fugitive pm10 -...
TRANSCRIPT

1
Fugitive PM10
John Watterson(with thanks to John Abbott)
What’s in this presentation
• Guidance• Monitoring• Modelling• Case studies of modelling

2
When not to worry about fugitive PM10
• LAs need to assess those sites which are likely to exceed the PM10 Air Quality Limits.
• “Short term construction works do not normally need to be considered for the purposes of Review and Assessment.
• See LAQM.TG4(00), Section 8.36, Page 115.
Which monitor to use
• TEOM (Tapered Element Oscillating Microbalance)
• BAM (Beta Attenuation Monitor)
• Gravimetric Samplers• All used in the national
networks• Partisols ?

3
Monitoring at Stage 3
• LAQM.TG4(00) defines the relevant criteria and sampling periods
– Ideally monitor for 1 year with 90% data capture.
– minimum 6 months is being advised (summer/winter) if comparing with national network sites.
– 3 months will often do (but consider wind direction)
When is monitoring not required?
• If future predicted concentrations well below objective, LAs can conclude:
– objective unlikely to be exceeded.
– even if model accuracy only within 50%.

4
When & Why is monitoring required?
• Recommendation in LAQM.TG4(00) to monitor in mixed urban areas to validate model.
• At Stage 3 LAs need confidence in their results
Can you use someone else’s monitoring data?
• Can you use monitoring data from neighbouring areas / sources to validate your model?
• For emissions from traffic - yes, but :– area modelled must be ‘identical’ to the one under
investigation.– (interpret as very similar in nature!)
• For point sources (stacks)– sources need to be similar in nature

5
Can you use someone else’s monitoring data - fugitive PM10
• For fugitive sources
– each source is unique, and local meteorological effects likely to be important, so can’t really apply this approach.
– you’ve probably got to do your own monitoring.
QA/QC of data - it’s essential!
• Is it necessary to bother with detailed QA/QC when it’s
– time consuming– costly– and the data ‘seems reasonable’?
• Yes, because the data cannot be usedto validate the model without QA/QC.
• An example of why QA/QC critical to follows ...

6
PM10 concentrations (µµµµg m-3 TEOM), w ithout any QC, from fugitive emissions from a quarry
-1000
-750
-500
-250
0
250
500
Mar-99 Jun-99 Sep-99 Dec-99 Mar-00 Jun-00
Time
PM10
con
cent
ratio
n ( µ µµµ
g m
-3)
Data without QC - monitoring of fugitive PM10
Monitoring for fugitive PM10
Met.PM10
PM10
PM10 sampler
Met. Meteorological stationHousing (nearest receptor
400m
Prevailing wind direction
Working face – area of maximum activity

7
Monitoring for fugitive PM10
• Ideally site PM10 samplers to be upwind and downwind, close to nearest receptors– but in reality, one sampler employed.
• Meteorological data is important– perhaps use data recorded at a nearby site?
• PM10 filters can be retained for microscopic analysis.
• If sensitive receptors all > 400 m from active face, then probably no monitoring needed.
Where can you turn to for more help?
• MONITORING help desk– Operated by The National Environmental Technology Centre– Telephone 01235 46 3356– Email [email protected] web site
www.aeat.co.uk/netcen/airqual/welcome.html
• MODELLING help desk – Operated by Stanger Science and Environment – Telephone 0181 256 4972 – Email [email protected] – web site www.stanger.co.uk
• LOCAL AIR QUALITY POLLUTANTS' SPECIFIC GUIDANCEhelp desk
– http://www.uwe.ac.uk/aqm/review– check the FAQ bit
8
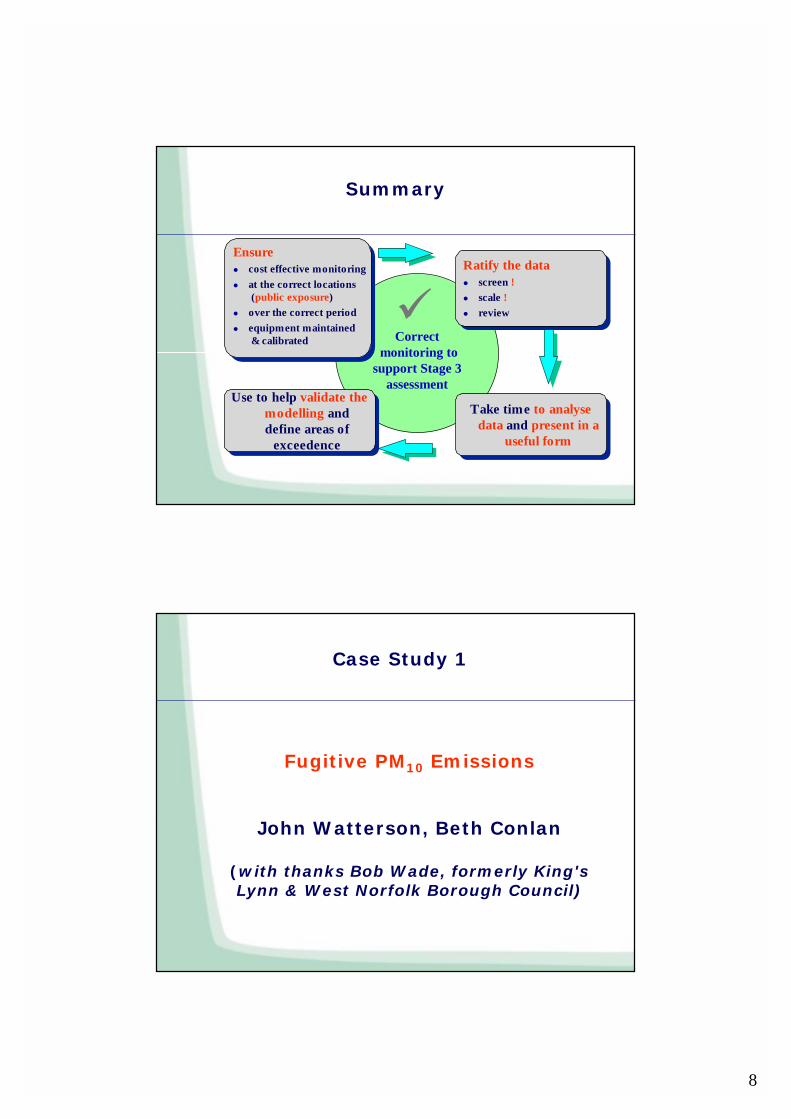
Summary
Correctmonitoring to
support Stage 3 assessment
!Ensure" cost effective monitoring
" at the correct locations(public exposure)
" over the correct period
" equipment maintained& calibrated
Ensure" cost effective monitoring
" at the correct locations(public exposure)
" over the correct period
" equipment maintained& calibrated
Use to help validate the modelling and define areas of
exceedence
Use to help validate the modelling and define areas of
exceedence
Ratify the data" screen !" scale !" review
Ratify the data" screen !" scale !" review
Take time to analyse data and present in a
useful form
Take time to analyse data and present in a
useful form
Fugitive PM10 Emissions
John Watterson, Beth Conlan
(with thanks Bob Wade, formerly King's Lynn & West Norfolk Borough Council)
Case Study 1

9
Goods yard - fugitive PM10 issue
• Overview– Local Authority wishes to build housing
close to a railway.
– but there are several sources of fugitive PM10 close to the railway line (aggregate delivered by railway).
– how close could they build the houses without exceeding the most stringent PM10objective?
Main sources of emission
• Main sources of emission from aggregate handling operations are :– Loading of aggregate onto storage piles (batch or
continuous drop operations);
– Equipment traffic in storage area;
– Wind erosion of pile surfaces and ground areas around piles;
– Loadout of aggregate for shipment or for return to the process stream (batch or continuous drop operations

10
28500 28550 28600 28650 28700 28750 28800 28850 28900
Easting, m
38600
38650
38700
38750
38800
38850
38900
38950
39000
39050
39100
Nor
thin
g, m
Modelled 90th percentile 24 hour average PM10concentrations, mg m-3
Wet batching plant
Aggregate pile
Aggregate pile
‘Topmix’ dry batching plant
Roadstonecoating plant
Three sided aggregate storage
Railway lines
Bottom drop feed hopper
Ideal monitor location
ACTUAL monitor location
Proposed housing
• The quantity of dust emitted from vehicle traffic on a paved road
• The quantity of particulate emissions from batch or continuous drop operations
• The emissions generated by wind erosion of stockpiles.
• Hourly meteorological data was needed (March-May 2000)
• (See me after if you want the detailed methodology and equations!)
Predictive emission factor equations for each type of sourcetaken from US EPA AP42 emissions database

11
Selection of monitoring site
• This was a problem.
• The ‘ideal’ location had no power supply.
• So another location was selected - location of monitor limited by where there was power.
• Welcome to the ‘real world’!
Receptor locations
• The dispersion model was used to calculate the contribution from each modelled source:
– to concentrations at receptor locations spaced on a regular grid.
– extending approximately 500 m from the goods yards.
– with grid nodes at 50 m intervals.

12
Model validation for PM10
• The monitoring data obtained at the Goods Yard was limited by duration and by the location of the monitoring station.
• Hourly average modelled contributions from the handling operations compared with the excess concentration at the monitoring station.
• The ‘excess concentration’ was calculated as the measured concentration at the Goods Yard minus the measured concentration at an automatic network site (nearest background site).
Data selection criteria necessary for model validation
• The wind was from the sector between 300 and 30 degrees.
• Meteorological data was available from nearby airport.• The Goods Yard monitoring site was operating• The background monitoring site was operating.
• There was a train delivering material to the Aggregates on that day
• The modelled concentration was not zero• The measured concentration at Goods Yard was greater
than that at the background site

13
Model performance
• Measured ‘excess concentration’ plotted against modelled fugitive PM10 prediction.
• Model overestimating PM10 concentrations by several µgs.
• Considerable uncertainty in the model predictions as uncertainties inherent in model predictions of emissions and pollutant dispersion and the short period of the model run.
Which concentration to use asexceedance limit?
• Uncertainty (one SD) resulting from the short period of the model run (from period to annual mean monitoring data comparison) was estimated to be 10 µg m-3 (gravimetric).
• The model validation indicates that the model overestimates the contribution from the handling operations.
• It is thus likely that the 40 µgm-3 and 60 µg m-3
isopleths provide reasonable upper and lower bounds on the expected area of exceedence of the 24 hour PM10 objective.

14
Fugitive PM10 emissions
John Watterson, Beth, Beth ConlanConlan
(with thanks Bob Wade, formerly King's Lynn & West Norfolk Borough Council)
Case Study 2
Grain handling at a dockyard Fugitive PM10
• Dust nuisance complaints from grain handling operations.
• TEOM monitoring for PM10 at a location nearby suggests exceedances of current 24 hour objective.
• Modelling suggests exceedances of the 24 hour PM10 objective.

15
Data needed for modelling offugitive PM10
• Shipping movements and cargo handled.
• Air quality monitoring– continuous TEOM to validate the results of
the model against• Appropriate dispersion model
• Meteorological data
Monitoring location

16
Unloading grain from lorry prior to ship loading
Grain loading / unloading

17
Emissions from loading lorries and stockpiles
Response of PM10 concentrations to ship loading activity
Daily a v erage con cen tra tion s of PM 10

18
Modelling approach
• Identify suitable emission factors of PM10 for the type of grain loading activity that occurs at the dock area (US EPA AP 42 database).
• Compile the detailed activity data available (periods when commodity handling took place).
• Estimate emissions of PM10 on an hourly basis throughout a one year period from all the main areas where grain handling took place. These estimates were derived from the emission factors and the activity data.
Modelling approach
• Estimate the 90th percentile of 24 hour average PM10concentrations at the location of the nearest PM10continuous monitoring station. A dispersion model, ADMS V3, and locally measured wind speed and direction data were used to produce these estimates.
• Calibrate the results of the PM10 modelling using the PM10 concentrations recorded at the PM10 monitoring site.
• Finally, estimate 90th percentile of 24 hour average PM10 concentrations in an area 600 m by 600 m downwind of the dock areas.

19
Suggested Air Quality Management
Area starting between the
36 mg m-3 and 44 mg m-3 contours
Modelled concentrations of 90th percentile of daily PM10 in 2004
Action Plan possibilities
# Close down the grain handling operations# Move the operations to an area that would not lead
to exceedances at relevant receptors# Restrict loading/unloading operations so exceedances
of the daily PM10 objective unlikely
# Complete a process audit to identify operations responsible for majority of PM10 emissions
# Fit abatement to control emissions - cost/benefit for each of the abatement options