fuel taxation, emissions policy, and competitive …jthurk/papers/mmt_rand.pdf · olavide, ponti...
TRANSCRIPT

RAND Journal of EconomicsVol. 49, No. 3, Fall 2018pp. 504–540
Fuel taxation, emissions policy,and competitive advantage in the diffusionof European diesel automobiles
Eugenio J. Miravete∗Marıa J. Moral∗∗and
Jeff Thurk∗∗∗
Economic integration agreements have significantly decreased import tariffs. We investigatewhether national policies can be an effective replacement for tariffs to protect domestic industry.We show that (a) European fuel taxes and vehicle emissions policy favored diesel vehicles, atechnology popular with European consumers but largely offered only by domestic automakers;(b) European automakers benefited from pro-diesel fuel taxes and a lenient NOx emissions policyto earn significant profits from diesel cars; and (c) that both policies amounted to significantnontariff trade policies equivalent to an import tariff between two to three times the official rate.
1. Introduction
� Multilateral trade agreements among countries have driven import tariffs to historic lows(Bergstrand, Larch, and Yotov, 2015). When application of traditional protectionist policies such astariffs and quotas becomes harder due to trade liberalization agreements, governments may resortto less obvious regulations designed to protect domestic industries (Bhagwati and Ramaswami,1963; Staiger, 1995; Bagwell and Staiger, 2001; Ederington, 2001). In this article, we consider
∗ The University of Texas at Austin, Centre for Competition Policy/UEA, and CEPR; [email protected].∗∗ UNED, Paseo Senda del Rey, GRiEE and GRIPICO; [email protected].∗∗∗ University of Notre Dame; [email protected] article supersedes “Protecting the European Automobile Industry through Environmental Regulation: The Adoptionof Diesel Engines.” We thank the Editor, Aviv Nevo, and the three referees for outstanding comments and suggestions. Weare also grateful to Kyle Bagwell, Allan Collard-Wexler, John Graham, Kenneth Hendricks, Tom Holmes, Cristian Huse,Ashley Langer, Amil Petrin, Jeff Prince, Bob Staiger, Frank Wolak, as well as seminar audiences at CCP/East Anglia,CESifo/Munich, Collegio Carlo Alberto, Colorado, Duke, Ford Motor Company, DG Competition-EU, Florida State,ICESI, Indiana, ITAM, Michigan, National Singapore University, Pablo de Olavide, Pontificia Universidad Catolica deChile, Texas-Austin, Wisconsin-Madison, Vigo, Yale, Zurich, the 2013 Economics of Low-Carbon Markets conferencein Riberao Preto, the 2015 CEPR Conference on Applied Industrial Organization in Athens, the 2014 Hal White AntitrustConference in Washingon DC, the 2015 Barcelona GSE Summer Forum, the 2016 SITE-Trade and SITE-IO meetings inPalo Alto, the 2016 TE3 conference in Ann Arbor, and the 2017 ITEA Conference in Barcelona. We are solely responsiblefor any errors that may still remain. Moral gratefully acknowledges funding from the Spanish Ministry of Education andScience, and the European Regional Development Fund through grants ECO2017-82445-R and ECO2015-69334.
504 C© 2018, The RAND Corporation.
MIRAVETE, MORAL AND THURK / 505
fuel taxation and vehicle emission regulations as examples of such policies employed by theEuropean Union (EU). We argue these policies had the effect of promoting diesel vehicles amongconsumers and thereby increased profits for the firms who offered diesels—European automakers.
Our setting is the European marketplace where (largely) European diesel vehicles constitutethe majority of new car sales. We show that diesel fuel was taxed at a lower rate than gasoline andthe vehicle emissions policy chosen by European regulators targeted carbon monoxide (CO) andcarbon dioxide (CO2) but not nitrogen oxide (NOx ).1 This distinction is important, as diesel carsproduce a large amount of NOx emissions but relatively little CO and CO2. Gasoline-poweredengines do just the opposite. Hence, these policies provided a competitive advantage for domesticautomakers, as foreign firms sold gasoline-powered vehicles which not only used a more expensivefuel, but also faced stricter emissions standards than their diesel-powered competition.
We use detailed automobile registration data from Spain—a country with diesel adoptionrates representative of Europe—to estimate a structural discrete-choice oligopoly model of hori-zontally differentiated goods similar to Berry, Levinsohn, and Pakes (1995), henceforth BLP. Themodel is flexible enough to generate reasonable substitution patterns between similar productsand account for product characteristics known to consumers and firms but not to the researcher.Our data have two important features. First, the sample covers the years immediately followingthe introduction of the turbodiesel engine in 1989—a major improvement in diesel technology,which proved to be very popular among consumers, as diesel penetration increased from 10% to50% in less than a decade. Second, the sample also covers a period in which European automakersfaced increased competition from Asian automakers.
We show that fuel taxation and vehicle emissions standards chosen by European regulatorspromoted diesels through three channels. The first channel is consumer demand, where ourestimates indicate that consumers preferred vehicles with greater fuel economy, defined as thenumber of kilometers one can travel per euro of fuel. Fuel economy is therefore a function ofboth fuel efficiency, defined as the number of kilometers one can travel on a liter of fuel, andfuel price, where the latter is impacted by fuel taxes. A primary advantage of diesel cars is theirsuperior fuel efficiency, traveling 20%–40% farther on a liter of fuel. Because they benefited frompreferential European fuel taxes, the average diesel in our data could travel 63% farther per euroof fuel relative to a comparable gasoline-powered car. A stricter vehicle emissions policy wouldhave eroded this advantage, as the addition of sophisticated abatement technologies required tomeet such a standard would have increased vehicle weight and decreased performance. Thesetwo policies, therefore, both worked to promote diesel vehicles by enhancing the fuel savings ofdiesels’ superior fuel efficiency.
The second channel corresponds to the increased marginal cost required to meet a stricterNOx emissions policy. We document several different technologies capable of reducing NOx
emissions, though each increases production cost to diesel vehicles. In equilibrium, some of thisexpense would have been passed on to consumers through higher retail prices, leading someconsumers to switch to models equipped with gasoline engines likely produced by foreign firms.By not choosing stricter NOx emissions standards, European regulators implicitly reduced theretail prices of diesel vehicles and increased the likelihood price-sensitive consumers wouldchoose them.
The third channel addresses why these policies amounted to nontariff trade policies. Weargue that the popularity of diesel cars among European consumers is a unique feature of thismarket, and we outline a variety of initial conditions which likely provided a foundation forthe fast adoption of diesels in Europe. As the European market constituted the bulk of salesfor domestic automakers, developing a viable diesel technology was a worthwhile investment.Foreign firms, on the other hand, chose not to invest in the diesel technology because Europe
1 CO and CO2 are greenhouse gases associated with global warming, whereas NOx emissions are associated withsmog and to a lesser extent, acid rain. The role of CO as a greenhouse gas is weaker than CO2, though still relevant (seetes.jpl.nasa.gov/mission/climateroles).
C© The RAND Corporation 2018.

506 / THE RAND JOURNAL OF ECONOMICS
constituted just a niche market for them.2 Policies favoring diesels thus benefited domestic firmsalmost exclusively.
We quantify the effects of alternative fuel taxation and vehicle emissions policies via counter-factual analysis. We show that diesels were not only popular among consumers, but also generatedsignificant profits for European firms. Had regulators imposed fuel taxes and vehicle emissionsstandards which did not favor diesel vehicles, consumers would have substituted toward gasoline-powered Asian imports, leading to significant reductions in profits for domestic automakers. Sucha shift is usually achieved by levying import tariffs on foreign products, leading to less consump-tion of foreign varieties. Multilateral negotiations over the past several decades, however, havedriven import tariffs to record lows, thereby reducing their effectiveness as a policy tool.
We use the estimated model to measure the implicit protective value of these policies, that is,their tariff-equivalence. We find that only by imposing an import tariff of between 17.1%–27.4%,or roughly two to three times the official rate, could European regulators have both employed thealternative policies we consider and maintained the import share observed in the data. Moreover,we show both policies played important roles in protecting domestic firms. We view these resultsas evidence that national policies can indeed amount to significant nontariff trade barriers.
Economists, policy experts, and politicians have all expressed concerns over the ability ofnational policies to fill the void left by import tariffs, but identifying and quantifying effects ofnontariff barriers (NTBs) has proven difficult. Our results, therefore, amount to an important andnovel contribution as, to the best of our knowledge, this study is the first to measure the effectsof a NTB using an estimated structural model. The advantage of our structural approach is that itenables us to account for the optimal equilibrium responses of consumers and firms to alternativepolicies, thereby increasing the reliability of our conclusions.
We are not the first to evaluate the trade effects of policy on heterogeneous firms in the auto-mobile industry. Feenstra (1988) documents that voluntary export restraints placed on Japanesecars during the 1980s and early 1990s induced significant quality-upgrading by Japanese firms,leading to the growth of luxury brands Acura, Infiniti, and Lexus in the US market. Berry,Levinsohn, and Pakes (1999) show this policy also increased profits for domestic firms anddecreased welfare for domestic consumers, although left significant tariff revenue on the table.Goldberg and Verboven (2001) evaluate sources for cross-country dispersion of vehicle prices inEurope prior to 1993, whereas Goldberg and Verboven (2005) document that the creation of theEuropean single market served to reduce price dispersion. Put differently, these articles documentthat the existence of different rules among European countries served to decrease competition.3
Our contribution is to evaluate the tariff-equivalence of domestic policies and thereby demonstratethat seemingly innocuous domestic policies can amount to significant trade policy.
We show our results are robust to a variety of alternative assumptions, and that European firmswould have had to increase the fuel efficiency of their gasoline fleet significantly to compensatefor lost diesel profits under the alternative policies we consider. At the core of our hypothesis isthe idea that national governments may set seemingly innocuous rules which benefit domesticfirms at the expense of foreign ones. It is from this perspective that Volkswagen’s (VW) recentadmission to cheating on the US Environmental Protection Agency’s NOx emissions standardsprovides a unique external validation for our conclusions.4
2 Kato (1997) recognizes the priority given by European regulators to CO2 over NOx , as well as the disinterest ofJapanese firms to invest in an automobile technology (diesels) that was popular only in Europe. Busser and Sadoi (2004)document that because demand was small in their countries of origin, Asian manufacturers such as Toyota chose topurchase diesel engines from other European firms as a less costly way to satisfy European demand rather than investingin the development of diesel engines from scratch.
3 Jacobsen (2013), Goldberg (1998), and Ito and Sallee (2018) show the introduction of corporate average fueleconomy (CAFE) standards in the United States favored foreign over domestic firms. Thus, the domestic policy theystudy actually promoted foreign imports.
4 On September 18, 2015, the US Environmental Protection Agency (EPA) accused Volkswagen of devising asophisticated scheme to deceive authorities when testing for nitrogen oxide (NOx ) emissions.
C© The RAND Corporation 2018.

MIRAVETE, MORAL AND THURK / 507
First, the episode confirms that European firms like Volkswagen earned substantial profitfrom their diesel fleets and that stricter NOx standards both increase cost and decrease perfor-mance, leading to less sales and lower profits. The fact that Volkswagen management was willingto risk severe financial punishment for cheating only reinforces this connection between dieselsales and vehicle emissions standards.5 Interestingly, the harsh prosecution of the case in theUnited States will also likely result in the effective disappearance of diesel vehicles from the USmarket for a second time in two decades, due to failure to meet American emission standards.
Second, Volkswagen’s admission to also cheating on European emissions policy since 2004elicited a very different response in Europe, where regulators chose to increase the NOx ceilingfacing cars sold in Europe, and government committed itself to not revisiting the policy until 2019.Although the company also faces financial penalties in Europe, we view this as stark evidencethat EU regulators understand that a stricter NOx emissions policy would have significant adverseeffects on domestic firms.
It is tempting to view our results as an indictment of European policy or proof that Euro-pean regulators explicitly designed their fuel taxes and emission standards to promote domesticautomakers. Our point is that regardless of whether it was the intent of the policy maker, theeffect of these policies served to protect domestic European manufacturers by fostering a prefer-ence for a technology, diesel engines, that was only produced by domestic firms. We show that,provided health and environmental externalities from diesel vehicle emissions were negligible,these policies actually benefited consumers, as they promoted an innovation (diesels) valued byEuropeans due to fuel cost savings and relative affordability. Thus, it could be that these policieswere enacted to serve consumers and inadvertently also protected domestic firms.
Last, we ask: did these policies violate World Trade Organization (WTO) rules? The WTOconsiders a policy a NTB only if the policy is not “set at an appropriate level to achieve legitimateobjectives with minimum impact on trade” (OECD, 2005). Thus, proving European fuel taxationand vehicle emission policies did indeed amount to illegal NTBs would have been difficult,because European regulators could have claimed the policies benefited consumers. Our results,therefore, provide evidence that national policy can be an effective substitute for import tariffs,and that proving such a policy amounted to an illegal NTB is difficult.
The article is organized as follows. In Section 2, we describe the growth of diesel vehicles inEurope. In Section 3, we document differences in diesel and gasoline fuel taxes as well as discussdifferences in emissions policy between the United States and Europe. Section 4 describes theequilibrium model of discrete choice demand for automobiles. Section 5 describes the estimationapproach, discusses identification, and reports results. In Section 6, we use the estimated modelto quantify the equilibrium implications of alternative fuel taxes and emissions policies on theEuropean automobile market and calculate the tariff-equivalence of the pro-diesel regulations.Finally, Section 7 summarizes our contribution. Additional results, information, and data sourcesare documented in the Appendices.
2. The European market for diesel automobiles in the 1990s
� This section familiarizes the reader with the basic characteristics of the diesel technology;the institutional features of the European automobile market that allowed for a swift takeoff ofdiesel sales in the early 1990s; the evolution of the Spanish market; and characteristics of vehiclesin the data.
� A significant innovation—next generation diesel engines. In the late 19th century, RudolfDiesel designed an internal combustion engine in which heavy fuel self-ignites after being injectedinto a cylinder where air has been compressed to a much higher degree than in gasoline engines.
5 The notice of violation, and VW’s subsequent admission, translated into an immediate 20% drop in its stockmarket value due to concerns about the company’s credibility, as well as an estimated $18 billion in fines.
C© The RAND Corporation 2018.

508 / THE RAND JOURNAL OF ECONOMICS
However, it was only in 1927, many years after Diesel’s death, that the German company Boschbuilt the injection pump that made the development of the engine for trucks and automobilespossible. The first commercial diesel vehicles followed soon after: the 1933 Citroen Rosalie andthe 1936 Mercedes-Benz 260D. Large passenger and commercial diesel vehicles were commonin Europe from the late 1950s through the 1990s.
In 1989, Volkswagen introduced the turbocharged direct injection (TDI) diesel engine in itsAudi 100 model, a substantial improvement over the existing Perkins technology.6 A turbochargeddiesel (“turbodiesel”) engine uses a fuel injector that sprays fuel directly into the combustionchamber of each cylinder, and the turbocharger increases the amount of air going into thecylinders. Complementing both is an intercooler, which lowers the air temperature in the turbo,thereby increasing the amount of fuel that can be injected and burned. The net effect was thatthese turbodiesel vehicles were significantly quieter, cleaner (no black smoke), and more reliablethan their predecessors, plus maintained superior fuel efficiency and torque relative to comparablegasoline models.7
Other European firms quickly introduced their own turbodiesels, most notably Peugeot andRenault.8 The incredible pace of adoption of diesel automobiles, growing from 10% to nearly 60%market share within a decade, suggests that the turbodiesel technology proved to be a significanttechnological advance, and that consumers gained little from waiting for additional incrementalimprovements, which have been few and of minor importance.9
� The automobile industry in the 1990s. Our data include yearly car registrations by man-ufacturer, model, and fuel engine type in Spain between 1991 and 2000. After removing a fewobservations, mostly of luxury vehicles, our sample is an unbalanced panel comprising 99.2% ofall car registrations in Spain during the 1990s. Spain was the fifth largest automobile manufacturerin the world during the 1990s, and also the fifth largest European automobile market by salesafter Germany, France, the United Kingdom, and Italy. In our sample, automobile sales rangefrom 873,057 to 1,364,687 units sold annually. See Appendix A for further details on Spanishdata sources.
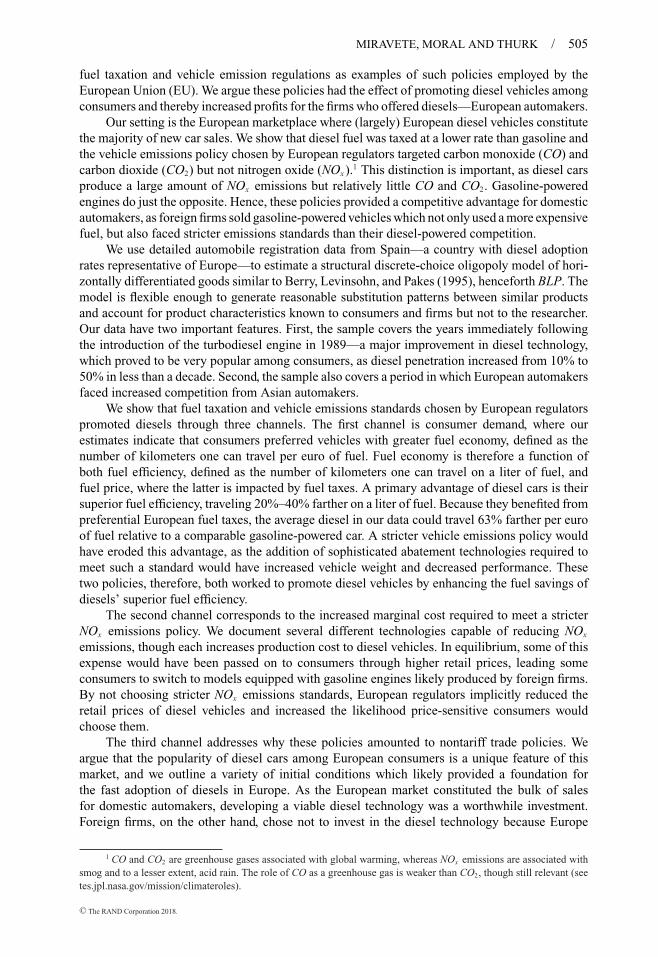
Figure 1 (a) depicts the growth and changing composition of the Spanish automobile market.Sales of gasoline models were flat in 1993 and 1995, about 573,000 vehicles, despite a scrappageprogram in 1994, when they temporarily increased by 15%. Sales of gasoline models has grownsteadily since, but this growth pales in comparison to the growth of diesels. Initially, in 1991, theyrepresented only about 13% of total sales, but by the end of the decade, diesels represented 54%of the market, growing from 111,943 to 732,334 units sold in years 1991 and 2000, respectively.Figure 1 (b) shows that diesel vehicles became increasingly popular not only in Spain but all overEurope.10
In Table 1, we document the dramatic transformation in the number and characteristics ofvehicles available to consumers, where we present vehicle characteristics as the sales-weightedaverage to account for changes in consumer demand. At the beginning of the decade, consumerscould choose from 129 different models, most of which were produced by domestic automakers.By 2000, the consumer’s choice set had grown substantially (from 129 to 229 vehicles), driven
6 The 1987 Fiat Croma was actually the first diesel passenger car to be equipped with turbo direct-injection. Whereasthe Audi 100 controlled the direct injection electronically, the Fiat Croma was mechanical. The difference proved crucialfor commercial success, as electronic controls improved both emissions and power.
7 See the 2004 report “Why Diesel?” from the European Association of Automobile Manufacturers (ACEA).8 Thurk (2017) evaluates the financial implications for VOLKSWAGEN due to the quick imitation of the TDI.9 This argument was first put forward by Schumpeter (1950) and later formalized by Balcer and Lippman (1984).
More recently, it has been used by Manuelli and Seshadri (2014) to explain the half a century time span needed for thediffusion of the much studied case of tractors.
10 There is variance in the adoption of diesels across countries, however, as smaller countries such as Denmark wereslow adopters, although France, led by Peugeot, adopted diesels earlier than Spain.
C© The RAND Corporation 2018.

MIRAVETE, MORAL AND THURK / 509
FIGURE 1
TRENDS IN THE EUROPEAN AUTOMOBILE MARKET [Color figure can be viewed atwileyonlinelibrary.com]
0
75
150
225
300
375
450
525
600
675
750
825
1991 1992 1993 1994 1995 1996 1997 1998 1999 2000
Gasoline Diesel
(a) Sales (thousands of vehicles)
0%
10%
20%
30%
40%
50%
60%
70%
80% Spain EU
(b) Diesel penetration
Notes: Authors’ calculations. New passenger car registration data from Association Auxiliaire de l’Automobile (AAA).In panel (b), we constructed European diesel penetration (dashed line) using gross domestic product as weights (source:World Bank Development Indicators). Countries included: Austria, Belgium, Denmark, France, Germany, Ireland, Italy,Luxembourg, Netherlands, Portugal, and the United Kingdom.
TABLE 1 Car Model Characteristics By Origin and Engine Types
1991 MODELS SHARE PRICE SIZE HPW C90 MPG KPE
EU: DIESEL 42 12.78 12.09 73.18 3.09 4.42 53.85 46.82EU: GASOLINE 68 84.08 10.85 71.03 4.09 5.31 45.10 30.05NON-EU: DIESEL 1 0.04 13.76 80.51 2.86 5.30 44.38 38.58NON-EU: GASOLINE 18 3.10 15.16 78.16 4.50 5.71 41.60 27.72
ALL 129 100.00 11.15 71.53 3.97 5.21 46.11 32.13
2000 MODELS SHARE PRICE SIZE HPW C90 MPG KPE
EU: DIESEL 75 50.95 16.19 76.32 3.14 4.55 52.35 38.18EU: GASOLINE 84 37.28 14.93 73.40 3.90 5.68 41.89 24.23NON-EU: DIESEL 20 2.71 17.20 82.48 3.22 5.41 44.74 32.63NON-EU: GASOLINE 50 9.06 13.66 75.32 4.08 6.11 39.41 22.80
ALL 229 100.00 15.52 75.31 3.51 5.13 47.07 31.43
Notes: Statistics weighted by quantity sold. SHARE is the market share as defined by automobiles sold. PRICE isdenominated in the equivalent of thousands of 1994 euros and includes value-added taxes and import tariffs. SIZE islength × width measured in square feet. HPW is the performance ratio of horsepower per hundred pounds of weight. C90is consumption (in liters) of fuel required to cover 100km at a constant speed of 90 km/hr. MPG is the number of milesone can travel on a gallon of fuel. KPE is the distance, measured in kilometers, traveled per euro of fuel. Table A1 inAppendix A complements this description of product features reporting statistics by market segment.
largely by the entry of gasoline vehicles by Asian automakers.11,12 At the same time foreignfirms were entering the European market, domestic automakers increased their supply of diesel
11 Asian imports include DAEWOO, HONDA, HYUNDAI, KIA, MAZDA, MITSUBISHI, NISSAN, SUZUKI, and TOYOTA. We usethe terms “Asians” or “non-Europeans” when referring to imports. CHRYSLER sold its production facilities to PEUGEOT in1978 and since then, the few models sold in Europe are imported from the United States. On the contrary, FORD and GM
are considered European manufacturers. FORD has 12 manufacturing plants and has been continuously present in Europesince 1931. GM entered the European market in 1911, acquired the British brand Vauxhall and the German Opel in the1920s, and today operate 14 manufacturing facilities in Europe. In both cases, these brands have factories in Spain.
12 Appendix A documents that most Asian automobiles were directly imported into the European market and thatthe small production of Asian automobiles in Europe, transplants, was generally treated as imports until year 2000,because of their limited “local content” in terms of value added. We thus treat them as imported products.
C© The RAND Corporation 2018.

510 / THE RAND JOURNAL OF ECONOMICS
vehicles. In 1991, a consumer interested in purchasing a diesel could choose from 43 differentoptions, where all but one was produced by a European firm. By 2000, this consumer had 95different diesel options, of which 75 were produced by a European automaker. Thus, not onlywere diesels very popular among European consumers, they were also produced almost entirelyby European firms.
Diesel and gasoline versions of a particular car model share the same chassis, so consumerscompare performance rather than car size or appearance when deciding whether to buy a dieselor gasoline-powered vehicle. Diesel engines are about 10% heavier than a comparable gasolineengine; have 15% to 20% less horsepower than gasoline engines; and are between one andtwo thousand euros more expensive. Diesel vehicles also consume 20%–40% less fuel than acomparable gasoline model, and given that diesel fuel is less expensive than gasoline due todifferences in taxation, the average diesel in our data travels about 63% farther on a euro of fuelthan a comparable gasoline-powered model. We observe that cars generally become less fuelefficient over the sample (e.g., the fuel efficiency for European diesels decreases from 53.85 to52.35 miles/gallon), but the increasing popularity of diesels ultimately increased the average fuelefficiency (MPG) on the road from 46.11 to 47.07 miles/gallon over the sample. We also observethat cars become on average 39.2% more expensive, 5.5% larger, and 11.6% less powerful (HPW)across time.
Our final observation relates to the market entry of fuel-efficient Asian (NON-EU) vehicles,particularly in the gasoline segment. This entry eroded market share for European firms, wheredomestic automakers accounted for 84% of all sales in the gasoline segment but only 37% by2000. Their investment in diesel vehicles and subsequent dominance in that segment, however,mitigated the effects of foreign competition overall, as European automakers accounted for88% of all sales in 2000, down slightly from 97% in 1991. Thus, diesel vehicles appear tohave been a significant competitive advantage for domestic automakers in fending off foreigncompetition.
3. Why are diesels popular in Europe?
� In this section, we put forward two hypotheses as to why diesel vehicles have been andremain popular among European consumers. Our first hypothesis is that pro-diesel fuel excisetaxes enacted in the 1970s to support the transportation and agricultural industries acted as acatalyst for consumer adoption of diesel vehicles. As turbodiesels became popular in the 1990s, anemissions standards policy which favored diesel vehicles then served to promote the technologyas well as protect domestic automakers—our second hypothesis. We test these hypotheses inSection 6.
� Preferential fuel taxes. There are important institutional circumstances that helped buildthe initial conditions that were particularly favorable for the adoption of this new technologyin Europe. The key element is the European Fuel Tax Directive of 1973, adopted by the thennine members of the European Economic Community gathered in Copenhagen in December of1973, two months after the oil crisis began. The main goal was to harmonize fuel taxation acrosscountries so that drivers, and fossil fuel users in general, faced a single and consistent set ofincentives to save energy. Coordination also limited the possibility of arbitrage across state lines,as well as prevented countries from free-riding on the conservation efforts of other members.Neither fuel prices nor their taxation were harmonized overnight, but the new Tax Directiveoffered principles of taxation that were eventually followed in every country.
Regulators designed policy to help two economic industries particularly hit by the increasein 1970s oil prices: road transport and agriculture. With minor modifications, these principleshave guided European fuel taxation until very recently. In 1997, the European Commission firstsuggested modifying these principles of taxation to reduce the differential treatment of diesel andgasoline fuels and incorporating elements of environmental impact of each type of fuel when
C© The RAND Corporation 2018.
MIRAVETE, MORAL AND THURK / 511
FIGURE 2
FUEL PRICES GROSS AND NET OF TAXES (1994 EURO-CENTS/LITER) [Color figure can be viewed atwileyonlinelibrary.com]
0.00
10.00
20.00
30.00
40.00
50.00
60.00
70.00
80.00
1991 1992 1993 1994 1995 1996 1997 1998 1999 2000
Fuel price Fuel price + Tax
(a) Gasoline
0.00
10.00
20.00
30.00
40.00
50.00
60.00
70.00
80.00
1991 1992 1993 1994 1995 1996 1997 1998 1999 2000
Fuel price Fuel price + Tax
(b) Diesel
setting taxes. This change in principles was only adopted in 2013, however, so consumers facedstable and consistent incentives favoring diesel fuel consumption for a very long period of time.13
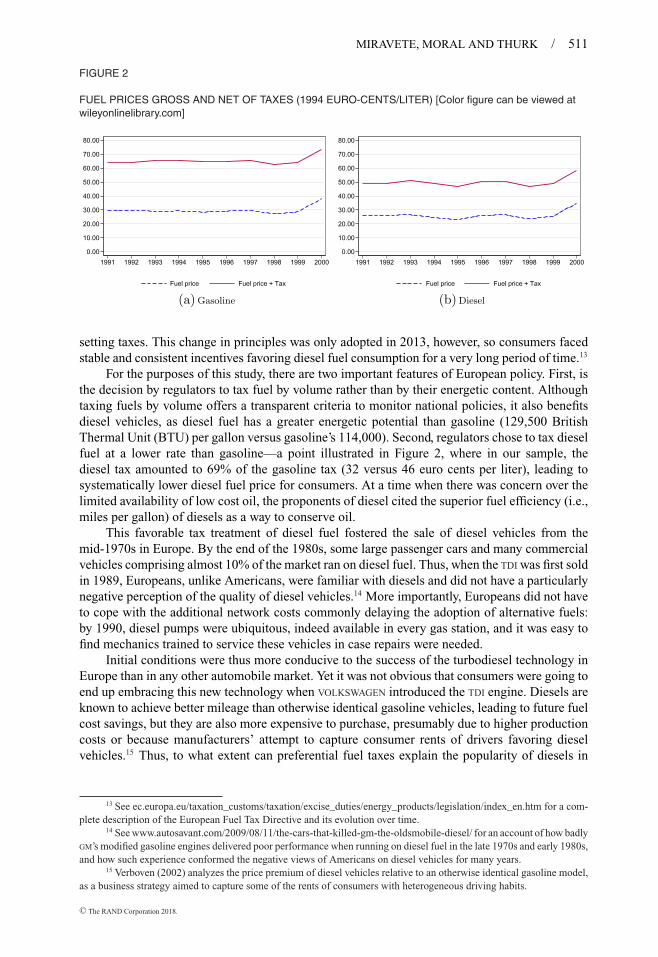
For the purposes of this study, there are two important features of European policy. First, isthe decision by regulators to tax fuel by volume rather than by their energetic content. Althoughtaxing fuels by volume offers a transparent criteria to monitor national policies, it also benefitsdiesel vehicles, as diesel fuel has a greater energetic potential than gasoline (129,500 BritishThermal Unit (BTU) per gallon versus gasoline’s 114,000). Second, regulators chose to tax dieselfuel at a lower rate than gasoline—a point illustrated in Figure 2, where in our sample, thediesel tax amounted to 69% of the gasoline tax (32 versus 46 euro cents per liter), leading tosystematically lower diesel fuel price for consumers. At a time when there was concern over thelimited availability of low cost oil, the proponents of diesel cited the superior fuel efficiency (i.e.,miles per gallon) of diesels as a way to conserve oil.
This favorable tax treatment of diesel fuel fostered the sale of diesel vehicles from themid-1970s in Europe. By the end of the 1980s, some large passenger cars and many commercialvehicles comprising almost 10% of the market ran on diesel fuel. Thus, when the TDI was first soldin 1989, Europeans, unlike Americans, were familiar with diesels and did not have a particularlynegative perception of the quality of diesel vehicles.14 More importantly, Europeans did not haveto cope with the additional network costs commonly delaying the adoption of alternative fuels:by 1990, diesel pumps were ubiquitous, indeed available in every gas station, and it was easy tofind mechanics trained to service these vehicles in case repairs were needed.
Initial conditions were thus more conducive to the success of the turbodiesel technology inEurope than in any other automobile market. Yet it was not obvious that consumers were going toend up embracing this new technology when VOLKSWAGEN introduced the TDI engine. Diesels areknown to achieve better mileage than otherwise identical gasoline vehicles, leading to future fuelcost savings, but they are also more expensive to purchase, presumably due to higher productioncosts or because manufacturers’ attempt to capture consumer rents of drivers favoring dieselvehicles.15 Thus, to what extent can preferential fuel taxes explain the popularity of diesels in
13 See ec.europa.eu/taxation_customs/taxation/excise_duties/energy_products/legislation/index_en.htm for a com-plete description of the European Fuel Tax Directive and its evolution over time.
14 See www.autosavant.com/2009/08/11/the-cars-that-killed-gm-the-oldsmobile-diesel/ for an account of how badlyGM’s modified gasoline engines delivered poor performance when running on diesel fuel in the late 1970s and early 1980s,and how such experience conformed the negative views of Americans on diesel vehicles for many years.
15 Verboven (2002) analyzes the price premium of diesel vehicles relative to an otherwise identical gasoline model,as a business strategy aimed to capture some of the rents of consumers with heterogeneous driving habits.
C© The RAND Corporation 2018.

512 / THE RAND JOURNAL OF ECONOMICS
FIGURE 3
EUROPE AND US EMISSIONS STANDARDS [Color figure can be viewed at wileyonlinelibrary.com]
0.07
0.81
0.00
0.10
0.20
0.30
0.40
0.50
0.60
0.70
0.80
0.90
US Tier 2 Euro 3
NOx
0.01
0.08
0.00
0.01
0.02
0.03
0.04
0.05
0.06
0.07
0.08
0.09
US Tier 2 Euro 3
PM
2.89
1.03
0.00
0.50
1.00
1.50
2.00
2.50
3.00
3.50
US Tier 2 Euro 3
CO330
224
0
50
100
150
200
250
300
350
US Tier 2 Euro 3
CO2
Source: www.dieselforum.org. “NOx ” refers to nitrogen oxide limits; “PM” to particulate matter; “CO” to carbonmonoxide; and “CO2” to carbon dioxide. US statistics for NOx , PM , and CO are based on fleet averages under Tier 2 ofthe 1990 Clean Air Act Amendments (CAAA), whereas the statistic for CO2 is based on a CAFE standard of 27.5 mpg.EU statistics for NOx , PM , and CO are based on the Euro III standards implemented in 2000, wheras the CO2 statistic isthe 2008 fleetwide commitment. Prior to 2008, the European Union did not regulate CO2 emissions. All statistics are ingrams of emissions per mile driven.
Europe? Had European regulators chosen to tax diesels at a higher rate, would this policy haveeliminated any chance of success for diesels in Europe?
� Preferential vehicle emissions standards. Next, we argue that the popularity of diesels inEurope was also due to vehicle emissions standards which favored diesel vehicles, as they producea different emission mix than gasoline models, that is, diesel cars produce a large amount of NOx
and little CO and CO2, whereas gasoline engines do just the opposite. In Figure 3, we documentthat American and European regulators chose to target different kinds of vehicle emissions. Inthe United States, approval of the 1990 Clean Air Act Amendments (CAAA) directed the USEnvironmental Protection Agency (EPA) to reduce smog produced by nitrogen oxide (NOx ) andacid rain produced by sulfur dioxide (SO2). The EPA, therefore, chose a policy which set stringentNOx vehicle emissions standards, but weaker limits on CO and CO2.16,17
Europeans did just the opposite and chose less stringent targets for NOx emissions andparticulate matter, PM .18 In 1994, US Tier 1 standard allowed NOx emissions of 1 gram permile (g/mi), whereas the Euro I standard was 1.55 g/mi. By year 2000, US policy allowed only0.07 g/mi, whereas the Euro III standard set the NOx emission level at a far less demanding0.81 g/mi.19 Similar results hold for PM .20 The fast diffusion of diesel vehicles in the 1990s also
16 For simplicity, we refer to the EPA setting US policy, but a more accurate depiction center on the CaliforniaAir Resources Board (CARB) as the driving force for a stricter NOx vehicle emission standard, as the combination ofwesterly prevailing winds, eastern mountains in California, and large population centers like Los Angeles led to significantconcerns over smog in the state.
17 The EPA set its emissions goals (Title IV-A) targeting power generating plants and established a cap-and-tradesystem (Title V). The EPA also chose strict NOx emission standards for light-duty vehicles (Title II-A).
18 See Section IV of the 2001 report: “Demand for Diesels: The European Experience. Harnessing Diesel Innovationfor Passenger Vehicle Fuel Efficiency and Emissions Objectives” available at www.dieselforum.org.
19 European authorities set NOx and PM standards for each vehicle and US authorities set a fleet-wide limit. As forCO and CO2 emissions, these depend on fleet average fuel consumption standards and are reported as realized fleet-widelevels.
20 The negative health effects of PM are well documented. Capturing PM is, however, easier and far less expensivethan capturing NOx , and we will not address it in our counterfactual analysis. See The World Bank’s report: ReducingBlack Carbon Emissions from Diesel Vehicles: Impacts, Control Strategies, and Cost-Benefit Analysis, available at open-knowledge.worldbank.org/bitstream/handle/10986/17785/864850WP00PUBL0l0report002April2014.pdf. In page 27, itindicates that the cost of complying with the most stringent PM emissions for a 4-cylinder 1.5 L diesel engine was $1400in 2014.
C© The RAND Corporation 2018.

MIRAVETE, MORAL AND THURK / 513
enabled European authorities to choose more stringent CO2 emission standards than the UnitedStates; the goals of local automobile manufacturers and European environmental regulators werethus perfectly aligned.
The differences between the US and European emission standards are significant. ReducingNOx emissions is much harder for diesel engines, as the three-way catalytic converters used toreduce emissions in gasoline engines cannot cope with the high concentrations of NOx generatedby diesel engines, for example, Canis (2012). Thus, for instance, in the 1990s, rather thaninvesting to redesign their diesel engines to meet these stringent emission standards, VOLKSWAGEN
and MERCEDES chose to stop selling their diesel models in the US market in 1993 and 1994,respectively, precisely at the time of the implementation of the US emission standards mandatedby the CAAA.21
Only in 2009 did the EPA finally address the issue of NOx emissions from diesel vehiclesby requiring the installation of an urea-based selective catalytic reduction (SCR) that injectsan aqueous solution into the vehicles’ exhaust stream to “scrub” NOx emissions, for example,Appendix A. An SCR system not only increases a car’s manufacturing cost, it also increases thevehicle’s weight, and therefore decreases fuel efficiency. There is also evidence that operating thesystem decreases performance in other dimensions.22 Whether turbodiesels will remain a viableproduct in the United States market is unclear. Moreover, the impact of vehicle emissions onvehicle sales suggests that American emission standards amounted to a de facto ban of dieselvehicles in the US market. Could then a similar European emission policy have eliminated anychance of success for diesels in Europe?
4. An equilibrium oligopoly model of the automobile industry
� In this section, we present a structural model of demand and supply to conduct our analysis.We first present a BLP discrete choice demand for horizontally differentiated products withheterogeneous preferences over observable and unobservable automobile characteristics. We addto this a model of oligopoly Bertrand-Nash price competition among multiproduct firms. Themodel delivers a set of structural equations which we use to recover the underlying demand andcost parameters.
� Demand. Demand can be summarized as follows: consumer i derives an indirect utilityfrom buying vehicle j at time t that depends on price and characteristics of the car:
uijt = xjtβi + αit p jt + ξjt + εijt,
where i = 1, . . . , It ; j = 1, . . . , Jt ; t = {1991, . . . , 2000}, (1)
where we define a product j as model-engine type pair. In this Lancasterian approach, utilitydepends on the set of characteristics of the vehicle purchased, which includes a vector of Kobservable characteristics xjt as well as other characteristics, which are known to consumers andfirms but remain unobservable for the econometrician, ξjt. Unobserved tastes of consumer i forvehicle j , εijt, follow an i.i.d. multivariate type I extreme value distribution. Similar to Sweeting(2013), we assume the unobserved quality ξjt evolves according the following AR(1) process:
ξ j,t+1 = Fj + Sj + ρξξ j,t + ν j,t+1, (2)
21 According to Stewart (2010), the NOx emissions level of the least polluting diesel model available in Canada, theVOLKSWAGEN Jetta (known as Bora in Europe), was 0.915 and 0.927g/mi for the 1991 and 1997 year models, respectively.This indicates that the NOx emissions standards imposed by the EPA were indeed binding constraints for diesel vehicles,as even the cleanest diesel models barely met the 1994 US emission standards and would have generated NOx emissions13 times greater than the 2000 limit.
22 See the April 2016 report “Volkswagen Diesel Emissions Settlement High on Promise, Short on De-tails.” (www.consumerreports.org/cars-vw-fix-for-diesel-vehicles/). VOLKSWAGEN argues that the fix applied to theTDI has no impact on fuel efficiency or performance, though road tests appear to contradict the company’s claim(www.motortrend.com/news/diesel-fix-reduces-fuel-economy-on-european-vw-model-test-shows/).
C© The RAND Corporation 2018.

514 / THE RAND JOURNAL OF ECONOMICS
where Fj is a time-invariant brand (e.g., VOLKSWAGEN) fixed effect that captures differences inproduct quality levels across brands, Sj is a time-invariant segment (e.g., COMPACT) fixed effect thatcaptures differences in product quality across segments, and ν ∼ N (0, σ 2
ν) are temporary product-
level demand shocks. This specification accounts for gradual unobserved improvements in qualitythat are the result of investment and cumulative experience of manufacturers, a reasonableapproach when automakers are deploying new diesel models characterized by unobservableperformance features such as high torque at low r.p.m., extended durability, and great reliability.As in Schiraldi (2011), ν represents unexpected innovations in unobserved quality that drivesdemand.
We allow for individual heterogeneity in response to vehicle prices and characteristics bymodelling the distribution of consumer preferences over characteristics and prices as multivariatenormal with a mean that shifts with consumer attributes:
αit = α/yit, (3a)
βi = β + ηi , ηi ∼ N (0, In+1). (3b)
Consumer i in period t is characterized by her income yit as well as a vector of random tastes, ηi ,distributed i.i.d. standard normal. measures the covariance in unobserved preferences acrosscharacteristics. The inclusion of these random coefficients generates correlations in utilities forthe various automobile alternatives that relax the restrictive substitution patterns generated by theIndependence of Irrelevant Alternatives property of the multinomial logit model.
We decompose the deterministic portion of the consumer’s indirect utility into a commonpart shared across consumers, δjt, and an idiosyncratic component, μijt. The mean utilities ofchoosing product j and the idiosyncratic deviations around them are given by:
δjt = xjtβ + ξjt, (4a)
μijt = α/yit + xjtηi . (4b)
Each period t , Mt consumers each choose to purchase either one of the Jt vehicles availableor the outside option ( j = 0) of not buying a new car. We normalize the value of the outsideoption to be zero.23 We therefore define the set of individual-specific characteristics leading tothe optimal choice of car j as:
Ajt(x·t , p·t , ξ·t ; θ ) = {(yit, ηit, εijt)|uijt ≥ uikt ∀k = 0, 1, . . . , Jt}, (5)
with θ summarizing all model parameters. The extreme value distribution of random shocks allowsus to integrate over the distribution of εit to obtain the probability of observing Ajt analytically.The probability that consumer i purchases automobile model j in period t is:
sijt = exp(δjt + μijt)
1 + ∑k∈Jt
exp(δkt + μikt). (6)
Integrating over the distributions of consumer income yit and unobservable consumer attributesηit, denoted by Py(yt ) and Pη(ηt ), respectively, leads to the model prediction of the market sharefor product j at time t :
sjt(xt , pt , ξt ; θ ) =∫
ηt
∫yt
sijtdPyt (yt )dPηt (ηt ), (7)
with s0t denoting the market share of the outside option.
23 The data does not allow us to adequately model the used car market, for example, Gavazza, Lizzeri, and Roketskiy(2014), so our definition of the outside option combines consumers who do not buy a car with those who choose to buya used car rather than a new car. Appendix A documents how we account for variation of the outside option over theeconomic cycle in Spain during the 1990s.
C© The RAND Corporation 2018.

MIRAVETE, MORAL AND THURK / 515
� Pricing. Equilibrium prices are found as the solution to a noncooperative Bertrand-Nashgame among the competing automakers. A firm f maximizes period t profits by choosing thevector of pre-tariff prices pw
jt for all of the products in its portfolio J ft . Going forward, we drop
time subscripts for the sake of brevity. Equilibrium pre-tariff prices (pwj ) can therefore be written
as a nonlinear function of the product characteristics (x), market shares s j (x, p, ξ ; θ ), retail prices(p), and markups:
pw
j = mcj + −1(p, x, ξ ; θ )s j (p, x, ξ ; θ )︸ ︷︷ ︸bj (p, x, ξ ; θ )
; (8)
where pj = pwj × (1 + τ j ) and τ j is the import duty applicable to model j , if any. The vector of
equilibrium euro markups bj (·) depends on market shares s j (·) and the matrix (·) with elements:
r j (x, p, ξ ; θ ) =⎧⎨⎩
∂sr (x, p, ξt ; θ )
∂pj
× ∂pj
∂pwj
, if products {r, j} ∈ J f ,
0 otherwise.(9)
Thus a firm f ’s optimal choice of pre-tariff prices internalizes the official tariff rate (if applicable)as well as the cross-price elasticities of products in its portfolio (J f ).
In estimating costs, we make a common assumption that firms have Cobb-Douglas costfunctions, therefore:
log c = Zγ + ω, (10)
where Z is composed of brand and segment fixed effects as well as logged observable character-istics, and ω are cost components unknown to the researcher.
5. Estimation
� We define the structural parameters of the model as θ = [α, β, γ,, ρξ , σ2ν] and construct
the demand-side structural error by creating quasidifferenced moments of consumer mean utility(4a) taking advantage of the AR(1) process in which unobserved product quality evolves:
δjt(,α; sjt) − ρδ j,t−1(,α; s j,t−1) = xjtβ − ρx j,t−1β + Fj + Sj + νjt. (11)
Define the demand-side structural error as εD(θ ) = ν and the supply-side structural erroras εS(θ ) = ω. We construct these structural errors as follows. First, we solve for the meanutilities δ(θ ) via a contraction mapping, which connects the predicted purchase probabilities inthe model to observed shares in the data for a given value of θ (see Berry, 1994, and BLP).We construct predicted aggregate shares (7) via Monte Carlo integration using 6000 Haltondraws. The demand-side structural error εD then follows from (11).24 Observed prices, ownershipstructure, and tariff rates plus equation (8) generate marginal costs as a function of the parameterguess. The supply-side structural error εS then follows from (10).
We make the common assumption that the product set is exogenous, so that our structuralerrors are mean independent of the product characteristics, that is, E[ω|Z ] = 0 and E[ν|X ] = 0.25
Demand and supply parameter estimates θ = [α, β, γ,, ρξ , σ2ν] are recovered via a generalized
method of moments (GMM) estimator, using observable product characteristics as basis functionsto construct identifying moment conditions H . The GMM estimator exploits the fact that at the true
24 When we observe a vehicle for the first time, the analog to (11) is εDjt (θ ) = δjt(θ ) − xjtβ − Fj − Sj , where our
assumption is that these temporary demand shocks are also i.i.d. N (0, σ 2ν ).
25 There are no automobile models sold exclusively in Spain, but rather all are sold across the European continent.This reduces the concerns that product characteristic X may be endogenous and responding to local demand.
C© The RAND Corporation 2018.

516 / THE RAND JOURNAL OF ECONOMICS
value of parameters (θ�), the instruments H are orthogonal to the structural errors εD(θ�), εS(θ�)so that the GMM estimates solve:
θ = argminθ
{g(θ )′HWH ′g(θ )}, (12)
where g(θ ) is a stacked vector of the demand-and supply-side structural errors, and W is theweighting matrix, representing a consistent estimate of E[H
′gg′ H ].26
Knittel and Metaxoglou (2014) and Dube, Fox, and Su (2012) point out that finding aglobal solution to (12) is difficult because the objective function is highly nonlinear so any line,gradient, or simplex search will likely only result in a local solution. To increase the likelihoodof achieving a global minimum, we employ a state-of-the-art minimization algorithm (KnitroInterior) starting from several different initial conditions—a strategy shown by Dube, Fox, andSu (2012) to generate the global solution in Monte Carlo simulations.
� Specification. Consumer demand includes measures of automobile performance: horse-power divided by weight (HPW), exterior dimensions (SIZE), fuel economy (KPE), and engine type(DIESEL), where the inclusion of DIESEL as a random coefficient allows for different substitutionpatterns within the diesel segment. We also include a linear diesel trend (DIESEL × TREND) inmean utility, which we found helpful in explaining the increasing popularity of diesel vehiclesover time. We include brand fixed effects (e.g., AUDI, TOYOTA) to account for quality differencesacross brands and segment fixed effects (e.g., COMPACT, SEDAN) to capture segment-specific meanutility differences beyond HPW, SIZE, or KPE. We simulate individual income yit from yearly censusdata to account for changes in the distribution of income across time. Finally, the inclusion ofa linear time TREND accounts for any variation in the remaining relative valuation of the outsideoption over time.
In modelling supply, we assume that marginal cost is a function of logged HPW, SIZE, and fuelefficiency. In contrast to consumer demand, we replace KPE for C90 to eliminate the effect of fluctu-ations in fuel price, which has nothing to do with the cost of manufacturing engines. Consequently,AUDI’s fuel-efficiency for a gasoline model A4 impacts its cost directly as measured by C90, butdemand for A4’s will also be influenced by changes in the price of gasoline (Figure 2) due to eco-nomic factors outside of AUDI’s control through KPE. Similarly, we interact an index for the price ofsteel, SPI, with HPW and SIZE to account for the changes in the cost of this input.27 This impacts thevalue of HPW and SIZE in supply but not demand. We also include a DIESEL dummy to account fordifferences in engine cost, as diesel engines are manufactured to withstand higher compressionratios during internal combustion. We include linear trends gasoline and diesel to capture changesin production marginal cost across the sample. As in the demand specification, we include brandand segment dummies to account for differences in marginal cost across these dimensions. Fi-nally, changes in import tariff rates are accounted for in p through pricing equation (8), whereaschanges in firm ownership due to mergers and acquisitions documented in Appendix A (Table A2)impact the matrix and ultimately estimated marginal costs also through equation (8).
� Parameter identification and instruments. The parameter estimates are pinned down inthe GMM estimation via the instruments H . The intuition into how data variation identifies differentcomponents of θ is as follows. Mean utility parameters β and cost parameters γ are recoveredusing the linear projection outlined in Nevo (2000) using equations (10) and (11). Consequently,the mean utility vector β is identified by correlations between market shares and observableproduct characteristics after controlling for persistent variation in brand (via F), segment (viaS), and model (via ρξ ). The identification of γ follows from variation in observable product
26 In constructing the optimal weighting matrix, we first assume homoscedastic errors and use W = [H′H ]−1 to
derive initial parameter estimates. Given these estimates, we solve equation (12) and use the resulting structural errors(εD, εS) to update the weight matrix.
27 As heavier cars contain more steel, we multiply WEIGHT by SPI and recompute HPW.
C© The RAND Corporation 2018.

MIRAVETE, MORAL AND THURK / 517
FIGURE 4
SAMPLE VARIATION OF HOUSEHOLD INCOME
11.0 11.3 11.1 11.211.8 11.9
12.3 12.1
12.913.6
0
2
4
6
8
10
12
14
Ave
rage
hou
seho
ld in
com
e(T
hous
ands
of 1
994
euro
s)
1991 1992 1993 1994 1995 1996 1997 1998 1999 2000
Source: Encuesta Continua de Presupuestos Familiares, INE (Spanish Statistical Agency).
characteristics and implied marginal costs, where the latter depends on variation in price andmarket shares via the price coefficient α, plus the shocks to fuel price and steel prices. Given theexogeneity of product set, the components of X and Z are sufficient instruments for β and γ .
The timing of unobserved quality shocks ν makes past product characteristics valid instru-ments to identify the AR(1) persistence term ρξ and therefore, this parameter is identified bypersistence in market shares not explained a general time TREND, or a specific fuel time effect,DIESEL × TREND. The price coefficient α is identified by changes in the income distribution overthe economic cycle of Figure 4, plus variation in prices and quantity sold over the sample period.We instrument for price using the total number of products accounting for differences in firmportfolios. This provides two instruments: (i) the sum of other products in the firm’s period tportfolio and (ii) the number of products produced by other firms in period t . Reynaert andVerboven (2014) show that including the supply-side pricing decision aids in the identification ofα. Residuals from the GMM estimation are used to compute σ 2
ν.
The remaining parameters are the random coefficients which govern product substitutionpatterns among observable characteristics. Under the assumption the product set is exogenous,a common assumption, we use variation in the product set to identify these parameters, takingadvantage of changes in product characteristic space (e.g., HPW, SIZE, KPE) plus changes in pricesand quantities to isolate these substitution patterns.
Our specification includes a CONSTANT and an indicator for DIESEL engines. These parametersgovern substitution within the gasoline and diesel segments, respectively. The sum of productsin and outside the portfolios of firms not only aid in instrumenting for price, they also provideidentification for the CONSTANT random coefficient. We construct the instruments for the DIESEL
random coefficient using the number of vehicles within fuel types, as in Bresnahan, Stern, andTrajtenberg (1997): (i) the sum of other products in the firm’s period t portfolio of the same fueltype as product j , and (ii) the number of products of the same fuel type as product j producedby other firms in period t . Thus, the random coefficient for diesel vehicles is identified by thecorrelation between changes in the number of diesel vehicles in the product set and changes inpurchase shares of diesel vehicles. A similar rationale holds for the constant random coefficientwith respect to gasoline-powered vehicles.
Other random coefficients (HPW, SIZE, and KPE) refer to continuous characteristics. Weconstruct instruments for these random coefficients by approximating the “optimal instruments”
C© The RAND Corporation 2018.

518 / THE RAND JOURNAL OF ECONOMICS
of Chamberlain (1987) using the “differentiation IVs” of Gandhi and Houde (2015).28 The ideais to use the distributions of product characteristics to identify by constructing cdf’s for eachcontinuous characteristic based on the pairwise distances among any two products. For example,we can construct a cdf for a 1995 Audi A4 in KPE space by looking at the distance betweenthat model’s fuel economy and the fuel economy of other models in that year. The additionor subtraction of models over time then impacts this distribution. When consumers value fueleconomy, orthogonality between εd(θ ) and this cdf is achieved by increasing the KPE randomcoefficient—a similar intuition to the instruments used in BLP.
We operationalize this approach by replacing the large-dimensional cdfs with sample statis-tics. Specifically, the period t instrument for product j and characteristic k is
H k,1jt =
Jt∑r = j
r∈F j
(dk
r j,t
)2(13a)
H k,2jt =
Jt∑r = j
r /∈F j
(dk
r j,t
)2(13b)
H k,3jt =
Jt∑r = j
dkr j,t × 1
(dk
rj,t < sd(xk
·,t))
(13c)
H k,4jt =
Jt∑r = j
r∈Fuel j
dkrj,t × 1
(dk
rj,t < sd(xk
·,t))
, (13d)
where dkrj,t is the distance in product characteristic space k between products j and r defined as
xkr,t − xk
j,t , and sd(xk) is the standard deviation of characteristic k. Thus, H k,1jt sums the square of
the distances products of the same brand than product j ; H k,2jt of products of other brands; H k,3
j t
of “close” products of any brand; and H k,4jt of close products of the same fuel type. We follow a
similar approach in constructing the supply-side instruments.
� Estimation results. We present the parameter estimates for a logit model and our pre-ferred random coefficient logit (“RC Logit”) specification in Table 2. Overall, the estimates arereasonable, statistically significant, and congruent with the descriptive evidence of the Spanishautomobile industry of Section 2.
Recall that diesel vehicles present two primary differences from gasoline vehicles: betterfuel efficiency (measurable) and greater torque at low r.p.m. (unobservable). The former wecapture via our measure of fuel economy (KPE) in consumer utility, whereas the latter we captureby including diesel dummy and trend variables (DIESEL, DIESEL × TREND) in mean utility. We findthat consumers do indeed value fuel economy (βKPE > 0), and the effect is statistically significant.This result identifies the first channel by which the fuel taxation and vehicle emission standardschosen by European regulators implicitly promoted these vehicles. Fuel economy (KPE) accountsfor both differences in fuel efficiency (MPG) and fuel price. A low diesel fuel tax thereforeincreases diesel fuel economy relative to gasoline-powered models and increases both dieselvehicle sales and profits for the automakers who produce them. Stricter NOx emissions standardsrequire modifications to the engine, which add weight and decrease performance, including fuelefficiency. Thus, weak emission standards also increase the attractiveness of diesel vehicles byincreasing fuel economy.
At the beginning of the sample, consumers value diesels less than gasoline-powered cars(βDIESEL < 0), but their perceptions of diesels increase over the decade. The increasing valuation
28 Reynaert and Verboven (2014) further discuss instrumentation of discrete choice demand systems.
C© The RAND Corporation 2018.

MIRAVETE, MORAL AND THURK / 519
TABLE 2 Demand and Supply Estimates for Different Specifications
Logit RC Logit
Coefficient Rob. SE Coefficient Rob. SE
Mean Utility (β)CONSTANT −12.8646 (0.8857) −19.8474 (5.3107)HPW 0.5469 (0.0734) −2.3574 (1.5000)SIZE 4.3136 (0.7028) 6.1373 (5.6900)KPE 0.3822 (0.0960) 1.0342 (0.5598)TREND 0.0589 (0.0156) 0.4668 (0.1888)DIESEL −1.1659 (0.2074) −10.2957 (4.8363)DIESEL × TREND 0.1672 (0.0226) 0.6763 (0.2644)
Standard Deviation (σ )CONSTANT 2.9841 (2.1617)HPW 1.2504 (0.5075)SIZE 4.2742 (2.1363)KPE 0.8242 (0.3740)DIESEL 5.4194 (2.8847)
Interactions (�)PRICE/INCOME −1.6853 (0.0957) −2.2252 (0.0695)
Transition Process for Unobserved Qualityρξ 0.8618 (0.0087)σ 2
ν 0.8818 (0.1481)
Cost (γ )ln(HPW/SPI) 6.4626 (1.1368) 0.7954 (0.0478)ln(SIZE × SPI) 20.6792 (3.6212) 2.8725 (0.1191)ln(c90) −2.3107 (1.2663) 0.6027 (0.0431)TREND 0.0796 (0.0985) −0.0237 (0.0029)DIESEL 4.1180 (2.0462) 0.4271 (0.0342)DIESEL × TREND −0.3082 (0.2623) −0.0057 (0.0032)
Notes: GMM J-statistic for RC Logit model is 94.67. Results based on 1849 observations and 6000 simulated agents peryear. In the Logit model, we replace yi,t with average period t income. Estimation results for brand and segment dummiesin consumer mean utility and firm costs not reported. Robust standard errors in parentheses. Equilibrium prices accountfor year-specific ownership structure as reported in Appendix A (Table A2).
of diesels could reflect improvements to unobserved quality or consumers learning about thenext generation diesel technology, the turbodiesel. Unfortunately, our data do not enable us todifferentiate between these two hypotheses. We also find persistence in the unobserved quality ofautomobiles, ρξ > 0, even after controlling for differences in brand, though temporary demand arealso important, (σ 2
ν> 0). On the cost side, we find that diesels are more expensive to manufacture
than gasoline models. Marginal cost of production are also higher for larger and more powerfulcars. Marginal cost is decreasing in fuel efficiency (increasing in C90). Our cost estimates alsoindicate significant efficiency gains throughout the decade for both gasoline and diesel vehicles.
Our results indicate that small, inexpensive cars tended to have less elastic demand—a resultconsistent with Grigolon and Verboven (2014) for the German automobile industry. For example,the average estimated demand elasticities for COMPACT, SEDAN, and LUXURY vehicles are 2.52, 2.96,and 3.86, respectively. Thus, an automaker tended to generate more profit per vehicle selling aCOMPACT car (44.25% average estimated price-cost margin) than a LUXURY car (28.67% averageestimated price-cost margin).29
Significant estimates for the HPW, SIZE, KPE, and DIESEL random coefficients indicate a greatdeal of heterogeneity among consumers, though these estimates are smaller (in absolute value)
29 We define the price-cost margin of vehicle j in period t as 100 × pwjt −cjt
pwjt
, where pwjt is the price set by the automaker
(i.e., does not include any applicable tariff) and cjt is the estimated marginal cost of producing vehicle j .
C© The RAND Corporation 2018.

520 / THE RAND JOURNAL OF ECONOMICS
FIGURE 5
CROSS-PRICE ELASTICITIES
0.00
0.01
0.02
Cro
ss-p
rice
elas
ticity
0 10 20 30 40 50 60 70 80 90
Distance in product space (0 = Near, 90 = Far)
(a) hpw
0.00
0.01
0.02
Cros
s-pr
ice e
last
icity
0 10 20 30 40 50 60 70 80 90
Distance in product space (0 = Near, 90 = Far)
(b) size
0.00
0.01
0.02
Cro
ss-p
rice
elas
ticity
0 10 20 30 40 50 60 70 80 90
Distance in product space (0 = Near, 90 = Far)
(c) kpe
0
.01
.02
.03Cr
oss-
price
elas
ticity
Diesel-Diesel Gas-Gas Diesel-Gas
(d) Fuel Type
Notes: Figures present average estimated cross-price elasticities across characteristics (panels a–c) and engine-type(panel d). In Table B1, we present the matrix of estimated cross-price elasticities for the most popular products, whereasin Table B2, we present the “best substitute” for a select number of products.
than the corresponding estimates on the mean utility, so both components tend to be importantwhen consumers make purchase decisions. Interestingly, we find the random coefficient forgasoline cars (σCONSTANT) is large but insignificant, indicating that other characteristics account forthe majority of the variation in car substitution patterns.
In Figure 5, we show the inclusion of random coefficients translates into reasonable esti-mated substitution patterns. In panels (a–c), we compare the average cross-price elasticity amongproducts as we increase the product distance, dk
rj,t , in characteristic space. For each observableproduct characteristic, we divide the product pairs into deciles and plot the average cross-priceelasticity on the x-axis. Product pairs in the left-most bins are therefore closer together thanproduct pairs in the right-most bins. Panels (a–c) all indicate that car models close together incharacteristic space tend to be better substitutes. As diesel is a discrete variable, we show theaverage cross-price elasticity within and across fuel types (panel d). Our estimates indicate thatdiesels are closer substitutes to other diesels and that gasoline models are closer substitutes toother gasoline models.
In Figure B1 in Appendix B, we report our estimates of the brand fixed effects in demandand supply relative to the Spanish market leader, RENAULT. Again, results are very reasonable.German upscale brands AUDI, BMW, and MERCEDES have higher valuations, but are also the mostexpensive to produce. Foreign imports tend to be relatively inexpensive to produce (e.g., DAEWOO,HYUNDAI, KIA), although less so among those with higher estimated valuations among consumers(e.g., HONDA and TOYOTA). Meanwhile, the old Spanish brand SEAT, now operated by VOLKSWAGEN,
C© The RAND Corporation 2018.

MIRAVETE, MORAL AND THURK / 521
FIGURE 6
ROLE OF TRANSITORY DEMAND SHOCKS (ν) [Color figure can be viewed at wileyonlinelibrary.com]
0.00
0.20
0.40
0.60
Obs
erve
d ve
hicl
e m
arke
t sha
res
0.00 0.20 0.40 0.60 Predicted vehicle market shares without transitory demand shocks (ν)
Notes: Figure compares the actual vehicle market shares (y-axis) to the predicted market shares under the restrictionof ν = 0 (x-axis).
is both inexpensive to produce and relatively well valued by consumers, though both effects aresmall.
In Figure 6, we demonstrate the importance of the transitory demand shocks captured by ν
toward predicting consumer demand. We do so by comparing the actual vehicle market shares(y-axis) to the predicted market shares when we set ν = 0 (x-axis). As the model generatesobserved demand by construction, if setting transitory demand shocks played little role, settingν = 0 would correspond to only small deviations in predicted demand. Graphically, this wouldcorrespond to points concentrated on the dashed 45-degree line of Figure 6. Whereas there is somebunching around the 45-degree line reflecting the importance of other demand-side covariates,we also observe large deviations indicating that transitory demand shocks are also important.
In Table 2, we also compare our preferred RC Logit estimation to that of a simple multinomiallogit model, where the latter differs from the RC Logit model in two ways. First, it restrictssubstitution patterns by imposing = 0 and yi,t = yit. Second, we assume no autocorrelationin unobserved characteristic and impose ρξ = 0, σ 2
ν= 0. This restricted simple logit model
still delivers many of the qualitative results from the estimated RC Logit model, for example,consumers favor fuel economy (KPE) and have a negative preference for diesels, which improvesover time. This provides further evidence that pro-diesel fuel taxation and vehicle emissionstandards promoted diesels by increasing their fuel economy. The most notable difference betweenthe models corresponds to price responsiveness of consumers, where in our preferred RC Logitframework, consumers are more sensitive to price than in the logit model. We therefore estimatedemand to be less elastic in the logit model, where 3% of car models have inelastic estimateddemands. In comparison, demand estimates in the RC Logit model yield vehicle demand curveswhich are always elastic.30
In summary, the estimated RC Logit model generates reasonable estimates of consumerdemand and supplier marginal cost. The estimated model also delivers reasonable substitutionpatterns between products (Figure 5) and own-price elasticities. We find that consumers valuefuel economy (KPE) when purchasing a new vehicle. As the fuel taxation and vehicle emissionpolicies we discussed in Section 3 both increase fuel economy for diesel cars, these estimationresults support our hypothesis that these policies promoted diesel vehicles.
30 Although ignoring the distinction between diesel and gasoline models, Moral and Jaumandreu (2007) find similardemand elasticities as our preferred RC Logit estimated model.
C© The RAND Corporation 2018.

522 / THE RAND JOURNAL OF ECONOMICS
FIGURE 7
SHARE OF PROFITS FROM DIESEL CARS
13.5 13.5
38.0
19.8
59.3
14.4
0
10
20
30
40
50
60
70
Sha
re o
f pro
fits
(%)
1991 1995 2000
Benchmark No diesel trend
(a) European firms
1.2 1.2
11.7
5.2
24.3
3.7
0
10
20
30
40
50
60
70
Sha
re o
f pro
fits
(%)
1991 1995 2000
Benchmark No diesel trend
(b) Non-European firms
� Value of diesels. Before moving on to testing our hypotheses as to whether preferentialfuel taxation and vehicle emissions promoted diesels and in so doing, amounted to a successfulstrategic trade policy, we use the parameter estimates to document that diesel cars were indeed avaluable innovation for European firms. In Figure 7, we use our cost estimates to show that dieselsgenerated a significant share of the profits for European firms that increased over time. Althoughprofits from diesels also increased for non-European (largely Asian) firms, their contribution toprofits was substantially smaller. If we hold the consumer valuation of diesels fixed at their 1991level by setting βDiesel-x-Trend = 0, the importance of diesels to these firms’ decreases significantly,indicating that the improving valuation of diesels played an important role in the technology’ssuccess.
6. Fuel taxation and emissions policies as strategic trade policy
� In this section, we use the estimated RC Logit model to test the quantitative impor-tance of pro-diesel fuel taxation and emissions policy. Although there are many potential alter-native policies we could consider, we restrict our attention to the following scenarios. We assumeEuropean regulators equalize fuel taxes by setting a uniform fuel tax equal to the gas tax weobserve in the data. Regarding alternative emissions policies, we allow for the possibility that astricter NOx vehicle emissions policy could affect both the marginal cost of producing diesels andtheir performance. For simplicity, we assume that all diesel models require the same “abatementcost” and suffer the same reduced performance, though it is likely these effects would vary byengine and car size.
The task then is to identify a “realistic” cost and change in performance an automaker’sdiesel fleet would incur to meet the hypothetical stricter NOx emission standard. For years, atechnology to successfully capture NOx emissions at the tailpipe simply did not exist. When itfinally became available, in the late 2000s, it was still very expensive. By the EPA’s own estimatesin 2010, diesel engines could be retrofitted to comply with both EPA and California NOx emissionstandards by means of a Lean NOx Catalyst (LNC) at an estimated cost of between $6,500 to$10,000 per vehicle. Lean NOx catalysts use diesel fuel injected into the exhaust stream to createa catalytic reaction and reduce pollution. However, these catalysts still require specific exhausttemperatures for appropriate NOx emission control performance, and on average, they reduceemissions up to a maximum of 40%. German manufacturers BMW and MERCEDES were certifiedto be sold in all 50 states of the United States in 2009 only after equipping their new vehicleswith the more efficient and expensive Selective Catalytic Reduction System that injects a reluctant(a urea-based solution) into the exhaust stream, where it reacts with a catalyst to convert NOx
C© The RAND Corporation 2018.

MIRAVETE, MORAL AND THURK / 523
emissions to nitrogen gas and oxygen. This system is more effective, reducing NOx emissions upto 75%, but the EPA estimated that its retrofitting cost ranged between $10,000 and $20,000 pervehicle in 2010.31
These options for abatement technology yields a great deal of variation for how Europeanautomakers may have responded to a more rigorous NOx vehicle emissions standards. If weassume such a technology did in fact exist in the 1990s, the abatement cost estimates from EPAare likely biased upward, as they amount estimated costs for the ex post retrofitting of vehiclesto meet the stricter American emission standard. It seems likely that an automaker making anex ante modification to a diesel vehicle could likely do so at a lower cost. We therefore model twoscenarios at different estimates of abatement cost in hopes of providing a reasonable range for thelikely impact of a stricter NOx emission policy. First, we assume the marginal cost of attachingan abatement system (either LNC or SCR) to a 1990s European diesel would have been the lowerbound of the above ex post retrofitting estimates ($6500).32 We view this estimate change inmarginal cost as a likely upper bound and refer to this scenario as “EPA.” Second, we considerthe “NONE” scenario where meeting a stricter NOx standard does not impact the marginal costof diesels at all. We view this scenario as a lower bound, because adding abatement technologyat the very least requires the purchase and installation of a SCR or LNC system.
To evaluate the impact of stricter emissions policies on performance, we use the 2015Volkswagen emissions scandal as guidance, as these vehicles were equipped with viable SCRabatement systems, so the company had incurred the increased marginal cost to include theabatement technology. The scandal therefore highlighted the impact of a stricter NOx vehicleemissions on engine performance as the company included a software-based “defeat device,”which changed how the vehicle used the SCR system:
The software sensed when the car was being tested and then activated equipment thatreduced emissions, United States officials said. But the software turned the equipmentdown during regular driving, increasing emissions far above legal limits, most likely tosave fuel or to improve the car’s torque and acceleration. 33
The fact that Volkswagen management was willing to risk billions of dollars in fines anddamage to the brand’s value for the sake of increasing performance (e.g., fuel efficiency) speaksto the importance of this channel toward selling diesel vehicles. The question then is: how big isthis change in performance? For the emissions scandal, evidence suggests that the modificationsrequired to bring diesels in compliance with the US NOx standard decreases fuel efficiency (MPG)6.8% on average. We therefore assume that under both the “None” and “EPA” cost scenariosdescribed above, meeting the stricter NOx emission standard we consider decreases fuel efficiency(MPG) 6.8%, and thereby decreases fuel economy (KPE). We view this as a likely lower bound onthe impact to performance, because part of the benefit of diesels is also the (unobservable to us)increased torque at low r.p.m., which is captured only in the diesel fixed effect and diesel-trendvariable.
� The shrinking popularity of diesels under alternative policies. We begin the analysis byevaluating how fuel taxation and emission standards affect the demand for diesel automobiles. InFigure 8, we use the estimated model to show that switching to a less diesel-friendly fuel tax or amore NOx stringent vehicle emission standard leads to significant reductions in the popularity ofdiesels across the entire sample.
31 On abatement costs, see Diesel Retrofit Devices. EPA’s National Clean Diesel Campaign, 2013.www.epa.gov/cleandiesel/technologies/retrofits.htm, as well as our summary in Appendix A.
32 In 1994, euros this figure amounts to an increase in marginal cost of €3300 or 23.9% of the average (sales-weighted) diesel retail price of €13,794 in our sample.
33 “How Volkswagen’s ‘Defeat Devices’ Worked.” New York Times. March 16, 2017.
C© The RAND Corporation 2018.

524 / THE RAND JOURNAL OF ECONOMICS
FIGURE 8
FUEL ECONOMY, FUEL EFFICIENCY, AND DIESEL POPULARITY
12.8
7.5
32.9
21.2
53.7
45.4
0
10
20
30
40
50
60
Die
sel m
arke
t sha
re
1991 1995 2000
Data Equalize
(a) Fuel tax
12.810.6
7.8
32.9
28.6
23.8
53.750.4
44.9
0
10
20
30
40
50
60
Die
sel m
arke
t sha
re
1991 1995 2000
Data None EPA
(b)Vehicle emissions
Notes: Bars reflect market share of diesels as a function of different fuel tax and vehicle emission policies.
In panel (a), we show that modifications to the fuel tax impacts the relative gasoline/dieselfuel prices facing consumers and ultimately leads to a reduction in diesel sales. The uniform fueltax scenario, where all fuels are taxed at the current higher gasoline tax, increases the driving costsof diesel vehicles and results in sizable reductions in diesel market share: ↓ 5.3%, ↓ 11.7%, and↓ 8.3% in 1991, 1995, and 2000, respectively. These results are inline with Grigolon, Reynaert,and Verboven (2017) who predict that the 1998 diesel market share in Spain would have decreased9% had regulators increased the diesel fuel tax such that the price of diesel fuel matched the priceof gasoline.34
Panel (b) shows smaller but qualitatively similar effects due to a stricter NOx vehicle emis-sions policy. We begin by looking at the impact of such a standard when we assume automakerscould have met the stricter standard by modifying performance alone (i.e., “None”). Under thisscenario, diesel market share falls 2.2% in 1991 and 3.3% in 2000. When we also account forthe increased cost from attaching an abatement technology to the engine (i.e., “EPA”), firmsoptimally choose to pass through some of this expense to consumers, leading to higher dieselvehicle prices and even lower penetration of diesel vehicles: decreasing 5.0% in 1991 and 8.8%in 2000.
In Figure 9, we evaluate financial implications of these policies to firms in order to identifythe beneficiaries of the observed pro-diesel policies. We focus on the share of imports and theprofits of European manufacturers to highlight how these pro-diesel policies soften competition bydirecting demand away from gasoline imports toward diesel-powered domestic automobiles. Frompanels (a) and (b), we see that instituting the alternative policies we consider decreases profits forEuropean firms significantly, whereas import shares increase (panels c–d) as consumers substituteaway from domestic diesels and toward foreign (largely Asian) gasoline-powered vehicles. Putdifferently, Figure 9 demonstrates that European firms benefited significantly from both of the pro-diesel policies employed by regulators. Moreover, these effects increased over time as domesticautomakers invested in developing their diesel fleets (i.e., Table 1).
� Import tariff equivalence. Thus far, we have shown that diesel vehicles were a popularchoice among consumers and generated substantial profits for European automakers, but muchof this success was due to preferential fuel taxes and vehicle emissions standards, which shiftedconsumption and profits toward domestic firms. In this section, we use the model estimates to
34 In contrast, we allow for the cost of gasoline and diesel fuel to differ and instead equalize the fuel taxes, leadingto a higher price of diesel fuel relative to gasoline (Figure 2).
C© The RAND Corporation 2018.

MIRAVETE, MORAL AND THURK / 525
FIGURE 9
WHICH FIRMS BENEFIT FROM CURRENT POLICY?
-3.3
-9.6-10.0
-12
-11
-10
-9
-8
-7
-6
-5
-4
-3
-2
-1
0
Perc
ent c
hang
e fro
m d
ata
1991 1995 2000
(a) European firm profits (fuel tax)
-1.5
-2.9
-3.7
-6.5
-4.3
-9.0
-12
-11
-10
-9
-8
-7
-6
-5
-4
-3
-2
-1
0
Per
cent
cha
nge
from
dat
a
1991 1995 2000
None EPA
(b) European firm profits (vehicle emissions)
3.1 3.3
7.38.2
11.8
13.3
0123456789
10111213141516
Impo
rt sh
are
1991 1995 2000
Data Equalize
(c) Import share (fuel tax)
3.1 3.2 3.3
7.3 7.6 8.0
11.812.4
13.1
0123456789
10111213141516
Impo
rt sh
are
1991 1995 2000
Data None EPA
(d) Import share (vehicle emissions)
Notes: Panels (a)–(b) present change in total profit for aggregate profits for European firms. Panels (c)–(d) reflecttotal import share across time under different policies. “Data” corresponds to the import share observed in the data.Counterfactual experiments are described in the text. We present the cumulative effects of both policies to European firmprofits and import share in Figure B2 in Appendix B.
measure the tariff-equivalence of these policies. We do this in the following way. First, we solvefor the pricing equilibrium when European regulators choose the alternative policies we consider.Under this equilibrium, we observe substitution toward imported varieties, Figure 9, panels (c–d).We then solve for the import tariff each year, which reduces equilibrium import share to the levelwe observe in the data, that is, incentivizes consumers to purchase local vehicles. We call thisvalue the “import tariff-equivalence” of the policies.
In Table 3, we present the import tariff-equivalence of the pro-diesel policies employed bythe European Union. In the right-most column, we present the tariff required to maintain importmarket share observed in the data when regulators equalize fuel taxes and impose vehicle emissionstandards which increase diesel marginal costs and decrease fuel efficiency 6.8% (i.e., “EPA”).35
Recall that fuel economy (KPE) is defined as
KPE = “Fuel Efficiency”
“Fuel Price”. (14)
Therefore, a 6.8% reduction in fuel efficiency (MPG) due to stricter fuel emission standards alsoamounts to a 6.8% reduction in fuel economy (KPE). An increase in the diesel fuel excise taxto match the higher gasoline excise tax impacts KPE differently, however, as such a tax changeincreases the diesel “Fuel Price” leading to a reduction in diesel KPE. In our data, equalizing fuel
35 Table B3 further details the tariff-equivalence across vehicle emissions assumptions.
C© The RAND Corporation 2018.

526 / THE RAND JOURNAL OF ECONOMICS
TABLE 3 Implicit Tariff By Year Across Policies
YEAR OFFICIAL FUEL TAX EMISSIONS BOTH
1991 18.80 21.72 21.38 23.221992 14.40 18.27 17.69 20.011993 10.30 14.96 14.09 17.121994 10.30 16.11 14.60 18.541995 10.30 17.67 15.60 20.551996 10.30 16.64 15.12 19.861997 10.30 18.07 15.94 22.031998 10.30 18.94 15.92 22.811999 10.30 21.69 17.91 27.362000 10.30 19.65 17.81 25.28
Notes: “Data” is the current import tariff on foreign imports. “Fuel Tax” corresponds to the implicit import tariff forthe observed fuel excise taxes. “Emissions” corresponds to the implicit tariff for the observed emissions policy under theassumption that the stricter NOx policy requires a €3300 increase in marginal cost (“EPA”) and a 6.8% reduction in fuelefficiency for all diesels. “Both” corresponds to the implicit tariff when both policies are enforced simultaneously.
FIGURE 10
TARIFF-EQUIVALENCE OF EU POLICY [Color figure can be viewed at wileyonlinelibrary.com]
Only emissions Only fuel tax Both
10121416182022242628303234
Impl
icit
tarif
f (%
)
0 2 4 6 8 10 12 14 16 18 20 22 24
Percent reduction in fuel economy (KPE)
(a)No change in marginal cost (“none”)
Only emissions Only fuel tax Both
10121416182022242628303234
Impl
icit
tarif
f (%
)
0 2 4 6 8 10 12 14 16 18 20 22 24
Percent reduction in fuel economy (KPE)
(b) €3300 increase in marginal cost (“EPA”)
Notes: Implicit tariff required to limit the import share to 11.8% as we decrease fuel economy (KPE) due to changesin fuel taxation and vehicle emission policies. In Panel (a), we consider the case where a stricter NOx vehicle emissionspolicy has no effect on the marginal cost of producing diesels (i.e., “None” in the text), whereas in Panel (b), we assumethe cost of producing diesels increases €3300. Vertical dashed lines correspond to estimated changes in fuel economybased on stricter vehicle emissions policy (KPE ↓ 6.8%), equalized fuel taxes (KPE ↓ 16.8%), or both (KPE ↓ 22.5%).Shaded areas correspond to the 95% confidence interval. See Appendix B for computational details. Results correspondto year 2000 when the official import tariff was 10.3%.
taxes alone amounts to a 16.8% decrease in diesel KPE in 2000. If both policies, emissions andfuel taxation, are implemented simultaneously in that year, the two effects compound and dieselfuel economy (KPE) decreases 22.5%.
We find the implicit tariff from these policies ranges from 17.12% in 1993 to 27.36% in1999. Thus, the cumulative impact of these policies amounted to a significant trade policy barrierequivalent to imposing a tariff roughly two to three times the official rate (second column). In thethird and fourth columns, we isolate the yearly contribution of each policy. To do so, we follow asimilar approach to the one outlined above but only change one policy at a time. We find that bothpolicies played important roles and amounted to quantitatively significant de facto nontariff tradepolicies during the 1990s, though fuel taxes played an increasing role as the decade progressed.
Our calculation of the import tariff-equivalence of EU policy depended upon these policies’effect on diesel popularity via improved fuel economy (KPE) as well as changes in marginal costto meet more rigorous NOx vehicle emission standards. In Figure 10, we document that each of
C© The RAND Corporation 2018.

MIRAVETE, MORAL AND THURK / 527
these channels played a significant role in defending domestic industry. We do so by plotting theimport tariff in 2000 required to generate the import share we observe in the data, about 11.8% in2000, across different changes in fuel economy (x-axis). In panel (a), we present the case where amore rigorous NOx vehicle emission policy does not impact the marginal cost of producing dieselvehicles, whereas in panel (b), we present the “EPA” scenario where these alternative standardsincrease the marginal cost of producing diesel vehicles €3300. Thus, a zero percent change inKPE when the alternative vehicle emission policy does not impact marginal costs amounts to theequilibrium we observe in the data, and the tariff is simply the official import tariff of 10.3%.Graphically, this scenario is represented by the y-intercept in panel (a). The vertical dashed linesin each panel correspond to the change in fuel economy implied by removing the pro-dieselpolicies. Thus, the intersection of the dashed lines with the solid line in panel (b) corresponds tothe implicit tariffs we presented in Table 3 for 2000. Shaded regions indicate the 95% confidenceintervals of the estimated implicit tariff. Inference is based on bootstrapping simulations usingthe demand and cost estimates from Table 2. See Appendix B for details.
In both panels, we find an implicit tariff which is statistically greater than the official 10.3%rate for all reductions in fuel economy. Moreover, we again find that both the fuel taxation andvehicle emission policies employed by European regulators amounted to large and statisticallysignificant nontrade policies and that together, these effects compound. If we focus only onpanel (a) and ignore the possibility that changes in policy would have likely impacted vehicleproduction costs, we find that reductions in the fuel economy of diesel vehicles alone played alarge and statistically significant role in promoting domestic industry. As both preferential fueltaxes and a weak NOx emission standard increased the fuel economy of diesel vehicles, panel (a)demonstrates that these policies promoted diesel vehicles by increasing their fuel economy, absentchanges in the marginal of producing diesels.
In panel (b), we redo the analysis assuming a more rigorous NOx vehicle emission standardwould have increased the marginal cost of producing diesel vehicles by €3300. We observean upward shift in the line relative to panel (a), indicating that increasing the marginal costof producing diesel vehicles leads to higher equilibrium prices, causing consumers to shiftconsumption from domestic diesels toward foreign gasoline-powered imports. For example, ifwe ignore the role of changes in fuel economy due to changes in policy (set KPE to zero),we find that changes in diesel marginal cost would have generated sufficient substitution towardforeign imports that only by increasing the import tariff from 10.3% to 14.4% (i.e., the solid line’sy-intercept) could EU regulators have maintained data import share at 11.8%. We conclude thata weak NOx emission policy promoted diesels by also decreasing their production costs, leadingto lower prices for price-sensitive consumers.
� Consumer welfare. Thus far, our analysis has focused on the impact of pro-diesel regula-tions on market shares of imported automobiles in Europe and on the increased profits of domesticautomakers. In this section, we evaluate the impact of these policies to consumer welfare, whichwe define as mean compensating variation, that is, the average amount of money required tomake consumers indifferent when we institute alternative fuel tax and vehicle emission policiesand recompute the equilibrium. As our demand model allows for income effects, we solve forcompensating variation accounting for both income and substitution effects, following Dagsvikand Karlstrom (2005). A positive value indicates that consumers would be willing to pay thegovernment to stay in the estimated equilibrium, that is, they prefer the fuel taxation and vehicleemission policy we observe.
In Table 4, we present the welfare effects to consumers of pro-diesel policy relative to twopolicy regimes. In the columns marked “Alternative Policies,” we compare the current pro-dieselpolicy to a regime where policy makers both harmonize fuel taxes and introduce a stricter NOx
emissions standard, which reduces fuel efficiency 6.8%. These columns therefore refer to theconsumer welfare effects in Section 6, where we documented that these hypothetical fuel taxationand vehicle emission policies cause consumers to switch from diesels and toward imported cars.
C© The RAND Corporation 2018.

528 / THE RAND JOURNAL OF ECONOMICS
TABLE 4 Government Policy and Consumer Welfare
ALTERNATIVE POLICIES ALTERNATIVE POLICIES + TARIFF
YEAR NONE EPA NONE EPA
1991 €28.74 (0.21%) €72.51 (0.54%) €267.57 (1.99%) €519.15 (3.85%)1992 43.91 (0.32%) 124.65 (0.91%) 327.16 (2.38%) 635.56 (4.62%)1993 73.86 (0.50%) 192.62 (1.30%) 344.45 (2.32%) 698.84 (4.70%)1994 113.15 (0.69%) 277.18 (1.68%) 558.36 (3.39%) 1036.62 (6.29%)1995 157.31 (0.91%) 399.56 (2.31%) 747.87 (4.32%) 1359.47 (7.86%)1996 183.67 (1.03%) 484.19 (2.71%) 555.44 (3.11%) 1102.95 (6.17%)1997 233.00 (1.32%) 609.96 (3.46%) 643.97 (3.66%) 1259.29 (7.15%)1998 313.26 (1.80%) 816.54 (4.69%) 1836.33 (10.55%) 2991.68 (17.18%)1999 417.43 (2.40%) 1048.13 (6.03%) 1011.58 (5.82%) 1957.05 (11.25%)2000 402.24 (2.26%) 1135.93 (6.38%) 1238.16 (6.95%) 2424.79 (13.61%)
Average €196.66 (1.14%) €516.13 (3.00%) €772.39 (4.45%) €1419.45 (8.27%)
Notes: Table depicts mean compensating variation measured in 1994 euros under different abatement cost assumptions,where a positive value indicates the average consumer is better off under the observed pro-diesel policies. Values inparentheses correspond to mean compensating variation as a percent of median retail price in the data. Compensatingvariation in “Alternative Policies + Tariff” also includes lump-sum payment for increased tariff revenue.
Our conclusion is that the average European consumer is better off each year under thecurrent policies. This is not surprising, because the alternative policies we consider both decreasefuel economy (due to higher diesel fuel taxes and a reduction in diesel fuel efficiency) and mayincrease the retail price of diesels (due to “EPA” abatement costs). These negative welfare effectsgrow over time as diesels become increasingly popular. In terms of relative magnitudes, thechange in welfare amounts to 1.14% of median retail price on average when cost of modifyingdiesel engines are nil, though the relative impact is nearly double at the end of the decade, whendiesels are clearly dominant in several automobile segments. If meeting the alternative emissionsstandards requires positive abatement costs (column “EPA”), automakers will pass some of thisincrease in marginal costs of producing diesels to consumers. Consequently, adopting thesealternative polices decreases consumer surplus further and drivers will be even better off underthe current pro-diesel policy, about 3% of median retail price on average, though again the effectgrows over the decade to over double that gain. Put differently, the benefits of not adopting thesealternative policies to consumers increase by a factor of three when we also account for changesin marginal cost.
In Section 6, we calculated the tariff-equivalence of the observed pro-diesel policies. Onecould interpret this equilibrium as the consequence of a regulator uses only tariffs to manageimports. In “Alternative Policies + Tariff,” we evaluate the consumer welfare effects of this policy.For simplicity, we assume that incremental tariff revenue is returned to consumers as a lump-sumpayment. Now the impact to consumer welfare is more severe, as regulation not only limits thepopularity of diesel cars but also increase the retail prices of foreign imports.
Measuring the full effect to consumers requires accounting for negative health externalitiesdue to greater NOx but reduced CO2 emissions. If these externalities are large, then providingincentives to purchase diesel vehicles may adversely affect consumers and reverse the conclusionsfrom Table 4.36 This is particularly true for NOx emissions, because externalities such as smog tendto affect local populations. If we assume that regulators are not captured by domestic industryand that they do consider both the externality and consumer welfare when instituting policy,the fact we observe these pro-diesel policies supports the idea that these policies do serve alegitimate purpose: to promote a new technology, the turbodiesel, which turned out to be popularamong domestic consumers and happened to be produced by domestic firms. The impact of these
36 Measuring the externality explicitly in our context is, however, difficult because it would require measuringchanges in driving habits as a function of full prices and fuel economy.
C© The RAND Corporation 2018.

MIRAVETE, MORAL AND THURK / 529
policies on foreign firms—their tariff-equivalence—would therefore amount to an unintendedconsequence.
In summary, we have shown that the European fuel taxation and vehicle emission policiesfavored diesels, amounted to a significant nontariff trade policy, and benefited consumers, providedexternalities were sufficiently small. We conclude this section by asking: did these policies violateWTO rules? The WTO considers a policy a NTB only if the policy is not “set at an appropriate levelto achieve legitimate objectives with minimum impact on trade” (OECD, 2005), but Europeanregulators could claim the policies did serve a legitimate objective: they benefited consumers.These results therefore highlight the difficulty of prosecuting such policies in the WTO, as provingthey amount to a NTB is difficult, absent a compelling piece of evidence.
� Robustness. In this article, we find significant evidence to support the hypothesis thatEuropean fuel taxation and vehicle emissions regulation had the effect of protecting the domesticEuropean automobile industry. Our analysis does come with caveats, however. First, the esti-mated model is static, so we cannot account for the long-term effects of the alternative policieswe considered. If we interpret the increasing valuation of diesels throughout the sample (i.e.,βDIESEL×TREND > 0) as customer learning, a small modification of the diesel fuel tax (or equivalently,a small decrease in the NOx vehicle emission standard) early in our sample could have limitedthe diffusion of diesels later in the sample. Our results would then amount to a lower bound ofthe impact of these policies. Second, in evaluating the impact of a stricter NOx emission standard,we account only for reductions in fuel efficiency, though evidence suggest that torque is alsoaffected by the abatement technology. Unfortunately, our data do not include engine torque, soits contribution toward the popularity of diesel vehicles can only be captured via the diesel anddiesel-trend variables.
Finally, our results, however, depend upon the strong assumption that the set of car mod-els (and their corresponding characteristics) would not have changed, had European regulatorsadopted different fuel taxation and vehicle emissions standards. The goal of the analysis of thissection is to convince the reader that other strategies not based on the sales of diesel automobileswould have been less profitable for the European industry. European automakers had an exclusiveexpertise in the production of diesel engines, and the pro-diesel policies of European authori-ties reinforced this advantage by diverting demand away from imported fuel efficient gasolinevehicles.
There are many ways in which European firms could have responded to alternative fueltaxation and vehicle emission standards. Given the fact that consumers prefer fuel efficientvehicles (βKPE > 0), we test whether European firms could have invested in redesigning theirgasoline-powered vehicles to compensate for lost diesel profits due to the alternative fuel taxationand vehicle emission standards we considered above. As in our calculation of the implicit tariff,we begin from the counterfactual equilibrium, where regulators chose to not adopt the pro-dieselpolicies and instead adopted the alternative fuel taxation and emission policies we considered. Aswe showed in Figure 9, such policies decrease the profits of European firms. We then unilaterallysolve for the increased fuel efficiency, MPG, of European gasoline-powered cars each year requiredto offset the reduction of diesel profits. We also account for changes in firm costs due to changesin C90, as well as changes in vehicle prices (i.e., we resolve equation (8) at the new vectorof characteristics). It is important to note that this exercise may not generate equilibria whichcorrespond to the Nash equilibria of a game in which firms choose characteristics, however.Instead, we view this exercise as a simple way to explore whether such modifications would havebeen feasible.
Figure 11 reports the (sales-weighted) average mileage of the current fleet in 1991, 1995, and2000, and compares it to the required mileage for European gasoline models that will compensatethe foregone diesel profits under the “None” and the more expensive “EPA” vehicle emissionscenarios. In both scenarios, we assume regulators harmonize the fuel taxes charged to diesel and
C© The RAND Corporation 2018.

530 / THE RAND JOURNAL OF ECONOMICS
FIGURE 11
EUROPEAN FIRM RESPONSE
45.146.2
47.2
43.8
46.9
49.2
41.9
48.5
55.9
35
40
45
50
55
Ave
rage
fuel
eco
nom
y–ga
solin
e en
gine
s(m
iles/
gallo
n)
1991 1995 2000
Data None EPA
Notes: Graph depicts (sales-weighted) average gasoline fuel efficiency required for European firms to earn as muchprofit as estimated in the data. A similar pattern exists when comparing the simple average. In each counterfactualexperiment, we assume harmonized fuel taxes, as described in the text.
gasoline. For simplicity, we restrict attention to the “EPA” scenario and note that “None” amountsto an intermediate case.
At the beginning of the 1990s, when diesels generated only 13.5% of European profits,firms could offset foregone profits from diesels by increasing the fuel efficiency of their gasolinefleet from 45.1 to 47.2 miles per gallon, a 4.7% increase. By the end of the decade—whendiesels accounted for 59.3% of European firm profits—recovering the foregone profits fromdiesels would have required a 33.4% increase in gasoline vehicle fuel efficiency, from 41.9 to55.9 miles per gallon. This is less than the increase in fuel efficiency expected by Europeanauthorities between 2015 and 2021, from 45 to 68 miles per gallon, respectively. It seemsreasonable to assume that such levels of fuel efficiency were out of reach in the 1990s. Thus, thepro-diesel policies simply reinforced the most profitable product strategies available to Europeanautomakers.
7. Concluding remarks
� The goal in this article was to estimate the tariff-equivalence of two European domesticpolicies, which favored the domestic automobile industry. To do so, we estimated an equilibriumoligopoly model of differentiated products. Our estimation allowed for significant heterogeneityof preferences, finding that consumers favored fuel economy, were price-sensitive, and increasedtheir valuations of diesel vehicles over the sample period.
We find that the pro-diesel fuel tax and vehicle emissions policies employed by the EuropeanUnion amounted to significant trade policies, which we estimate to be equivalent to a 17% to27% import tariff. This is, to the best of our knowledge, the first use of a structural equilibriummodel of demand and industry oligopoly competition to show that seemingly innocuous domesticpolicies can be an effective replacement for traditional trade policies. Our results illustrate thatin an increasingly global economy, governments can effectively construct nontrade nationalpolicies, including environmental regulations, to protect domestic industries when traditionaltrade policies are no longer available. We further showed that both consumers and domesticmanufacturers benefited under these policies, provided any health or environmental externalitiesare negligible.
C© The RAND Corporation 2018.

MIRAVETE, MORAL AND THURK / 531
TABLE A1 Car Model Characteristics Across Segments
1991 MODELS SHARE PRICE SIZE HPW C90 MPG KPE
SMALL 26 39.69 7.88 62.55 3.63 4.68 50.66 34.86COMPACT 31 34.84 10.83 74.28 3.98 5.31 45.02 31.57SEDAN 34 18.88 14.50 80.32 4.40 5.71 41.74 29.69LUXURY 36 6.46 22.94 85.88 4.79 6.44 37.03 25.60MINIVAN 2 0.13 20.88 85.16 3.61 7.11 33.56 24.12
ALL 129 100.00 11.15 71.53 3.97 5.21 46.11 32.13
2000 MODELS SHARE PRICE SIZE HPW C90 MPG KPE
SMALL 49 32.75 10.42 66.36 3.18 4.86 49.11 31.61COMPACT 56 34.43 14.86 76.54 3.59 5.00 48.15 32.53SEDAN 52 25.97 19.45 81.92 3.63 5.26 45.72 31.60LUXURY 40 3.72 34.53 89.72 5.17 6.72 36.46 23.31MINIVAN 32 3.13 20.80 83.47 3.16 6.39 37.89 25.91
ALL 229 100.00 15.52 75.31 3.51 5.13 47.07 31.43
Notes: See definitions in Table 1.
Appendix A
This Appendix presents the different sources of data used in the estimation, discusses transplants and why the sales ofmost Asian vehicles during the 1990s are considered imports despite some being partially built in Europe, and finally, wealso review the engineering estimates of abatement costs of NOx emissions for diesel vehicles.
Data sources. To control for household income distribution, 1000 individuals are sampled each year from the EncuestaContinua de Presupuestos Familiares (Base 1987 for years 1992–1997 and Base 1997 for years 1998–2000) conductedby INE, the Spanish Statistical Agency.37 The outside option varies significantly during the 1990s, due to the importantrecession between 1992 and 1994 and the very fast growth of the economy and population (immigration) in the secondhalf of the decade. We also use these consumer surveys to set the size of the outside option for each year in our sample,which we compute as the total number of households minus the total number of new car registrations. Starting with 1991,the outside market share s0t is: 0.93, 0.92, 0.94, 0.93, 0.93, 0.93, 0.92, 0.91, 0.89, and 0.89, respectively.
Fuel prices were also obtained from INE. We obtained Spanish steel prices, SPI, from the 2001 edition of Iron andSteel Statistics—Data 1991–2000, published by the European Commission (Table 8.1).
For the analysis of demand, we build a data set using prices and vehicle characteristics as reported by La guıa delcomprador de coches, ed. Moredi, Madrid. We select the price and characteristics of the mid-range version of each model,that is, the most popular and commonly sold. Demand estimation also makes use of segment dummies. Other than theLUXURY segment, which also includes sporty cars, our car segments follow the “Euro Car Segment” definition describedin Section IV of “Case No. COMP/M.1406—Hyundai/Kia.” Regulation (EEC) No. 4064/89: Merger Procedure Article6(1)(b) Decision. Brussels, 17 March 1999. CELEX Database Document No. 399M1406. Table A1 presents automobilecharacteristics by market segment.
Until Spain ended its accession to the European Union transition period in 1992, it was allowed to charge importduties on European products. Similarly, import duties for non-European products converged to European levels. Europeanimports paid tax duty of 4.4% in 1992, and nothing thereafter. Non-European manufacturers had to pay 14.4% and10.3%, respectively. Thus, for the estimation of the equilibrium random-coefficient discrete-choice model of Table 2, wedistinguish between prices paid by consumers (p) and those chosen by manufacturers (pw).
The other relevant factor that changes during the 1990s is the ownership structure of automobile firms. Duringthis decade, FIAT acquired ALFA ROMEO and LANCIA; FORD acquired VOLVO; and GM acquired SAAB. BMW acquired ROVER in1994, but sold it in May 2000 (with the exception of the “Mini” brand), so these are treated as separate firms. Table A2describes the ownership structure at the beginning and end of the decade.
Japanese automobile sales in Europe. In our analysis, we treat all Japanese production as imported, even though somemodels were produced in the European Union even before the beginning of our sample. Thus, for instance, Nissanestablished in the United Kingdom in 1984 and Toyota and Honda in 1989. We argue that: (i) Most Japanese vehicles soldin the European automobile market during the 1990s were imported from Japan, (ii) out of those produced in Europe,many were light trucks not included in our sample, and (iii) those produced in Europe could not avoid paying import
37 See www.ine.es/jaxi/menu.do?L=1&type=pcaxis&path=/t25/p458&file=inebase for a description of thesedatabases.
C© The RAND Corporation 2018.

532 / THE RAND JOURNAL OF ECONOMICS
TABLE A2 Automobile Groups: 1992 versus 2000
Year 1992 Year 2000
Firm Gasoline Diesel Owner Gasoline Diesel Owner
ALFA ROMEO 5,038 64 ALFA ROMEO 2,941 3,983 FIAT
AUDI 16,689 1,982 VOLKSWAGEN 15,273 24,184 VOLKSWAGEN
BMW 17,855 1,906 BMW 13,683 15,838 BMW
CHRYSLER 1,243 – 5,941 2,389CITROEN 68,890 36,851 PSA 46,420 111,694 PSA
DAEWOO – – 25,201 –FIAT 35,677 5,733 FIAT 30,557 17,967 FIAT
FORD 121,140 17,468 FORD 55,268 57,013 FORD
HONDA 4,805 – 8,782 1,072HYUNDAI 2,704 – 30,150 3,590KIA – – 9,778 1,387LANCIA 11,117 905 LANCIA 2,206 2,126 FIAT
MAZDA 3,064 – 2,205 1,480MERCEDES 9,352 4,129 MERCEDES 13,953 10,684 MERCEDES
MITSUBISHI 3,041 – 3,660 1,013NISSAN 16,010 905 17,855 21,971OPEL 110,286 11,099 GM 66,488 75,418 GM
PEUGEOT 61,323 35,494 PSA 55,371 92,496 PSA
RENAULT 147,907 27,448 RENAULT 76,925 99,360 RENAULT
ROVER 15,255 425 ROVER 10,173 8,491 ROVER
SAAB 1,551 – SAAB 1,867 2,424 GM
SEAT 85,773 11,787 VOLKSWAGEN 58,072 109,447 VOLKSWAGEN
SKODA 724 – SKODA 5,003 10,385 VOLKSWAGEN
SUZUKI 2,058 – 3,250 486TOYOTA 4,425 – 16,827 3,584VOLKSWAGEN 50,561 5,471 VOLKSWAGEN 47,125 50,296 VOLKSWAGEN
VOLVO 10,179 – VOLVO 7,379 3,566 FORD
Notes: Sales of vehicle by manufacturer and fuel type. “Owner” indicates the name of the automobile group with directcontrol on production and pricing. Those without a group are all non-European manufacturers and defined as NON-EU inthe analysis.
tariffs because local value added was considered too low to qualify as domestic production by European rules until year2000.
During the 1990s, Japanese automakers tried to avoid EU import tariffs through the establishment of factoriesin the United Kingdom and later in partnership with other manufacturers in a strategy known as “Transplant JapaneseProduction.” To avoid import tariffs, Japanese firms had to demonstrate that their models contained a sufficient amountof “local content.” In France, Italy, Portugal, and Spain, this amounted to 80% of value added had to be from Europeansources—a stringent standard set at the request of European automakers.38 In the United Kingdom and Germany,a threshold of 60% was accepted as appropriate. Seidenfuss and Kathawala (2010) document that these demandingrequirements were active until 1999.
Table A3 presents car models manufactured by Toyota, Nissan, Honda, and Mitsubishi, the most important Japanesefirms in Europe at the time, for example, Kato (1997). The United Kingdom was the country where more Japanesepassenger models were produced. As the UK government was less demanding in the application of the “local content”requirement, most of the production was also sold there. Before year 2000, when these models were sold in Spain, theyhad to face the European import tax duty rate—generally 10.3% during the sample.
In any case, the share of Japanese-produced vehicles in Europe is very small. To document it we collectedinformation on European production of those transplant factories for our sample period (1991–2000). Available data forproduction do not distinguish by brand and aggregate passenger cars and light trucks. As some transplant factories operatedon joint venture with European companies, European production of Japanese vehicles is estimated as the differencebetween European registrations, given by ACEA, and Japanese exports to Europe, given by the Japan AutomobileManufacturers Association, JAMA. Table A4 documents the yearly production of Japanese automobiles in Europe during
38 This local content commitment by Japanese firms in the European Union is far higher than corresponding amountin the United States, for example, Hoon Hyun (2008).
C© The RAND Corporation 2018.

MIRAVETE, MORAL AND THURK / 533
TABLE A3 Japanese Models Produced in the European Union
Toyota* Nissan Nissan Honda Mitsubishi**
(UK) (UK) (Spain) (UK) (Netherlands)
Carina (1992–1996) Primera (1992–2000) Patrol (1992–2000) Accord (1992–2000) Carisma (1992–2000)Avensis (1997–2000) Micra (1992–2000) Terrano (1992–2000) Civic (1994–2000) Space Star (1998–2000)Corolla (1997–2000) Almera (1998–2000) Serena (1997–2000)
Almera (1999–2000)Other light vehicles
Notes: (*) Production in France started in 2001; (**) Mitsubishi also produced in Spain, but only manufactured trucksand engines. In Netherlands, Mitsubishi produced in a joint venture with Volvo. Source: Japan Automobile ManufacturesAssociation.
TABLE A4 European Production of Japanese Companies
Exports Registrations ProductionYear (1) (2) (2) – (1)
Production onSales (%)
1991 1,496,263 1,673,575 177,312 10.591992 1,410,488 1,598,169 187,681 11.741993 1,115,491 1,381,085 265,594 19.231994 900,304 1,303,502 403,198 30.931995 782,240 1,287,183 504,943 39.231996 818,644 1,385,880 567,236 40.931997 1,081,482 1,566,067 484,585 30.941998 1,192,802 1,706,119 513,317 30.091999 1,182,269 1,733,618 551,349 31.802000 1,004,224 1,676,311 672,087 40.09
Note: Passenger cars and light vehicles are included. Sources: JAMA and ACEA.
TABLE A5 Estimated Costs to Modify Diesel Vehicles
Typical NOx
Technology Emission Reduction Typical Cost ($)
Lean NOx Catalyst (LNC) 5%–40% $6,500–$10,000Selective Catalytic Reduction (SCR) <75% $10,000–$20,000; Urea $0.80/gallon
Source: US Environmental Protection Agency.
the 1990s, including both passenger cars and light trucks (that we do not include in our analysis). From 1994 to 1999, thetotal transplant Japanese production represented only 34% of total Japanese sales in Europe.
EPA cost estimates for abatement diesel vehicles. The following information was taken from “Diesel Retrofit Devices,”Environmental Protection Agency (www.epa.gov/cleandiesel/technologies/retrofits.htm), last updated January 23, 2013.As described in the text, the abatement technology we consider is the “Lean NOx Catalyst (LNC),” as this technology ismost relevant for limiting NOx emissions in passenger cars. Our inclusion of the remaining technologies recommendedby the EPA shows both the breadth of technologies available to reduce a variety of emissions as well as the variety ofcosts (of which the LNC is near the bottom) required to modify a vehicle.
Diesel retrofit devices for after-treatment pollution control can be installed on new or existing vehicles andequipment to reduce particulate matter (PM), nitrogen oxides (NOx ), hydrocarbons (HC), or carbon monoxide (CO), aswell as other air pollutants. Table A5 and the information below provides estimated emission reductions and their cost.Lean NOx Catalyst (LNC). Lean NOx Catalysts (LNC) use diesel fuel injected into the exhaust stream to create a catalyticreaction and reduce pollution. Verified LNCs are paired with either a DPF (Diesel Particulate Filter) or a DOC (DieselOxidation Catalyst). An LNC can also be paired with an active DPF to reduce NOx emissions and enable filter regenerationover a range of duty cycles. However, an LNC still requires specific exhaust temperatures for appropriate NOx emissioncontrol performance. LNCs can increase fuel usage by 5%–7% (emphasis added).Selective Catalytic Reduction (SCR). Selective Catalytic Reduction (SCR) Systems inject a reductant, also known asdiesel exhaust fluid (DEF), into the exhaust stream, where it reacts with a catalyst to convert NOx emissions to N 2
(nitrogen gas) and oxygen. The process is illustrated in Figure A1. The catalytic reaction requires certain temperature
C© The RAND Corporation 2018.

534 / THE RAND JOURNAL OF ECONOMICS
FIGURE A1
SELECTIVE CATALYTIC REDUCTION (SCR) [Color figure can be viewed at wileyonlinelibrary.com]
Notes: Diagram depicts the typical operation of a SCR system. The DEF sets off a chemical reaction that convertsnitrogen oxide (NOx ) into nitrogen, water, and small amounts of carbon dioxide (CO2) which are then expelled throughthe vehicle tailpipe. Source: www.dieselforum.org.
criteria for NOx reduction to occur. As with DPFs, knowing the age and type of each engine in the fleet as well as the drivecycles of the vehicles is important. Data logging must be performed to determine whether the exhaust gas temperaturesmeet the specific SCR system requirements.
SCR systems require periodic refilling of the DEF by the car owner. SCR systems are commonly used in conjunctionwith a DOC and/or DPF to reduce PM emissions. Because of new NOx standards, most 2010 and newer on-highwaydiesel engines come equipped with an SCR system. A DEF refueling infrastructure is in place, facilitating the use ofSCRs. Inclusion of an SCR system adds weight to the vehicle, thereby decreasing fuel efficiency (MPG), although alsoadding complexity to the diesel engine.
Appendix B
This Appendix describes how we compute the implicit tariff-equivalence of fuel taxation and emissions policy throughcounterfactuals and presents additional estimation results.
Solving for the implicit tariff. In this section, we provide computational details regarding solving for the import tariff-equivalence of the pro-diesel fuel taxation and vehicle emission policies employed European regulators. For simplicity,we describe the process to solve for the import tariff for a given year.
1. We begin by adjusting consumer demand and firm marginal costs according to the policy considered. For instance,when evaluating the joint impact of fuel taxation and vehicle emissions policy where the latter requires a €3300increase in marginal cost for each diesel (i.e., what we call “EPA” in the main text), we decrease fuel economy 22.5%in 2000 to capture both more expensive diesel fuel prices and the reduction in fuel efficiency due to the stricteremissions standard. We also increase the marginal cost of all diesel vehicles €3300. We do not adjust marginal costto reflect changes in fuel efficiency, however.
2. Solve for the pricing equilibrium by solving the system of firm FOCs represented by equation (8). Because thereexists no guarantee that a unique solution satisfies this system of equations, we begin each search from a variety ofdifferent initial guesses. In practice, we found the solution to the system of FOCs was robust to the initial guess. Wethen record the import share at the new equilibrium prices.
3. Solve for the tariff, which drives import share back down to the level observed in the data (e.g., 11.8% in 2000). Thisrequires solving the pricing equilibrium for each potential import tariff.
We constructed the 95% confidence intervals of Figure 10 via bootstrap, where we used the point estimates andstandard errors for the demand and cost parameters (Table 2) to construct a random sample (N=1,000) of demand andcost estimates. To ease computation, we restricted the bootstrap to be over the nonlinear parameters {α,, ν}. For eachbootstrap sample n = 1, . . . , 1000, we begin with a set of parameters drawn from the empirical distributions defined byTable 2. Define θn = {αn, n, νn} as the bootstrap parameters for sample n. We recover the remaining parameters {βn, γn}following the solution method outlined in Section 5.39 Consequently, each bootstrap simulation n generates predictedmarket shares, which match the data by construction.40
39 First solve for the mean utilities δ(θn) such that bootstrap sample n generates predicted shares equal to thoseobserved in the data. We then recover mean utility demand β(θn) and cost γ (θn) parameters via linear projection.
40 One sees this fact in Figure 10, panel (a), where the confidence interval converges to zero as KPE ↓ 0 (i.e., aswe converge to the data equilibrium) and the implicit tariff converges to the official import tariff rate of 10.3%.
C© The RAND Corporation 2018.

MIRAVETE, MORAL AND THURK / 535
For each sample n and year t , we solve for the import tariff-equivalence of the pro-diesel fuel taxation and vehicleemission policies using the approach outlined above and the parameter vector {αn, n, νn, βn, γn}. The final product is alarge set of implicit import tariffs, which vary not only by fuel economy (KPE) and diesel marginal costs (“None” versus“EPA”), but also by {αn, n, νn, βn, γn}. We construct the 95% confidence interval for each year as the range between the2.5% and 97.5% quartiles, that is, the middle 95%.
Additional results.
C© The RAND Corporation 2018.

536 / THE RAND JOURNAL OF ECONOMICS
TA
BL
EB
1E
stim
ated
Pri
ceE
last
icit
ies
(Sel
ect
Mod
els)
IDr
Ow
ner
Nam
eID
j10
402
1110
612
001
1240
412
703
2040
220
507
2170
422
103
2270
1
Chr
ysle
rV
OY
AG
ER
—G
as10
402
−3.7
104
0.02
100.
0073
0.00
390.
0093
0.00
350.
0009
0.00
250.
0006
0.00
03H
yund
aiH
.CO
UP
E—
Gas
1110
60.
0335
−3.0
040
0.02
580.
0173
0.05
360.
0023
0.00
170.
0054
0.00
240.
0010
Ope
lA
ST
RA
—G
as12
001
0.07
480.
0965
−2.4
965
0.09
190.
0839
0.01
070.
0069
0.01
410.
0108
0.00
91R
enau
ltC
LIO
—G
as12
404
0.03
890.
0602
0.09
90−2
.173
00.
0711
0.00
630.
0063
0.01
040.
0111
0.01
33S
eat
TO
LE
DO
—G
as12
703
0.04
270.
0414
0.04
170.
0328
−2.8
423
0.00
530.
0011
0.00
940.
0041
0.00
45C
hrys
ler
VO
YA
GE
R—
Die
sel
2040
20.
0042
0.00
170.
0014
0.00
090.
0015
−3.5
015
0.01
770.
0218
0.01
200.
0076
Cit
roen
XS
AR
A—
Die
sel
2050
70.
0087
0.00
850.
0125
0.01
250.
0080
0.13
65−2
.594
10.
0460
0.12
920.
1365
Mer
cede
sE
SE
RIE
300—
Die
sel
2170
40.
0067
0.00
620.
0035
0.00
220.
0051
0.04
610.
0107
−4.4
973
0.02
000.
0135
Peug
eot
306—
Die
sel
2210
30.
0051
0.00
990.
0097
0.01
100.
0098
0.09
020.
1029
0.07
30−2
.588
20.
1398
Sea
tIB
IZA
—D
iese
l22
701
0.00
150.
0040
0.00
460.
0064
0.00
330.
0331
0.09
940.
0191
0.08
64−2
.196
6
Not
es:T
able
pres
ents
aver
age
pric
eel
asti
citi
esfo
rse
lect
bran
ds.T
hesa
mpl
eco
rres
pond
sto
the
best
sell
ing
mod
elin
each
segm
ent,
engi
ne-t
ype
pair
.
C© The RAND Corporation 2018.

MIRAVETE, MORAL AND THURK / 537
FIGURE B1
ESTIMATED BRAND FIXED EFFECTS [Color figure can be viewed at wileyonlinelibrary.com]
-20%
-15%
-10%
-5%
0%
5%
10%
15%
20%
BMW
Mer
cede
s
Audi
Kia
Hond
a
Seat
Daew
oo
Peug
eut
Toyo
ta
Ope
l
Mits
ubish
i
Volk
swag
en
Chry
sler
Niss
an
Maz
da
Ford
Skod
a
Saab
Alfa
Rom
eo
Rove
r
Hyun
dai
Fiat
Suzu
ki
Citr
oen
Lanc
ia
Volv
o
(a) Consumer demand
-25%
-20%
-15%
-10%
-5%
0%
5%
10%
15%
20%
25%
BMW
Mer
cede
s
Audi
Kia
Hond
a
Seat
Daew
oo
Peug
eut
Toyo
ta
Ope
l
Mits
ubish
i
Volk
swag
en
Chry
sler
Niss
an
Maz
da
Ford
Skod
a
Saab
Alfa
Rom
eo
Rove
r
Hyun
dai
Fiat
Suzu
ki
Citr
oen
Lanc
ia
Volv
o
(b) Marginal cost
Notes: Figure presents estimated brand fixed effect in demand (panel a) and production (panel b). Results are presentedas percent deviations of the point estimate from the reference category, RENAULT.
C© The RAND Corporation 2018.

538 / THE RAND JOURNAL OF ECONOMICS
TABLE B2 Estimated Best Substitutes (Select Products)
Best Substitute
Owner Name Segment Owner Name Segment Elasticity
Ford ESCORT—Diesel Compact Seat MALAGA—Diesel Compact 0.2366Peugeot 306—Diesel Compact Rover SERIE 100—Diesel Small 0.1810Renault MEGANE—Diesel Compact Hyundai LANTRA—Diesel Compact 0.2194Ford ESCORT—Gas Compact Rover MONTEGO—Gas Luxury 0.1456Opel ASTRA—Gas Compact Suzuki SWIFT—Gas Small 0.1328Renault MEGANE—Gas Compact Rover 25—Gas Compact 0.1896Audi A6—Diesel Luxury Opel SINTRA—Diesel Minivan 0.1295BMW SERIE 5—Diesel Luxury Mercedes S Serie 4—Diesel Luxury 0.2866Mercedes E SERIE 300—Diesel Luxury Opel SINTRA—Diesel Minivan 0.3805Audi 100—Gas Luxury Renault 25—Gas Luxury 0.0653BMW SERIE 5—Gas Luxury Mercedes S SERIE 500—Gas Luxury 0.1788Hyundai H.COUPE—Gas Luxury Nissan 200 SX—Gas Luxury 0.0843Chrysler VOYAGER—Diesel Minivan Mazda MPV—Diesel Minivan 0.0715Opel ZAFIRA—Diesel Minivan Hyundai H-1—Diesel Minivan 0.0441Renault ESPACE—Diesel Minivan Hyundai H-1—Diesel Minivan 0.0336Chrysler VOYAGER—Gas Minivan Chrysler 300M—Gas Luxury 0.0467Mercedes SerieA—Gas Minivan Daewoo TACUMA—Gas Minivan 0.0097Opel ZAFIRA—Gas Minivan Hyundai H-1—Gas Minivan 0.0399Citroen XANTIA—Diesel Sedan Hyundai H-1—Diesel Minivan 0.1789Citroen XSARA—Diesel Sedan Hyundai H-1—Diesel Minivan 0.2503Seat TOLEDO—Diesel Sedan Ford FOCUS—Diesel Compact 0.0895Ford MONDEO—Gas Sedan Rover MONTEGO—Gas Luxury 0.1033Opel VECTRA—Gas Sedan Chrysler VISION—Gas Luxury 0.1018Seat TOLEDO—Gas Sedan VW JETTA—Gas Compact 0.0909Peugeot 205—Diesel Small Citroen AX—Diesel Small 0.1589Renault CLIO—Diesel Small Seat AROSA—Diesel Small 0.1200Seat IBIZA—Diesel Small Seat AROSA—Diesel Small 0.1889Opel CORSA—Gas Small Seat MARBELLA—Gas Small 0.1031Renault CLIO—Gas Small Suzuki SWIFT—Gas Small 0.1582Seat IBIZA—Gas Small Skoda FORMAN—Gas Small 0.1271
Notes: Table presents the best substitute for select products. We define the best substitute as the product with thegreatest average estimated cross-price elasticity. Sample of products correspond to the three most popular products ineach segment, engine-type pair. Entries sorted according to segment, engine-type, and finally, owner.
TABLE B3 Implicit Tariff By Year Across Policies
NONE EPA
YEAR DATA FUEL TAX EMISSIONS BOTH EMISSIONS BOTH
1991 18.80 21.72 20.02 22.31 21.38 23.221992 14.40 18.27 16.03 19.03 17.69 20.011993 10.30 14.96 12.20 15.88 14.09 17.121994 10.30 16.11 12.58 17.25 14.60 18.541995 10.30 17.67 13.03 19.06 15.60 20.551996 10.30 16.64 12.71 18.09 15.12 19.861997 10.30 18.07 13.22 19.94 15.94 22.031998 10.30 18.94 13.38 20.90 15.92 22.811999 10.30 21.69 14.34 24.45 17.91 27.362000 10.30 19.65 14.10 22.47 17.81 25.28
Notes: “Data” is the current import tariff on foreign imports. “Fuel Tax” corresponds to the implicit import tariff forthe observed fuel excise taxes (i.e., “Equalize” in the main text). “Emissions” corresponds to the implicit tariff for theobserved emissions policy under the assumption that the stricter NOx policy requires a €3300 increase in marginal cost(“EPA”) and a 6.8% reduction in fuel efficiency for all diesels. “Both” corresponds to the implicit tariff when both policiesare enforced simultaneously.
C© The RAND Corporation 2018.

MIRAVETE, MORAL AND THURK / 539
FIGURE B2
WHICH FIRMS BENEFIT FROM THE PRO-DIESEL POLICIES?
-3.9-4.8
-11.3
-13.0 -12.7
-16.5
-20
-15
-10
-5
0
5
Per
cent
cha
nge
from
Dat
a
1991 1995 2000
None EPA
(a) European firm profits (Fuel tax + Emissions)
12.8
6.44.4
32.9
18.915.7
53.7
42.7
37.5
0
10
20
30
40
50
60
Die
sel m
arke
t sha
re
1991 1995 2000
Data None EPA
(b) Diesel market share (Fuel tax + Emissions)
3.1 3.3 3.4
7.3
8.4 8.6
11.8
13.714.3
0123456789
10111213141516
Impo
rt sh
are
1991 1995 2000
Data None EPA
(c) Import share (Fuel tax + Emissions)
Notes: Panel (a) presents change in total profit for European firms when fuel taxes are harmonized and regulatorsimpose the stricter NOx emissions standards. Panel (b) compares diesel market share across policies. Panel (c) presentstotal import share across time under the different policies. “Data” corresponds to the import share observed in the data.
References
BAGWELL, K. AND STAIGER, R.W. “Domestic Policies, National Sovereignty and International Economics Institutions.”Quarterly Journal of Economics, Vol. 116 (2001), pp. 519–562.
BALCER, Y. AND LIPPMAN, S.A. “Technological Expectations and Adoption of Improved Technology.” Journal of EconomicTheory, Vol. 34 (1984), pp. 292–318.
BERGSTRAND, J., LARCH, M., AND YOTOV, Y. “Economic Integration Agreements, Border Effects, and Distance Elasticitiesin the Gravity Equation.” European Economic Review, Vol. 78 (2015), pp. 307–327.
BERRY, S. “Estimating Discrete-Choice Models of Product Differentiation.” RAND Journal of Economics, Vol. 25 (1994),pp. 242–262.
BERRY, S., LEVINSOHN, J., AND PAKES, A. “Automobile Prices in Market Equilibrium.” Econometrica, Vol. 63 (1995),pp. 841–890.
———. “Voluntary Export Restraints on Automobiles: Evaluating Strategic Trade Policy.” American Economic Review,Vol. 89 (1999), pp. 400–430.
BHAGWATI, J. AND RAMASWAMI, V.K. “Domestic Distortions, Tariffs, and the Theory of Optimum Subsidy.” Journal ofPolitical Economy, Vol. 71 (1963), pp. 44–50.
BRESNAHAN, T.F., STERN, S., AND TRAJTENBERG, M. “Market Segmentation and the Sources of Rents fromInnovation: Personal Computers in the Late 1980s.” RAND Journal of Economics, Vol. 28 (1997),pp. S17–S44.
BUSSER, R. AND SADOI, Y. “Japanese Automobile Makers in Europe and the Organization of the Supply System.” InR. Busser and Y. Sadoi, eds., Production Networks in Asia and Europe: Skill Formation and Technology Transferin the Automobile Industry. New York, NY: Taylor & Francis, 2004.
CANIS, B. “Why Some Fuel-Efficient Vehicles Are Not Sold Domestically.” Report to Congress, Congressional ResearchService, 2012.
C© The RAND Corporation 2018.

540 / THE RAND JOURNAL OF ECONOMICS
CHAMBERLAIN, G. “Asymptotic Efficiency in Estimation with Conditional Moment Restrictions.” Journal of Econometrics,Vol. 34 (1987), pp. 305–334.
DAGSVIK, J.K. AND KARLSTROM, A. “Compensating Variation and Hicksian Choice Probabilities in Random Utility Modelsthat Are Nonlinear in Income.” The Review of Economic Studies, Vol. 72 (2005), pp. 57–76.
DUBE, J.-P., FOX, J.T., AND SU, C.-L. “Improving the Numerical Performance of Static and Dynamic Aggregate DiscreteChoice Random Coefficients Demand Estimation.” Econometrica, Vol. 80 (2012), pp. 2231–2267.
EDERINGTON, J. “International Coordination of Trade and Domestic Policies.” American Economic Review, Vol. 91 (2001),pp. 1580–1593.
FEENSTRA, R.C. “Quality Change under Trade Restraints in Japanese Autos.” Quarterly Journal of Economics, Vol. 103(1988), pp. 131–146.
GANDHI, A. AND HOUDE, J.-F. “Measuring Substitution Patterns in Differentiated Products Industries.” Mimeo, Universityof Wisconsin-Madison, 2015.
GAVAZZA, A., LIZZERI, A., AND ROKETSKIY, N. “A Quantitative Analysis of the Used-Car Market.” American EconomicReview, Vol. 104 (2014), pp. 3668–3700.
GOLDBERG, P.K. “Effects of the Corporate Average Fuel Efficiency Standards in the U.S.” Journal of Industrial Economics,Vol. 46 (1998), pp. 1–33.
GOLDBERG, P.K. AND VERBOVEN, F. “The Evolution of Price Dispersion in the European Car Market.” Review of EconomicStudies, Vol. 68 (2001), pp. 811–848.
———. “Market Integration and Convergence to the Law of One Price: Evidence from the European Car Market.”Journal of International Economics, Vol. 65 (2005), pp. 49–73.
GRIGOLON, L., REYNAERT, M., AND VERBOVEN, F. “Consumer Valuation of Fuel Costs and the Effectiveness of TaxPolicy: Evidence from the European Car Market.” American Economic Journal: Economic Policy, (forthcoming,2017).
GRIGOLON, L. AND VERBOVEN, F. “Nested Logit or Random Coefficients Logit? A Comparison of Alternative Dis-crete Choice Models of Product Differentiation.” Review of Economics and Statistics, Vol. 66 (2014), pp. 916–935.
Hoon HYUN, J. “A Comparative Analysis of Transplants and Industrial Location of Japanese and Korean AutomotiveIndustries in Europe.” International Journal of Business, Vol. 13 (2008), pp. 215–235.
ITO, K. AND SALLEE, J.M. “The Economics of Attribute-Based Regulation: Theory and Evidence from Fuel-EconomyStandards.” The Review of Economics and Statistics, Vol. 100 (2018), pp.319–336.
JACOBSEN, M.R. “Evaluating U.S. Fuel Economy Standards in a Model with Producer and Household Heterogeneity.”American Economic Journal: Economic Policy, Vol. 5 (2013), pp. 1–26.
KATO, M. “Japanese Automakers Struggle in Europe.” Working Paper, NLI Research Institute, 1997.KNITTEL, C.R. AND METAXOGLOU, K. “Estimation of Random Coefficient Demand Models: Two Empiricists’ Perspective.”
Review of Economics and Statistics, Vol. 96 (2014), pp. 34–59.MANUELLI, R. AND SESHADRI, A. “Frictionless Technology Diffusion: The Case of Tractors.” American Economic Review,
Vol. 104 (2014), pp. 1368–1391.MORAL, M.J. AND JAUMANDREU, J. “Automobile Demand, Model Cycle and Age Effects.” Spanish Economic Review, Vol.
9 (2007), pp. 193–218.NEVO, A. “Mergers with Differentiated Products: The Case of the Ready-to-Eat Cereal Industry.” RAND Journal of
Economics, Vol. 31 (2000), pp. 395–421.OECD. “Looking Beyond Tariffs: The Role of Non-Tariff Barriers in World Trade.” 2005.REYNAERT, M. AND VERBOVEN, F. “Improving the Performance of Random Coeffcients Demand Models: The Role of
Optimal Instruments.” Journal of Econometrics, Vol. 179 (2014), pp. 83–98.SCHIRALDI, P. “Automobile Replacement: A Dynamic Structural Approach.” RAND Journal of Economics, Vol. 42 (2011),
pp. 266–291.SCHUMPETER, J.A. Capitalism, Socialism, and Democracy. New York, NY: Harper & Row, 3rd edition, 1950.SEIDENFUSS, K.-U. AND KATHAWALA, Y. “Voluntary Export Restraint (VER) without Market Restraints? The Case Study
of the Monitoring Agreement (1991–1999) between the Japanese Car Manufacturers and the European Union.”European Business Review, Vol. 17 (2010), pp. 217–231.
STAIGER, R.W. “A Theory of Gradual Trade Liberalization.” In A.V. Deardorff, J.A. Levinsohn, and R.M. Stern, eds., NewDirections in Trade Theory. Ann Arbor, MI: The University of Michigan Press, 1995.
STEWART, S.J. “Collection of PM Emission Data from In-Use Light-Duty Diesel and Gasoline Vehicles.” Technical Report,British Columbia Clean Air Research Fund Final Report, Pacific Vehicle Testing Technology, Ltd., 2010.
SWEETING, A. “Dynamic Product Positioning in Differentiated Product Markets: The Effect of Fees for Musical Perfor-mance Rights on the Commercial Radio Industry.” Econometrica, Vol. 81 (2013), pp. 1763–1803.
THURK, J. “Sincerest Form of Flattery? Business Stealing in the Imitation of Differentiated Goods.” Mimeo, Universityof Notre Dame, 2017.
VERBOVEN, F. “Quality-Based Price Discrimination and Tax Incidence: Evidence from Gasoline and Diesel Cars.” RANDJournal of Economics, Vol. 33 (2002), pp. 275–297.
C© The RAND Corporation 2018.