fuel consumption and additive efficiency on a tug · pdf filefuel consumption and additive...
TRANSCRIPT

Fuel consumption and
additive efficiency on a tug vessel
Presented by:Guy Hamel –OCEAN Charles Massicotte–OpDAQSystems

Presentation of OCEAN
Presentation of OpDAQ
Purpose of monitoring
Facts and circumstances
Test results

Ocean offers a wide range of complementary services in three (3) main areas of activity.
The company owns the most important fleet of marine equipment in Eastern Canada.
Marine works and dredging Towing and navigation
32 tugs + 1 under construction
7 pilot boats
1 integrated tug-and-barge
Naval construction and repair
2 shipyards
2 multi-functional workshops
Engineering team
Ocean Services
Over 500 barges
30 workboats
1 trailing suction hopper dredge

Ocean business locations
Head office located in
the Port of Québec
Shipyards at
l’Isle-aux-Coudres
and Bas-Caraquet

Harbour operation and pilot transfer
Ocean performs over 19,000
operations per year

Ocean Navigation
Ocean offers tug-barge transportation suitable
for all types of oversized/overweight cargo.

| Data Acquisition
| Optimization / Operation

OUR MISSON
To measure ship performance using
high precision tools, innovative approaches
and rigorous methods

EXPERTISE
Fuel Consumption Measurement for Diesel Engines
Shaft Torque/Power Measurement
Fuel Efficiency Monitoring
APPLICATIONS
Technology Evaluation
Vessel Performance Assessment
Best Practices Implementations
Remote Monitoring

MARINE SECTOR EXPERIENCE
Commercial vessels Shipyards Coast Guard (USCG & CCG)
OTHER SECTORS
Remote diesel power plant General industrial sector

Achievements

Diminish our ecological footprint
by decreasing our fuel consumption
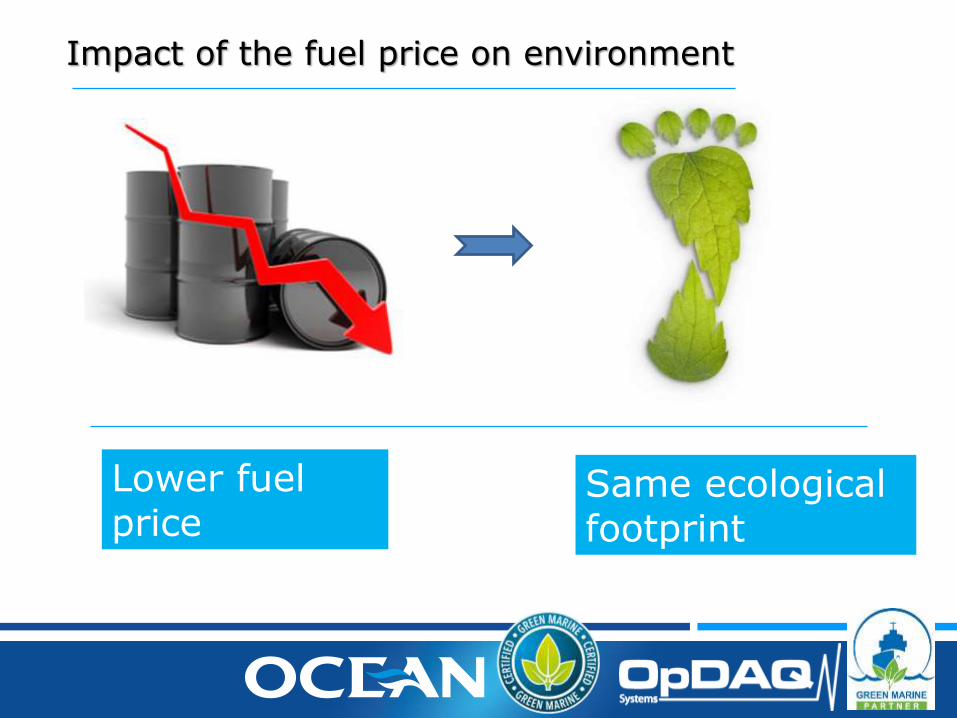
Lower fuel price
Same ecological footprint
Impact of the fuel price on environment

1. Have the best maintenance practice
2. Reduce tugboat transit speed
3. Renew the fleet
4. Improved engine efficiency
What Ocean has done so far
Ocean implemented a preventive maintenance software and counts on the very best in-house mechanics
Ocean installed speed monitoring system
Ocean renewed 50% of its tug fleet over the last 10 years
Ocean raised the cetane number in its fuel

How to get a better combustion?

LOWERCETANE NUMBER
Why increase the cetane number?
=

What is the cetane number?
The shorter the ignition delay, the better the combustion

International minimum cetane number
CANADA
40Environment Canada
CALIFORNIA
48California Air
Ressources Board
EUROPEAN UNION
51European Standards
Organization

Cetane number vs NOx reduction
Natural cetane = 40
Natural cetane = 45
Natural cetane = 50

Our tests
Four (4) different products were tested
Three (3) cetane boosters
One (1) oxygen booster
The results show that one of the cetane boosters was more efficient than the others for our operations.
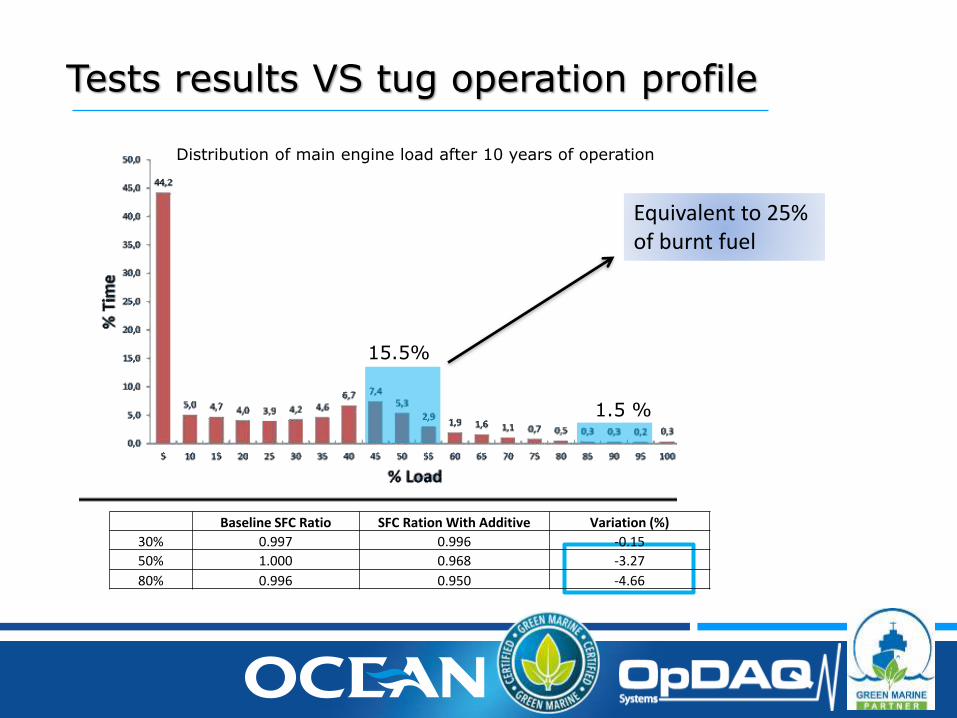
15.5%
1.5 %
Distribution of main engine load after 10 years of operation
Tests results VS tug operation profile
Equivalent to 25% of burnt fuel
Baseline SFC Ratio SFC Ration With Additive Variation (%)
30% 0.997 0.996 -0.15
50% 1.000 0.968 -3.27
80% 0.996 0.950 -4.66

4.6% of fuel economy
NOx REDUCTION
Tests results

Higher fuel priceSmaller ecologicalfootprint
Impact of the fuel price on environment

Ocean continuously invests in research and
development to find innovative ways to
reduce its environmental impact .

None of this would be possible without our partners!


Fuel Additive Evaluation
Trial Methodology
Results

Fuel Additive Evaluation
Goal:
To Evaluate the Engine Performance Improvement Related to the Use of a Fuel Additive

Performance Evaluation Parameter

Error Sources
1. Instrument error
2. Variations in fuel quality
3. Environmental factors

Error Sources – Measurement Error
Fuel ConsumptionPositive displacement flowmeters
Accuracy 0.1% single line
Shaft PowerStrain gage based torquemeters
Accuracy: 0.1%
System Accuracy: 0.44%

Required accuracy
Hypothesis:
Fuel additive has a potential of 5-10% impact on the fuel efficiency of diesel engines.

Error Sources – Variations in Fuel Quality
2 identical engines with 2 separate fuel tanks
- Port Engine: Treated with additive- Stbd Engine: Untreated, used as reference

Error Sources – Environmental factors
Wind, wavesBollard pull
CurrentsPower measurement compensates for slow fluctuations
TemperatureTrials performed in similar conditions
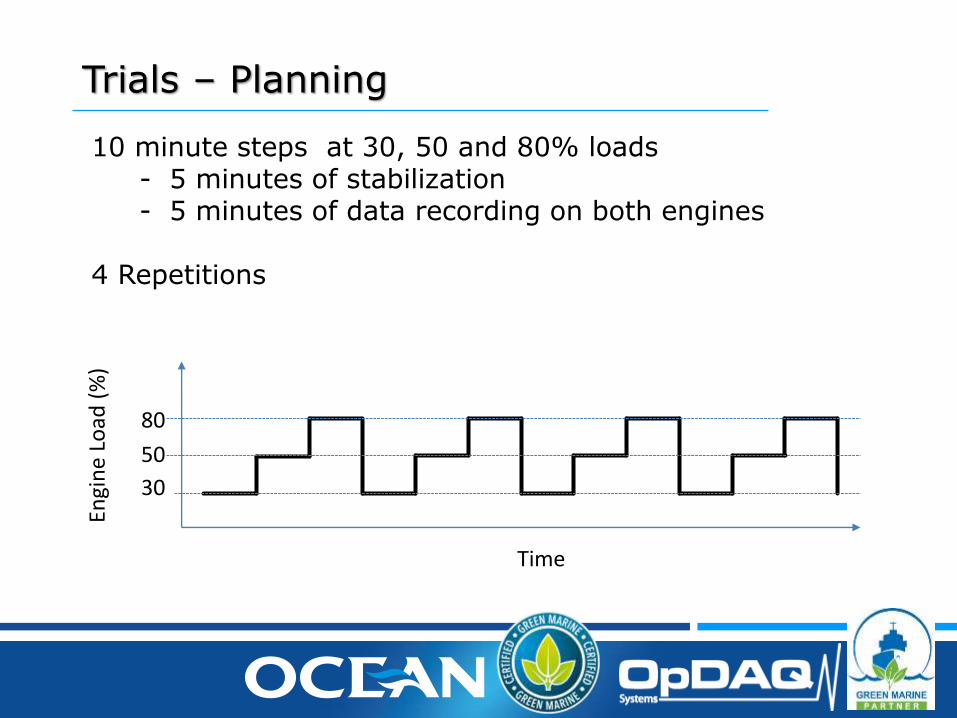
Trials – Planning
10 minute steps at 30, 50 and 80% loads- 5 minutes of stabilization- 5 minutes of data recording on both engines
4 Repetitions
Time
Engi
ne
Load
(%
)
80
50
30
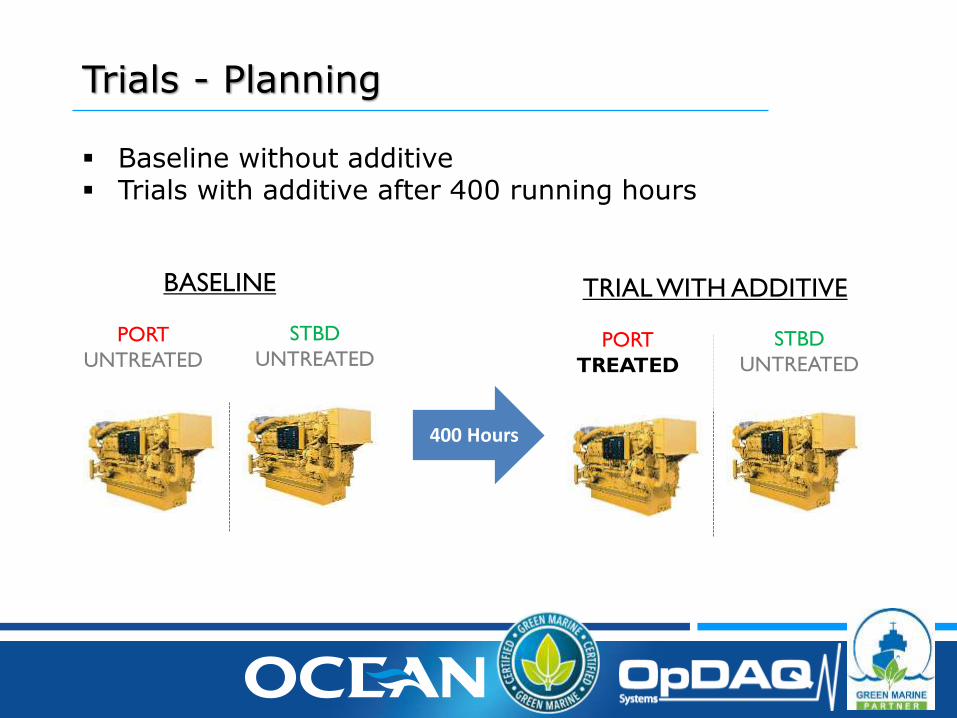
Trials - Planning
Baseline without additive Trials with additive after 400 running hours
PORT
UNTREATED
STBD
UNTREATED
BASELINE
PORT
TREATED
STBD
UNTREATED
TRIAL WITH ADDITIVE
400 Hours

Trials - Installation
SYSTEM INSTALLATION
4x Flow meters
2x Torque meters
Strain gauge installation
Calibration
Cable running
Monitoring System Setup

Trials
12 steps of 10 minutes as planned

Trials – Analysis
1. Calculate 5 minutes SFC averages for all steps
2. Calculate Treated/Untreated ratio
3. Compare final results to baseline

Results - Baseline
Engine Load (%) Port Engine (g/kWh) Stbd Engine (g/kWh) Ratio
30 237.3 237.9 0.997
50 214.2 214.3 1.000
80 212.4 213.4 0.996

Results – With Additive
Engine Load (%) Baseline SFC Ratio Ratio with additive Variation (%)
30 0.997 0.996 ---
50 1.000 0.968 -3.27
80 0.996 0.950 -4.66

Culture of Innovation
NEW TECHNOLOGY MONITORING
ANALYSIS IMPROVEMENT