fuel constrained bidding€¦ · a cost curve reflecting total energy capability in the timeframe...
TRANSCRIPT

© 2000 - 2015 New York Independent System Operator, Inc. All Rights Reserved.
Fuel Constrained Bidding
Cristy Sanada,
Associate Market Design Specialist, Energy Market Design
New York Independent System Operator
MIWG March 23, 2016
Krey Corporate Center

2 © 2000 - 2015 New York Independent System Operator, Inc. All Rights Reserved.
Purpose of today’s discussion
The purpose of today’s discussion is to:
Review bidding designs and design functionalities
Review timelines for implementation
Review Fuel Cost and Efficiency Curve research outcomes
Review Limited Energy and Level Schedule Bidding
Next steps

3 © 2000 - 2015 New York Independent System Operator, Inc. All Rights Reserved.
Terminology
Total Energy Curve Qualified Resource (TEC
Resource) – a single resource registered with
NYISO to use the Total Energy Curve Bidding
functionality
Total Energy Curve Group (TEC Group) = portfolio
of resources (multiple PTID) bidding a shared
Total Energy Curve

4 © 2000 - 2015 New York Independent System Operator, Inc. All Rights Reserved.
Fuel Constrained Bidding Designs
and Sub-functionalities
Designs:
Total Energy Curve (BIC Approved)
Fuel Cost and Efficiency Curve
Sub-functionalities:
Limited Energy Bidding – can be used with both designs
above
Level Schedule Request – could be used with or without
both designs above
All functionalities described above apply to DAM bidding only, are
optional, and available year-round

5 © 2000 - 2015 New York Independent System Operator, Inc. All Rights Reserved.
Review of Market Rules from 2/23 MIWG
NYISO must approve TEC resources and groups
Resources in TEC groups must belong to the same bidding and billing entity
A single resource can be a part of only one approved TEC entity in a single electric day
NYC resources can only be grouped with other NYC resources; if in NYC the resources must exist within the same load pockets and sub load pockets
Under the TEC design, no single, or combination of cost offers shall exceed the energy offer cap or be below the negative offer cap
Bid validation will ensure that the TEC reflects the total available capability reflected in hourly bids*
Base DAM bids (no adders) will be converted to RT bids – MPs will be responsible for updating RT bids
BPCG and DAMAP will be netted over constraint hours/resources under the constraint BPCG and DAMAP for reliability-committed resources will be calculated
independently with TEC costs prorated over reliability MWs in a methodology to be discussed at a later MIWG
Example calculations and formula revisions to be discussed at a later MIWG
*Note: We will discuss Limited Energy Bidding in subsequent slides where this would not apply

6 © 2000 - 2015 New York Independent System Operator, Inc. All Rights Reserved.
Total Energy Curve
(BIC Approved Design; MWh Constraint)

7 © 2000 - 2015 New York Independent System Operator, Inc. All Rights Reserved.
Total Energy Curve Design
This design would allow the MP to submit for the
electric day or subset of hours in the electric day: Hourly three-part bids for a TEC resource or TEC Group
A cost curve reflecting total energy capability in the timeframe
(MWh) and cost to produce those MWhs ($/MWh) for the TEC
resource or TEC Group

8 © 2000 - 2015 New York Independent System Operator, Inc. All Rights Reserved.
Total Energy Curve Bids MWh 1 $/MWh 1 MWh 2 $/MWh 2 MWh 3 $/MWh 3
5,000 $0 8,000 $25 10,000 $75
Note: Existing bid features will not change. Hourly three-part bids for each generator are still
submitted in conjunction with this offer
Total Energy Curve Example

9 © 2000 - 2015 New York Independent System Operator, Inc. All Rights Reserved.
Total Energy Curve Development
Timeline
The NYISO expects that implementation of this design could be achieved by 2019 at the earliest This design requires extensive bid to bill impacts detailed on the following slide
A large share of resources necessary for this implementation, especially in 2018, will be dedicated to the EMS/BMS upgrade project
The NYISO estimates following timeline until implementation for this design:
The NYISO also anticipates the Total Energy Curve design (MWh constraint) will be leveraged to implement a storage optimization bidding design to be addressed through the Energy Storage Optimization project
Target Date Estimated Time to Complete Activity
December 2016 9 months Tariff and Functional Requirements
April 2017 4 months FERC Filing
October 2017 6 months Draft Use Cases
Spring 2019 10 - 16 months Development
Fall 2019 - Winter 2019 6 - 10 months Testing/Deployment

10 © 2000 - 2015 New York Independent System Operator, Inc. All Rights Reserved.
Total Energy Curve Development
Timeline
Initial list of system and interface changes associated with
implementation of this design
Description of Changes Details
New bid screens
· Bidding interface for select TEC resource or TEC
group
· Funtionality to specify constraint hours and
associated price-quantity pairs
Additional bid validations
· Resource can belong to only one TEC entity in
the market day
· Offer cap validations
· Hourly Offers v. capability reflected on TEC
New tables for mapping TEC Resources and TEC Groups to generators
New tools for users to administer mappings of TEC Resources and TEC Groups to
generators
New tables for TEC offers
Revised MIS conduct testing (data fed to SCUC and Billing software for automated
mitigation processes)Additional conduct test for the TEC
Revised reliability committed unit mitigation processes
Revised logic to pull MIS bids into OISR
Logic revision to account for TEC offers in objective function
Revised Automated Mitigation logic
New multi-hour, multi-unit references for each TEC resource or groupA single TEC reference for each TEC resource or
group
Revise BPCG/DAMAP eligibility coding
Revise BPCG/DAMAP calculation coding
Additonal logic to account for reliability committed resource make-whole payments
Revise automated guarantee payment mitigation coding
New displays for multi-unit/multi-hour settlement components
New masked bid report structure to accomodate TEC offers

11 © 2000 - 2015 New York Independent System Operator, Inc. All Rights Reserved.
Fuel Cost and Efficiency Curve

12 © 2000 - 2015 New York Independent System Operator, Inc. All Rights Reserved.
NYISO committed to researching this design further at BIC
This design would break down cost components of hourly
offers that vary with resource heat rate and fuel burn into
separate offers
The optimization would select the least cost solution by
evaluating the interaction of costs and resource efficiencies at
different operating points for a single resource or group of
resources
Fuel Cost and Efficiency Curve Design
13 © 2000 - 2015 New York Independent System Operator, Inc. All Rights Reserved.
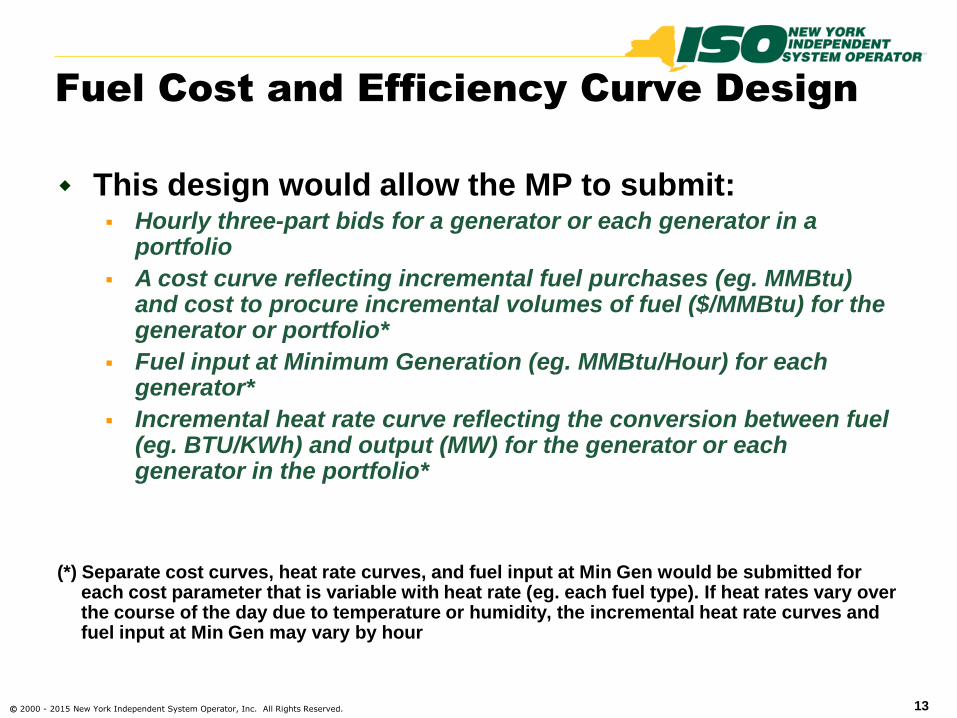
This design would allow the MP to submit: Hourly three-part bids for a generator or each generator in a
portfolio
A cost curve reflecting incremental fuel purchases (eg. MMBtu) and cost to procure incremental volumes of fuel ($/MMBtu) for the generator or portfolio*
Fuel input at Minimum Generation (eg. MMBtu/Hour) for each generator*
Incremental heat rate curve reflecting the conversion between fuel (eg. BTU/KWh) and output (MW) for the generator or each generator in the portfolio*
(*) Separate cost curves, heat rate curves, and fuel input at Min Gen would be submitted for each cost parameter that is variable with heat rate (eg. each fuel type). If heat rates vary over the course of the day due to temperature or humidity, the incremental heat rate curves and fuel input at Min Gen may vary by hour
Fuel Cost and Efficiency Curve Design
14 © 2000 - 2015 New York Independent System Operator, Inc. All Rights Reserved.
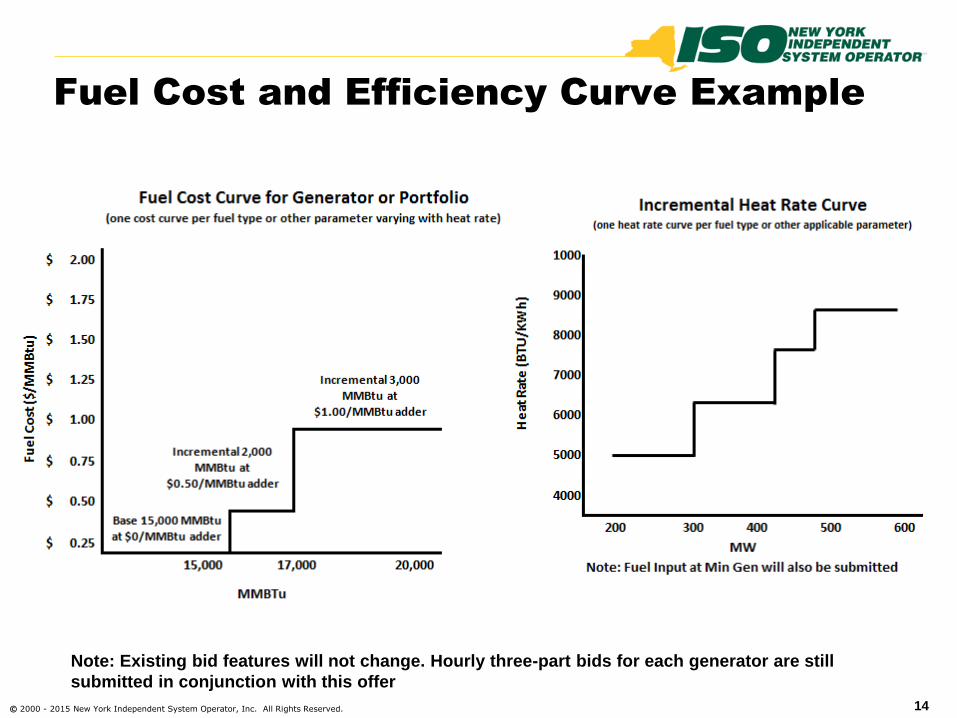
Fuel Cost and Efficiency Curve Example
Note: Existing bid features will not change. Hourly three-part bids for each generator are still
submitted in conjunction with this offer
15 © 2000 - 2015 New York Independent System Operator, Inc. All Rights Reserved.
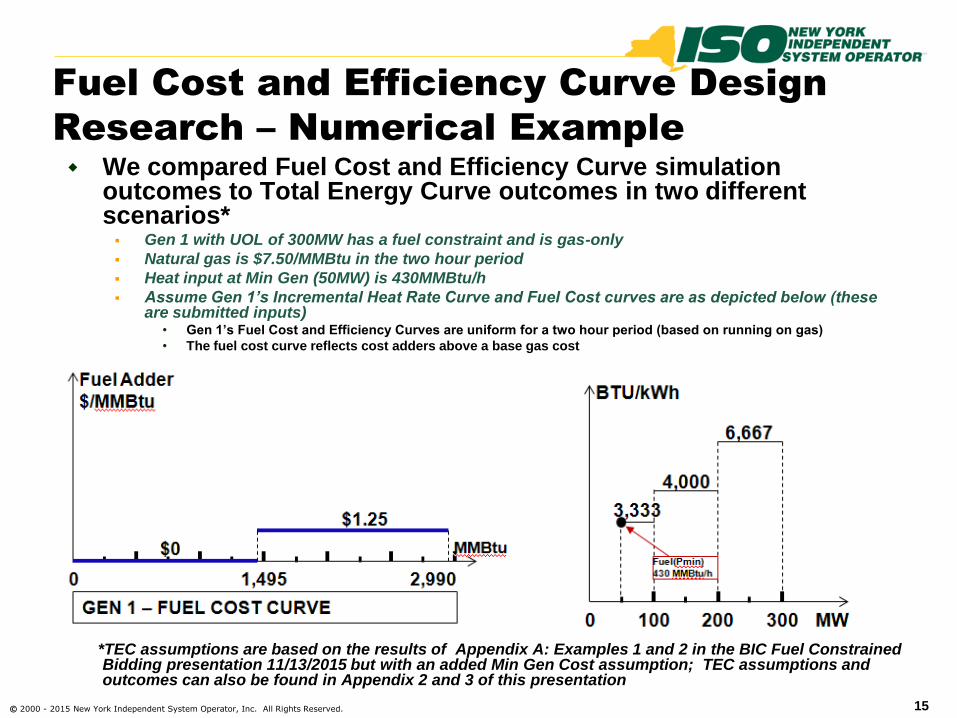
We compared Fuel Cost and Efficiency Curve simulation outcomes to Total Energy Curve outcomes in two different scenarios* Gen 1 with UOL of 300MW has a fuel constraint and is gas-only
Natural gas is $7.50/MMBtu in the two hour period
Heat input at Min Gen (50MW) is 430MMBtu/h
Assume Gen 1’s Incremental Heat Rate Curve and Fuel Cost curves are as depicted below (these are submitted inputs)
• Gen 1’s Fuel Cost and Efficiency Curves are uniform for a two hour period (based on running on gas)
• The fuel cost curve reflects cost adders above a base gas cost
*TEC assumptions are based on the results of Appendix A: Examples 1 and 2 in the BIC Fuel Constrained
Bidding presentation 11/13/2015 but with an added Min Gen Cost assumption; TEC assumptions and outcomes can also be found in Appendix 2 and 3 of this presentation
Fuel Cost and Efficiency Curve Design
Research – Numerical Example

16 © 2000 - 2015 New York Independent System Operator, Inc. All Rights Reserved.
Based on the resource’s incremental heat rate offer and calculated efficiency
at different operating points, we can construct what a Total Energy Curve
would look like subject to different operating efficiencies (detailed
conversions are in Appendix 1):
Different efficiency assumptions may translate to different breakpoints and
costs reflected on the TEC
Fuel Cost and Efficiency Curve Design
Research – comparison to TEC
MMBTU1 MMBTU2 $/MMBTU2
GEN1 1,495 2,990 $ 1.25 First breakpoint on TEC is ca lculated as MMBTU1/(Avg Heat Rate/1000)
Second breakpoint on TEC is ca lculated as MMBTU2/(Avg Heat Rate/1000)
GEN1 Fuel Cost Curve
Break
Point,
MW
Incremental
Heat Rate,
BTU/kWh
Fuel
consumption,
MMBTU/h
Average
Heat Rate,
BTU/kWh
Efficiency,
%
TEC
Breakpoint
1, MWh
TEC
Breakpoint
2, MWh
Cost Adder,
$/MWh
50 2,667 430 8,600 40% 174 348 3.33
100 3,333 597 5,967 57% 251 501 4.17
200 4,000 997 4,983 68% 300 600 5.00 #DIV/0!
300 6,667 1,663 5,544 62% 270 539 8.33

17 © 2000 - 2015 New York Independent System Operator, Inc. All Rights Reserved.
Ex 1 -- 68% Efficiency Conversion
Suppose Gen 1 bids reflecting 68% efficiency in a Total Energy Curve
(corresponds with a $5 adder on any MWh scheduled beyond 300MWh)
In both the TEC and Fuel Cost and Efficiency curve outcomes, the resource was
scheduled to 450MWh. At this schedule, the resource actually incurs a $8.33 fuel
adder (schedule requires 2327 MMBtu) as reflected in its Fuel Cost and
Efficiency Curve offers
We compare the Total Energy Curve outcome of reflecting 68% efficiency in the
TEC offer to the Fuel Cost and Efficiency Curve outcomes: No differences in gen schedules or actual production costs in both scenarios (bid production costs
do increase in the Fuel Cost and Efficiency Curve scenario)
This example shows a higher net revenue for Gen 1 using the Fuel Cost and Efficiency Curve. This is
because the resource reflects the wrong efficiency in the TEC (chooses efficiency associated with a
$5/MWh adder) rather than the actual outcome ($8.33/MWh). Actual efficiency is captured by the Fuel
Cost and Efficiency Curve scenario.
Load payments increased under the Fuel Cost and Efficiency Curve outcome. This is because Gen 1
was marginal in HB1 and set price with a $8.33 adder rather than the $5 under the TEC scenario
Gen 1 StrategyGen 1
Actual Production Cost
Total System
Production CostLoad Payment
Gen 1
Net Revenue
Gen 2 Net
RevenueAdder in Total Energy Curve
18,490$ 25,490$ 31,250$ 5,260$ 500$
Adder in Fuel Cost Curve18,490$ 25,490$ 32,083$ 6,093$ 500$
Delta (Fuel Cost - Total Energy) -$ -$ 833$ 833$ -$

18 © 2000 - 2015 New York Independent System Operator, Inc. All Rights Reserved.
Ex 2 -- 62% Efficiency Conversion
Suppose the resource bids reflecting 62% efficiency in its Total Energy Curve (corresponds
with a $8.33 adder on any MWh scheduled beyond 270MWh)
In both the TEC and Fuel Cost and Efficiency curve outcomes, the resource was scheduled to
310MWh. At this schedule, the resource actually incurs a $5 fuel adder (associated with 68%
efficiency) as reflected in its Fuel Cost and Efficiency Curve offers
We compare the Total Energy Curve outcome of reflecting 62% efficiency in the TEC offer to
the Fuel Cost and Efficiency Curve outcomes
There were no differences in gen schedules or production costs in both scenarios (bid production costs
were higher in the TEC scenario)
This example shows a higher net revenue for Gen 1 in HB1 in the TEC scenario. This is because the
resource reflects the wrong efficiency (chooses efficiency associated with a $8.33/MWh adder) in the
TEC rather than the actual outcome ($5/MWh) but is still scheduled as the lowest cost resource. Actual
efficiency is captured by the Fuel Cost and Efficiency Curve scenario.
Gen 1 earns higher net revenues in the TEC scenario, but the resource’s bid costs and thus costs
reflected in LBMP are higher than actual. This could be inefficient for the resource owner if their higher
offers prevented a schedule or resulted in a lower schedule
Load payments decreased under the Fuel Cost and Efficiency Curve outcome. This is because Gen 1
was marginal in HB1 and set price with the actual $5 adder rather than $8.33 under the TEC scenario
Gen 1 StrategyGen 1
Actual Production Cost
Total System
Production CostLoad Payment
Gen 1
Net Revenue
Gen 2
Net RevenueAdder in Total Energy Curve
12,423$ 19,423$ 21,716$ 1,793$ 500$
Adder in Fuel Cost Curve12,423$ 19,423$ 21,350$ 1,427$ 500$
Delta (Fuel Cost - Total Energy) -$ -$ (366)$ (366)$ -$

19 © 2000 - 2015 New York Independent System Operator, Inc. All Rights Reserved.
Numerical Example Conclusion
There are risks presented when a resource does not reflect the correct
operating efficiency in a Total Energy Curve offer:
1. A resource risks reflecting too low of a cost adder: Gen1 anticipated that it would run
at 68% efficiency where it would incur $5.00/MWh fuel cost adder. In reality the market
scheduled Gen 1 at 62% where it incurred $8.33/MWh cost adder. It did not fully reflect
its costs in offers using a TEC.
1. A resource risks reflecting too high of a cost adder: Gen 1 anticipated that it would
run at 62% efficiency where it would incur $8.33/MWh cost adder. In reality the market
scheduled Gen 1 at 68% where it only incurred $5.00/MWh cost adder. LBMPs may
reflect too high of a cost, or the resource may risk not receiving a schedule.

20 © 2000 - 2015 New York Independent System Operator, Inc. All Rights Reserved.
The small-scale simulation we ran assumed the fuel
constrained resources was a single fuel resource
There are added modeling complexities needed to address
resources that can operate on more than one fuel This would require the resource offer to include detailed unit characteristics and
associated costs in all operating configurations
Even with a single fuel offer, complexities are introduced when emission costs are tied
to fuel consumption
• Resources would have to submit emission characteristic offers that are related to fuel burn, which may
include multiple emissions costs (CO2, NOx, SOx)
This complexity would require extended time to conceptualize, model, and test
Implementation of this design would impact downstream
processes that utilize bid data as each system would have to be
capable of calculating a variety of bid costs in different
configurations This is a driver behind an extended timeline for developing requirements
Fuel Cost and Efficiency Curve Design
Research – Additional Observations

21 © 2000 - 2015 New York Independent System Operator, Inc. All Rights Reserved.
Conclusion
Both TEC and Fuel Cost and Efficiency Curve designs
eliminate the risk of guessing where and when to impose
cost adders in hourly bids
Total Energy Curve (output constraint) accurately optimizes the limited
energy available to the generator(s)
Fuel Cost & Efficiency Curve (input constraint) further optimizes the
limited fuel available to the generator(s).
If the generator/portfolio efficiency is uniform, the two
designs are identical
The Fuel Cost & Efficiency Curve eliminates risk of reflecting
the wrong operating efficiency in TEC offers
Both risks described above are faced today when resources
are bidding to reflect fuel or energy limitations
Both designs provide appreciable benefits from the current
bid construct

22 © 2000 - 2015 New York Independent System Operator, Inc. All Rights Reserved.
Fuel Cost and Efficiency Curve
Development Timeline
The NYISO foresees that implementation of this design would
extend beyond 2019 into 2020 due to more extensive bid to bill
impacts than the TEC design which would require:
Extended time to conceptualize design components, develop market rules,
tariff amendments and functional requirements
Extended development and testing
The NYISO estimates the following timeline until
implementation for this design:
Target Date Estimated Time to Complete Activity
October 2017 18 months Tariff and Functional Requirements
February 2017 4 months FERC Filing
August 2018 6 months Draft Use Cases
April 2020 12-16 months
Development/Testing (likely would
not begin until 2019)
Late 2020 Deployment

23 © 2000 - 2015 New York Independent System Operator, Inc. All Rights Reserved.
Initial summary of system and interface changes associated
with implementation of this design
Items in blue highlight differences compared to the TEC design
Fuel Cost and Efficiency Curve
Development Timeline
Description of Changes Details
New bid screens
· Bidding interface for select resource or group
· Funtionality to specify constraint hours and associated fuel cost/efficiency curves
· Additional inputs must be accounted for to allow for submission of multiple
parameters that vary with heat rates
Additional bid validations
· Resource can only belong to one approved bid entitiy in a market day
· Offer cap validations - additional complexity to account for the computation of costs
between the fuel cost and efficiency parameters
· Hourly Offers v. Capability Reflected in Fuel Cost and Efficiency Curve validations -
additional complexity to account for the computation of potential energy capability as
reflected in fuel and heat rate offers
New tables for mapping bid entities to specific generators
New tools for users to administer mappings of generators and bid entities
New tables for fuel cost and efficiency curve offers Additional complexity to reflect potentially multiple cost and efficiency curves
Revised MIS conduct testing (data fed to SCUC and Billing software for
automated mitigation processes)Additional complexity to perform conduct tests across potentially multiple cost offers
Revised reliability committed unit mitigation processes
Logic revision to account for fuel cost and efficiency curve offers in the
objective function
Additional complexity to account for potentially multiple cost and efficiency curves;
costs are calculated within the optimization
Revised Automated Mitigation logic
New multi-hour, multi-unit references for each resource or group Multiple components of references for each resource or group
Revise BPCG/DAMAP eligibility coding
Revise BPCG/DAMAP calculation coding
Revise Automated GP Mitigation coding
New displays for multi-unit/multi-hour settlement components
New data structure to accomodate fuel cost and efficiency curve offers for
masked bid reportingMust consider what the masked bids should look like

24 © 2000 - 2015 New York Independent System Operator, Inc. All Rights Reserved.
Limited Energy Bidding

25 © 2000 - 2015 New York Independent System Operator, Inc. All Rights Reserved.
Background
The NYISO is currently pursuing the Total Energy Curve bidding design
All examples presented to MPs have shown this design as a way to more efficiently reflect opportunity costs across a resource(s)’ full potential capability as reflected in hourly three-part bids
Bid validation was presented to ensure this condition is met
The NYISO has stated that this design should not be used in place of taking an outage; this still holds true
At the last MIWG, MPs expressed that there is value to allowing resources to reflect a “hard” limit on energy using this design
We noted to MPs that we would discuss this topic at a future MIWG

26 © 2000 - 2015 New York Independent System Operator, Inc. All Rights Reserved.
Limited Energy Bidding Concept
Using this functionality, the TEC resource or TEC
group could submit:
Hourly three-part bids for all resource-hours covered by the
constraint
Total Energy Curve reflecting limited energy and associated
adder costs
The last MWh point on the Total Energy Curve could be less
than the total MWh reflected in hourly offers
This would allow the optimization to schedule the
resource(s) in the most optimal hours subject to the
limited energy reflected on the TEC
The benefit is that the resource would not have to
guess in which hours to bid (reflect availability)

27 © 2000 - 2015 New York Independent System Operator, Inc. All Rights Reserved.
Limited Energy Bidding Concept
Hour MWh 1 $/MWh 1
HB00 100 $15
HB01 100 $15
HB02 100 $15
HB03 100 $15
HB04 100 $15
HB05 100 $15
HB06 100 $15
HB07 100 $15
HB08 100 $15
HB09 100 $15
HB10 100 $15
HB11 100 $15
HB12 100 $15
HB13 100 $15
HB14 100 $15
HB15 100 $15
HB16 100 $15
HB17 100 $15
HB18 100 $15
HB19 100 $15
HB20 100 $15
HB21 100 $15
HB22 100 $15
HB23 100 $15
Ho
url
y IE
Off
ers
MWh 1 $/MWh 1 MWh 2 $/MWh 2
100 $0 400 $25Total Energy Curve
• Total Capability Reflected in Hourly Bids = 2400MWh
• Total Actual Capability Reflected on TEC = 400MWh
• The resource can be scheduled for <=400MWh total over the
day

28 © 2000 - 2015 New York Independent System Operator, Inc. All Rights Reserved.
The NYISO has determined that this capability does provide additional market efficiency and proposes to pursue this sub-design as part of the Fuel Constrained Bidding effort
This design provides benefits in comparison to current options: A resource can guess in which hours would be most optimal to run and
bid only in those hours, and report an outage for other hours
A resource risks guessing wrong; the optimization may have scheduled the resource in a more optimal hour, but instead must schedule a more costly resource
A resource can bid in more hours than capable, then take a forced outage if it cannot meet that schedule
This may result in more costly resources making up for the resource’s schedule in RT
The following provisions will be enforced for resources using this functionality: Resources must still report their anticipated de-rate to outage scheduling
as done today
Based on outage records and DAM offers, MMA will still check that ICAP resources are meeting their DAM bid, schedule, notify obligation
Using this feature to withhold available capability from the Energy and Ancillary Service markets will result in review for possible physical withholding
This MWh limitation will also serve as a cap on the total of energy, spin, and non-spin reserve schedules
Limited Energy Bidding Concept

29 © 2000 - 2015 New York Independent System Operator, Inc. All Rights Reserved.
Level Schedule Request
Feature
30 © 2000 - 2015 New York Independent System Operator, Inc. All Rights Reserved.
Background
This feature is currently part of the high level
design approved at BIC
Bidding functionality to allow resources to more
efficiently reflect 1/24th OFO constraints in day-
ahead offers is recommended in 2013/14 State of
the Market reports
Though discussions with resource bidders, this
functionality is desirable to help reflect costs
better in energy offers when a 1/24th OFO is
anticipated

31 © 2000 - 2015 New York Independent System Operator, Inc. All Rights Reserved.
Level Schedule Concept
This feature does not have to be used with a Total Energy Curve, though it is a multi-hour constraint
Using this functionality, a resource could submit:
Hourly three-part bids for all resource-hours covered by the constraint
Request to enforce a level schedule for specified hours
OPTIONAL: Total Energy Curve
This would allow the optimization to schedule the resource(s) flexibly, but to enforce a level schedule if scheduled
This feature would give resources an alternative to self-scheduling to achieve a level schedule
A resource can be evaluated economically for a level schedule as opposed to offering as a price taker in order to guarantee a level schedule

32 © 2000 - 2015 New York Independent System Operator, Inc. All Rights Reserved.
Level Schedule Request Concept
• Single block-loaded resource with level schedule request over HB 00-09:

33 © 2000 - 2015 New York Independent System Operator, Inc. All Rights Reserved.
NYISO proposes that this sub-design be available for single, block loaded resources only Historically, MPs have inquired about how to reflect OFO-
related costs across block-loaded resources, not flexible resources
Single resources in a portfolio can bid with this request to achieve a portfolio-level, level schedule
A resource requesting a level schedule may still belong to a TEC group
NYISO is interested in hearing feedback on whether this functionality would be beneficial for flexible scheduled resources as well
These resources could bid in the ISO Flex or ISO Fixed bid mode and will be eligible for BPCG as the decision to schedule the resource would be an economic decision
For block-loaded resources, this request is essentially an on/off decision and NYISO will assume that a resource’s UOL offers are reflective of a level fuel draw
Resources using this feature will be precluded form providing reserves in the constraint timeframe
Level Schedule Request Concept

34 © 2000 - 2015 New York Independent System Operator, Inc. All Rights Reserved.
The NYISO plans to conduct an informative WebEx for
resource bidders and conduct a follow-up survey to determine
design preferences and quantify perceived benefits of each
design and sub-functionality
The following questions will be addressed:
How beneficial is the design or sub-functionality to your generation
fleet?
How often would this design or sub-functionality be used?
Where do preferences lie?
The results of this survey will be discussed at an April MIWG
This feedback will help inform us of which design components
to prioritize
Solicitation of generator
bidder/scheduler feedback

35 © 2000 - 2015 New York Independent System Operator, Inc. All Rights Reserved.
Next Steps
Currently soliciting MP feedback Please e-mail any questions or comments to [email protected]
Conduct a WebEx to solicit feedback from resource
bidders/schedules to gauge design preferences
March - May Continuation of discussions on market rules for the TEC design
Q2-Q3 2016 Tariff language development
BIC Vote on Market Design and Tariff Language
Q4 2016 Draft and approve functional requirements (Internal)

36 © 2000 - 2015 New York Independent System Operator, Inc. All Rights Reserved.
APPENDIX 1 – Conversion of
Incremental Heat Rate Curve to
Operating Point Efficiency

37 © 2000 - 2015 New York Independent System Operator, Inc. All Rights Reserved.
Assume the resource’s Fuel Input at Min Gen (50MW) is 430MMBtu/h.
Fuel consumption is calculated at each point of the incremental heat
rate curve. We can construct the resource’s input/output curve as
follows:
From here, we can calculate the resource’s average heat rate and
calculate a % efficiency at each operating point, used in the analysis
Conversion of Incremental Heat Rate
Curve to Operating Point Efficiency

38 © 2000 - 2015 New York Independent System Operator, Inc. All Rights Reserved.
APPENDIX 2 – TEC/Fuel Cost and
Efficiency Curve Comparison
Example 1 Details

39 © 2000 - 2015 New York Independent System Operator, Inc. All Rights Reserved.
TEC/Fuel Cost and Efficiency Curve
Comparison – Example 1
TEC inputs and outcomes:

40 © 2000 - 2015 New York Independent System Operator, Inc. All Rights Reserved.
Fuel Cost and Efficiency Curve inputs and outcomes:
TEC/Fuel Cost and Efficiency Curve
Comparison – Example 1

41 © 2000 - 2015 New York Independent System Operator, Inc. All Rights Reserved.
Example 1 – Fuel Cost and Efficiency Curve
Market Clearing

42 © 2000 - 2015 New York Independent System Operator, Inc. All Rights Reserved.
Actual production costs for Gen 1 and Gen 2 over both hours is
calculated as:
Comparison of results:
Example 1 Comparison of Outcomes
Gen 1 StrategyGen 1
Actual Production Cost
Total System
Production CostLoad Payment
Gen 1
Net Revenue
Gen 2 Net
RevenueAdder in Total Energy Curve
18,490$ 25,490$ 31,250$ 5,260$ 500$
Adder in Fuel Cost Curve18,490$ 25,490$ 32,083$ 6,093$ 500$
Delta (Fuel Cost - Total Energy) -$ -$ 833$ 833$ -$

43 © 2000 - 2015 New York Independent System Operator, Inc. All Rights Reserved.
APPENDIX 3 – TEC/Fuel Cost and
Efficiency Curve Comparison
Example 2 Details

44 © 2000 - 2015 New York Independent System Operator, Inc. All Rights Reserved.
TEC inputs and outcomes:
TEC/Fuel Cost and Efficiency Curve
Comparison – Example 2

45 © 2000 - 2015 New York Independent System Operator, Inc. All Rights Reserved.
Fuel Cost and Efficiency outcomes:
TEC/Fuel Cost and Efficiency Curve
Comparison – Example 2
46 © 2000 - 2015 New York Independent System Operator, Inc. All Rights Reserved.
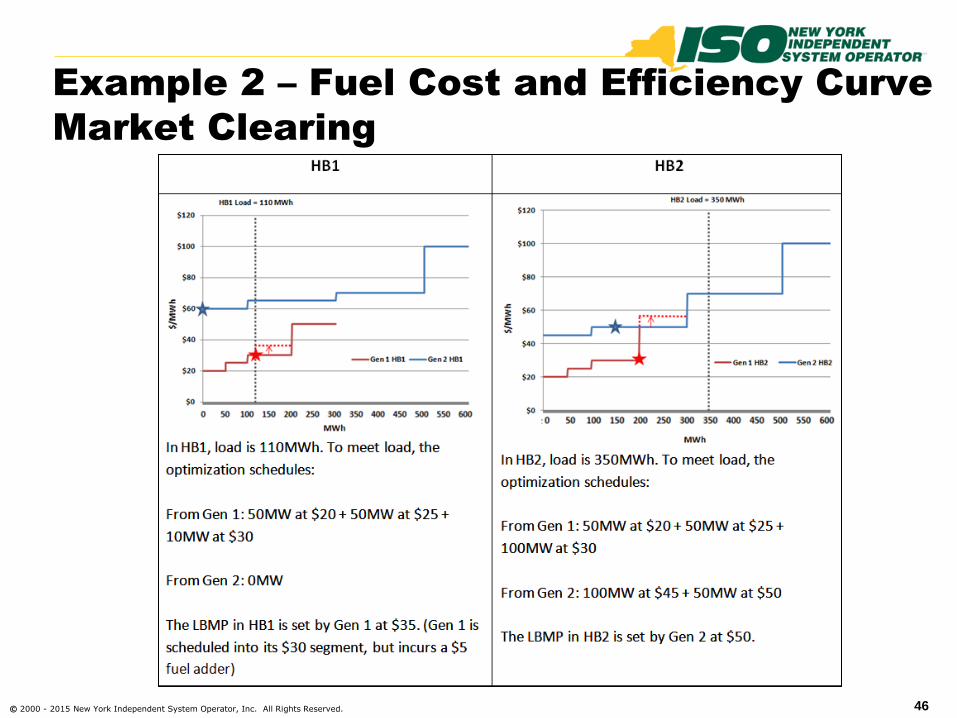
Example 2 – Fuel Cost and Efficiency Curve
Market Clearing

47 © 2000 - 2015 New York Independent System Operator, Inc. All Rights Reserved.
Actual production costs for Gen 1 and Gen 2 over both hours is calculated as:
Comparison of results:
Example 2 Comparison of Outcomes
Gen 1 StrategyGen 1
Actual Production Cost
Total System
Production CostLoad Payment
Gen 1
Net Revenue
Gen 2
Net RevenueAdder in Total Energy Curve
12,423$ 19,423$ 21,716$ 1,793$ 500$
Adder in Fuel Cost Curve12,423$ 19,423$ 21,350$ 1,427$ 500$
Delta (Fuel Cost - Total Energy) -$ -$ (366)$ (366)$ -$