fuel-cladding interaction layers in irradiated u-zr and u
TRANSCRIPT
Argonne National Laboratory is managed by The University of Chicago for the U. S. Department of Energy
Fuel-Cladding Interaction Layers in Irradiated U-Zr and U-Pu-Zr Fuel Elements
ANL-NT-240
prepared by Engineering Technology DivisionArgonne National Laboratory-West
NT Technical Memorandum
Results reported in the NT-TM series of memoranda frequently are preliminary and subject to revision.
Consequently, they should not be quoted or referenced.
Disclaimer
This report was prepared as an account of work sponsored by an agency of the United States Government. Neither the United States
Government nor any agency thereof, nor The University of Chicago, nor any of their employees or officers, makes any warranty, express
or implied, or assumes any legal liability or responsibility for the accuracy, completeness, or usefulness of any information, apparatus,
product, or process disclosed, or represents that its use would not infringe privately owned rights. Reference herein to any specific
commercial product, process, or service by trade name, trademark, manufacturer, or otherwise, does not necessarily constitute or imply
its endorsement, recommendation, or favoring by the United States Government or any agency thereof. The views and opinions of
document authors expressed herein do not necessarily state or reflect those of the United States Government or any agency thereof,
Argonne National Laboratory, or The University of Chicago.
About Argonne National Laboratory Argonne is managed by The University of Chicago for the U.S. Department of Energy under contract W-31-109-Eng-38. The Laboratory’s main facility is outside Chicago, at 9700 South Cass Avenue, Argonne, Illinois 60439. For information about Argonne and its pioneering science and technology programs, see www.anl.gov.
Availability of This ReportThis report is available, at no cost, at http://www.osti.gov/bridge. It is also available on paper to U.S. Department of Energy and its contractors, for a processing fee, from:
U.S. Department of Energy
Office of Scientific and Technical Information
P.O. Box 62
Oak Ridge, TN 37831-0062
phone (865) 576-8401
fax (865) 576-5728
Argonne National Laboratory is managed by The University of Chicago for the U. S. Department of Energy
Fuel-Cladding Interaction Layers in Irradiated U-Zr and U-Pu-Zr Fuel Elements
ANL-NT-240
by D.D. Keiser*Engineering Technology Division, Argonne National Laboratory-West
*Current Affiliation: Idaho National Laboratory, P.O. Box 1625, Idaho Falls, ID 83415

ii

iii
TABLE OF CONTENTS
Page
ACRONYMS................................................................................................................................ vi
ABSTRACT.................................................................................................................................vii
1. Introduction........................................................................................................................ 1
2. Result of Post Irradiation Analyses of Fuel Elements ....................................................... 22.1 Layers in Fuel Elements with HT9 Cladding ........................................................ 4
2.1.1 HT9-Clad Elements with Ternary U-Pu-Zr Alloy Fuel............................. 42.1.1.1 DP16............................................................................................ 42.1.1.2 DP21.......................................................................................... 15
2.1.2 HT9-Clad Elements with Binary U-Zr Alloy Fuel .................................. 152.1.2.1 DP11.......................................................................................... 152.1.2.2 DP81.......................................................................................... 202.1.2.3 Breached Fuel Elements............................................................ 20
2.2 Layers in Fuel Elements with D9 or Type 316 Stainless Steel Cladding ............ 202.2.1 D9-Clad Elements with Ternary U-Pu-Zr Alloy Fuel ............................. 20
2.2.1.1 T106 .......................................................................................... 202.2.1.2 T112 .......................................................................................... 222.2.1.3 T087 .......................................................................................... 252.2.1.4 T159 .......................................................................................... 252.2.1.5 A850.......................................................................................... 252.2.1.6 T042 .......................................................................................... 27
2.2.2 D9-Clad Elements with Binary U-Zr Alloy Fuel..................................... 272.2.2.1 T141 .......................................................................................... 272.2.2.2 T225 .......................................................................................... 292.2.2.3 C709 .......................................................................................... 31
3. Discussion........................................................................................................................ 313.1 Phases Found at the Fuel-Cladding Interface in Irradiated U-Zr and
U-Pu-Zr Fuel Elements Clad with D9, Type 316, or HT9 Stainless Steel .......... 313.2 Factors Affecting Interaction Zone Thickness in Irradiated Fuel Elements ........ 333.3 Potential Components to be Carried Over into a Metal Waste Form .................. 33
4. Conclusions...................................................................................................................... 34
ACKNOWLEDGMENTS ........................................................................................................... 35
REFERENCES ............................................................................................................................ 36
iv
LIST OF FIGURES
Page1. Optical Micrograph of Typical Fuel-cladding Interface from DP-16 Samples...................... 52. Optical Micrograph Showing the Accumulation of Fission Product
Phases at the Fuel-cladding Interface ..................................................................................... 63. Electron Microprobe Specimen Current Image and X-ray Maps for
U, Pu, Zr, Fe, Cr, Ce, Nd, Ru, and Pd ................................................................................... 84. Relative EPMA Concentration Profiles for U, Zr, Pu, Fe, Cr, Ce,
and Nd Across the Fuel-Cladding Interface for DP16............................................................ 95. Secondary Electron Micrographs of a Cladding Sample Taken from DP-16, Low
Magnification Image of the Sample, and the Outlined Box Identifies the RegionWhere Subsequent Analyses were Focused, Specifically at Locations A and B,(b) Shows a Higher Magnification Image of Region A and (c) Shows Region B................ 10
6. Backscattered Electron (a) and Secondary Electron (b) Images of the InteractionLayers Observed in Location A for the Sample Taken from DP16 ..................................... 11
7. Measured Compositions as a Function of Linear Position in Location A............................ 128. Backscattered Electron and Secondary Electron Images of the Interaction Layers
Observed in Location B for the Sample Taken from DP16.................................................. 149. Measured Compositions as a Function of Linear Position in Location A
Shows Elemental Traces for Cladding Constituents and Shows Traces forthe Fission Products.............................................................................................................. 17
10. Electron Microprobe Specimen Current Image and X-ray Maps for U, Zr, Fe,Cr, Ba, La, Ce, Pr, Nd, and Sm............................................................................................. 19
11. Optical Micrograph of an Area Near the Fuel-Cladding Interface Where Dark-Gray Precipitates and Light-Gray Precipitates are Observed...................................... 21
12. Optical Micrograph Showing the Presence of Blocky Particles Near theFuel-Cladding Interface ........................................................................................................ 22
13. Optical Micrograph Showing the Presence of an Interaction Zone at the Fuel-Cladding Interface ........................................................................................................ 23
14. Optical Micrograph Showing The Presence of a Fuel-cladding Interaction Zone and Large Quantities of Fission Products Filling Voids Near the Cladding ............... 24
15. Optical Micrograph Showing the Fuel-cladding Interface Near An Intact Zr-rind Layer ........................................................................................................................ 24
16. Optical Micrograph Showing Fuel-Cladding Interaction Adjacent to a LargeDeposit of Lanthanide Fission Products ............................................................................... 26
17. Optical Micrographs Showing A Low Magnification Image and High Magnification Image of the Fuel-cladding Interface Where The Zr-rind Is Not Intact and Interaction Has Occurred Between the Fuel and Cladding....................... 28
18. Optical Micrograph Showing the Fuel-cladding Interaction That Has Occurred in an Area Where the Zr-rind Is Not Intact........................................................... 29
19. Optical Micrographs of a Transverse Cross-section Taken From The Bottom of Element T-225 ...................................................................................................................... 30

v
LIST OF TABLESPage
1. Nominal Compositions for Stainless Steel Cladding Materials ............................................. 12. Results From Examinations of Fuel Elements Irradiated in EBR-II ...................................... 33. Approximate Compositions of Spot Readings Taken in Different Regions
of the Phase Layers at Location A of DP16 SEM Sample ................................................... 114. Approximate Compositions of Spot Readings of Phase Layers at
Location B of DP16 SEM Sample........................................................................................ 135. Approximate Compositions of Light and Dark Regions of Noble
Metal-Containing Phases in a Sample From Fuel Element T106......................................... 216. As-Irradiated Data For Samples From Fuel Element A850 ................................................. 25

vi
ACRONYMS
ANL Argonne National Laboratory
BOL Beginning-Of-Life
EBR-II Experimental Breeder Reactor-II
EDS Energy Dispersive Spectroscopy
EPMA Electron Probe Micro-Analysis
ID Inner Diameter
OM Optical Metallography
PICT Peak Inner Cladding Temperature
SEM Scanning Electron Microscope
SS Stainless Steel
WDS Wavelength Dispersive Spectroscopy
vii
FUEL-CLADDING INTERACTION LAYERS IN IRRADIATEDU-ZR AND U-PU-ZR FUEL ELEMENTS
by
D. D. Keiser
ABSTRACT
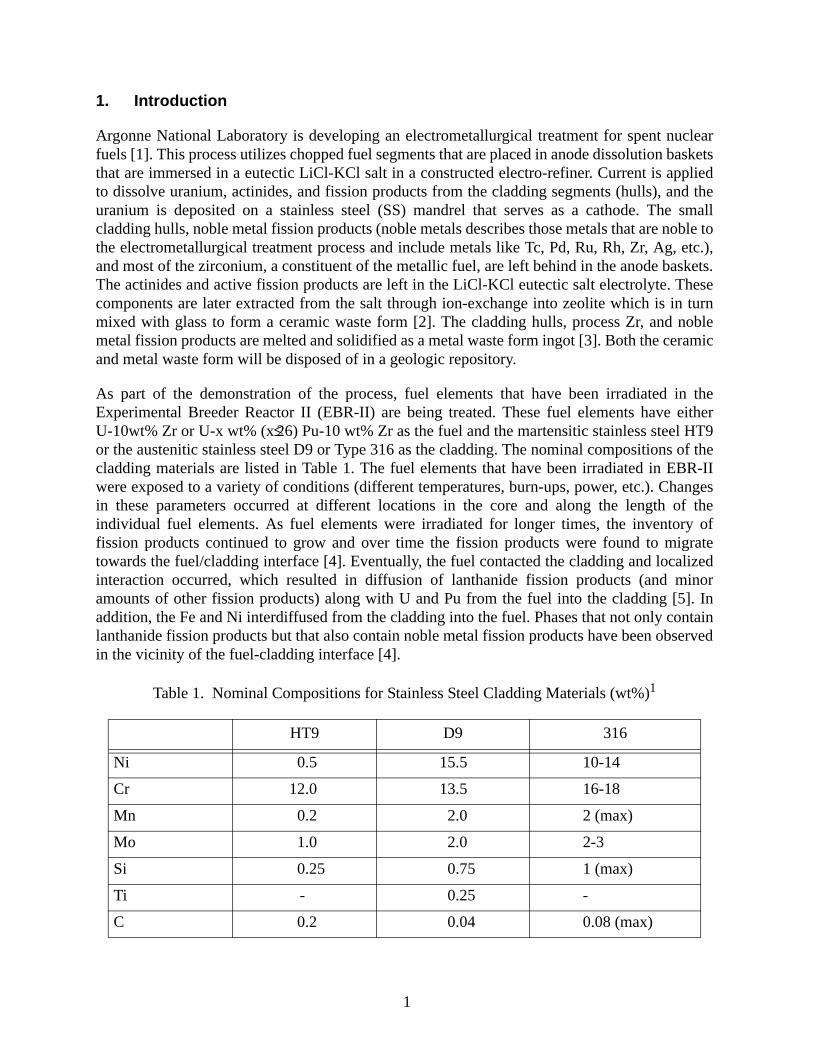
Argonne National Laboratory is developing an electrometallurgical treatment for spent nuclearfuels. The initial demonstration of this process is being conducted on U-Zr and U-Pu-Zr alloyfuel elements irradiated in the Experimental Breeder Reactor-II (EBR-II). Theelectrometallurgical treatment process extracts usable uranium from irradiated fuel elements andplaces residual fission products, actinides, process Zr, and cladding hulls (small segments oftubing) into two waste forms—a ceramic and a metal alloy. The metal waste form will containthe cladding hulls, Zr, and noble metal fission products, and it will be disposed of in a geologicrepository. As a result, the expected composition of the waste form will need to be wellunderstood. This report deals with the condition of the cladding, which will make up a largefraction of the metal waste form, after irradiation in EBR-II and before insertion into theelectrorefiner. Specifically, it looks at layers that can be found on the inner surface of thecladding due to in-reactor interactions between the alloy fuel and the stainless steel cladding thatoccurs after the fuel has swelled and contacted the cladding. Many detailed examinations of fuelelements irradiated in EBR-II have been completed and are discussed in the context ofinteraction layer formation in irradiated cladding. The composition and thickness of thedeveloped interaction layers are identified, along with the irradition conditions, cladding type,and axial location on fuel elements where the thickest interaction layers can be expected todevelop. It has been found that the largest interaction zones are observed at combined high powerand high temperature regions of fuel elements and for fuel elements wiht U-Pu-Zr alloy fuel andD9 stainless steel cladding. The most prevalent, non-cladding constituent observed in thedeveloped interaction layers are the lanthanide fission products

viii
.
1
1. Introduction
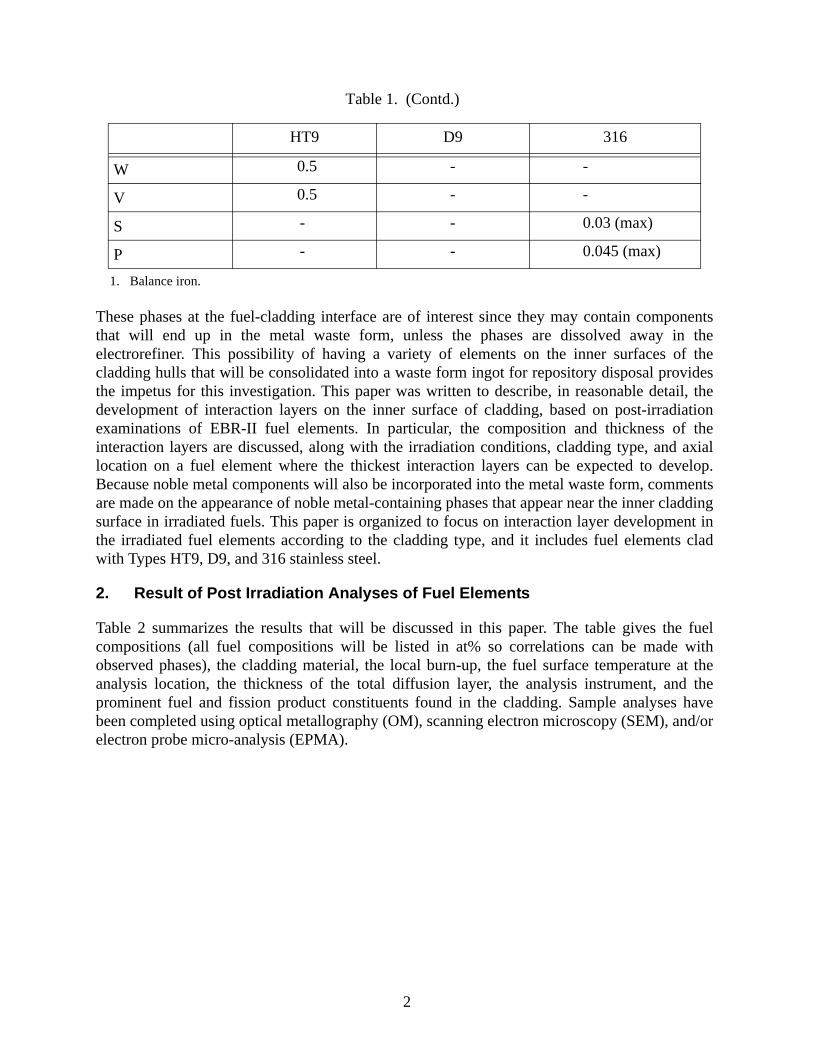
Argonne National Laboratory is developing an electrometallurgical treatment for spent nuclearfuels [1]. This process utilizes chopped fuel segments that are placed in anode dissolution basketsthat are immersed in a eutectic LiCl-KCl salt in a constructed electro-refiner. Current is appliedto dissolve uranium, actinides, and fission products from the cladding segments (hulls), and theuranium is deposited on a stainless steel (SS) mandrel that serves as a cathode. The smallcladding hulls, noble metal fission products (noble metals describes those metals that are noble tothe electrometallurgical treatment process and include metals like Tc, Pd, Ru, Rh, Zr, Ag, etc.),and most of the zirconium, a constituent of the metallic fuel, are left behind in the anode baskets.The actinides and active fission products are left in the LiCl-KCl eutectic salt electrolyte. Thesecomponents are later extracted from the salt through ion-exchange into zeolite which is in turnmixed with glass to form a ceramic waste form [2]. The cladding hulls, process Zr, and noblemetal fission products are melted and solidified as a metal waste form ingot [3]. Both the ceramicand metal waste form will be disposed of in a geologic repository.
As part of the demonstration of the process, fuel elements that have been irradiated in theExperimental Breeder Reactor II (EBR-II) are being treated. These fuel elements have eitherU-10wt% Zr or U-x wt% (x≤26) Pu-10 wt% Zr as the fuel and the martensitic stainless steel HT9or the austenitic stainless steel D9 or Type 316 as the cladding. The nominal compositions of thecladding materials are listed in Table 1. The fuel elements that have been irradiated in EBR-IIwere exposed to a variety of conditions (different temperatures, burn-ups, power, etc.). Changesin these parameters occurred at different locations in the core and along the length of theindividual fuel elements. As fuel elements were irradiated for longer times, the inventory offission products continued to grow and over time the fission products were found to migratetowards the fuel/cladding interface [4]. Eventually, the fuel contacted the cladding and localizedinteraction occurred, which resulted in diffusion of lanthanide fission products (and minoramounts of other fission products) along with U and Pu from the fuel into the cladding [5]. Inaddition, the Fe and Ni interdiffused from the cladding into the fuel. Phases that not only containlanthanide fission products but that also contain noble metal fission products have been observedin the vicinity of the fuel-cladding interface [4].
Table 1. Nominal Compositions for Stainless Steel Cladding Materials (wt%)1
HT9 D9 316
Ni 0.5 15.5 10-14
Cr 12.0 13.5 16-18
Mn 0.2 2.0 2 (max)
Mo 1.0 2.0 2-3
Si 0.25 0.75 1 (max)
Ti - 0.25 -
C 0.2 0.04 0.08 (max)
2
1. Balance iron.
These phases at the fuel-cladding interface are of interest since they may contain componentsthat will end up in the metal waste form, unless the phases are dissolved away in theelectrorefiner. This possibility of having a variety of elements on the inner surfaces of thecladding hulls that will be consolidated into a waste form ingot for repository disposal providesthe impetus for this investigation. This paper was written to describe, in reasonable detail, thedevelopment of interaction layers on the inner surface of cladding, based on post-irradiationexaminations of EBR-II fuel elements. In particular, the composition and thickness of theinteraction layers are discussed, along with the irradiation conditions, cladding type, and axiallocation on a fuel element where the thickest interaction layers can be expected to develop.Because noble metal components will also be incorporated into the metal waste form, commentsare made on the appearance of noble metal-containing phases that appear near the inner claddingsurface in irradiated fuels. This paper is organized to focus on interaction layer development inthe irradiated fuel elements according to the cladding type, and it includes fuel elements cladwith Types HT9, D9, and 316 stainless steel.
2. Result of Post Irradiation Analyses of Fuel Elements
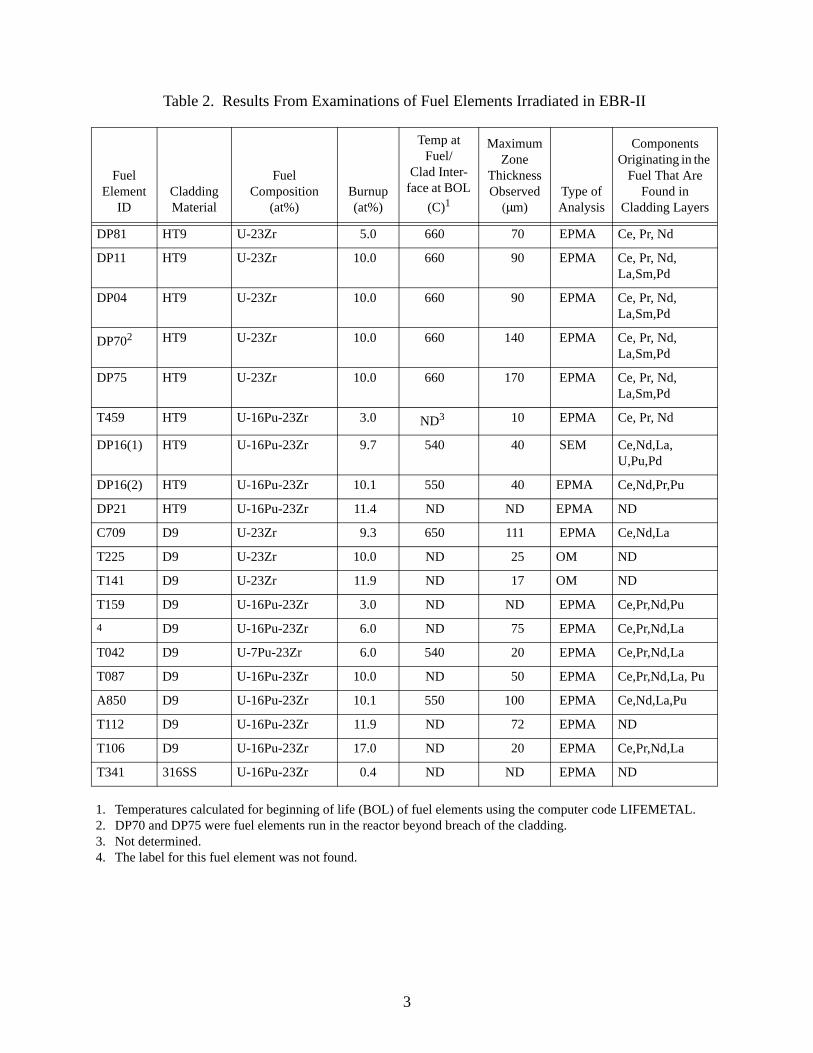
Table 2 summarizes the results that will be discussed in this paper. The table gives the fuelcompositions (all fuel compositions will be listed in at% so correlations can be made withobserved phases), the cladding material, the local burn-up, the fuel surface temperature at theanalysis location, the thickness of the total diffusion layer, the analysis instrument, and theprominent fuel and fission product constituents found in the cladding. Sample analyses havebeen completed using optical metallography (OM), scanning electron microscopy (SEM), and/orelectron probe micro-analysis (EPMA).
HT9 D9 316
W 0.5 - -
V 0.5 - -
S - - 0.03 (max)
P - - 0.045 (max)
Table 1. (Contd.)
3
Table 2. Results From Examinations of Fuel Elements Irradiated in EBR-II
1. Temperatures calculated for beginning of life (BOL) of fuel elements using the computer code LIFEMETAL.2. DP70 and DP75 were fuel elements run in the reactor beyond breach of the cladding.3. Not determined.4. The label for this fuel element was not found.
FuelElement
IDCladdingMaterial
FuelComposition
(at%)Burnup(at%)
Temp at Fuel/
Clad Inter-face at BOL
(C)1
Maximum Zone
ThicknessObserved(μm)
Type ofAnalysis
ComponentsOriginating in the
Fuel That Are Found in
Cladding Layers
DP81 HT9 U-23Zr 5.0 660 70 EPMA Ce, Pr, Nd
DP11 HT9 U-23Zr 10.0 660 90 EPMA Ce, Pr, Nd, La,Sm,Pd
DP04 HT9 U-23Zr 10.0 660 90 EPMA Ce, Pr, Nd, La,Sm,Pd
DP702 HT9 U-23Zr 10.0 660 140 EPMA Ce, Pr, Nd, La,Sm,Pd
DP75 HT9 U-23Zr 10.0 660 170 EPMA Ce, Pr, Nd, La,Sm,Pd
T459 HT9 U-16Pu-23Zr 3.0 ND3 10 EPMA Ce, Pr, Nd
DP16(1) HT9 U-16Pu-23Zr 9.7 540 40 SEM Ce,Nd,La,U,Pu,Pd
DP16(2) HT9 U-16Pu-23Zr 10.1 550 40 EPMA Ce,Nd,Pr,Pu
DP21 HT9 U-16Pu-23Zr 11.4 ND ND EPMA ND
C709 D9 U-23Zr 9.3 650 111 EPMA Ce,Nd,La
T225 D9 U-23Zr 10.0 ND 25 OM ND
T141 D9 U-23Zr 11.9 ND 17 OM ND
T159 D9 U-16Pu-23Zr 3.0 ND ND EPMA Ce,Pr,Nd,Pu
4 D9 U-16Pu-23Zr 6.0 ND 75 EPMA Ce,Pr,Nd,La
T042 D9 U-7Pu-23Zr 6.0 540 20 EPMA Ce,Pr,Nd,La
T087 D9 U-16Pu-23Zr 10.0 ND 50 EPMA Ce,Pr,Nd,La, Pu
A850 D9 U-16Pu-23Zr 10.1 550 100 EPMA Ce,Nd,La,Pu
T112 D9 U-16Pu-23Zr 11.9 ND 72 EPMA ND
T106 D9 U-16Pu-23Zr 17.0 ND 20 EPMA Ce,Pr,Nd,La
T341 316SS U-16Pu-23Zr 0.4 ND ND EPMA ND

4
2.1 Layers in Fuel Elements with HT9 Cladding
Referring to Table 2, nine irradiated fuel elements clad with the martensitic stainless steel HT9have been analyzed with particular focus on the fuel-cladding interface. Three elements hadU-16 at% Pu-23 at% Zr fuel, while the rest had U-23 at% Zr fuel.
2.1.1 HT9-Clad Elements with Ternary U-Pu-Zr Alloy Fuel
2.1.1.1 DP16
Fuel element DP16 consisted of U-16Pu-23Zr fuel and HT9 cladding and was irradiated to aburn-up of 11.3 at%. This element is of particular interest since it was the only fuel elementwhere a sample was sliced from the element and analyzed using scanning electron microscope/energy dispersive spectroscopy (SEM/EDS), in addition to the more typical opticalmetallography and EPMA analyses historically performed on fuel elements.
The optical metallography and EPMA analysis for DP16 was performed on a sample from aposition of x/L=0.78 (x/L refers to the radial position from the bottom of the fuel element, x,divided by the total length of the fuel element, L) (with a local burn-up of 10.1 at%). Theobservations at the fuel-cladding interface for this fuel element proved to be representative ofwhat was observed for the other U-16Pu-23Zr/HT9 fuel elements, based on EPMA and opticalmetallography.
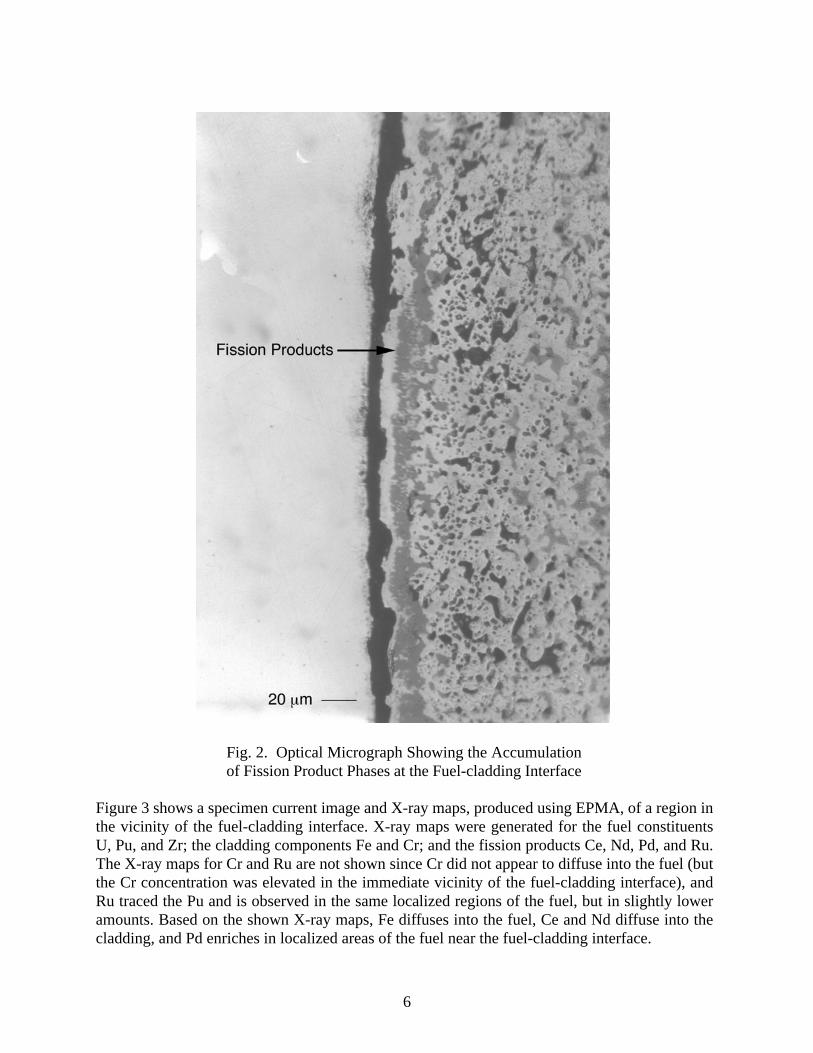
Figure 1 shows an optical micrograph of a small region of the fuel-cladding interface in fuelelement DP16. Interdiffusion layers are observed on the inner-surface of the cladding. Anotheroptical metallograph is presented in Fig. 2 that shows some of the fission product phases that canbe found in regions of the fuel near the cladding.

5
Fig. 1. Optical Micrograph of Typical Fuel-cladding Interface from DP-16Samples (note interaction on the cladding side of the interface [black arrows])
6
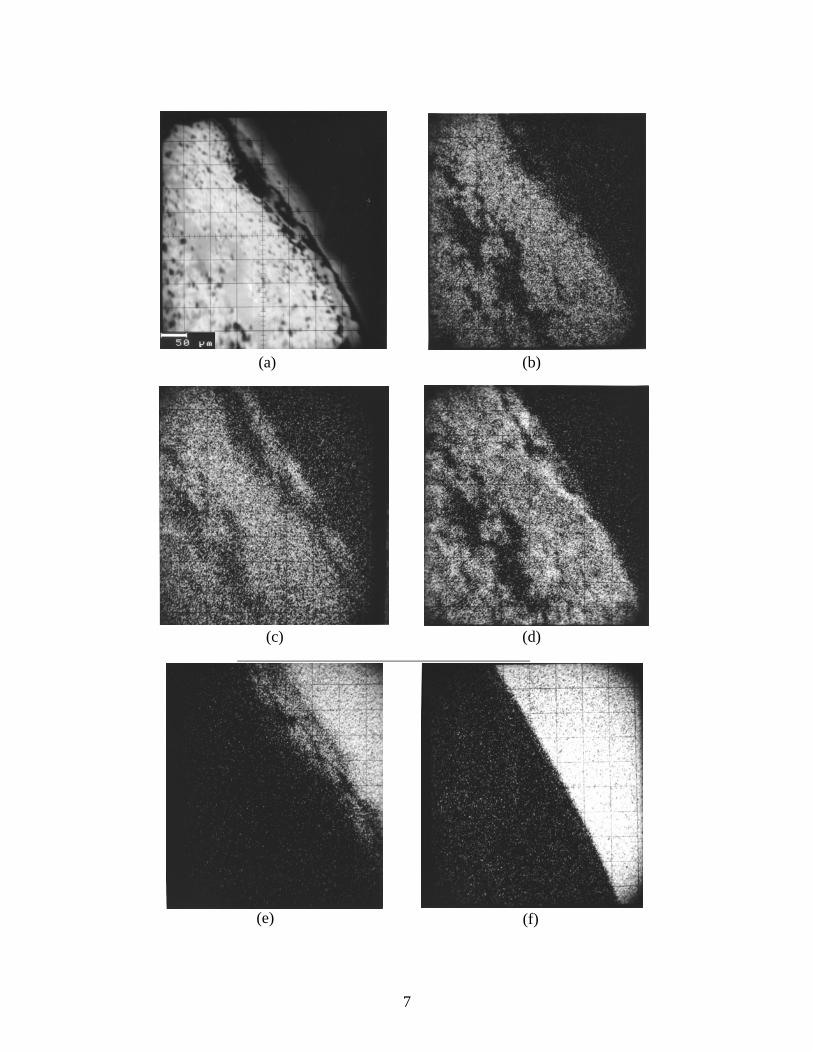
Figure 3 shows a specimen current image and X-ray maps, produced using EPMA, of a region inthe vicinity of the fuel-cladding interface. X-ray maps were generated for the fuel constituentsU, Pu, and Zr; the cladding components Fe and Cr; and the fission products Ce, Nd, Pd, and Ru.The X-ray maps for Cr and Ru are not shown since Cr did not appear to diffuse into the fuel (butthe Cr concentration was elevated in the immediate vicinity of the fuel-cladding interface), andRu traced the Pu and is observed in the same localized regions of the fuel, but in slightly loweramounts. Based on the shown X-ray maps, Fe diffuses into the fuel, Ce and Nd diffuse into thecladding, and Pd enriches in localized areas of the fuel near the fuel-cladding interface.
Fig. 2. Optical Micrograph Showing the Accumulationof Fission Product Phases at the Fuel-cladding Interface
7
(a) (b)
(c) (d)
(e) (f)

8
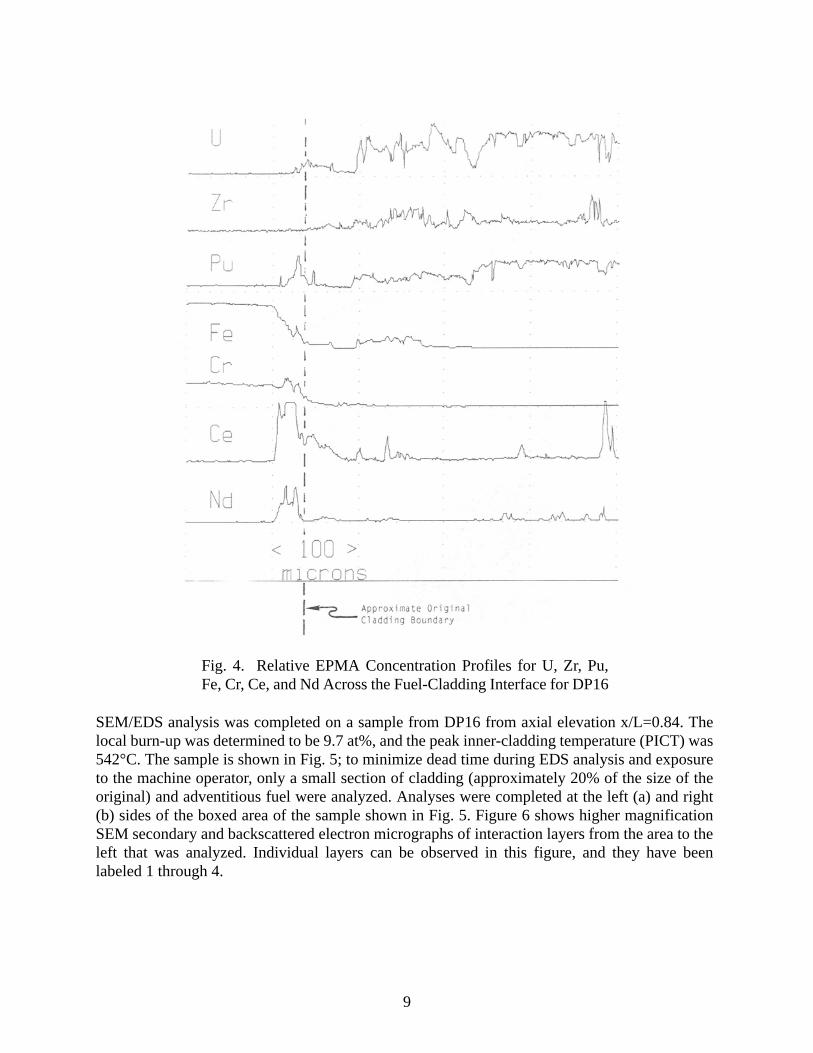
Figure 4 shows an EPMA elemental trace taken at the fuel-cladding interface in DP16. Theapproximate original cladding boundary corresponds to where the Cr concentration drops to nearzero. The elemental trace shows the same behavior for Fe, Cr, U, Pu, Zr, Ce, and Nd compared towhat is observed with X-ray maps. The lanthanides penetrated the furthest into the cladding(approximately 40 μm) of any components originating in the fuel.
(g) (h)
(j)(i)
Fig. 3. (a) Electron Microprobe Specimen Current Image and X-ray Mapsfor (b) U, (c) Pu, (d) Zr, (e) Fe, (f) Cr, (g) Ce, (h) Nd, (i) Ru, and (j) Pd
9
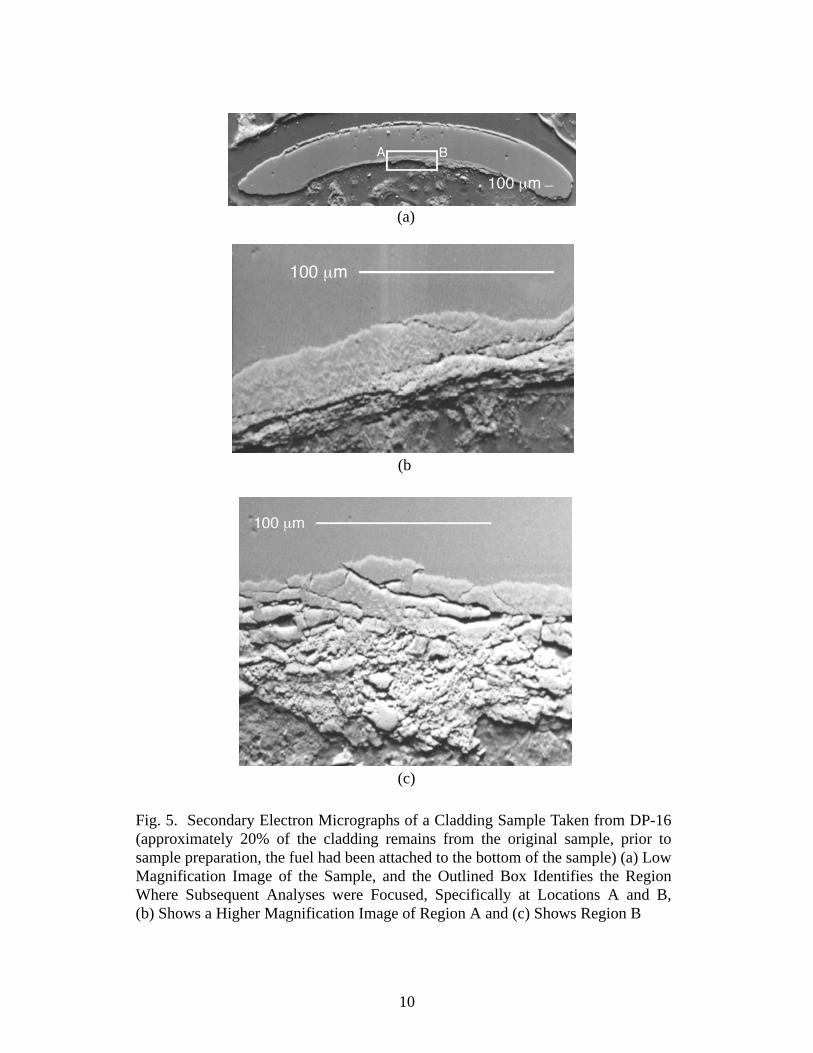
SEM/EDS analysis was completed on a sample from DP16 from axial elevation x/L=0.84. Thelocal burn-up was determined to be 9.7 at%, and the peak inner-cladding temperature (PICT) was542°C. The sample is shown in Fig. 5; to minimize dead time during EDS analysis and exposureto the machine operator, only a small section of cladding (approximately 20% of the size of theoriginal) and adventitious fuel were analyzed. Analyses were completed at the left (a) and right(b) sides of the boxed area of the sample shown in Fig. 5. Figure 6 shows higher magnificationSEM secondary and backscattered electron micrographs of interaction layers from the area to theleft that was analyzed. Individual layers can be observed in this figure, and they have beenlabeled 1 through 4.
Fig. 4. Relative EPMA Concentration Profiles for U, Zr, Pu,Fe, Cr, Ce, and Nd Across the Fuel-Cladding Interface for DP16
10
(a)
(b
(c)
Fig. 5. Secondary Electron Micrographs of a Cladding Sample Taken from DP-16(approximately 20% of the cladding remains from the original sample, prior tosample preparation, the fuel had been attached to the bottom of the sample) (a) LowMagnification Image of the Sample, and the Outlined Box Identifies the RegionWhere Subsequent Analyses were Focused, Specifically at Locations A and B,(b) Shows a Higher Magnification Image of Region A and (c) Shows Region B

11
Table 3 enumerates the approximate compositions of the four phase layers, based on point-to-point SEM/EDS measurements taken in the various phase layers at location A. A compositionprofile through layers 1-4 is shown in Fig. 7 where spot readings were matched with a distancethrough the interaction zone (some constituent concentrations are grouped together). Layer 1appears to consist of two phases and it contains the only Zr found in the sample and appreciablePd. Only trace amounts of Fe and Cr were observed in Layer 1, and relatively high levels oflanthanide fission products were observed (about 50 at% over the width of the layer).
Table 3. Approximate Compositions of Spot Readings Taken in DifferentRegions of the Phase Layers at Location A of DP16 SEM Sample (in at%)a
Layer Fe Cr Si Pd Ceb Nd Zr Pu Other
1 2 2 0 24 16 34 19 1 -
1 1 1 5 35 19 33 5 1 -
1 - - 5 38 13 26 7 2 9La
1 - - - 20 10 16 31 - 6La,17Pb
2 - 34 6 - 11 23 - - 3Mo,6La,8U,9Sn
2 2 28 7 - 16 28 - - La,7U,1Ag,10Sn
(a) (b)
Fig. 6. Backscattered Electron (a) and Secondary Electron (b) Images of theInteraction Layers Observed in Location A for the Sample Taken from DP16 (thelower left is un-reacted cladding, and the upper right is mount material)

12
a. Nominal un-reacted cladding had composition of 84Fe-12Cr-2Si-1Mn-0.4Ni for components listed in Table 3 (determined by SEM/EDS).
b. It is difficult to resolve lanthanides using SEM/EDS due to peak overlap. As a result,the numbers given for Ce and Nd should be taken as qualitative numbers, and in some cases La may be present with the Ce and Nd (based on EPMA X-ray maps).
Layer 2 contained lanthanides and relatively high levels of Cr. A relatively high level of U wasobserved in this layer, which agrees with EPMA data where U does penetrate into the cladding.The detection of Sn in layer 2 seems believable and has been seen in other samples analyzed withEPMA.
Layer 3 was a very thin layer (approximately 1 μm wide), and as a result was hard to differentiatefrom layer 2 (Fig. 6). Composition differences were detected between layers 2 and 3. 15 at% Pd,
Layer Fe Cr Si Pd Cea Nd Zr Pu Other
3 28 20 5 15 10 12 - 11 -
4 63 10 4 - 7 13 - 0.3 1La
4 66 15 6 - 5 7 - 0.2 1Ag
4 67 13 6 - 5 7 - 0.2 1Ag
4 69 16 4 - 5 5 - 0.3 1Ag
Fig. 7. Measured Compositions as a Function of Linear Position in Location A (the valuesare compiled in Table 3, the numbers at the top correspond to the layer numbers in Table 3)
Table 3. (Contd.)

13
28 at% Fe, and 11 at% Pu concentrations were detected in layer 3. The fact that layer 2 hadnegligible levels of Fe, Pd, and Pu while notable concentrations of these elements are observed inlayer 3 demonstrates that layer 3 is an actual phase layer. The Pu in layer 3 is evidence of thefurthest penetration of any non-fission product fuel constituent.
Layer 4 was the widest layer (20-28 μm) at location A. A fine second phase was observeddispersed throughout this layer. The compositions reported in Table 3 for this layer correspond toa combination of the dispersed and matrix phases. 10-12 at% of lanthanides is observed in layer4. Why this layer may be associated with the (Fe,Cr,Si)17(Nd,Ce,La)2 phase will be discussedlater.
The second region of the sample where composition information was determined for the layerswas at the right-side of the boxed area of the sample shown in Fig. 5 (location B). An SEMmicrograph of the area analyzed is presented in Fig. 8. The layers were labeled 1–4 and layer 4had a composition very near that of the phase labeled layer 4 at location A. The compositionsobserved for spot readings taken in layers 1–4 are depicted in Table 4.
Table 4. Approximate Compositions of Spot Readings of Phase Layers at Location B of DP16 SEM Sample (in at%)
Layer Fe Cr Mo Si Pu U Ce Nd La Other
1 41 - - 2 15 - 10 21 4 7Pd
1 66 2 - 7 22 - 2 2 2 1Ni,1Ba
1 55 14 0.4 2 3 1 7 15 2 0.4Ni
2 - 28 1 - 5 4 15 39 6 -
3 37 39 2 2 8 2 5 3 1 0.5Mn
4 69 17 - 1 0.2 - 5 6 - 1Mn,0.4Ni

14
Layer 1 appeared to contain different types of fine phases and was not a well-defined layer. Thefirst measurement in Table 3 for layer 1 is for an average area near layer 2. The phase or phases
(a)
(b)
Fig. 8. Backscattered Electron (a) and Secondary Electron (b) Imagesof the Interaction Layers Observed in Location B for the Sample Takenfrom DP16 (the layer to the far left is the same as layer 4 in Fig. 6)
15
in this area contain 35 at% lanthanides, 41 at% Fe, 7 at% Pd, and 15 at% Pu. Two other areaswhere spot readings were taken had different compositions. The second measurement listed inTable 3 was for a small particle (about 5 μm diameter) further into the fuel, and the finalmeasurement in layer 1 was taken at the furthest location in the fuel available, and it containedmore lanthanides and less Pu than did the second measurement.
Layer 2 contained approximately 60 at% lanthanides, 28 at% Cr, and 9 at% U plus Pu and wassimilar in composition and size to the layer 2 shown in Fig. 6. The major difference between thetwo layers was that the layer 2 in Fig. 6 had Cd and Sn, while layer 2 in Fig. 8 had U and Pu. If infact the Cd observed at location B is mainly U (possibly due to overlap of the EDS peaks), thenthe layers at both locations are even more similar.
Layer 3 was approximately 1 μm wide and contained relatively high amounts of Cr (39 at%) andactinides (10 at% U plus Pu). The Fe content was higher and the lanthanide content was lower forthis layer 3 compared to the layer 3 in Fig. 6.
The layer nearest the un-reacted cladding, layer 4, consisted of two-phases, as did the layer 4 inFig. 6. Yet, in Fig. 8 the precipitate phase appeared slightly larger in layer 4 than it did in thelayer 4 in Fig. 6. As a result, attempts were made to determine the concentration of the precipitatephase. The composition listed in Table 3 for layer 4 is the average composition for the matrix andprecipitate phase together. SEM/EDS analysis of the precipitate phase suggested that the precipi-tate phase was lower in Fe (67 at% compared to 72 at%) and Cr (12 at% compared to 17 at%)and had about twice as much lanthanides (15 at% compared to 8 at%) compared to the matrixphase.
2.1.1.2 DP21
DP21 is another HT9 clad fuel element with U-Pu-Zr alloy fuel that is of particular interest,because of its relatively high burn-up of approximately 11.4 at%. DP21 was run as part of thesame fuel assembly as DP16. It exhibited the same major features as were described for DP16.The buildup of lanthanides at the fuel-cladding interface was notable, and these lanthanides com-bined with Fe and Ni from the cladding to form phases. The main features of the fuel-claddinginteraction zones observed in DP16 and DP21 are representative of the smaller amounts of fuel-cladding interaction observed for fuel element T459–a fuel element irradiated to only 3 at%.
2.1.2 HT9-Clad Elements with Binary U-Zr Alloy Fuel
2.1.2.1 DP11
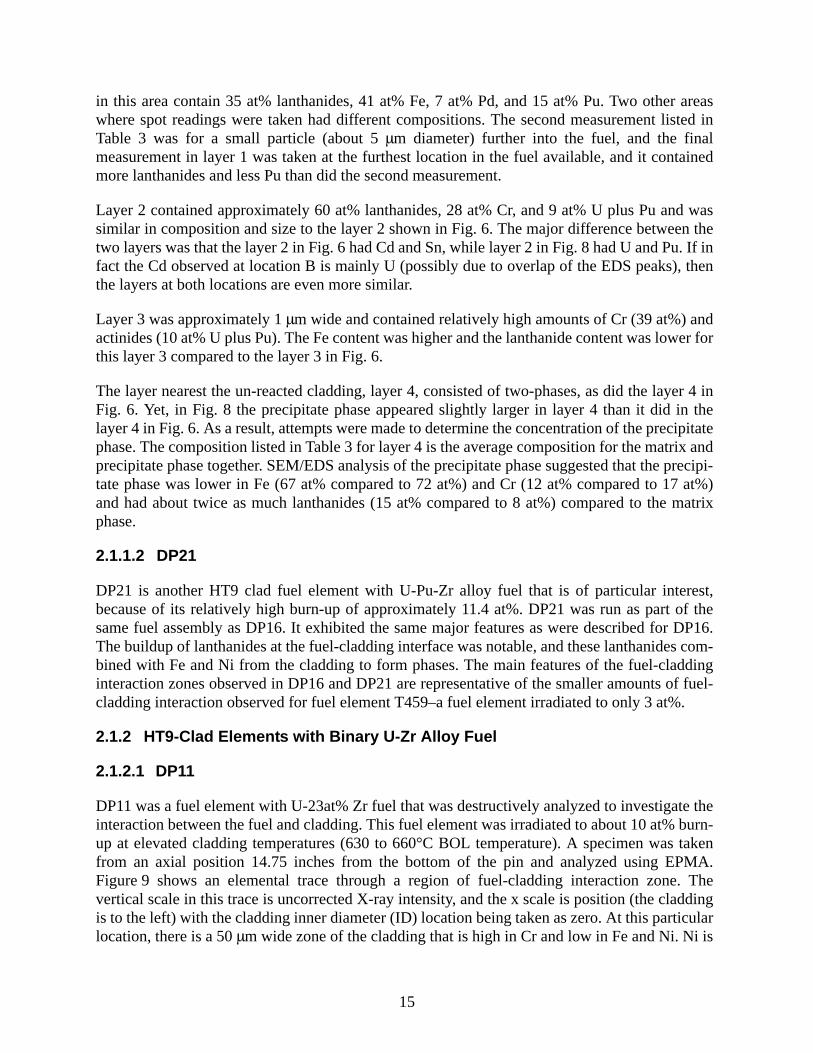
DP11 was a fuel element with U-23at% Zr fuel that was destructively analyzed to investigate theinteraction between the fuel and cladding. This fuel element was irradiated to about 10 at% burn-up at elevated cladding temperatures (630 to 660°C BOL temperature). A specimen was takenfrom an axial position 14.75 inches from the bottom of the pin and analyzed using EPMA.Figure 9 shows an elemental trace through a region of fuel-cladding interaction zone. Thevertical scale in this trace is uncorrected X-ray intensity, and the x scale is position (the claddingis to the left) with the cladding inner diameter (ID) location being taken as zero. At this particularlocation, there is a 50 μm wide zone of the cladding that is high in Cr and low in Fe and Ni. Ni is

16
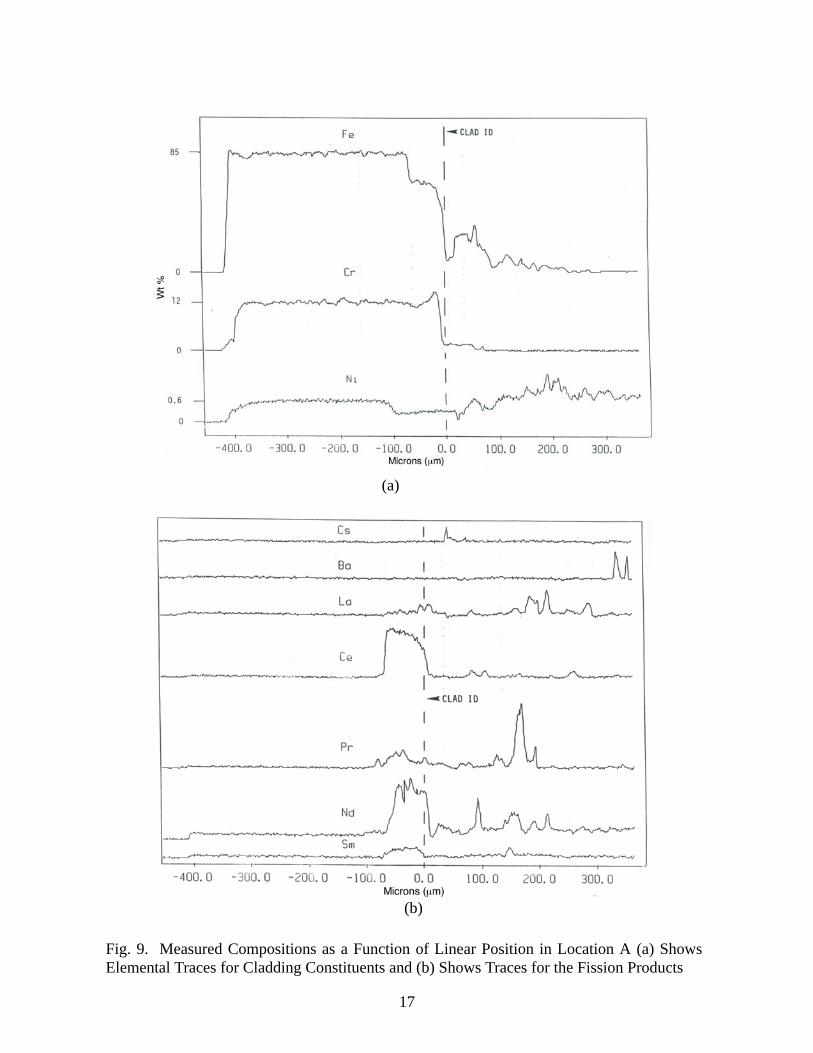
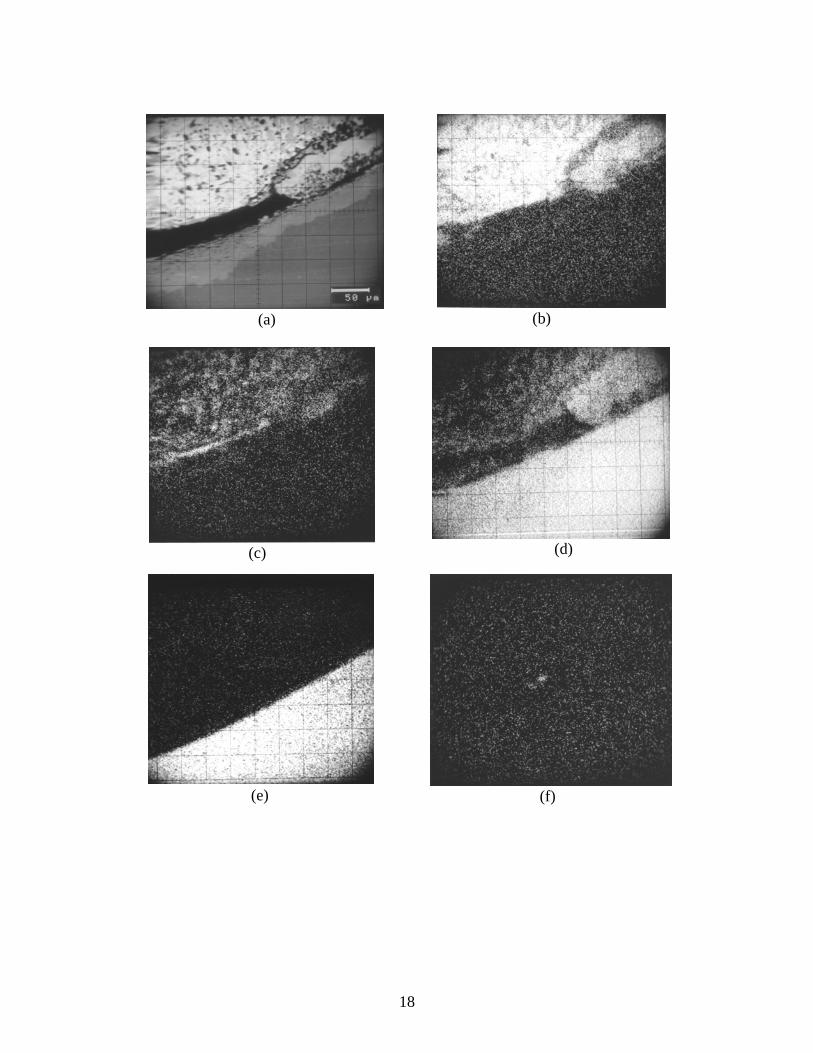
also depleted from the cladding for another 40 μm into the cladding over what is observed for theFe. Into the fuel, Fe has interdiffused around 250 μm and the Ni around 20 μm. In the50 μm wide band in the cladding with high Cr and low Fe and Ni, lanthanide concentrations areelevated. Ce and Nd are the principal elements in this layer and lower levels of La, Pr, and Sm arealso observed. A possible presence of Pd in the fuel-cladding interaction zone is observed, basedon X-ray maps. Figure 10 shows typical X-ray maps taken to identify the locations of the variouscomponents at the fuel-cladding interface.
17
(a)
(b)
Fig. 9. Measured Compositions as a Function of Linear Position in Location A (a) ShowsElemental Traces for Cladding Constituents and (b) Shows Traces for the Fission Products
18
(a) (b)
(c) (d)
(e) (f)
19
(g) (h)
(i) (j)
(k)
Fig. 10. (a) Electron Microprobe Specimen Current Image and X-ray Mapsfor (b) U, (c) Zr, (d) Fe, (e) Cr, (f) Ba, (g) La, (h) Ce, (i) Pr, (j) Nd, and (k) Sm

20
2.1.2.2 DP81
Two specimens were examined from fuel element DP81, an element with U-23Zr fuel and HT9cladding and irradiated to 5 at% burn-up. Samples were cut from positions 0.75 in. and 3.125 in.from the top of the fuel element. Fuel-cladding interaction was observed in the sample taken at0.75 in. but not in the sample taken at 3.125 in. from the top of the element. Based on thepraseodymium penetration into the cladding, the fuel-cladding interaction zone is 70 μm wide.An 80 μm wide band of the cladding was Ni-depleted. Fission product constituents thatpenetrated into the cladding included Ce, Pr, Nd, La, and Sm. Besides a high atomic numberband, a band was also detected where grain boundary penetration of fission products into thecladding had apparently occurred.
2.1.2.3 Breached Fuel Elements
Results from examinations of fuel elements that were kept in the reactor after failure of thecladding have been reported [6]. Failed elements DP75 and DP70 (U-10 wt% Zr fuel and HT9cladding) were analyzed and compared to un-failed elements DP04 and DP11, which had thesame fuel and cladding. Brittle, non-uniform bands of lanthanides were observed to penetrate upto 170 μm into the cladding in DP75, and up to 140 μm into the cladding in DP70 (in the hottestregions of the fuel elements). A maximum of 90 μm of lanthanide penetration was observed inthe un-failed elements DP04 and DP11. The breached fuel elements were run to 10 at% burn-up,had a peak calculated cladding temperature near 660°C, and had up to 45% of the total claddingthickness of 5.84 mm consumed by interaction layers. The un-breached fuel elements exposed tothe same conditions had only 20% of the cladding consumed by layers. Carbon depletion zones(up to approximately 60 μm thick) were observed on the cladding side of the interaction layers.
2.2 Layers in Fuel Elements with D9 or Type 316 Stainless Steel Cladding
D9 and Type 316 stainless steel are austenitic steels that contain appreciable nickel. Those fuelelements clad with these materials imparted slight differences in their observed fuel-claddinginteraction compared to the elements clad with the martensitic (low Ni) stainless steel HT9. Thefuel element T341 was the only element with Type 316 stainless steel cladding that was analyzedto investigate fuel-cladding interaction. Due to its low burn-up of 0.4 at%, negligible fuel-clad-ding interaction was observed. The fuel elements discussed in the context of fuel-cladding inter-action will be the ones clad with D9 stainless steel. The major differences between D9 and Type316 stainless steel is that D9 has more Ni, less Cr, and it contains Ti (Table 1).
2.2.1 D9-Clad Elements with Ternary U-Pu-Zr Alloy Fuel
2.2.1.1 T106
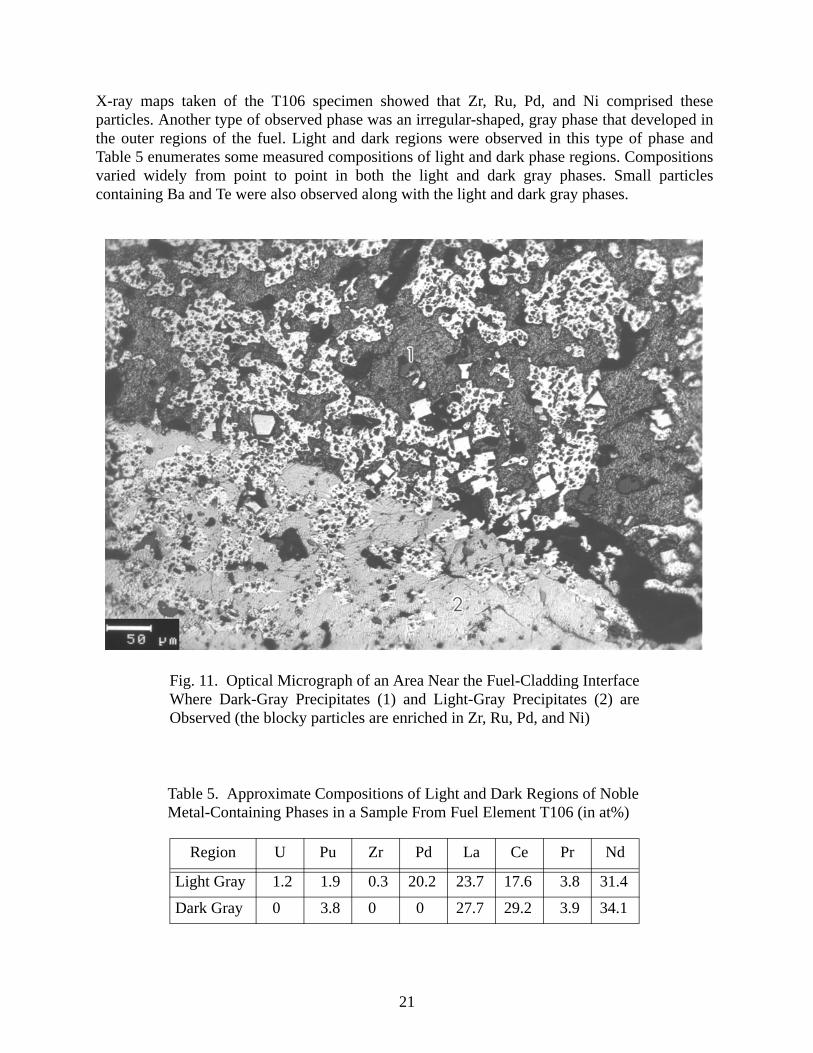
Fuel element T106 had U-16Pu-23Zr fuel and D9 cladding and was irradiated to 17 at% burn-up.The EPMA analysis of T106 investigated the development of fuel-cladding interaction layers,along with the distribution of noble metal fission products in discrete phases in the outerperiphery of the fuel at two different locations in a longitudinally-cut sample. Presented inFig. 11 is an optical micrograph of the fission product-containing phases that were observed atone location in T106. One observed phase was a blocky particle observed throughout the fuel.
21
X-ray maps taken of the T106 specimen showed that Zr, Ru, Pd, and Ni comprised theseparticles. Another type of observed phase was an irregular-shaped, gray phase that developed inthe outer regions of the fuel. Light and dark regions were observed in this type of phase andTable 5 enumerates some measured compositions of light and dark phase regions. Compositionsvaried widely from point to point in both the light and dark gray phases. Small particlescontaining Ba and Te were also observed along with the light and dark gray phases.
Table 5. Approximate Compositions of Light and Dark Regions of NobleMetal-Containing Phases in a Sample From Fuel Element T106 (in at%)
Region U Pu Zr Pd La Ce Pr Nd
Light Gray 1.2 1.9 0.3 20.2 23.7 17.6 3.8 31.4
Dark Gray 0 3.8 0 0 27.7 29.2 3.9 34.1
Fig. 11. Optical Micrograph of an Area Near the Fuel-Cladding InterfaceWhere Dark-Gray Precipitates (1) and Light-Gray Precipitates (2) areObserved (the blocky particles are enriched in Zr, Ru, Pd, and Ni)

22
At another location in the fuel (Fig. 12), blocky particles were observed and analyzed. Theseparticles contained Zr, Mo, Tc, Ru, Rh, and Pd, based on X-ray maps. Nickel, which wasobserved in similar blocky particles in another area of the fuel, was not seen in these particles.
The fuel-cladding interaction zone itself in T106 was a fairly continuous band around the innerdiameter of the cladding. About 20 μm of interaction was observed in the analyzed sample, and itconsisted of two layers. Element maps for the interaction zone showed that the Fe and Crconcentration levels are slightly enriched in the interaction zone, and the Ni is depleted. Theinteraction zone contained Ce, La, Pr, Nd, Pd, and Sn. Evidence of minor amounts of Pu in theinteraction zone was additionally observed.
2.2.1.2 T112
Fuel element T112 had U-16Pu-23Zr fuel and D9 cladding and was irradiated to 11.9 at% burn-up. Metallographic specimens were taken from this element at locations 3.5, 7.5, 13.5, and 14.25inches from the top of the element. The specimen taken at the hottest part of the pin (14.25 in.)exhibited the most fuel-cladding interaction (approximately 70 μm). Figure 13 shows theobserved interaction layers in this region of the pin, along with the indentation marks left behind
Fig. 12. Optical Micrograph Showing the Presenceof Blocky Particles Near the Fuel-Cladding Interface

23
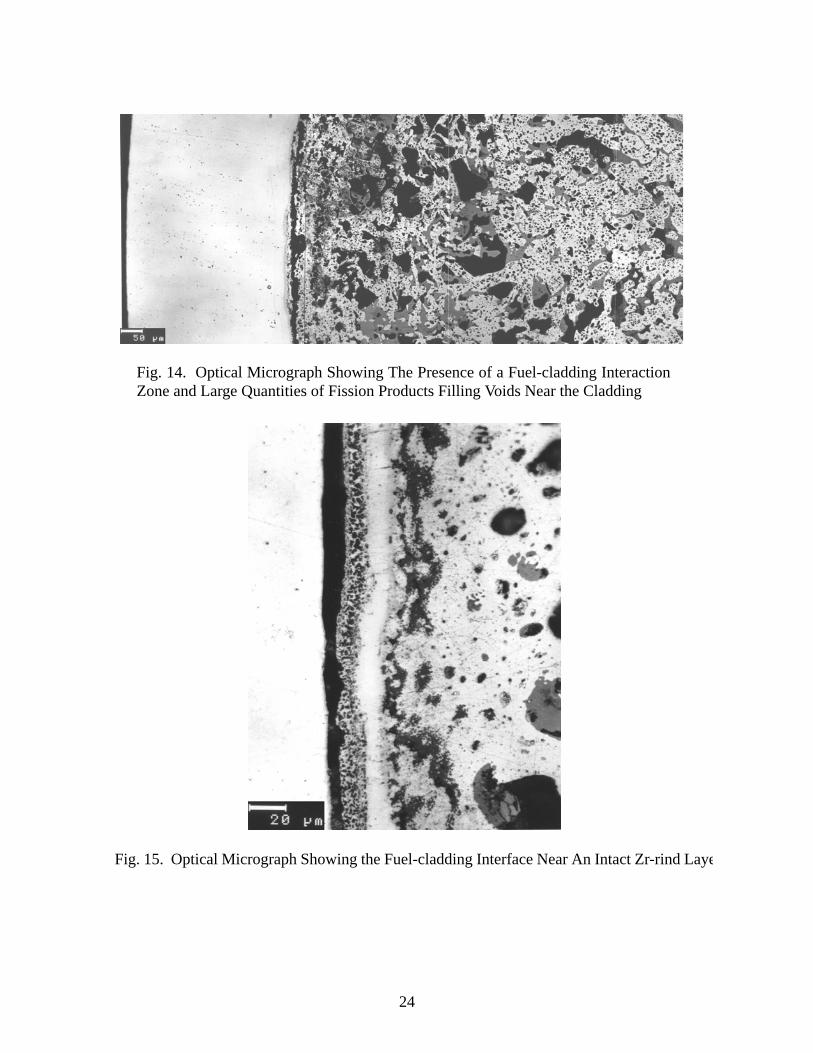
from hardness testing that was performed on the sample. The interaction zone and un-reactedcladding exhibited hardness values of approximately 1100 and 350 DPH, respectively. Theinteraction layers observed in the cladding of a sample taken from a position of 13.5 in. arepresented in Fig. 14 (also note the light and dark contrast fission product phases that can be foundin the outer periphery of the fuel). In Fig. 15, the fuel-cladding interface at an axial position of3.5 is shown. An intact layer of Zr-rind, which is a thin layer on the outer surface of the fuel alloythat is produced during the injection casting of fuel using quartz molds, is apparent along withdark-contrast fission product phases that exist at the outer periphery of the fuel. No fuel-claddinginteraction is observed where the Zr-rind is intact.
Fig. 13. Optical Micrograph Showing the Presence of an Interaction Zoneat the Fuel-Cladding Interface (hardness indents reveal the increasedhardness of the interaction zone vis-a-vis the un-reacted cladding)
24
Fig. 14. Optical Micrograph Showing The Presence of a Fuel-cladding InteractionZone and Large Quantities of Fission Products Filling Voids Near the Cladding
Fig. 15. Optical Micrograph Showing the Fuel-cladding Interface Near An Intact Zr-rind Laye
25
2.2.1.3 T087
EPMA was performed on the D9-clad fuel element T087, which had U-16Pu-23Zr fuel and wasirradiated to 10 at% burn-up. In addition to the original fuel and cladding components, the fissionproducts Tc, Pd, Cs, Ba, La, Ce, Pr, Nd, Sm, Eu, and Gd were detected in the fuel. A narrowreaction band was identified on the cladding side of the fuel-cladding interface. The band provedto have elevated concentration levels of Zr, Ce, Pr, Nd, La, and Sm, and was heavily depleted inNi and partially depleted in iron from the levels noted in the original unreacted cladding. On thefuel side of the fuel-cladding interface, discrete, globular, lanthanide-rich phases were detected.Some of these phases had relatively high levels of palladium.
2.2.1.4 T159
EPMA of this fuel element (U-16Pu-23Zr fuel with D9 clad) showed that even at a low burn-upof 3 at% redistribution of fuel and fission product constituents results in elevated levels of U, Pu,Zr and fission products at the fuel-cladding interface. Little evidence of actual fuel-claddinginteraction was observed in this fuel element.
2.2.1.5 A850
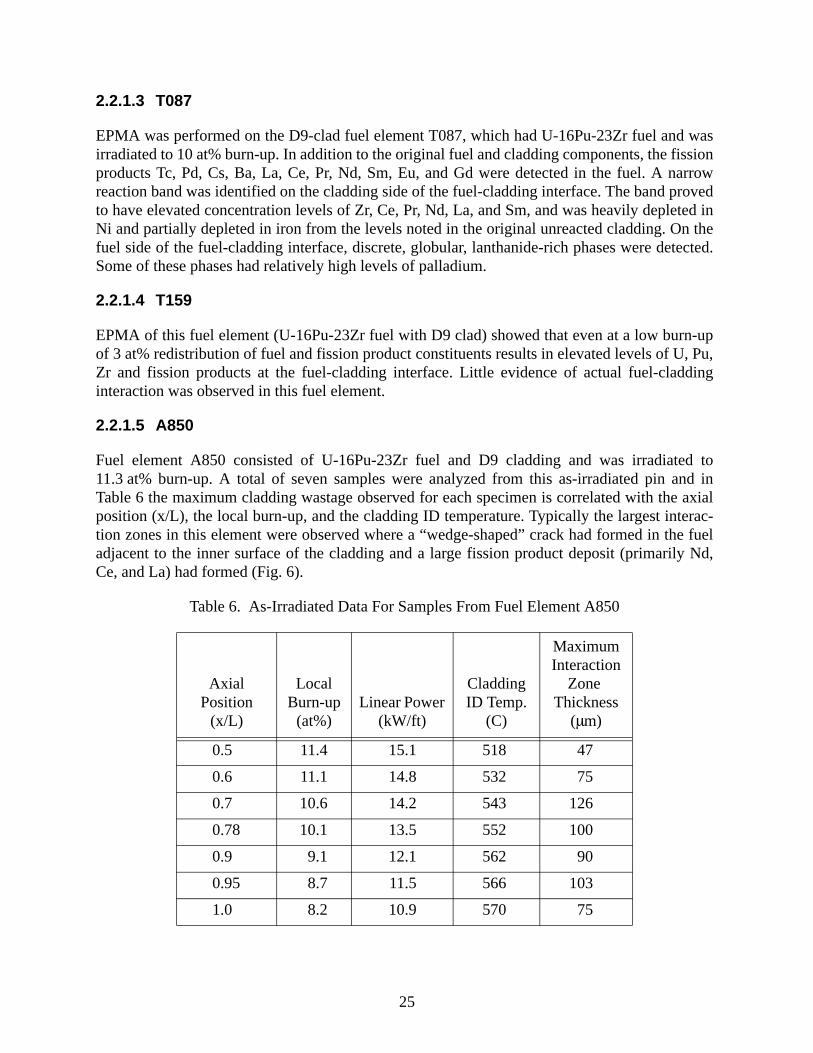
Fuel element A850 consisted of U-16Pu-23Zr fuel and D9 cladding and was irradiated to11.3 at% burn-up. A total of seven samples were analyzed from this as-irradiated pin and inTable 6 the maximum cladding wastage observed for each specimen is correlated with the axialposition (x/L), the local burn-up, and the cladding ID temperature. Typically the largest interac-tion zones in this element were observed where a “wedge-shaped” crack had formed in the fueladjacent to the inner surface of the cladding and a large fission product deposit (primarily Nd,Ce, and La) had formed (Fig. 6).
Table 6. As-Irradiated Data For Samples From Fuel Element A850
AxialPosition
(x/L)
Local Burn-up
(at%)Linear Power
(kW/ft)
Cladding ID Temp.
(C)
MaximumInteraction
Zone Thickness
(μm)
0.5 11.4 15.1 518 47
0.6 11.1 14.8 532 75
0.7 10.6 14.2 543 126
0.78 10.1 13.5 552 100
0.9 9.1 12.1 562 90
0.95 8.7 11.5 566 103
1.0 8.2 10.9 570 75

26
For a sample taken at x/L=0.78, three different areas were analyzed at the fuel-cladding interface.The first area that was analyzed was near a “wedge-shaped” crack in the fuel that had been filledin with fuel. The second area contained a thin band (about 40 μm thick) of lanthanidessandwiched between the fuel and the cladding. The last location was near a fuel crack, like thatseen in Fig. 16. The bulk of the iron diffusion was observed in the first area analyzed. At the“wedge-shaped” crack location, iron penetrated into the fuel to a maximum depth of about175 μm, and the concentration of iron in local spots in the fuel was as high as 25 wt%. No ironpenetration into the fuel was observed at the other two analyzed areas.
Nickel interdiffuson was observed in all three locations analyzed (about 180 to 200 μm into thefuel) leaving a nickel depleted layer in the cladding; the nickel concentrations varied between 6and 12 wt% in the fuel. Zirconium and nickel appeared to collocate in the fuel especially adjacentto the cladding. With regards to plutonium behavior, the high concentrations of nickelcorresponded to local depletions of plutonium in the fuel, while in the cladding, elevated levelsof plutonium were observed in the nickel depleted region. The highest amount of plutoniuminterdiffusion was observed in the first area analyzed. Here was noted the highest levels of irondepletion from the cladding and the most elevated concentration levels for Pu in the cladding.The lanthanide interdiffusion behavior appeared to mirror that of the plutonium, and they were
Fig. 16. Optical Micrograph Showing Fuel-Cladding Interaction (whitearrows) Adjacent to a Large Deposit of Lanthanide Fission Products

27
found to interdiffuse to similar depths in the cladding. Cerium and neodymium were the mostabundant lanthanides at all three locations, and lanthanum was the only other fission productobserved in a measurable concentration. Uranium and zirconium did not penetrate into thecladding at any of the locations analyzed. The maximum lanthanide penetration was seen wherelanthanide phases appeared to be in direct contact with the cladding.
As was the case for fuel element DP16 (an HT9 clad element), two differing contrast phases wereobserved in the vicinity of the fuel-cladding interface in element A850. These phases containeddiffering amounts of lanthanides; the lightest phase also contained palladium and ruthenium. Forthe sample sliced at an x/L position of 0.6, the boundary between the light and dark phases wasseen around 200 μm from the fuel-cladding interface. For x/L positions of 0.7 and 0.95, theboundary was observed 170 and 150 μm, respectively, from the interface. The 0.95 position wasthe highest temperature region of the pin, and this is where the light and dark phases seemed tobe closest to the cladding. Therefore, the local temperature in a fuel element appears to controlhow close the light and dark phases will be observed in relation to the fuel-cladding interface.
2.2.1.6 T042
For the sample from element T042 (which was irradiated to 6 at% burn-up), approximately20 μm of interaction was observed along with the presence of lanthanide fission products in theinteraction zone. T042 was the only element analyzed that had a fuel alloy with a composition ofU-7Pu-23Zr. Another fuel element that was analyzed after 6 at% burn-up had U-16Pu-23Zr fuel(no identifying number for this element could be found); the maximum amount of interactionequaled 75 μm. Lanthanide fission products were observed in the interaction zone along with evi-dence of Ni and Fe depletion. The Ni was depleted to around 1 wt% from the original 16 wt%that existed in the original cladding, and the Fe was depleted from 67 wt% to 59 wt%.
2.2.2 D9-Clad Elements with Binary U-Zr Alloy Fuel
2.2.2.1 T141
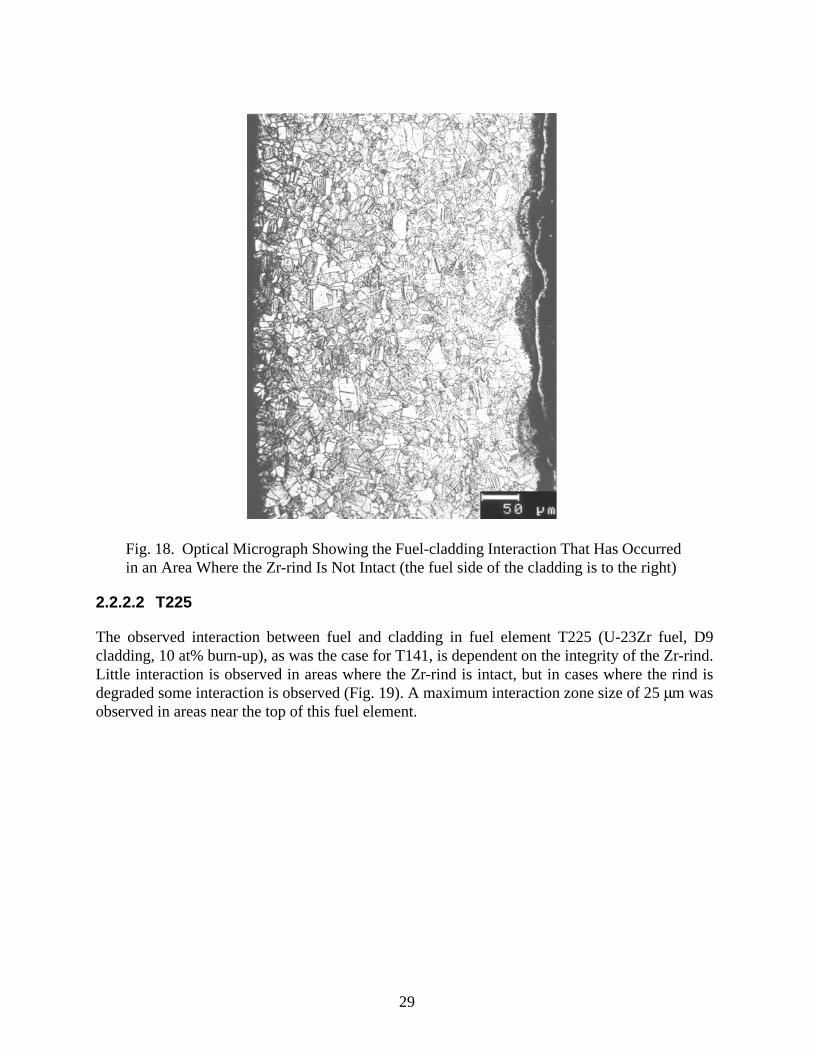
In fuel element T141 (U-23Zr fuel, D9 cladding, 11.9 at% burn-up) the original Zr-rind from theinjection casting of the fuel provided protection from fuel-cladding interaction. As shown inFig. 17, interaction layers were only observed in the cladding in areas where the Zr-rind hadfailed. The maximum interaction layer thickness (25 μm) was observed in the sample taken fromthe hottest region of the pin (an axial position of 14.25). This area of maximum interaction layerformation is presented in Fig. 18. Near the cladding, small amounts of fission product-containingphases were observed, may be due to the high amounts of fuel porosity that was observed nearthe cladding. As discussed earlier, T112, a fuel element with U-16Pu-23Zr fuel and D9 cladding,was also irradiated to 11.9 at% burn-up (just like T141). Yet, T141 had a smaller interactionzone, which may be correlated to it having binary U-23Zr fuel.

28
(a)
(b)
Fig. 17. Optical Micrographs Showing A Low Magnification Image (a) andHigh Magnification Image (b) of the Fuel-cladding Interface Where The Zr-rindIs Not Intact and Interaction Has Occurred Between the Fuel and Cladding
29
2.2.2.2 T225
The observed interaction between fuel and cladding in fuel element T225 (U-23Zr fuel, D9cladding, 10 at% burn-up), as was the case for T141, is dependent on the integrity of the Zr-rind.Little interaction is observed in areas where the Zr-rind is intact, but in cases where the rind isdegraded some interaction is observed (Fig. 19). A maximum interaction zone size of 25 μm wasobserved in areas near the top of this fuel element.
Fig. 18. Optical Micrograph Showing the Fuel-cladding Interaction That Has Occurredin an Area Where the Zr-rind Is Not Intact (the fuel side of the cladding is to the right)

30
(a)
(b)
Fig. 19. Optical Micrographs of a Transverse Cross-section Taken From The Bottomof Element T-225 (figure (a) is a low magnification image where the black arrowsidentify some of the areas where the Zr-rind is not intact and fuel-cladding interactionhas occurred, figure (b) is a higher magnification image of one of these areas)
31
2.2.2.3 C709
In a transverse cross-section taken from element C709 (U-23Zr fuel, D9 cladding, 9.3 at% burn-up), two regions near the fuel-cladding interface were analyzed using EPMA. In both regions,complex multiphase diffusion structures were noted. By moving through the interaction zonestarting with the un-reacted cladding and going towards the fuel, the first phase layer that wasobserved contained Fe, Cr, and some lanthanides (no Ni). The next layer consisted of Fe, Cr,lanthanides and some Ni. This layer was followed by two lanthanide layers with and without Pdand Sn (the layer without Pd and Sn was towards the cladding), and a layer containing Zr, Ni, andFe (and some Si). Closest to the un-reacted fuel was a multiphase layer, where the matrix phasewas enriched in U. A precipitate phase containing Zr, Ni, and Fe was present on the clad-side ofthe layer, and a precipitate phase containing only Zr and Ni was present closer to the center of thefuel element. Lanthanides were not present in high amounts on the clad-side of this zone butwere observed towards the fuel-side.
The second region of the sample that was analyzed had similar interdiffusion zones compared tothe first. Again going from the un-reacted cladding towards the fuel center, the layers observedincluded: (1) a layer containing Fe and Cr (with negligible Ni); (2) a layer with Fe, Nd, Ce, La,and minor amounts of Ni; (3) a Zr-rich layer with Ni and smaller amounts of Fe; (4) phase withNd, Ce, La, and Pd; (5) a U layer with Fe + Zr precipitates (the layer was devoid in lanthanides);and (6) a layer with a U-matrix and lanthanide phases, Zr + Ni phases, and Fe+Zr phases.
3. Discussion
3.1 Phases Found at the Fuel-Cladding Interface in Irradiated U-Zr and U-Pu-Zr Fuel Elements Clad with D9, Type 316, or HT9 Stainless Steel
Based on the results from analyses of fuel elements with U-Zr and U-Pu-Zr alloy fuels and D9,Type 316, and HT9 stainless steel cladding that were irradiated in EBR-II, a variety of phaseshave been observed to form locally where swelled fuel has contacted the cladding. At theinterface between the fuel and the cladding, the observed phases on both sides of the interfacecombine the cladding elements Fe, Ni, and Cr with the fuel components U, Zr, and Pu and thelanthanide fission products. Some of these phases near the fuel-cladding interface contain Pd andRu.
Looking at the cladding-side of the original fuel-cladding interface, the developed phases areenriched in cladding components and they contain differing amounts of the primary fuelcomponents (U, Pu, and Zr) and fission product components. The lanthanide fission products areobserved to penetrate furthest into the cladding (Ce and Nd appear to penetrate the furthest), inboth HT9 and D9–clad fuel elements. This penetration results in the development of phasescontaining Ce, Nd, and La nearest the un-reacted cladding.
Fuel element DP16 (U-16Pu-23Zr fuel and HT9 cladding) was the fuel element analyzed in thegreatest detail (using OM, SEM, and EPMA), and it provided the most information for trying todetermine specific phases that may form on the cladding-side of the fuel-cladding interface. Inparticular, a lanthanide–Fe type of intermetallic phase, linked to the binary Ce-Fe phase diagram,may be the most likely phase to develop nearest the unreacted cladding. Tortorici and Dayananda
32
[7] determined via a diffusion couple technique that when a diffusion couple between HT9 andCe is assembled and annealed at 425°C for seven days two single–phase layers form. Of the twolayers, the phase layer adjacent to the un-reacted cladding is similar in composition andmorphology to the one observed for fuel element DP16 (layer 4 in Table 1). By ratioing the Ceconcentration (13 at%) with the sum of the concentrations for the cladding components [Fe(71 at%) + Cr (16 at%) + Ni (<1 at%)], Tortorici and Dayananda determined this phase layer tobe a Ce2(Fe+Cr+Ni)17 phase. (A (lanthanide)2Fe17 is the only possible intermetallic phase thatcan form at lower lanthanide concentrations based on binary phase diagrams between Fe and thelanthanides Ce, Nd, Sm, and Pr. La when combined with Fe does not form a La2Fe17 phase, andlanthanum is not observed in noticeable levels in what has been labeled the(lanthanide)2(Fe+Cr+Ni)17 phase in DP16. Based on the same phase diagrams, the likelyintermetallic to form at higher lanthanide concentrations is a (lanthanide) Fe2 phase.) This phaseis similar to the Ce2Fe17 described in the Ce-Fe binary phase diagram [8]. Using the sameapproach for labeling the phase layer that forms adjacent to the un-reacted cladding in the DP16fuel element, layer 4 in Fig. 6 and Fig. 7 appears to also consist of a (Ce+Nd)2(Fe+Cr+Ni)17phase.
Besides the (Ce+Nd)2(Fe+Cr+Ni)17 phase, other types of phases appear on the cladding-side ofthe fuel-cladding interaction zone in DP16 that have different ratios of cladding components tolanthanides. These phases also contain Pu and Pd, and minor amounts of other components. InDP16 and the other analyzed fuel elements, deep penetration of Pu into the cladding is observed,along with penetration of U. Zr does not penetrate far, but instead stays near the original fuel-cladding interface and combines with primarily cladding components to form Zr-rich phases.
On the fuel-side of the fuel-cladding interaction zone, some phases are observed that are enrichedin the fuel constituents U, Pu, or Zr and contain Fe or Ni as the major non-fuel or components(with some lanthanides). Other phases are observed that contain primarily lanthanides. When thelow-nickel stainless steel HT9 is employed as cladding in a fuel element, Fe is observed topenetrate the deepest into the fuel of any cladding constituent. As a result, the phases found onthe fuel-side of the interface in these fuel elements contain more Fe than any other claddingcomponent. The fuel component that appears to combine with the Fe is Zr. For fuel elements cladwith the austenitic stainless steel D9, Ni diffuses much further into the fuel, and it is found tocombine with Zr. Fe also diffuses into the fuel and forms phases. An Fe and Ni depletion zone isobserved in all the fuel elements, with the depletion of the Ni extending further into the claddingthan the depletion of the Fe.
Pd is the non-lanthanide fission product that is found to interdiffuse farthest into the cladding.Looking at the results from DP16, the phase layer with the most Pd also had levels of Ce, Nd, andPu that were also reasonably high. In a case where Pd did not penetrate far into the cladding, thePd was found in a phase layer where the Ce and Nd levels were still high but the Puconcentration had dropped off and the Zr concentration was high. From binary phase diagramsthat combine the lanthanides Ce or Nd with Pd, it is observed that many intermetallic phases canform between any lanthanide and Pd. In layers 1 and 3 of the DP16 SEM sample shown in Fig. 6,notable amounts of Ce, Nd, and Pd are detected. These concentration levels could be indicating
33
the formation of one or more (Ce+Nd)-Pd phases that have some solid solubility for other fueland cladding constituents.
3.2 Factors Affecting Interaction Zone Thickness in Irradiated Fuel Elements
In general, interaction zone formation is localized. In many of the analyzed fuel elements, fuel-cladding interaction can be linked to the integrity of the Zr-rind. In cases, where the Zr-rind isfailed, some of the thickest interaction zones can be observed. The Zr-rind is most likely toremain intact in fuel elements exposed to lower temperatures and lower power.
Both temperature and power variations along the length of a fuel element appear to impact theamount of fuel-cladding interaction that will occur. The temperature increases along the length ofa fuel element and reaches a maximum at the top. The power variation is a dropped cosine. Thefuel element region exposed to the maximum power and temperature combination is located nearan x/L position of 0.80. The maximum fuel-cladding interaction is observed in this combinedhigh temperature and high power region of a fuel element. In this region of a fuel element, theinterdiffusion kinetics are increased and the supply of fission products at the fuel-claddinginterface is large. The result can be some of the largest observed interaction zones.
The burn-up of a fuel pin is another parameter that impacts the size of the fuel-claddinginteraction zone. Larger interaction zones are observed for higher-burn-up fuel elements. Onereason for the larger zone size is the larger inventories of fission products that are available at thefuel-cladding interface in high-burn-up fuel elements. More lanthanides diffuse down thetemperature gradient that exists from the center towards the outer edge of a fuel element therebyincreasing the inventory of fission products at the interface. Also, a high-burn-up fuel elementhas been at relatively high temperatures for long periods of time, resulting in more available timefor interdiffusion between fuel and cladding components to occur. Another fuel element attributethat impacts fuel-cladding interaction is the position of a fuel element in the core of the reactor,since this helps determine the burn-up of the fuel element. In addition, the peak inner claddingtemperature will vary based on core position, and this will impact the interdiffusion kinetics. Fuelelements at the hotter core positions can exhibit increased interdiffusion at the fuel-claddinginterface over those at colder positions.
3.3 Potential Components to be Carried Over into a Metal Waste Form
As mentioned earlier, when fuel elements are chopped into small segments and placed into anelectrorefiner to dissolve away the U-Zr or U-Pu-Zr alloy fuel, conditions will be controlled sothat the cladding hulls, Zr, and noble metal fission products will be purposefully left behind inthe anode dissolution baskets. The leftover material will then be cast into a metal waste form.Based on the investigation described above, a potential exists for an additional carryover, withthe cladding hulls, of some non-noble-metal fission products and non-Zr fuel components. Thenon-noble-metal fission products include the lanthanide elements and the non-Zr fuel constitu-ents include U and Pu.
The potential for carryover would be most likely for the fuel elements with the largest fuel-cladding interaction zones, i.e. the high-burn-up fuel elements. In the high-burn-up fuelelements, the largest fuel-cladding interaction zones should exist in the highest temperature
34
regions of the fuel element. Even in these high-burn-up fuel elements, any carryover oflanthanides, U, or Pu would only be in very minor amounts, based on the size of the interactionlayers that have been observed to form in analyzed fuel elements. On the other hand, ifelectrorefiner conditions are favorable, the interaction layers that can exist on the inner surfacesof cladding hulls will dissolve, and the lanthanides, U, and Pu will not be present with thecladding hulls, and will not be incorporated into the metal waste form.
4. Conclusions
Results from the destructive analyses of nineteen irradiated fuel elements from EBR-II have beenassessed in the context of fuel-cladding interaction. Based on these results, the followingconclusions can be made:
1. Of the fuel and fission product constituents, the lanthanide fission productspenetrate the deepest into HT9 and D9 cladding; these components form phaseswith Fe, Ni, and Cr.
2. For fuel elements with U-Pu-Zr alloy fuel, Pu is the primary fuel constituent thatpenetrates furthest into the cladding; for U-Zr alloy fuel, U penetrates the deepestinto the cladding.
3. Of the cladding constituents, Fe and Ni are observed to diffuse into the fuel to formphases with U, Pu, and Zr. A significant Ni-depletion band is observed to form inthe austenitic cladding, D9. Cr becomes enriched at the fuel-cladding interface anddoes not penetrate far into the fuel.
4. Near the fuel-cladding interface, light and dark contrast phases can be observed onthe fuel-side of the interface that contain lanthanide fission products and Pd. Blockyparticles containing Zr, Mo, Tc, Ru, Rh, and Pd are observed in the fuel near thecladding.
5. The Zr-rind in the fuel is a barrier to fuel-cladding interaction, and it is most likelyto remain intact in fuel elements exposed to relatively lower temperatures and lowerpower.
6. Maximum fuel-cladding interaction occurs at the combined high power and hightemperature region of a fuel element. The largest penetrations into the cladding areobserved for fuel elements with ternary U-Pu-Zr fuel and D9 cladding.
7. If interaction layers that reside on the inner surface of cladding hulls do not dissolvein the electrorefiner, then minor amounts of lanthanide fission products, U, and Puwill be found in the metal waste form.
35
Acknowledgments
The support of the U. S. Department of Energy under contract W-31-109-ENG-38 is gratefullyacknowledged. Adam Cohen is acknowledged for his assistance in collecting information toinclude in this report.
36
REFERENCES
1. J. E. Battles, J. J. Laidler, C. C. McPheeters, and W. E. Miller, “Pyrometallurgical Process forRecovery of Actinide Elements,” Actinide Processing: Methods and Materials, 135-151, TheMinerals, Metals, & Materials Society, Warrendale, PA (1994).
2. C. Pereira, M. A. Lewis and J. P. Ackerman, “Overview of Mineral Waste Form Developmentfor the Electrometallurgical Treatment of Spent Nuclear Fuel,” Proc. of the Embedded Topicalon DOE Spent Nuclear Fuel and Fissile Material Management, Reno, NV, 129,(June 16-20, 1996).
3. S. M. McDeavitt, D. P. Abraham, and D. D. Keiser, Jr., “Alloy Waste Forms for Metal FissionProducts and Actinides Isolated by Spent Nuclear Fuel Treatment,” Proceedings of the SecondInternational Symposium on Extraction and Processing for the Treatment and Minimizationof Wastes, Scottsdale, AZ, 177, (Oct. 27-30, 1996).
4. G. L. Hofman and L. C. Walters “Metallic Fast Reactor Fuels” Materials Science andTechnology: A Comprehensive Treatment, 10:1-43, VCH Publishers Inc. (1994).
5. R. G. Pahl, D. L. Porter, C. E. Lahm, and G. L. Hofman, “Experimental Studies of U-Pu-ZrFast Reactor Fuel Pins in the Experimental Breeder Reactor-II,” Met. Trans. 21A-1863 (1990).
6. R. G. Pahl, C. E. Lahm, and S. L. Hayes, “Performance of HT9 Clad Metallic Fuel at HighTemperatures,” J. Nucl. Mater. 204:141 (1993).
7. P. C. Tortorici and M. A. Dayananda, “Interdiffusion of Cerium in Iron-Nickel-ChromiumAlloys,” Thesis, Purdue University, (May 1993).
8. T. B. Massalski, Binary Alloy Phase Diagrams, Second Edition, American Society of Metals,Materials Park, OH,1058 (1990).