ftth deployment in ireland: eir's experiences (workshop ftth eu conference 2016)
TRANSCRIPT

FTTH Council Europe, February 2016
FTTH deployment in Ireland: Eir’s
experiences
David Renehan
Dave Bolsdon
Jonas Verstuyft

Speakers
2
Dave Bolsdon
GE
Jonas Verstuyft
FiberPlanIT
David Renehan
Eir

Introduction to Ireland and Eir
David Renehan
3
Ireland
4
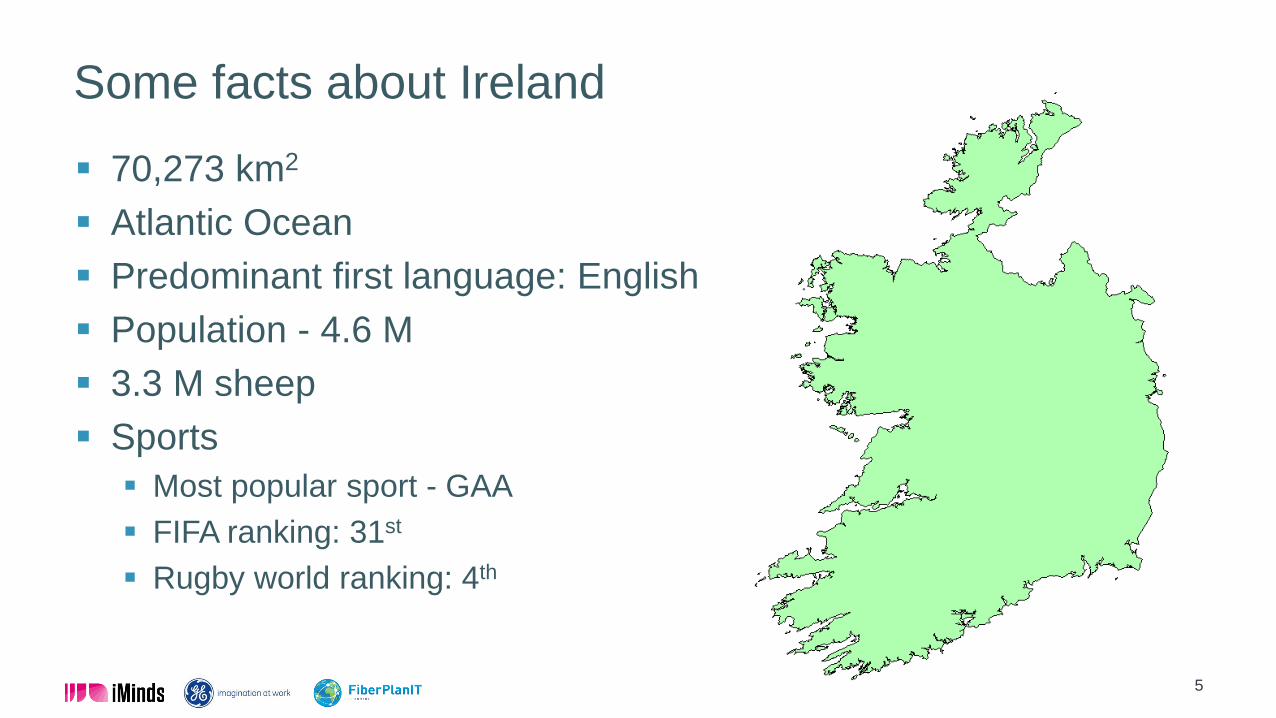
Some facts about Ireland
70,273 km2
Atlantic Ocean
Predominant first language: English
Population - 4.6 M
3.3 M sheep
Sports
Most popular sport - GAA
FIFA ranking: 31st
Rugby world ranking: 4th
5
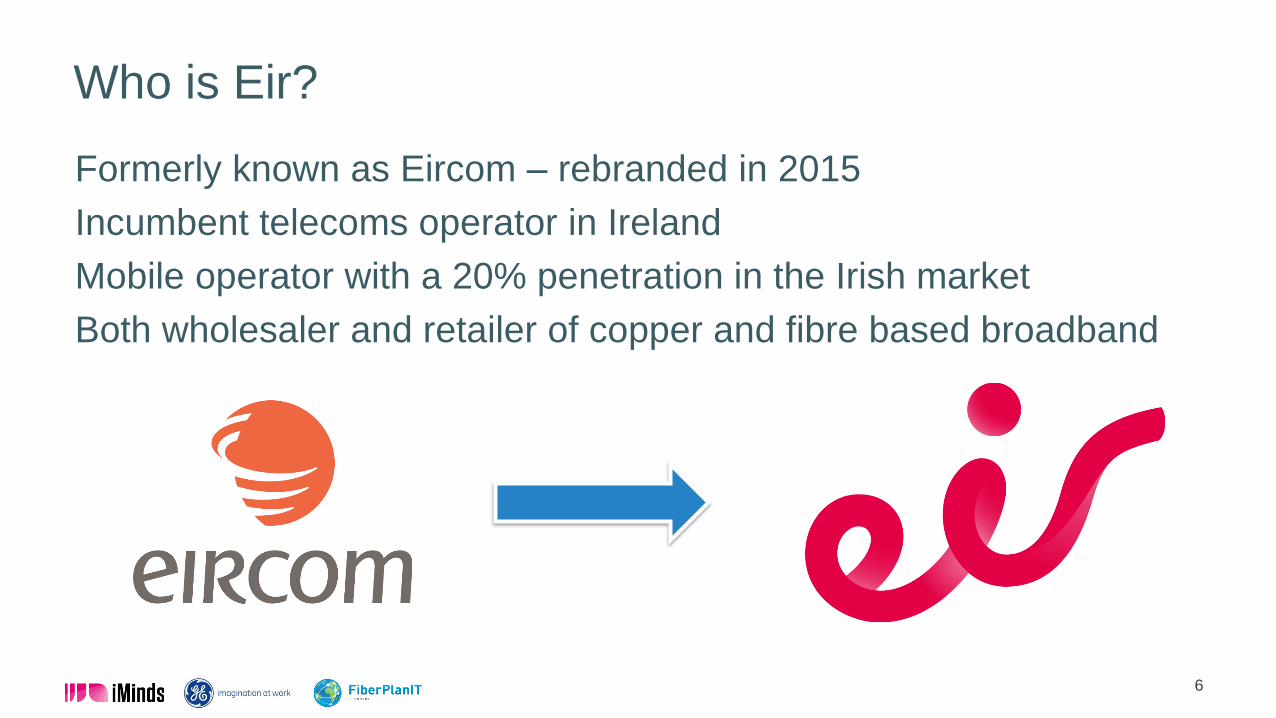
Who is Eir?
Formerly known as Eircom – rebranded in 2015
Incumbent telecoms operator in Ireland
Mobile operator with a 20% penetration in the Irish market
Both wholesaler and retailer of copper and fibre based broadband
6
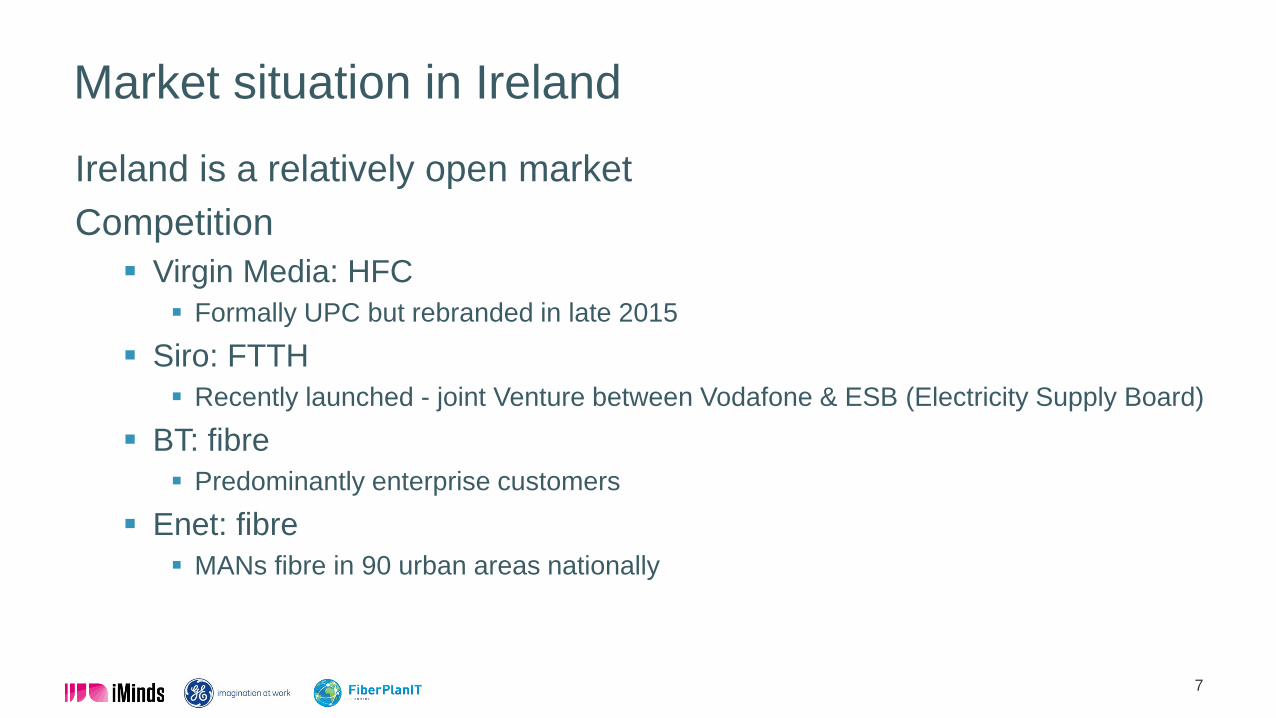
Market situation in Ireland
Ireland is a relatively open market
Competition
Virgin Media: HFC
Formally UPC but rebranded in late 2015
Siro: FTTH
Recently launched - joint Venture between Vodafone & ESB (Electricity Supply Board)
BT: fibre
Predominantly enterprise customers
Enet: fibre
MANs fibre in 90 urban areas nationally
7
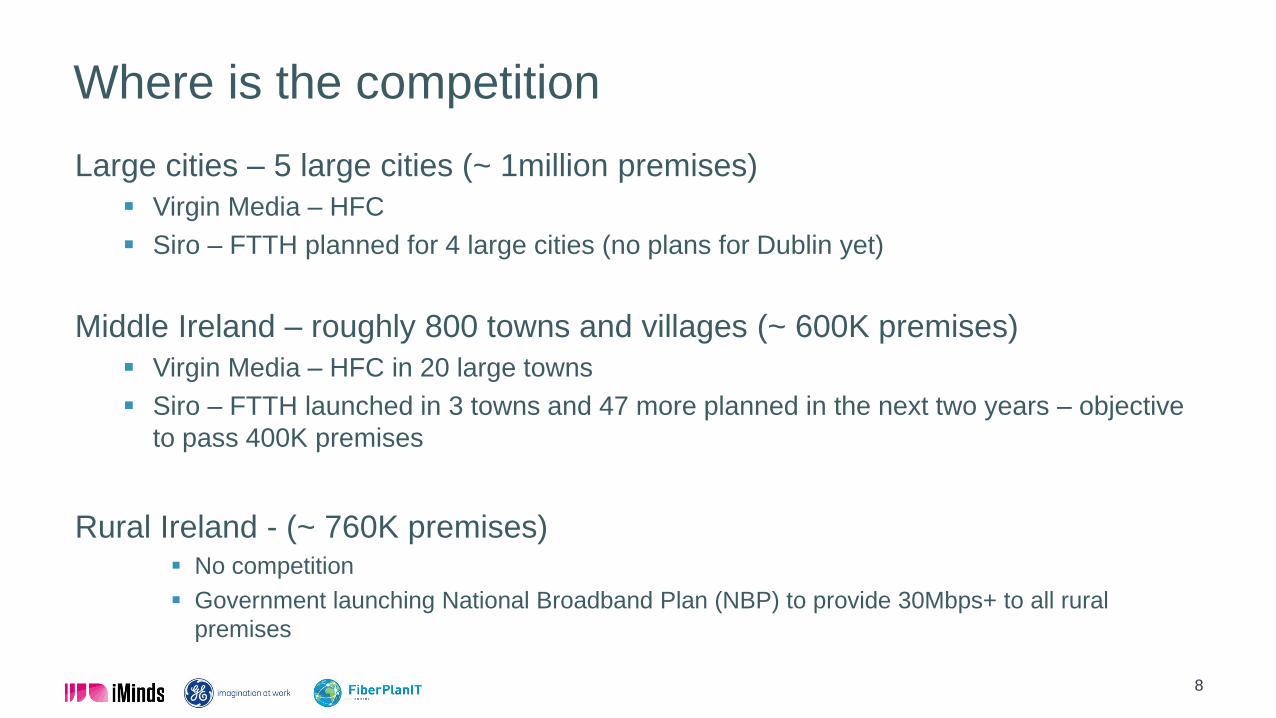
Where is the competition
Large cities – 5 large cities (~ 1million premises)
Virgin Media – HFC
Siro – FTTH planned for 4 large cities (no plans for Dublin yet)
Middle Ireland – roughly 800 towns and villages (~ 600K premises)
Virgin Media – HFC in 20 large towns
Siro – FTTH launched in 3 towns and 47 more planned in the next two years – objective
to pass 400K premises
Rural Ireland - (~ 760K premises) No competition
Government launching National Broadband Plan (NBP) to provide 30Mbps+ to all rural
premises
8

Irish National Broadband Plan
Objectives
First 50% of population: 70-100+ Mbps
Next 20-35% of population: >40 Mbps
100% of population: >30 Mbps
Public funds: 175M EUR (~50% subvention)
Rural Coverage
610,000 households
150,000 business
9
NGA
NBP
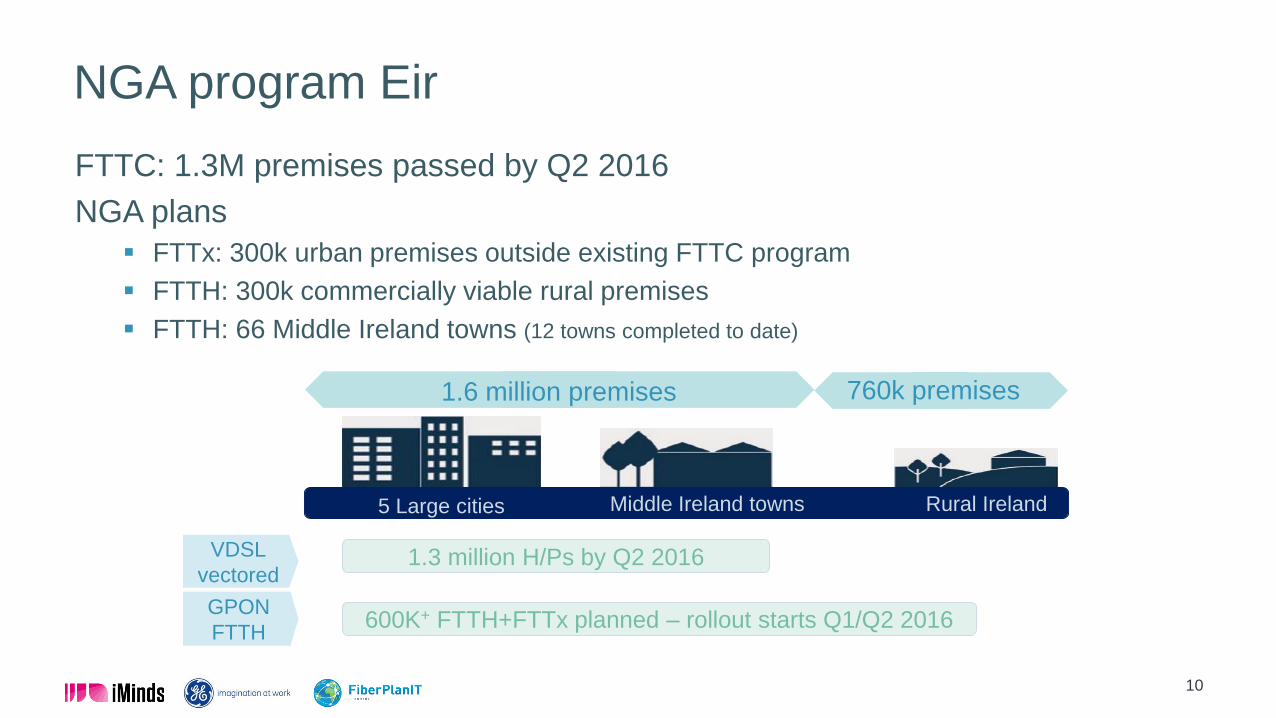
NGA program Eir
FTTC: 1.3M premises passed by Q2 2016
NGA plans
FTTx: 300k urban premises outside existing FTTC program
FTTH: 300k commercially viable rural premises
FTTH: 66 Middle Ireland towns (12 towns completed to date)
10
5 Large cities Middle Ireland towns Rural Ireland
1.6 million premises 760k premises
VDSL
vectored
GPON
FTTH
1.3 million H/Ps by Q2 2016
600K+ FTTH+FTTx planned – rollout starts Q1/Q2 2016

Best practice: Evaluating architectures &
technologies
Jonas Verstuyft
11

FTTH, FTTB, FTTdp,…
Need?
Available?
Influencers?
Budget?
12
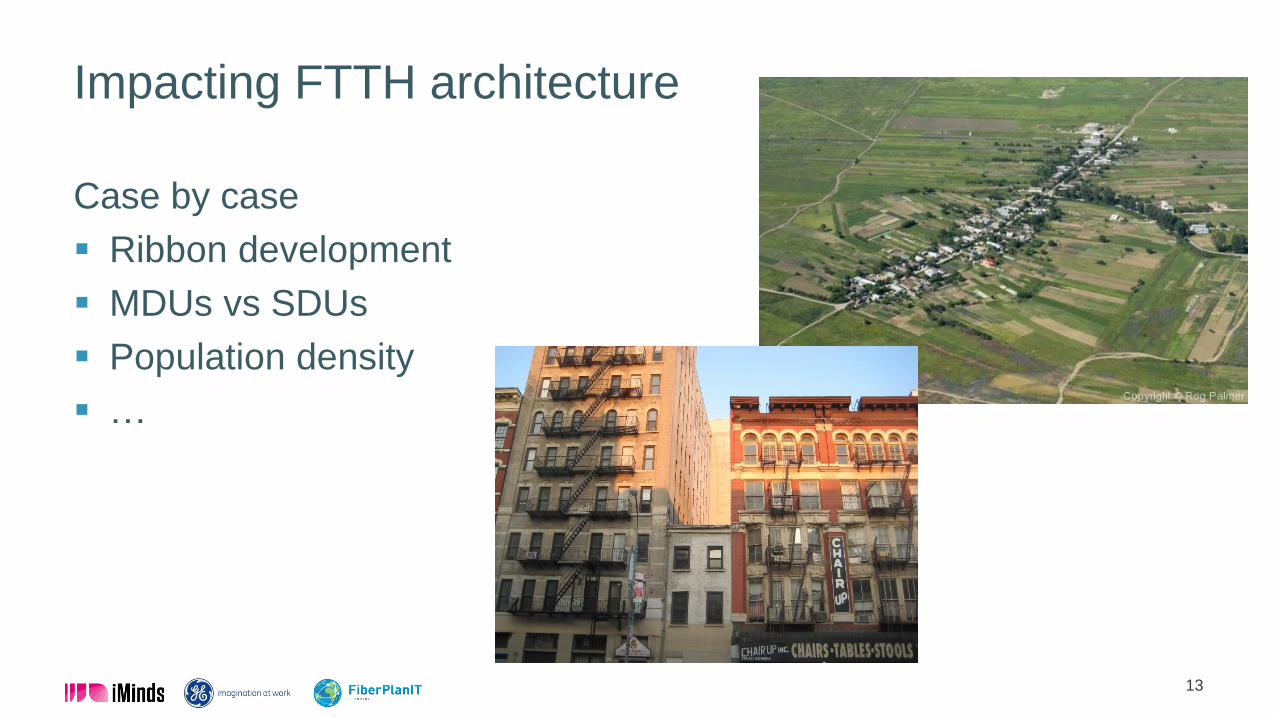
Impacting FTTH architecture
Case by case
Ribbon development
MDUs vs SDUs
Population density
…
13
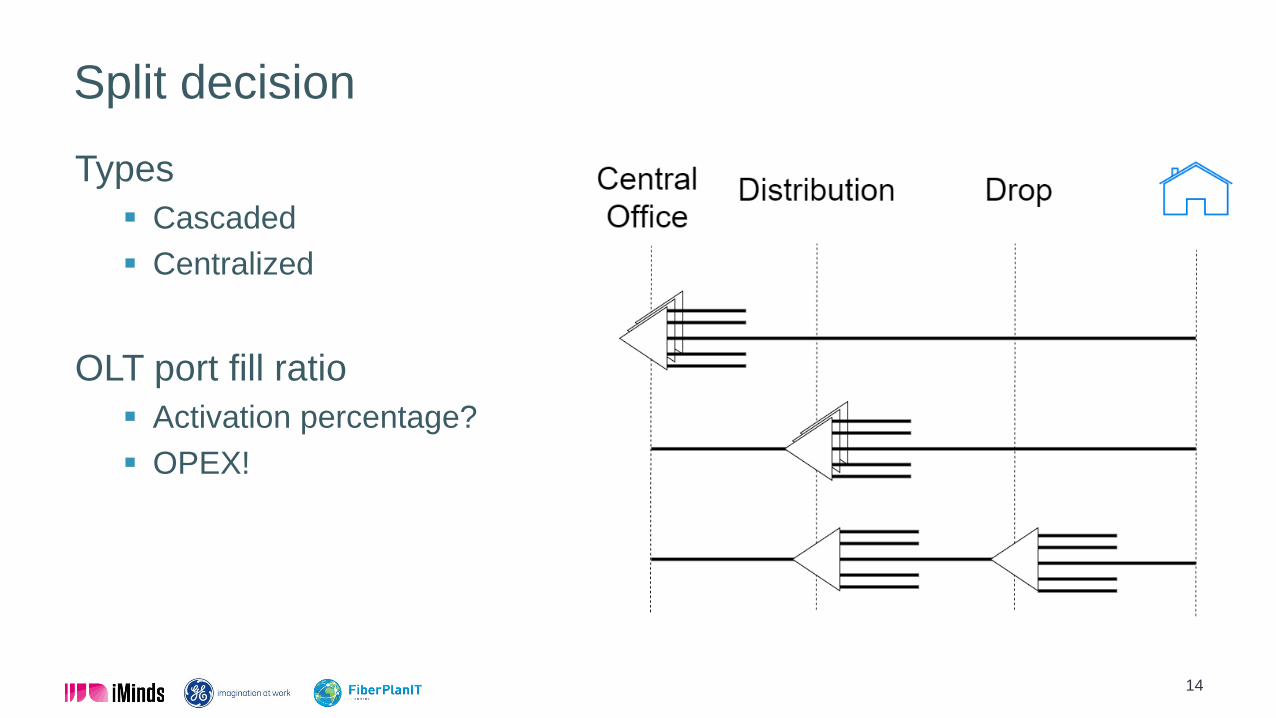
Split decision
Types
Cascaded
Centralized
OLT port fill ratio
Activation percentage?
OPEX!
14
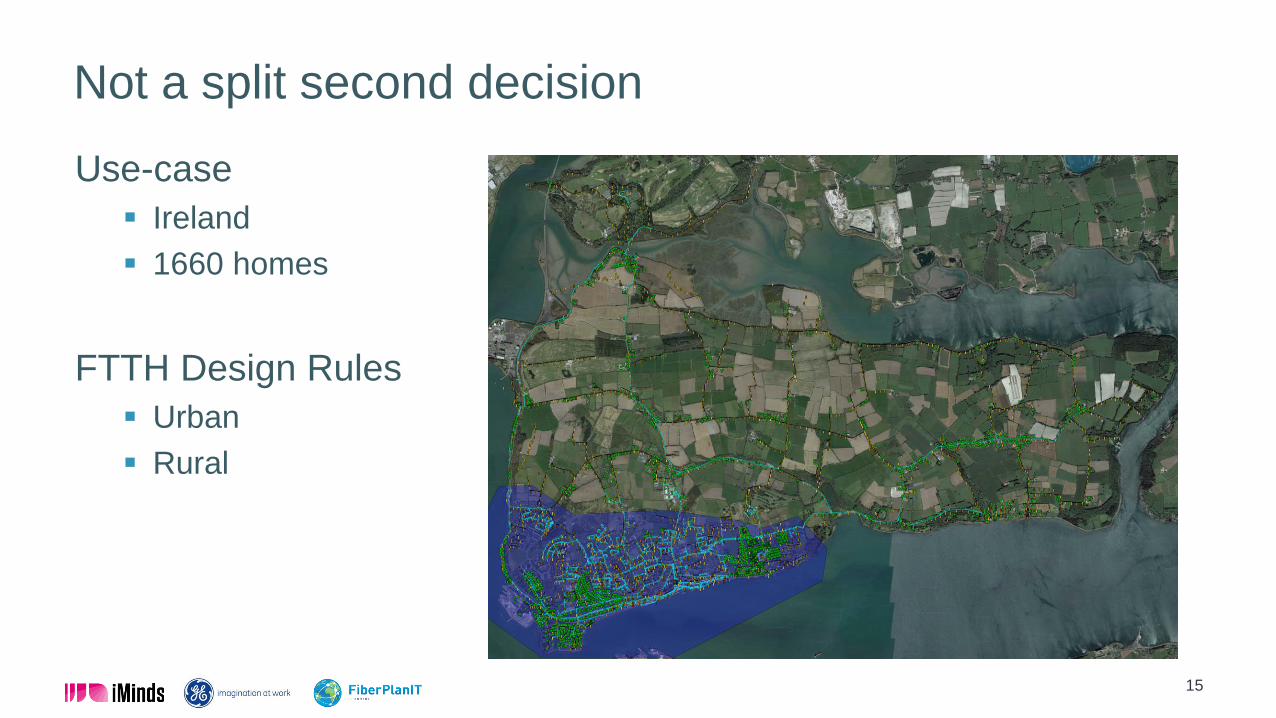
Not a split second decision
Use-case
Ireland
1660 homes
FTTH Design Rules
Urban
Rural
15
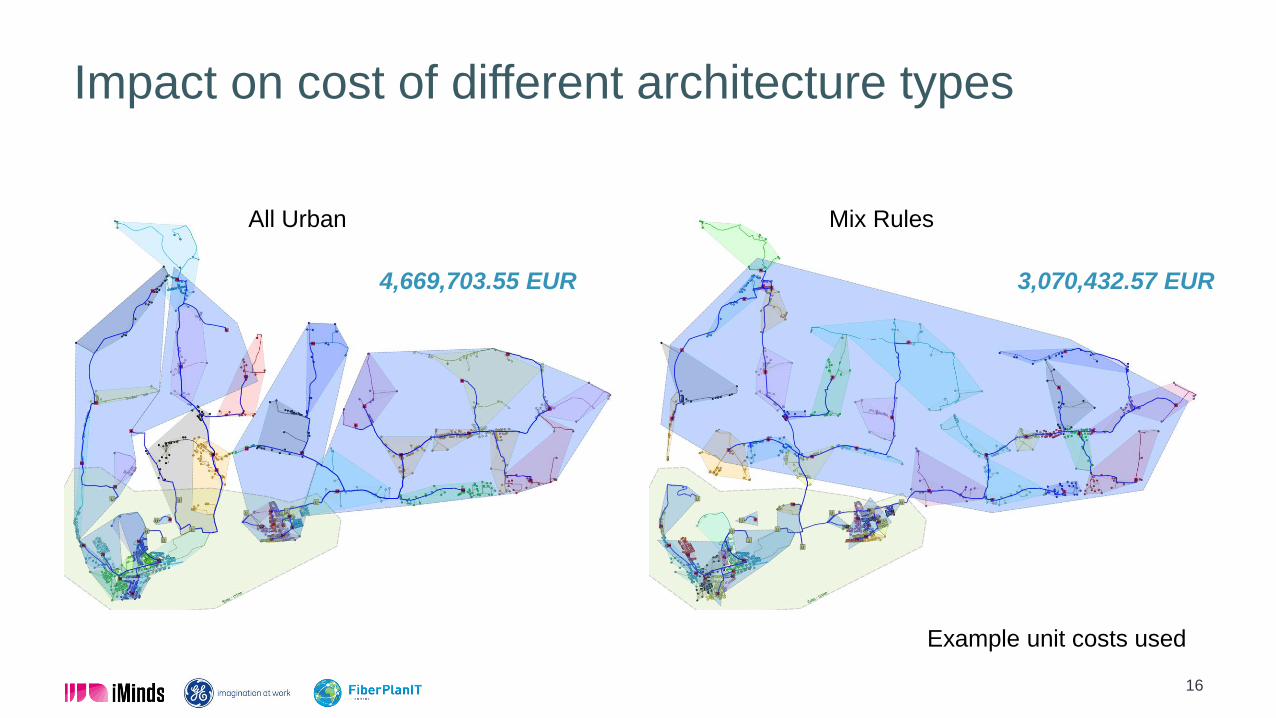
Impact on cost of different architecture types
16
Mix RulesAll Urban
3,070,432.57 EUR4,669,703.55 EUR
Example unit costs used
Deployment methods at Eir
Jonas Verstuyft
17

SDUs
95% Single Dwelling Units (SDUs)
75% of Ireland’s SDU have easy cable access.
aerial or duct
18
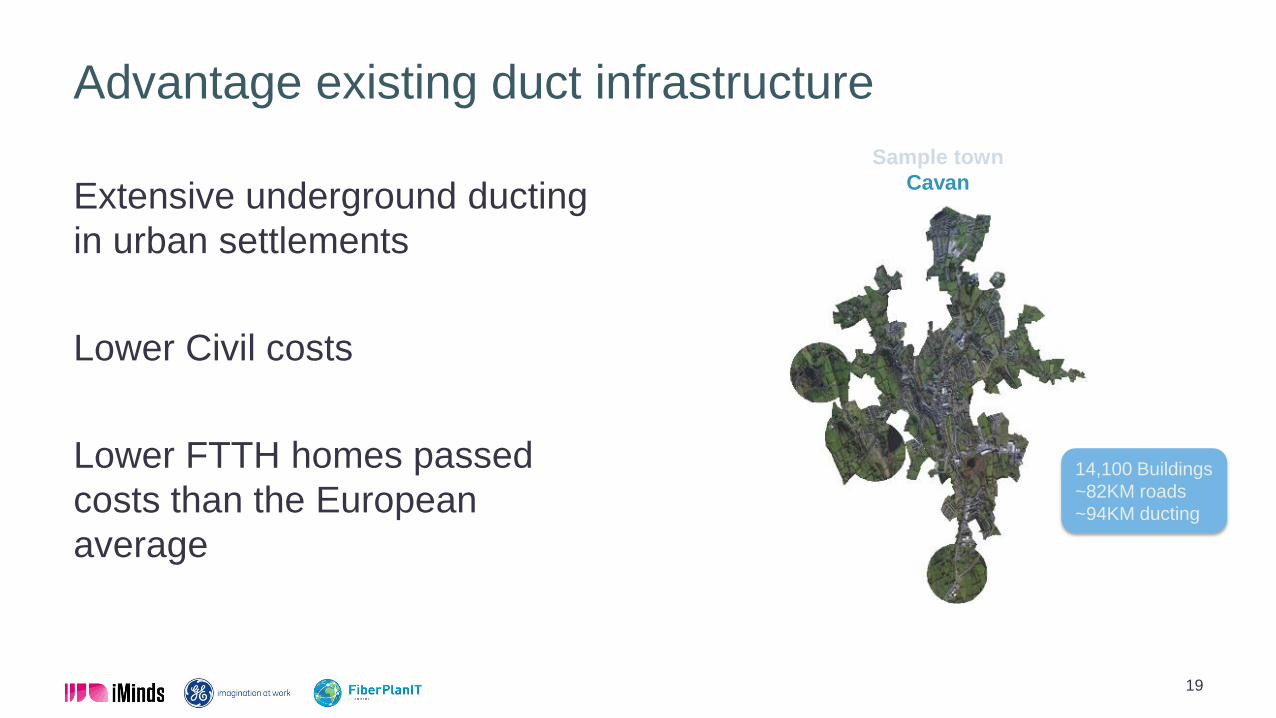
Advantage existing duct infrastructure
Extensive underground ducting
in urban settlements
Lower Civil costs
Lower FTTH homes passed
costs than the European
average
19
Sample town
Cavan
14,100 Buildings
~82KM roads
~94KM ducting
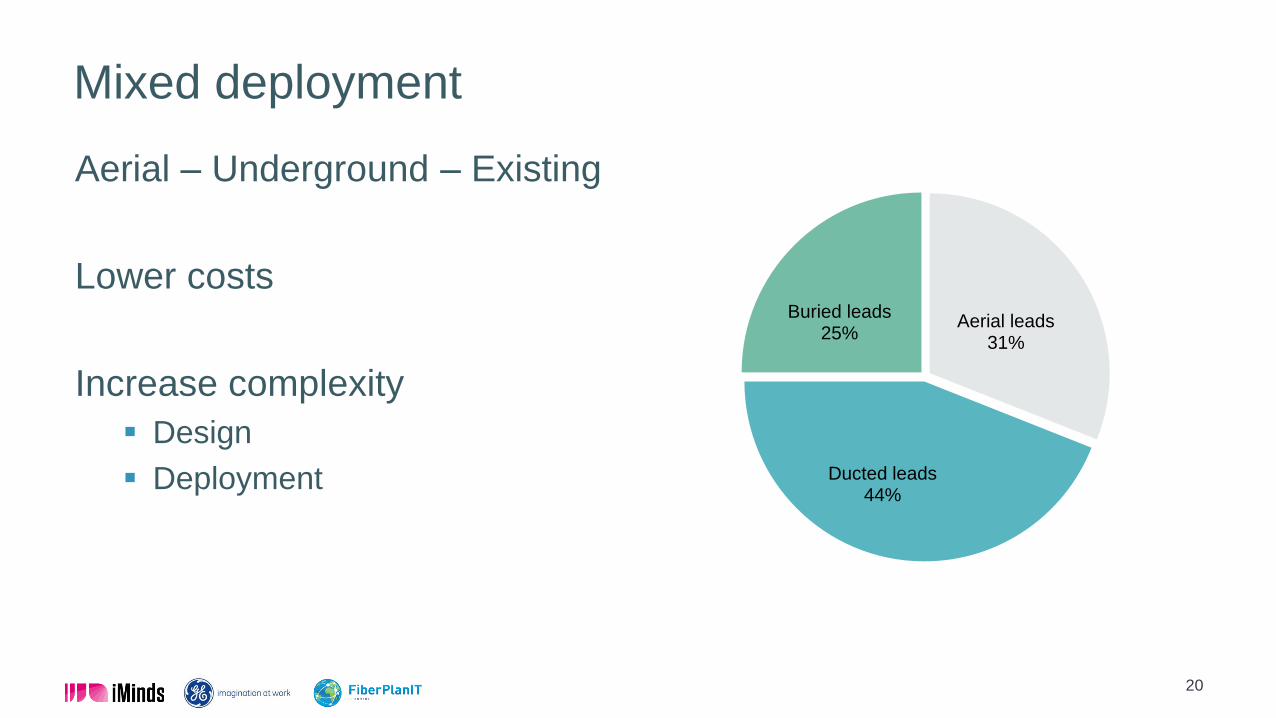
Mixed deployment
Aerial – Underground – Existing
Lower costs
Increase complexity
Design
Deployment
Aerial leads31%
Ducted leads44%
Buried leads25%
20
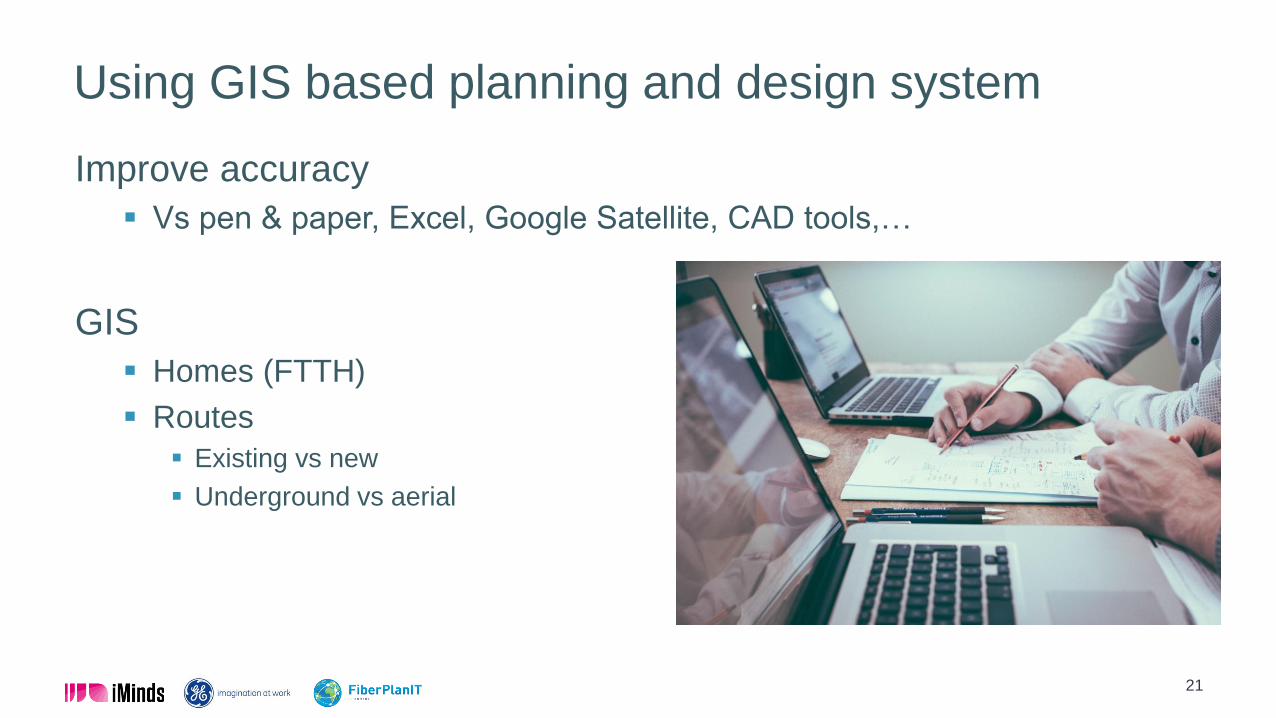
Using GIS based planning and design system
Improve accuracy
Vs pen & paper, Excel, Google Satellite, CAD tools,…
GIS
Homes (FTTH)
Routes
Existing vs new
Underground vs aerial
21
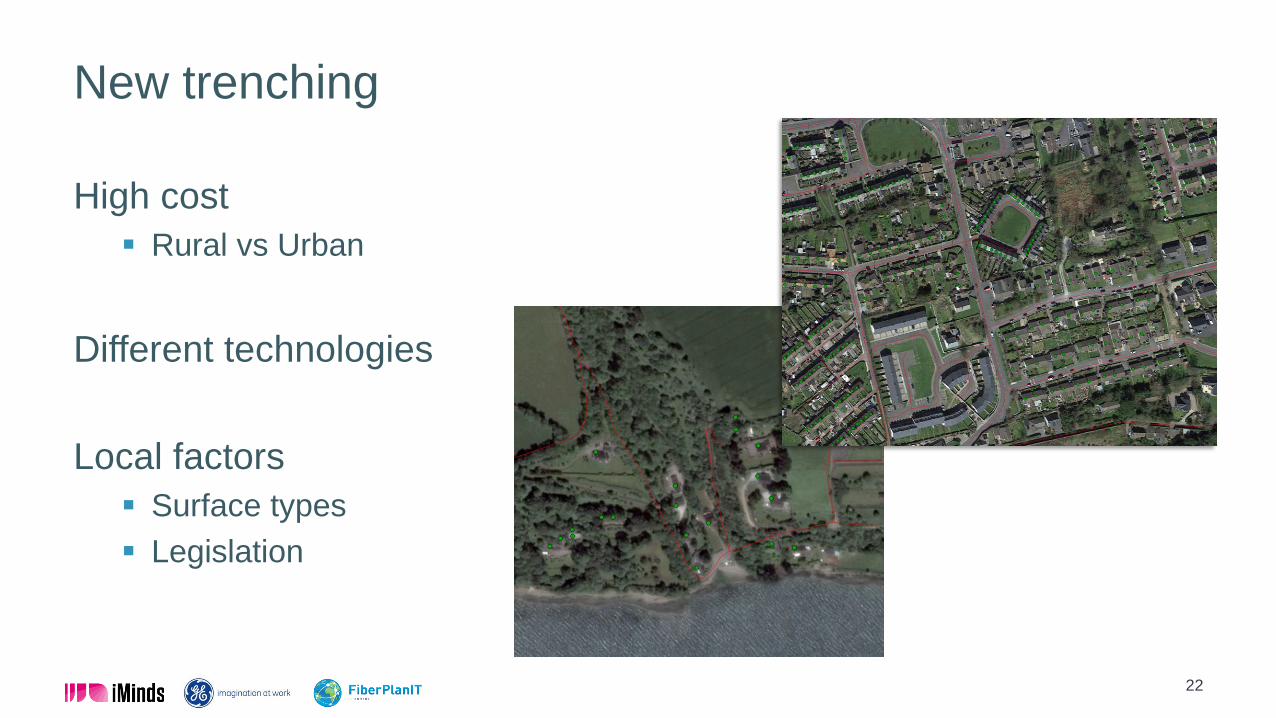
New trenching
High cost
Rural vs Urban
Different technologies
Local factors
Surface types
Legislation
22
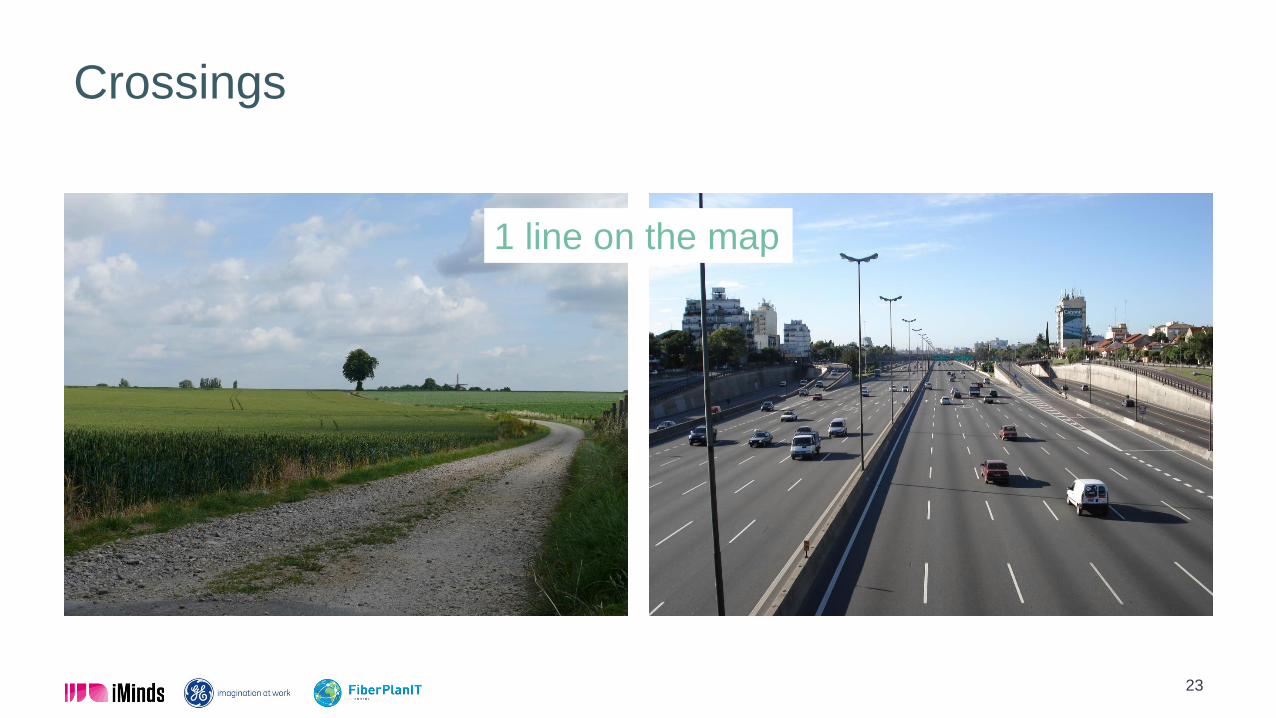
Crossings
23
1 line on the map

Existing infrastructure
Poles
Own poles?
Lease?
New poles?
Existing Ducts
Existing Manholes
Blockages?
Spare capacity?
24
Best practice: Importance of input data
James Wheatley
25
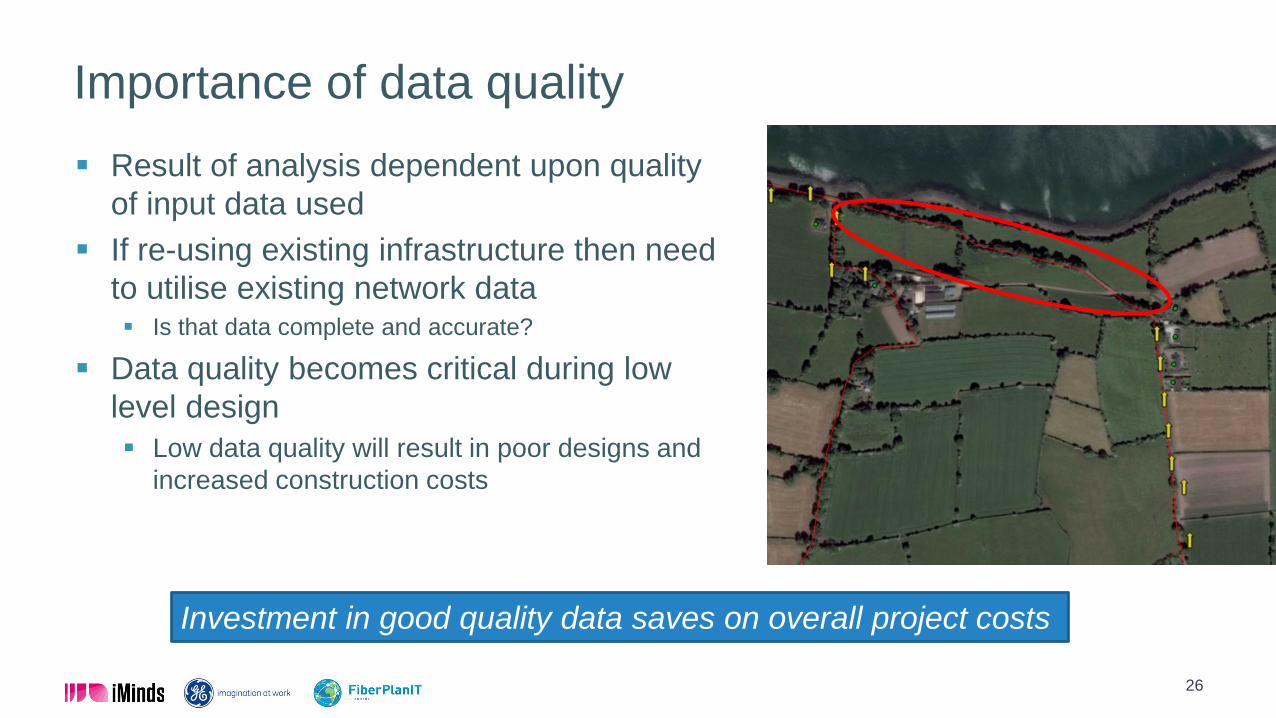
Importance of data quality
Result of analysis dependent upon quality
of input data used
If re-using existing infrastructure then need
to utilise existing network data Is that data complete and accurate?
Data quality becomes critical during low
level design
Low data quality will result in poor designs and
increased construction costs
26
Investment in good quality data saves on overall project costs
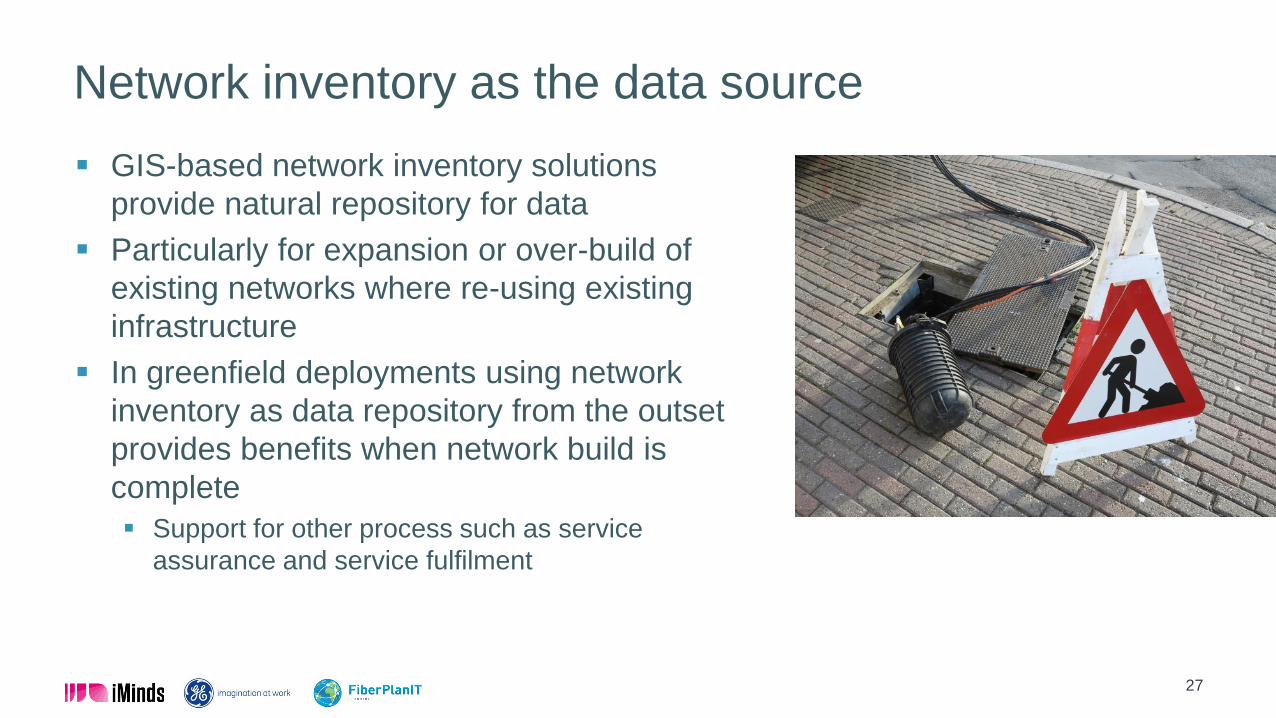
Network inventory as the data source
GIS-based network inventory solutions
provide natural repository for data
Particularly for expansion or over-build of
existing networks where re-using existing
infrastructure
In greenfield deployments using network
inventory as data repository from the outset
provides benefits when network build is
complete
Support for other process such as service
assurance and service fulfilment
27
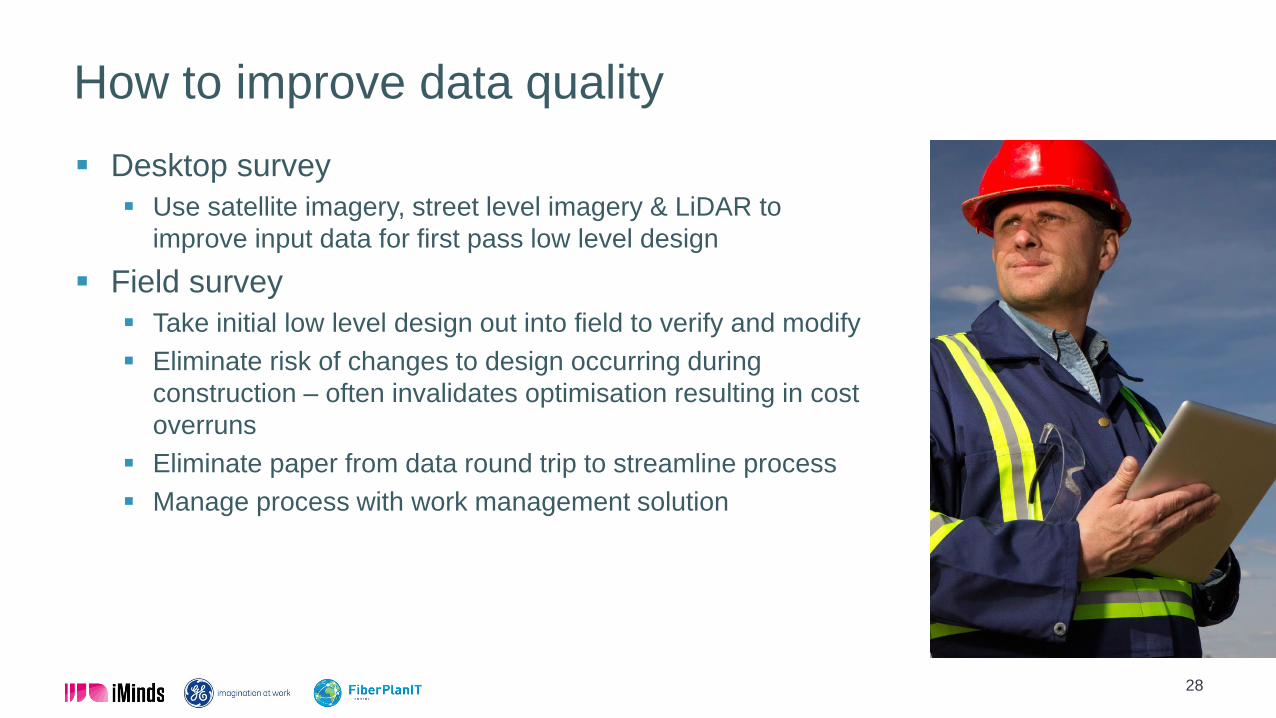
How to improve data quality
Desktop survey
Use satellite imagery, street level imagery & LiDAR to
improve input data for first pass low level design
Field survey
Take initial low level design out into field to verify and modify
Eliminate risk of changes to design occurring during
construction – often invalidates optimisation resulting in cost
overruns
Eliminate paper from data round trip to streamline process
Manage process with work management solution
28
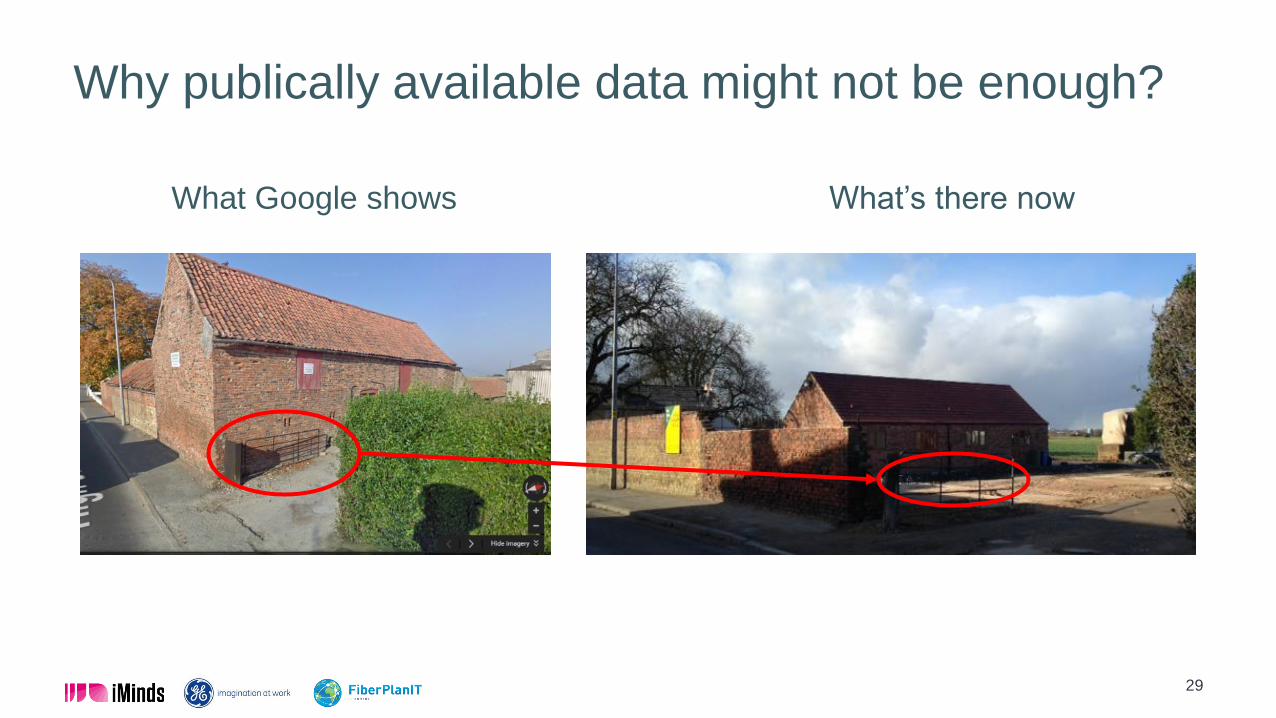
Why publically available data might not be enough?
29
What Google shows What’s there now
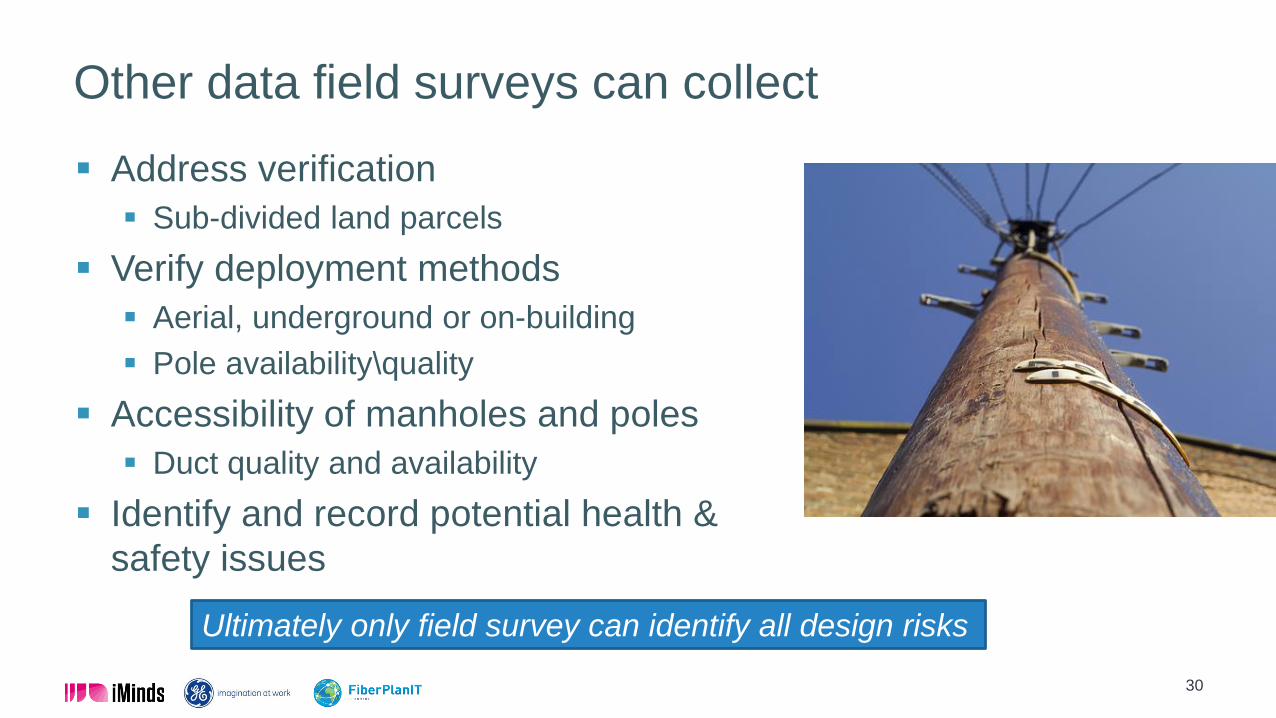
Other data field surveys can collect
Address verification
Sub-divided land parcels
Verify deployment methods
Aerial, underground or on-building
Pole availability\quality
Accessibility of manholes and poles
Duct quality and availability
Identify and record potential health &
safety issues
30
Ultimately only field survey can identify all design risks

Best practice: Area classification
Jonas Verstuyft
31
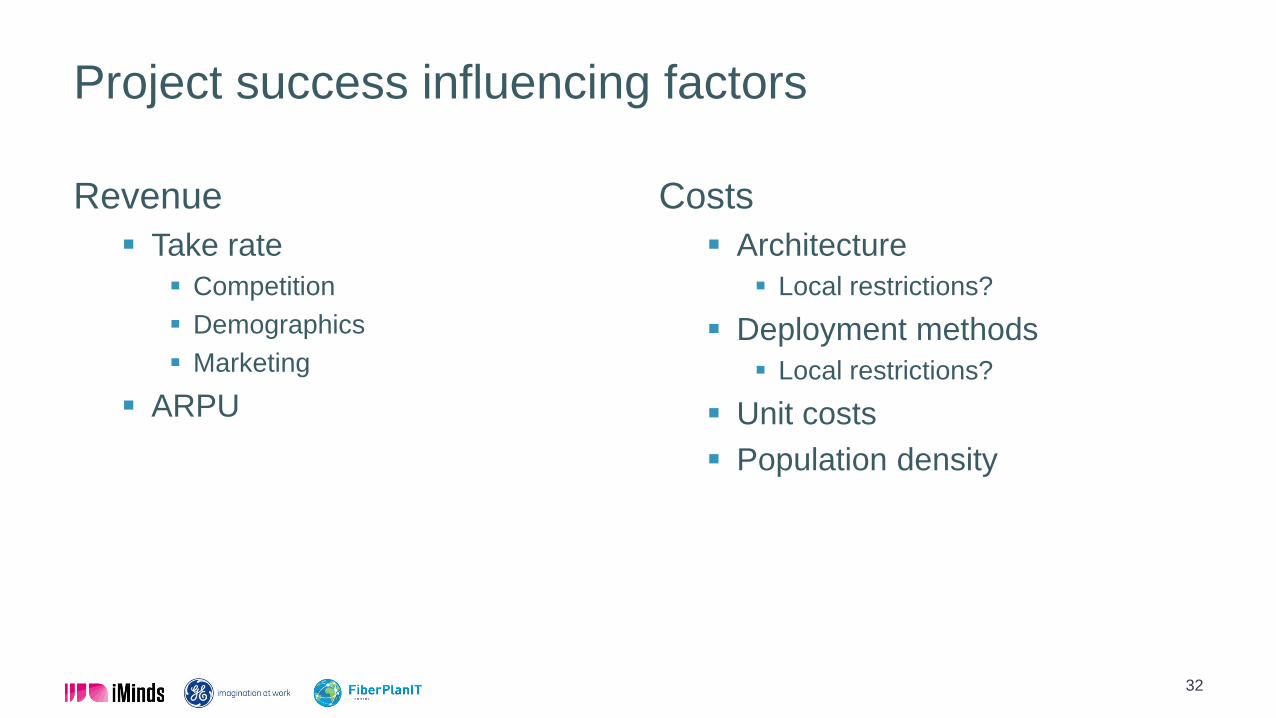
Project success influencing factors
Revenue
Take rate
Competition
Demographics
Marketing
ARPU
Costs
Architecture
Local restrictions?
Deployment methods
Local restrictions?
Unit costs
Population density
32

Identify commercially viable areas
Cost of roll-out
GIS data
Automation tools
Mistakes allowed?
ROI classification
Input data!
Unit cost information
Trial?
Marketing data
33
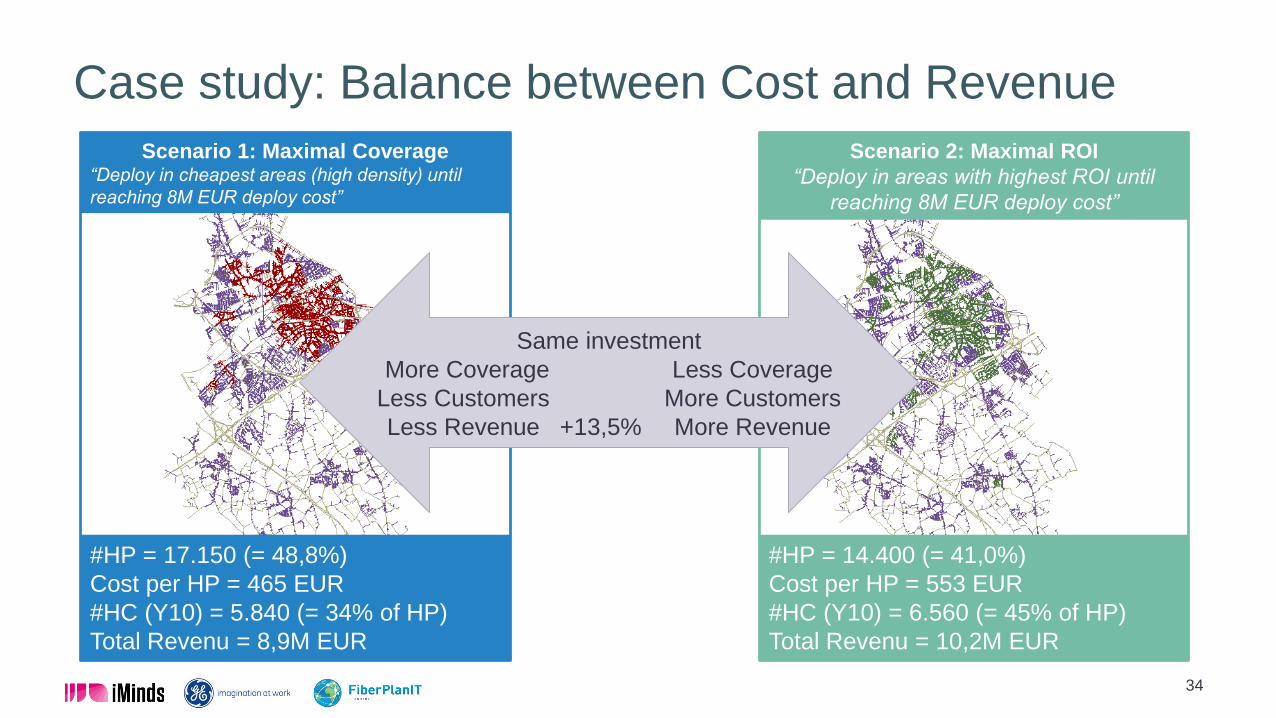
Case study: Balance between Cost and Revenue
34
Scenario 1: Maximal Coverage“Deploy in cheapest areas (high density) until
reaching 8M EUR deploy cost”
#HP = 17.150 (= 48,8%)
Cost per HP = 465 EUR
#HC (Y10) = 5.840 (= 34% of HP)
Total Revenu = 8,9M EUR
Scenario 2: Maximal ROI
“Deploy in areas with highest ROI until
reaching 8M EUR deploy cost”
#HP = 14.400 (= 41,0%)
Cost per HP = 553 EUR
#HC (Y10) = 6.560 (= 45% of HP)
Total Revenu = 10,2M EUR
Same investment
More Coverage Less Coverage
Less Customers More Customers
Less Revenue +13,5% More Revenue
Areas with competition
Go for FTTH
Better offer
Impact on adoption rates
Still attractive
Overbuild
Time to market!
Design automation
Advantage existing conduits/poles
35
Rural and Urban deployment at Eir
David Renehan
36

Rural broadband in Eir
Two years ago eir carried out detailed analysis on it’s rural network (mostly aerial cable) to determine what
was the most cost effective and scalable technology to deliver rural broadband nationally across a rural
landscape that was made up predominantly of ribbon development housing (houses built alone the roads
and not in hamlets).
FTTH/GPON was the technology of choice ahead of FTTC/FTTN/FTTB/FTT-dp or LTE.
After careful analysis eir have chosen a cascaded two stage splitter architecture for rural FTTH (1st stage
splitter = 1:8 2nd stage splitter = 1:4).
eir set up a team to evaluate existing overhead fibre work practices to reduce costs per KM.
eir chose a All-Dielectric Self-Supporting (ADSS) fibre cable as the best choice for aerial cascaded splitter
FTTH delivery and also the ADSS cable had the added advantage of reducing the number of OH/UG transitions
at electrical crossings.
Primary
Splitter
1:8
new fibre
OLTOptical
Line
Terminal
ODFOptical
Distribution
Frame
exchange
Secondary
Splitter/FDP
1:4Home Home
37
Rural broadband in Eir: Trial
In 2014 eir built its first trial rural FTTH network passing over 150
homes as a proof of concept to determine:
The new access fibre work practices worked in the live network
ADSS fibre cable was suitable for eir’s splitters/splicing & DP closures.
Planning and GEO tools could record and manage the new rural FTTH
architecture.
This was a huge success and proved useful to both eir and the rural
communities as to how FTTH could change their lives
In mid 2015 eir built a second trial rural FTTH network passing over
120 homes to fine tune the outcomes from the first rural trial:
38
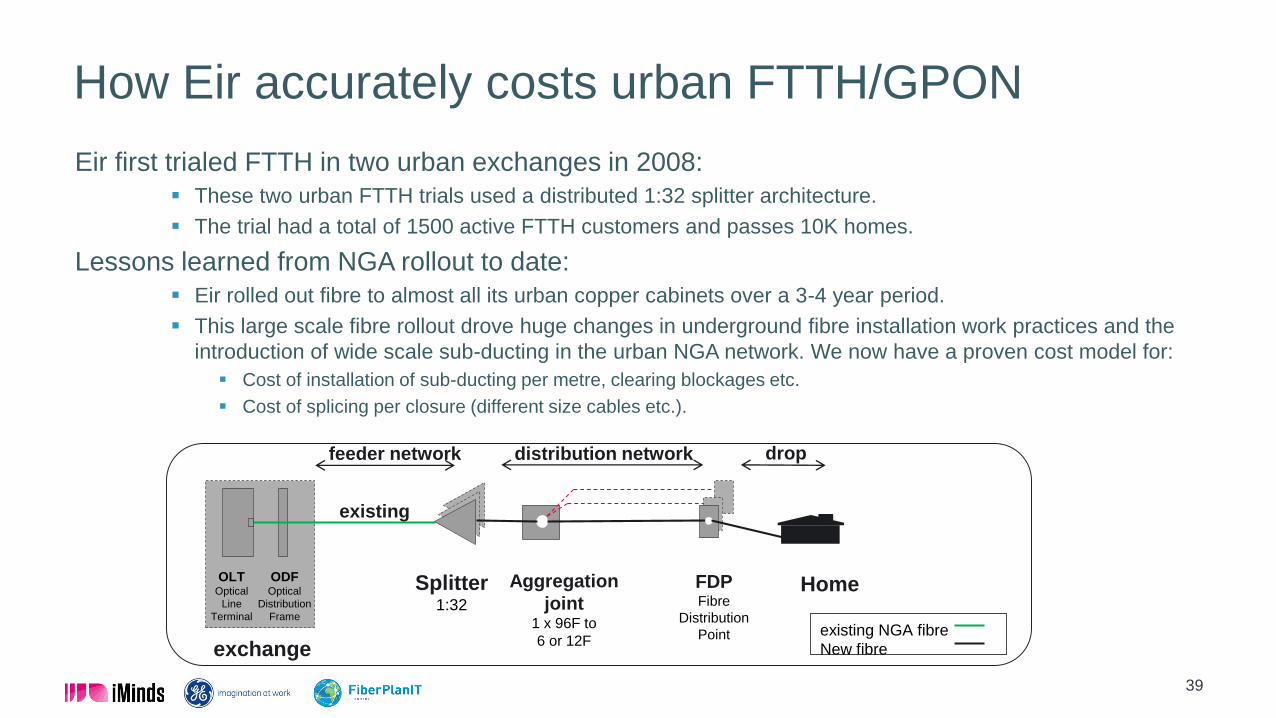
How Eir accurately costs urban FTTH/GPON
Eir first trialed FTTH in two urban exchanges in 2008:
These two urban FTTH trials used a distributed 1:32 splitter architecture.
The trial had a total of 1500 active FTTH customers and passes 10K homes.
Lessons learned from NGA rollout to date:
Eir rolled out fibre to almost all its urban copper cabinets over a 3-4 year period.
This large scale fibre rollout drove huge changes in underground fibre installation work practices and the
introduction of wide scale sub-ducting in the urban NGA network. We now have a proven cost model for:
Cost of installation of sub-ducting per metre, clearing blockages etc.
Cost of splicing per closure (different size cables etc.).
39
OLTOptical
Line
Terminal
ODFOptical
Distribution
Frame
Splitter1:32
Aggregation
joint 1 x 96F to
6 or 12F
FDPFibre
Distribution
Point
exchange
distribution network drop
Home
feeder network
existing
existing NGA fibre
New fibre
How Eir accurately costs urban FTTH/GPON
Using planning tools to accurately cost future FTTH projects .
Using eir’s FTTH planning tool and GEO analysis tools it is now possible to take the
learned costs and accurately produce a details BOM per new FTTH planned area.
These tools can run various scenarios to evaluate what are the best FTTH rules to
apply to design the most efficient splitter/homes passed model and reduce
infrastructure costs.
40
Identifying commercially viable FTTH rural areas
Eir has spent the past few years analysing both urban and rural
access infrastructure.
Using GEO tools, Eir have mapped every premises in Ireland and
identified whether they are urban or rural and what exchange they
are served from:
Is the premises served from an NGA enabled exchange?
Is the exchange fibre enabled?
Distance from exchange?
Exchange density?
Total length and type of existing cable infrastructure?41
Identifying commercially viable FTTH rural areas
Using automated FTTH design simulators, GEO tools and an in
house algorithm it was possible to derive the cost H/P per dwelling
using various rules e.g. Cost per exchange area?
Identify most cost effective routes per exchange?
Identify most cost effective routes nationally?
Launch from fibre enabled exchanges only?
Etc.
From the above information it is now possible to calculate a detailed
BOM for any rural FTTH route and classify it as commercially viable
or not?
42

Something to remember?
Learn from trials and earlier roll-outs
Get accurate view on difficulties and costs
Involvement of government in rural broadband
Use tools for accurate cost estimations
Save costs by reusing infrastructure
Importance of data quality
43

FTTH Council Europe, February 2016
Thank you for your attention!
Any questions?