front page image to be added. - amazon s3 · page 4 of 90 what is pcmark 8? pcmark 8 is a complete...
TRANSCRIPT

Page 1 of 90
Front page image to be added.

Page 2 of 90
This guide updated December 13, 2017
What is PCMark 8? ........................................................................................................................................... 4
Latest version numbers .............................................................................................................................................. 5
System requirements .................................................................................................................................................. 6
Benchmark accuracy .................................................................................................................................................... 7
How to benchmark performance .......................................................................................................................... 8
How to benchmark battery life .............................................................................................................................. 9
PCMark 8 settings ..................................................................................................................................................... 11
Home benchmark .......................................................................................................................................... 13
Home benchmark version history ..................................................................................................................... 14
Creative benchmark ..................................................................................................................................... 15
Creative benchmark version history ................................................................................................................ 16
Work benchmark ........................................................................................................................................... 17
Work benchmark version history ...................................................................................................................... 18
Storage benchmark ....................................................................................................................................... 19
Expanded Storage ...................................................................................................................................................... 20
Storage benchmark version history .................................................................................................................. 22
Applications benchmarks ........................................................................................................................... 23
Adobe Creative Cloud test (2.0) ......................................................................................................................... 24
Microsoft Office test ................................................................................................................................................ 25
Applications benchmark version history ........................................................................................................ 26
Battery life testing ......................................................................................................................................... 27
Tuning ................................................................................................................................................................ 28
Benchmark workloads ................................................................................................................................. 29
Web Browsing - JunglePin ..................................................................................................................................... 30
Web Browsing - Amazonia .................................................................................................................................... 32
Writing .............................................................................................................................................................................. 33
Casual Gaming ............................................................................................................................................................. 35
Mainstream Gaming .................................................................................................................................................. 36
Photo Editing v2 in Home 3.0, Creative 3.0 ................................................................................................. 37
Photo Editing in Home 2.0, Creative 2.0 (Compatibility Mode) ....................................................... 38
Batch Photo Editing v2 in Creative 3.0 ........................................................................................................... 39
Batch Photo Editing in Creative 2.0 (Compatibility Mode) ................................................................. 40
Video Editing v2 in Creative 3.0 ......................................................................................................................... 41
Video Editing in Creative 2.0 (Compatibility Mode) .............................................................................. 42

Page 3 of 90
Media To Go .................................................................................................................................................................. 43
Video Chat v2 in Home 3.0, Work 2.0 ............................................................................................................. 45
Video Chat in Home 2.0 (Compatibility Mode) .......................................................................................... 46
Video Group Chat v2 in Creative 3.0............................................................................................................... 47
Video Group Chat in Creative 2.0 (Compatibility Mode) ..................................................................... 48
Spreadsheet ................................................................................................................................................................... 49
Storage workloads......................................................................................................................................... 50
Consistency test .......................................................................................................................................................... 56
Adaptivity test .............................................................................................................................................................. 57
Application workloads ................................................................................................................................. 58
Adobe Photoshop light ............................................................................................................................................ 59
Adobe Photoshop heavy ......................................................................................................................................... 61
Adobe InDesign ........................................................................................................................................................... 63
Adobe Illustrator ......................................................................................................................................................... 64
Adobe After Effects in Adobe Creative Cloud test v2.0........................................................................ 66
Adobe After Effects in Adobe Creative Suite test v1.0 (Compatibility Mode) ......................... 67
Microsoft Word ........................................................................................................................................................... 68
Microsoft Excel ............................................................................................................................................................ 70
Microsoft PowerPoint.............................................................................................................................................. 72
Benchmark Scores ......................................................................................................................................... 73
How to report scores from PCMark 8 ............................................................................................................ 74
Scoring .............................................................................................................................................................................. 75
Release notes .................................................................................................................................................. 82
About Futuremark and UL.......................................................................................................................... 90

Page 4 of 90
What is PCMark 8?
PCMark 8 is a complete benchmark for Windows - an essential tool for testing
the performance of all types of PC, from tablets to desktops, in the home and
at the office.
PCMark 8 includes a variety of benchmark tests reflecting the different ways
people use their computers. Each test can be run individually allowing you to
choose the benchmark that best matches your own situation or the main
purpose of your system.
Each benchmark produces a score you can use to compare systems as well as
detailed results for gaining a deep understanding of performance during each
individual workload. Scores are not comparable across tests, nor are scores
from PCMark 8 comparable with results from other versions of PCMark.
Unlike previous versions of PCMark, there is no overall PCMark score. When
testing devices or components, be sure to use the most appropriate
benchmark for the hardware's capabilities and report your results using the
full name of the test, for example:
"Notebook scores 5,800 in PCMark 8 Creative Accelerated benchmark."
"Notebook scores 5,800 in PCMark benchmark."
PCMark is used by hundreds of hardware review sites and many of the world's
leading manufacturers. We hope it will prove to be valuable for you as well.
What's new in this version?
New Adobe and Microsoft application tests
One of the most exciting new features in PCMark 8 is the Applications
benchmark which measures system performance using popular applications
from the Adobe Creative Suite and Microsoft Office such as Photoshop and
Microsoft Word. You can choose which tests to run based on the applications
installed on your system.
Battery life testing
For the first time in the series, PCMark 8 combines performance testing with
battery life measurement giving you two ways to judge the capabilities and
value of a device. PCMark 8 even supports external instrumentation with 3rd
party power measurement equipment.
Page 5 of 90
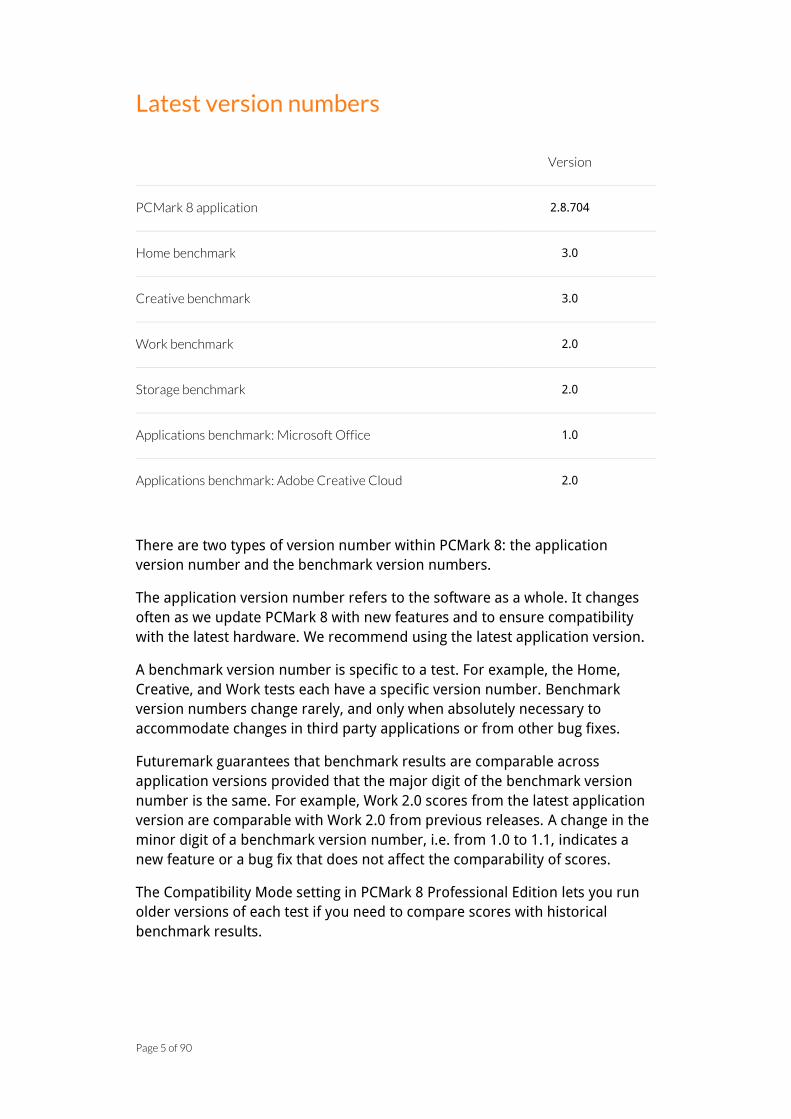
Latest version numbers
Version
PCMark 8 application 2.8.704
Home benchmark 3.0
Creative benchmark 3.0
Work benchmark 2.0
Storage benchmark 2.0
Applications benchmark: Microsoft Office 1.0
Applications benchmark: Adobe Creative Cloud 2.0
There are two types of version number within PCMark 8: the application
version number and the benchmark version numbers.
The application version number refers to the software as a whole. It changes
often as we update PCMark 8 with new features and to ensure compatibility
with the latest hardware. We recommend using the latest application version.
A benchmark version number is specific to a test. For example, the Home,
Creative, and Work tests each have a specific version number. Benchmark
version numbers change rarely, and only when absolutely necessary to
accommodate changes in third party applications or from other bug fixes.
Futuremark guarantees that benchmark results are comparable across
application versions provided that the major digit of the benchmark version
number is the same. For example, Work 2.0 scores from the latest application
version are comparable with Work 2.0 from previous releases. A change in the
minor digit of a benchmark version number, i.e. from 1.0 to 1.1, indicates a
new feature or a bug fix that does not affect the comparability of scores.
The Compatibility Mode setting in PCMark 8 Professional Edition lets you run
older versions of each test if you need to compare scores with historical
benchmark results.

Page 6 of 90
System requirements
Minimum Recommended
OS Windows 71
(32-bit and 64-bit are supported)
Windows 7 or Windows 82
(32-bit and 64-bit are supported)
Processor Dual core processor Dual core processor
Memory 2 GB 2GB
Graphics DirectX 93 DirectX 11
Display 1366 × 768 resolution 1920 × 1080 resolution
Storage 30 GB free space 30 GB free space
⚠ Internet Explorer 10 or later required. Internet Explorer 11
recommended.
⚠ You must have the relevant Adobe and Microsoft applications
installed in order to run the Applications tests. PCMark 8 is
compatible with Adobe Creative Cloud and Microsoft Office 2010
or later.
⚠ An Internet connection is required for activation and some
program features.
1 For Windows 7, SP1 (recommended) or at least Windows Updates KB-2729094, KB-2731771, KB-2533623, KB-
2670838 and KB-2786081 are required.
2 Users of Windows 8 N Edition and Windows 8 KN Edition will need to install Windows Media Player 12.
3 DirectX 9 hardware needs Shader Model 2.0 support and 128MB of video RAM. PCMark 8 Creative benchmark
requires hardware that supports all DirectX 11 features.

Page 7 of 90
Benchmark accuracy
The accuracy of a measurement method can be described with trueness and
precision, (as defined in ISO 5725-1).
Trueness refers to the closeness of agreement between the arithmetic mean of
a large number of test results and the true or accepted reference value.
Precision refers to the closeness of agreement between test results.
The precision of PCMark 8 scores is usually better than 3%. This means that
running the benchmark repeatedly on a consistently performing system in a
well-controlled environment will produce scores that fall within a 3% range.
Individual scores may occasionally fall outside the margin of error since the
factors that influence the score cannot be completely controlled in a modern,
multitasking operating system. There are also devices that simply do not offer
consistent performance due to their design. In these cases, it is necessary to
run the benchmark multiple times, and then take either an average or a mode
of the results.

Page 8 of 90
How to benchmark performance
In general, you should benchmark every device you test under the same
conditions. For example, you should test every system in the same location, at
room temperature, and away from direct sunlight and other heat sources.
Recommended process
1. Install all critical updates to ensure your operating system is up to date.
2. Install the latest approved drivers for your hardware.
3. Close other programs.
4. Run the benchmark.
Expert process
1. Install all critical updates to ensure your operating system is up to date.
2. Install the latest approved drivers for your hardware.
3. Restart the computer or device.
4. Wait 2 minutes for startup to complete.
5. Close other programs, including those that may be running in the
background.
6. Wait for 15 minutes.
7. Run the benchmark.
8. Repeat from step 3 at least three times to verify your results.
Page 9 of 90
How to benchmark battery life
Measuring performance and battery life provides a better view of the overall
profile of a device than benchmarking performance alone. You can test a
device's battery life using the Home, Creative, Work and Applications
benchmarks in PCMark 8.
The battery must be at least 80% charged before the test will start. The test
loops the benchmark until the battery charge drops below 20%. The reported
battery life is an estimate for a 95% duty cycle (from 100% charged to 5%)
extrapolated from the actual, measured battery life during the benchmark run.
At 20% battery charge level, warnings and pop-up alerts instruct the user to
connect a power source. As such, we consider 20% charge to be the lower limit
of comfortable use.
Battery life testing can take several hours during which you will not be able to
use your device for other tasks. Do not use the charging cable while the test is
running.
Windows Power Plan settings
We do not recommend changing the Power Plan setting in the Windows
Control Panel when benchmarking battery life. Instead, one should use the
configuration that is shipped to and used by the end user. You should make a
note of Power Plan used, though, to be able compare devices fairly.
Calibrate the battery
When a device is brand new, or is usually connected to a power supply and
hasn't been discharged for a long time, or has been shut down and
disconnected from power for a month or more, you must calibrate its battery
before running the test.
You can calibrate the device's battery with a full drain/charge cycle followed by
a couple of hours left connected to mains power. For better accuracy, we
recommend two complete drain/charge cycles. The device manufacturer may
provide special software to calibrate the battery. Check with the manufacturer
for details.
Screen brightness settings
Screen brightness can have a significant effect on a device's battery life. To
produce comparable results you should calibrate every device you test to the
same screen brightness. In practice, this is difficult without expensive,
specialist equipment.
PCMark 8 provides a pure white calibration screen to help you calibrate the
brightness. If you don't have access to a luminance meter, you can calibrate

Page 10 of 90
your devices by comparing the pure white calibration screen to a reference
such as a monitor, light-box or similar. Alternatively, place your devices side by
side and adjust the brightness levels by eye.
⚠ It is not a good idea to calibrate the screen using the device's built-
in brightness settings. Different screens offer different levels of
maximum brightness. The 50% brightness setting on one device
may not be equal in luminance to the 50% setting on another
device, for example.
Recommended process
1. Test the device at room temperature, away from direct sunlight and heat
sources.
2. Disable automatic screen brightness adjustment.
3. Use the pure white calibration screen in PCMark 8 to set the device's
screen brightness to a defined level, ideally 110 cd/m2.
Expert process
To produce accurate, comparable results you should test devices under
controlled conditions. Our recommendations below match those given in the
ECMA-383 standard "Measuring the Energy Consumption of Personal
Computing Products."
1. Test the device in an environment that meets ECMA-383 requirements:
1.1 Temperature: 23 +/- 5 degrees Celsius.
1.2 Relative humidity: 10 - 80 %.
1.3 Ambient light: 250 +/- 50 lux.
2. Disable automatic screen brightness adjustment.
3. Use the pure white calibration screen in PCMark 8 and a luminance meter
to calibrate the screen brightness to 110 cd/m2.
⚠ Luminance is occasionally expressed in Nits. Nit is a non-SI name
used for units of luminance and is equivalent to the SI unit, i.e. 1
nit = 1 cd/m2.

Page 11 of 90
PCMark 8 settings
The settings found on the Help tab apply to all PCMark 8 benchmark tests.
Register / Unregister
If you have a PCMark 8 Advanced or Professional Edition upgrade key, copy it
into the box and press the Register button. If you wish to unregister your key,
so you can move your license to a different machine for example, press the
Unregister button.
Automatically view results online
When this box is checked PCMark 8 will automatically open a browser window
allowing you to view your results on the Futuremark website after you
complete a benchmark run. This option is selected by default and cannot be
disabled in PCMark 8 Basic Edition.
Enable compatibility mode
Check this box if you wish to run benchmark tests from a previous version of
PCMark 8, for instance to compare a system against a historical set of test
results. This option is disabled by default and cannot be selected in PCMark 8
Basic Edition.
Scan SystemInfo
SystemInfo is a component used in Futuremark benchmarks to identify the
hardware in your system or device. It does not collect any personally
identifiable information. This option is selected by default and is required in
order to get a valid benchmark test score.
SystemInfo monitoring
This option controls whether SystemInfo monitors your CPU temperature,
clock speed, power, and other hardware information during the benchmark
run. This option is selected by default.
Automatically detect 3rd party applications
When this option is selected, PCMark 8 will look in the default install locations
for 3rd party applications such as Internet Explorer, Microsoft Office and Adobe
Creative Suite. This option is selected by default.
Enable hardware accelerated video transcoding and playback
This option allows media workloads to use hardware acceleration, if available.
This option is selected by default.

Page 12 of 90
Maximum logging
This option is disabled by default since it can affect performance. You should
only use this option when instructed to by Futuremark as part of resolving a
support request.
Override automatic OpenCL selections
PCMark 8 will automatically choose the optimal OpenCL device in your system
when running benchmark tests in Accelerated mode. For troubleshooting, or
comparison testing, you can override the automatic selection and choose the
OpenCL device manually.
Reset all settings and options
This button restores all settings and options to their defaults.
Page 13 of 90
Home benchmark
PCMark 8 Home benchmark measures your system's ability to perform a series
of common tasks typical of daily home use. The Home workloads generally
have light computational requirements and are ideal for testing low-cost
tablets, notebooks and desktop home PCs.
The PCMark 8 Home benchmark test contains the following workloads.
Web Browsing
Writing
Casual Gaming
Photo Editing
Video Chat
Please refer to the Workloads section for a detailed description of each
workload.
Run Conventional
In Conventional mode the workloads do not use OpenCL. This reflects how the
majority of software works today, with the score providing a performance
baseline.
Run Accelerated
Accelerated mode allows workloads to use OpenCL acceleration, anticipating
the way software will work in the future. PCMark 8 will automatically find and
use the optimal OpenCL device in your system.
⚠ While you can compare Conventional and Accelerated scores from
a single system, you should not compare Conventional scores from
one system with Accelerated scores from another system. When
comparing two or more systems, you should use the same mode
on every system being tested.

Page 14 of 90
Home benchmark version history
Version Release date Notes
3.0 January 17, 2014
New Photo Editing test using the open source
ImageMagick library and a wider variety of image
processing operations. Video Chat test now features
improved face detection and performance. The test
has been updated to use OpenCV 2.4.7.
2.0 October 10, 2013 Added Conventional and Accelerated run modes.
Professional Edition only.4
1.0 May 31, 2013 Launch version, Professional Edition only
4 PCMark 8 Basic and Advanced Editions were released on October 21, 2013 with the Home 2.0 workload.
Page 15 of 90
Creative benchmark
PCMark 8 Creative benchmark measures your system's ability to perform a
series of entertainment and media tasks. The Creative workloads generally
have demanding computational requirements and are designed for testing mid
to high-end notebooks and desktops. Your system must have a GPU with full
DirectX 11 support in order to run all the workloads in the PCMark 8 Creative
benchmark.
The PCMark 8 Creative benchmark test contains the following workloads:
Web Browsing
Photo Editing
Batch Photo Editing
Video Editing
Media To Go
Mainstream Gaming
Video Group Chat
Please refer to the Workloads section for a detailed description of each
workload.
Run Conventional
In Conventional mode the workloads do not use OpenCL. This reflects how the
majority of software works today, with the score providing a performance
baseline.
Run Accelerated
Accelerated mode allows workloads to use OpenCL acceleration, anticipating
the way software will work in the future. PCMark 8 will automatically find and
use the optimal OpenCL device in your system.
⚠ While you can compare Conventional and Accelerated scores from
a single system, you should not compare Conventional scores from
one system with Accelerated scores from another system. When
comparing two or more systems, you should use the same mode
on every system being tested.

Page 16 of 90
Creative benchmark version history
Version Release date Notes
3.0 January 17, 2014
New Photo Editing test using the open source
ImageMagick library and a wider variety of image
processing operations. Video Editing part 2 now
uses source material in 4K UHD resolution
(3840 × 2160). Video Group Chat test now features
improved face detection and performance. The test
has been updated to use OpenCV 2.4.7.
2.0 October 10, 2013 Added Conventional and Accelerated run modes.
Professional Edition only.5
1.0 May 31, 2013 Launch version, Professional Edition only
5 PCMark 8 Basic and Advanced Editions were released on October 21, 2013 with the Creative 2.0 workload.

Page 17 of 90
Work benchmark
PCMark 8 Work benchmark measures your system's ability to perform a series
of basic office and work tasks. For more demanding office use, run the Creative
benchmark test. The Work tests are designed for testing typical office
notebooks and desktop PCs that lack media capabilities.
The PCMark 8 Work benchmark test contains the following workloads:
Web Browsing
Writing
Video Chat
Spreadsheet
Please refer to the Workloads section for a detailed description of each
workload.
Run Conventional
In Conventional mode the workloads do not use OpenCL. This reflects how the
majority of software works today, with the score providing a performance
baseline.
Run Accelerated
Accelerated mode allows workloads to use OpenCL acceleration, anticipating
the way software will work in the future. PCMark 8 will automatically find and
use the optimal OpenCL device in your system.
⚠ While you can compare Conventional and Accelerated scores from
a single system, you should not compare Conventional scores from
one system with Accelerated scores from another system. When
comparing two or more systems, you should use the same mode
on every system being tested.

Page 18 of 90
Work benchmark version history
Version Release date Notes
2.0 January 17, 2014
New Spreadsheet test using LibreOffice Calc, a part
of the open-source productivity suite from The
Document Foundation. Added Video Chat test.
1.0 May 31, 2013 Launch version, Professional Edition only

Page 19 of 90
Storage benchmark
PCMark 8 Storage benchmark is ideal for testing the performance of SSDs,
HDDs and hybrid drives.
Using traces recorded from Adobe Creative Suite, Microsoft Office and a
selection of popular games, PCMark 8 Storage highlights real-world
performance differences between storage devices. You do not need to have
these applications installed on your system to run the Storage benchmark.
The PCMark 8 Storage benchmark test contains the following workload traces:
Storage – Adobe Photoshop light
Storage – Adobe Photoshop heavy
Storage – Adobe Illustrator
Storage – Adobe InDesign
Storage – Adobe After Effects
Storage – Microsoft Word
Storage – Microsoft Excel
Storage – Microsoft PowerPoint
Storage – World of Warcraft
Storage – Battlefield 3
Please refer to the Workloads section for a detailed description of each
workload.

Page 20 of 90
Expanded Storage
PCMark 8 Expanded Storage benchmarks are specialist tests designed for
professional testing labs. These benchmarks are only available from the
command line with PCMark 8 Professional Edition. You can download the
PCMark 8 Command Line Guide from the Futuremark website.
PCMark 8 v2.3.293 added the ability to customize the Storage Consistency test.
You'll find details and instructions in the PCMark 8 Storage Consistency
Customization Guide.
Please refer to the Workloads section for a detailed description of each test.
⚠ These tests can take up to 24 hours or more to complete.
How to prepare a drive for Expanded Storage tests
PCMark 8 Expanded Storage tests can only be run on a completely clean drive. To protect against accidental data loss, PCMark 8 will refuse to run the Expanded Storage tests on a disk that has partitions defined in the partition table. To clean and prepare a drive for the Expanded Storage tests:
Run DISKPART from an elevated (admin) command line
Type list disk
Type select disk n, where n is the number of the disk to test
Type clean to fully erase the drive
Exit DISKPART
Adaptivity test
The Adaptivity test measures the "learning" capabilities of the storage system.
The Storage test workloads are repeated and the results are observed. The test
continues until a steady state of performance has been reached.
The benchmark reports the performance level at the start and in the steady
state as well as the number of iterations required to reach the state.
Consistency test
The PCMark 8 Consistency test measures the performance consistency and
degradation tendency of a storage system.
The Storage test workloads are repeated. Between each repetition the storage
system is bombarded with a usage that causes degraded drive performance.
In the first part of the test, the cycle continues until a steady degraded level of
performance has been reached.

Page 21 of 90
In the second part, the recovery of the system is tested by allowing the system
to idle and measuring the performance with long intervals.
The test reports the performance level at the start, the degraded steady-state
and the recovered state as well as the number of iterations required to reach
the degraded state and the recovered state.

Page 22 of 90
Storage benchmark version history
Version Release date Notes
2.0 January 18, 2016
The test now provides better support for NVMe
drives. Scores from NVMe drives will improve in
some cases. The faster the drive, the bigger the
difference. Other types of drive are unaffected.
1.1 November 27, 2014
A bug fix in this application update means that
scores from the Expanded Storage tests included in
PCMark 8 Professional Edition may improve slightly
on some hardware. The main Storage benchmark
score is not affected.
1.1 January 17, 2014
Added Expanded Storage tests for specialist analysis
of drive performance. PCMark 8 Professional Edition
command line only.
1.0 May 31, 2013 Launch version, Professional Edition only

Page 23 of 90
Applications benchmarks
The PCMark 8 Applications benchmark measures system performance using
popular applications from the Adobe Creative Cloud and Microsoft Office. You
can choose which tests to run based on the applications installed on your
system. Each test automatically steps through a series of actions such as
opening, editing and saving a file. The results are used to calculate the PCMark
8 Applications scores for the system.
PCMark 8 is compatible with Adobe Creative Cloud and Microsoft Office 2010
or later. You must have the relevant Adobe and Microsoft applications installed
in order to run the PCMark 8 Applications test.
⚠ When comparing two or more systems, ensure you are using the
same versions of the third party applications on every system
being tested.

Page 24 of 90
Adobe Creative Cloud test (2.0)
The test uses the following workloads:
Adobe Photoshop light
Adobe Photoshop heavy
Adobe InDesign
Adobe Illustrator
Adobe After Effects CC
Please refer to the Workloads section for a detailed description of each
workload.

Page 25 of 90
Microsoft Office test
PCMark 8 is compatible with Microsoft Office 2010 and Microsoft Office 2013.
The Microsoft Office test consists of following subtests:
Microsoft Word
Microsoft Excel
Microsoft PowerPoint
Please refer to the Workloads section for a detailed description of each
workload.

Page 26 of 90
Applications benchmark version history
Adobe Creative Cloud benchmark
Version Release date Notes
2.0 January 18, 2016
The After Effects test output has been changed to
uncompressed AVI format as the latest version of
Adobe After Effects CC no longer supports output to
compressed Windows Media Video format.
1.0 May 31, 2013 Launch version
⚠ Enable Compatibility Mode to use version 1.0 of the test with
Adobe Creative Suite 6 or with Adobe Creative Cloud applications
from 2014 or before. Scores from 2.0 and 1.0 are not comparable.
Applications benchmark: Microsoft Office version history
Version Release date Notes
1.0 May 31, 2013 Launch version
Page 27 of 90
Battery life testing
PCMark 8 improves on previous versions by including new battery life testing
tools. Choosing Battery Life mode before running the Home, Creative, Work or
Applications benchmark will loop the test until the battery is almost empty to
accurately measure battery life under real-world conditions.
The device's battery must be at least 80 percent charged before Battery Life
testing can begin. The test will end when the battery level falls below 20
percent.

Page 28 of 90
Tuning
From the Tuning tab you can select and run individual workloads from any of
the benchmarks in PCMark 8. This can be useful for fine-tuning settings or
troubleshooting hardware issues.
Running one or more workloads from the Tuning tab will produce detailed
results for each workload, but will not produce an overall benchmark score,
even if all the workloads required for the benchmark were included in the run.

Page 29 of 90
Benchmark workloads

Page 30 of 90
Web Browsing - JunglePin
Components stressed by this workload CPU, storage system
Benchmarks that use this test Home, Creative, Work
Implementation
This workload represents a common web browsing scenario: checking up on
friends on a social networking site.
The workload launches a web browser application and loads the workload
content. The web browser is a custom-built application utilizing the Internet
Explorer ActiveX control using IWebBrowser2 interface. The web server is a
local server built into the test application.
Tasks
1. renderitems: renders a page with varying sized images, measures time
2. scroll: scrolls the page down and back to up, measures frame rate
3. openitem: zooms into one picture, measures animation frame rate
4. opensearch: loads a set of data into search feature, measures time
5. writesearch: executes searches when a search term typed a character in
time, measures time
6. additemanimation: selects a thumbnail area from image to be added,
measures animation frame rate
7. additem: adds the image to page causing re-rendering the page, measures
time
Summary
Total files Package size
Initial document
178 4.4 MB
Scoring
𝑃𝑟𝑖𝑚𝑎𝑟𝑦 𝑟𝑒𝑠𝑢𝑙𝑡 = 𝐺𝐸𝑂𝑀𝐸𝐴𝑁(1
𝑅1,
1
𝑅2, 𝑅3, 𝑅4)
Where
𝑅1 = addanimation_result secondary result

Page 31 of 90
𝑅2 = openitem_result secondary result 𝑅3 = scroll_latency secondary result 𝑅4 = writesearch_latency secondary result

Page 32 of 90
Web Browsing - Amazonia
Components stressed by this workload CPU, storage system
Benchmarks that use this test Home, Creative, Work
Implementation
This workload represents a common web browsing scenario: checking up on
friends on a social networking site and searching for items from an online
retailer.
The workload launches a web browser application and loads the workload
content. The web browser is a custom-built application utilizing the Internet
Explorer ActiveX control using IWebBrowser2 interface. The web server is a
local server built into the test application.
Tasks
1. scroll: scrolls the page down and back to up, measures frame rate
2. animation: animates a product 360 degrees image, measures frame rate
3. carousel: animates the product carousel when different products are
selected, measures frame rate
4. addtocart: adds a product to shopping cart, measures time
Scoring
𝑃𝑟𝑖𝑚𝑎𝑟𝑦 𝑟𝑒𝑠𝑢𝑙𝑡 = 𝐺𝐸𝑂𝑀𝐸𝐴𝑁(1
𝑅1,
1
𝑅2, 𝑅3)
Where:
𝑅1 = itemanimation_result secondary result 𝑅2 = carousel_result secondary result 𝑅3 = scroll_latency secondary result

Page 33 of 90
Writing
Components stressed by this workload CPU, storage system
Benchmarks that use this test Home, Work
Implementation
This workload represents basic word processing activity. The test uses a
custom text editor written in C# for .NET Framework 4.5. The workload
stresses the Microsoft Rich Edit control.
The workload steps through a series of common word processing tasks,
recording the time taken to complete each task.
Tasks
1. Load Document 1, display in a window
2. Load Document 2, display in a window
3. Copy a large part of Document 1 and paste into Document 2
4. Save As with Document 2
5. Resize Document 2 window
6. Cut and paste parts of Document 2 around within the document
7. Save Document 2
8. Type some text in Document 2
9. Save Document 2
10. Insert some pictures from a local drive in Document 2
11. Save Document 2
Summary
File size Pages Word count Images
Initial document
53.5 MB 73 17,801 5
Final document 67.2 MB 110 30,587 10

Page 34 of 90
Scoring
𝑃𝑟𝑖𝑚𝑎𝑟𝑦 𝑟𝑒𝑠𝑢𝑙𝑡 = 𝐺𝐸𝑂𝑀𝐸𝐴𝑁(𝑅1, 𝑅2, 𝑅3, 𝑅4, 𝑅5, 𝑅6, 𝑅7, 𝑅8, 𝑅9, 𝑅10, 𝑅11)
Where:
𝑅1 = source_document_display_time secondary result 𝑅2 = destination_document_display_time secondary result 𝑅3 = copy_and_paste_time secondary result 𝑅4 = save_target_document_1_time secondary result 𝑅5 = resize_target_document_window_time secondary result 𝑅6 = cut_and_paste_time secondary result 𝑅7 = save_target_document_2_time secondary result 𝑅8 = type_text_to_destination_document_time secondary result 𝑅9 = save_target_document_3_time secondary result 𝑅10 = add_pictures_to_destination_document secondary result 𝑅11 = save_target_document_4_time secondary result

Page 35 of 90
Casual Gaming
Components stressed by this workload CPU, GPU
Benchmarks that use this test Home
Implementation
The workload represents the demands of a casual DirectX 9 game with 3D
graphics using ShaderModel 2.0 capable hardware delivers a high and
consistent frame rate.
This workload uses the Firefly test that first appeared in 3DMark06 and has
since been used as the DirectX 9 graphics test in PCMark Vantage and PCMark
7. More details can be found in the 3DMark06 Technical Guide.
In this workload a forest is inhabited by magic fireflies that playfully fly around
the forest. There are a large number of trees with branches swaying separately
in the light breeze, and there is dense vegetation on the ground. The
vegetation is dynamically distributed according to the camera movements. The
level of detail is also dynamically altered depending on the distance to the
camera.
The ground material uses diffuse, diffuse detail, normal and normal detail
maps. The rock surfaces also have a specular map. The tree branches are also
a modified material without a specular map and with a diffuse cube map and
no bump mapping. The sky is created using a procedural light scattering
shader.
The moonlight is directional, generating cascading shadow maps. The
illuminating fireflies are shadow mapped point lights with a cubemap mask.
The illuminating fireflies are masked point lights, throwing shadows using a
1024 × 1024 × 6 cube depth map/hardware shadow maps.
Scoring
The primary result is the average frames per second during the test.

Page 36 of 90
Mainstream Gaming
Components stressed by this workload CPU, GPU
Benchmarks that use this test Creative
Implementation
This workload represents the demands of modern mainstream DirectX 11
video games. Powerful hardware delivers a high and consistent frame rate.
The workload uses Graphics tests 3 and 4 from 3DMark 11. The tests run at
1280 × 720 in windowed mode otherwise the settings are the same used in the
3DMark 11 Performance preset. More details can be found in the 3DMark 11
Technical Guide.
Part 1
PCMark 8 Mainstream Gaming part 1 uses the same workload as 3DMark 11
Graphics test 3 running under the Performance preset.
The workload renders a scene with one shadow casting directional light and a
moderate number of non-shadow casting point lights. Volumetric illumination
is only enabled for the shadow casting directional light. The shadow casting
directional light uses volumetric illumination with optical density varied along
world space height. The scene contains tessellated geometry.
Part 2
PCMark 8 Mainstream Gaming part 2 uses the same workload as 3DMark 11
Graphics test 4 running under the Performance preset.
The workload renders a scene with one shadow casting directional light and a
few shadow casting spot lights is rendered. The scene uses volumetric
illumination with optical density varied along world space height. Majority of
the rendering workload comes from drawing tessellated geometry to shadow
maps and G-buffer.
Scoring
The primary result is the average frames per second during the test.

Page 37 of 90
Photo Editing v2 in Home 3.0, Creative 3.0
Components stressed by this workload CPU, GPU (with OpenCL)
Benchmarks that use this test Home, Creative
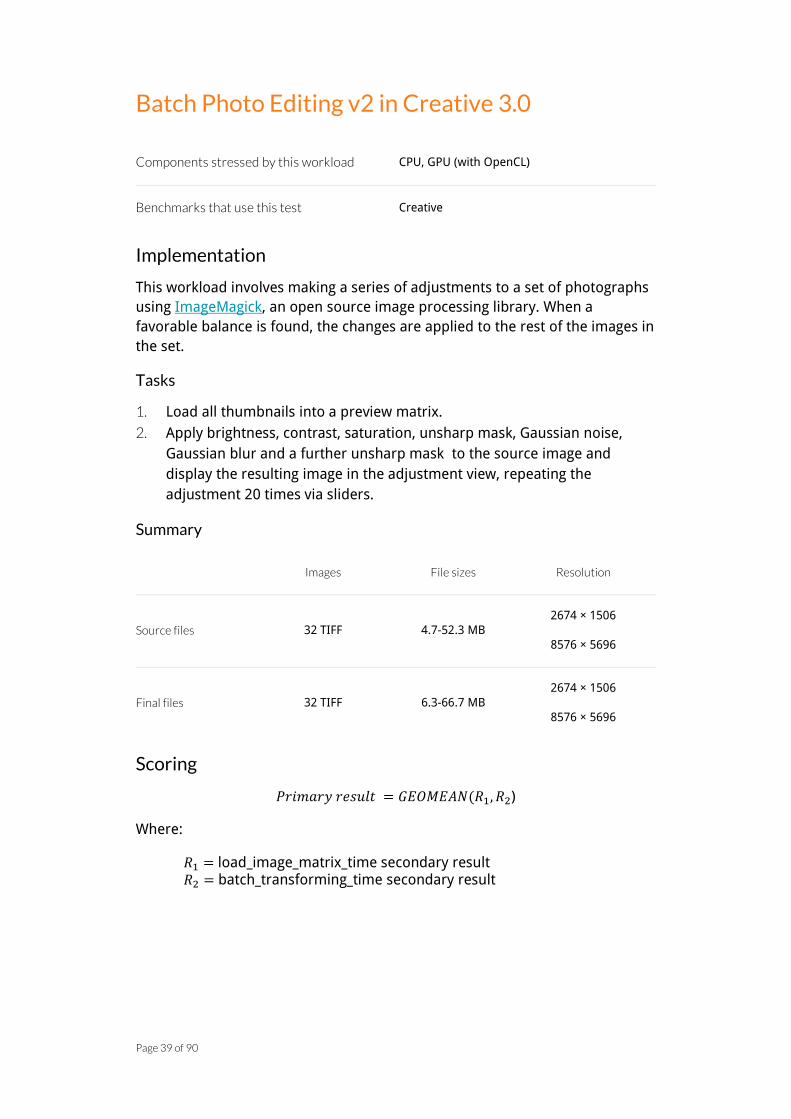
Implementation
This workload involves making a series of adjustments to a set of photographs
using ImageMagick, an open source image processing library. When a
favorable balance is found, the changes are applied to the rest of the images in
the set.
Tasks
1. Load all thumbnails into a previewing matrix
2. Load and display a source image into the adjustment view
3. Apply brightness, contrast, saturation, unsharp mask, Gaussian noise,
Gaussian blur and a further unsharp mask to the source image and
display the resulting image in the adjustment view, repeating the
adjustment 20 times via sliders.
Summary
Images File sizes Resolution
Source files 32 TIFF 4.7-52.3 MB 2674 × 1506
8576 × 5696
Final files 32 TIFF 6.3-66.7 MB 2674 × 1506
8576 × 5696
Scoring
𝑃𝑟𝑖𝑚𝑎𝑟𝑦 𝑟𝑒𝑠𝑢𝑙𝑡 = 𝐺𝐸𝑂𝑀𝐸𝐴𝑁(𝑅1, 𝑅2, 𝑅3, 𝑅4, 𝑅5, 𝑅6)
Where
𝑅1 = load_image_matrix_time 𝑅2 = color_adjusting_step_latency 𝑅3 = unshap_mask_1_step_latency 𝑅4 = noise_adding_latency 𝑅5 = gaussian_blur_step_latency 𝑅6 = unshap_mask_2_step_latency

Page 38 of 90
Photo Editing in Home 2.0, Creative 2.0 (Compatibility Mode)
Components stressed by this workload CPU, GPU if accelerated in GDI+
Benchmarks that use this test Home, Creative
Implementation
This workload involves making a series of adjustments to a set of photographs
using an image editing tool to adjust brightness, contrast, saturation and
gamma. When a favorable balance is found, the changes are applied to the rest
of the images in the set.
The test uses .NET 4.5 System.Drawing.Imaging API based on GDI+.
Tasks
1. Load all thumbnails into a previewing matrix
2. Load and display a source image into the adjustment view
3. Apply a color transformation to the source image and display the resulting
image in the adjustment view, repeating the adjustment 20 times via
sliders.
Summary
Images File sizes Resolution
Source files 32 TIFF 4.7-52.3 MB 2674 × 1506
8576 × 5696
Final files 32 TIFF 6.3-66.7 MB 2674 × 1506
8576 × 5696
Scoring
𝑃𝑟𝑖𝑚𝑎𝑟𝑦 𝑟𝑒𝑠𝑢𝑙𝑡 = 𝐺𝐸𝑂𝑀𝐸𝐴𝑁(𝑅1, 𝑅2, 𝑅3)
Where:
𝑅1 = thumbnail_loading_time secondary result 𝑅2 = adjustment_startup_time secondary result 𝑅3 = adjustment_time secondary result
Page 39 of 90
Batch Photo Editing v2 in Creative 3.0
Components stressed by this workload CPU, GPU (with OpenCL)
Benchmarks that use this test Creative
Implementation
This workload involves making a series of adjustments to a set of photographs
using ImageMagick, an open source image processing library. When a
favorable balance is found, the changes are applied to the rest of the images in
the set.
Tasks
1. Load all thumbnails into a preview matrix.
2. Apply brightness, contrast, saturation, unsharp mask, Gaussian noise,
Gaussian blur and a further unsharp mask to the source image and
display the resulting image in the adjustment view, repeating the
adjustment 20 times via sliders.
Summary
Images File sizes Resolution
Source files 32 TIFF 4.7-52.3 MB 2674 × 1506
8576 × 5696
Final files 32 TIFF 6.3-66.7 MB 2674 × 1506
8576 × 5696
Scoring
𝑃𝑟𝑖𝑚𝑎𝑟𝑦 𝑟𝑒𝑠𝑢𝑙𝑡 = 𝐺𝐸𝑂𝑀𝐸𝐴𝑁(𝑅1, 𝑅2)
Where:
𝑅1 = load_image_matrix_time secondary result 𝑅2 = batch_transforming_time secondary result
Page 40 of 90
Batch Photo Editing in Creative 2.0 (Compatibility Mode)
Components stressed by this workload CPU, GPU if accelerated in GDI+
Benchmarks that use this test Creative
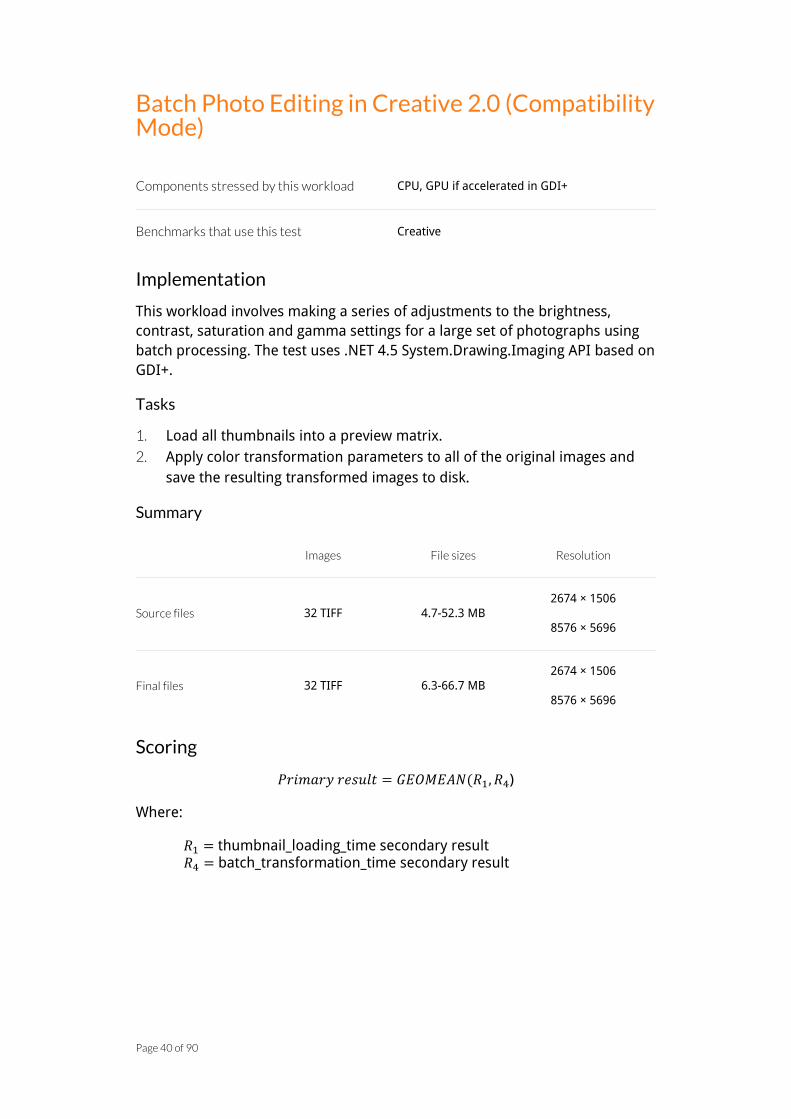
Implementation
This workload involves making a series of adjustments to the brightness,
contrast, saturation and gamma settings for a large set of photographs using
batch processing. The test uses .NET 4.5 System.Drawing.Imaging API based on
GDI+.
Tasks
1. Load all thumbnails into a preview matrix.
2. Apply color transformation parameters to all of the original images and
save the resulting transformed images to disk.
Summary
Images File sizes Resolution
Source files 32 TIFF 4.7-52.3 MB 2674 × 1506
8576 × 5696
Final files 32 TIFF 6.3-66.7 MB 2674 × 1506
8576 × 5696
Scoring
𝑃𝑟𝑖𝑚𝑎𝑟𝑦 𝑟𝑒𝑠𝑢𝑙𝑡 = 𝐺𝐸𝑂𝑀𝐸𝐴𝑁(𝑅1, 𝑅4)
Where:
𝑅1 = thumbnail_loading_time secondary result 𝑅4 = batch_transformation_time secondary result

Page 41 of 90
Video Editing v2 in Creative 3.0
Components stressed by this workload CPU, GPU (with OpenCL)
Benchmarks that use this test Creative
Implementation
The workload uses FFmpeg to apply video enhancement filters to a high bitrate
H.264 video and then encode it to a format suitable for distribution.
The FFmpeg binary used is custom built by Futuremark using a development
version of the source available from the project's code repository. Build
options are as default except that OpenCL is enabled.
Part 1
The workload applies a deshaking filter to a source video at 1920 × 1080 (HD
1080) before scaling down and outputting at 1280 × 720 (HD 720).
Command line:
FFmpeg.exe -y -v 40 -i videotest_shakycamera.mp4 -vf
"scale=w=1280:h=720:flags=bicubic,unsharp=opencl=%OCL%:lx=7:ly=7:la=0.56
:cx=7:cy=7:ca=0.28" -strict -2 -preset superfast -tune ssim -x264opts
ssim output.mp4
Part 2
The workload applies a deshaking filter to a source video at 3840 × 2160 (4K
UHD) before scaling down and outputting at 1920 × 1080 (HD 1080).
Command line:
FFmpeg.exe -y -v 40 -i videotest_shakycamera_4k.mp4 -vf
deshake=opencl=%OCL%:search=1:blocksize=32,crop=in_w-192:in_h-
108,scale=w=1920:h=1080 -strict -2 -vcodec libx264 -preset superfast -
tune ssim -x264opts ssim output.mp4
Scoring
Video editing part 1 primary result = runtime in seconds
Video editing part 2 primary result = runtime in seconds

Page 42 of 90
Video Editing in Creative 2.0 (Compatibility Mode)
Components stressed by this workload CPU and GPU depending on OpenCL setup
Benchmarks that use this test Creative
Implementation
The workload uses FFmpeg to apply video enhancement filters to a high bitrate
H.264 1080p video and then encode it to a format suitable for distribution.
The FFmpeg binary used is custom built by Futuremark using a development
version of the source available from the project's code repository. Build
options are as default except that OpenCL is enabled.
Part 1
The workload applies a deshaking filter to the video and encodes the output to
H.264 1080p.
Command line:
FFmpeg.exe -y -v 40 -i input.mp4 -vf
deshake=opencl=%OCL%:search=1:blocksize=32,crop=in_w-192:in_h-108 -
strict -2 -vcodec libx264 -preset superfast -tune ssim -x264opts ssim
output.mp4
Part 2
The workload blurs, scales down and sharpens the video to H.264 720p
resolution.
Command line:
FFmpeg.exe -y -v 40 -i input.mp4 -vf
"smartblur=lr=2:ls=1:lt=15:cr=2:cs=0.7:ct=15,scale=w=1280:h=720,unsharp=
lx=5:ly=5:la=2:cx=5:cy=5:ca=2" -strict -2 -preset superfast -tune ssim -
x264opts ssim output.mp4
Scoring
Video editing part 1 primary result = runtime in seconds
Video editing part 2 primary result = runtime in seconds

Page 43 of 90
Media To Go
Components stressed by this workload CPU, GPU or custom hardware depending on
the Windows Media Foundation encoders
Benchmarks that use this test Creative
Implementation
This workload includes three parts based on converting and syncing music and
video files from a PC to a portable device. The tests implement a
straightforward transcoding task using the Fast Transcode feature found in
Windows Media Foundation. The number of input files is fixed in all tests.
Music To Go
Audio to go transcodes a batch of songs in WAV format to 130 kbps AAC. The
test runs transcoding in parallel with the number of worker threads equal to
the number of logical cores in the CPU.
Files
Source WAV 32
Final AAC 32
Video To Go part 1
Video to go 720p downscales a batch of video clips in H264 1080p format to
H264 720p. The workload runs in one worker thread.
Files Resolution Bitrate
Source video 5 1920 × 1080 25 Mbps
Final video 5 1280 × 720 5 MBps
Video To Go part 2
Video to go 1080p reduces the bitrate of a batch of video clips in H264 1080p
format. The workload runs in one worker thread.

Page 44 of 90
Files Resolution Bitrate
Source video 5 1920 × 1080 25 Mbps
Final video 5 1920 × 1080 8 MBps
Scoring
Music To Go primary result = runtime in seconds
Video To Go part 1 primary result = runtime in seconds
Video To Go part 2 primary result = runtime in seconds
Page 45 of 90
Video Chat v2 in Home 3.0, Work 2.0
Components stressed by this workload
CPU, GPU or custom hardware depending on
the Windows Media Foundation encoders
and the OpenCL setup
Benchmarks that use this test Home, Work
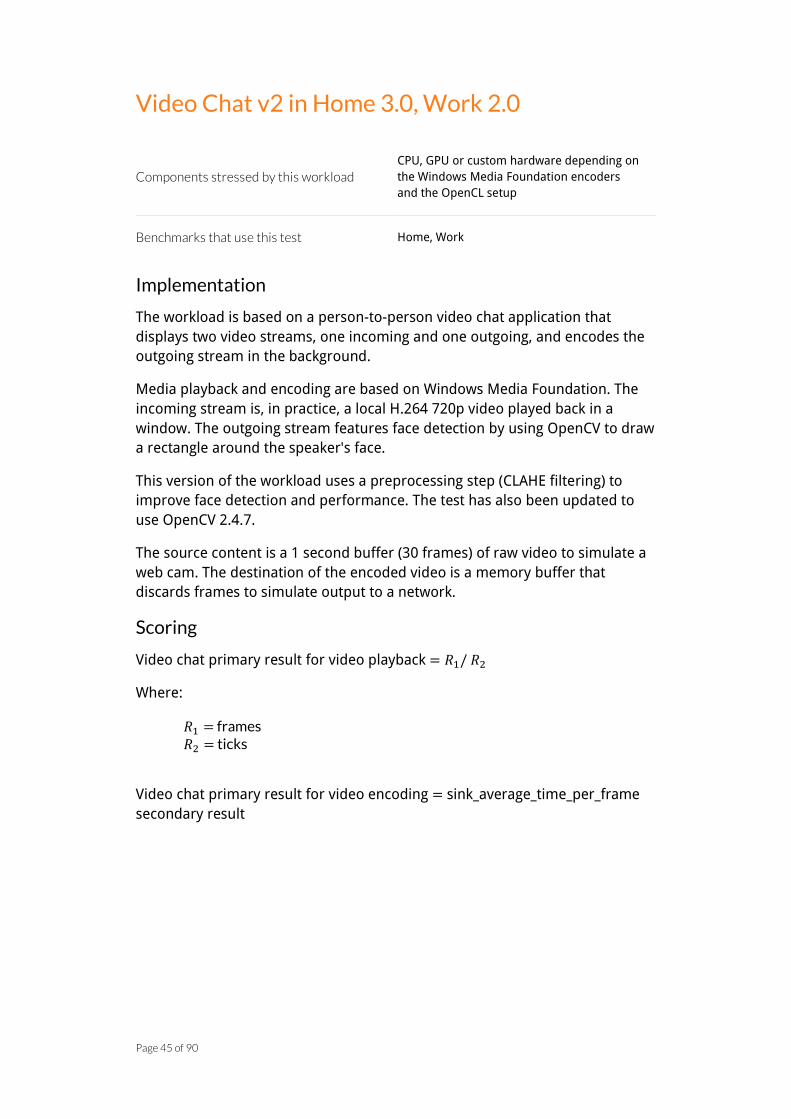
Implementation
The workload is based on a person-to-person video chat application that
displays two video streams, one incoming and one outgoing, and encodes the
outgoing stream in the background.
Media playback and encoding are based on Windows Media Foundation. The
incoming stream is, in practice, a local H.264 720p video played back in a
window. The outgoing stream features face detection by using OpenCV to draw
a rectangle around the speaker's face.
This version of the workload uses a preprocessing step (CLAHE filtering) to
improve face detection and performance. The test has also been updated to
use OpenCV 2.4.7.
The source content is a 1 second buffer (30 frames) of raw video to simulate a
web cam. The destination of the encoded video is a memory buffer that
discards frames to simulate output to a network.
Scoring
Video chat primary result for video playback = 𝑅1/ 𝑅2
Where:
𝑅1 = frames 𝑅2 = ticks
Video chat primary result for video encoding = sink_average_time_per_frame
secondary result

Page 46 of 90
Video Chat in Home 2.0 (Compatibility Mode)
Components stressed by this workload
CPU, GPU or custom hardware depending on
the Windows Media Foundation encoders
and the OpenCL setup
Benchmarks that use this test Home, Work
Implementation
The workload is based on a person-to-person video chat application that
displays two video streams, one incoming and one outgoing, and encodes the
outgoing stream in the background.
Media playback and encoding are based on Windows Media Foundation. The
incoming stream is, in practice, a local H.264 720p video played back in a
window. The outgoing stream features face detection using an open source
library called OpenCV that draws a rectangle around the speaker's face.
The source content is a 1 second buffer (30 frames) of raw video to simulate a
web cam. The destination of the encoded video is a memory buffer that
discards frames to simulate output to a network.
Scoring
Video chat primary result for video playback = 𝑅1/ 𝑅2
Where:
𝑅1 = frames 𝑅2 = ticks
Video chat primary result for video encoding = sink_average_time_per_frame
secondary result

Page 47 of 90
Video Group Chat v2 in Creative 3.0
Components stressed by this workload
CPU, GPU or custom hardware depending on
the Windows Media Foundation encoders
and the OpenCL setup
Benchmarks that use this test Creative
Implementation
The workload is based on a group video chat application that displays three
incoming video streams and one outgoing, which is encoded in the
background.
Media playback and encoding are based on Windows Media Foundation. The
incoming stream is, in practice, a local H.264 720p video played back in a
window. The outgoing stream features face detection by using OpenCV to draw
a rectangle around the speaker's face.
This version of the workload uses a preprocessing step (CLAHE filtering) to
improve face detection and performance. The test has also been updated to
use OpenCV 2.4.7.
The source content is a 1 second buffer (30 frames) of raw video to simulate a
web cam. The destination of the encoded video is a memory buffer that
discards frames to simulate output to a network.
Scoring
Video group chat primary result for video playback = 𝑅1/ 𝑅2
Where:
𝑅1 = frames 𝑅2 = ticks
Video group chat primary result for video encoding =
sink_average_time_per_frame secondary result

Page 48 of 90
Video Group Chat in Creative 2.0 (Compatibility Mode)
Components stressed by this workload
CPU, GPU or custom hardware depending on
the Windows Media Foundation encoders
and the OpenCL setup
Benchmarks that use this test Creative
Implementation
The workload is based on a group video chat application that displays three
incoming video streams and one outgoing, which is encoded in the
background.
Media playback and encoding are based on Windows Media Foundation. The
incoming stream is, in practice, a local H.264 720p video played back in a
window. The outgoing stream features face detection using an open source
library called OpenCV that draws a rectangle around the speaker's face.
The source content is a 1 second buffer (30 frames) of raw video to simulate a
web cam. The destination of the encoded video is a memory buffer that
discards frames to simulate output to a network.
Scoring
Video group chat primary result for video playback = 𝑅1/ 𝑅2
Where:
𝑅1 = frames 𝑅2 = ticks
Video group chat primary result for video encoding =
sink_average_time_per_frame secondary result
Page 49 of 90
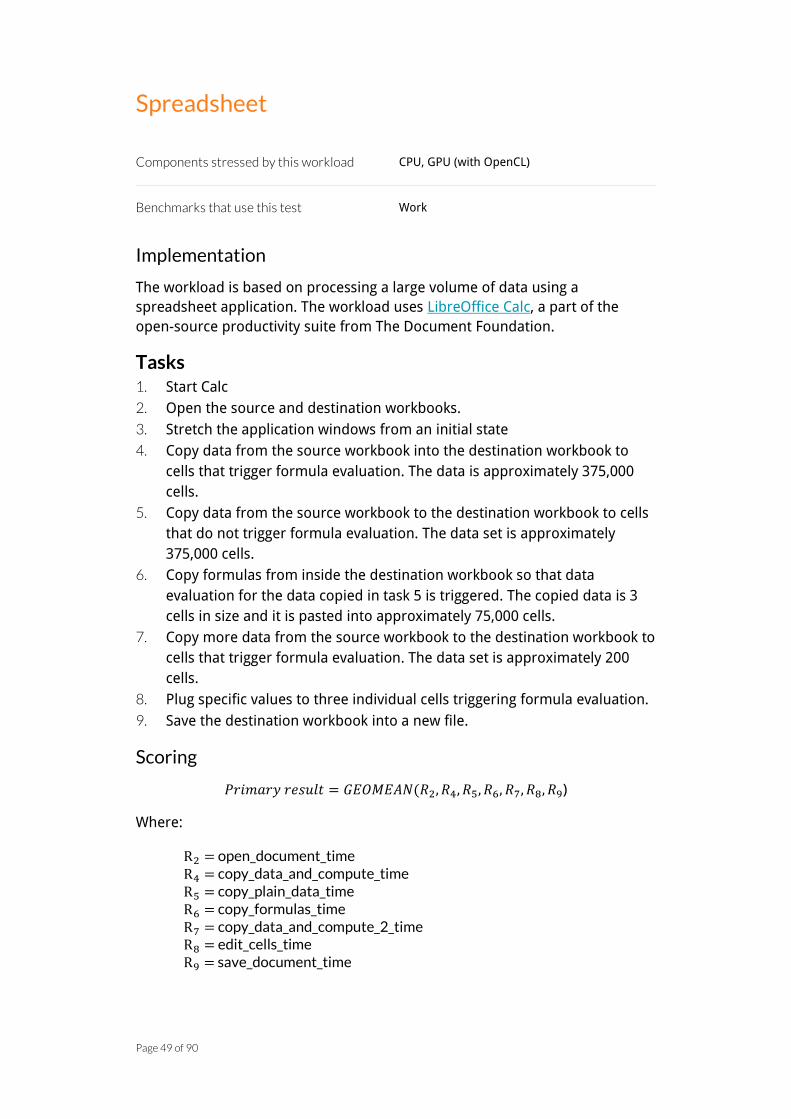
Spreadsheet
Components stressed by this workload CPU, GPU (with OpenCL)
Benchmarks that use this test Work
Implementation
The workload is based on processing a large volume of data using a
spreadsheet application. The workload uses LibreOffice Calc, a part of the
open-source productivity suite from The Document Foundation.
Tasks
1. Start Calc
2. Open the source and destination workbooks.
3. Stretch the application windows from an initial state
4. Copy data from the source workbook into the destination workbook to
cells that trigger formula evaluation. The data is approximately 375,000
cells.
5. Copy data from the source workbook to the destination workbook to cells
that do not trigger formula evaluation. The data set is approximately
375,000 cells.
6. Copy formulas from inside the destination workbook so that data
evaluation for the data copied in task 5 is triggered. The copied data is 3
cells in size and it is pasted into approximately 75,000 cells.
7. Copy more data from the source workbook to the destination workbook to
cells that trigger formula evaluation. The data set is approximately 200
cells.
8. Plug specific values to three individual cells triggering formula evaluation.
9. Save the destination workbook into a new file.
Scoring
𝑃𝑟𝑖𝑚𝑎𝑟𝑦 𝑟𝑒𝑠𝑢𝑙𝑡 = 𝐺𝐸𝑂𝑀𝐸𝐴𝑁(𝑅2, 𝑅4, 𝑅5, 𝑅6, 𝑅7, 𝑅8, 𝑅9)
Where:
R2 = open_document_time R4 = copy_data_and_compute_time R5 = copy_plain_data_time R6 = copy_formulas_time R7 = copy_data_and_compute_2_time R8 = edit_cells_time R9 = save_document_time
Page 50 of 90
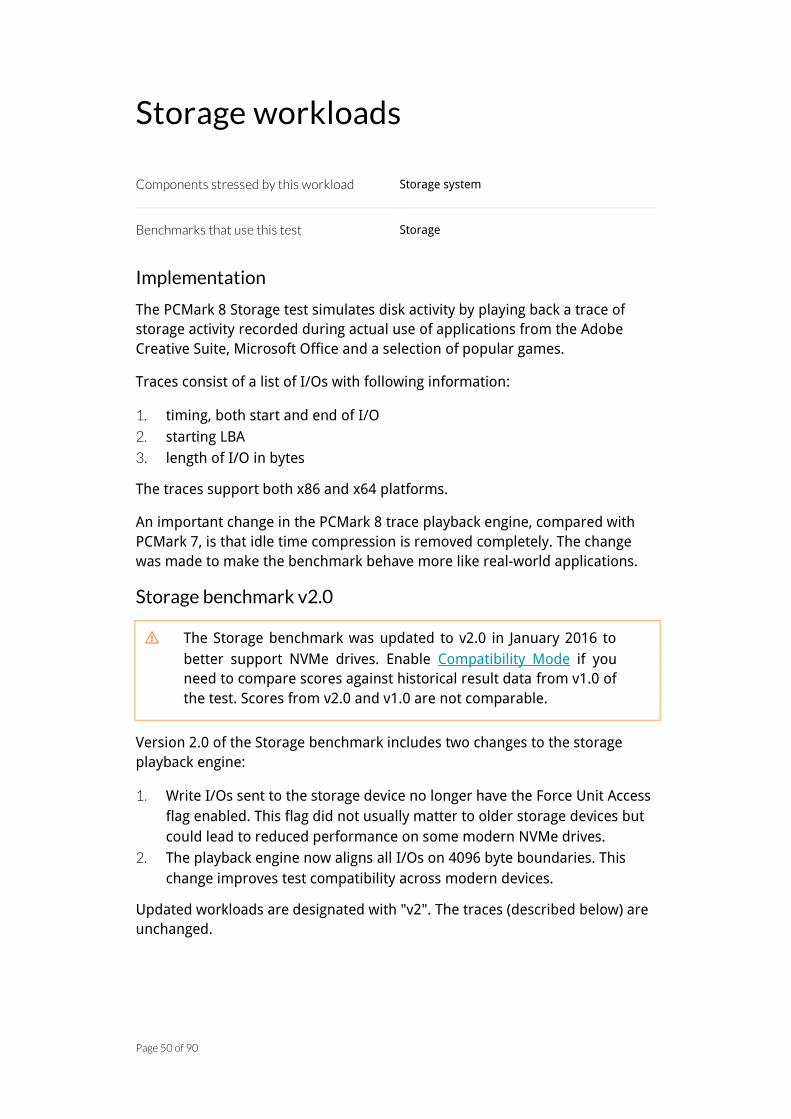
Storage workloads
Components stressed by this workload Storage system
Benchmarks that use this test Storage
Implementation
The PCMark 8 Storage test simulates disk activity by playing back a trace of
storage activity recorded during actual use of applications from the Adobe
Creative Suite, Microsoft Office and a selection of popular games.
Traces consist of a list of I/Os with following information:
1. timing, both start and end of I/O
2. starting LBA
3. length of I/O in bytes
The traces support both x86 and x64 platforms.
An important change in the PCMark 8 trace playback engine, compared with
PCMark 7, is that idle time compression is removed completely. The change
was made to make the benchmark behave more like real-world applications.
Storage benchmark v2.0
⚠ The Storage benchmark was updated to v2.0 in January 2016 to
better support NVMe drives. Enable Compatibility Mode if you
need to compare scores against historical result data from v1.0 of
the test. Scores from v2.0 and v1.0 are not comparable.
Version 2.0 of the Storage benchmark includes two changes to the storage
playback engine:
1. Write I/Os sent to the storage device no longer have the Force Unit Access
flag enabled. This flag did not usually matter to older storage devices but
could lead to reduced performance on some modern NVMe drives.
2. The playback engine now aligns all I/Os on 4096 byte boundaries. This
change improves test compatibility across modern devices.
Updated workloads are designated with "v2". The traces (described below) are
unchanged.

Page 51 of 90
Storage - Adobe Photoshop light
Storage trace recorded from the Adobe Photoshop light and heavy
Applications test.
Bytes read: 313 MB
Bytes written: 2336 MB
up to 4096 up to 64k
up to
128k: Total:
4k aligned
%
Sequential reads 479 680 349 1508 68.83%
Random reads 8215 9249 61 17525 68.25%
Sequential writes 223 861 17258 18342 99.91%
Random writes 214 246 1283 1743 99.20%
Storage - Adobe Photoshop heavy
Storage trace recorded from the Adobe Photoshop light and heavy
Applications test.
Bytes read: 468 MB
Bytes written: 5640 MB
up to 4096 up to 64k
up to
128k: Total:
4k aligned
%
Sequential reads 706 3288 283 4277 88.05%
Random reads 8980 9623 52 18655 68.94%
Sequential writes 250 904 43588 44742 100.00%
Random writes 440 208 1417 2065 98.64%

Page 52 of 90
Storage – Adobe Illustrator
Bytes read: 373 MB
Bytes written: 89 MB
up to 4096 up to 64k
up to
128k: Total:
4k aligned
%
Sequential reads 274 709 53 1036 65.64%
Random reads 9716 12181 26 21923 63.31%
Sequential writes 5 15 662 682 99.12%
Random writes 373 127 32 532 97.37%
Storage – Adobe InDesign
Bytes read: 401 MB
Bytes written: 624 MB
up to 4096 up to 64k
up to
128k: Total:
4k aligned
%
Sequential reads 575 1571 213 2359 37.94%
Random reads 10913 11240 54 22207 65.40%
Sequential writes 4 49 4821 4874 100.00%
Random writes 528 283 116 927 98.71%
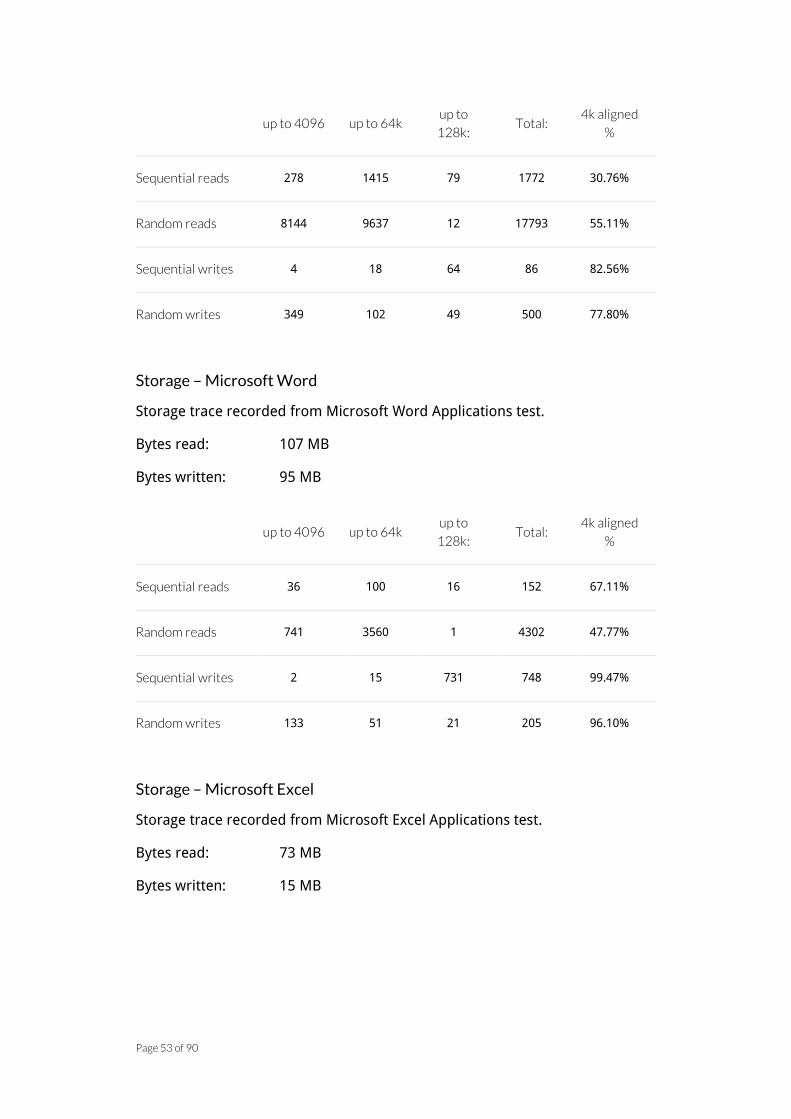
Storage - Adobe After Effects
Storage trace recorded from Adobe After Effects Applications test.
Bytes read: 311 MB
Bytes written: 16 MB
Page 53 of 90
up to 4096 up to 64k
up to
128k: Total:
4k aligned
%
Sequential reads 278 1415 79 1772 30.76%
Random reads 8144 9637 12 17793 55.11%
Sequential writes 4 18 64 86 82.56%
Random writes 349 102 49 500 77.80%
Storage – Microsoft Word
Storage trace recorded from Microsoft Word Applications test.
Bytes read: 107 MB
Bytes written: 95 MB
up to 4096 up to 64k
up to
128k: Total:
4k aligned
%
Sequential reads 36 100 16 152 67.11%
Random reads 741 3560 1 4302 47.77%
Sequential writes 2 15 731 748 99.47%
Random writes 133 51 21 205 96.10%
Storage – Microsoft Excel
Storage trace recorded from Microsoft Excel Applications test.
Bytes read: 73 MB
Bytes written: 15 MB

Page 54 of 90
up to 4096 up to 64k
up to
128k: Total:
4k aligned
%
Sequential reads 23 49 0 72 50.00%
Random reads 539 2609 0 3148 39.74%
Sequential writes 2 2 115 119 98.32%
Random writes 63 14 10 87 97.70%
Storage – Microsoft PowerPoint
Storage trace recorded from Microsoft PowerPoint Applications test.
Bytes read: 83 MB
Bytes written: 21 MB
up to 4096 up to 64k
up to
128k: Total:
4k aligned
%
Sequential reads 22 34 0 56 26.79%
Random reads 633 2808 0 3441 40.51%
Sequential writes 2 2 143 147 98.64%
Random writes 68 14 25 107 98.13%
Storage – World of Warcraft
The storage trace is recorded while the user starts World of Warcraft, logs in
and starts playing.
Bytes read: 390 MB
Bytes written: 5 MB

Page 55 of 90
up to 4096 up to 64k
up to
128k: Total:
4k aligned
%
Sequential reads 264 545 606 1415 93.07%
Random reads 5237 9308 382 14927 71.68%
Sequential writes 0 7 3 10 100.00%
Random writes 494 161 4 659 96.66%
Storage – Battlefield 3
The storage trace is recorded while the user starts Battlefield 3, logs in, loads a
saved game and starts playing.
Bytes read: 887 MB
Bytes written: 28 MB
up to 4096 up to 64k up to 128k Total 4k aligned
%
Sequential reads 1093 2716 1973 5782 90.35%
Random reads 24231 17920 1336 43487 88.79%
Sequential writes 12 39 167 218 97.71%
Random writes 268 135 28 431 92.81%

Page 56 of 90
Consistency test
PCMark 8 v2.3.293 added the ability to customize the Storage Consistency test.
You'll find details and instructions in the PCMark 8 Storage Consistency
Customization Guide.
Precondition phase
1. Write the drive sequentially through up to the reported capacity with
random data, write size of 256 × 512 = 131,072 bytes.
2. Write it through a second time (to take care of overprovisioning).
Degradation phase
1. Run writes of random size between 8 × 512 and 2048 × 512 bytes on
random offsets for 10 minutes.
2. Run performance test (one pass only). The result is stored in secondary
results with name prefix degrade_result_X where X is a counter.
3. Repeat 1 and 2 for 8 times and on each pass increase the duration of
random writes by 5 minutes.
Steady state phase
1. Run writes of random size between 8 × 512 and 2048 × 512 bytes on
random offsets for final duration achieved in degradation phase.
2. Run performance test (one pass only). The result is stored in secondary
results with name prefix steady_result_X where X is a counter.
3. Repeat 1 and 2 for 5 times.
Recovery phase
1. Idle for 5 minutes.
2. Run performance test (one pass only). The result is stored in secondary
result with name recovery_result_X where X is a counter.
3. Repeat 1 and 2 for 5 times.
Clean up
1. Write the drive sequentially through up to the reported capacity with zero
data, write size of 256 × 512 = 131,072 bytes.
Page 57 of 90
Adaptivity test
The Adaptivity test has three phases:
Precondition phase
1. Write the drive sequentially through up to the reported capacity with
random data, write size of 256 × 512 = 131,072 bytes.
2. Write it through a second time (to take care of overprovisioning).
Steady state phase
1. Idle for 5 minutes.
2. Run performance test (one pass only). The result is stored in secondary
result with name steady_result_X where X is a counter.
3. Repeat 1 and 2 for 10 times.
Clean up
1. Write the drive sequentially through up to the reported capacity with zero
data, write size of 256 × 512 = 131,072 bytes.
Page 58 of 90
Application workloads

Page 59 of 90
Adobe Photoshop light
Components stressed by this workload CPU, storage
Benchmarks that use this test Applications
Implementation
The workload involves editing a series of photographs.
Tasks
1. Start Photoshop.
2. Open a series of 14 images, one by one. For each, perform a series of
operations:
2.1 Close the previous image if one is open.
2.2 Adjust color balance.
2.3 Apply auto levels.
2.4 Adjust shadows and highlights.
2.5 Downscale the image using bicubic interpolation.
2.6 Apply unsharp mask to the image.
2.7 Save the image into a new file.
3. Close the final image and exit Photoshop.
Summary
Images File sizes Resolution
Source
14 3.9–17.6 MB
2500 × 1677
6048 × 4032
Destination 14 388-778 KB 1200 × 800

Page 60 of 90
Scoring
𝑃𝑟𝑖𝑚𝑎𝑟𝑦 𝑟𝑒𝑠𝑢𝑙𝑡 = 𝐺𝐸𝑂𝑀𝐸𝐴𝑁(𝑅1, 𝑅2, 𝑅3, … , 𝑅24)
Where:
𝑅1 = open_photoshop_time secondary result 𝑅2 = process_image_01_time secondary result 𝑅3 = process_image_02_time secondary result 𝑅4 = process_image_03_time secondary result 𝑅5 = process_image_04_time secondary result 𝑅6 = process_image_05_time secondary result 𝑅7 = process_image_06_time secondary result 𝑅8 = process_image_07_time secondary result 𝑅9 = process_image_08_time secondary result 𝑅10 = process_image_09_time secondary result 𝑅11 = process_image_10_time secondary result 𝑅12 = process_image_11_time secondary result 𝑅13 = process_image_12_time secondary result 𝑅14 = open_image_13_time secondary result 𝑅15 = adjust_colors_of_image_13_time secondary result 𝑅16 = resize_image_13_time secondary result 𝑅17 = apply_unsharp_mask_to_image_13_time secondary result e, 𝑅18 = save_image_13_time secondary result 𝑅19 = open_image_14_time secondary result 𝑅20 = adjust_colors_of_image_14_time secondary result 𝑅21 = resize_image_14_time secondary result 𝑅22 = apply_unsharp_mask_to_image_14_time secondary result 𝑅23 = save_image_14_time secondary result 𝑅24 = close_photoshop_time secondary result

Page 61 of 90
Adobe Photoshop heavy
Components stressed by this workload CPU, storage
Benchmarks that use this test Applications
Implementation
The workload is based on editing a high-resolution photo to create a poster.
Tasks
1. Start Photoshop.
2. Open a PSD document.
3. Upscale the image using bicubic interpolation.
4. Change the color depth to 16 bits per channel.
5. Create a color range selection and paste it into a new layer.
6. Merge the two existing image layers and place the new layer topmost.
7. Apply lens blur to the topmost layer.
8. Select an elliptical area in the topmost layer and remove it.
9. Merge all existing layers into a new topmost layer.
10. Apply Gaussian blur to the topmost layer.
11. Select a gradient mask and remove the selection from the topmost layer.
12. Reduce the opacity of the topmost layer.
13. Save the image into a new PSD file.
14. Export the image into a new TIFF file.
15. Flatten the image and downscale it using bicubic interpolation.
16. Apply unsharp mask on the image.
17. Export the image into a new JPEG file.
18. Close the image and exit Photoshop.
Summary
File size Resolution DPI Layers
Source PSD 113 MB 5184 × 7744 300 DPI 1
Final PSD 1320 MB 7000 × 10457 300 DPI 4
Final TIFF 476 MB 7000 × 10457 300 DPI n/a
Final JPEG 177 KB 1000 × 1494 300 DPI n/a
Page 62 of 90
Scoring
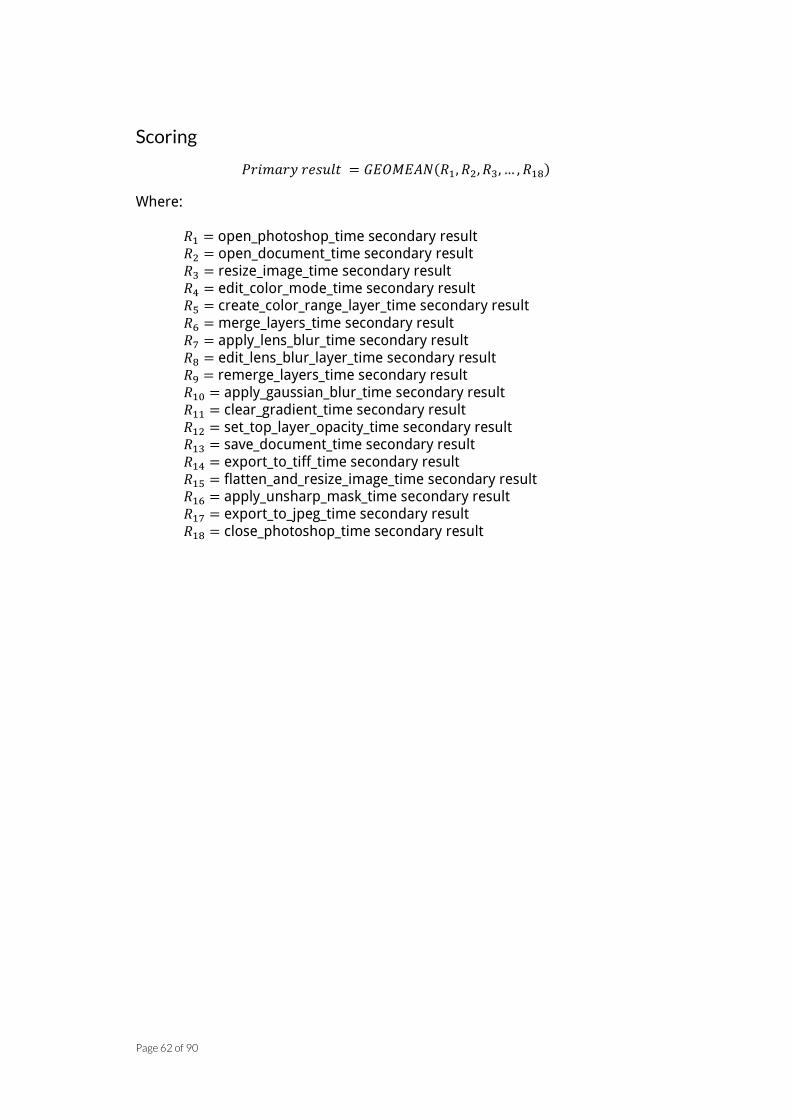
𝑃𝑟𝑖𝑚𝑎𝑟𝑦 𝑟𝑒𝑠𝑢𝑙𝑡 = 𝐺𝐸𝑂𝑀𝐸𝐴𝑁(𝑅1, 𝑅2, 𝑅3, … , 𝑅18)
Where:
𝑅1 = open_photoshop_time secondary result 𝑅2 = open_document_time secondary result 𝑅3 = resize_image_time secondary result 𝑅4 = edit_color_mode_time secondary result 𝑅5 = create_color_range_layer_time secondary result 𝑅6 = merge_layers_time secondary result 𝑅7 = apply_lens_blur_time secondary result 𝑅8 = edit_lens_blur_layer_time secondary result 𝑅9 = remerge_layers_time secondary result 𝑅10 = apply_gaussian_blur_time secondary result 𝑅11 = clear_gradient_time secondary result 𝑅12 = set_top_layer_opacity_time secondary result 𝑅13 = save_document_time secondary result 𝑅14 = export_to_tiff_time secondary result 𝑅15 = flatten_and_resize_image_time secondary result 𝑅16 = apply_unsharp_mask_time secondary result 𝑅17 = export_to_jpeg_time secondary result 𝑅18 = close_photoshop_time secondary result

Page 63 of 90
Adobe InDesign
Components stressed by this workload CPU, storage
Benchmarks that use this test Applications
Implementation
The workload involves preparing a publication with a large number of images.
Tasks
1. Start InDesign.
2. Open an InDesign document.
3. Resize and reposition images. Add a colored rectangle for decoration.
4. Change the document's margin settings.
5. Add text into the document.
6. Save the document into a new file.
7. Export the document into a new PDF file.
8. Close the document and exit InDesign.
Summary
File size Pages Images
Initial file 385 MB 40 42
Final file 378 MB 40 40
Final PDF 64.7 MB 40 40
Scoring
𝑃𝑟𝑖𝑚𝑎𝑟𝑦 𝑟𝑒𝑠𝑢𝑙𝑡 = 𝐺𝐸𝑂𝑀𝐸𝐴𝑁(𝑅1, 𝑅2, 𝑅3, 𝑅4, 𝑅5, 𝑅6, 𝑅7, 𝑅8)
Where:
𝑅1 = open_indesign_time secondary result 𝑅2 = open_document_time secondary result 𝑅3 = place_images_time secondary result 𝑅4 = adjust_margins_time secondary result 𝑅5 = add_text_time secondary result 𝑅6 = save_documents_time secondary result 𝑅7 = export_to_pdf_time secondary result 𝑅8 = close_indesign_time secondary result

Page 64 of 90
Adobe Illustrator
Components stressed by this workload CPU, storage
Benchmarks that use this test Applications
Implementation
The workload involves preparing a presentation based on images created using
Photoshop.
Tasks
1. Start Illustrator.
2. Open an Illustrator document.
3. Resize and reposition images. Add a translucent filled rectangle for color
effect.
4. Vectorize the images in the document.
5. Add text labels, lines, rectangles, ellipses, stars and a curved path into the
document.
6. Save the document into a new file.
7. Export the document into a PDF file.
8. Close the document and exit Illustrator.
Summary
File size
Initial file 733 KB
Final file 6.2 MB
Final PDF 5.6 MB
Scoring
𝑃𝑟𝑖𝑚𝑎𝑟𝑦 𝑟𝑒𝑠𝑢𝑙𝑡 = 𝐺𝐸𝑂𝑀𝐸𝐴𝑁(𝑅1, 𝑅2, 𝑅3, 𝑅4, 𝑅5, 𝑅6, 𝑅7, 𝑅8)
Where:
𝑅1 = open_illustrator_time secondary result 𝑅2 = open_document_time secondary result 𝑅3 = resize_and_move_time secondary result 𝑅4 = vectorize_time secondary result 𝑅5 = add_items_time secondary result

Page 65 of 90
𝑅6 = save_time secondary result 𝑅7 = export_time secondary result 𝑅8 = close_illustrator_time secondary result

Page 66 of 90
Adobe After Effects in Adobe Creative Cloud test v2.0
Components stressed by this workload CPU, storage
Benchmarks that use this test Applications
Implementation
The user runs After Effects to render a video that has been prepared earlier.
The user wants the rendering to complete as quickly as possible.
Tasks
The prepared video is passed to AERender for processing at 1920 × 1080
(1080p) at 30 fps.
The settings used are:
Uncompressed AVI
Summary
File size Resolution Data rate Audio Total bitrate
Final file 890 MB 1080p, 30 fps 1458 Mbps
1536 kbps
@ 48 kHZ
stereo
1459 Mbps
Scoring
The primary result is the time spent on rendering.

Page 67 of 90
Adobe After Effects in Adobe Creative Suite test v1.0 (Compatibility Mode)
Components stressed by this workload CPU, storage
Benchmarks that use this test Applications
Implementation
The user runs After Effects to render a video that has been prepared earlier.
The user wants the rendering to complete as quickly as possible.
Tasks
The prepared video is passed to AERender for processing at 1920 × 1080 at 30
frames per second.
The settings used are:
Windows Media Video 9 advanced profile
Constant bitrate 0.9 Mbps
Image quality 98
Keyframe interval 1 second
Buffer size 1 seconds
Constant bitrate audio 256 kbps, 44 kHz, stereo (A/V) CBR
Windows Media Audio 9.2
Summary
File size Resolution Data rate Audio Total bitrate
Final file 5.64 MB 1080p, 30 fps 0.9 Mbps
256 kbps @
44 kHZ
stereo
0.9256 Mbps
Scoring
The primary result is the time spent on rendering.
Page 68 of 90
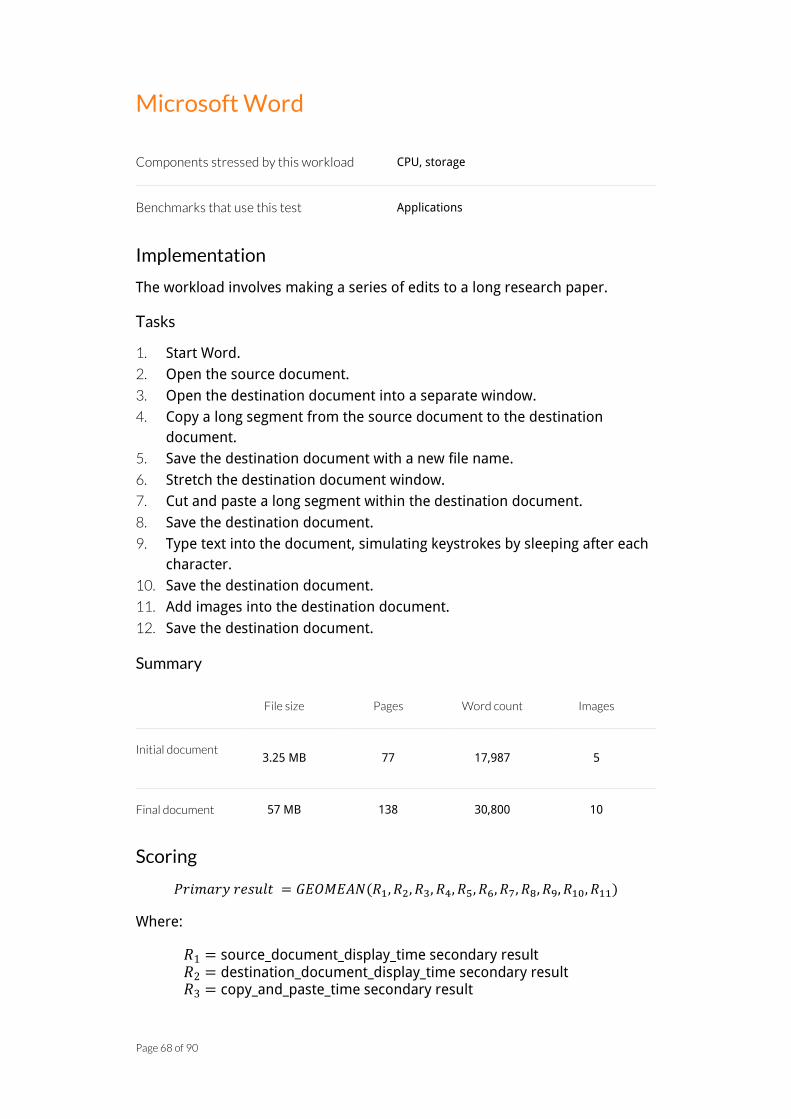
Microsoft Word
Components stressed by this workload CPU, storage
Benchmarks that use this test Applications
Implementation
The workload involves making a series of edits to a long research paper.
Tasks
1. Start Word.
2. Open the source document.
3. Open the destination document into a separate window.
4. Copy a long segment from the source document to the destination
document.
5. Save the destination document with a new file name.
6. Stretch the destination document window.
7. Cut and paste a long segment within the destination document.
8. Save the destination document.
9. Type text into the document, simulating keystrokes by sleeping after each
character.
10. Save the destination document.
11. Add images into the destination document.
12. Save the destination document.
Summary
File size Pages Word count Images
Initial document
3.25 MB 77 17,987 5
Final document 57 MB 138 30,800 10
Scoring
𝑃𝑟𝑖𝑚𝑎𝑟𝑦 𝑟𝑒𝑠𝑢𝑙𝑡 = 𝐺𝐸𝑂𝑀𝐸𝐴𝑁(𝑅1, 𝑅2, 𝑅3, 𝑅4, 𝑅5, 𝑅6, 𝑅7, 𝑅8, 𝑅9, 𝑅10, 𝑅11)
Where:
𝑅1 = source_document_display_time secondary result 𝑅2 = destination_document_display_time secondary result 𝑅3 = copy_and_paste_time secondary result

Page 69 of 90
𝑅4 = save_target_document_1_time secondary result 𝑅5 = resize_target_document_window_time secondary result 𝑅6 = cut_and_paste_time secondary result 𝑅7 = save_target_document_2_time secondary result 𝑅8 = type_text_to_destination_document_time secondary result 𝑅9 = save_target_document_3_time secondary result 𝑅10 = add_pictures_to_destination_document secondary result 𝑅11 = save_target_document_4_time secondary result

Page 70 of 90
Microsoft Excel
Components stressed by this workload CPU, storage
Benchmarks that use this test Applications
Implementation
The workload involves making a series of changes and additions to a large
Excel workbook.
Tasks
1. Start Excel.
2. Open the source and destination workbooks.
3. Stretch the application window.
4. Copy data from the source workbook into the destination workbook to
cells that trigger formula evaluation. The data set is approximately 75,000
cells.
5. Copy more data from the source workbook to the destination workbook to
cells that do not trigger formula evaluation. The data set is approximately
75,000 cells.
6. Copy formulas from inside the destination workbook so that data
evaluation for the data copied in task 5 is triggered. The copied data is 3
cells in size and it is pasted into approximately 15,000 cells.
7. Copy more data from the source workbook to the destination workbook to
cells that trigger formula evaluation. The data set is approximately 20
cells.
8. Plug specific values to three individual cells triggering formula evaluation.
9. Save the destination workbook into a new file.
Summary
File size Worksheets Active cells
Initial files
4.62 MB
2.33 MB 4 240,800 approx.
Final file 4.18 MB 2 10,930 approx.
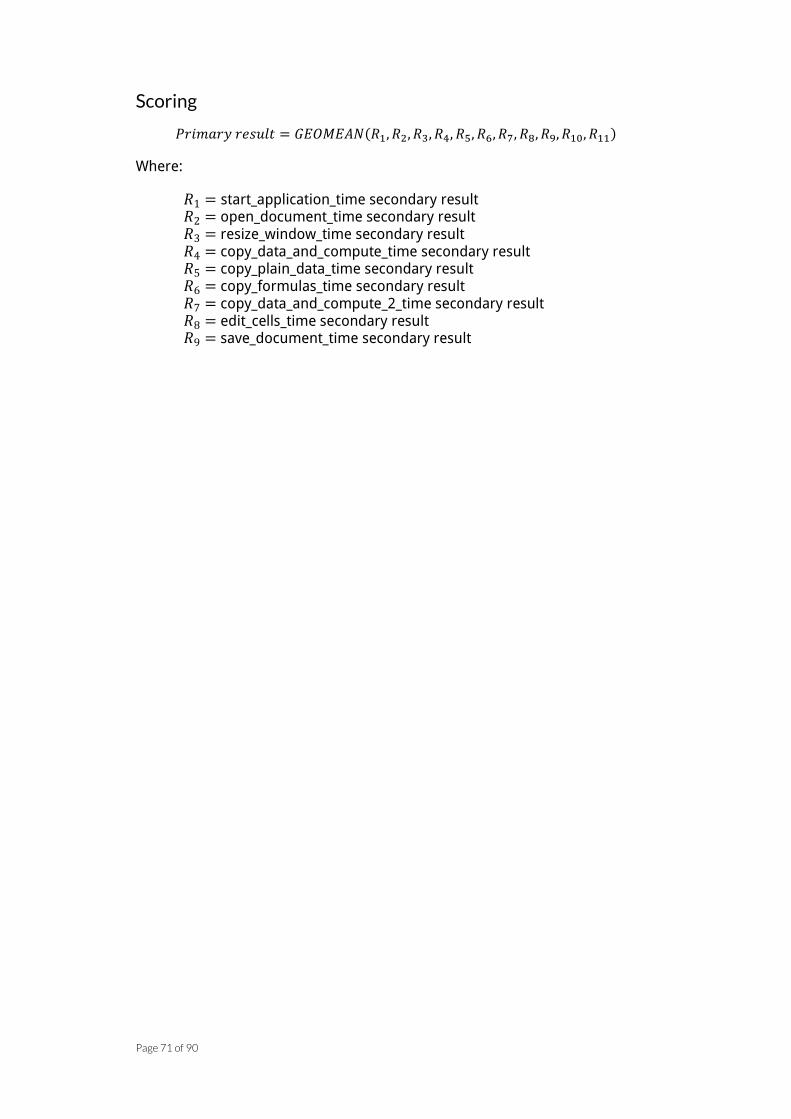
Page 71 of 90
Scoring
𝑃𝑟𝑖𝑚𝑎𝑟𝑦 𝑟𝑒𝑠𝑢𝑙𝑡 = 𝐺𝐸𝑂𝑀𝐸𝐴𝑁(𝑅1, 𝑅2, 𝑅3, 𝑅4, 𝑅5, 𝑅6, 𝑅7, 𝑅8, 𝑅9, 𝑅10, 𝑅11)
Where:
𝑅1 = start_application_time secondary result 𝑅2 = open_document_time secondary result 𝑅3 = resize_window_time secondary result 𝑅4 = copy_data_and_compute_time secondary result 𝑅5 = copy_plain_data_time secondary result 𝑅6 = copy_formulas_time secondary result 𝑅7 = copy_data_and_compute_2_time secondary result 𝑅8 = edit_cells_time secondary result 𝑅9 = save_document_time secondary result
Page 72 of 90
Microsoft PowerPoint
Components stressed by this workload CPU, storage
Benchmarks that use this test Applications
Implementation
The workload involves making a series of edits to an image-rich PowerPoint
presentation.
Tasks
1. Start PowerPoint.
2. Open the presentation.
3. Stretch the application window.
4. Browse through each slide in turn and simulate reviewing by sleeping
each slide.
5. Add a slide to the presentation.
6. Add an image to the new slide and crop it.
7. Add text to the new slide.
8. Save the finished presentation into a new file.
9. Export the presentation into a PDF file.
Summary
File size Slides Images
Initial files
27.1 MB 15 12
Final PDF 2.83 MB 16 13
Scoring
𝑃𝑟𝑖𝑚𝑎𝑟𝑦 𝑟𝑒𝑠𝑢𝑙𝑡 = 𝐺𝐸𝑂𝑀𝐸𝐴𝑁(𝑅1, 𝑅2, 𝑅3, 𝑅4, 𝑅5, 𝑅6)
Where:
𝑅1 = start_application_time secondary result 𝑅2 = open_document_time secondary result 𝑅3 = browse_document_time secondary result 𝑅4 = add_and_adjust_image_time secondary result 𝑅5 = add_text_time secondary result 𝑅6 = export_to_pdf_time secondary result

Page 73 of 90
Benchmark Scores

Page 74 of 90
How to report scores from PCMark 8
Please follow these guidelines when including PCMark 8 scores in reviews or
marketing materials to avoid confusing your customers and to ensure you
represent our software correctly.
Each test gives its own score, which you can use to compare similar devices or
systems. There is no overall 3DMark score. Scores from different tests are not
comparable. Do not use PCMark as a unit of measurement.
"Tablet scores 2,000 in PCMark 8 Creative Accelerated benchmark."
"Tablet scores 2,000 PCMarks."
Always include details of the hardware setup you used to obtain the score. Be
sure to include the operating system, system hardware and version numbers
for relevant drivers.
Using PCMark scores in marketing material
You must have a commercial license to use PCMark 8 scores in marketing
material. A commercial license is granted with the purchase of PCMark 8
Professional Edition or through our site licensing program.
On the first mention of PCMark 8 in marketing text, such as an advertisement
or product brochure, please write "PCMark 8 benchmark" in order to protect
our trademark. For example:
"We recommend the PCMark® 8 benchmark from Futuremark®."
Please include our legal text in your small print.
PCMark® is a registered trademark of Futuremark Corporation.

Page 75 of 90
Scoring
Each test run reports a score. Scores from different tests are not comparable.
For instance, you should not compare Home scores directly with Creative
scores.
Home 3.0, Home 2.0 (Compatibility Mode)
𝑃𝐶𝑀𝑎𝑟𝑘 8 𝐻𝑜𝑚𝑒 𝑠𝑐𝑜𝑟𝑒 =𝐾
𝐺𝐸𝑂𝑀𝐸𝐴𝑁(𝑅1, 𝑅2, 𝑅3, 𝑅4, 𝐺𝐸𝑂𝑀𝐸𝐴𝑁 (1
𝑅5, 𝑅6) ,
1𝑅7
)
Where:
𝑅1 = Web Browsing - JunglePin primary result 𝑅2 = Web Browsing - Amazonia primary result 𝑅3 = Writing primary result 𝑅4 = Photo Editing primary result 𝑅5 = Video Chat playback 1 primary result 𝑅6 = Video Chat encoding primary result 𝑅7 = Casual Gaming primary result
And depending on the test version:
K = 2100 for Home 2.0 K = 1200 for Home 3.0

Page 76 of 90
Creative 3.0, Creative 2.0 (Compatibility Mode)
𝑃𝐶𝑀𝑎𝑟𝑘 8 𝐶𝑟𝑒𝑎𝑡𝑖𝑣𝑒 𝑠𝑐𝑜𝑟𝑒
=𝐾
𝐺𝐸𝑂𝑀𝐸𝐴𝑁(𝑅1, 𝑅2, 𝐺𝐸𝑂𝑀𝐸𝐴𝑁 (𝐺𝐸𝑂𝑀𝐸𝐴𝑁 (1
𝑅3,
1𝑅4
,1
𝑅5) , 𝑅6) , 𝑅7, 𝑅8, 𝐺𝐸𝑂𝑀𝐸𝐴𝑁(𝑅9, 𝑅10), 𝐺𝐸𝑂𝑀𝐸𝐴𝑁(𝑅11, 𝑅12, 𝑅13),
1𝐺𝐸𝑂𝑀𝐸𝐴𝑁(𝑅14, 𝑅15)
)
Where:
𝑅1 = Web Browsing - JunglePin primary result 𝑅2 = Web Browsing - Amazonia primary result 𝑅3 = Video Group Chat playback 1 primary result 𝑅4 = Video Group Chat playback 2 primary result 𝑅5 = Video Group Chat playback 3 primary result 𝑅6 = Video Group Chat encoding primary result 𝑅7 = Photo Editing primary result 𝑅8 = Batch Photo Editing primary result 𝑅9 = Video Editing 1 primary result 𝑅10 = Video Editing 2 primary result 𝑅11 = Video To Go 1080p primary result 𝑅12 = Video To Go 720p primary result 𝑅13 = Audio To Go primary result 𝑅14 = Mainstream Gaming 1 primary result 𝑅15 = Mainstream Gaming 2 primary result
And depending on the test version:
K = 6800 for Creative 2.0 K = 5200 for Creative 3.0
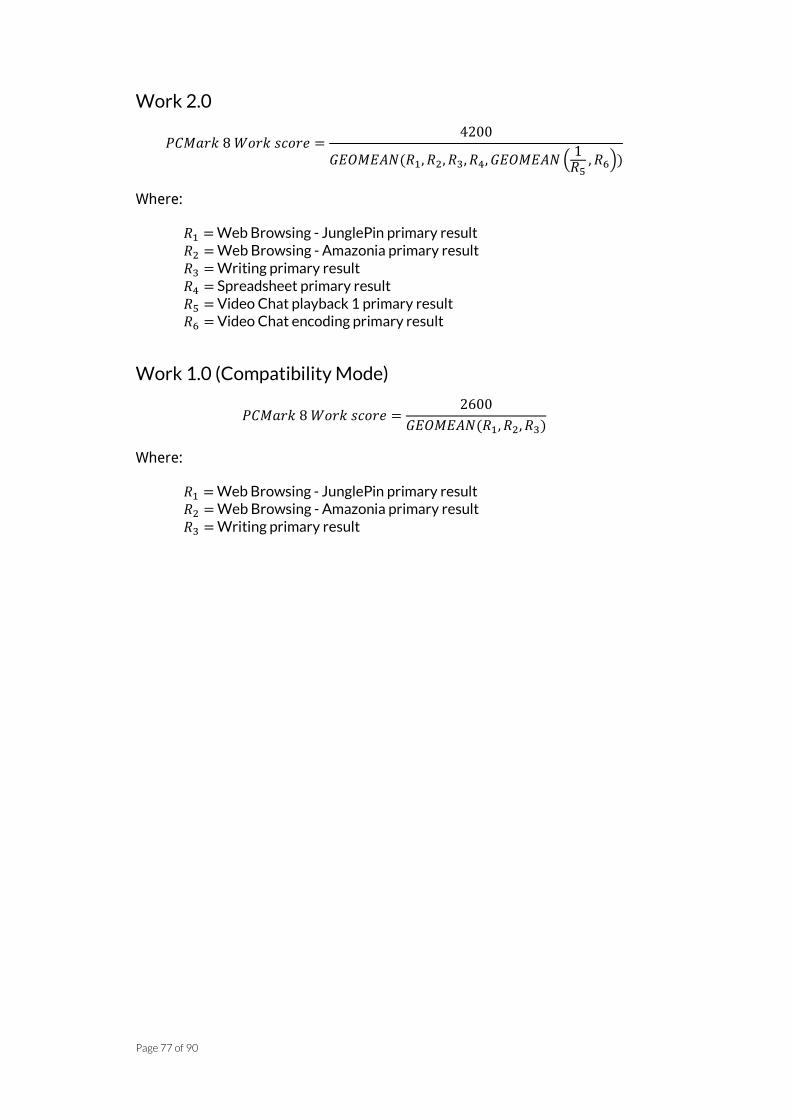
Page 77 of 90
Work 2.0
𝑃𝐶𝑀𝑎𝑟𝑘 8 𝑊𝑜𝑟𝑘 𝑠𝑐𝑜𝑟𝑒 =4200
𝐺𝐸𝑂𝑀𝐸𝐴𝑁(𝑅1, 𝑅2, 𝑅3, 𝑅4, 𝐺𝐸𝑂𝑀𝐸𝐴𝑁 (1
𝑅5, 𝑅6))
Where:
𝑅1 = Web Browsing - JunglePin primary result 𝑅2 = Web Browsing - Amazonia primary result 𝑅3 = Writing primary result 𝑅4 = Spreadsheet primary result 𝑅5 = Video Chat playback 1 primary result 𝑅6 = Video Chat encoding primary result
Work 1.0 (Compatibility Mode)
𝑃𝐶𝑀𝑎𝑟𝑘 8 𝑊𝑜𝑟𝑘 𝑠𝑐𝑜𝑟𝑒 =2600
𝐺𝐸𝑂𝑀𝐸𝐴𝑁(𝑅1, 𝑅2, 𝑅3)
Where:
𝑅1 = Web Browsing - JunglePin primary result 𝑅2 = Web Browsing - Amazonia primary result 𝑅3 = Writing primary result

Page 78 of 90
Storage
The primary result of each storage test is the total time elapsed while playing
back the trace. The primary result is used to calculate Storage score.
𝑃𝐶𝑀𝑎𝑟𝑘 8 𝑆𝑡𝑜𝑟𝑎𝑔𝑒 𝑠𝑐𝑜𝑟𝑒 =270000
𝐺𝐸𝑂𝑀𝐸𝐴𝑁(𝑅1, 𝑅2, 𝑅3, 𝑅4, 𝑅5, 𝑅6, 𝑅7, 𝑅8, 𝑅9, 𝑅10)
Where:
𝑅1 = Storage: World of Warcraft primary result 𝑅2 = Storage: Battlefield 3 primary result 𝑅3 = Storage: Adobe Photoshop light primary result 𝑅4 = Storage: Adobe Photoshop heavy primary result 𝑅5 = Storage: Adobe InDesign primary result 𝑅6 = Storage: Adobe After Effects primary result 𝑅7 = Storage: Adobe Illustrator primary result 𝑅8 = Storage: Microsoft Word primary result 𝑅9 = Storage: Microsoft Excel primary result 𝑅10 = Storage: Microsoft PowerPoint primary result
The secondary result of the test is bandwidth, which is the total amount of
bytes read and written during the test divided by busy time (in other words,
the time when the depth of the queue of pending I/O operations was at least
1). The bandwidth result is used to calculate Storage bandwidth, which is
reported along with Storage score.
𝑃𝐶𝑀𝑎𝑟𝑘 8 𝑆𝑡𝑜𝑟𝑎𝑔𝑒 𝑏𝑎𝑛𝑑𝑤𝑖𝑑𝑡ℎ, 𝑖𝑛 𝑀𝐵/𝑠
= 𝐺𝐸𝑂𝑀𝐸𝐴𝑁(𝑆1, 𝑆2, 𝑆3, 𝑆4, 𝑆5, 𝑆6, 𝑆7, 𝑆8, 𝑆9, 𝑆10)
Where:
𝑆1 = Storage: World of Warcraft bandwidth result 𝑆2 = Storage: Battlefield 3 bandwidth result 𝑆3 = Storage: Adobe Photoshop light bandwidth result 𝑆4 = Storage: Adobe Photoshop heavy bandwidth result 𝑆5 = Storage: Adobe InDesign bandwidth result 𝑆6 = Storage: Adobe After Effects bandwidth result 𝑆7 = Storage: Adobe Illustrator bandwidth result 𝑆8 = Storage: Microsoft Word bandwidth result 𝑆9 = Storage: Microsoft Excel bandwidth result 𝑆10 = Storage: Microsoft PowerPoint bandwidth result

Page 79 of 90
Expanded Storage
The purpose of the Expanded Storage test is to go deeper than the Storage
test. This deep performance analysis requires more than a single number. As
such, interpreting the results of the Expanded Storage tests is not trivial.
In future releases we plan to improve the presentation of the results. Until
then understanding the data from this benchmark requires some effort and
understanding of storage concepts.
The results of the test can be seen in the result XML file. A way to access the
XML is to open the result file from PCMark 8's GUI and click "View raw result"
button.
For the Consistency test, the primary result is the worst performance score
encountered during the benchmark run.
For the Adaptivity test, the primary result is the best performance score
encountered during the benchmark run.
Both primary results are massive simplifications so it's better to dig deeper
into the results. There are a lot of secondary results. They are grouped with
prefixes that match to a certain test phase:
degrade_X
steady_X
recovery_X
The details of each iteration of the test are available in each phase, which
enables you to track performance in each subtest.
You could also concentrate on secondary results of form
(degrade/steady/recovery)_X_score and
(degrade/steady/recovery)_X_bandwidth which can used to plot a curve that
illustrates changes in performance during the test, for example.
PCMark 8 v2.3.293 added the ability to customize the Storage Consistency test.
You'll find details and instructions in the PCMark 8 Storage Consistency
Customization Guide.
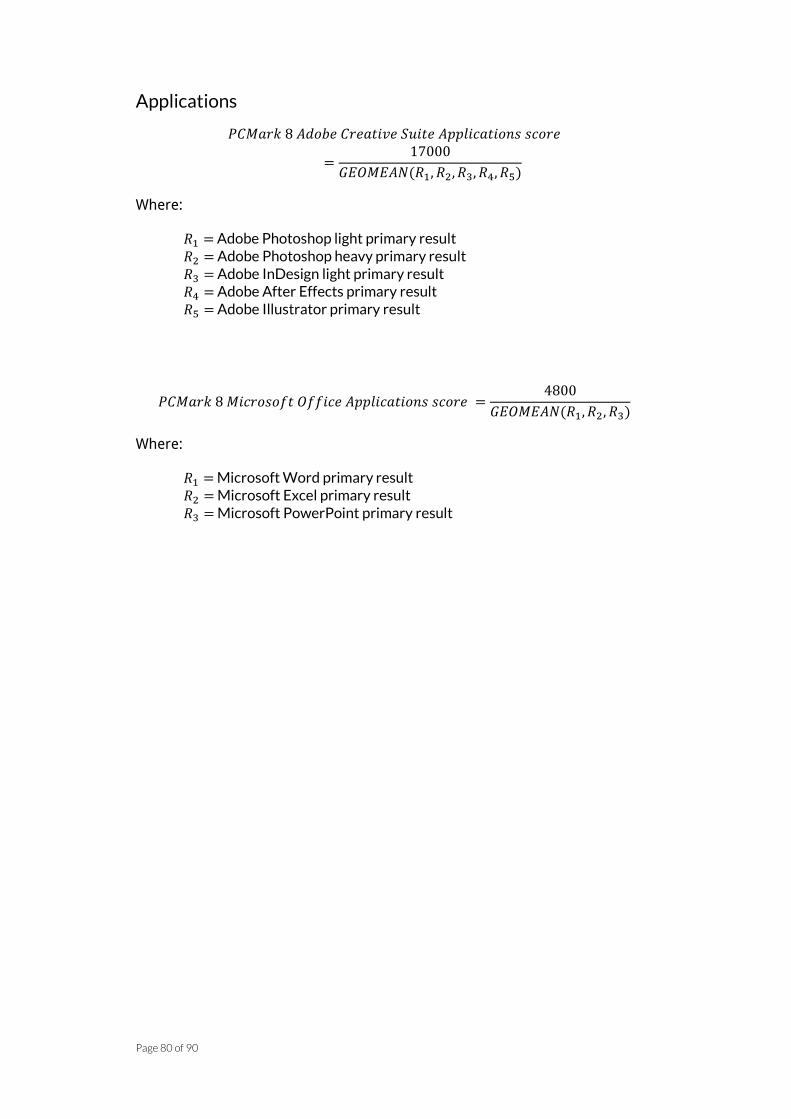
Page 80 of 90
Applications
𝑃𝐶𝑀𝑎𝑟𝑘 8 𝐴𝑑𝑜𝑏𝑒 𝐶𝑟𝑒𝑎𝑡𝑖𝑣𝑒 𝑆𝑢𝑖𝑡𝑒 𝐴𝑝𝑝𝑙𝑖𝑐𝑎𝑡𝑖𝑜𝑛𝑠 𝑠𝑐𝑜𝑟𝑒
=17000
𝐺𝐸𝑂𝑀𝐸𝐴𝑁(𝑅1, 𝑅2, 𝑅3, 𝑅4, 𝑅5)
Where:
𝑅1 = Adobe Photoshop light primary result 𝑅2 = Adobe Photoshop heavy primary result 𝑅3 = Adobe InDesign light primary result 𝑅4 = Adobe After Effects primary result 𝑅5 = Adobe Illustrator primary result
𝑃𝐶𝑀𝑎𝑟𝑘 8 𝑀𝑖𝑐𝑟𝑜𝑠𝑜𝑓𝑡 𝑂𝑓𝑓𝑖𝑐𝑒 𝐴𝑝𝑝𝑙𝑖𝑐𝑎𝑡𝑖𝑜𝑛𝑠 𝑠𝑐𝑜𝑟𝑒 =4800
𝐺𝐸𝑂𝑀𝐸𝐴𝑁(𝑅1, 𝑅2, 𝑅3)
Where:
𝑅1 = Microsoft Word primary result 𝑅2 = Microsoft Excel primary result 𝑅3 = Microsoft PowerPoint primary result

Page 81 of 90
Battery Life
The reported battery life is an estimate for a 95% duty cycle (from 100%
charged to 5%) extrapolated from the actual, measured battery life during the
benchmark run:
𝐵𝑎𝑡𝑡𝑒𝑟𝑦𝐿𝑖𝑓𝑒 = 0.95 ∗𝑅𝑢𝑛𝑇𝑖𝑚𝑒
𝐵𝑎𝑡𝑡𝑒𝑟𝑦𝐿𝑒𝑣𝑒𝑙𝑂𝑛𝑆𝑡𝑎𝑟𝑡 − 𝐵𝑎𝑡𝑡𝑒𝑟𝑦𝐿𝑒𝑣𝑒𝑙𝑂𝑛𝐸𝑛𝑑
Page 82 of 90
Release notes
PCMark 8 v2.8.704 – December 13, 2017
This is a minor update. Benchmark scores are not affected.
Improved
Systeminfo updated to version 5.3 for improved hardware compatibility.
Fixed
To avoid the Video Editing test running out of memory, it is now limited to
16 threads on processors with high-core counts. This does not affect the
score.
PCMark 8 v2.7.613 – April 13, 2016
This is a minor update. Benchmark scores are not affected. Improved
SystemInfo module updated to 4.45 for improved hardware compatibility.
Fixed
Fixed an issue where the Photo Editing tests failed to run when the system
path name included non-Latin characters.
Professional Edition only
Improved reporting of system information in the PDF report adds detailed
OS version, detailed storage information, write cache policy information,
power profile information, and the number of memory channels. The
application version number is shown in the header. The drive used in
storage test is shown next to the scores.
PCMark 8 v2.6.517 – February 9, 2016
This is a minor update. Benchmark scores are not affected. Fixed
Fixed an issue with Video Editing tests timing out and leaving entry level
CPUs unable to finish the Creative conventional benchmark.
Professional Edition only
Fixed Expanded Storage test command line options.
Page 83 of 90
Command line --submit switch no longer opens a web browser window
when submitting result data.
PCMark 8 v2.6.512 – January 18, 2016
This major update accommodates a change in the latest version of Adobe After
Effects and provides better support for NVMe SSDs. These changes affect the
workloads in the Adobe Applications benchmark and the Storage benchmark.
Scores from the new versions of these tests should not be compared with
older versions. Home, Creative, and Work benchmark scores are not affected.
Adobe Applications benchmark
Adobe Applications benchmark has been updated to version 2.0. Scores
should not be compared with earlier versions.
The After Effects test output has been changed to uncompressed AVI
format as the Adobe Creative Cloud version no longer supports output to
compressed Windows Media Video format.
Use Compatibility mode to compare scores with historical result data, (also
requires an older version of Adobe software that supports Windows Media
Video).
Storage benchmark
The Storage and Expanded Storage benchmarks have been updated to
version 2.0. Scores should not be compared with earlier versions.
The tests now provide better support for NVMe drives. Scores from NVMe
drives will improve in some cases. The faster the drive, the bigger the
difference. Other types of drive are unaffected.
Improved
General stability and error handling has been improved.
SystemInfo module updated to 4.41 for improved hardware compatibility.
Fixed
Video Chat test now works even when there is no audio device in the
system.
Fixed a bug that could cause PCMark 8 to crash when the SystemInfo
module failed.
Fixed several issues found on non-English language Windows installations.
Professional Edition only
Command line now offers temp path selection.
XML output now shows battery life in minutes not seconds for more
intuitive results.

Page 84 of 90
PCMark 8 v2.5.419 - September 8, 2015
This is a minor update. Benchmark scores are not affected.
Improved
Results screen now shows benchmark duration and battery consumption in
Benchmark Information section.
More detailed logging for the Storage test.
SystemInfo module updated to 4.40 for improved hardware compatibility.
Fixed
When loading a result from a previous version of PCMark 8, the Results
screen now correctly shows the application version used rather than the
current version.
Fixed a result creation issue that occurred when SystemInfo was disabled.
Professional Edition only
New Command Line exit codes to assist with scripting.
Fixed an issue when trying to use the --out and --export-pdf Command Line
options at the same time.
PDF export of Battery Life results now shows battery life as the overall
result and the average score from all benchmark passes as a secondary
result.
PDF export now shows Battery Life in hours and minutes (seconds rounded
down).
PCMark 8 v2.4.304 - April 1, 2015
This is a minor update. Benchmark scores are not affected.
Improved
SystemInfo module updated to 4.36 for improved hardware compatibility.
Fixed
Spreadsheet test: fixed an issue with test hanging, crashing or not finishing
with some hardware platforms in Accelerated mode.
Compatibility
Updated LibreOffice to the version in the LibreOffice code repository
tagged libreoffice-4-2-milestone-7-2 for improved compatibility with Intel
hardware.

Page 85 of 90
PCMark 8 v2.3.293 - November 27, 2014
A bug fix in this update means that scores from the Storage Consistency and
Storage Adaptivity tests included in PCMark 8 Professional Edition may
improve slightly on some hardware. Other benchmark scores are not affected.
Improved
SystemInfo module updated to 4.31 for improved hardware compatibility.
Fixed
Fixed an issue that could cause the Adobe After Effects test to fail.
Fixed an issue that prevented the Storage benchmark from running on
dynamic disks, including stripes and mirrors.
Professional Edition only
PDF report now includes details of the screen resolution and memory
modules.
Fixed a data alignment issue in the Storage Consistency test that could
result in read-modify-write operations when a simple write was intended.
Scores from this test may improve on devices previously affected by the
bug.
Added --custom command line option to enable the Storage Consistency
test to be customized for selected use cases. See the PCMark 8 Storage
Consistency Customization Guide for details.
PCMark 8 v2.2.282 – October 2, 2014
This is a minor update. Benchmark scores are not affected.
Improved
SystemInfo module updated to 4.30 for improved hardware compatibility
with X99 platforms.
Fixed
Fixed Adobe Creative Cloud 2014 compatibility issue which prevented After
Effects test from running.
Professional Edition only
The command line application now checks software requirements only
when needed. This enables you to run benchmarks on systems that do not
meet all the requirements, for example, running the Storage benchmark on
a virtualized system without DirectX 11 support.
New command line --pass option can be used to set the number of
benchmark passes. See command line guide for details.
Page 86 of 90
PCMark 8 v2.1.274 – June 30, 2014
This is a minor update. Benchmark scores are not affected.
Professional Edition only
Professional Edition users can now export results as PDF files from the
Results screen, saved result files and the command line.
Improved
SystemInfo module updated to 4.29 for improved hardware detection.
Fixed
Fixed a bug that left the PCMark.exe process running after closing the
application.
PCMark 8 v2.0.228 - March 12, 2014
This is a minor update. Benchmark scores are not affected.
Improved
SystemInfo module updated to 4.26 for improved hardware detection.
Fixed
Photo Editing test: fixed the issue with error message, "Init error:
System.BadImageFormatException."
Video Editing test: fixed the issue with error message, "file is too small."
Steam version only
Fixed an issue that gave an error when choosing to view results online.
Professional Edition only
Added command line option --randomdata to Expanded Storage Test. See
command line guide for details.
PCMark 8 v2.0.204 – February 4, 2014
This is a minor update. Benchmark scores are not affected.
Fixed
Fixed an issue that prevented PCMark 8 from launching after a recent
Steam update.
Fixed an issue with Expanded Storage tests (Professional Edition only) that
could result in the unintentional removal of the partition table from a non-
empty drive.

Page 87 of 90
PCMark 8 v2.0.191 – January 17, 2014
This is a major update for the Professional Edition that adds new tests and workloads. Home, Creative and Work scores from PCMark 8 v2.0.X cannot be compared with previous versions, however, this update adds a new Compatibility Mode that enables you to run older versions of each test for when you need to compare scores with historical benchmark results.
Home benchmark
Home updated to version 3.0. Scores should not be compared with version
2.0.
New Photo Editing test using the open source ImageMagick library and a
wider variety of image processing operations.
Video Chat test now features improved face detection and performance.
The test has been updated to use OpenCV 2.4.7.
Creative benchmark
Creative updated to version 3.0. Scores should not be compared with
version 2.0.
New Photo Editing test using the open source ImageMagick library and a
wider variety of image processing operations.
Video Editing part 2 now uses source material in 4K UHD resolution
(3840 × 2160).
Video Group Chat test now features improved face detection and
performance. The test has been updated to use OpenCV 2.4.7.
Work benchmark
Work updated to version 2.0. Scores should not be compared with version
1.0.
Work v2.0 adds a new Spreadsheet test and includes the Video Chat test to
provide a more varied and representative benchmark for office
productivity use.
New Spreadsheet test using LibreOffice Calc, a part of the open-source
productivity suite from The Document Foundation.
Added Video Chat test to the benchmark.
Storage benchmark
Storage updated to version 1.1. Scores are comparable with version 1.0.
Added Expanded Storage tests for specialist analysis of drive
performance. Please note that these tests can only be run from the
command line using PCMark 8 Professional Edition.

Page 88 of 90
Compatibility Mode
Compatibility Mode enables you to run the Home, Creative and Work
benchmarks from version 1.2.157 for times when you need to compare
scores against historical result data.
PCMark 8 v2.0.162 – December 31, 2013
PCMark 8 version 2.0.162 was a special preview build of PCMark 8 v2.0.191
Professional Edition made available to selected members of the press.
PCMark 8 v1.2.157 – October 21, 2013
New
Basic and Advanced Editions now available.
You can now submit and save scores online.
Improved
Various UI improvements.
PCMark 8 v1.1.111 – October 10, 2013
This is an update for the Professional Edition. Scores from Work, Storage and
Applications are not affected by this update. Scores from Home and Creative
should not be compared with scores from previous versions due to the
addition of new run modes for those tests.
New
Home updated to version 2.0. Scores should not be compared with
previous versions.
Creative updated to version 2.0. Scores should not be compared with
previous versions.
Home and Creative benchmarks now offer a choice of run modes.
Conventional mode does not use OpenCL acceleration, reflecting how
the majority of software works today.
Accelerated mode uses OpenCL acceleration, anticipating how software
may work in the future.
New interactive graphs show hardware monitoring data from each
benchmark run.
Improved
Progress windows now show estimated time for each test.
SystemInfo scan is now at least 50% faster.
Compatibility
Compatible with Windows 8.1.

Page 89 of 90
Compatible with Internet Explorer 11.
SystemInfo updated to v4.21 for improved compatibility with the latest
hardware.
New troubleshooting options for OpenCL device selection in Help tab.
Fixed
Fixed an issue in the Web Browsing test that could cause the test to hang.
Fixed an issue with Video Chat and Video Group Chat showing empty
windows.
Fixed a bug that could cause Video Chat tests to return inaccurate results.
Fixed a crash on 32 bit versions of Windows.
PCMark 8 v1.0.0 – May 31, 2013
Launch version, Professional Edition only

Page 90 of 90
About Futuremark and UL
Futuremark creates benchmarks that help people measure, understand and
manage computer hardware performance. Our talented team creates the
industry's most authoritative and widely used performance tests for desktop
computers, notebooks, tablets, smartphones and browsers.
We work in cooperation with many of the world's leading technology
companies to develop industry standard benchmarks that are relevant,
accurate, and impartial. As a result, our benchmarks are widely used by the
world's leading press publications and review sites.
Futuremark maintains the world’s most comprehensive hardware performance
database, using results submitted by millions of users to help consumers make
better purchasing decisions.
Our headquarters are in Finland just outside the capital Helsinki. We also have
a sales office in Silicon Valley and sales representatives in Taiwan.
Futuremark became a part of UL in November 2014. UL is a global safety
science company with more than a century of expertise and innovation in the
fields of product safety testing, inspection and verification services. With more
than 10,000 professionals in 40 countries, UL is dedicated to creating safe
working and living environments for all.
UL partners with businesses, manufacturers, trade associations, regulators,
and governments to play a key role in the development and harmonization of
national and international standards. For more information about certification,
testing, inspection, advisory and education services, visit http://www.UL.com.
Please don't hesitate to contact us if you have a question about PCMark 8.
Press [email protected]
Business [email protected]
Support http://www.futuremark.com/support
© 2017 Futuremark® Corporation. PCMark® and Futuremark® trademarks and logos, Futuremark® character
names and distinctive likenesses, are the exclusive property of Futuremark Corporation. Microsoft, Windows 8, Windows 7, Internet Explorer, Outlook, Excel, DirectX, and Direct3D are either registered trademarks or trademarks of Microsoft Corporation in the United States and/or other countries. The names of other companies and products
mentioned herein may be the trademarks of their respective owners.