from project to process management in engineering
TRANSCRIPT


fl-:'
/•
K:/O


HD28.M414
^2-
WORKING PAPER
ALFRED P. SLOAN SCHOOL OF MANAGEMENT
From Project to Process Management in
Engineering: Strategies for Improving
Development Cycle Time
P. Adler, A. Mandelbaum, E. Schwerer
andVien Nguyen
WP# 3504-92-MSA October, 1992
MASSACHUSETTS
INSTITUTE OF TECHNOLOGY50 MEMORIAL DRIVE
CAMBRIDGE, MASSACHUSETTS 02139

From Project to Process Management in
Engineering: Strategies for Improving
Development Cycle Time
P. Adler, A. Mandelbaum, E. Schwerer
andVien Nguyen
WP# 3504-92-MSA October, 1992

IJAN 1 3 1993

From Project to Process Management in Engineering:
An Empirically-based Framework
for the Analysis of Product Development
Paul S. Adler Art Mandelhauui
Department of Management and Organization Faculty of Industrial Engineering and Management
School of Business Administration Technion
University of Soutiiern California Haifa, Israel 32000
Los Angeles, CA 90089-1421
Vien Nguyen
Sloan School of Management
Massachusetts Institute of Technology
Cambridge, MA 02139
Elizahdh Schwerer
(Iraduate School of Business
Stanford University
Stanford. C \ 9430.>o01o
Abstract
Product development work has often been studied as though it consisted of isolated
unique projects. This approach allows organizations' activities to he described in terms of
PERT models, which either do not acknowledge resource limitations at all or assume that
resources are dedicated. However, many product development organizations do not rely on
fully-dedicated teams, so their projects suffer delays when re.sources have more than one project
to contend with concurrently. This study develops an empirically-based framework for analyz-
ing development time in such contexts. We model the product development organization as a
stochcistic processing network in which engineering resources are "workstations" and projects
are "jobs" that flow among the workstations. At any given time, a job is either receiving
service or queueing for access to a resource, and our model's spreadsheets and simulations
quantify this division of time. This class of models provides a valuable managerial frame-
work for studying product development becau.se it enables formal performance analysis and
it points to data that should be collected by organizations .seeking to improve development
cycle times. These models can serve as management tools, for example, to support decisions
regarding resource allocation and to help in predicting project completion time. They also
provide a vaJuable conceptual framework, since they point to commonalities and differences
between engineering and manufacturing operations.
November 1992
^ Author's names are listed in alphabetical order.


Contents
1 Introduction 1
2 A Brief Literature Survey 2
3 The Conceptual Fi-aniework: A Process Model 5
4 The Research Site: The Plastics division at Chemicals Inc. 7
5 Constructing the Model 9
51 Project Types 9
52 Resources 10
5.3 Tasks 11
5.4 New Product Projects: Activity Times 12
5.5 New Product Projects: Precedence Const rauits 13
5.6 Reformulation Projects 16
6 Analysis, Stage I: Capacity 16
7 Analysis, Stage II: Cycle Time 18
7.1 The Simulation Model 19
7.2 Simulation Results 22
8 Conclusion 24

List of Tables
1 Interarrival Times of New Produoi Projects 30
2 Resource Characteristics 30
3 Fraction of Time Devoted to Administrative and Support Activities 30
4 Activity Descriptions 31
5 Processing Times for New Products 32
6 Probability of Involvement - New Products 33
7 Maximum permissible pooling 34
8 Average Number of Times Activities are Executed for New Protiucts 34
9 Processing Times for Reformulations 35
10 Utilization Profile 36
11 Utilization Profile with Pooling 37
12 Values of Adjustable Parameters 38
13 Simulation Model - Resources 39
14 Activity Descriptions - Simulation Model 39
15 Processing Times - Simulation Model 40
16 Utilization Factors - Simulation Model 40
17 Simulation Results 41
18 Fraction of Time Spent in Overtime 41

List ()f Figures
1 Processing Network Representation 42
2 Traditional PERT Representation 42
3 Organization Cliart of Chemicals Inc 43
4 Process Flow Diagram - New Products 44
5 Process Flow Diagram - Reformulations 45
6 Iteration Structure for New Products 46
7 Utilization Profile with Pooling - Graphical Representation '. 47
8 New Products Activities Flow Diagram - Simulation .Model 48
9 Reformulations Activities Flow Diagram - Simulation Model 48
10 New Products Project Completion Time - Histogram 49
11 New Products Project Completion Time - Cumulative Distribution 50
12 Reformulations Project Completion Time - Histogram 51
13 Reformulations Project Completion Time - Cumulative Distribution 52
111

1 Introduction
I'm late. I'm late, for a very important date. The While Rabbit, Alice in Wonderland
Product development organizations often view their projects as independent collections of
unique activities. In reality, however, projects are often mutually dependent because they place
simultaneous demands on shared resources. Moreover, different jirojects witlim an organization
often exhibit substantial similarity in the overall flow of constituent activities. We therefore
hypothesize that a process view - that is, a view of the development process as a regular "design
production process" - can provide a framework for better understanding organizations that pursue
multiple concurrent non-unique projects using shared resources In particular, this approach
should allow us to quantify the delays a project experiences as it waits for resources. To test this
hypothesis, we constructed a process model of an actual firm's product development activities.
In this paper, we present the models that we constructed and discuss potential roles of process
models for managing development cycle time.
Several business observers, including Blackburn (1991), Stalk and Hout (1990). Clark and
Fujimoto (1989a), and Wheelwright (1989), have noted the increasing pressures on firms to ac-
celerate their process of developing and launching new products. The most prevalent tools for
predicting product development times are descendants of PERT (Project Evaluation and Review
Technique) and CPM (Critical Path Method) (Dean, 1985), but these techniques fail to account
for several phenomena that can slow project progress. First. the> depict an idealized flow of
project activities in which activity times are predictable and first attempts always succeed. Many
product development organizations, on the other hand, face uncertainties m both activity times
and number of activity repetitions: for example, proposed designs are often tested and iteratively
redesigned and retested until specifications are met Second, typical PERT/CPM analyses, if they
acknowledge resource limitations at all, assume that resources are dedicated to a single project
at a time. Thus they fail to account for the congestion effects arising from contention for shared
resources among concurrent projects.
We posit that the product development organization can be viewed as a system whose activities
can be described in terms of processes. This approach differs from previous studies of product
development, which we survey in Section "2, in that it focuses on the management of resources
instead of on the management of individual projects.
We model the product development organization as a stochastic processing network iii which
engineering resources are 'workstations'" and projects are jobs" that compete for "service' from

the workstations. At any given time, a job is either receiving service from a workstation or queue-
ing for access to a resource. Our representation is in the spirit of queuemg network models for
manufacturing processes, but the product development environment lias unique characteristics
that lead to networks with different features tiiaii those traditionally associated with manufac-
turing. We elaborate upon these differences in Section 3, where we describe m detail the process
models that we use. The subsequent sections of this report are organized as follows Section 4
describes the division that was our host for this project. Section 5 describes the components of the
model and specifies the data that we collected. Sections 6 and 7 present OLir analysis. Section 6
discusses the first stage 'capacity analysis," which culminates m spreadsheets displaying resource
utilization profiles. The underlying calculations compare the average demand of project-related
work with the time available to resources. The second stage of analysis focuses on cycle time and
is presented in Section 7. A first companion paper ( Adier et. nl. 1992b) discusses m greater detail
the methodological challenges of this study, and a second ( AdIer tt al i992a) demonstrates how
such models can be used to better manage time-to-market. Section 8 highlights the lessons that
we learned in carrying out the project, points out some limitations of our study, and discusses
future prospects for process modeling in product development environments.
Our objectives in this study were threefold. First, we wanted to test whether product develop-
ment could be meaningfully represented within the framework of process models, "meaningfully,"
that is, from the dual perspectives of the practitioner and the academic. Second, we wanted to
see if we could build tools based on such a model that would be both useful to product develop-
ment managers and theoretically interesting to researchers. Third, we hoped that this research
effort would highlight major differences and similarities between engineering 'knowledge work"
and manufacturing operations.
We feel that our effort has been successful on all of our three goals: a process model can offer
significant insights into a broad spectrum of product development organizations; both our spread-
sheet and simulation models appear to be promising practical and theoretical tools; and we have
identified a rich framework for identifying the differences and similarities between manufacturing
and engineering operations.
2 A Brief Literature Survey
The literature on project management and product development is voluminous, but little of it
addresses the question of congestion in multi-project environments. A brief survey ot previous
studies highlights the need for research addressing this issue.
A first body of research focuses on information and task flows within projects but does not

tackle problems of queues within a single project or within rnulti-projerr environments For
example, Cooper (1983) synthesizes the results of nian> held studies of product development.
finding several key phases of new product development wiiose effective pxecution is critical to
project success. He proposes a "flow" approach, in which management considers these phases in
a systematic way to ensure that nothmg is overlooked.
A second body of research (for example, Allen and Cohen 1969, Tushman 1978, and Tushman
1979) has studied both information flow in development organizations and the effect of organi-
zational structure and behavioral patterns on the operation of these organizations. However, the
focus on complex information flows in this research is not linked to the cycle-time performance of
discrete projects.
A third body of research is more attentive to the complex iterations that characterize most
product development work. It attempts to describe the overall structure of these iterations but
remains focussed on the single project environment. Clark f/ al (1987. 1989a. 1989b. 1991)
highlight lead time as a critical performance measure in product development They analyze the
coordination between development and manufacturing departments and the integration ^f up-
stream and downstream activities. In p.articular tiiey consider the issues of simultaneous versus
sequential performance of tasks and of the piecemeal rejt^ase of information from upstream re-
sources to downstream ones, but they fail to recognize how these processes are affected by resource
limitations.
Imai, Nonaka, and Takeuchi (1985) consider both new product development cycle time and
the ability of organizations to adjust their processes in response to exogenous factors. They
study these performance measures in the light of five cases of recent product innovations in
Japanese and American companies. They identify six critical factors that encourage efficient and
innovative development: "top management as catalyst, sell-organizing project teams, overlapping
development phases, multilearning, subtle control, and the organization transfer of learning."
Again, the focus is on management of single projects.
Black, Fine, and Sachs (1990) propose a matrix method for deciding how to order the activities
of a product design process according to the flow of information among them Eppinger. Whitney,
Smith, and Gebala (1989) take a similar approach based on models of the design process in several
organizations. These studies focus on the overall structure of the work flow - in particular, the
likelihood of iterations - but they consider neither the queueing effects created by the flow through
this structure nor those created by multii^le concurrent projects competing for resources.
A paper closer in spirit to ours is Taylor and Moore ( 1990) They take as their model a GERT
(Graphical Evaluation and Review Technique) network, which is a generalized PERT network
that allows probabilistic routing and repetition of activities \ia fin^dhark ioo[is (Neumann. 1979).

They use the simulation package Q-GERT (Pntsker 1979) to study a devplopment organization
with multiple research teams and multiple projects. Since tlie> a.ssume that each team is dedicated
to a single project at a time, their model does not include any resource contention and queueing
effects.
Another group of studies is now emerging that highlights the importance of the process issues
in multi-project environments. Hayes, Wheelwright, and Clark (1988) develop a framework for
understanding the management challenges of product development. Of particular relevance to our
research, they identify "manufacturing capability" as a key determinant of project performance
(pp. 323-327). By manufacturing capability, they mean not only the manufacturing organization's
readiness to ramp-up production, but also manufacturing s contribution to the earlier phases by
speedily constructing high-quality prototypes. They further stretch the concept to include the
design engineering organization's internal "process capabilities'" that allow for fast turnaround
of key engineering tasks such as laboratory testing. This e.xtension of the idea of manufacturing
capabilities to the engineering organization leads naturall_\- to the idea that engineering operations
too can be organized according to JIT principles But tht.'v do not develop the concepts needed
to make this new approach operational.
Several recent studies have attempted to define the more specific concepts needed to flesh
out a process view of project management. Blackburn (1991) emphasizes the link between suc-
cessful new product development and the Just-In-Time manufacturing strategy In particular.
he discusses the ideas of organizational design (how functional groups should be structurf>d ).
batch sizing, and coordination with "suppliers"; and he discusses how to translate the Japanese
manufacturing philosophy into the product development setting.
VVatkins and Clark (199'J) present a framework for studying organizations that manage an
evolving portfolio of projects. They identify project scheduling, resource dedication, and resource
specialization as three key dimensions in the framework. They e.xamine strategies used by man-
agers in deploying their resources and conclude that these strategies are based on assumptions
about the nature of the new product development process that have become invalid Watkins aiul
Clark identify the inherent uncertainty in the new product development environment as a source
of difficulty for such stratgies.
Schonberger (1986) discusses a case study of a group that tried to implement this type of Just-
In-Time approach to identify the obstacles to rapid project completion m their own organization
They found that careful recording of their work times highlighted bottleneck areas that they were
able to reduce or eliminate.
Finally, Alexander ( 1990) sketches a queueing network model of product development projects
like the one we analyze in this paper. The author discusses many issues of modeling and data
4

collection, and he suggests how principles of queueing theory could he used to identify bottlenecks.
Our present study contributes to this emerging body of research on the impact of congestion on
project cycle-time in multi-project organizations. We focus on testmg this approach by applying
it to data from real projects in a real organization.
3 The Conceptual Framework: A Process Model
We propose to model the product development organization as a "stochastic processing network"
(Figure 1). For our purpose, a stochastic processing network consists of a collection of "work-
stations" or "resources," each of which is composed of one or more interchangeable and identical
"servers" working in parallel. A workstation corresponds to a pool of employees, typically with
the same title, who perform the same functions interchangeably. For example, two of the resources
in our model are "process engineers'" (a pool of two employees) and "manufacturing engineers" (a
pool of five). The servers are the technicians or engineers who make up the pool The organization
processes projects, or "jobs," which consist of collections of tasks (such as "Product Prototyping"
and "Product Testing") that are performed by specified resources in specified orders. Certain
tasks can be carried out in parallel while others must be performed sequentially When several
tasks may begin processing at the same time, we refer to the phenomenon as a "fork": when a
task may not begin until several other tasks have been completed, we call it a "join." The time
required to complete a task is called its '"processing time," or 'activity time." and the intervals
between the starts of new projects are called ""interarrival times.'"
We use PERT-style diagrams to illustrate constraints on the order in which tasks are executed.
For example. Figure 2 is the PERT diagram associated with the processing network depicted in
Figure 1. Each job consists of 7 activities. Activities "Vlanufacturing Process Development"
and "Slab Prototype" can be performed in parallel (they represent a fork) and "Manufacturing
Scale-Up" begins when activities "Product Testing" and "Manufacturing Process Development"
are both completed (a join).
The processing network is stochastic because interarrival times, processing times, and prece-
dence requirements may be subject to statistical variability Projects are said to be of the same
"type" if their individual precedence requirements, processing times, and interarrival times can be
characterized by the same set of probability distributions. In the sample organization we studied.
we distinguished 2 types of projects, ""new product projects"" and 'reformulation projects" (see
discussion in Section 5).
Underlying our model are several assumptions First, we a.ssume that the organizations
tasks and technologies are stable over time and that projects can !it^ characterized h\ sets of
probability distributions. We further assume tiiat there is a small number of identifiable types
of projects and that projects within each type are uniform m tlie sense that differences among
their realizations can be attributed fo stochastic varialnlity, Tliese assumptions restrict us to
organizations whose projects share many common cliaracteristics. We hvpothesize that among
this class are organizations devoted to the development of well-defined families of products, and
this paper can be read as a test of that hypothesis. On the other hand, our model is probably
not very useful for understanding groups whose mission is basic research, where projects are by
nature more idiosyncratic.
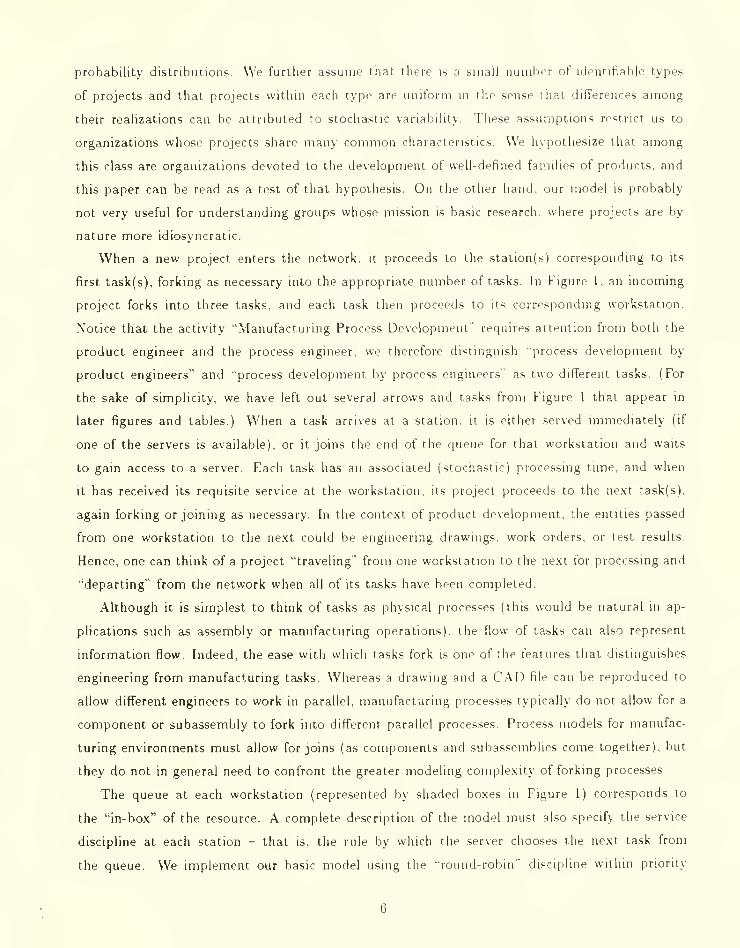
When a new project enters the network, it proceeds to the station(s) corresponding to its
first task(s), forking as necessary into the appropriate number of tasks. In Figure 1, an incoming
project forks into three tasks, and each task then proceeds to its corresponding workstation.
Notice that the activity "Manufacturing Process Development" requires attention from both the
product engineer and the process engineer, we therefore distinguish "process development by
product engineers" and "process development by |5rocess engineers" as two different tasks. (For
the sake of simplicity, we have left out several arrows and tasks from Figure 1 that appear in
later figures and tables.) When a task arrives at a station, it is either served immediately (if
one of the servers is available), or it joins the end of the queue for that workstation and waits
to gain access to a server. Each task has an associated (stociiastic) processing time, and when
it has received its requisite service at the workstation, its project proceeds to the next task(s),
again forking or joining as necessary. In the context of product development, the entities passed
from one workstation to the next could be engineering drawings, work orders, or test results.
Hence, one can think of a project "traveling" from one workstation to the next for processing and
"departing" from the network when all of its tasks have been completed.
Although it is simplest to think of tasks as physical processes (this would be natural in ap-
plications such as assembly or manufacturing operations), the flow of tasks can also represent
information flow. Indeed, the ease with which tasks fork is one of the features that distinguishes
engineering from manufacturing tasks. Whereas a drawing and a CAD file can be reproduced to
allow different engineers to work in parallel, manufacturing processes typically do not allow for a
component or subassembly to fork into different parallel processes. Process models for manufac-
turing environments must allow for joins (as components and subassemblies come together), but
they do not in general need to confront the greater modeling complexity of forking processes.
The queue at each workstation (repre.sented by shaded boxes in Figure 1) corresponds to
the "in-box" of the resource. A complete description of the model must also specify the service
discipline at each station - that is, the rule by which the server chooses the next task from
the queue. We implement our basic model using the rouiKl-robm" discipline within priority
6
classes. In this discipline, a free server takes the next top |Driority task in the queue and works
on it for a pre-specified length of time. If she completes the task withm the time period, the
corresponding project moves on to a successor task, and the server continues with the next top
priority task in the queue. Otherwise, the task returns to the end of the queue, its remaining
processing time is updated to reflect the last round of service, and it waits until its next access to
the server. When the queue is empty of top priority work, the station serves the second priority
tasks in the same manner. Clearly there are other possible choices for service discipline, including
first-in-first-out, last-in-first-out, or project with the earliest due-date first We conjecture that
the round-robin service discipline is a reasonable approximation of human response to important
competing demands.
In summary, a complete specification of a processing network requires the following ingredients:
the number of resources in the network and the iiumiier of parallel servers within each resource; the
number of project types; and for each project type, a set of probability tlistributions characterizing
the type's precedence requirements (i.e., the numl)pr of tasks and the order in which they are to
be executed), the processing time of each task, and the interarrival times of new projects.
The model that we have proposed clearly draws from queueing theoretic concepts and terminol-
ogy and can be seen as a "generalized queueing network." Since Jackson ( 1957, 1963) introduced
queueing networks as models of job shops, they have had a rich history of applications in man-
ufacturing, communications, computer systems, and transportation science The generalization
of classical queueing networks to processing networks, which allow forking and joining, enables
analysis of systems that are characterized by parallel as well as sequential processing (Nguyen.
1990, 1992). Such models have been used, for example, to represent distributed database systems
(Baccelli, 1989). We hypothesize that stochastic processing networks can also be used to analyze
product development organizations.
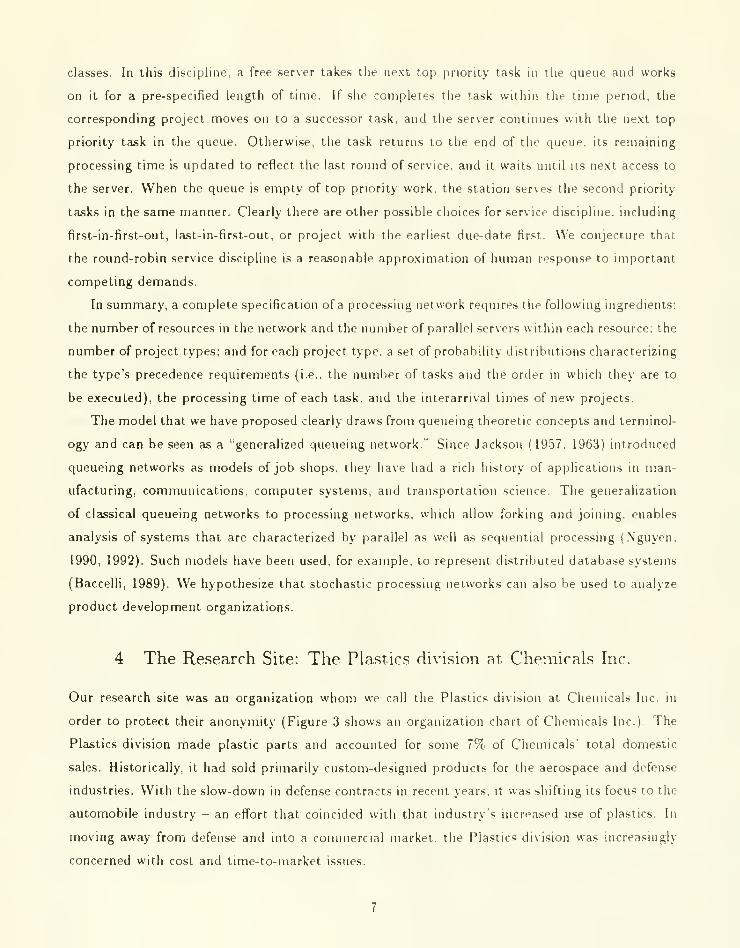
4 The Research Site: The Plastics division at Chemicals Inc.
Our research site was an organization whom we call the Plastics division at Chemicals Inc in
order to protect their anonymity (Figure 3 shows an organization chart of Chemicals Inc ) The
Plastics division made plastic parts and accounted for some 79c of Chemicals' total domestic
sales. Historically, it had sold primarily custom-designed products for the aerospace and defense
industries. With the slow-down in defense contracts in recent years, it was shifting its focus to the
automobile industry - an effort that coincided with that industry's increa.sed use of plastics. In
moving away from defense and into a commercial market, the Plastics division was increasingly
concerned with cost and time-to-market issues.
The Plastics division offered several advantages as a research site. Fir^t, both divisional and
corporate management were interested in understanding how they could accelerate then- product
development cycle, so they were eager to help us m our research. The Plastics division had
recently lost several potential contracts to their principle competitor, a large Japanese firm with
significantly faster product development. Management support was crucial to the success of our
project because of the time and effort involved in helping us collect data Second, for several
years the Product Development manager had been collecting time cards from his staff, and these
could be retrieved for our use.
The staff of the technical department in the Plastics division consisted of engineers and tech-
nicians divided into functional groups specializing m product design, process design, and appli-
cations. A technical services group supported these engineering groups by helping to make and
test product prototypes. Finally, manufacturing engineers, product managers, salespeople, and
other staff members all made critical contributions to development projects All these resources
constitute workstations in our network.
Although the group considered its principal mandate to be the development of "new prod-
ucts," it also handled "reformulations" - projects to replace the materials in e.xisting products
- and it supported products on the market. New i.iroduct development and support efforts were
typically triggered by customer interest; reformulations arose either when a vendor discontinued a
constituent material or when a better material became available Reformulation projects tended
to have little urgency: the plant might have several months' supply of the current material, and
the potential cost savings from using a different material was typically small. Only rarely did
circumstances force reformulation projects into top jiriority
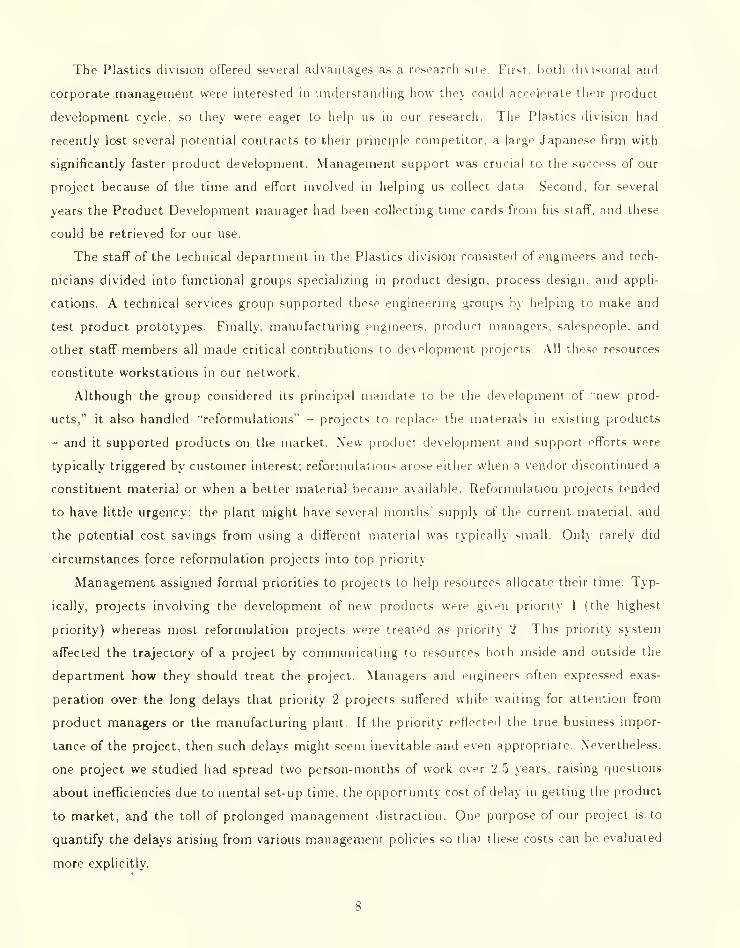
Management assigned formal priorities to projects to help resources allocate their time. Typ-
ically, projects involving the development of new products were gneii ]iriority 1 (the highest
priority) whereas most reformulation projects were treated as priority 2 This priority system
affected the trajectory of a project by communicating to resources both inside and outside the
department how they should treat the project. Managers and engineers often expressed exas-
peration over the long delays that priority 2 projects suffered while waiting for attention from
product managers or the manufacturing plant If the priority reflectetl the true business impor-
tance of the project, then such delays might seem inevitable and even appropriate. Nevertheless.
one project we studied had spread two person-months of work over 2 5 \ears. raising questions
about inefficiencies due to mental set-up time, the opportunity cost of delay in getting the product
to market, and the toll of prolonged management distraction. One purpose of our project is to
quantify the delays arising from various management policies so that these costs can be evaluated
more explicitly.

The Plastics division liad recently defined a standard, five-phase procedure for product de-
velopment. This phase system was the product of a (luahty im|)rovement team that had sought
to explicitly characterize the development process for new products. Their effort culminated in
a "living guideline which insured that key issues were discussed and com|)leted before a project
moved into the next phase" of development (quoting from internal division documents). One
objective of the phase system was to get people from diflferent functions involved in projects at an
early stage in order to keep them informed and to ensure that projects focused on customer needs
from the beginning. A second purpose was to systematize project evaluation so that people would
ask critical questions early and prevent wasted work. For us, the phase system proved crucial by
establishing a nomenclature for project tasks.
5 Constructing the Model
To characterize statistically the projects at the Plastics division, we asked our informants to
identify major categories of projects, according to the similarity of the projects' acti\ity histories.
For each project type, we required data on the frequency of new job starts ( mterarrival times), the
tasks involved, the order in which they were executed (pi edence requirements), and the time
required to complete each task (processing times). Because we accounted explicitly for time spent
on support and administrative duties, we also needed data on the time that each resource pool
devoted to these activities. Recall from Section 3 that our model requires the entire distribution
of these quantities and not only their averages.
We collected our data in three half-day workshops with a group of Plastics division employees
representing most of our resource pools. We asked them to estimate average activity times for a
recent new product project (Project X) which had enjoyed high visibility m the group and had
been well documented. We intended this preliminary exercise to provide a baseline from which
we could aisk our informants to generalize to probability distributions for the entire "portfolio of
new product projects." The data that we describe below are the final estimates that ue obtained
from the Plastics division for its portfolio of projects.
5.1 Project Types
Our categorization criteria for project types required that each type occupv a substantial amount
of resource time and that each have some structural features distinguishing it from other types.
We identified three main features of a project: the assigned priority, the characteristics of the final
product, and the nature of the development effort as reflected in its precedence relationships The
assigned priority affected the service discipline ai^plied to the [)roject. The characteristics of the
product determined its technical requirements and lience the necessary development activities.
Finally, the nature of the development effort determined the required resources and activity
sequence.
Following the suggestion of our key contact at the Plastics division, we focused our study on
a family of products we will call plastic parts This product family accounted for over 80% of the
engineering organization's time. The other family was made up of more idiosyncratic projects. As
in the broader class of all products, plastic parts work included both new product developments
and reformulations, and these projects could be assigned eitlier priority 1 or priority 2.
Although we recognize two distinct project types, we explicitly model only new product
projects (of both priority 1 and priority 2). Reformulation projects, which typically are smaller
than new product projects, constituted less than 49c of the resources' capacity. Therefore, we
collected only aggregate data for reformulation projects, and modeled them simply as support
activities in many of our simulation scenarios.
Our model consists of two plastic parts project types: new products and reformulations. Our
decision to isolate these two types of projects accomplishes two goals. First, it allows us to
explore how various project characteristics affect the product development cycle .Second, with
these two categories of projects, we manage to capture the bulk of the Plastics division's time.
In combination with support activities and admivistratiie duties (which the group also treated as
priority 1 work), they accounted for virtually all of the group's time.
We based our data for job interarrival times on management interpretations of quarterly
status reports for the few years preceding our study. Our informants estimated that recently
there had been 3 priority 1 new product final design reviews per year, with approximately 5
percent more starts, or 3.15 per year. Our contacts also characterized for us the distribution of
project terminations for those projects that were never completed. Typically these terminations
occurred toward the end of Phase 3 when engineers determined that no feasible solutions existed
for the remaining problems inhibiting scale-up or launch. For priority 2 new product projects.
we learned that roughly 2.5 projects per year were initiated and none were terminated Table 1
summarizes these figures.
5.2 Resources
The core resources are the product and process engineers and technicians who dedicated their time
to product development, but this "development group" relied on several other resource pools. For
example, they ordered materials from other divisions, ran prototypes in the manufacturing plant,
requested tests from the technical services group, sought marketing and sales advice about the
10
concerns of the lead customer, consulted with the specifications group about possible legal issues.
and relied on product management to coordinate and promote these actlvitit^^i Our data gathering
effort revealed wide differences in the quality of information available to us on these resources.
Considering these information gaps, we distinguished resources that satisfied the following two
criteria: the group had potential impact on project process, and its acti\ities were adequately
documented. Those groups that potentially affected the rate of project completion but that did
not satisfy the latter requirement are combined into a group called 'Miscellaneous'" which includes
the following functions: Sales. Finance, Specifications, Logistics, and Quality Assuranro
We identified 9 resources. According to management estimates of resource availability (number
of work hours per week per server within each resource), average work weeks varied from 40 to
55 hours depending on the resource. The name of the resources, the number of parallel servers
within each resource, and the average availability per week for each are group are shown in Table
2. The first 4 resources. Product Engineer, Process Engineer. Product Technician, and Process
Technician, constitute the core development resources. Collectively they handled approximately
65% of the product development work. Table 3 shows estimated fractions of time devoted to
administrative and support activities by each resource group
5.3 Tasks
To find a partition of the product development activities at the Plastics division, we turned to
the phase procedure mentioned in Section 4. This procedure described five sequential phases
of the development process, specifying a standard protocol for resolving the key issues in each
phase. Phase 1 ("Concept/Feasibility") was characterized by the intensive involvement of a few
marketing and product development people who simultaneously explored technical, manufactur-
ing and market feasibility. In Phase 2 ("Project Plan/Team") a full team was assembled, and a
project plan was drafted. Phase 3 ("Product Development") signaled the project's peak effort,
as the team worked out the technical, legal, and marketing issues in detail. It was here that
the development group expected to face the project's critical challenges. Phase 4 ("Manufactur-
ing Standardization/Launch") marked the transfer of the project from the development labs to
full-scale manufacturing. It included a concentrated effort to eliminate any remaining technical
wrinkles, and it closed with the product launch. Finally. Phase .j ("Continuous Improvement")
represented ongoing refinements while the product was on the market Each phase consisted of
approximately a dozen issues to be resolved.
To simplify the data collection and the analysis, we decided to focus on the first four phases
(through Manufacturing Standardization/Launch), aggregating Phases 1, 2. and 4 into one "activ-
11
ity" each and specifying Phase 3 (Product Development) ni greater detail W'e chose to highlight
Phase 3 of the development process because it contained the bulk of project work and because it
illustrated some interesting network features which distinguish product development from man-
ufacturing, namely, forking, looping among activities, continual transmission of information be-
tween steps, and resources who potentially juggled several activities at onct\ Phase 3 later proved
to be a felicitous choice for the additional reason that it marked the time of crispest activity
definition.
Working with the Plastics division staff, we identified 14 activities in Phase 3. The complete
model of the development process for new product projects consists of 17 activities whose names
and descriptions appear in Table 4. Reformulation projects tended to be smailpr projects than new
product development efforts, requiring fewer resources and fewer person-hours to complete. Often
they skipped Phases 1 and 2 entirely and began with Phase 3. Each activity may require attention
from several resources. A "task" as defined in Section 3 corresponds to an activity/resource pair
(e.g. Review Patent/Product Engineer) Thus while each task is performed by exactly one
resource, each resource can be responsible for several tasks.
5.4 New Product Projects: Activity Times
We asked our informants at the Plastics division to consider their portfolio of projects' and
estimate the 10th and 90th percentiles of the processing times for most activities. That is, we
expect that 10% of all occurrences of an activity took less time tlian our low estimate and \0% took
more time than our high estimate. We characterize each protyotyping activity by only one number,
which we take to be the actual processing time. Members of the Plastics division perceived that
these activities were of relatively short and invariant duration and that the variability in times
spent prototyping activities was due mostly to the number of repetitions. The data for new
product development projects are shown in Table 5. An empty activity /resource box indicates
that the resource did not contribute to the activity.
In Table 6, an entry of 1 indicates that the resource was always involved in the activity, and an
empty cell implies that the resource never devoted time to the activity. Fractional probabilities,
however, can be interpreted in two diametrically opposed ways. On tiie one hand, such entries
might be independent, indicating that the activity was not necessary for all projects. This is an
appropriate representation of the activity "Phase 2.'" According to Tal.de 6, only 30% of projects
required application engineers to contribute to this activity, and independently of the application
engineers' contribution, manufacturing engineers could expect to spend time on Phase 2 m 90% of
the projects. On the other hand, some fractional probabilities reflected interchangeability among
12

resources. Technical employees tend to liave more general skills than their official functions
suggest. When the probabilities in Table 6 iiulicate the average proportions of times that each
resource was assigned exclusively to a task, we asterisk the corresponding entries. According to
this interpretation, asterisked fractional probabilities in each row sum to the total probability that
the activity occurred. For example, Table 6 indicates that m any given project, either application
engineers or product engineers, but not both resources, spent time on field trials.
A second issue arises from this tension between interchangeability and specialization. En-
gineers and technicians - unlike machines and equipment which are their manufacturing coun-
terparts - are capable of handling a wide variety of tasks beyond their formal functions in the
organization. For example, during busy periods at the Plastics division, the development group
might turn some of its work over to engineers with nominally different functions, such as manufac-
turing or applications engineers (who normally dealt with factor^' and customer implementation
issues respectively). Since specialization is often a matter of organizational choice and not of
technical capability, it is up to the modeler to decide how much of this specialization to charac-
terize as fixed versus variable. The entries m Table 7, which we obtained from conversations with
our informants, indicate the maximum extent to which we permit reallocation of work between
resources. A negative entry indicates a resource giving away some responsibility, and a positive
entry reflects another resource accepting it. In this table, the substitute resources are assumed to
complete the work as efficiently as the original resources.
A feature that we did not include in our models is the possible dependence among activities.
One might wonder whether a prolonged Phase 1 was topically followed by a long Phase 2 -
that is, if it was difficult to resolve feasibility issues, was it also difficult to formulate a process
plan? Or is the opposite scenario more representative - if the development group spent more
time resolving Phase 1 issues, was it more straightforward for them to formulate process plans'?"
Our model assumes that the two activities are independent To answer empirically the question
of dependence among activities, we would need a joint distribution of all the tasks that compose
a product development effort; the engineering organization we studied did not keep the detailed
data necessary for such analysis.
5.5 New Product Projects: Precedence Constraints
Simultaneously with our effort to identify tasks, we asked our key contact at the Plastics division to
translate the phase system into PERT-like diagrams illustrating the flow of activities. The activity
flow diagram presented in Figure 4 reflects the resulting model of the [irocess flow. Activities are
shown in boxes, and arrows indicate precedence among activities; if several resources were involved
13

in an activity, we assume tliat they could execute their tasks ui |)arallel. An ideal" project would
have only forward arrows: a downstream activ it> would ne\er be followed by an upstream activity.
Figure 4 represents the following process flow: a new project begins at Phase 1 and then proceeds
to Phase 2. Its completion of Phase 2 triggers the start of several (possibly) simultaneous Phase
3 activities. Product engineers and technicians begin acti\ities in the prototyping cycle: making
and testing material samples ("slabs") to refine the material formulation, making and testing
product prototypes in the lab to explore product geometries and to study the material's behavior,
and finally making product prototypes in the plant to uncover manufacturability issues Product
engineers, process engineers, and technicians simultaneously develop the manufacturing process,
getting information from the product engineers about special product reciuirements and sharing
their own cost and feasibility results.
At the same time, people in sales and product management begin the acti\ities shown m the
lower-left corner of the flow chart. These activities initially have little impact on the technical
side of product development, but ultimately the two groups negotiate through the interface of the
product specifications effort. When a final product and set of specifications are defined, technical
services performs a comprehensive set of qualification tests to ensure that the product meets these
specifications. If all goes well, the new product proceeds on to field trials, to the phase 3 (design)
review, and ultimately to the full manufacturing scale-up and launch of Phase 4.
The proliferation of reverse arrows in the flow chart illustrates necessary iterations among
activities. For the sake of simplicity in our model, we include onl> those loops that our informants
believed occurred with significant frequency.
Figure 5 displays the process flow diagram for reformulation projects As we mentioned,
reformulation projects are simpler than new product development efforts and require significantly
fewer activities. In particular, note that our model bypasses Phases 1 and 2. and Phase 3 contains
fewer activities.
The likelihood of iterating was the most difficult part of our model to specify. To completely
characterize it, we would need to describe not only the number of times that activities occurred,
but also the order in which they occurred, and we would need probability distributions over both
of these differentiating features. The informants found it diflicult to discuss the range of possible
configurations that they encountered or to identify characteristic patterns, so we needed to take
a simpler route. We asked the engineers to cla.ssify 11 recently completed projects according to
the complexity of the iteration structure (2 projects were simple, 5 medium, and 4 complex); we
developed profiles for each class as we describe below; and then we used the weighted average uf the
resultant profiles to analyze the organization's overall performance. Implicit m this approach was
the assumption of dependence among different iterations in a project In reality, it appears that
14
in some projects, some iterations were independent of one another, and others were negatively
correlated; but we only picked up piecemeal indications of what form of data collection might
prove most revelatory.
We gathered two forms of data for the iteration structure. For "inner prototyping iterations
(involving the making and testing of materials and products), which were typically repeated many
times, we have "expected total number of iterations per project'" This form of data reflects an
expectation of strong negative correlation among nested levels of iterations It also reflects our
finding that our informants were typically not well informed on the iteration phenomena outside
their domains; we considered it best to ask each informant only for estimates of the numbers of
iterations she herself performed. For "outer iterations.' which typically did not occur often, we
collected data in the form of "probability of iterating." sometimes with a maximum number of
times that an activity could be executed. We treat this maximum as a global maximum and
treat visits before the maximum number as independent. This raises the following interpretive
question: when the maximum is reached, should we assume that further visits to the activity will
always succeed, or should we allow the possibility of failure (representing project termination)?
Figure 6 displays data of the iteration structure in new product development projects. Activ-
ities within a cell are assumed to proceed either in sequence (i.e . there is no chance of iterating
among each other) or in parallel. Arrows indicate the direction in which activ ities flow: "forward"
arrows indicate that an activity is successfully completed and the project moves on to successor
activities, and "backward" arrows indicate that a number of activities must be repeated. Num-
bers accompanying backward arrows describe the likelihootl of repeats Percentages indicate the
probability of iterating, and integers denote the expected number of times that an activity is
executed. Figures in parentheses indicate the maximum number of times that an activity can be
executed. Each pair of numbers corresponds to data for medium and complex projects, respec-
tively. Following our informants' recommendation, we use otir baseline project (project X) as the
profile of a simple project.
As an example, consider what Figure 6 reveals about the (|ualificatioii testing experience of
a project of medium complexity. For a project of medium complexity, there was a -309^ chance
that a qualification test would result in returning to a previous activity In 20% of such cases
the flaw required material reformulation, in 60% of them it required product redesign, and in
the remaining 20% the problem could be solved in manufacturing scale-up. In any project of
medium complexity, however, one expected to execute the t|iialification testing activity at most
three times. Table 8 condenses the iterating data for new products into an average number of
visits for each activity.
15
5.6 Reformulation Projects
Finally, Table 9 summarizes the average work content of eacli activity in reformulation projects.
These figures were obtained from an internal study at the Plastics division Unlike the figures
that we presented for new product i)rojects, the numbers in Table 9 correspond to "aggregate"
data: that is, these numbers are the total number of hours required for each task, accounting
for the total number of times that tasks are carried out and weighted with the probability of
involvement of each resource.
6 Analysis, Stage I: Capacity
Our first level of analysis estimates divisional capacity by comparing the average demand of project
related work with the time available to the resources. For each resource, we calculate its percentage
utilization: the ratio of the average rate at which the resource receives work to tiie rate at which
the resource can complete it. We calculate utilizations by means of a spreadsheet (part of which
is shown as Table 10) For managing development cycle-time, utilization information provides
important first-order performance measures. Managenient can use these figures to identify under-
staffed resources, determine probable project bottlenecks, and estimate the maximum rate at
which the organization can take on new work By varying key parameters in the spreadsheet,
management can examine their influences on the average load for each resource.
The top row of Table 10, labeled "NP Hours," shows the total amount of time that each
resource group spends on an average new product develoi)ment project. (We discuss how these
figures were calculated at the end of this section.) The second and third rows of Table 10 compare
some spreadsheet-generated measures with actual data that is available for the Plastics division.
Although the division did not keep track of the time spent by individual resources on individual
activities, it did record the total hours spent by various groups on recent projects. Thus, we can
see that our estimate of 3910 hours spent by the four development resource pools on an average
project is not too far from the division estimate of 4408. However, we appear to significantly
overestimate the time spent by technical services on an average project, and in particular it
appears that we may be attributing to them work actually performed by the development group.
This kind of analysis can point to interesting difi'erences between the way our contacts conceived
of their work and the way it actually occurred, or between the nominal functions of resources and
the roles they actually performed. For example, it appe.ir* that technical services was cliartered
to do a significant amount of routine testing that was often clone by the development group. This
may have been because technical services was often a project bottleneck, so development engineers
16

felt they could do the work more efficiently themselves. Finally, the fourth row of Table 10 shows
the amount of time resources sjient on an average reformulation project.
It is useful to decompose the utilization factors into categories of high priority and low priority
work and project-related and non-project-related work, lo compute the utilization due to priority
1 new product development projects, we multiply the average number of hours devoted to a new
product project (displayed in the first row of the spreadsheet) by the rate at which priority 1
new product projects are started (Table 1). Then we divide the result by resource capacity (from
Table 2). That is, the utilization due to priority 1 new product projects (NP) for resource A is
calculated by
. (rate of prioritv 1 NP starts) x (avg hours per NP project)utilization (NP pri 1,A) = ^
:
capacity of resource A
The utilizations due to priority 2 new product projects and reformulation projects are calculated
similarly. Beneath the priority 1 reformulation utilization row are two rows showing contributions
from administrative and support activities. Unlike the other rows, these entries represent direct
estimates from our informants as reported in Table 3 (eg from i|iiarterly reports), adjusted to
the longer work weeks. The total utilization factor is then simply the sum of the utilizations due
to the various activities. A percentage utilization close to 100 7(. indicates that our model accounts
for almost all of the resource's time. Note that we ilo not have figures for the administrative and
support activities of those resources formally outside of the product development organization
In Table 11, we show percentage utilizations when resources are allowed to pool their work -
that is, resources share their work with others according to the Reallocation level specified at the
bottom of Table 12 and the Maximum Permissible Pooling Level defined in Table 7. Specifically,
we multiply the maximum permissible hours given in Table 12 by the weighting parameter in Table
7 to obtain a total amount of work that the resources exchange. For example. Table 7 shows that
product engineers can potentially turn over much of their prototyping work to product technicians,
and the Reallocation parameter of 0.80 in this example allows them to do so at 80 percent of the
maximum permissible level. The Total column indicates that we assume reallocation happens with
perfect efficiency, i.e,, a task does not take any longer when performed by a substitute resource,
and thus the total number of manhours does not change when we introduce pooling. Figure 7
summarizes this information in a barchart.
The utilization figures in Tables 10 and 11 raise several issues. One of these is that in order
for some resources to complete all of their work (including priority 2 work), we need to allow
them to maiximally reassign work to other resource groups. There are a few possible explanations
for this result. Since engineers estimated most of our numbers. the> may have systematically
overestimated their own contributions at the expense of their technirian^ ,\nother possibility
17

is that the group simply took on more work tlian it could handle. This extra work may have
gotten done in last minute stints of overtmie as deadlines approached. Our model does not allow
for overtime beyond the hours estimated in Table 2. Fnially. our average activity time estimates
may be simply too high. We believe that this last factor cannot account for much of the problem
because our calculations of total average time per project agree closely with the division's own
data.
Table 12 summarizes the adjustable parameters of this spreadsheet. The "weighting param-
eter" shows how we compute the average activity times from the figures that we collected as 10
percent and 90 percent estimates. The value .9 means that we give 90% of the weight to the lower
estimate and 10% to the higher one. We needed to use such a high factor (indicating a distribu-
tion heavily skewed towards the lower estimates) in order to arrive at a reasonable estimate of
total hours per project. Although this was initially a disturbing finding, we think it may point to
significant negative correlation in the activity times: a given project is likely to have one or two
"sticking points" that take abnormally long to complete, but the process of working through them
facilitates other activities. It also implies that the processnig time distributions may be heavily
skewed to the left
The "loop factor adjustments'" were introduced in response to an informant's comment that
our estimates for the number and duration of the prototyping loops were unreasonably high. This
too is most likely due to negative correlation. The average slab prototyping effort did indeed take
21 iterations (as shown in Table 8), but each iteration is unlikely to take the Product Engineer the
full number of hours required by the first iteration Based on our informants' reaction to the totals
we derived from their estimates of each Iteration, we introduced the Loop Factor Adjustments
shown in the example to bring the totals into closer conformity to reality.
7 Analysis, Stage II: Cycle Time
To carry out the second stage of our analysis, we developed a Miiuilation model for studying
cycle-time performance of the product development process at the Plastics division. Unlike the
first-order analysis which used only information regarding averugt processing times and average
new start rates, the simulation model explicitly incorporates the uncertainty of the development
process. For example, interarrival times as well as activity times are subject to variability, and
some activities may need to be iterated several times before they are successfuly completed. In the
next section, we show how the simulation model can be used to identify trends, develop qualitative
insights, and suggest system improvements.
The basic information regarding resources, project types, activity rimes, and routing require-
18

ments necessary to build a simulation model of the Plasties division are roiitained m Section 5.
However, instead of using all of this information, we simplify the represt^iitation of the process
significantly by aggregating activities and resources. To create a simulation model at the level
of detail provided in Section 5 (and indeed to experiment with such a model) would require an
overwhelming amount of time, and we believe it would only marginally improve insight. Our
simulation model is intended to capture the spirit of the product development process at the
Plastics division without actually mimicking all levels of interactions. (Section H of the XCELL
manual (Conway, 1990) provides an excellent discussion of the virtues of keejjing simulation mod-
els small and simple.) All simulations were performed using the simulation package Siman ( 1990).
7.1 The Simulation Model
Resources
The simulation model aggregates the 9 resources shown m Table 2 into 7 composite resource
pools (see Table 13) First, we group the product engineers and process engineers into a single
resource called product development (PD) engineers Second, the product technicians and pro-
cess technicians are combined into a pool called product develoment (PD) technicians. Third, we
replace the group miscellaneous, which previously was composed of several groups including the
specifications department, solely by the specifications group (i.e., all other groups in the miscella-
neous category have been deleted from consideration). Our aggregation, which coalesces several
resources into a single group, essentially creates pools of interchangeable resources that were not
treated as interchangeable in the original model Such an aggregation scheme clearly creates a
more efficient organization and consequently results more optimistic predictions of system perfor-
mance. However, because we are pooling resources with comparable levels of utilization, we do
not expect this aggregation to have a significant impact on system performance.
Finally, we allocate additional capacity to resource pools that belong in the technical group of
the Plcistics division (these include product development engineers and technicians, application
engineers, and technical services). These resources typically work extra hours when projects are
backlogged or when deadlines approach, and the maximum server capacity figures shown m Table
13 reflect the maximum number of hours that these resources uork during those critical periods.
In our simulation models we report the fraction of time that each resource pool must work its
maximum overtime.
19

Project Types
As described in Section 5, the two job types in the network are "new product projects'" and
"reformulation projects," and eacii job type can be assigned either priority 1 or priority 2 The
Plastics division initiates an average of 3 priority 1 new product projects and 2.5 priority 2 new
product projects per year. In addition, it starts an average of 1 reformulation project of each
priority every year. Times of new project starts are typically uncertain, and we assume that the
starts of new projects are characterized by a Poisson process.
Activities and Precedence Constraints
In addition to aggregating resources, the simulation model also groiip.s together several activities
as shown in Table 14. For example, we grouped all activities related to marketing and sales such
as "Review Patent" and "Identify Lead Customer" into an activity called "Marketing." Moreover,
we coalesced all prototyping activities into a single activity called "Prototyping ""
In general, any
subset of a network can be replaced, without much sacrifice in accuracy, by a single node with
suitably defined processing times and routing instructions The combined effects of processing
times, queueing times, and routing among the nodes of the subset can be reasonably approximated
by a single node whose processing times and routing probabilities are defined appropnatel_v. We
first investigate a simplified model. Subsequent studies can determine the most significant nodes
and examine these individual nodes in greater detail.
Figure 8 depicts the flow of activities in new product projects Note that even though some ac-
tivities have been aggregated, the simulation model still exhibits iterations among the aggregated
activities. In our simulation model we treat all routing as "Markovian." meaning that the future
route of a job is not affected by its processing history As indicated in Figure 8, the probability
of repeating a prototyping activity is 0.75, and the probability of returning to prototyping after
manufacturing scale-up is 0.60. Thus, the average number of times manufacturing scale-up and
prototyping are carried out are (1 - .60)"' = 2 ' nd 2.5x(l - 75)~' = 10 respectively.
Figure 9 illustrates the flow of activities m reformulation projects. As discussed in Section 5,
reformulation projects constitute a very small fraction of project-related work and we collerfed
only summary data for this type of projects. Consequently, we do not model reformulation
projects at the same level of detail as for new product projects For example. Figure 9 shows no
iterations between the activities, whereas m reality, one typically experiences several iterations of
the prototyping activities. Even with these simplifications, our simulation models were still able
to predict cycle-time performance with reasonable accuracy
20

Task Times
Table 15 displays the average processing time for eacii task We derive these averages from the
spreadsheet calculations discussed in Section 6. If an activity corresponds to an aggregation of
several sub-tasks, then the average task time is calculated by summnig all task times of those
sub-tasks in the aggregated task over all resource groups composing the aggregated resource. We
simplified matters somewhat by applying a "level of significance" test to each activity/resource
pair: We assign time to an activity/resource pair only if that resource's contribution (m terms
of hours) exceeds a pre-set level of significance; otherwise, we consider that resource to spend
zero time on the activity. We chose the level of significance based on our understanding of the
development process at Chemicals, Inc In working out this issue, as well as several other issues
discussed in this section, our goal was to identify the suwplfst model of the product development
organization at the Plastics division that captured its essential characteristics.
Even though we collected some distributional information for task times (for example, the 10
and 90 percentiles of individual task times), in the end we modeled all ta.sk time distributions as
exponential. In our preliminary simulation experiments, we found that system performance did
not vary significantly with different distributional forms for several key activities (e.g. prototyping
and manufacturing scale-up). We conjecture that because there are several other contributing
sources of uncertainty, small changes in the variability of [processing times produce imperceptible
changes in cycle-time prefonnance.
We took support ami administrative times from Table 10 when such figures were available;
otherwise, we approxmiated them based on our understanding of the role of the resources and the
nature of their work. (For example, because the manufacturing engineers primary responsibility
is to the production and manufacturing operations, they spend the bulk of their time on activities
outside the product development arena. This is reflected in their high support times.) We found it
necessary to reduce the administrative times for several resources to obtain reasonable performance
measures. This modification is partially justified by noting that many adminstrati\e duties can
be forgone in critical situations. For example, vacations can be postponed, meetings do not have
to be attended, and training activities can be rescheduled. We model activity times for both
support and administrative activities as exponentially distributed Wheras support activities
arrive according to a Poisson process, administrative times, which are more regular in nature,
arrive deterministically.
•21

Pooling
Using spreadsheets similar to those described in Section 6, we calculate the percentage utilizations
of each resource in the network. Table 16 summarizes the results of these calculations.
We noted in Section 6 that an important characteristic of the product development envi-
ronment is the possibility of pooling work among various resources. Moreover, our spreadsheet
analysis from Section 6 indicated that some resources had to maiimally reassign their work to
other resource groups if they are to have enough capacity From Table Ki, it also appears that
there is much opportunity for engineers to sharf part of their work with technicians In our
simulation model, we let product development engineers reassign part of their work to product
development technicians whenever there are more than -5 ongoing projects We assume that work
can be transferred from PD engineers to PD technicians only in Phase 1. Prototyping, and Man-
ufacturing Scale-Up. For each of these activities, at most SO'/J. of the engineers' work can be given
to technicians.
Service Discipline
We set the service discipline at each workcenter to be the "round robin" discipline with service
segments equal to two weeks. Under this discipline, an engineer or technician processes the first
task in his queue for two weeks or until the task is finished. If he completes the task within two
weeks (the service period), then the job moves on to its next ta.sk(s). Otherwise, the task returns
to the end of the queue and its remaining service time is updated to reflect the last round of
service.
7.2 Simulation Results
Table 17 shows various statistics obtained from the simulation The performance measure of
primary interest in this paper is project completion time, which we will also refer to as project
cycle time. It is the amount of elapsed time from the beginning"" of th* iTOject until the "end" of
the project. New product projects begin with concept generation and feasibility studies (Phase 1),
and they end with the product launch (Phase -4). Reformulation projects begin with prototyping
activities and end when the product is launched (Phase 4). Another nieasure of performance that
we study is the number of unfinished projects in the organization.
To calibrate our models, we compare our findings with figures provided by the Plastics division.
Our host was able to provide us with detailed timelines for priority 1 new product projects from
which we were able to compute average project completion tinies Such records were not available
•22

for other types of projects, and for these statistics, we relied on estimates l)v the manager of the
Plastics division.
Table 17 shows that the simulated average completion time of priority 1 new product projects
is 84 weeks, compared to the figure of 82 weeks reported by the Plastics division. On the other
hand, both simulated and reported figures indicate that the Plastics division requires more than
3 years to finish priority 2 new product projects.
For reformulation projects, the simulated completion times are 5 months for priority 1 projects
and 1 year for priority 2 projects. These numbers are somewhat lower than the figures estmiated
by the manager of the Plastics division: 6-9 months for priority 1 reformulation projects and 1-3
years for priority 2 reformulation projects. Although reformulation projects are formally assigned
either priority 1 or 2, in reality they are generally treated with less urgency than new product
projects of the same priority. We mentioned in Section 4 that refornnilation projects are treated
as low priority work, and only when a project needs to be expedited is it elevated to priority 1.
Consequently, it is likely that a priority 2 reformulation project is often treated as "priority 3."
This informal setting of priorities may partly explain the biases in our simulation results: the
simulated completion time for priority 2 reformulation projects is shorter than the actual project
cycle time, whereas priority 2 new product projects take longer to complete than reported by the
Plastics division.
Figures 10-13 show histograms and cumulati\e distributions of the project cycle time for the
2 types of projects. The 90th percentiles of project completion time, which can be read from
Figures 11 and 13, are siginificantly longer than the corresponding averages; for example, while
priority 1 new product projects are completed in 84 weeks on average. lO'/J of them take more
than 2.5 years! It is clear with these displays that it is not enough to measure just average project
completion times; information concerning the distribution of project completion time must also
be considered.
To measure the impact of variability and congestion on cycle time performance, the last column
of Table 17 shows the ratio of the actual average project completion time (which appears m the
fourth column) to the project cycle time predicted by PERT (fifth column). This number, the
"actual- to- PERT" ratio, compares the amount of time that a project spends waiting for resources
to the amount of time it actually spends being proces.sed. For example. Table 17 indicates that
an average priority 1 new product project suffers relatively little from congestion, as less than
10% of its time is spent idle waiting for resources. A priority 2 new product project, on the
other hand, spends (on average) more than half of its time waiting to be processed Priority 2
reformulation projects, which are less time-intensive than new product projects, suffer e\eii more
from the congestion. It spends approximately twice as much time waiting for a resource as ii does
23

being processr^d.
The last four rows in Table 17 compare the siniulateil iiuinber of uiiftiiished projects in the
Plastics division with the figures estimated by its manager. Again, readers should note the dis-
parity between averages and 90th percentiles
Finally, Table 18 shows the fraction of time that each resource pool in the core technical group
must work its maximum overtime. These numbers appear to be quite high for some resources -
PD engineers work 60-hour weeks more than 65% of the time. On the other hand, PD technicians
work their maximum work-week less than 6 weeks per year. As pointed out in Section 6, our
data appears to be heavily skewed towards engineers: because much of our data was estimated by
engineers, we suspect that they may have over-estimated their contribution and under-estimated
that of their technicians. It is also possible that more work is |")ooled l.^etween engineers and
technicians than we have allowed.
Readers may notice that we have presented our results in terms of "average" project completion
times and "average" number of unfinished projects. We obtaineii these figures by simulating
the models until they reach "steady-state" and take the long-run averages as our performance
measures. The time horizon we used in the simulation experiments- approximately 2000 years! -
is clearly inappropriate when considering the product development environment (Each simulation
run takes approximately 80 minutes of CPU time on a Micro\',4.\ 3800-) The difficulty here is
essentially one of finding the correct initial conditions for the system. If we were able to collect
data concerning the present distribution of workloads - i.e., the luimber of projects currently in
the system and the amount of work remaining to be done on each project by each resource - then
simulation could answer practical questions such as "how will the system perform over the next
five years." Because we have no information regarding initial conditions, we must simulate the
systems long enough for them to accumulate a reasonable amount of work, and we approximate
the performance measures by their steady-state values.
8 Conclusion
When we began this project, we hypothesized that process management would offer opportunities
to improve product development in a wide class of businesses and that process modeling would
prove to be a valuable tool supporting that effort. We believe that the results reported in the
previous sections are sufficiently positive to encourage further research along these lines. The
hurdles we encountered along the way, however, are also valuable research results Here we
discuss these lessons under two headings - technical constraints and organizational impediments
From a technical point of view, there are some difficulties inherent in the differences between
24

product development engineering and repetitive manufacturing operations Whereas manufactur-
ing produces thousands of identical units of dozens of different products, the tasi< of tlie engineer-
ing organization has tiie inverse structure: it produces dozens of different product designs using
thousands of possible engineering and support activities. For manufacturing, repeatability is of
the essence, and the constituent activities have to be rigorously standardized. In the engineering
case, the product design effort aims at the optimal unique solution, and tlie group performs the
required activities in whatever order, combination, and form necessary to reach that goal (Of
course, customized manufacturing job shops look a lot like engineering from this perspective )
In this technical setting, a process perspective seem- iitithetical to the very essence of product
development engineering, and the difficulties we encountered in building a process model have
helped us better understand the distinctive nature of engineering. Our research was designed to
test the hypothesis that tliis view of engineering as essentially non-routine is sufficiently false -
that there is enough repetitiveness in at least some engineering organizations - to make a process
model possible and useful. We believe the results reported in the previous sections support our
hypothesis.
Second, even if a process view is feasible, another technical difficulty lies in the intrinsic
complexity of process modeling. Many managers are familiar with the enormous complexity of
manufacturing process plans, and they justifiably worry that the burden of creating, maintaining
and exploiting "engineering process plans" would outweigh any benefits. We hope that this project
has shown that this burden can be greatly reduced by appropriate simplifications and that the
benefits are potentially considerable.
A third technical impediment that surfaced only occasionally m our project might prove to be
an interesting subject for future research. Our approach takes the project as the unit of analysis,
but in reality projects belong to streams: new products are often generated as variants of old
ones. For example, dialogue with new customers often leads the product development group to
adapt product specifications in order to broaden their potential customer base If our collection
of project data proved difficult, it was in part because the engineers and managers tended to view
the organization's work as composed of such streams, rather than as a set of discrete projects.
If we are right and a process approach could be a powerful management tool, why has it not
been attempted before? Our project also led us to several hypotheses about the specifically orga-
nizational impediments that account for engineering management's traditional focus on discrete
projects rather than on ongoing processes.
First, engineering managers have tended to concentrate on the unique features of each project.
a point of view that is rooted in the assumption that the effect ivene.ss of an engineering project
depends most critically on creativity. It is natural that the culture of engineering should hie;hli,B,ht
25

and celebrate the distinctive and novel challenges in engineering work. In many engineering
organizations, however, there is considerable cross-project commonality and a high ratio of routine
to non-routine activities. In such contexts, projects can be managed as variants of previous
projects, and effectiveness depends not only on the creativity with which the truly creative parts
of the project are conducted but also on the efficiency with which the routine parts are conducted.
As product development time becomes a more salient competitive factor, management needs to
shift its attention from an exclusive focus on creativity and product features and to consider as
well the efficiency of the product development process.
A second organizational impediment for engineering managers is the lack of requisite data. It is
difficult to determine what data ought to be gathered; moreover, unlike manufacturing operations,
there is no unobtrusive way to collect the data that process modeling would require. Nevertheless
some organizations do collect time cards from engineers, and if the organization has a consistent
nomenclature of activities, then times can be collected for projects and activities, thus opening
the way to systematic process modeling. In the future as engineering work is done on CAD/CAE
workstations, the opportunities for unobstrusive data collection will grow.
Finally, and perhaps most fundamentally, the reluctance to develop process models might
stem from an image of engineers as "autonomous" professionals who should not be told how to do
their jobs. Indeed, process models might connote a recipe for regimentation and alienation. We
believe, however, that if process management is presented as a route towards effectiveness - not
as a way of making engineers work harder but as a tool that helps them work smarter - then they
will be enthusiastic about it. Our experience at the Plastics division supports this hypothesis. We
found a high level of support for our project, and the engineers were very cooperative throughout
our time-consuming data collection effort. It is appropriate that we close this report by thanking
them.
Acknowledgements: This study would not have been possible without the generous coopera-
tion of the company we have called Chemicals, Inc We owe thanks m particular to the manager
and staflF of its Plastics division. This project has also benefited from the advice and support of
Chuck Holloway and Mike Harrison. Funding from the Stanford Institute for Manufacturing and
Automation is gratefully acknowledged. Elizabeth Schwerer was supported by a National Science
Foundation graduate fellowship.
References
Adler, p., a. Mandelbaum, V. Nguyen, and E. Schwerer, "From Project to Process Man-
agement: Strategies for Improving Development Cycle Time," submitted for publication ( 1992a).
, ,, AND , "From Project to Process Management: Modeling Issues and
Data Collection Challenges in Building a Process Model," UCLA Conference Proceedings ( 199'2b)
Alexander, R., "Scheduling and Resource Allocation Methodologies for Fast Product Development
in a Multi-Product Environment," unpublished master's thesis, Sloan School of Management,
Massachusetts Institute of Technology, 1990
Allen, T. J. and S. I. Cohen, "Information Flow in Research and Development Laboratories,"
Administrative Science Quarterly, 14 (1969) 12-19
Anthony, R. N., The Management Control Function, Harvard Business School Press, Boston, 1985.
Baccelli, F. and a. Makowski, "Queueing Models for Systems with Synchronization Con-
straints," Proceedings of the IEEE, 77 (1989), 138-161.
Black, T. A., C. H. Fine, and E. M. Sachs, "A Method for Systems Design Using Prece-
dence Relationships: An Application to Automotive Brake Systems," Alfred P. Sloan School of
Management Working Paper No. 3208-90-MS, Massachusetts Institute of Technology. 1990
Blackburn, J. D., "New Product Development: The New Time Wars," in Time-Base Competition-
The Next Battleground in American Manufacturing. J D Blackburn. Ed . Business One Irwin.
Homewood, 1991.
Clark, K. B., W. B Chew, and T. Fujimoto, "Product Development in the World Auto
Industry," Brookings Papers on Economic Activity. 3 (1987), 729-781.
AND T. Fujimoto, "Lead Time in Automobile Product Development Explaining the Japanese
Advantage," Journal of Engineering and Technology Management. 6 (1989a), 25-58
AND , "Overlapping Problem Solving in Product Development," m .\fanaging Interna-
tional Manufacturing, K. Ferdows, Ed., (1989b), 127-152
AND , Product Development Performance: Siralegy. Organization, and Management
in the World Auto Industry, Harvard Business School Press, Boston, 1991.
Conway, R., W. L. Maxwell, J. O. McClain, S. L. Worona, User's Guide to XCELL-h
Factory Modeling System, Release J,.0, The Scientific Press. South San Francisco, 1990
Cooper, R.G., "A Process Model for Industrial New Product Development." IEEE Transactions on
Engineering Management, 30 (1983), 2-11.
Dean, B. V. (Ed), Project Management: Methods and Studies. North-Holland, .\msterdam, 1985.
Eppinger, S. D., D. E. Whitney, R. P. Smith, and D. A. Gebala. "Organizing the Tasks m
Complex Design Projects," Alfred P. Sloan School of Management Working Paper No- 3083-89-
MS, Massachusetts Institute of Technology, 1989.
Hayes, R. H., S. Wheelwright, and K B. Clark, Dynamic Manufacturing: Creating the
Learning Organization. Free Press, New York, 1988.
Imai, K., I. Nonaka, and H. TakeUCHI, "Managing the New Product Development Process: How
Japanese Companies Learn and Unlearn," in The Uneasy Alliance: Managing the Productivity-
Technology Dilemma, Kim B.Clark, Robert H Hayes, and Christopher Lorenz, Eds, Harvard Busi-
ness School Press, Boston, 1985.
Jackson, J. R., "Networks of Waiting Lines," Oper. Res., o (1957), 519-521
, "Jobshop-Like Queueing Systems," Management Sci.. 10 (1963), 131-142.
Kleinrock, L., Queueing Systems Volume 1: Theory. Wilex .k Sons, Npvv "^'ork. 1975
Neumann, K., "GERT Network and the Time-Oriented Evaluation of Projects," m Lecture \o1es
in Economics and Mathematical Systems. Vol. 112. Springer V'erlag, .New "^'ork, 1979
Nguyen, V., "Heavy Traffic Analysis of Processing .Networks with Parallel and Sequential Tasks,"
Ph.D. dissertation. Department of Operations Research, Stanford, 1990.
, "Processing Networks with Parallel and Sequential Tasks; Heavy Traffic Analysis and
Brownian Limits," Ann. Appl. Prob.. forthcoming
Pegden, C. D., R. E. Shannon, and R. P. Sadowski Introduction to Simulation Using .s'/.IM.V
McGraw-Hill, Inc., 1990.
Pristker, a. a. B., Modeling and Analysis Using Q-GERT Networks (2'"^ Edition), John Wi-
ley/Halsted Press, New York, 1979.
Rosenthal, S. R., Effective Product Development: How to Cut Lead Times and Increase Customer
Satisfaction, Business One Irwin, Homewood, 1992
SchOENBERGER, R. J., World Class Manufacturing: The Lessons of Simplicity Applied. The Free
Press, A Division of Macmillan, Inc., New York, 1986.
Stalk, G. Jr., and T. M, Hout, Competing .Against Time: How Time Based Competition Is
Reshaping Global Markets, Free Press, New York, 1990.
Taylor, B. W. and L. J. Moore, "R&D Project Planning with Q-GERT Network Modeling and
Simulation," Management Science, 26 (1980), 44-59.
TUSHMAN, M. L., "Technical Communication in R 1' D Laboratories: The Impact of Project Work
Characteristics," Academy of Management Journal. 21, (1978). 624-645.
, "Work Characteristics and Subunit Communication Structure: A Contingency Analysis,"
Administrative Science Quarterly, 24 (1979) 82-98.
Watkins, M. D. and K. B. Clark, "Strategies for Managing a Project Portfolio," W'orking paper
No. 93-004-, Harvard Business School, 1992.

Wheelwright, S. C, "Time to Market in New Product Development." ICL Technical Journal.
November (1989), 62.5-646.
AND K. B. Clark, "Creating Project Plans to Focus Product Development." Harvard
Business Review, March-April (1992), 70-82.
AND , Revolutionizing Product Development: Quantum Leaps in Speed. Effi-
ciency and Quality, Free Press, New York, 1992.

Project Type

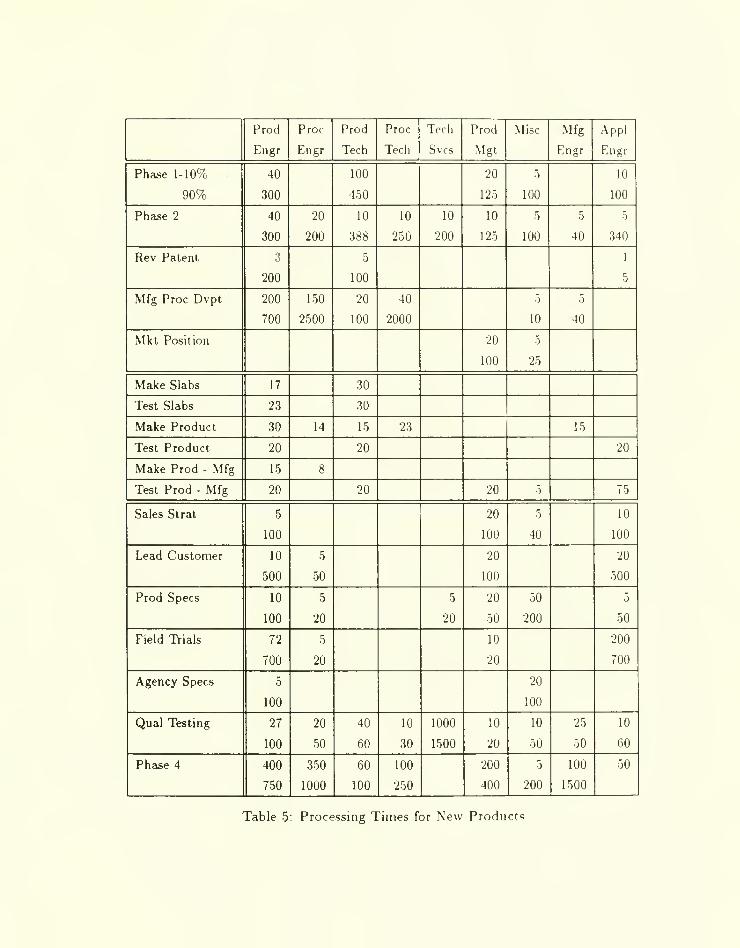

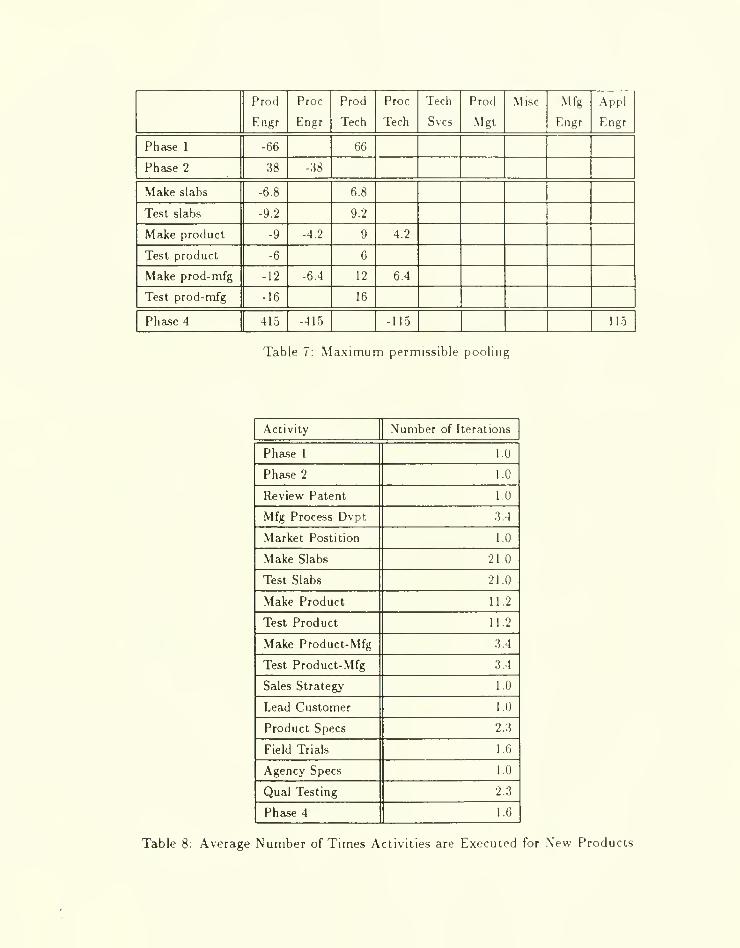


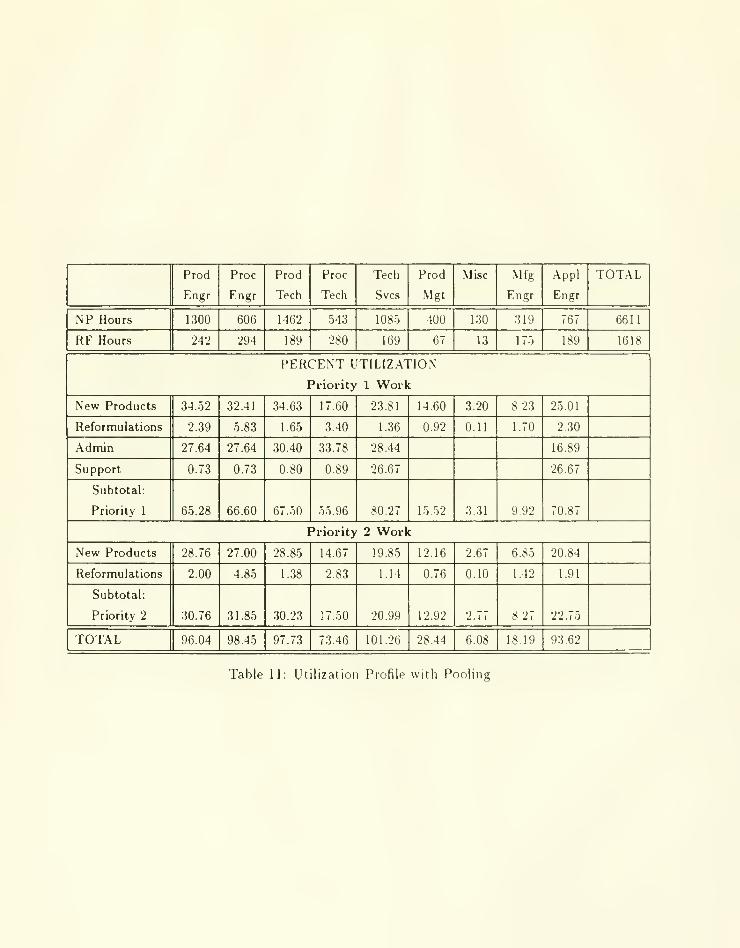

Rate of work generation, new products:
- priority 1 new project starts per year

Resource Name


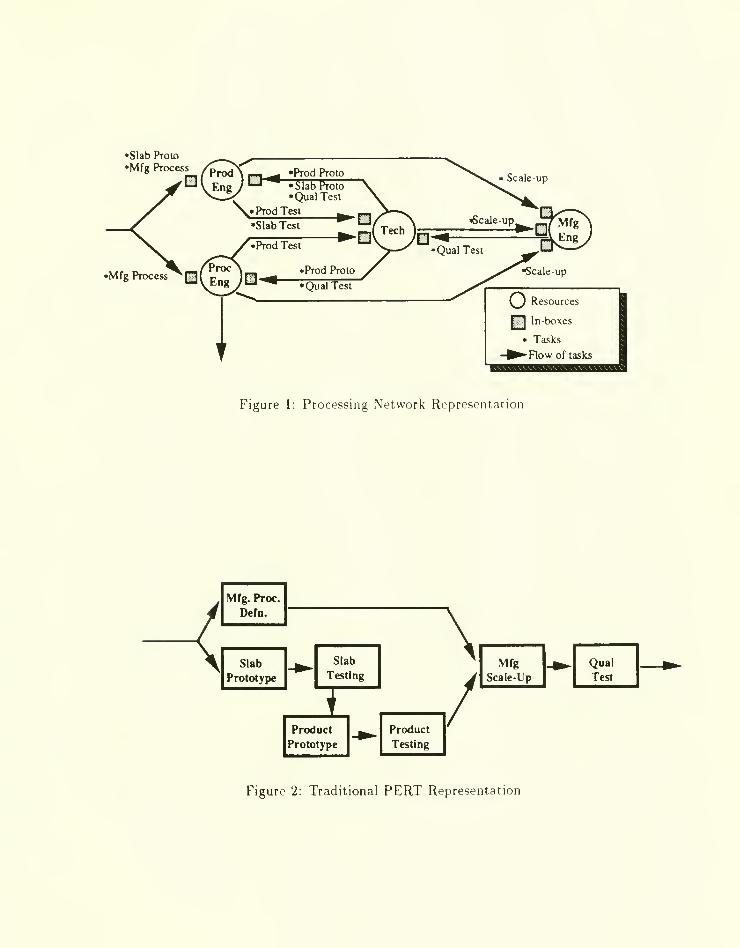
Slab Proio
•Mfg ProcessProd '\ p-^g_;PTodProto
Eng y"^ 'SlabProtoy •QualTest
\.« Prod Test
Scale-up
Figure 1: Processing Network Representation
<
Mfg. Proc.
Defn.

CEO
Corp
R&D PRODUCTION DIVISIONS
OREGIONAL AND PRODUCT FAMILY GROUPS
I r
Technology Finance/
AdminPRODUCT DIVS
Mki Analysis
and Sales
Plastics
Div.
Technical Dept
-| 1
Technical Appl
Services Eng
Mfg Product Mktg Finance Qlty
Mgt Assurance]
Prod Prod Process Process
Eng Teh Eng Tehu ---.
Figure 3: Organization Chart of Cliemicals Inc.

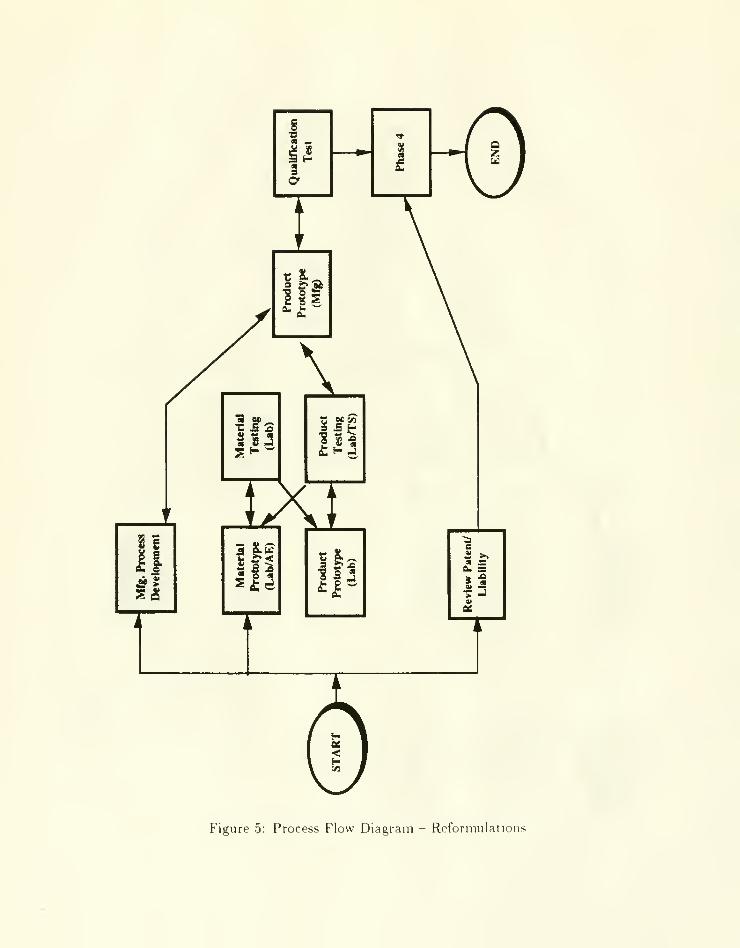
Figure 5; Process Flow Diagram - Reformulations

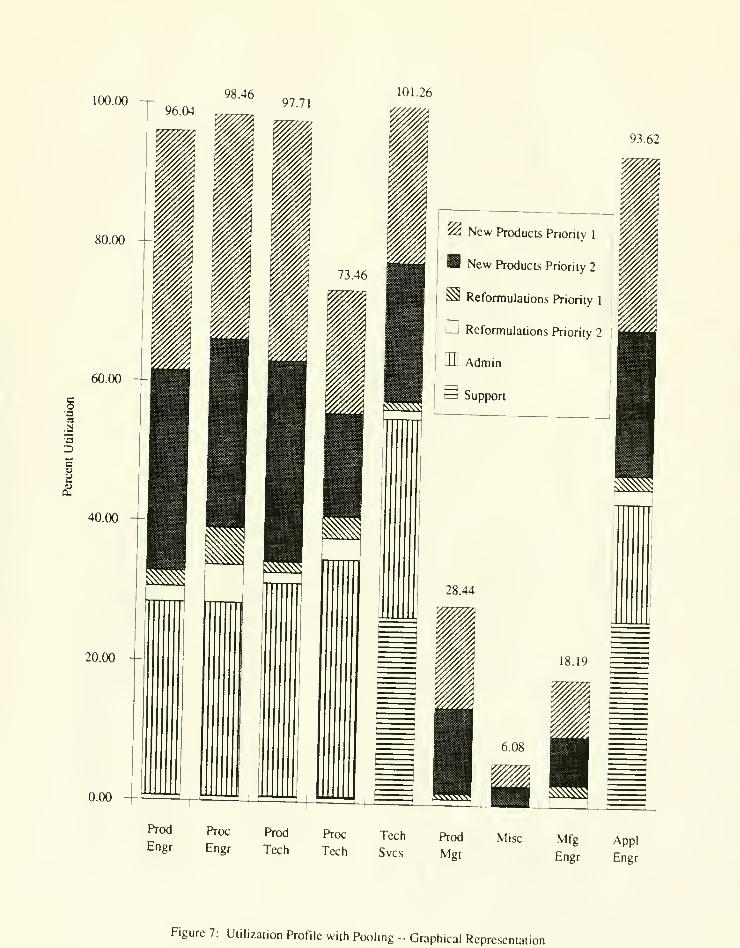
100.0098.46
97.7101.26
80.00 —
60.00
eoa
Deua
40.00
20.00 ~
0.00
Prod
Engr
New Products Priority 1
New Products Priority 2
^ Reformulations Priority 1
U Reformulations Priority 2
[H Admin
td Support
93.62
18.19
Proc
Engr
Prod
Tech
Proc
Tech
Tech Prod Misc
Svcs Mgt
Mfg Appl
Engr Engr
Figure 7: Utilization Profile with Pooling - Graphical Representaiion
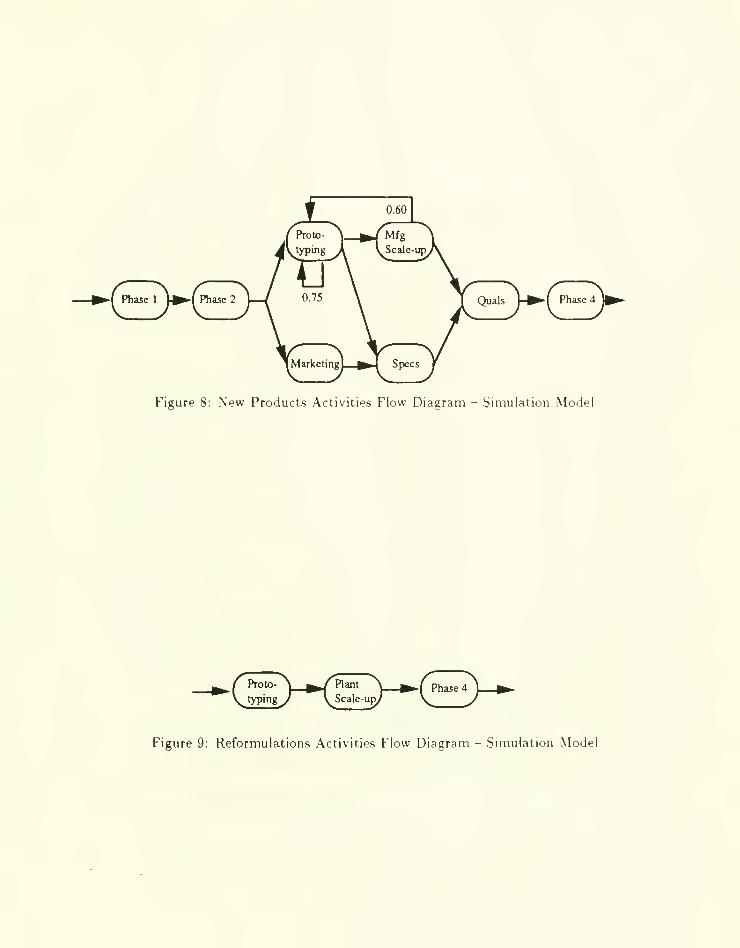
-[ Phase 1 \^»[ Phase 2 \-^'( Phase4 j^>
Figure 8: New Products Activities Flow Diagram - Simulation Model
/^ Proto-^^y'Plam A ^.(>hasc4
Figure 9: Reformulations Activities Flow Diagram - Simulation Model

L OOlt-
1O'OLi
ooee
0063

Q 00 It'
- OQLi
3
>
3£3U
0)
E
coa_u
o.EoU
o
3
1)
z
3SO
dso
d d d d d d
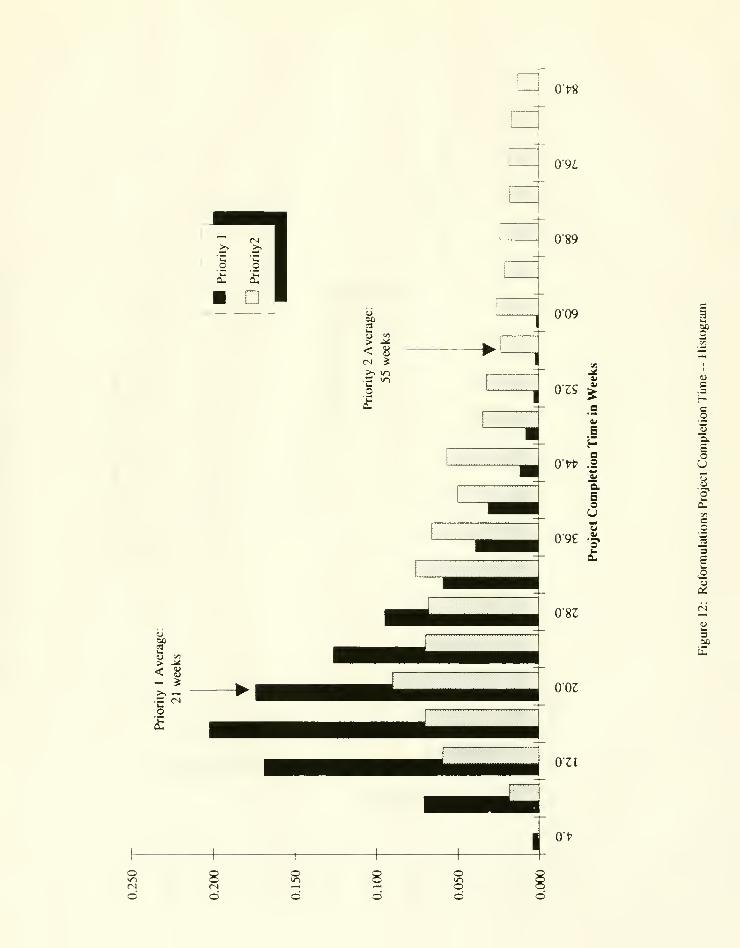
0>8
ao
<N S
0-9L
089
009
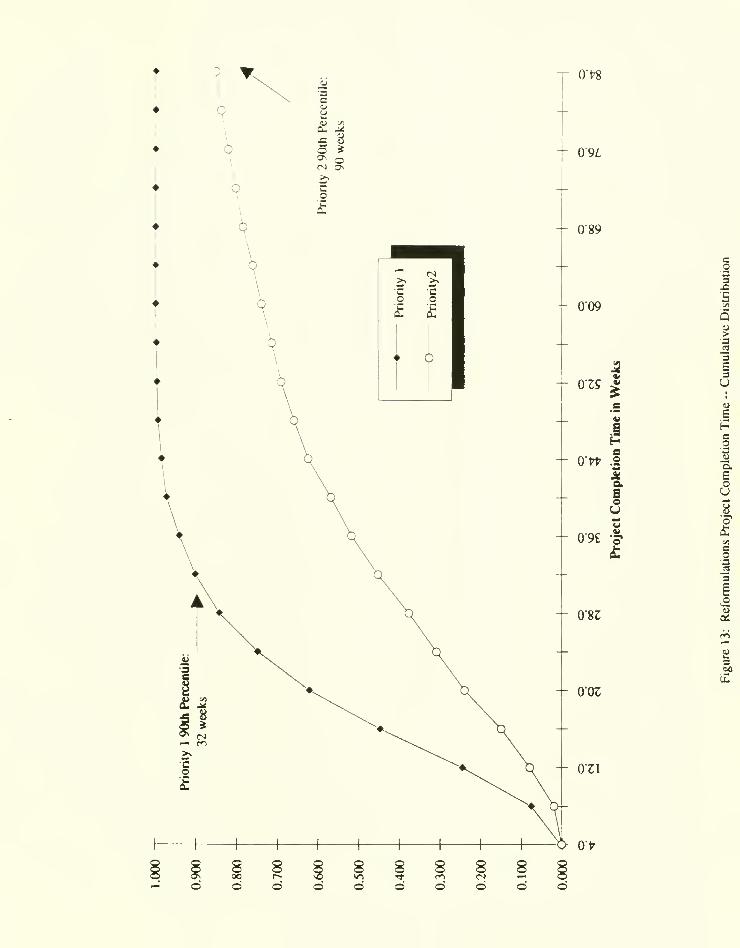
T O't^
- 09Z.
g•saJO
I"a-
EsU
o"S"5.
E6
I09e
I
OS
d00
d d d d d d

/
7bb ,85


Date Due

UBBABlE'>„P!'f,\,
llllll
3 c,Q60 00624021 ?
