from college to work: the case of the sudan; 1987 -...
TRANSCRIPT


From college to work: the case of the Sudan

This study is part of the HEP research project on 'Higher education and employment', directed by Bikas C. Sanyal
From college to work: the case of the Sudan
B . C . Sanyal L . Yaici
I. Mallasi
Paris 1987
Unesco: International Institute for Educational Planning

The views and opinions expressed in this volume are those of the authors and do not necessarily represent the views of Unesco or of H E P .
This volume has been typeset using Unescd's computer facilities and the Waterloo 'Script' documentation-composition program.
First published in 1987 by the United Nations Educational, Scientific and Cultural Organization, 7, place de Fontenoy, 75700 Paris Printed in France by Soregraph, 92300 Levallois
I S B N 92-803-1120-4
© Unesco 1987

Preface
This case study on the transition of higher-education graduates from the institutions of higher education to the world of work in the Sudan is a follow-up of an earlier research on the-global relationship between higher education and employment in the country, which was carried out by the H E P and a national team of researchers and published in 1975. The present research, undertaken within the framework of the IIEP's previous M e d i u m - T e r m Plan (1978-83) is part of the research programme on education, employment and work.
This research addresses itself to key issues such as the evolution of higher education in recent years as a response to the changing needs of Sudanese society, students' choice in higher education and their performance, the insertion of students into working life, and the match of students' qualifications with job requirements on the one hand and between students' expectations and their achievements on the other.
These studies, as well as other activities in the research programme of the H E P , reflect the ongoing concern in educational planning and policymaking with the relationship between education and employment. The series of studies are meant not only to contribute a relevant data-base for each of the specific countries covered by the programme, but also to propose more elaborate methodologies for approaching similar problems in other countries.
The relationship between education and employment is one of considerable complexity and defies over-simplified models of quantitative correspondence between the output of an educational system and the expected intake of the labour market. Perceptions, attitudes and expectations—not only of students but also of prospective employers and of already employed graduates—play an important role in this relationship and require m o r e of our attention if w e are better to understand its dynamics. It is one of the attributes of this study that it attempts to provide a systematic multidimensional exploration of the linkage between higher education and the labour market for post-secondary graduates. The information-base which is thus created should allow for better guidance of planners and policymakers in the further development of higher-education programmes.
v

Preface
The preliminary draft of this study was reviewed by a group of national and international researchers, planners and decision-makers at a workshop organized in Khartoum. The present volume is a substantially revised version, based on the suggestions and criticisms received at the workshop.
It is m y hope that decision-makers and the professional community in Sudan will derive some benefit from the results of this study. The H E P has been most fortunate in obtaining the full co-operation of all concerned Sudanese authorities in the preparation and organization of the study, and wishes to acknowledge this most sincerely. It is a pleasant duty to acknowledge the close professional co-operation that w e have enjoyed throughout this project with the National Council for Higher Education, the Higher Education Grants Committee, the University of Khartoum, and, of course, the Ministry of Education. All of IIEP's research programmes hinge on close co-operation with the host country's research team. I a m therefore particularly glad to include this study as a further example of such eminent collaboration between H E P and a M e m b e r State of Unesco.
Financial support for this study has been provided to H E P by the Canadian International Development Agency (CIDA), the Norwegian Agency for International Development ( N O R A D ) , the Swedish International Development Authority (SIDA), and the Ministry for Economic Co-operation ( B M Z ) of the Federal Republic of Germany, and this is acknowledged with gratitude.
Sylvain Lourié Director, HEP
VI

Contents
Preface v
Introduction 1
I. The economy and the education system 25
II. Surveys of students, graduates and employers 47
III. The educational context preparing for higher education 54
IV. The world of higher education as perceived by the student 79
V. The higher education graduates 113
VI. The employers' perceptions 753
VU. Findings and recommendations 182
Appendix A : Questionnaires 191
vi i

Introduction
A n overview of the problem of graduate unemployment
Whatever the political ideology of a government, employment of graduates from the institutions of higher education is considered an essential element of national development, not only because the employment market is the core of social and economic development determining the role of an active citizen, but also because every citizen is entitled to have a social role to play and today gainful employment is the means of playing that role. Statistics on the level of unemployment by educational level of citizens are not available for most countries of the world. T h e International Labour Office (ILO), one of the specialized agencies of the United Nations, publishes statistics on unemployment by different categories of occupations for the countries where such statistics are available. The two occupational categories, namely 'professional, technical and related workers' and 'administrative, executive and managerial workers' mostly comprise graduates, i.e. successful completers of any third-level education. T h e unemployment situation in these two categories reflects to a large extent the unemployment situation of graduates. According to the I L O , the number of unemployed w h o had previous employment experience in these two categories has increased for all the industrialized free-market countries and most of the developing countries during the last decade.
A large s u m of money has been invested in educating these graduates, which could otherwise have been invested in job-creating productive programmes. It is not only the economic aspect which makes this problem so serious. The social and political stakes are also very high.
The extent of unemployment discussed above relates only to open unemployment and reveals only the peak of the iceberg, because it does not reveal the enormous amount of underemployment which is reflected in non-voluntary part-time work and underutilization of skills and capabilities on the job. The I L O therefore has categorized two types of underemployment: 'visible underemployment', involving shorter than normal periods of
1

Frpm college to work: the case of the Sudan
work , and 'invisible underemployment' which is characteristic of persons whose earnings are abnormally low, whose jobs d o not permit full use of their capacities or skills, or w h o are employed in establishments or economic units where productivity is abnormally low.
In most developing countries, underemployment of graduates is a m o r e serious problem than open unemployment of graduates. In the Philippines, where open graduate unemployment did not seem to exist during the last few years, one out of four employed persons was a nonvoluntary part-time worker—an example of visible underemployment.1 In Sri Lanka, it is estimated that around one to two thousand university graduates in arts-based disciplines work in the clerical service, which requires only second-level education—an example of invisible underemployment. In Bangladesh, according to a Planning Commission estimate, out of 610,000 educated job-seekers employed (with secondary education or higher qualifications), 189,000 were inappropriately placed, being unable to utilize their training.
T h e industrialized countries also suffer from underemployment. According to one estimate, in the United States of America underutiliza-tion of college graduates ranges between one-quarter and one-half of the college graduate labour force.2
In countries where graduates are guaranteed an employment, there is no open unemployment , but underemployment is a c o m m o n p h e n o m e n o n , particularly of the invisible type. This is to be found in most of the Socialist countries. Underemployment , in the form of misappropriate placement of graduates, is also c o m m o n to the developing countries.
In addition to the different types of unemployment , one can m a k e an important distinction between two different aspects of unemployment: incidence and duration. U n e m p l o y m e n t incidence is the percentage of unemployed in a given population group. It is the 'unemployment rate'. O n the other hand, unemployment duration has a calendar time attached to it. It usually takes the form of 'absorption rates x years after graduation', or simply, m e a n years or months unemployed since graduation. Research carried out at the International Institute for Educational Planning ( H E P ) of Unesco and other research studies demonstrate s o m e relationship between unemployment incidence and the level of education. In m a n y cases, the relationship takes the form of an inverted U-shape, meaning that it is the graduates of the middle-level education w h o are most hit by the unemployment problem.3 H o w e v e r , there are exceptional cases. For
B . C . Sanyal, W . S . Perfecto, A . Árcelo, Higher education and the labour market in the Philippines, Wiley Eastern and Unesco Press, N e w Delhi, 1981.
J. Berg, M . Freedman, 'The American workplace: illusions and realities' in: Change, N e w York, 1977, pp.24-30.
2

Introduction
example, in Italy in 1978, unemployment rates of those aged below 30 were positively related to education, with the rate for graduates from secondary or higher education about two and a half times greater than those having less than an intermediate school certificate. O n the other hand, in the U S A in the same year, the unemployment rate of 16-24 year olds not enrolled in school was 6.3 a m o n g university graduates, but 18.6 per cent for high school dropouts. Similar is the case of Kenya and of Colombia.4
T h e inverse relation between unemployment and educational attainment supports the theory of labour queue, according to which education is a critical background characteristic used by employers in ranking potential workers on the basis of their training costs. Behind the increased social demand for higher education there is also this reasoning.
In respect of duration of graduate unemployment, it appears that it is a sharply declining function of age, i.e. it is principally a youth problem, nearly every graduate finding a job after some time.
Education/employment relationship
T h e above description of the problem of graduate unemployment leads us to think that there is a relationship between higher education and graduate unemployment which could be looked into within the global framework of the relationship between education and employment. This relationship has recently attracted the attention of researchers in the field of both education and economics. A s is to be expected, they differ in their points of view.
O n e view is that education provides people with skills to develop and manage the economy and the related services, and, therefore, investment in education is supposed to be an investment in h u m a n capital, implying investment in the productive capacity of the people. This is k n o w n as the h u m a n capital theory. T h e second view is that education not only provides skills for performing different vocational tasks, it also demonstrates social values in promoting upward mobility in the society, and that education acts as a screening device to select the ablest people for the best jobs. A third view is that productivity is an attribute of a job and not of a person. People are matched to jobs by criteria which m a y be associated to education, but education is not a determinant of productivity. This phenomenon
3 G . Psacharopoulos, Returns to education: an international comparison Elsevier, Amsterdam, 1973. B . C . Sanyal, G . Psacharopoulos, Higher education and employment: the HEP experience in five less-developed countries, Unesco, H E P , Fundamentals of Educational Planning Series No.32, Paris, 1981.
4 M . Blaug, Education and the employment problem in developing countries, ILO, Geneva, 1973.
3

From college to work: the case of the Sudan
has been labelled the labour market segmentation theory. T h e fourth view, which is related to the third, is that the idea of correspondence between education and employment is an illusion existing only in the minds of graduates and has little to do with the performance in active life. T h e usual practice of recruiting graduates for certain jobs according to certain educational qualifications leads new job-seekers to believe that they are entitled to such types of jobs.
The above four points of view in respect of graduate education and employment m a y in fact be grouped into two categories. T h e first two points of view accept the idea of education's contribution to the social and economic development of people. The latter two points of view raise doubts on the role of education in such development. It would be worthwhile to note that expansion in higher education in both industrialized and developing countries in the sixties was mostly supported by the first two points of view. It has only been in recent years that the role of the employment sector, and that of the employers in manipulating the labour market, has been recognized, especially in the industrialized countries. However, empirical evidence to support the segmentation theory and the illusion of correspondence between education and employment is not yet sufficient to ignore the role of education in social and economic development, particularly for the developing world.
In most of the developing countries, the economy was essentially a subsistence agrarian economy before the advent of the western commercial and industrial civilization. T h e primary task of the community was to produce food, the most important basic need. All ancillary crafts and occupations supported this primary function. All kinds of services necessary for subsistence were provided by different social groups. The socialization of the individual, his training in a given skill and in the value system of the society, were all indivisible elements of a single learning system. The family, the workplace, the formal centres of learning, and the religious institutions, all imparted education on h o w to live, work and follow the rules of the society into which an individual was born. The social leaders, the elders, expert craftsmen and religious teachers set the standards and provided the learning. The world of work could hardly be separated from the world of education.
Even during the period w h e n m a n y of the developing countries were under colonial domination, the same system prevailed in most of these countries, particularly in the rural areas where most people lived and which remained unaffected by the western civilization brought by the foreign rulers. However, in the urban areas and in the tiny modern sector of the economy, namely the government and commercial sector, the colonial rulers needed local manpower at the subordinate level, w h o m they trained in institutions set up according to their o w n needs. T h e formal education system which was producing these cadres was elitest, and generally the language of instruction was that of the foreign colonial rulers. Higher
4

Introduction
education was restricted in quantity and type to meet the needs of these rulers.
At the same time, the modern organized sector started recognizing the completion of an educational programme as a requirement for employment, graded, perhaps arbitrarily as mentioned above, according to the type and duration of studies. Education and employment n o w had a correspondence, but the inherent linkage was lost; the world of education became separate from the world of work.
At independence, m a n y of the developing countries had to expand their educational systems. The developmental efforts and departure of expatriates holding high-level decision-making positions created heavy demand for higher education in quantitative terms. With demand exceeding supply and attention focussed on those types of higher education where graduates were in short supply, little thought was given to unemployment. T h e distribution of income and employment were implicitly thought to be problems that would be solved by rapid economic expansion and by the upward mobility of the poor through increased educational opportunities. At that time also, industrial development was favoured over agricultural development because agriculture appeared to be able to survive with unskilled labour, and because the planners and politicians thought that only dynamic industrial growth could absorb the masses of underemployed and lead the economy into 'take-off. It was also believed that this would sustain economic growth, increase consumption and improve the overall economic condition of the people.
Economists were quick to argue that investment in h u m a n resources was a powerful factor for economic growth. The rates of return for such investment, although calculated very approximately and sometimes arbitrarily, showed that in terms of productivity the rate of return on educational expenditures was as high as, if not higher than, the investments elsewhere. Thus, more and more m o n e y was invested in education, with the institutions of higher education having a large share, a share justified by salary differentials, which in turn were legitimized by educational differentials. In addition to economic reasons, social and political factors were also responsible for expansion of higher education.
Causes of graduate unemployment
T h e most dominant cause for graduate unemployment is, of course, the stagnation in economic growth. The overall average annual growth rate of gross domestic product in the industrial market economies and middle income countries has decreased during the period 1970-79 at 3.2 per cent and 5.5 per cent respectively from 5.1 per cent and 6.1 per cent during the period 1960-70. A m o n g the low income countries, except for China and India, the growth rate has decreased from 4.3 per cent during the period 1960-70 to 3.8 per cent during the period 1970-79 (World Bank 1981).
5

From college to work:ihe case of the Sudan
Slower economic growth in the face of a faster growth in supply of graduates from the institutions of higher education around the world is at the heart of the problem. But the growth model adopted by different countries favouring m o r e capital investment than labour investment also has to take responsibility for the unemployment problem.
In free market economies, if salaries were fixed based on d e m a n d and supply of graduates, the larger output of graduates would have reduced the salary structure for graduates thus redressing the d e m a n d for higher education. But, w e have seen in Section 1 above that in developing countries until n o w all graduates end up with s o m e kind of employment even if after waiting for sometime, and a university graduate has a higher probability of employment than a non-graduate. Since most of the graduates in developing countries are employed by the public sector, and since the public sector salary structure cannot be adjusted quickly to follow the law of demand and supply, a longer waiting period does not reduce the private rate of return to higher education in the long run.5 So the d e m a n d for higher education continues. In contrast, in the U S A the real salaries of new graduates have fallen dramatically during the period 1969-75.6 There is, as a result, a downward trend in participation in college education in the U S A , particularly for employment purposes.
T h e situation in Europe is slightly different, where one reason for unemployment is cited as the high and rising wage cost. This is revealed in the steadily increasing capital labour ratios. As real wages have risen relative to the value of output, there has been a depressing effect on profits and this decline in profitability has led to stagnating investment and job creation. However, there is a difference of opinion in this respect. S o m e researchers are of the opinion that 'substitution of capital for labour takes place because of factor prices and that given a certain technology, labour and capital are largely complementary, especially in large-scale industries with a high technology content. A s a consequence, unemployment is more likely to be caused by deficiencies in the process of capital accumulation—i.e. lagging investments.7
Another reason the for increasing graduate unemployment is the increased labour force participation rate a m o n g graduates. This is true mainly for the female population. In developing countries, until recently.the participation rate of female graduates in the labour force had
5 M . Blaug, P . R . G . Layard, M . Woodhall, The causes of graduate unemployment in India. Allen Lane, London, 1969.
6 R . B . Freeman, The over-educated American, Academic Press Inc., N e w York, 1976.
7 J.P. Jallade, Employment and unemployment in Europe, Trentham Books, Staffordshire, 1981.
6

Introduction
remained remarkably low because of attitudes, traditions and social customs. Participation rate by sex is also increasing in favour of females at a high rate in the industrialized countries, with m a n y w o m e n having a graduate-level education. The effect of overall labour force participation rate on graduate unemployment is going to reduce in the near future because of falling birth rates, although this decrease is expected to be offset by increased participation of female graduates in the labour force.
Lack of interaction between employers and institutions of higher education is another reason for graduate unemployment cited by a large proportion of graduates in some developing countries. Also, lack of proper information about where the jobs are and h o w to get them is cited as another reason. At a more aggregate level, lack of information on manpower needs for the developmental efforts is a more or less universal phenomenon. In spite of the defects in respect of accuracy of m a n p o w e r forecasts, it is believed that these forecasts can provide some broad direction as to the development that higher education should take. Educated unemployment is also due to a mismatch between aspirations and opportunities. The examination results which provide terminal qualifications do not have any correspondence with the needs of the world of work. However, these terminal qualifications raise the job aspirations of those holding them, but do not help in obtaining productive employment.
Finally, the employers' preference for non-graduates is another cause of graduate unemployment. If the job conditions permit, employers prefer to employ someone with a lower academic qualification and train him on the job.
The problem of education and employment in the Sudan
The problem of education and employment in the Sudan follows more or less the same pattern as in many other developing countries. In the Sudan higher education is expanding faster than secondary education, which is expanding faster than primary education. The participation rate of w o m e n in both education and the world of work is also increasing. The m a n p o w e r situation is characterized, on the one hand, by a surplus of arts-based graduates in the labour market and on the other, by a shortage of professional and technical graduates. As will be seen later, the professional technician ratio is m u c h higher in the labour force than normally observed in other developing or developed countries. T h e unemployment problem is also acute for certain kinds of science-based graduates, namely, agricultural graduates and chemical engineering graduates. In determining the supply of qualified manpower , the country can only play a limited role. M o r e than half of the students in the Sudan follow mainly arts-based courses at a university not yet under the control of the national authorities. The number of students studying abroad are also, to a large extent,free to
7

From college to work: the case of the Sudan
choose their subjects of study which do not always conform to the needs of the country. Experienced professionals and the most qualified graduates are attracted towards the neighbouring high-wage countries. Although to some extent the emigration of highly educated people helps the country's balance of payment situation through remittances, loss of m u c h needed skilled workers, technicians and professionals create bottlenecks for economic development. It is observed that the experienced and the better qualified constitute a significant proportion of the emigrants. Statistics on such emigration are difficult to collect, but Table I would give an idea of the migrants, their exit status, and their occupational status at the time they left the country. S o m e of these migrants leave with permits, others travelling on pilgrimage or tourism take the opportunity of not coming back.
Table 1: Migrants: Exit status and professions 1976/77-1979/80 (in percentages)
Managerial Professional and technical Administrative and clerical Skilled Unskilled
Total
1976/77
0.8
8.4
11.0 44.6 35.3
100.0
Left without Left with Permit Permit
1977/88 1978/79 1979/80( + ) 1976/77-1977/78
0.5
6.6
3.0 55.9 34.0
100.0
0.6
11.2
2.4
40.6
45.2
100.0
0.8
15.1
4.1 69.1 10.9
100.0
3.6
20.3
14.1
61.1
100.0
Note: ( + ) relates to period July 1979-April 1980. Source: Labour Department
There is also another aspect of the education-employment relationship in the Sudan. T h e guaranteed employment scheme was introduced in 1966 for all graduates of post-secondary institutions in the Sudan. It was subsequently revised in 1974 to exclude graduates in arts and humanities and to cover only professional and technical graduates. This scheme has encouraged students to follow academic programmes in secondary schools, these being the channels for entry into professional courses in the post-secondary institutions including the universities. The prestigious professional third-level courses are not easily accessible to technical secondary graduates.
8

Introduction
This factor then becomes responsible for increased demand for places in academic secondary schools.
Again, the wage structure is rigidly related to paper qualifications, especially in the public sector which employs most of the skilled manpower . T h e higher the level of the certificate, the better the pay scales and career prospects. Skills acquired at the technical institutes or secondary technical schools are not rewarded according to the need for such skills. The average monthly m i n i m u m salary for a subprofessional is hardly any higher than that of a clerk. This, it is thought, reduces the d e m a n d for technical education in the country. O n the other hand, the liberal arts graduates earn according to the level of their certificates as soon as they are employed. This strong association of the salary structure with academic degrees has influenced the attitudes and expectations of both the students and their parents because private rate of return, even to liberal arts education, is very high. It is definitely higher in other forms of higher education as well as academic secondary education. It is considered that this also contributes to the increased demand for academic secondary and higher education, although the economy cannot absorb so many liberal arts graduates. This results in a longer waiting period to obtain a job for this type of graduate, and in increased 'mismatch' between expectations and realities.
It is also believed that the highly centralized wage policy does not allow for relating wages and salaries to productivity or economic growth. This is particularly true for public sector corporations which cannot adjust their salary structure in accordance with economic needs for skills or individual initiatives without referring to the Ministry of Public Service and Administrative Reform. The fact that the government intends to provide employment to all graduate applicants means that relating employment with educational types and levels becomes a complex and challenging task.
The problem of relating the development of higher education with the employment needs of the country has been one of the major concerns of the decision-makers in the Sudan. T h e International Labour Office undertook a study on the global issues relating to employment,8 in which the role of education was dealt with from a general point of view. The importance of the relationship between higher education and employment was also the subject of a joint study undertaken by the International Institute for Educational Planning and the National Council for Research of the Sudan.9
in the early seventies. T h e following section gives the principal findings of that study and the recommendations m a d e .
8 ILO, Growth, employment and equity: the case of the Sudan, Geneva, 1976.
9 B . C . Sanyal and El-Sammani A Yacoub, Higher education and employment in the Sudan, H E P , Paris, 1975.
9

From college to work: the case of the Sudan
Principal findings a n d r e c o m m e n d a t i o n s of the earlier study
The principal findings of the study:
(a) During the sixties, education in the Sudan experienced unprecedented growth. Enrolment in primary schools increased at an annual average rate of 10.8 per cent, in intermediate and junior secondary schools at 11.1 per cent, and in higher secondary schools at 12 per cent. The overall government education budget increased at an annual rate of 12.4 per cent at current prices. Adjusted for price increase, the increase in the budget had been m u c h less than the increase in enrolment. Even with this rapid expansion, only 42.3 per cent of seven-year-olds had been admitted to the first grade of primary schools.
(b) Only one out of five children of primary school-going age in rural areas went to school, as against two out of three children in the urban areas. At the junior secondary level only 2.6 per cent of rural children went to school as against 41.8 per cent of urban children. Higher secondary education in the Sudan was only available in urban areas. Disparity among the provinces in respect of educational opportunities is markedly significant; enrolment ratio at primary level varied from 62.8 per cent to 4.5 per cent, at junior secondary level from 28.3 to 0.8 per cent, and at the higher secondary level from 20.9 to 0.2 per cent. T h e degree of participation between m e n and w o m e n was also significantly different. At the primary level, the male/female ratio was 2:1, at junior secondary level, it was 3:1, and at higher secondary level 4:1.
(c) Opportunities for vocational training before the higher secondary level were very limited. There were only two such schools and these were not fully utilized.
(d) Enrolment in higher education had increased at an annual average rate of 12 per cent during the period 1968-79, with varying rates for different institutions. S o m e of them had in fact diminished in size. The ratio between arts-based and science-based students was decreasing because of the actions taken by the University of Khartoum in its own admission policy, emphasizing more science-based intake, and by the government towards the admission policy for the Sudanese to the University of Cairo (Khartoum branch), by restricting the intake. T h e expansion in higher education had not taken account of the employability of the graduates, especially in arts-based fields. The slow rate of growth of the economy, accompa-
10

Introduction
nied by decreasing gross domestic fixed capital formation and low level of saving and fast rate of growth of the graduates, especially in the arts-based fields, were the main reasons for unemployment of graduates. The establishment of the Unemployment Relief Fund for unemployed graduates had created social and administrative problems in addition to increasing the burden on the already strained government treasury.
In addition to the problem of employment of graduates, the country had also faced several other problems during this fast expansion in higher education, as follows:
(i) All but one of the institutions of higher education had been located in the three adjacent towns of Khartoum North and O m d u r m a n , leaving the remainder of this vast country without any facilities for higher education.
(ii) Disparity a m o n g provinces in respect of higher education had increased enormously. In the case of higher education, participation from the Northern province was at the highest rate followed by Khartoum province and Blue Nile. A s in the lower levels of education, Bahr-el-Gazal and Upper Nile in the Southern region had the lowest rate of participation in higher education. Equatoria, another province in the South, had a higher rate of participation than Red Sea and Darfur, the two provinces in the north.
(iii) Opportunities for w o m e n to pursue higher education had not increased at the same rate as for male students. In 1973/79 the Sudan had a female student population of about 12 per cent only of the total student population in the institutions of higher education.
(iv) The distribution of admission between science-based professional and subprofessional fields had been unbalanced, especially in the fields of health and agriculture. F r o m 1956 until 1973, there were 752 medical and pharmacy degree-holders as against only 569 diploma-holders. There was less than one technical assistant (e.g. nurse and/or public health officer) to one professional. This had resulted in inefficient utilization of very scarce and costly manpower . In the case of agriculture, the situation was the same. U p until 1973, there were 788 agricultural professional degree-holders (agriculture and veterinary science), as against 858 agricultural diploma-holders (agriculture and forestry). T h e rapid expansion of technical education had resulted in inconsistencies on the qualitative
11

to work: the case of the Sudan
side. The employers were not satisfied with the job performance of the technicians. Criticism had been levelled against the 'bookish' type of training they received.
The development of higher education had not taken into consideration the importance of post-graduate studies in the universities. T h e University of Khartoum, the only fully-fledged national university, had on the rolls in 1973/74 only 304 post-graduate students out of a total of 6,663, i.e. only 4.6 per cent. Most of them were in the humanistic fields.
A large part of Sudanese education was under foreign control, as reflected in the number of students w h o went abroad for training (4,841 in 1973/74) and the number of Sudanese students at the University of Cairo (Khartoum branch), controlled by the Senate of the University of Cairo in Egypt. The advantages of training abroad lay in the little visible cost to the government, and broadness of outlook and dynamoism amongst those graduates w h o returned. But disadvantages were also quite significant and were reflected in the problem of relevance of the studies to Sudanese needs, lack of available facilities in the country similar to those abroad, and the problem of social adjustment of the returnees. The problem of non-return did not exist for those w h o were sent abroad by the government. Statistics on loss due to non-return of those w h o went abroad at their o w n expense were not available.
The location of all the institutions of higher education in the Sudan in three adjacent towns had obliged the government to provide boarding facilities for most of the students. Higher education in the Sudan being virtually free, cost per student to the government was extremely high. This did not apply to the students of the University of Cairo, which was entirely financed by the Arab Republic of Egypt. T h e disintegration of the Khartoum Polytechnic into several small institutes had increased the cost per student. Each Forest Rangers' College student cost m o r e than four University of Khartoum students. The School of Hygiene cost more per student than the faculty of medicine of the University of Khartoum, which cost per student the same as the Khartoum Nursing College. S o m e of these institutes turned out graduates w h o were badly needed for the social and economic development of the country and expansion of these institutes could reduce cost per student. Provision of boarding facilities could also be controlled to reduce the burden on the treasury.

Introduction
(viii) Organized sources of career guidance were very few in the Sudan, which had led to a substantial proportion of students pursuing higher education without being aware of the career possibilities. Parents, friends and relations were the main source of such information and guidance, and the institutions of post-secondary education played a very insignificant role. Lack of career information was more c o m m o n amongst children of peasants and unskilled labourers, and those belonging to the provinces of the south. Medical science was the most preferred profession a m o n g the students, followed by engineering (although the private rate -of return was lower for this field than for some others). There was a good correspondence between the profession of the parent and the expected profession of the student. Female students tended to prefer social science, health science and teaching.
(ix) About one in five students were not satisfied with their current field of studies and two in five considered that the secondary school curriculum was inadequate for higher studies. This inadequacy was expressed mostly by students from Kassala, Kordofan, Darfur and Bahr-el-Gazal.
It was possible that between 60 and 80 per cent of higher secondary graduates could find places in the country's institutions of higher education, depending upon the alternative chosen for the admission policy of the higher education system.
Since there was a surplus of arts-based graduates and a general shortage of science-based graduates in the labour market, it was necessary that intake to arts-based courses be reduced and intake to science-based courses increased. A n analysis of the implications of several alternative intake policies based on alternative assumptions showed that it would be possible to reduce the ratio in output of arts-based and science-based graduates from 60:40 to 40:60 by 1980 if the low alternative for all arts-based intake (with the high alternative only for secretarial studies a m o n g the arts-based intake) and the high alternative for science-based intake were accepted and followed.
Under the then prevailing circumstances, the ratio between sub-professional and professional output could not be improved before 1980. Only serious efforts to establish n e w institutes for sub-professionals, accompanied by a changed salary structure and prospects, could change the situation. If such attempts were not m a d e , the country could continue to face structural imbalance a m o n g the scientifically qualified m a n p o w e r .
13

From college to work: the case of the Sudan
(g) It could be possible to increase the output of science-based graduates to a m a x i m u m limit of 12.4 per cent per year between 1974 and 1980, and to decrease the output of arts-based graduates to a m a x i m u m limit of 7.1 per cent per year during the same period.
(h) About two-thirds of the students indicated that they wanted to pursue higher education because of the need for higher degrees for career reasons. About one-fifth of all the students, but about half of the female students, responded that they had pursued higher education for the sake of further study only. This might be one of the reasons for the low participation of w o m e n graduates in the labour force at that time.
(i) The most important source of information on employment opportunities for the employed graduates had been the Department of Labour. Personal contacts did play a role in obtaining employment in the opinion of the employed graduates, although the employers did not agree. The institutions of higher education played an important role in finding employment for graduates in the agricultural and engineering fields.
(j) The graduates with specialization in agriculture, engineering and natural science obtained employment quickly, but those specializing in law had to wait the longest period of time.
(k) There was very little substitution between specialization and profession a m o n g the graduates in engineering, natural science, medicine, law, education, teacher training and commerce. Substitution ratio varied from zero in the case of law and medicine to 1:6 for natural science. This ratio was high in the case of graduates in humanities and arts. O n e out of three went to non-liberal professions.
(1) The main problem that the employers faced in appointing an employee was the lack of coherence between the curriculum of the educational institution and the employers' needs. T h e situation was worsened by the fact that there was divergence between the training that the graduates actually had and what they were supposed to have. Moreover, the graduates w h o did well in their academic life were not necessarily as successful in their professional life. Only 37.25 per cent of the employers were of the opinion that there was a high correspondence between the educational performance and the job performance of employed graduates. About 50 per cent of the employers considered that only a moderate correspondence existed between these two aspects.
14

Introduction
(m) Even though good performance in academic life did not ensure good performance, the most important criterion of recruitment was—the academic record of the candidates seeking the job, which about 75 per cent of the employers considered as very important. The next important criterion was the performance of candidates w h e n interviewed, with about 51 per cent of the employers emphasizing the importance of the interview when selecting employees. Aptitude tests and past experience in similar jobs were also important factors, but letters of recommendation and physical appearance were not very significant as criteria for recruitment.
(n) As far as the media of recruitment were concerned, the employers depended mainly on the labour department, the institutes and authorities, and 'newspaper advertisements', the first being considered as the most important.
(o) In order to minimize the gap between the employers' needs and the nature of the training offered by the higher education institutions, most of the employers were willing to actively assist the institutes in developing curricula, suggesting methods of instruction, evaluating training programmes and developing research projects related to the employers' needs.
T o be realistic however, one must admit that the higher educational institutes can hardly cater for all the special and characteristic requirements of all the industrial and commercial firms and concerns. T h e employers must therefore send their employees to specialized training courses to enable them to acquire the ' k n o w - h o w ' necessary for their respective firms. Nevertheless, the higher educational institutions could organize some broad-spectrum special courses for industry/business, etc., to meet the general requirements of the labour market. About half of the employers surveyed were willing to have such special courses in the higher educational institutions.
About 60 per cent of the employers had in-service training facilities for their employees. The majority of the employers w h o did not have some training programmes would have liked to have these in order to upgrade their personnel and to meet the special requirements of their firms. The employers felt that the higher educational institutes should become more concerned about their requirements and should develop training courses to prepare the students for the needs of the labour market. T h e employers were ready to advance their co-operation in various respects, for example by sending personnel on training courses, participating in teaching programmes and by offering expert opinions as members of curriculum committees.
15

From college to work: the case of the Sudan
The principal recommendations of the study:
The recommendations that followed from the above findings included corrective measures within the system as well as broad institutional measures, and these are given below.
T h e purpose of the earlier study was not only diagnostic but prescriptive in the sense that measures to remedy the existing inconsistencies were suggested. Alternative strategies for admission policy relevant to the employment possibilities of the graduates of the higher education system in the Sudan were formulated. These strategies were only suggestions and not definitive, since nothing was certain about the future. The alternatives were formulated in view of the uncertainties about future manpower needs and the absence of a national m a n p o w e r plan. Development of higher education could not ignore the employability of graduates. This called for an effective m a n p o w e r element in future national planning. Expansion of the intake to higher education was to be undertaken by quota according to detailed projections of need which were to be continually monitored and updated.
W e had analyzed the factors that determined the students' choice of an educational career. In order to m a k e any m a n p o w e r plan successful these factors could not be ignored. In the orientation of students towards the fields of specialization, the importance of career guidance could hardly be over-emphasized— especially in the Sudan where most students chose their specialization by themselves and where very few students received any worthwhile career information. It was recommended that the reward system in respect of salary and career prospects for graduates of technical and higher education be substantially revised in line with the labour market forces of demand and supply, so that the flow of students would be influenced by economic criteria.
In any development process, regional disparities and disparities a m o n g social classes should be considered as undesirable factors. T h e admission policy of the higher education system had to be geared to a balanced distribution a m o n g different social and regional groups, even if it slowed d o w n the process of development, otherwise too few people would enjoy too m a n y benefits at the cost of too m a n y , resulting in the long run in disastrous discontent.
H o w could such a strategy be implemented? T h e study attempted to develop a methodology by which inconsistencies could be identified and controlled. But could this methodology be applied? N o strategy existed in a vacuum; shared aims, rational preparation and willpower are essential to the implementation of any educational policy which has a tangible shape, existing at several levels and adjusted to fit the peculiar circumstances and responsibilities of each level and place. Strategies and goals vary from individual to individual, region to region, and from institution to institution. But if they are to be mutually reinforcing, they must have a c o m m o n
16

Introduction
approach to diagnostic acts, must be founded in a broad consensus which would cover diverse interests, and enjoy the loyalty of the leaders of different groups. There are two indispensable features which any higher educational policy must have: firstly, it should focus on the relationship of factors and seek improved interaction between the authorities of higher education institutions and those directly affected by their action. This needs a systems approach which facilitates continuous monitoring, feedback and control of the implementation of the policy. T h e second feature is to look for n e w ideas and methods to solve emerging problems, not on a piecemeal basis but on an overall basis. In an effort to implement such an educational strategy in the Sudan, the following suggestions were m a d e in respect of the institutional set-up:
(i) The manpower planning unit
It was suggested that this unit of the Department of Labour should analyze the needs of the different sectors of the economy in quantitative terms, establish the quota by different specializations for a future target date, monitor any quantitative mismatch and communicate this to the National Council for Higher Education. This unit should also be entrusted to assist employers with tools for job descriptions and criteria for recruitment best suited to their interests; ways and means to encourage graduates to accept jobs in outlying areas should be found. T h e implications of staff rules for participation in employment of different social classes have to be analyzed and implemented. W a y s to promote job opportunities in outlying regions had also to be identified.
(ii) Establishment of an institutional research unit
T h e objective would be the assessment of the qualitative mismatch of the higher education system by means of periodical surveys in conjunction with the m a n p o w e r planning unit and the communication of the results to the different institutions. This unit would also analyze the cost efficiency of different institutions and recommend measures to reduce cost without impairing the efficiency of the system. It was considered essential that expansion in higher education be geared to m a n p o w e r needs.
Another task of this unit would be to study the regional projects for development in collaboration with various ministries and the Planning Commission, and to develop programmes for training to supply the needs of such projects. Regional disparities and their causes were to be analyzed and ways of minimizing them should be suggested to the different ministries. Disparities in the distribution of higher education a m o n g the different social classes and the causes should also be identified and remedies suggested. This unit, which it was suggested should be part of the National Council for Higher Education, would transmit to different institutions the quotas for admission to different specializations.
17

From college to work: the case of the Sudan
Analysis of internal efficiency with the analysis of repetition, dropout and failure should be earned out by this unit and possible means of reducing wastage should be found.
Brochures explaining the career prospects for different fields of studies should be brought out each year and circulated to secondary school students.
The relevance of scholarships should be analyzed, keeping in view the skills needed urgently for the country, and the system of the boarding facilities should be analyzed for each institution and for different types of students.
Areas in which training facilities were lacking in the country, but which were necessary for its development should be identified. T h e relevance of the training offered by the institutions of higher education should be assessed from time to time through surveys and the results transmitted to the institutions for adjustment. T h e relevance of training abroad also required examination for different specialities.
The scientific and technical potential of the country should be up-dated every year in collaboration with the M a n p o w e r Planning Unit.
In the long run, a system might be developed in which all the graduates of the institutions of higher education could be followed up during their'occupational career to identify the factors responsible for a particular career profile. The Scientific and Technical Potential Survey results could be taken as a starting point for such follow-up.
(Hi) Establishment of an employment committee in each institution
Each institution should have a committee to assist the M a n p o w e r Planning Unit of the Department of Labour in finding employment for the graduates. This unit would be the link between the institutions and the National Council for Higher Education in respect of the activities related to the labour market. It would also organize practical job experience for students during vacation or during the regular course of study as a part of the training programme to provide the students with better knowledge about prospective employment. Regular contact should be established between institutions and employers through this committee.
(iv) Establishment of an education-employment information system
The units proposed are the basic components of an education-employment information system, with each unit supplying information to the institutional research unit, which in turn would analyze the consequences of different strategies or assess the performance of a particular component in the higher education system to be used to control the operation of that system in order to achieve desired targets. T h e needs of the labour market in both quantitative and qualitative terms, the results of the periodical
18

Introduction
assessment of the operation of the higher education sector and the labour market through attitude surveys would be the basic tools for continuous monitoring and adjustment of the higher education system.
Finally, all this information could be computerized to avoid complexity of the work and ensure the rapidity of the analysis. This analysis would be the basis for planning the development of higher education in the Sudan—a system of higher education which would be oriented towards the needs of the society, distributed equally a m o n g different regions and social classes— a system flexible enough to cater for emerging needs.
(v) The role of nonformal education to meet emerging needs
There was considerable concern in the Sudan that higher education should be oriented to economic development. With internal problems mostly under control and external aid flowing in, the economy of the Sudan would probably quite soon need skills of varied types in large numbers. The formal education system could not perhaps adapt rapidly enough to these changing needs. This draws attention to the importance of the nonformal education system parallel to the formal education system in the contribution to economic development. The Sudan is however not inexperienced in this field. T h e Sudan Gezira Board had already a well-established nonformal system of training for its employees. Such training programmes were to be extended to the economic activities where they were most needed. The formal education system would have to co-operate with and be prepared to contribute to and receive assistance from these units. A better co-ordination of the formal and nonformal educational units would m a k e the system of higher education in the Sudan more successful in achieving its goals.
Implementation of the recommendations of the earlier study:
The extent to which the recommendations of our earlier study have been implemented, is given below.
The study was the output of a research activity with an academic emphasis. It was not a government-sponsored, policy-oriented report. Its main objective was to sensitize the decision-makers on the problems of education and employment in the Sudan and the ways to tackle these problems. The H E P was interested in finding out to what extent the results of the study had been useful in decision-making for higher education. A senior official not involved in the earlier study was asked to prepare a brief report on the impact of the study on planning and decision-making. This paper written in November 1978, four years after the study was published,
19

From college to work: the case of the Sudan
gives a detailed report on the subject.10 and is summarized below:
(a) A Higher Education Reform Act was introduced in N o v e m b e r 1975, defining the aims and objectives of higher education. T h e National Council for Higher Education was given the responsibility of supervising the planning and co-ordination of the general policy of higher education, of drawing up plans and programmes and of defining the role of each institution of higher education in executing these plans and programmes. It was also to decide on the admission policy and standards of various higher education institutions. Based on the recommendations of the H E P study, a n u m b e r of institutions have been established in different regions and provinces of the Sudan with the objective of reducing disparity and regional imbalance in higher education. T h e programmes of these institutions have been formulated insofar as possible with a view to developing local resource potential.
(b) T h e University of Khartoum has increased its science-based intake. B y 1976/77 two out of three students will be enrolled in science courses. T h e University of Cairo (Khartoum branch), however, has continued to expand with the opening of a science section although small. A public sector recruitment board was established in 1974 to deal with placement of graduates as a part of the proposed 'information system'.
(c) T h e Ministry of Planning has incorporated in the national employment plan a separate sector of m a n p o w e r needs by different level and type of training. T h e admission policy has been centralized at the University of Khartoum for all institutions of higher education under Sudanese control, excluding the University of Cairo (Khartoum branch). Studies and surveys on utilization of m a n p o w e r and the overall m a n p o w e r situation are being undertaken by the Ministry of Planning." Similar research is also being carried out at the University of Khartoum and the Institute of Afro-Asian Studies.
(d) T h e fragmented institutes of technical studies have been integrated in one Polytechnic with different departments, in order to reduce unit cost and achieve economy of scale. However , the N . C . H . E . has not as yet taken any direct action to improve career information for
10 L H . Mallasi, Higher education and employment: the case of Sudan IIEP/S51/14A, November 1978. (mimeo.)
11 See for example the works by A h m e d Salim A h m e d and M o h a m e d El-Murtada Mustafa published in Labour and Society, ILO, Geneva 1980.
20

Introduction
students, nor has there been any special emphasis on articulating nonformal education. However, the Ministry of Planning has conducted studies to identify the employers' attitudes towards nonformal education. The N . C . H . E . has been doing studies on the internal efficiency of the system, especially on the problem of wastage, costs and financing of higher education, etc.
As a part of such interest in improving the usefulness of higher education for the development needs of the individuals and the society as a whole, the N . C . H . E . has been concerned with the phenomenon of transition of individuals from college to work.
T h e present study
The present study is the result of the interest mentioned above. Higher education in the Sudan has undergone changes during the
seventies, as has the economic and social set-up of the country, and especially the labour market. Given the problems of relating education and employment described above, it was suggested that a follow-up study be undertaken to re-examine the following issues:
(a) T h e development of higher education in quantitative terms, with special emphasis on growth by disciplines, region, and sex.
(b) The educational context preparing for higher education, namely the mechanism available to the final-year secondary students to prepare them for higher education, and its adequacy; the distribution of final-year students by discipline, region and sex, their expectations about higher education.
(c) T h e functioning of the system óf higher education with special reference to the choice of field of study, and match between expectations and reality in respect of such choice, adequacy of the secondary education as a preparation for higher education, reasons for pursuit of higher education, mobility within the system of higher education, alternative structures of higher education to respond to the job needs, expected occupational career factors that could encourage people to work in rural areas, and factors of job satisfaction.
(d) T h e functioning of the labour market with special reference to the selection criteria for graduate workers, methods of recruitment, and to provide broad directions for higher education to take in order to m a k e the transition of individuals from college to work smoother.
21

From college to work: the case of the Sudan
M a p 1. Sudan : Political divisions
Í EL FASHER
CENTRAL AFRICAN REPUBLIC
V WESTERN EQUATORIA ,' EASTERN EQUATORIA •"•»
^ \ YAMBIO / ' • inn« - A .
\ a> Provincial Capitals
_ _ _ _ Provincial Boundaries
^ ^ - ^ ^ Regional Boundaries
^ * ^ a International Boundaries
• U G A N D A
100 200 300 400
KILOMETERS
A x
A N
22

Introduction
Methodology adopted to examine the above issues
T o examine the first issue, a diagnostic analysis of the higher education system has been undertaken using available data on the system. Linkage has been established with lower levels of education as m u c h as possible. T o analyze the past trend of development, c o m p o u n d growth rates have been used as the indicator for different types and levels of education. The fields of studies in higher education have been broadly categorized as arts-based and science-based. They have been further sub-divided into specialized fields, such as humanities and arts, social sciences, natural sciences, engineering and technology, agriculture and veterinary science, health, law, commerce and business, and education and teacher training. For the analysis of distribution by region, broad categories were North and South, which have been further sub-divided into the eighteen provinces of the Sudan (see Map 1). Indicators such as coefficient of variation and Gini coefficients have been used to measure disparity. The cost of higher education has also been analyzed following the unit-cost method.
For the second, third and fourth issues, published data were not available, and questionnaires were used to collect the data. Students, graduates and employers of the graduates were selected to form the relevant population groups, whose attitudes, perceptions and expectations were measured to provide the elements for examining these issues. T h e details of the .conceptual framework providing the items of the questionnaires have been discussed in Chapter III. Each of the issues was examined globally for the respective population group. T h e analysis was further detailed by identifying suitable explanatory variables to explain a particular phenomenon. This identification was based on available knowledge and discussions with experts in the field, and covered such variables as: individual characteristics, family characteristics, community characteristics, parental education, occupation and income, early educational and occupational context of the individuals. In the case of institutions, namely the enterprises (the employers), the variables were: type of control, size, and major activity to indicate the industry. In respect of the student population, two groups were considered relevant for the study: the first relates to final-year secondary school students w h o are planning for the world of higher education or the world of work, and the second group were university students.
Strict representativity could not be maintained in the samples because of non-response. However, the large size of the samples, particularly for the students and graduates, could reduce the margin of error. Since the objective of the study was to provide broad directions for higher education in order to facilitate the transition from higher education to work, and to identify existing inconsistencies in broad terms, the results of the study, in spite of its limitations, could be useful.
In the presentation of the results, the surveys of the graduates and the employers have been reported separately dealing with each item of the
23

From college to work: the case of the Sudan
issues mentioned above. Analysis has been mainly carried out by using cross-tabulations. For certain phenomena, multivariate analysis has also been undertaken (namely, the analysis of the waiting period for obtaining a job and the earnings).
24

I. The economy and the education system
T h e economy of the Sudan has been going through a difficult period during the last few years for which statistics on the gross domestic product ( G D P ) are available, except for the year 1980/81 when there was a slight improvement. In constant 1978 prices, G D P (factor cost) had gone d o w n from S£2,577.3 million in 1977/78 to S£2,531.7 million in 1979/80. Most of this decrease was due to reduction in the contribution of the agricultural sector. Given the predominant role of agriculture in the Sudanese economy (nearly 40 per cent of the G D P ) , any change in the performance of this sector influences the overall economy. The reasons for this decline in agriculture are shortages of inputs available due to lack of foreign exchange, problema of transport, weak management on the irrigation schemes and inadequate producer prices. The manufacturing sector also underwent a decline from 1976/77 to 1978/79 (see Table 2).
Given the long-term nature of the reasons for the decline in the economy—one of which is the problem of h u m a n resources—rigorous planning of all scarce resources is necessary if the economy is to take a sharp, positive turn in the near future. The discovery of commercially exploitable crude oil in South Kordofan and Northern Bahr-el-Gazal has created some optimism that in the second part of the eighties more than half of the domestic petroleum needs will be met indigenously. At present, more than 40 per cent of the total export earnings are consumed for import of petroleum. T o explore, exploit and manage the natural resources that the Sudan possesses, it is imperative that the country be equipped with better skilled and motivated h u m a n resources, this is where the education system has its role to play; to what extent and in what manner it has responded to this challenge is the subject of discussion in the following sections.
25

co
lleg
e to
work
: th
e c
ase o
f the S
udan
o
00
ON
ON
as O
N
00
r~
¡-ï c-
ON
lOtÑ
tN'o
Ñe
Ño
OO
\N©
t«Í—
i »o
>o
n m
(<i t
rt
o
*
ON
ON
<n
—i •—
N
d*
qfN
r-^r-.x
qtN
Tj-,N
oi"
-;r-;
lOtN
tNeN
NO
Tf^
oO
oN
xO
oooo
rt^
(N|N
t^o
om
O
NO
N
CO
I-I t-H
eN
eN
•
*
i-
ii
nN
O-
Hi
nO
NO
iH
^N
rftN
i-í't
r^
oó
oó
oÑ
co
i-!
•^•T
T o ^
—
i co
tN r
- oo
OO
rtn-H
tN
tN
^
1
tN '
tN
i—i
00 •
in
T-l
r-; Vlf
; NO
O
fifin
g
tN
O
NO
CO 0
0
^
CO
W0
.-i
tN
CO i-c
C"; IO tN
00
oò tN
<ñ r~
oò c
ò
00
NO ^
O
N C*~ i—
«
tN
lo
r» --ï
tN
tN
NO q
co
NO io
q
>o O
N r-
NO
ON d
N
O i-i
t~- O
N eS O
tN
>
o
oo
-H
>o 212,
O 250.
O 287.
r-NO
t~
O
N
(NjN
too
oiifl(S
«N
tM;0
; r^
vií-irí^
od
i/ío
òw
i in
ko
i-*io
r-NlT
j-NO
ioco
O
NO
N cO
i-i—
ï i—
i(S^
ON 00
CO i-i
Tt 00 t~; I
O
r-Ñ d
r~ d
eÑ u-i
>o tN en O
oo oo
tN
Tf .-H
00
oo
tN
NO
r~
¡o
ON
«O
ON
en
r~
en
r»
ON
tNo
oT
ítNo
oq
^rN
ji-iON
N
oo
or~
oÑ
oÑ
do
ÑtN
t~r~
N
© IO
O
-q
-íN
CO
NO
lOlO
0
00
0
cO
i-ii-i O
fN
cO
NO
«0
^>
OtN
fN
fN
t--q
'«t
oÑ
tNr~
r^
r^
oo
tÑr~
NO
OÑ
O
NO
N r~
TJ- ON
CO
00
CO tN
OO
00
tN i-i
00 .-ï C
O
ON
r^
i-icO
oo
fNc
n.fN
r^
q
NO ON" r
- ON f¡ •»' c
i t' ooV
ONOO
IO eN © CO 00 eN TT
0000
tNi-ii-i
r-i-ifN
co i-i
r» c
o <o
>o
193
oo '
i—i
NO
i—l
O
' d
c-
i—i
ON
NO f- eN
N
O eN
co
-^ c
o
-H
co r
tN
N
tNir
-tN
tN
tN tN
oo
oo q
q
N
O
NO T
Í eÑ O
Ñ io
C
O i-i
N
O CO
'N
* N
O
tN
O
"O
tN
tN
'S; O
; CO •
* CO IO
ri
d O
i-i vT
r-' tN
tN T
t en tN
io
tN
O
N
en
287.
es 287.
tN 287.
tN
ON
ON
^N
OO
oio
ON
Tj-i-ic
ON
q
r^d
t-^^
toN
NO
oõ
eN
cÒ
NO
m
m
tNi-iN
Oc
ortc
oc
o
r- r-
NH
r-
i-i ts
«o
NO
oo o oo i-i
r— NO
ON NO -»i- c
o NO >ò
tN CO tN 00 NO 1-
tN
r-
ON
00
eN
tN
r-
ON
i-
<t
Nq
qN
OO
Nv
qo
Nt
~;
^c
oo
o^
-t
Ñr
-^
co
eÑ
-H
O
oo o
o
tN .-i
r- .-i eN
NO
o
•<r q i-; q
o
o O
; eÑ
c- r~
o
OÑ o
d
«H
in
Ntm
iii
tN •-• 0
0
r-l
00
tN
Ô
ON
ON
NO
ON
II
i-*q
cN
}.-iT
t;qt-;N
or-;tN
•-iN
Oiò
dio
r^
r^
dio
i-i
«o
í- NO
*
NO N
t o •
* N
B
00
00
eN
.-n
00 .-ï tN
•-; IO
00 T
f —. O
O
eN
H
ci rl
NtV
r
t-
itiN
tH
Oo
om
oo
N
HO
IH
«
eN
.-i
eN
• N
O r-; r-; q
eN
co
t
OÑ O
NO i/l N
T
co O
N O
N o
o ii
en
eN
r-
o
n
eN
i-it
Nc
o^
-iO
No
r-o
oo
NO
i-ie
N
co t
>o. co
vo
•"*• t—
1
i—l
i—1
i-H
ï—I
i—I
CO
i—
l C
O
i-joo
tNe
Ne
no
Oi-iT
rq
i-; •N
^O
OIO
—ie
sd
oo
ioO
NO
Ñ
C~
NO
NO
Ti-c
-rí-io
fNO
r-~
r-~
eN
r»
i-i tN
1
««
3.8
c
o
«o ce
a
o<
C C
S
2 o
«
NÍJ o
3=a
(Ä
hU
ffl
X O
,
Mí"
1
o =>
•o
o
«1
OH
8.a t-
u
V C
I/i
Ç
_.
o
eo O
C
n ¿¡o
o
O
*•
»
z axes
H V
K
•3
c
v¡
O
O Pri
2
II oo
r-O
N i-
ator
c u
Û
OH O
. Û
Û
OO
eN
oo
tN
"O
en
§3
O
o
a ¿Tí
«O
E
"Î7Î U
J
s
o
to

The economy and the education system
The education system
T h e Sudan's educational system follows the 6-3-3 ladder, with six years of primary, three years of intermediate level, and three years of secondary. T h e usual age of entry to school is seven years. Third-level education consists of the university and higher institutes, including the Khartoum Polytechnic, where study duration varies from three to six years. At the secondary level, teacher training and technical schools have a course duration of four years, whereas after primary there are vocational youth centres of two years duration for those w h o do not have access to second-level education. After intermediate level also there are vocational training centres for those w h o do not have access to secondary, technical or teacher training institutes. During recent years, Koranic schools and village schools have been integrated with the modern education system, providing them with additional teaching and financial resources so that the students might have access to intermediate level school after passing through a system of complementary schools (see Figure 1 for the structure of the education system).
The literacy rate in the Sudan has been very low; the latest estimate is 20 per cent for adults. The primary school enrolment ratio has increased from 30.5 per cent in 1970/71 to 38.8 per cent in 1980/81. The enrolment ratio varies from province to province, the m i n i m u m being found in Lakes province with 11.6 per cent and the m a x i m u m in Nile province with 75.4 per cent in 1980/81 (Table 3). T h e enrolment ratio also varies for boys and girls, with 44.5 per cent and 32.6 per cent respectively. Comparing the situation with some earlier point in time, namely 1978/79, there has been some improvement. For example, in 1978/79, the total enrolment ratio was 37.2 per cent (boys 42.6 per cent and girls 31.4 per cent), and the m i n i m u m enrolment ratio was for the Lakes province at 11.1 per cent and m a x i m u m for the Northern province at 74.2 per cent. During the two-year period, Nile province has therefore surpassed Northern province.
In respect of primary education, w e still find evidence of private control. In 1980/81, 223 schools with an enrolment of 36,370 were in private hands, out of a total of 6,009 schools and a total enrolment of 1,476,300. The number of private schools is however decreasing very rapidly.
Total enrolment at primary level has increased at an annual rate of 4.8 per cent only during the period 1972-80. This growth rate has also riot been uniform for all provinces or regions. During the past two years, m i n i m u m growth was registered for Upper Nile at 1.9 per cent, and m a x i m u m growth was for East Equatoria at 30.6 per cent per a n n u m . By sex, the growth rate in enrolment for boys was only 2.6 per cent and for girls 6.9 per cent during the period 1977-80.
The transition rates from grade 1 to grade 12 (see Table 4) show that out of 174.8 thousand students in grade 1 in 1968, 144.9 thousand arrived
27

From
college to work: the case of the
Sudan
r-i s
M j chni 4> ghei
2
00
LO
CO
CM
CO CM
CM CM
CM
O CM
I
3 S
S
S
Ol
00
ID
5 «
E u </> >-. V)
C
g S 3
'S <u o 0) l_ 3 O
3 u
Ol
CO
r-
J3-
TH
CO
*-" E
Iß
uO
J-CO
CM
TH
CM
CD
Ol
CO
r-5? 3 00
2 a
28

The economy and the education system
Table 3: Enrolment ratios by province for primary, intermediate and secondary levels in 1980/81
Province Primary Intermediate Higher secondary
Lakes/Bahr-el-Gazal 12.2 7.7 1.1 (11.6 + )
Jonglei/Upper Nile 21.3 12.9 6.0 East and West Equatoria
South Kordofan North Kordofan South Darfur North Darfur Blue Nile Red Sea West Nile Kassala Northern Nile Gezira Khartoum
Overall
Note: + Lakes province only
in grade 6 in 1973, with a crude retention rate of 83 per cent. T h e high transition rates are due to automatic promotion from grade 1 to grade 6. T h e higher n u m b e r s in grade 6 are due to the repeaters w h o did not succeed in the examination held for the first time at the end of grade 6, and therefore repeated the s a m e grade in the next year.
Enrolment at the intermediate level increased from 163,500 in 1973/74 to 278,767 in 1980/81, an annual growth rate of 7.9 per cent per a n n u m . At the secondary level, enrolment has increased at an annual rate of 12.1 per cent during the period 1973/74 to 1980/81, from 61,600 in 1973/74 to 136,651 in 1980/81. Here again, growth has not been uniform in the different types of second-level education. Academic secondary, which had been the most popular stream, has g r o w n at an annual rate of 11.8 per cent, whereas technical secondary, which was not very popular in the past, has shown a faster growth rate at 18.7 per cent during the period 1973-80, due to the emphasis by the government on this branch in order to meet the needs for skilled labour. T h e teacher training institutes, which provide
29
53.8 34.9 30.0 18.9 27.8 42.0 20.6 31.7 31.1 73.6 75.4 64.6 67.4
38.8
30.0 11.5 18.3 7.3
12.8 21.6 14.5 19.4 19.4 53.7 46.3 33.5 30.8
22.9
8.3 4.6
10.1 3.9 6.1 7.2
15.5 9.7
9.5 32.8 25.0 22.8 31.0
13.0

From college to w
ork: the case of the Sudan
co TJ con
i/i
co
OJ l
w> >f)
co SO
«O
r~
Ol
sO
Os
-o
r» oo
o o»
Tf
oo
Ol
o
sO
Os
o o t—
*
Tf
Tí
Tí
o 1-*
OÍ
Tf
oo sO
co CO
co v>
sO
Tf
OÍ
CO
Os
CO
co Ol Ol
o-Os
Tf
i—t
OÍ
co sO OÍ
>o Tí
OÍ
Os
Oí
Os
co
o sO
O)
O r-Ol
Tí
co co
r~
Ol
sO
co
o Tf
CO
00
co CO
Ol
CO
CO
00
Tí
co
VI
c 3 D
•O
° c
00 «
Os
ob vO
O
s
T3
O
Ol
Os
Tf
Oí
*n sO
Ol
O«
O Ol
Oí
CO
o> Ol
Os CO
Ol
SO
Ol
O 32
Tí
in
Oí
O oo Oí
o sO
CO
o Os
Oí
T—»
Os
CO
i—t
O-
Tf
Tí
O Tí
OÍ
sO
o-oo Tí
r~ Tí
sO
O-
Tí
Tí
sO
sO
sO
Tí
>n Tf SO
>r> oo o-
o-CO
SO
sO
Oí
o-W)
Ol
o-
vO
o>
sO
sO
o~
o-Tf
oo
Ol
00
o-Os
o oo
sO
OÍ
Os
in
o Os
Os
Oí
oo
f¡
o
a
! B
£
£ i>
T3
cd
¡•s
C E
c PJ
TV
SU
•*
*
-O
Tf
Os
Oí
o-co
m Tf
Tf
oí O eO
»n CO Tí
oo 174
Tf
Tf
CO
CO
00
CO
oo
Oí
o Oí
Tf
sO
O-
sO 183
oo SO
CO
Oí
co Oí
Oí
Os
CO
o o Ol
o oo
o 193
*—*
o , r» oí
O oo Tí
o~ O o-IO
00
o-<n
Os
o> Os
OÍ
r-Oí
Tí
oí sO
sO
Tí
Tí
O-
1—1
Tí
Os
00 208
Os
Tf
Tí
sO
Os
IO
Oí
Os
sO
<r> oo 00
Oí 205
o-214
Oí
oí 1/1
Os
OO
sO
O-
Tí
00
Os
Oí
Os
O 205
Oí 227
oí oo «TI
1/1
sO
i/->
Os
O-
00
OÍ
Os
*-* 219
co 252
00
o Os
O o-t
o oo
o-200
t-i 232
Os 252
>/•>
co
1 , sO
o-sO
Os
,_ Oí
oí
sO 250
Os 282
00
o-m sO
00
Tf 207
Tf 229
o 259
V) 297
•-i
OÍ
Os
sO
Os
Os
Tf 218
>/> 248
o 309
OÍ 319
es oo sO
O
s
O-
©
^ sO
O
- 0>
Os
Os
Os
Oí
o-Os co o» Os
Tf
O*-Os
VI o
Os
sO
o-Os O-
r~ Os
00 o> Os
o 00 Os
30

The economy and the education system
teachers for primary education, have seen their enrolment increase at an annual rate of 4.8 per cent during these years. However, this is still the slowest growing branch.
Information on provincial growth rates, available for the period 1978/79 to 1980/81, shows a wide difference in growth rate a m o n g the provinces. The highest increase observed is for White Nile at 49.2 per cent per a n n u m , and the lowest for East Equatoria at -12 per cent per a n n u m . There has been a net decrease in enrolment in East Equatoria during the last two years. By sex, the growth rate has been higher for girls at 23.8 per cent than for boys at 11.3 per cent during 1978-80.
T h e enrolment ratio for secondary education has also shown a moderate increase during the period 1978-80, from 10.1 per cent to 13.0 per cent, and again this has not been uniform for all provinces. The highest enrolment ratio is observed in Northern province at 32.8 per cent, and the lowest at 1.1 per cent in Lakes province and Bahr-el-Gazal. The disparity in enrolment ratios is also revealed in the co- efficient of variation at 66 per cent and the Gini coefficient at 0.60 for 1980/81 (see Figure 2).
In respect of transition rates, it is observed that out of a total student population of 144.9 thousand in the 6th grade in 1973, 63.7 thousand arrived at grade 9 in 1976—a loss of 81 thousand. The m a x i m u m loss occurred between grade 6 and grade 7 (55 per cent) when the national examination took place. Average transition rate from grade 6 to grade 7 during the period 1972 to 1980 was 56.5 per cent, i.e. more than one out of two sixth-graders would on average continue to the intermediate level of education.
T h e average flow rate within intermediate level has been higher than the average flow rate from intermediate to secondary level, which is 53.9 per cent on average from grade 9 to grade 10. Within the secondary level, inter-grade flow rate varies between 85 per cent and 100 per cent, and 98 per cent and 142 per cent from grade 10 to 11 and from grade 11 to 12 respectively. T h e last figure is m o r e than 100 per cent because of high repetition in grade 12.
The above shows that out of nearly 175 thousand students at grade 1 in 1968, 65.4 thousand reached grade 7 in 1974, 33.4 thousand reached grade 10 in 1977, and 32.8 thousand reached grade 12 in 1979. This shows that approximately 142 thousand students, or nearly 81 per cent, left the school system. This is a very slight increase from the situation prevailing for the cohort of 1959 where crude retention rate was found to be 15 per cent.12
In respect of physical facilities, the number of primary schools has increased from 5,156 in 1977/78 to 6,009 in 1980/81 at an average annual rate of 5.2 per cent. The number of classrooms has increased at an annual
12 B . C . Sanyal and El-Sammani A . Yacoub, Higher education and employment in the Sudan, op cit. p.62,
31

From college to work:
the case of the
Sudan
o oo O
N
.a >
•O C O o <L> t/5 D
•«
-»
CS '•5
V
¿3 cd
S CU
i-i
3 u N
G
X *
1/5
H 1/3
w Pá
(N
•*
r-~
VO »—
1
d
>• oá
^
(N
<N »
-H
(N
CN
d
H z o"
r-ON O
N O
N in
Ü
o
'O
•
N LO
-1
tu
>
w 1-1 >
1
Cá < s PRI]
I-I w >
w p-i H <
EDI
cl w INT
J
w LEV
ÎH
eá < Q Z O tu
\
\
\
CD 1
LO
\
%
\* *
LO OJ
I o
o
_l_
J-LO
O
LO
r-» L
O
CN
INaW
lO^N
a 3D
VIN
3Dtf3d
S
AU
Vin
WlD
32

The economy and the education system
average rate of 17.8 per cent during the same period—more than three times faster than the number of schools. The number of teachers has increased from 34,988 in 1977/78 to 42,611 in 1980/81. T h e teacher/ student ratio in primary schools was 1:35 in 1980/81, but this varies from province to province, with a m i n i m u m of 1:25 in Northern province and a m a x i m u m of 1:62 in East Equatoria.
At the intermediate level, the number of schools has increased from 1,173 in 1976/77 to 1,602 in 1980/81, and the number of classrooms has increased from 3,751 to 5,553 during the same period. The number of teachers has increased from 10,612 in 1977/78 to 12,323 in 1980/81 at an annual average growth rate of 5.1 per cent. The teacher/student ratio was 1:23 in 1980/81.
In respect of academic secondary education, the number of schools has increased from 131 in 1976/77 to 288 in 1980/81, and the number of classrooms has increased from 1,200 to 1,718 in the same period. The teacher/student ratio varies from province to province, with the m i n i m u m at 1:17 in Jonglei province and the m a x i m u m at 1:40 in South Kordofan province, and 1:31 for the whole country.
As far as technical education is concerned, the number of schools has increased from 29 in 1976/77 to 50 in 1980/81. The number of teachers has increased from 435 in 1977/78 to 684 in 1980/81, at an average annual growth rate of 16.3 per cent during this period. The teacher/student ratio was 1:18.7 at national level in 1979/80, but varies from province to province with the m i n i m u m in Northern province at 1:10.5 and m a x i m u m in East Equatoria province at 1:29.3.
The number of teacher training institutes has increased from 15 in 1977/78 to 18 in 1980/81, and the corresponding number of teachers has increased from 488 to 695 during the same period.
Public expenditure on education at primary, intermediate and secondary levels had a share of 5.6 per cent of G D P in 1980/81, and a share of 15.6 per cent of the total national budget. It should be noted that compared to the coverage of higher education, general education has a m u c h lower share in the overall budget, which is not supportive of achieving universal primary education nor of providing a strong base for higher education.
Cost per pupil at the primary level was S£30.7 in day-schools and S£105 in boarding schools in 1979/80. Similar figures for intermediate are S£83.3 and S£184.3 respectively, and for secondary education S£145.5 and 250.6 respectively. It is striking to note thé provincial differences in cost per pupil at different levels. At day primary schools, it varies from S£25.9 in Khartoum province to 48.4 in Nile province. At day secondary schools, it is S£108.8 in Northern province and 241.8 in Red Sea province (Table 5).
33

From college to work: the case of the Sudan
Table 5: Cost per pupil at secondary, intermediate and primary levels (in S£)
Province
Northern Nile Khartoum Gezira West Nile Blue Nile Kassala Red Sea North Kordofan South Kordofan North Darfur South Darfur
Average
Secondary level
Boarding
203.8 205.3 348.9 247.6 204.8 254.3 269.4 431.3 189.2 266.3 442.3 308.6
250.6
Day school
108.8 121.7 151.6 156.7 111.0 163.8 145.7 241.8 115.9 127.7 210.6 182.5
145.5
Intermediate level
Boarding
202.1 180.3 278.2 184.9 222.8 169.5 194.1 294.8 125.2 197.8 241.4 199.7
184.3
Day school
98.9 100.2
59.7 90.2 76.3 66.5 70.8
107.9 73.5 92.4
115.8 101.2
83.3
Primary level
Boarding
132.5 128.1 196.4 114.1 101.8 117.6 130.4 148.8 80.8
100.2 105.6 103.9
105.0
Day school
45.2 48.4 25.9 26.9 31.2 33.4 32.9 43.6 35.0 30.5 45.2 34.8
30.7
Higher education
In the Sudan, higher education has undergone substantial change since 1973/74, at which time there were three universities and eighteen higher institutes and colleges under the Ministry of Education. In addition, there were seventeen post-secondary institutions belonging to other agencies, including the Military College,13 Police Officers College, Prison Officers College, Institute of Banking, Telecommunication Training Institute, X - R a y Technicians Training Centre, Post and Telegraph Institute, Institute of Music, D r a m a and Folklore, Wad-e l -Magboul Higher Institute, and Veterinary Training Institute.
3 According to a recent agreement, the selection for admission to the Military College will be administered by the University of Khartoum. The applicants will have to secure a secondary pass certificate with 60 per cent marks in the different disciplines. During the three-year course the academic programmes would be conducted by the university and the military training provided by the Military College. A n academic intermediate certifícate will be awarded by the university to allow the students to pursue degree programmes later.
34

The economy and the education system
A s mentioned in Chapter I, in 1975 the National Council for for Higher Education, was reinforced and given the responsibility of planning and supervising the development of higher education. The N . C . H . E . is also responsible for determining the role of each institution of higher learning and the annual student intake and their distribution among different specialities. The N . C . H . E . is authorized to examine the annual budgets of the institutions, to allocate funds to each institution and to suggest grants to non-governmental institutions. Finally, it is responsible for determining requirements for the appointment of academic staff and fixing their terms of service.
T o help the N . C . H . E . in discharging its responsibilities, the following central bodies were established:
(a) Higher Education Grants Committee
(b) General Administration Unit of the Higher Education Grants Committee
(c) Secretariat-General of the N . C . H . E . Higher Education Admissions Committee
(d) General administrative unit of the Higher Education Admissions Committee."
With the purpose of making higher education more relevant and responsive to the needs of the society, a number of accompanying laws were promulgated establishing n e w institutions and redesignating the functions of existing ones. Thus, by 1975, the Sudan's system of higher education had expanded to include five universities: University of Khartoum, University of Juba, University of Gezira, the Islamic University of O m d u r m a n , and the University of Cairo (Khartoum branch—under the control of the Egyptian government).
In the area of technical and post-secondary education, new institutions were established: the Khartoum Polytechnic, the Colleges of Agriculture and Natural Resources at A b u Haraz and A b u N a a m a , the Institute of Music and D r a m a , and the Institute of Radiography and Radiotherapy. T h e College of Hygiene, the Higher Nursing College, the College of Mechanical Engineering at Atbara, and the Higher Institute of Physical Training already existed.
Along with the above institutions, the Ahfad University College for W o m e n (a private college) was established in 1966 to offer B.Sc. in h o m e economics and B . A . in european languages and secretarial studies.
T h e 1975 Higher Education Reform Act aimed mainly at adapting higher education to the needs of the changing society. The practices of institutions of higher learning before 1975 were described as being 'based
35

Front college to work: the case of the Sudan
on unadapted foreign models or directly implanted from systems that are completely alien to the local conditions'. Thus , the 1975 Reform Act formulated a general policy which defined the objectives and structure of higher education, and the role of each institution in the national development.
T h e University of Khartoum—the oldest and most important institution of higher learning in the Sudan—has provided the country with generations of administrators and professionals in the fields of agriculture, arts, economics and social studies, education, engineering and architecture, law, medicine, pharmacy, science and veterinary science. After reaching its capacity for such training, the university had to develop vertically by concerning itself with enhancing post-graduate studies and development-oriented research.
In developing a high capability for problem-solving and rural development, two n e w universities were established: (i) the University of Juba—structured on colleges of natural resources and environmental studies, economic and social studies, and education—which was to be responsible for the preparation of trained cadres capable of shouldering the complex problems of rural development, and for conducting research on problems of the nomadic and agrarian societies of the Southern region, as well as preservation and development of natural resources; (ii) the University of Gezira—structured on colleges of physical sciences, agriculture, and social studies—with special reference to rural development.
The role of the Islamic University of O m d u r m a n was to enhance the development of religion and culture in the country by engaging in teaching and research in the fields of languages, Islamic religion, law and other related studies.
The role of the Khartoum Polytechnic and other higher technical institutes and colleges was to provide the country with paraprofessionals and middle-level m a n p o w e r in different specialities. It consists of five colleges: agricultural studies, engineering, commercial studies, fine and applied arts, and extra-mural studies.
During 1982 and at the beginning of 1983 the N . C . H . E . m a d e efforts to introduce a n e w model for regionalizing higher education in the country. This effort was the result of a Presidential directive in 1982 which called for the following:
(a) Speeding u p of the completion of the col'eges and other constructions of Juba and Gezira universities.
(b) Finalizing all the feasibility studies concerning the establishment of Darfur university as a step forward for undertaking similar studies with the aim of establishing other universities in Northern, Eastern and Kordofan regions.
36

The economy and the education system
(c) T h e target date for establishing these regional universities should be before the terms of office of the present regional governors end.
Following the directive, the Secretariat General of the N . C . H . E . looked for the different possibilities of implementing the directive. T h e subject was discussed in special meetings of the following five specialized advisory committees set up for this purpose by the N . C . H . E :
(a) The Committee for Engineering and Technological studies.
(b) The Committee for Medical and Health studies.
(c) The Committee for Economic and Social studies.
(d) T h e Committee for Natural Resources and Scientific studies.
Recommendations were m a d e by each of these committees which would serve as the guidelines for the establishment of each regional university.
The N . C . H . E . staff in co-operation with other m e m b e r s of the academic community have m a d e intensive investigations into the orientation that these universities would have to m a k e them instruments for regional development. It was proposed that the Darfur university should specialize in natural resources and would comprise the following units at the initial stage (i) a main campus consisting of the colleges and a research institute; (ii) three institutes for practical work in animal production (at El-Gazala Gawazat), horticulture and vegetable production (at Zalenge) and an environmental studies centre (at K u t u m m ) ; and (iii) production farms for poultry, dairy and meat production (at Sag El N a ' a m ) and plantations for fruits and vegetables (at Kas).
In the Northern region a college of education is proposed to be set up at Atbara with assistance from the Arab Republic of Egypt and sponsored by the University of Cairo (Khartoum branch). T h e regional government is to provide the physical facilities. T h e College of Mechanical Engineering at Atbara is to be remodelled to become a university college of technology, with additional programmes on agro-industry for exploiting the agricultural resources of the region. In the Kordofan region, another university for natural resources and technology is to be set up to limit desertification and to achieve efficient utilization of water resources and improved animal husbandry.
In the Eastern region, it is proposed to establish a technical college of mining and petroleum at Port Sudan with a department of marine sciences. A college of education and humanistic studies is also to be set up in Kassala, the capital of the region. Each of these institutions will be production-oriented and the programmes work-oriented. They will be
37

From college to work: the case of the Sudan
started with existing facilities, and only after competent staff have been trained. Programmes will be flexible in respect of duration and clientele to meet the regional needs of middle- and high-level manpower . T h e present study, based mainly on the existing institutions, does not go into details of the implications of the proposed expansion and regionalization of higher education in the country. As the detailed plans for these new institutions are yet to be prepared, the findings of the present report m a y be of some use. Therefore, what follows in the sections below is a diagnosis of the existing higher education system.
E n r o l m e n t trends
The system of higher learning in the Sudan is highly selective, based on academic achievement. Tables 6 and 7 give admission ratios into universities and higher institutes for four-year and three-year courses.
It is noted that approximately six out of seven applicants for admission to higher education with a duration of four years and over are refused admission. For the courses with a duration of three years, four out of five candidates are rejected.
Table 6: Admissions to universities and higher institutes (four-year courses)
Year
1975/76 1976/77 1977/78 1978/79 1979/80
Applicants
15 934 13 219 17 900 20 131 20 145
Qualified
8 596 7 767
10 639 10 558 11 525
Admitted
2 169 2 169 2 741 3 036 2 611
2:1 %
54 59 59 53 57
3:2 %
25 28 26 29 23
3:1 %
14 16 15 15 13
Growth in enrolment
During the period 1969 to 1981, enrolment in higher education increased at an average annual rate of 10.5 per cent, from nearly 10,000 students in 1969/70 to a total of approximately 33,000 in 1981/82. T h e growth rate has slowed d o w n since 1975 at 7.6 per cent. However, the growth is uneven by institution and by field of study.
T h e University of Khartoum has increased its enrolment at a very slow rate of 2.5 per cent per year, whereas the University of Cairo (Khartoum branch) has increased enrolment by 8.5 per cent per year, and
38

The economy and the education system
Table 7: Admissions to colleges and higher institutes (three year courses)
Year
1975/76 1976/77 1977/78 1978/79 1979/80
Applicants
2 262 2 117 3 419 3 793 3 656
Qualified
1 340 1 637 2 615 2 567 2 667
Admitted
528 622 618 760 748
2:1 %
59 77 77 68 73
3:2 %
39 38 24 30 28
3:1 %
32 29 18 20 21
Source: National Council for Higher Education, Khartoum.
has been increasing at a faster rate in the most recent years (during 1978-81, the growth rate was 10.4 per cent). T h e Islamic University has increased its enrolment by 9 per cent per year. T h e University of Juba, which started in 1977 with an enrolment of 119, has increased its enrolment to 650 in 1981/82, and the University of Gezira has increased enrolment from 202 to 797. Like the University of Khartoum, Khartoum Polytechnic has stabilized its enrolment.
It is'striking to note that the University of Cairo has increased its share of enrolment in higher education in the Sudan from 49 per cent in 1975/76 to 55 per cent in 1981/82 (see Table 8).
T h e number of students studying abroad also increased substantially from 8,916 in 1976/77 to 17,604 in 1979/8014 as against a total of 26,937 students studying in the Sudan. If w e subtract the University of Cairo (Khartoum branch) students, the total number of students studying in the Sudan comes to 13,018. So, out of a total of 44,541 students, only 13,000 pursued their studies strictly under Sudanese control, which should be a matter of serious concern for the policy-makers.
T h e growth rate in enrolment by field of study demonstrates that although the enrolment controlled by the Sudanese system has increasingly attempted to achieve a favourable share of science-based students, the large share of University of Cairo students—almost all of w h o m are in arts-based fields—has offset the science: arts balance. In 1978/79, of all students enrolled in the Sudan, 27 per cent were in science-based fields, whereas in 1981/82 this share has further gone d o w n to 25 per cent. Table 9 shows the distribution of enrolment by field of study for 1978/79 and 1981/82.
14 Unfortunately, statistics on students abroad were not available for 1981/82. The remark that follows relates to the year 1979/80.
39

From college to work: the case of the Sudan
Table 8: Enrolment in higher education institutions for 1975/76 and 1981/82
Year 1975/76 1981/82
Institution
University of Khartoum O m d u r m a n Islamic University Juba University Gezira University Khartoum Polytechnic College of Hygiene Khartoum Nursing College Atbara College of Mechanical Engineering
Institute of Music and Drama Radiography and Radio Therapy Institute
Higher Institute of Physical Education
A b u Naama College of Agriculture and Natural Resources
A b u Haraz College of Agriculture and Natural Resources
Ahfad College for W o m e n University of Cairo (Khartoum branch)
7 253 1 016
--
1 604 59 86
70 153
-
-
-
.
10
0 172
8 424
1 700 650 797
1 755 71 143
125 204
105
138
238
264 359
18 271
A positive aspect of the development of higher education is the faster growth in female enrolment than for males. T h e share of female enrolment has increased from 12 per cent in 1973/74 to 23 per cent in 1978/79, the latest year for which statistics on sex-wise distribution of enrolment could be obtained. T h e growth rate has been 22 per cent per a n n u m . Most of this increase has, however, been in the fields of arts and arts-related subjects. T h e Ahfad University College for W o m e n is contributing considerably to female education in the country. T h e University of Cairo, however, has the largest share of female students amongst all the institutions.
For the University of Khartoum, the share of female intake has increased from 12.2 per cent in 1975/76 to 32.8 per cent in 1982/83. In s o m e faculties, female students outnumber male students, e.g. the college of dentistry. W h e n w e compare 1975/76 female enrolment by field of
40

The economy and the education system
Table 9: Enrolment by field of study in 1978/79 and 1981/82
Commercial studies Arts Law Engineering sciences Medicine Agriculture Science and natural resources Other arts-based
Total
1978/79
25.2 23.1 10.8 9.2 7.3 6.8 3.3
14.3
100.0
N : 26 366
1981/82
23.8 21.2 15.8 6.7 6.9 7.2 4.3
14.1
100.0
N : 33 264
study with that of 1981/82, w e note a significant improvement in the distribution by field. T h e share of female enrolment for the same period in such faculties as science, medicine, agriculture, pharmacy, and veterinary sciences have increased respectively from 15.8, 12.0, 9.9 15.5 and 11.9 per cent to 27.0, 27.3, 26.4, 31.2 and 20 per cent (see Tables 10 and 11). Such an improvement in female participation could serve as an example for m a n y other universities in the developing countries. Whatever improvement has been achieved by the University of Khartoum in respect of female participation in science- based fields has however been offset by the increase in the number of female students in arts-based fields at The University of Cairo (Khartoum branch).
The gross enrolment ratio in higher education (measured by the total enrolment in higher education divided by the population in the age-group 20-24 years) has been increasing slowly during the period 1975/76 to 1981/82 from 1.5 per cent to 2 per cent.
In respect of graduation, the universities' performances vary widely. T h e University of Khartoum has a very high rate of success in almost all faculties. T h e flow rates from one year of study to the next are also very high. Table 12 gives the graduation rate of comparable fields of study for two years between the University of Khartoum and the University of Cairo (Khartoum branch), which provides some idea about the effectiveness of the two universities in providing instruction in similar faculties.
41

From college to work: the case of the Sudan
Table 10: Female enrolment as percentage of total enrolment by faculty for 1975/76 at the University of Khartoum
Faculty
Arts Education Economics and Social sciences
Agriculture Pharmacy Medicine Veterinary science Science Law Engineering School of Mathematics
Total of students
870 461
945 815 155 983 362
1 510 181 971
Female total
139 67
81 98 24
118 43
238 29 34
% of the faculty
16.0 14.5
8.6 9.9
15.5 12.0 11.9 15.8 16.0 3.5
% of the total female
enrolment
16.0 7.7
9.3 11.3 2.8
13.5 4.9
27.3 3.3 3.9
Total 7 253 871 12.2 100.0
Financing of higher education
A s already mentioned, the University of Cairo (Khartoum branch) is entirely financed by the Arab Republic of Egypt, and the Sudanese government does not have any expenditures for this university. Also, for students studying abroad, very little public expenditure is involved. T h e total amount spent on bursares and travel expenses for students abroad was Sf773,488 in 1977/78 for 10,278 students, and Sf 1,499,405 in 1979/80 for 17,604 students studying abroad. T h e average rate of growth for these students was 19.6 per cent as against the expenditure at 24.7 per cent.
T h e current budget for higher education in Sudan (including administrative offices) increased from S£14.2 million in 1975/76 to S£30.3 million in 1979/80, an annual average growth rate of 20.8 per cent unadjusted for inflation. The share of salaries and wages varied from 60.3 per cent in 1975/76 to 51.2 per cent in 1979/80, that of students' maintenance and other services increased from 34.2 per cent to 41.8 per cent, and that of durable goods and capital expenditure fluctuated between 5.5 per cent and 7 per cent during this period. T h e proportion of the national budget allocated to higher education decreased from 4.6 per cent in 1975/76 to 3.5 per cent in 1979/80.
42

The economy and the education system
Table 11: Female enrolment as percentage of total enrolment by faculty for 1981/82 at the University of Khartoum
Faculty
Arts School of Education
Economics and social sciences
Agriculture Pharmacy Medicine Veterinary science Science Law Engineering School of mathematics
Total of students
909
775
Female total
230
287
974 1 308
231 1 266
514 782 304
1 338
195 346 72
345 103 211 77 78
% of the faculty
25.3
37.0
20.0 26.4 31.2 27.3 20.0 27.0 25.3
5.8
of the total female
enrolment
11.8
14.8
10.0 17.8 3.7
17.7 5.3
10.8 4.0 4.0
23
Total 8 424 1 944 33.8 100
Source: Department of Statistics, National Council for Higher Education
Table 12: Comparison of graduation rate from University of K h a r t o u m and University of Cairo (Khartoum branch) for 1979/80 and 1980/81
Faculty
Arts Law
University of Khartoum
1979/80
0.82 0.85
1980/81
0.66 100.00
University of Cairo (Khartoum branch)
1979/80
0.65 0.58
1980/81
0.65 0.35
T h e average annual growth rate in the current budget, unadjusted for inflation, for the relevant institutions was 18.3 per cent, as against student increase of 5.6 per cent per a n n u m during the period 1975-79. W h e n
43

From college to work: the case of the Sudan
adjusted for inflation, the rate of growth of the approved current budget might be less than that of the students. During this period, the O m d u r m a n Islamic University has enjoyed the fastest growth rate in its current budget at 32 per cent per a n n u m , and the University of Khartoum the slowest growth rate at 9.7 per cent per a n n u m . T h e n u m b e r of students in these two institutions has increased at an annual average rate of 11.7 per cent and 2.2 per cent respectively. T h e two n e w universities of Juba and Gezira received respectively S£2.64 million and S£2 million in 1979/80 with student enrolments of 409 and 366 respectively. These two universities having started their first intakes in 1977 and 1978 do not yet function to their full capacity.
T h e latest statistics on current and capital expenditure on education show that in 1980/81 higher education had a share of 3.8 per cent of total government current expenditure. For capital expenditure it was 3.3 per cent. This constituted 20.4 per cent of total current expenditure on education and 22.4 per cent of total capital expenditure on education. Overall government current expenditure for 1980/81 was S£.933 million and total government capital expenditure for the same year was S£339.5 million.
T h e overall cost per student varies widely a m o n g the institutions mainly because of their fields of studies and enrolment. Table 13 shows that the m i n i m u m cost per student was at A b u N a a m a College for Agriculture and Natural Resources at S£l,093.6 in 1979/80 and the m a x i m u m was for the University of Gezira at S£5,268.8. Cost per student at the University of Khartoum was S£l,990.9 and has been increasing at an annual rate of 7.3 per cent, and that of the Islamic University has increased at a rate of 22.2 per cent per a n n u m . At the Hygiene College cost per student has increased by 8.4 per cent and that of the Nursing College by 18.8 per cent. T h e Khartoum Polytechnic had a faster rate during 1975-77, but since then the rate of increase in cost has gone d o w n .
It should be noted that most of the increase is due to inflation factors. T h e unit-cost for Juba is the highest at S£5,269.8 and the next is for Gezira. Although the cost for Gezira is falling with increasing enrolment, that of Juba has not shown any sign of e c o n o m y of scale for the period 1978/79 and 1979/80. The increase in cost per student for the Islamic University also deserves some attention.
T h e problem of the development of higher education has attracted the attention of the Sudanese decision-makers, as noted by the re-organization of the higher education system in 1975. In February 1977, the Ministry of Education published its o w n appraisal of the overall education system15 and c a m e up with a set of recommendations for corrective action, and to achieve such goals as reduction in illiteracy, universal primary education for seven-year-olds by 1990/91, m o r e technically skilled secondary-school
Ministry of Education, Sudan, Appraisal of education: a strategy for action, February 1977.
44

The economy
and the education system
*•—***
«+<
Í/5
>W
O
oo
o 76 to
m
r-o\
*~* T
3
O
*c
o.
<u 4=
O
oo
ò
I~-o-
*—1
O
25
r-0^
oo
r-i-î
oo .-<
OO
"O
>*
Om
00
rt
oò
\¿
i/->
sO
©
<S
O
ir¡
w->
00
^ i-<
O
H
h
(*1
{S
1/1 ^
ftrt
O
^
i-H
u-¡ xr>
O
vO
OO
^C
Jv
OO
sO
vO
cN
es
cj\ o
o
O;
CJ\
rr¡ (S
•tf
O
O
-tf f-
•*
i y—
t
c¿
O
O
•*
t-H
<N
•
—_,
<t ^
oo
* «
r->/">
OÑ
o¿ ci
r
t-
ci O
Ñ (N
r
MO
O^
n>
í »
o
»O
OO
rtílr
H
~ -- -- 1 "
~ —
'
q-H
oo
qo
\o¡
o** r
rj
»-• 0
\ r-<
O
iC
NN
On
O
oo
oo
r- t
o
oo 0
0 1
•*
i—i
<s
1—1
r-ui
oo
(S
1-^
°i ci r-t—
4
<-H
1
vq
ci o
o
^ vi >o
0
0
1
t/>
c
o
• n
tut
"^ t/5
c
••
"
c
o
4-»
CG
o
3 •o
<u
u
4>
J=
O
O
t—
o
t-~
o
*~*
-o
r~
¡o
r-Ov
qo
om
o
om
«
Of
Ti
•rt
O 260
1 o
vo
n
' •-i
r- ^o
O
T
I O
w
"i oo
O
' -3-906
c cu T
D
3
tí v-<U
O.
••-»
VJ
O
O
>
<n
-o
c es
O 3
60
c u
c '5b c
¡2 73
£
u
.tí o>
vi
c >
3'S
CO
P
öl
c
es .B
u
V
3 O
M
• -
eZ
u
w *^
—
ë eg
3
5*
«
g
^ u
s
6
C=
5Q
3
3
n
"2
t a M
« CO
g
C
O
s-s il O
cZ
2
S> 2
g
o
"w
F
3
«
cj 3
2
3
-.—
c
co
•«-»
B C
"
"»
CO
H
3
Ä
S
o £ £
*¡ < 5
Ö S
!
3 U
"& <
t.
0 a
" 4>.
3
-g S^
i
Î?BS
U<
«
(S
3 U
'C
<
'"S 8
o
u
CU) 3
s? es 7
3
la CQ
(S
zz
1 =
<.
eo
B
u
3 •o
tu
a:
es B es
z 3 O
G0
45

From college to work: the case of the Sudan
leavers, regionalization and professionalization of higher education to meet development needs of the country. T h e above analysis, although brief, provides some idea of the success or failure of s o m e of the programmes designed to achieve these goals. It also helps us to identify the bottlenecks to success and the problems that must be tackled. W e have restricted ourselves in this chapter to a quantitative diagnostic analysis. T h e following chapters will deal with the qualitative aspects of the analysis to meet the objectives set out in Chapter I.
46

II. Surveys of students, graduates and employers
Background
Information on the relationship between the system of higher education and the labour market can be gathered through different sources. A m o n g those sources, elaborated statistics by national authorities, reports from different agencies and parties of the labour market and institutions of higher education, national censuses and manpower surveys are to be considered as the most important, or at least the most interesting, for any attempt at relating education in general, and higher education in particular, to the world of work. It is, however, more appropriate perhaps to go straight to the individuals directly involved in this interaction, in order to obtain information on the qualitative aspects of the relationship under investigation. In this respect, students, graduates, employers and educational authorities must be considered as the most relevant segments of the society, which can give the researchers or the educational planners all kinds of information required for a better understanding of the complexity of the world of education and its interaction with the world of work.
T o obtain this kind of information from the individuals, questionnaire surveys are a very important source in that they allow for investigating the elements of the planning mechanism of h u m a n resources in a specific social and economic context. They permit a large n u m b e r of individuals to be canvassed on a broad field of topics. It is important that these questionnaires be well constructed in order to enable the facts and opinions to be organized in a manner suitable for statistical analysis.
T h e questionnaire surveys can also be supplemented by interviews to obtain a m o r e exact and comprehensive picture of the relationship between education and work in general. Although more difficult and m o r e expensive to carry out, interviewing can nevertheless be used in the first phase of the survey to refine the questionnaires, cover all the aspects one can look for and frame the different items related to specific issues in a m o r e relevant way.
47

Front College to work: the case of the Sudan
O f course, the advantage of the questionnaire survey is that data needed for a particular type of investigation can be collected which are not normally available.
For the present study a questionnaire survey approach has been used to gather the necessary information from students, graduates and employers. The questionnaires utilized were adapted from those administered in the previous study'6 and are given in Appendix A.
The conceptual framework
In the construction of survey questionnaires it is of great importance to consider an implicit or explicit framework, because it constitutes the base on which the survey lies. T h e questionnaires give expression to the conceptual framework. A s a tool for the analysis of the data, an explicit framework provides not only a grouping of the large number of questionnaire items but also an order suggestive of the relationship supposed to prevail among the variables considered.
For the present survey, the conceptual framework comprises three parts covering students (secondary and tertiary final year), graduates and employers.
Items on the student questionnaire are grouped under sixteen headings representing as m a n y separate global dimensions, as follows:
List of conceptual groups of student variables
1. Personal characteristics 2. Communi ty characteristics 3. Childhood h o m e characteristics 4. Secondary school characteristics 5. Early career information 6. Occupation desired at end of secondary schooling 7. Adult h o m e characteristics 8. Educational career decision 9. Current employment context 10. Current educational context 11. Institution seeks co-operation in careers information 12. Attitudes and opinions about current education 13. Opinion about careers information 14. Attitudes towards work in rural areas 15. Opinions about work 16. Current occupational expectations
16 B . C . Sanyal and El-Sammani A . Yacoub, Higher education and the labour market in the Sudan, op.cit.
48

Surveys of students, graduates and employers
Items on the graduate questionnaire are grouped under thirteen headings, as follows:
List of conceptual groups of graduate variables
1. Personal characteristics 2. Communi ty characteristics 3. Childhood h o m e characteristics 4. Early occupational and educational expectations 5. Adult h o m e characteristics 6. Educational characteristics 7. Early occupational career 8. Current occupational career 9. Opinions about education 10. Opinions about career information 11. Attitudes towards work in rural areas 12. Opinions about work 13. Co-operation with institution of post-secondary education
Items on the employers' questionnaire are grouped under eight headings as follows:
List of conceptual groups of employer variables
1. Organizational characteristics 2. M a n p o w e r characteristics 3. Recruitment practices 4. Correspondence between academic and vocational
performance 5. In-service training 6. Opinions about institutions of higher education 7. Provision of work opportunities within organization 8. Opinions about employee needs
With a few exceptions, each of the global dimensions listed above is represented by items on the questionnaires. Sometimes, the global dimensions are broken down into finer groups within the questionnaire.
In the analysis given in the chapters that follow, this conceptual framework has been utilized as a guide to cover the different issues related to policy-making and planning of higher education.
49

From college to work: the case of the Sudan
The samples
T h e attitudes and expectations of the population are expected to be revealed by the samples chosen to be surveyed, and responding to the questionnaires. W e should note that certain characteristics of the different categories of individuals covered by the survey can provide a classification of the population in each category.
Secondary school students (final year)
T h e questionnaire was sent to a total of 1,000 final year secondary school students, of w h o m 827 responded, i.e. 2.2 per cent of the total population in the final year of secondary education. As shown in Table 14, 59.4 per cent of them were males and 40.6 per cent females.
Table 14: Distribution of secondary school final year students by sex and age
Age Male Female Total
33 397 61
491 (59.4%)
40 270 25
335 (40.6%)
15-17 33 40 (8.3%) 73 18-20 397 270 (80.8%) 667 21+ 61 25 (10.4%) 86
Total
O f the final year secondary school students surveyed, 58.7 per cent were born in urban areas and 41.3 per cent in rural areas; 86.1 per cent are academic school students, 6.1 per cent technical and 7.7 per cent commerce , whereas by academic stream, 12.4 per cent follow maths courses, 48.4 per cent biology and 39.2 per cent arts. Table 15 shows the total enrolment in final year academic secondary for 1979.
S o m e characteristics of secondary school students (final year) such as place of birth (urban or rural) sex, age, school finance, school type and academic stream are shown in Tables 111.1 to 111.4 in the Annex to this chapter.
It is to be noted that a m o n g the urban student group, females constitute a higher proportion than males, but a m o n g rural students the situation is the opposite. There is also a strong degree of statistical association between the characteristics 'place of birth' and 'sex' of the student. It would appear that lack of opportunities, as well as traditions and customs, still restrict pursuit of education by girls in the Sudan. Similar association
50

Surveys of students, graduates and employers
Table 15: Total enrolment in secondary academic schools in 1979
Boys Girls Total
Secondary academic 18 242 9 110 27 352 Percentage 66.7 33.3 100 Sample S9.4 40.6 100
can be noted between the type of financing of school education and the sex of the student. A higher proportion of female students are privately financed; the percentage goes d o w n as the financing system changes to government scholarships or partial government financing. It is also observed that in our sample not a single student in technical education is female.
Final year higher education students
O u t of a total of 500 students covered by the survey, 453 responded. Four hundred and forty cases were valid, of which 78.3 per cent were males and 21.7 per cent females. They constituted approximately 10 per cent of the total final year enrolment in higher education in Sudan. Total enrolment in 1979 was approximately 27,000, of which 20 per cent females and 80 per cent males.
By province, type of secondary school attended, institution (grouped into major fields) sex, age, etc., the distributions are shown in Tables III.5 to 111.9 in the Annex. It can be seen from Table 111.5 that the majority of students pursuing university education are male, belong to the age group 20-24 (although a substantial proportion, i.e. 46 per cent, c o m e from the 25 plus group), are single, and c o m e from government schools.
Graduates
Out of a total of 500 graduates covered by the survey, 348 responded. In addition to overall characteristics such as field of study, field of work, age, sector of employment, the following are worth noting: distribution of graduates by broad field of interés* (art, science and others), by place of birth, sex, age, marital status, etc. (see Tables 111.10 to III.13 in the Annex )
T h e sample of graduates shows a reduction in female representation a m o n g the graduates at 16 per cent and also a reduction in the representation of those from rural areas at only 33 per cent, whereas the student population is more evenly distributed. Most of the graduates of our sample belonging to the classes of 1967-74, the progress in recent years is not reflected. T h e majority of the graduates work in the government sector (79 per cent), and graduated in arts-based subjects.
51

From college to work: the case of the Sudan
Employers
O u t of 100 employers covered by the survey, 79 responded: 41 of them were government, 29 semi-government and 9 private employers. T h e y distribute as shown in Annex Table 111.14 to different criteria such as full-time and part-time employees, sector and type of control. It can be observed that 43 per cent of the employers belong to the small-size group having less than SO full-time workers, and 54 per cent belong to the services sector. It is also observed that small- size firms have m o r e part-time workers.
Some characteristics of the samples
It could be observed from the analysis of cross-classification that:
(a) A m o n g the final year secondary students, the female students are m o r e from urban than rural areas, whereas for male students the opposite is the case. T h e association between place of birth and the sex of the student is statistically significant;
(b) Male students are financed by government to a larger extent than female students. Source of finance has a statistically significant association with sex;
(c) Types of courses followed are associated with the sex of the student. Female students take academic streams in a higher proportion than male students. N o n e of the female students in the sample followed technical streams, which would at least indicate that technical streams are less popular with female students.
(d) Female participation in final year of higher education is proportionally lower in Central province and highest in the K h a r t o u m area.
(e) T h e parents/guardians of most (88 per cent) of the final year students work in the government sector, and those of female students work in larger proportion in the private sector than in other sectors. T h e situation is the reverse for male final year higher education students.
(f) There are m o r e female students in the age-group 20-24 than male students. T h e m e a n age of final year female students is less than that of the male students.
52

Surveys of students, graduates and employers
(g) The proportion of females in the graduate sample is less than in the final year higher education student sample. This is because with time female participation in education is increasing.
(h) The proportion of graduates from rural areas is also less than that a m o n g final year higher education students. Seventy-nine per cent of the graduates work in the government sector, 14 per cent in the semi-government sector and the remainder in the private sector. This represents more or less the national employment market of the graduates.
(i) The highest discrepancy between field studied and field of work is evident a m o n g the arts graduates.
(j) There is no strong statistical association between sex of the graduate and the expected and actual field of study; nor is there any association between place of birth and the type of study (broadly grouped as science-based and arts-based).
53

III. T h e educational context preparing for higher education
It is essential to give some attention to the secondary level education since it supplies higher education with students. This is a general practice, with s o m e exceptions like Tanzania where admission to higher education is based in addition on work experience, and s o m e other countries where national service is required before admission to higher education. A s it is the only source of students for higher education in Sudan, one has to give consideration to this area in order to take into account all the aspects to be included in planning, innovating, readjusting, reforming, and renovating higher education admission policy, programmes, etc., with special reference to the changing needs of the socio-economic set-up of the country. Although a developing country, Sudan is facing similar problems to those of developed countries in differing forms and intensity (inflation, u n e m ployment a m o n g educated people, under-employment, etc.). Nowadays, secondary school students have formed their o w n conception of higher education, and in particular that m o r e education brings m o r e opportunities, better living conditions and in general better social, cultural and economic advantages. Students of secondary education realize today that it is important to have higher education for a better career and way of life.
Characteristics of the final year secondary education students
Y o u n g people tend still to believe that education is the means to change their way of life, which is true in a developing country like Sudan where illiteracy is still high. Therefore educated youth tend to want to have access to more education even if their financial and social situation does not contribute automatically to this attitude or aspiration. Parents with little formal academic background are not generally able to provide their children with counselling or advice as far as education is concerned. Nevertheless, they are often ready to m a k e whatever sacrifices necessary to give their children the opportunity of access to more education. In this respect, w e must be concerned with a series of questions which could help to clarify some of the problems related to education and attempt to find
54

The educational context preparing for higher education
the corresponding solutions. W h y do they continue to study? W h a t type of secondary programmes do they engage in? W h a t are the reasons for their choice? W h e r e do they obtain financing? These questions were put to the students of final year secondary education surveyed, in order to obtain more and better knowledge on their expectations about higher education, with special reference to the employment context.
A m o n g the 827 respondents, 78.5 per cent were financially supported by the government, against 18.3 per cent w h o received partial assistance from the government and 3.2 per cent w h o had financial support from private sources (1 per cent, i.e. 8 students, did not respond concerning their financial sources).
Looking at the distribution of these final year secondary school students from the point of view of their financial support, the analysis shows that 53.5 per cent of the respondents receiving government financial support came from urban areas against 46.5 per cent from rural areas (of the total sample, 58.5 per cent of students were from urban areas and 41.1 per cent from rural areas). Amongst those receiving partial government assistance, 74.5 per cent were from urban and 25.5 per cent from rural areas. A s for those financed from private sources, 84.6 per cent were from urban and 15.4 per cent from rural areas. There is a high degree of association between the type of financial support and the place of birth (Chi-square = 29.53 with 2 D F ) .
Amongst the students from rural areas, w e note that a larger proportion are supported by the government, namely 87.6 per cent, with 11.2 per cent receiving partial government assistance and 1.2 per cent financed through private sources, whereas amongst urban-born scholars it is 72.1 per cent, 23.3 per cent and 4.6 per cent respectively.
F r o m the point of view of the place of birth, the analysis also shows a high degree of association with the school type and the academic stream (Chi-square = 48.06, 11.56 with 2 D F respectively.
It is observed that the proportion of urban students going to academic schools is higher than a m o n g rural students. The rural students follow arts and mathematics courses more often than the urban students.
A m o n g female students, 71.8 per cent are financed through the government, 22.8 per cent through partial government assistance and 5.4 per cent through private sources, whereas for males it is 83.1 per cent, 15.3 per cent and 1.6 per cent respectively . O f those students financed through government sources, 62.2 per cent are males and 37.2 per cent females, whereas for those receiving partial government assistance it is respectively 49.3 per cent and 50.7 per cent, and for private sources of financing 30.8 per cent and 69.2 per cent respectively. This shows that male students are favoured by government financing.
Out of the total number of female students, we note that 95.2 per cent are in academic schools, whereas for males it is only 80.0 per cent; the proportion of females is nil for technical schools but 4.8 per cent in
55

From college to work: the case of the Sudan
commerce, as compared to 10.0 per cent and 9.8 per cent for boys respectively. A m o n g girls, only 6.3 per cent are in mathematics courses compared to 53.3 per cent in biology and 40.3 per cent in arts, whereas for boys it is respectively 17.2 per cent, 44.3 per cent and 38.5 per cent. This shows a better distribution by type of school and academic stream for boys than for girls w h o concentrate in academic schools and biology for the stream. It is interesting, however, to note that girls and boys enrol in biology in almost equal numbers, which is not the case for arts where the proportion of girls is higher than boys. O n e can note the segmentation of the labour market already starting at secondary school in the choice of courses for boys and girls.
Reasons for choice of type of education
As to the reasons for the type of education undertaken, secondary education students were asked to indicate what was the basis for their choice. They were given a set of reasons that could have influenced their choice of type of school and stream.
The analysis shows that 'personal interest' comes first with 74.4 per cent followed by 'better chance to get higher education' with 11.2 per cent; 'academic performance' with 8.7 per cent; 'better chance for employment after completion of higher education' with 2.9 per cent; 'better chance for employment after completion of secondary education' with 2.1 per cent and 'friends' influence' with 0.5 per cent; 'family preference' comes last with 0.1 per cent.
It appears that final year secondary students engage in programmes or types of education on the basis of personal interest rather than academic record or family influence and career opportunities. This could indicate a lack of information on career possibilities. Also the family does not appear to have m u c h influence in deciding on the educational career of their children. Another possible explanation is that the factor 'personal interest' is a compound variable which would cover not only study for its o w n sake but career aspects as well. It should be mentioned that only 20-25 per cent of final year intermediate are selected for secondary education.
There is a degree of association between reasons for choice of type of education and sex (Chi-square = 21.12 with 6 D F — significant at 0.1 per cent level), school type (Chi-square = 133.17 with 12 DF—significant at 0.0001 per cent level), region (Chi-square = 19.18 with 6 DF—significant at 0.3 per cent level), etc. (Tables IV.1 to IV.11 in the Annex to this chapter).
A s a reason for choosing the type of education, 'personal interest' is given by females more than by males, by those students in academic schools rather than those in technical or commercial schools, and by students from urban areas rather than rural. 'Employment opportunities'
56

The educational context preparing for higher education
is considered a m o r e important criterion by those students attending technical schools than those in academic schools.
The information mechanisms for higher education
Before examining what the secondary school students expect after, they have completed their programmes, it is important to look at the information mechanisms available for their guidance and counselling. They were asked whether they were able to get sufficient information concerning higher education. T h e majority of the students (61.6 per cent) considered that they were being properly informed. A s to their sources of information, the distribution is given in Table 16.
Table 16: Source of information on higher education
Educational Friends and Sources Teachers authorities Media relatives Other
Adjusted Percentages 21.8 7.0 14.3 16.4 2.1
It is observed that 39.4 per cent of the total student population surveyed consider they do not obtain enough information on higher education possibilities. O f those w h o were satisfied that they had received sufficient information, it seems that teachers and friends and relatives were the main sources. This is indicative of a weakness in the formal set-up in providing career information, the educational authorities playing a very minor role.
Availability of information does not vary according to the sex of the students. A m o n g females a proportion of 55.9 per cent think they get sufficient information compared to 44.1 per cent w h o think they do not, whereas for males the proportions are respectively 56.9 per cent and 43.1 per cent. O f the total respondents receiving information, males represent 33.9 per cent and females 22.6 per cent. B y school type w e note that those in academic schools form the highest proportion with 87.7 per cent, followed by technical with 6.2 per cent and commerce 6.0 per cent for the positive responses, which are m o r e or less the same as the proportion of students in these institutes and therefore do not m a k e any significant difference.
In the academic stream w e note a higher proportion a m o n g the positive answers with biology 49.4 per cent, followed by arts 39.4 per cent, and mathematics 11.2 per cent. A m o n g the students in mathematics, 52.3 per
57

From college to work: the case of the Sudan
cent considered that they had received sufficient information and 47.7 per cent did not, in biology 59.2 per cent and 40.8 per cent, and in arts 57.7 per cent and 42.3 per cent respectively. According to school finance, 55.6 per cent of those students w h o were government financed considered that they obtained sufficient information, and of those receiving partial government assistance, 57.6 per cent. Students financed through private sources appear more satisfied with career information obtained, with 69.2 per cent. Further analysis of each source of information can be summarized as follows:
Teachers
A m o n g those w h o mentioned 'teachers' as the source of information, 65.5 per cent were males and 34.4 per cent females, which is 41.7 per cent and 33.3 per cent of the respective total samples and 25.2 per cent and 13.2 per cent of the total respondents.
According to place of birth, 60.9 per cent of the respondents were urban-born and 39.1 per cent from rural areas, and 23.3 per cent and 15 per cent of the total respondents.
By school type, w e note 84.4 per cent of the students giving this source are in academic, 6.1 per cent in technical and 9.4 per cent in commerce, whereas by academic stream w e find 3.9 per cent in mathematics, 47.4 per cent in biology and 48.7 per cent in arts.
A m o n g those w h o considered that information was adequate, 75.6 per cent were financially supported by the government, compared to 20.6 per cent partially government-assisted, and 3.9 per cent through private sources.
Educational authorities
O f those students w h o obtained information from the educational authorities, 79.3 per cent were male and 20.7 per cent female. According to place of birth, w e note that 55.2 per cent were from urban areas and 44.8 per cent from rural areas.
By school type, 81.0 per cent were in academic schools, 15.1 per cent in technical and 3.4 per cent in commercial schools, whereas by academic stream 17.0 per cent followed mathematics, 48.9 per cent biology, and 34.0 per cent were in arts.
A m o n g those w h o obtained information from this source, 72.7 per cent were financed by the government, 21.8 per cent through partial government assistance and 5.5 per cent through private sources.
58

The educational context preparing for higher education
Mass media
Mass media were slightly m o r e popular as a source of career information among females than males. A m o n g those w h o cited this source, 48.3 per cent were males and 51.7 per cent females, being 12.2 per cent and 13.0 per cent of the total respondents. By place of birth, 61.9 per cent were from urban areas and 38.1 per cent were rural-born.
According to school type, we find 90.7 per cent in academic, 3.3 per cent in technical and 5.9 per cent in commercial schools, forming 22.8 per cent, 0.9 per cent and 1.5 per cent of the total respondents respectively; whereas by academic stream, 13.1 per cent were in mathematics, 49.5 per cent in biology and 37.4 per cent in arts, forming respectively 3.4 per cent, 12.9 per cent and 9.7 per cent of the total respondents.
As for school finance, w e note 76.1 per cent were financed by the government, 18.8 per cent through partial government assistance and 5.1 per cent through private sources, representing respectively 19.2 per cent, 4.8 per cent and 1.3 per cent of the total respondents.
Friends and relatives
Similarly with this source of information, w e note that of those w h o responded positively concerning the adequacy of information received, 52.2 per cent are males and 47.8 per cent are females, forming 15.1 per cent and 13.9 per cent of the total respondents. For place of birth, 69.1 per cent were urban and 30.9 per cent rural-born, representing respectively 20.1 per cent and 9.0 per cent of the total respondents.
By school type, 90.4 per cent were in academic schools, compared to 2.9 per cent in technical and 6.6 per cent in commercial schools, this being respectively 26.2 per cent, 0.9 per cent and 1.9 per cent of the total respondents; whereas according to stream, 13.7 per cent were in mathematics, 50.8 per cent in biology and 35.5 per cent in arts, i.e. 4.1 per cent, 15.3 per cent and 10.7 per cent respectively of the total respondents.
By type of financing, 83.3 per cent were government financed, 14.4 per cent received partial government assistance and 2.3 per cent were privately financed, being respectively 23.8 per cent, 4.1 per cent and 0.6 per cent of the total respondents.
Expectations of secondary students in respect of higher education
This section is devoted to the expectations of secondary school students after completion of their courses, in an attempt to give some light on what these students expect to do when they have ended the secondary education cycle. For this purpose a specific question was included in the questionnaire administered to the students.
59

From college to work: the case of the Sudan
It was revealed that a m o n g the 827 respondents.only 4.8 per cent expect to go to work, whereas 84.2 per cent expect to go on to university education and 11 per cent to higher education in technical institutions. T h e second group was requested to indicate the desired place of higher education and the reasons for their choice. A m o n g them, 62.4 per cent think they will follow higher education in the Sudan and 37.5 per cent abroad. For those w h o mentioned their wish to study higher education abroad, the reasons given (allowing multiple responses) were as follows:
(a) Lack of places in Sudan: 41.0 per cent
(b) Field of study not available in Sudan: 22.9 per cent
(c) Personal interest: 39.4 per cent
It is observed that non-availability of field of study in Sudan is not the main reason for wishing to study abroad.
T h e analysis carried out on the basis of students' wishes after completion of their secondary school shows that a m o n g those w h o expect to go to work 47.5 per cent are males and 52.5 per cent females, representing 2.3 per cent and 2.5 per cent of the total respondents. For those intending to go on to university, 57.3 per cent are males and 42.7 per cent females, i.e. respectively 48.2 per cent and 36.0 per cent of the total respondents. Amongs t those w h o intend to go to higher technical institutions, w e note 81.3 per cent males and 18.7 per cent females, this being 9.0 per cent and 2.1 per cent respectively of the total respondents. B y place of birth, school type, academic stream and school financing, the analysis is summarized in Table 17.
It is to be noted that all categories have the highest percentage a m o n g the students intending to go for university (Tables IV.12 to IV.15 in the Annex). However , tables IV.12 to IV.15 could also demonstrate that sex, age, place of birth and career followed have a statistically significant association with the type of post-secondary career the students would wish to follow. It is observed that girls are m o r e attracted towards work or university than boys, w h o are m o r e attracted towards the technical institutes than the girls. Younger students are m o r e inclined towards university education and older students to technical institutions and work. Urban students are m o r e attracted towards university than those from rural areas students and the situation is the opposite as far as work and technical institutions. Students following arts courses are m o r e attracted towards work than those following science courses. In brief, it can be said that boys of urban origin, of the age group 15-17, and following science courses are those of the final year secondary students w h o expect to follow university courses after post-secondary education.
60

The educational context preparing for higher education
Table 17: Distribution of secondary students career expectations by different characteristics
Technical W o r k University institutes
42.5 (2.1) 57.5 (2.8)
64.1 (3.0) 12.8 (0.6) 23.1 (1.1)
4.0 (0.1) 28.0 (1.0) 68.0 (2.4)
80.0 (3.9) 10.0 (0.5) 10.0
(0.5)
62.6 (52.7) 37.4
(31.4)
94.8 (80.2)
0.7 (0.6)
4.5 (3.8)
12.3 (91.4) 50.2
(47.6) 37.5
(34.9)
77.3 (65.0)
19.6 (16.5)
3.1
(2.6)
36.3 (4.0) 63.7 (7.0)
27.3 (2.9) 45.5 (4.9) 27.3 (2.9)
24.0 (0.8) 20.0 (0.7) 56.0 (2.0)
85.7 (9.5) 13.2 (1.5)
1.1
(6.1)
Note: Figures in brackets are percentage of the total respondents.
A s far as the place of higher education is concerned, the analysis gives the results summarized in the Table 18, showing that most students would like to follow higher education in the Sudan—except for arts students and those with private sources of financing. (See also Tables IV.16 and IV.17 in the Annex).
Table 18 also shows that a typical Sudanese with a higher probability to pursue higher education abroad is male, of urban origin, following
Place of birth: Urban
Rural
School type: Academic
Technical
Commercial
Academic stream: Mathematics
Biology
Arts
School financing: Government
Partial government assistance
Private
61

From college to work: the case of the Sudan
courses in commercial schools, having mathematics, and his secondary education financed by government.
Table 18:
Characteristics
Sex
Place of birth
School type
Academic stream
School financing
Preference concerning place
Male
Female
Urban
Rural
Academic
Technical
Commercial
Mathematics
Biology
Arts
Government financed
Partial government assistance Private
of higher education
Place — Sudan Abroad
55.3 (35.1) 44.7
(28.3) 57.3
(36.3) 42.7
(27.0) 13.5 (9.0) 52.7
(35.2) 33.1
(22.6) 90.9
(57.8) 5.4
(3.5) 3.7
(2.4) 81.4
(52.0) 16.5
(10.6) 2.1
(1.4)
Note: (Figures in brackets are percentages of the total respondents).
67.0 (24.5) 33.0
(12.1) 62.0
(22.7) 38.0
(14.0) 10.8 (3.6) 41.8
(13.9) 47.4
(15.7) 77.9
(28.3) 6.8
(2.5) 15.3 (5.6) 73.4
(26.5) 21.7
(7.8) 4.8
(1.7)
62

The educational context preparing for higher education
Mechanism for access to higher education
Information on the preferred mechanism for access to higher education would allow the educational authorities to examine the procedure for possible improvement. T w o main points have been kept as elements of reference. The first refers to the best time to apply for higher education, whereas the second refers to the best w a y to inform students about opportunities and conditions for admission to higher education, both local and abroad. T h e results could be summarized as follows:
Time: Before exams: 38.7 per cent After exams: 60.6 per cent
Best way: Issuing annual prospectus for a nominal fee: 42 per cent Through the admission authorities: 21.8 per cent Through the mass media: 14.3 per cent Through the teachers: 19.5 per cent N o reply or missing: 2.5 per cent
Despite the simplicity of this assessment, it is obvious that some measures have to be considered concerning the admission procedure for higher education. The measures need to be based on both a prospectus issued annually and through admission authorities in co-operation with teachers.
Analysis of the variables identified as being 'time to apply for higher education' and 'best way to inform students' has been carried out referring to other variables such as sex, place of birth, school type, academic stream and school finance, as reported below.
Time for applications for higher education
A s most students appear to consider the period after the examinations as the most appropriate time to apply for higher education—60.6 per cent against 38.7 per cent w h o prefer the period before the examinations—this issue deserves some attention.
W h e n w e look at this according to the variables specified above, w e note that a m o n g females 33.5 per cent are for the period before the examination and 66.5 per cent for the period after the examinations, (13.7 per cent and 27.1 per cent of the respondents respectively), whereas for males it is respectively 42.6 per cent and 57.4 per cent (being 25.2 per cent and 34.0 per cent of all the respondents). According to the place of birth, 36.4 per cent of the urban-born students are for the period before and 63.6 per cent are for the period after the examinations (i.e. respectively 21.4 per cent and 37.4 per cent of the total respondents); for the rural-born students, it is respectively 43.0 per cent and 57.0 per cent (i.e. 17.7 per cent and 23.5 per cent of the total respondents). A s before, sex, place of birth
63

From
co
llege to w
ork: the ca
se of the Sudan
c <L>
! H
r-; 'T
r-< CM
ri od
o
a
Na
o -«' <
£> O
-
O
Tf C
l
u U
•
*-
»
O
CO
I-CO
ca
S 2 •«ya? r-*>
^ O
'
O
v¿
<S
i-i
00 vO
O
00 ci
<n
\0 O
<N
.—
*o
r~
OfS
00
rJ -«a-
oo
.O
4> O
i
o.ï oo oo
li-1 0
0
O
~
r~ oo
"1
*~~ •*.
(N
O
00
o ^-
~ .-i es es
C
O
'^ CO
E
33 e Si
-5 <
CO
o 3
"O
UJ
Irt \0
•* *o
oo -q-
•*. '"i
o¿ wi
•<3- on
r- ->a-
o
•O
ír
. oo c>
o
</-) M- ro
!
•o
II c
_ CO
C
O
•° -v-
3
J5
U
V
c/j S iE
IB
•S
£
C0
fl)
u S!
< 3
c U
U
a.
2f
fl<
<2
o
CO
u
.£> C 3 60
1 64

The educational context preparing for higher education
and course followed have statistical association with the timing for application. A larger proportion of female students, of students from urban areas and those following arts courses consider that application for higher education should take place after the examinations (see Tables IV.18 to 1V.20 in the Annex.
Best way to inform students
Further analysis of how the students could be best informed about their future is summarized in Table 19.
It is noted that issuing an annual prospectus is considered the most important way of providing information. However, broken d o w n by the characteristics of the students, the popularity of the different methods of providing information shows some significant difference. Female students appear to prefer teachers as a source of information more than do males, and admission authorities less than the male students. Those from urban areas prefer the annual prospectus more, the admission authorities less, and teachers more than do rural students. Arts students have less preference for the annual prospectus, and more for teachers and the media than do students of mathematics and biology. See also Tables 1V.21 to IV.23 in the Annex).
65

From college to work: the case of the Sudan
Table III.1 Secondary school students (final year)
Sex
Male: Female: Missing
491 (59.4» 355 (40.5% 1 (0.14%)
59.4») 40.6»)
Age
15-17: 18-20: 21+ : Mean :
84 (10.2%) 668 (80.8t) 75 (9.1*) 19.04
Hace of birth
Urban: Rural : Missing:
School type
Academic: Technical : Commerce : Missing:
Academic stream
Mathematics: Biology: Arts Missing:
School financing
Government : fórtial Government assistance
Private: Missing:
484 (58.5% 340 (41.1% 3 (0.4%)
708 (85.6% 50 (6.0% • 64 (7.7% -5 (0.6%)
8 (10.6% 344 (41.6% 279 (33.7% 116 (14%)
58.7%) 41.3%)
- 86.1%) 6.1% ) 7.8% )
12.4%) 48.4%) 39.2%)
642 (77.6% - 78.4%)
151 (18.3% 26 (3.1% -8 (1.0%)
- 18.3%) 3.2% )
N.B. The second percentage given in the brackets is adjusted for missing cases.
66
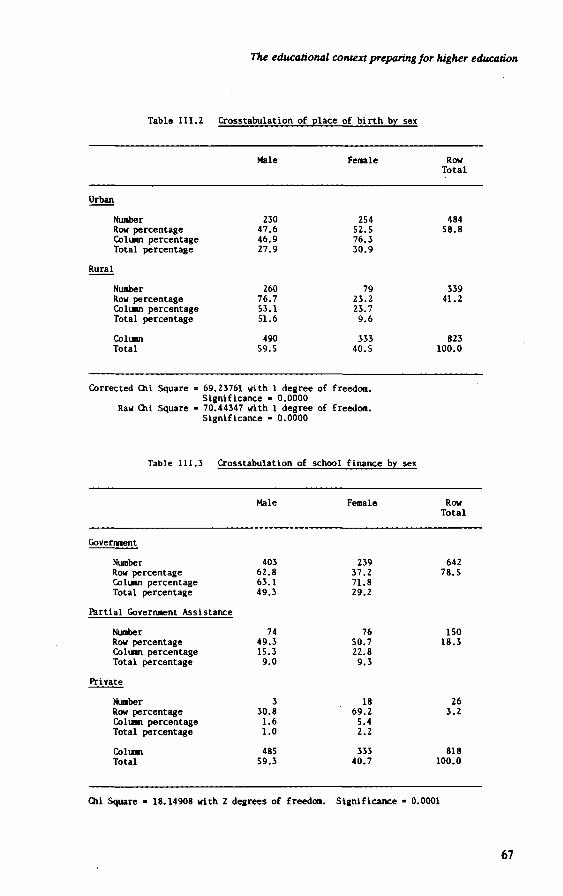
77te educational context preparing for higher education
Table III.2 Crosstabulation of place of birth by sex
Male Female Row Total
Urban
Number Row percentage Column percentage Total percentage
Rural
Number Row percentage Column percentage Total percentage
Column Total
230 47.6 46.9 27.9
260 76.7 53.1 51.6
490 59.5
254 52.5 76.3 30.9
79 23.2 23.7 9.6
333 40.5
484 58.8
339 41.2
823 100.0
Corrected Chi Square » 69.23761 with 1 degree of freedom. Significance - 0.0000
Raw Chi Square - 70.44347 with 1 degree of freedom. Significance • 0.0000
Table III.3 Crosstabulation of school finance by sex
Government
Number Row percentage Column percentage Total percentage
Partial Government Assistance
Number Row percentage Column percentage Total percentage
Private
Number Row percentage Column percentage Total percentage
Column Total
Male
403 62.8 63.1 49.3
74 49.3 15.3 9.0
3 30.8 1.6 1.0
485 59.3
Female
239 37.2 71.8 29.2
76 50.7 22.8 9.3
18 69.2 5.4 2.2
333 40.7
Row Total
642 78.5
150 18.3
26 3.2
818 100.0
Chi Square « 18.14908 with 2 degrees of freedom. Significance - 0.0001
67

From college to work: the case of the Sudan
sex
Academic
Number Row percentage Column percentage Total percentage
Technical
Number Row percentage Column percentage Total percentage
Commercial
Number Row percentage Column percentage Total percentage
Column Total
Male
393 55.6 80.0 47.9
50 100.0 10.2 6.1
48 75.0 9.8 5.8
491 59.8
Female
314 44.4 95.2 38.2
0 0.0 0.0 0.0
16 25.0 4.8 1.9
330 40.2
Row Total
707 86.1
50 6.1 6.1
64 7.8
821 100.0
Chi Square = 44.98485 with 2 degrees of freedom. Significance = 0.0000.
68

The educational context preparing for higher education
Table III.5 Final year higher education students
Sex
Male: 342 (77.7% - 78.3») (440: valid)
Female: 95 (21.6% - 21.7%) (440: total)
Marital status
Married: 26 (5.9% - 6.0%)
Single 397 (90.2% - 91.5%)
Divorced: 10 (2.3% - 2.3%)
Widowed: 1 (0.2% - 0.2%)
Missing: (6) (1.1%)
Religion
Muslim: 410 (93.2% - 94.3%)
Christian: 23 (5.2% - 5.3%)
Other: 2 (0.5 - 0.5%)
Missing: (5) (1.1%)
1st:
2nd:
3rd:
4th:
5th:
6th:
Miss:
Year
Lng
of study
1
1
85
214
65
15
59
N.B.: The second percen
Age
20-24: 22661.03%
25 - 29: 18543.4%
30+: 133.05%
Place of birth
Rural: 201 (45.7% - 42.3%)
Urban: 224 (50.9% - 52.7%)
Missing: (15) (3.4%)
Type of secondary school
Government: 381 (86.6% - 88%)
Semi-Government 24 (5.5% - 5.5%)
Private: 28 (6.4% - 6.5%)
Missing: (7) (1.6%)
Course duration
2 years: 3
3 years: 88
4 years: 246
5 years: 84
6 years: 17
Missing: 2
•B.: The second percentage given in the brackets is adjusted for missing cases.
69

From
colleg
e to work: the case of the Sudan
S3
Ü.5
to 6
.
•-H
CD
Cd
U
m
+J
.1-1 « e
>
*<S
2
CO U
>-. c
•y
•*
•'
e >
es
¡8*
I o at
O»
Ol
CM
•
IO
OO
f-
©
or-
*t rH
•
• •
OO Ir
tlA
f'
CM
• •
• co
t^ >o
O
O
*o
" • •
rH
l/>
O
NO
OH
OO r-t
00 •
U)
MO
N
1/llO
H
tO
^tt/itn
o
O
o vO
IO
CM
to
0\
Nin
N
00
00
<-i a>
cd
g
*j
i- fi
« (J
.H
cd C
>
i-H
t~
i—1
00
Oï
• •
• r^
oiH
C
M t-- C
M
^ lO
Ol
00
r- o
in
,
H
CVI CM
C
M
CM
<3> 0
0 l~-
oo
• •
• • ^r
CM
en
NO
OH
Ol
Ol O
0 OO
^-
CM
.-H
i-H
N©
i-l
4> 0
0 4>
Cd B
O
« ti «
OO
C
*J
cd
«
C
•y
.<->
*>
c u o
4>
«>
IM
r^
lO
NH
!—
!•
••
a> t~- t
CT
>
o»
o> o
CM
oo
CM
•
• •
HM
^ to
to
00 r-
t— •
oo
r-H
llll
s
J8
«
00 D
cd
DO
«> +¿ cd
U
BU
m
ue
•y u
C
D
e i->
u
CD
«
IM
a§
H
_ ™ *
I 5 Q
O
loiU
h
8 I 70

The educational context preparing for higher education
Table III.7 Crosstabulation of sex by type of secondary school
Government Semi
Government Private Row total
Male
Number Row percentage Collum percentage Total percentage
Female
Number Row percentage Column percentage Total percentage
Column Total
305 90.8 80.7 70.9
73 77.7 19.3 17.0
378 87.9
16 4.8 66.7 3.7
8 8.5 33.3 1.9
24 5.6
15 4.5 53.6 3.5
13 13.8 46.4 3.0
28 6.5
336 78.1
94 21.9
430 1Ò0.0
71

From
colleg
e to work: the case of the Sudan
72
M
P
O CT
> I-» rsi
r-
io
t/1 f-
r-l
rvî K
> O
4> OJ
C
E
to O
r- r
en %
o
r- •£>
^
H
•N
O
I« i-I
O
rsj
O
O
O
O
o
o
o
1 .
. .
r-j .
• •
i*i -
O
\0 Q
O
*t .
. .
NO
KJl
l/"> O
1-H
r- o
-» <J>
.-< i-H
O
(SI
Hi
no
I W
NN
Ol
HH
OO
N
r-I r-j
O
i L8.
_ P
o o
00 0)
« 00
00 C
*J o
ve
«u
« C
I-
O
V
I) h
U
O. d'
_ -8.
_ P
o
o

The educational context preparing for higher education
Table III.9 Crosstabulation of sex by age
20-24 25-29 30+ Row Total
Male
Number Row percentage Colunn percentage Total percentage
Female
Number Row percentage Column percentage Total percentage
Column Total
166 48.5 73.8 38.0
59 62.1 26.2 13.5
225 51.5
153 44.7 83.2 35.0
31 32.6 16.8 7.1
184 42.1
23 6.7
82.1 5.3
5 5.3
17.9 1.1
28 6.4
342 78.3
95 21.7
437 100.0
73

Front college to work: the case of the Sudan
Table III.10 Graduate sample characteristics
Place of birth Sex
j Urban
I Rural
j Missing I cases
| Total
1 No. | \
1 1 231 | 66.4
1 115 | 33
1 1
2 | 0.6 ! 1
348 |
1
Adjusted
66.8
33.2
-
I Male
| Female
I Total
No.
293
55
348
\
84.2
15.8
100
Marital status Religion
j Married
1 Single
| Divorced
1 Missing cases
1 Total 1
1 1 1 No. | t | Adjusted |
1 1 * 1 1 1 1 122 j 35.1 j 35.3 |
1 1 1 223 j 64.1 | 64.5 j
1 1 1 1 I 3.0 | 0.3 I
I 1 1 1 1 1
2 I 0.6 | |
348 | | 1
1 I I
1 1 1 1 1 Muslim
1 1 Christian
1 1 j Total
1
1 No. | \
1 1
336 | 96.6
1 12 3.4
1 1 348 | 100
1
Date of entry to higher education
1 I I I 61-66
I 6 7 - 7 4 I | 75-77
Total
No.
25
289
18
j Missing j 16 I I
I 348
7.2
83
5.1
4.6
Adjusted |j * II
r 7.5
87
5.4
Age
130-39
I 1140 § above II j| Total II
No.
215
125
348
61.8
35.9
100
74

The educational context preparing for higher education
Table III.10 (Contd.)
Field studied
Natural sciences
Engineering Ij technology
Health
Arts
Social sciences
Riysical education
Law
Business accounting
Agriculture
Veterinary science
Others
Missing
Total
No.
28
43
9
60
92
1
72
14
12
3
2
12
348
\
8.0
12.4
2.6
17.2
26.4
0.3
20.7
4.0
3.4
0.9
0.6
3.4
100
Adjusted \
8.3
12.8
2.7
19.9
27.4
0.3
21.4
4.2
3.6
0.9
0.6
100
No.
20
40
10
24
82
3
79
12
12
2
7
S7
348
Field of
*
5.7
11.5
2.9
6.9
23.6
0.9
22.7
3.4
3.4
0.6
2.0
16.4
100
work
Adjusted %
' 6.9
13.7
3.4
8.2
28.2
1.0
27.1
4.1
4.1
0.7
2.4
"
100
1 Sector of lemploy-jment
1 Govt.
1 Semi-1 govt.
1 Private
1 Other
1 Missing 1 cases
1 Total
No.
270
49
20
3
6
348
\
77.6
14.1
5.7
0.9
1.9
-
Adjusted * j
78.9 |
14.3 |
5.8 |
0.9 |
|
75

From college to work: the case of the Sudan
Table III.11 Crosstabulation of field of interest after secondary school by sex
Male Female Row Total
Science-based
Number Row percentage Column percentage Total percentage
Art-based
Number Row percentage Column percentage Total percentage
Others
Number Row percentage Column percentage Total percentage
Column Total
127
47. 39.
140 80.0
52 43.3
2 100.0
0.7 0.6
269 84.1
16 11.2 31.4 5.0
35 20.0 68.6 10.9
o o
o
o
o o
o
51 15.9
143 44.7
175 54.7
2 0.6
320 100.0
Chi Square » 4.94186 with 2 degrees of freedom. Significance - 0.0845
Table 111.12 Crosstabulation of field studied by sex
Male Female Row Total
Science-based
Number Row percentage Column percentage Total percentage
Art-based
Number Row percentage Column percentage Total percentage
Others
Number Row percentage Column percentage Total percentage
Column Total
86 90.5 30.4 25.6
195 81.6 68.9 58.0
2 100.0
0.7 0.6
283 84.2
9 9.5 17.0 2.7
44 18.4 83.0 13.1
0 0.0 0.0 0.0
53 15.8
95 28.3
239 71.1
2 0.6
336 100.0
Chi Square - 4.46293 with 2 degrees of freedom. Significance - 0.1074
76

The educational context preparing for higher education
Table III.13
Science-based
Nunber Row percentage Column percentage Total percentage
Art-based
Number Row percentage Column percentage Total percentage
Others
Number Row percentage Column percentage Total percentage
Column Total
Crosstabulat
Under 29
56 58.9 26.5 16.7
153 84.0 72.5 45.5
2 100.0 0.9 0.6
211 62.8
Chi Square • 2.43775 with 4 degrees of
ion of field
30-39
36 37.9 30.5 10.7
82 34.3 69.5 24.4
0 0
0.0 0.0
118 35.1
studied by age
freedom. Signifi
40+
3 3.2 42.9 0.9
4 1.7 57.1 1.2
0 0
0.0 0.0
7 2.1
icance - 0.1
Row total
95 28.3
239 71.1
2 0.6
336 100.0
3558.
77
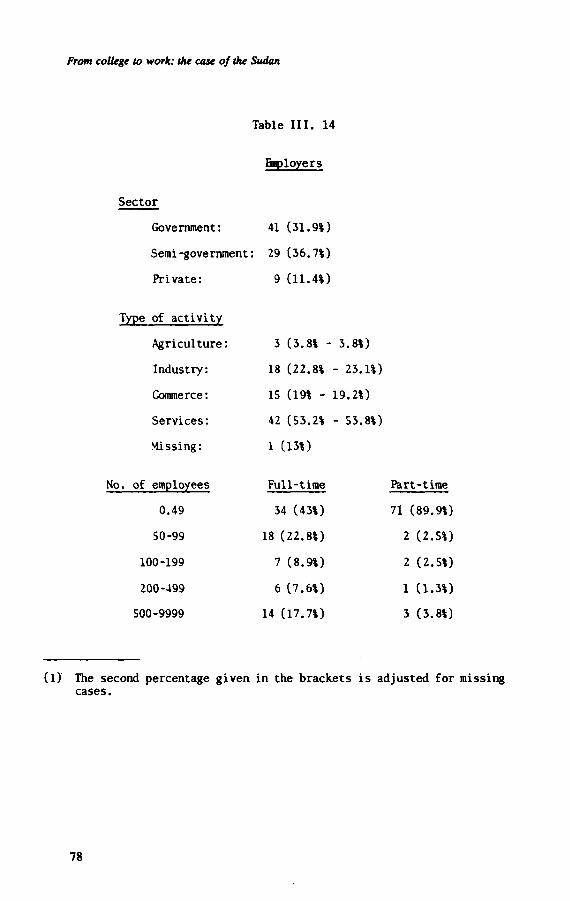
From college to work: the case of the Sudan
Table III. 14
Employers
Sector
Government: 41 (31.9*)
Semi-government: 29 (36.7*)
Private: 9 (11.4*)
Type of activity
Agriculture: 3 (3.8* - 3.8*)
Industry: 18 (22.8* - 23.1*)
Commerce: 15 (19* - 19.2*)
Services: 42 (53.2* - 53.8*)
Missing: 1 (13%)
N o . of employees Full-time Part-time
0.49 34 (43*) 71 (89.9*)
50-99 18 (22.8*) 2 (2.5*)
100-199 7 (8.9%) 2 (2.5*)
200-499 6 (7.6*) 1 (1.3*)
500-9999 14 (17.7t) 3 (3.8*)
(1) The second percentage given in the brackets is adjusted for missing cases.
78

IV. The world of higher education as perceived by the student
Developing countries face different types of problems concerning the access of young people to higher education after completion of their secondary education. In m a n y cases these problems have already appeared in the transition from primary to secondary level. According to the availability of opportunities, young people have to m a k e up their minds whether they continue on to higher education, and of what type, duration and the location, given the potential sources of financial support. In order to find out the factors that influence their decision and what reasoning they follow in giving shape to their decision, higher education students were asked about the reasons behind their educational career choices.
Choice of a specific field of study
Based on past experience in some other countries, a set of factors were selected which could have an influence on the pursuit of higher education. These factors, and the importance accorded to them by the students, are given in Table 20.
Since the different factors m a y be interdependent, the students were allowed to mark m o r e than one factor. The above results therefore give the frequencies of the responses to each of the factors. Personal liking for the field of study chosen, which is a compound factor covering all relevant items making the course likeable, scores the highest frequency, whereas wishing to follow friends in the same field had the lowest points. T h e field offering wide choice of future careers ranks second.
79

From college to work: the case of the Sudan
Table 20: Reasons for choosing field of study
Follow friends in the same field: Guardian's advice: G o o d employment opportunities
in this field: G o o d income: Wide choice of future careers: Social prestige: Enjoy the field: Other reasons:
N u m b e r of respondents
21 22
76 35
137 35
259 54
Rank
7 6
3 4 2 4 1
Desired field of study and actual course
T h e students were asked to indicate the field of study they wanted to pursue after high school, in order to compare this with the field of study actually followed. Table 21 gives the percentage distribution by field of study.
Table 21: Distribution by field of study desired and actually followed
Field of study
Social science and Humanities Art and Education Science and Medicine Engineering and Technology Agriculture Others
Field desired %
35.5 10.5 32.6 8.3 7.6 5.4
Course followed %
33.9 16.5 28.2 6.6
12.0 2.8
It is observed that social science and humanities was the most popular field of study, followed by science and medicine; agriculture was the least popular field. W h a t is striking is the realistic expectations of the Sudanese students. Although one would expect engineering and technology to be very popular because of career prospects, only one out of twelve students were interested in that field. Strict criteria for admission to this field reduces the expectations of the students.
80

The world of higher education as perceived by the student
The differences between the percentages expecting to undertake a field of study and actually pursuing a field of study are indeed insignificant, except in the case of agriculture and education/art. T h e percentage of respondents actually following these fields is higher than the percentage of respondents expecting to study in these fields. This is a reflection of the employment situation in these two fields of studies, which is rather bleak and career prospects are limited. O n e could note that the percentage of students admitted to engineering is the lowest, showing the limited number of places available for this field which results in strict competition.
Early career information of higher education students
T h e two approaches to educational planning, i.e. social demand and manpower approaches, have often been considered by educational planners as difficult to reconcile; the former is thought to emphasize individual demand for higher education, the second being considered the one which meets the economic needs of the society. T h e two approaches are however complementary in the sense that economic needs can be derived from individual demands for goods, services or living conditions. It is also believed that individual demands for higher education should be based on the social and economic needs of a country. For this purpose, a good information mechanism is necessary, which would enlighten students about the possibilities for different kinds of education.
If properly organized, the information service can be an integral part of the overall career guidance programme. T h e role of information on career possibilities is of great importance in the choice of an educational career by a student.
The higher education students were invited to indicate whether they had access to any career information which could have influenced the choice of type of higher education followed. T h e following sources of information available to students applying for higher education were considered: (i) admission office of the present institution; (ii) teaching staff of higher secondary schools; (iii) previous employment; (iv) friends, parents or relatives; (v) general information/mass media; (vi) other students; (vii) other. A m o n g the higher education students, 53.9 per cent indicated that they had received information on career possibilities before applying for higher education. Table 22 gives the sources referred to for this information. It is striking to note that 'friends, parents and relatives' were cited most frequently, whereas the admissions office played a very minor role. Those students w h o had received information on higher education were asked about the quality of such advice; only 46 per cent indicated it was satisfactory.
81

Front college to work: the case of the Sudan
Table 22: Sources of information on higher education
Admissions office: 20.1 Teaching staff of higher secondary school: 48.3 Previous employment: 8.6 Friends, parents, relatives: S3.1 General information, mass media: 43.5 Other students: 37.3 Other sources: 12.9
Reasons for pursuing higher education
T o a student w h o has successfully completed secondary education, two alternatives are available: either leave the education system and enter the e m p l o y m e n t market, or pursue post-secondary education and training (university or technical institute). In the choice of alternatives, several factors intervene. There can be pressures from the family to join the labour force, the possibility of not getting a place in the higher education system, indifference towards higher education, etc.
T h e following reasons were considered as to w h y a student might undertake post-secondary education or training: (i) obtaining specific professional qualifications; (ii) scholarship grant and incentives; (iii) study for its o w n sake; (iv) better e m p l o y m e n t opportunities for graduates; and (v) others. It was assumed that these factors influence the d e m a n d for higher education a m o n g the student population with variations according to the socio-economic background. Students were therefore asked to indicate which factors influenced them to continue to higher education. T h e responses are shown in Table 23.
Table 23: Factors influencing decision to pursue higher education
N u m b e r Adjusted
Obtaining specific professional qualifications: Scholarship grant, incentives: Study for its o w n sake: Better employment opportunities for graduates: Other factors:
188 17
139 67 11
44.5 4.0
32.9 15.9 2.6
82

The world of higher education as perceived by the student
W e note that 'obtaining specific professional qualifications' comes first, followed by 'study for its o w n sake', and 'better employment opportunities for graduates' comes third. 'Scholarship grant/incentives' does not play an important role as a reason for continuing to higher education. It is interesting that for the higher education students 'study for its o w n sake' ranks quite high (second) as the reason for pursuit of higher education. This seems to reflect the same attitude as for choosing a specific field of study, namely, 'enjoy the field'.
However deciding to pursue higher education is very complex, for the decision to continue on to higher education and the choice of a specific field of study are rarely explained by one single reason. As far as the student population is concerned, it appears from the above responses that the two main factors are obtention of professional qualifications and study for its o w n sake. Both these factors constitute m o r e than 75 per cent of the total responses of the students, while the remaining factors amount to less than 25 per cent. It is however worth noting the importance of the factor 'better employment opportunities' with only 15.9 per cent of responses, more or less the same as that for choosing a specific field of study discussed before.
A breakdown of the reasons for the choice of higher education by such characteristics as sex, h o m e region, area of secondary education, age, type of institution, shows that there is no association between the reasons for deciding to pursue higher education and these characteristics.
Reasons w h y students did not follow their desired field of study
A s w e had inquired about the reasons for choosing certain field of study, w e also attempted to find out w h y students did not follow the desired field of study. The students were asked to indicate which of the following reasons were responsible for this phenomenon: (i) lack of financing, (ii) unsatisfactory academic performance, (iii) family influence, (iv) better career information received later, and (v) other reasons.
A m o n g the higher education students w h o responded to this question, it would seem that the main reason w h y they did not follow the field of study they had originally desired was due to the fact that their academic performance had not been satisfactory (22.5 per cent); lack of finance and better career information received at a later stage c a m e as distant second and third reasons (8.2 per cent and 7.3 per cent respectively).
83

From college to work: the case of the Sudan
Higher education and internal migration
A s the Sudan is a very large country, the largest in Africa, it is interesting to look at the possible internal migration of people because of their desire to pursue higher education. Although in the past most higher education institutions used to be concentrated in the Greater Khartoum area, students were nevertheless requested to indicate whether they had m o v e d from their h o m e province to pursue higher education. Their responses are given in Table 24.
Table 24: Reasons for leaving h o m e area to attend a higher education institution
N o college in the area: 84.2% College in the area, but not satisfactory: 5.1% College in the area did not offer the course desired: 6.2% Parents wanted another college: 0.5% Other reasons: 4.0% (% adjusted for missing responses)
F r o m the above, it is clear that lack of colleges in the h o m e area is still the main reason for moving from the h o m e province to pursue higher education. T h e issue of migration in order to attend higher education institutions will be taken up again in the case of the graduates.
Adequacy of secondary education in the pursuit of higher education as perceived by the students
T h e students currently undergoing training in higher education institutions were asked whether they thought their secondary school studies had provided them with adequate background for pursuing their present course of study. It is very important to k n o w about this particular characteristic, although students might tend to over- or under-estimate the usefulness of their secondary education depending very m u c h on whether or not they are satisfied with their actual educational career. In responding to this question, there is always a possibility that they could have reacted according to their feelings or attitudes towards the course they are presently studying.
A s regards content, w e note that 75 per cent considered their secondary education to have been adequate or very adequate. A s for methods of teaching, about 66 per cent considered this to have been adequate or very adequate, as can be seen from Table 25.
84

The world of higher education as perceived by the student
Table 25: Adequacy of secondary education as regards content and teaching methods
Very adequate Adequate Inadequate Missing cases
No.
85 229 104 22
Content of study %
19.3 52.0 23.6 5.0
Adj .%
20.3 54.8 24.9
-
Method of teaching No.
64 196 134 46
% Adj.%
14.5 16.2 44.5 49.7 30.5 34.0 10.6
Further analysis showed that there did not appear to be any association between evaluation of content of study by the students and sex, origin, the employment sector, income and place of work of their parents, and type of secondary school attended. However w e note a degree of association between this evaluation and performance in the Secondary School Certificate (chi square = 15.31 with 8 D F ) . Concerning teaching methods, w e note an association between evaluation and type of secondary school (chi-square = 15.90 with 4 D F ) as well as with performance in Secondary School Certificate (chi-square = 21.42 with 8 D F ) .
Broken d o w n by age groups the analysis gives the following results. Those in the age-group 20-24 w h o thought it was adequate form 36.1 per cent of the total respondents, compared with 34.1 per cent in the age-group 25-29 and 5.0 per cent in the age-group 30 and above.
By origin, out of the total respondents, 37.4 per cent w h o considered the secondary school content to be adequate came from urban areas, compared to 37.7 per cent w h o were of rural origin.
As far as methods of teaching are concerned, the analysis reveals that of the total respondents in the age-group 20-24 (51.0 per cent of the total), 35.8 per cent felt these were inadequate compared to 64.1 per cent w h o considered them adequate. For the age-group 25-29 (42.8 per cent of the total respondents), 33.3 per cent considered the teaching methods inadequate against 65.7 per cent w h o felt that they were adequate. In the age-group 30 and above, it was respectively 24.0 per cent and 76.0 per cent.
Reactions to the course currently pursued
After analyzing the students' reactions towards their secondary education and their employment expectations, it is interesting to examine whether the students are satisfied with their actual course with regard to career objectives and personal interests. T h e responses are given in Table 26 It appears that there is considerable satisfaction amongst the students insofar as their
85

Front college to work: the case of the Sudan
present course of study is concerned: 84 per cent are satisfied with the course for meeting career objectives and 77.5 per cent satisfied for personal interests.
Table 26: Satisfaction with course currently followed
No. % Adj.% No. % Adj.%
Very satisfactory Satisfactory Unsatisfactory Missing cases
101 226 62 51
23.0 51.4 14.1 11.6
26.0 58.1 15.9
-
108 201 90 41
24.5 45.7 20.5 9.3
27.1 50.4 22.6
-
Financing of higher education
The students were asked to indicate the source of financing for their higher education. It appears that the family and the government finance to an equal extent nearly 67 per cent of the total respondents, which with higher education authorities makes almost 95 per cent. Non-government and other sources have a negligible role with only 4.9 per cent. State financing (government and higher education institutions) represents 62 per cent, which shows that higher education is very m u c h supported by the state. Table 27 gives the responses of the students concerning their sources of financing.
Table 27: Source of
Government Higher education institutions Other non-government Family Other Missing cases Total
financing of higher
No. 143 122
6 144 15 10
440
education
% 32.5 27.7
1.4 32.7 3.4 2.3
Adj .% 33.3 28.4
1.4 33.5 3.5
-
86

The world of higher education as perceived by the student
Mobility within the educational career
T h e aspects of lhe mobility during the educational career of a student are of various types. Starting from the possibility that a particular student has m a d e an unsuitable choice for his or her aptitudes and capabilities, w e can c o m e to the possibility which simply consists of the flexibility of the system that would allow any individual to find his or her o w n way towards an assured success. Between these two possibilities there is place for other reasons which could be personal, social, and economic. Whether any higher education system can realistically allow for changes during a student's educational career or not is of great importance to investigate. A n y mobility during a student's educational career, whatever the individual's interests, has also some negative aspects, such as time wasted, financial and h u m a n resources wasted for both the individual and the institution, etc., and attempts to reduce such mobility should be m a d e . W e have analyzed this in a very limited way, namely whether the students would have changed their field of study if more detailed information had been available to them. As shown in Table 28 59.8 per cent would not have done so even if m o r e information had been available, against 21.2 per cent w h o would have done so, and 19.0 per cent w h o did not have an opinion.
It is evident that a significant n u m b e r of students give importance to receiving better career information in order to m a k e the right choice of subjects.
Table 28: Change in field if m o r e information available
Yes N o N o opinion Missing Total
No. 87
245 78 30
440
% 19.8 55.7 17.7 6.8
Adjust.% 21.2 59.8 19.0
-
Employment status of the students
A n item was included in the questionnaire to find out h o w m a n y of the students were working whilst pursuing higher education. The majority of the students in the sample were not working (73.6 per cent), whereas 17.3 per cent were paid employees, 4.8 per cent self-employed, and 4.3 per cent unpaid family workers (116 out of 440 are employed).
87

From college to work: the case of the Sudan
Looking at the type of employment, the analysis shows that 12.5 per cent were full-time employees, 9.1 per cent part-time and 5.5 per cent occasional workers (including during vacation). The distribution of these working students according to different characteristics is discussed below.
O f those w h o declared themselves as employed, by age w e note that 65.5 per cent are paid, 18.1 per cent self-employed, and 16.4 per cent unpaid family workers. Out of the students w h o belong to the category of paid employees, 44.7 per cent are in the age-group 20-24, 44.7 per cent in the age-group 25-29 and 10.5 per cent in the age-group 30 and over, whereas a m o n g those that are self-employed w e note respectively 57.1, 23.8 and 19.0 per cent. In the category of unpaid workers, w e have respectively 57.9 per cent, 42.1 per cent and 0.0 per cent for the different age-groups. W e note therefore that working students tend to belong to the younger age;group. O f the students w h o work, 76.5 per cent are male, distributed as follows: 64.8 per cent as paid employees, 14.8 per cent self-employed, and 20.5 per cent unpaid family workers. Amongst the 23.5 per cent of employed female students, 66.7 per cent are paid, 29.6 per cent self-employed and 3.7 per cent unpaid family workers. (See Tables V.l and V.2 in the Annex to this chapter). Students of urban origin w h o are employed represent 52.3 per cent of the total that work, compared to 47.7 per cent of village origin.
Higher education for rural areas
A s already mentioned, one of the reasons for migration from rural to urban areas is the absence of institutions of higher education in rural areas. It is therefore necessary to k n o w what would encourage return to rural areas after graduation. The students were asked to indicate the reasons that would encourage them to accept employment in rural areas, as well as reasons which might discourage them from working in rural areas. T h e results are given in Table 29 (allowing for multiple responses).
It appears that the opportunity to assist the rural areas is the main reason for students to be willing to accept work in rural areas (42 per cent), followed by ' h o m e in rural areas', and 'low cost of living'. Possible financial incentives or lack of promotion prospects were not accorded m u c h importance by the students.
A s for reasons which could discourage working in rural areas, lack of opportunities for further studies comes first with 51.4 per cent of the respondents, followed by communication and transport difficulties with 22.5 per cent. O u r analysis shows that there is a strong association between reasons that discourage working in rural areas and field of study, institution and sex.
D u e to the regionalization policy of the government, m o r e opportunities will become available to serve the rural areas. If facilities for further
88

The world of higher education as perceived by the student
Table 29: Factors which would encourage or dissuade students concerning employment in rural areas
No. Factors encouraging employment in rural areas:
H o m e in rural area Financial incentives Promotion prospects Chance to assist the rural areas L o w cost of living Other
Reasons discouraging employment in rural areas:
Lack of tap water, electricity, etc. Communication/transport difficulties Separation from friends and relatives Dull life N o scope for improving competence Possible delays in promotion Lack of opportunities for further studies Other
153 4? 32 185 126 52
34.8 10.7 7.3
42.0 28.6 11.8
59 99 50 94 71 33 226 36
13.4
22.5 11.4 21.4
16.1 7.5
51.4 8.4
studies through correspondence or other m e a n s could be provided, there would not be m u c h problem of finding higher education graduates to work in the rural areas.
Factors that contribute to job satisfaction and meet career objectives
W e have already seen that students in the Sudan undertake higher studies mostly to obtain professional qualifications or because they enjoy studying. In meeting their expectations to s o m e extent, the country can m a k e the best use of h u m a n resources available. With this in mind, students were asked to consider certain factors identified as contributing to job satisfaction. T h e results of the analysis are given in Table 30 (allowing for multiple responses).
W e note that use of special talents is the most important factor with 69.8 per cent of the respondents, the least important being travel opportunities with 16.4 per cent.
89

From college to work: the case of the Sudan
Table 30: Factors contributing to job satisfaction
Factors
Use of special talents Scope for using initiative Creative work Opportunity for further studies Improve competence Helpful to others Good income Travel Better prospects Secure future Time for family and hobbies Good working environment Self-fulfillment
N o .
133 67
188 270 107 199 184 72 76
153 79
120 182
%
69.8 15.2 42.7 61.4 24.3 45.2 41.8 16.4 17.3 34.8 18.0 27.3 41.4
Looking at the cross-tabulation of these factors with other variables such as sex, institution, province, etc., w e note that there exists s o m e association. The strongest association is between factors and field of study (chi-square - 142.13 with 60 D F ) (see Table V.3 in Annex), and institution (chi-square = 230.5 with 108 D F ) . Self-fulfillment appears to be the most frequently cited single factor for all the fields of studies; good income is an important factor for students of engineering; use of talents, creative work environment, and initiative do not c o m e out as important factors.
Expected occupation, educational career and socio-economic characteristics of the students
A s soon as a student has decided to continue on to higher education, the next question is the type of higher education to be chosen with a view to meeting career objectives and personal interests of the student. Within the overall objectives for the pursuit of higher education, different occupations envisaged and their specific characteristics m a y influence the choice of the field of study. W e m a y assume that the flow from education to occupation depends upon the expected choice of occupation. S o m e jobs are highly skilled, with an almost one-to-one correspondence, others do not require specific skills, and substitution between education and occupation is possible to a certain extent. For certain types of employment any higher education degree is suitable from the point of view of employers.
90

The world of higher education as perceived by the student
Knowledge of the expected occupation of a student and actual educational career is important in that it enlightens us concerning the possible degree of substitution between education and occupation, which m a y be useful for translating m a n p o w e r forecasts into educational intakes.
It appears that the majority of the students surveyed (77.6 per cent) expect to seek employment in an occupation related to their major field of study, against 14.4 per cent w h o d o not expect to do so; 5 per cent expect to seek employment related to their field of study although not p e r m a nently, and 3.1 per cent were undecided.
Those students w h o do not expect to be permanently employed in their present field were asked to indicate the reasons that m a k e them continue to study in this field. Table 31 gives their responses.
Table 31: Reasons for continuing field of study although not expecting to be permanently employed in that field
This field gives good career prospects: 13.7% Enjoy the field: 41.6% This field gives a wider choice of future career: 29.2% It was a mistake to choose this field, but it is too late to change: 15.5%
A s for students w h o intend to seek permanent employment related to their field of study, the analysis according to sector of employment is given in Table 32 Although, the number of students that are undecided is quite high, the attraction to the government sector is noticeable.
Table 32: Sector of expected permanent employment
Government: Semi-government: Private: Abroad: Undecided: Total
211 23 63 24 119 440
48% 5.2% 14% 5.5% 27%
91

From college to work: the case of the Sudan
106 158 94 23 38 21
440
24.1
35.9 21.4 5.2 8.6 4.8
25.3 37.7 22.4
5.5 9.1
Expected waiting period after graduation
The-students were asked h o w long they expected to wait after graduation before finding a job. The responses are given in Table 33 from which w e note that 63 per cent of the students think that there will be either no waiting period or it would be less than 3 months. Only 9 per cent expect to wait more than 12 months for a job.
Table 33: Expected waiting period to find a job after graduation
N o . % Adj.%
N o waiting: Under 3 months: 3-6 months: 6-12 months: Above 12 months: Missing: Total
Analyzed by specialization (grouped by category) there appears to be a high degree of association between the expected waiting period and the specialization. T h e chi-square of 169.29 with 39 D F is very significant at .0001 level. L a w and arts students expect to wait the longest period to obtain a job after graduation, whereas engineers, scientists and health professionals expect to wait the shortest time.
The 264 respondents (63 per cent) w h o foresee a waiting period not exceeding 3 months after graduation are distributed as shown in Table 34.
Table 34: Estimated waiting period not exceeding 3 months after graduation, by specialization
Engineering: 82.9% Sciences: 50.0% Social sciences: 65.3% Humanities and arts: 49.4% Health: 79.2% Education and teacher training: 90.9% Business and commerce: 54.2% Agriculture: 72.6% Law: 11.1%
92

The world of higher education as perceived by the student
It is interesting to note that those specializing in teacher training and education are the least worried about obtaining jobs, followed by engineers, health professionals and students in agriculture. In respect of the latter, it seems that they are not very well informed of the unemployment situation in the agricultural sector as reflected in the statistics of the public sector recruitment board.
W h e n broken down the analysis shows that duration of waiting is not dependent upon the sex of the respondents.
Age-wise, the analysis shows that the higher the age, the less is the expected waiting period. O f those w h o do not expect to wait for a job, 19.4 per cent are in the age-group 20-24, 28.4 per cent in the age-group 25-29, and 53.8 per cent in the age-group 30 and above. For the expected wait of 3 months or less (37.7 per cent of the respondents) it is respectively 42.9 per cent, 33.5 per cent and 23.1 per cent for these age-groups. In the category 6-12 months (5.5 per cent of the respondents), it is 6.0 per cent, 5.7 per cent and 0.0 per cent respectively for these age-groups. Finally, in the category 12 months and over waiting period (9.1 per cent of the respondents), 10.6 per cent are in the age-group 20-24, 8.0 per cent from the age-group 25-29 and 3.8 per cent from the age-group 30 and above.
W e note an association between 'marks in Secondary School Certificate' and expected waiting period (chi-square - 32.89 with 16 D F significant at 10 per cent level) and between 'course duration' and expected wait (chi-square = 92.65 with 16 D F significant at 1 per cent level), as well as with 'financial support', 'institution', 'field desired', and''field studied' (chi-square = 52.63 with 16 D F ; 47.95 with 12 D F ; 169.29 with 36 D F ; 236.90 with 164 D F ; 373.98 with 164 D F , significant at 1 per cent level). Tables V.4 to V.9 in Annex).
In respect of the duration of course, the expected wait is higher for courses of four years duration than for others. Students w h o are supported by the family also seem to think that they will have to wait longer than others before finding a job.
Salary expectations of students
T h e main purpose of this section is to identify the factors which explain salary expectations. T o find out to what extent education in general, and higher education in particular, influences expected earnings per month, the students were asked to indicate the amount of earnings per month they would expect after their graduation. F r o m the analysis, w e note that 28.4 per cent did not reply (i.e. 125 students). The range of earnings mentioned by the students in their answers is from S£10 to 900, the mean being S£l27.743 (SD = 89.84), and the median income is S£100.200. W e have grouped this information into five earnings categories, namely S£10-60, S£61-110, S£lll-160, S£161-210, and S£211 + , and the results are shown in Table 35.
93

From college to work: the case of the Sudan
Table 35: Expected earnings after graduation
Expected salary (monthly) S£ No. Adjusted %
10-60 61-110 111-160 61-210 211 and above
40 151 81 19 24
12.7 47.9 25.7 6.0 7.6
. A high degree of association exists between expected monthly income and sex, institution, field desired, field studied, course duration, expected waiting period, and expected sector of employment, (see Tables V.10 to V.16 in Annex).
Nearly half of the students expect their earnings per month to be between S£61 and S£110. Almost one out of five medical students expects to earn more than S£210 after graduation. O n average, science-based professional students expect to earn more than the arts-based students. The male students expect to earn m o r e on average than do female students. Students with a longer duration of course expect to earn more than those whose courses are of a shorter duration, and those w h o expect to earn more on average. It is also observed that a m o n g those expecting the highest earnings, half expect to join the private sector; students expecting to work in the private sector expect to earn more on average.
T h e analysis of expected income by age shows that among those in the age-group 20-24, 13.3 per cent expect S£10-60, 48.5 per cent expect, S£361-110, 25.5 per cent expect S£l 11-160, 7.3 per cent, S£161-210 and 5.5 per cent, S£211 and above (representing 50.9 per cent of the total respondents). In the age-group 25-30, w e note respectively for the five earnings categories 12.2 per cent, 45.3 per cent, 24.5 per cent, 5.8 per cent and 12.2 per cent, (representing 42.9 per cent of the total respondents). A s for the age-group 30 and above, (6.2 per cent of the total respondents), 15.0 per cent expect to earn S£ 10-60, 50 per cent, S£61-110 and 35 per cent S£lll-160.
By sex the respondents distribute into 78.1 per cent males and 21.9 per cent females. It is observed that 8.8 per cent of males and 28.6 per cent of females expect to earn between S£10-60; 48.4 per cent of males and 45.7 per cent of females expect to earn S£61-110; 27.6 per cent of males and 15.7 per cent females expect S£l 1-160, and the rest above S£160. T h e average expected income of male students, as noted before, is higher than that of female students.
94

The world of higher education as perceived by the student
A multivariate analysis of the determinants of expected earnings and waiting period before obtaining employment
Bivariate relationships between expected earnings and waiting period and various background factors were described above. These relationships are, to s o m e extent, confounded by the influences of m a n y other variables, and this section will discuss the effects of certain variables on expectations while controlling for others.
(i) Determinants of expected earnings
In order to determine the effect of background variables on earnings expectations it was felt necessary to statistically control for the influences of other variables while analyzing the influence of one.
According to the regression equation, monthly earnings expected are a function of a set of factors as follows:
E = f (X,, X 2 , X 3 X ) = Bo + B , X , + B 2 X 2 + B n X n .
The regression coefficients, Bi, B 2 B n , represent the effect of the respective variables Xi , X 2 X o n expected earnings:
(a) age
(b) sex
(c) field of study
(d) province of origin
(e) guardian's income per m o n t h
(f) expected waiting period after graduation
(g) marks in Secondary School Certificate
(h) course duration
(i) income as student per month (excluding scholarship/grant)
and B 0 is the constant term. All these factors could be hypothesized as influencing the expected
earnings of students. Details on the variables are shown in Table 36.
95

From college to work:
the case of the Sudan
>-¡N
<N
OO
¡*'S
;qc
>(<
¡inin
•s ç
w
3
CO
CO i-i
O 00
O
oo
oo
in*o
oin
M(*in
oo
m
vO
vO
«rO
£>
00
>n
<N
'*<N
fN>
r «-!©
<-< " c
i cjÑ r- <-¡ rí *
TÍ
3
03
00
l/"¡0
\©IO
00
00
O©
.-il/->0
0
t-
Hi
-i
r-
«0
0»
—t
OO
OO
OO
US
C
'5
m
O O
T
f m
t i-*
o«
t--'H
inrn
nin
(<
ne
'-im
Ov
I- í
' ^' Ò
h ri h
" r~
•' «
Mm
•* <
0 <N <N
-H ,-c
VJ
_>* c
a
c o
'35
eo tu
a:
"o
-o
1-•O
c
co
c
o
"S
G,
a V Q Variable
nt) <u
13 C cj o
. cj T3 w
CJ Expected incom
c
c c
CJ
CJ
CJ ^
^ S CJ ^
^ s-*.-*-^-*^-'-^ -^-N-^^
SfiÎÏ
C C
B
CJ
CJ C
J CJ C
J CJ
U -^v
S CJ
"O ""O "O
"O ""O
3 *0
*0 *0
*0 "O
3
c c c
CJ C
J C
J C CJ C C
C B
C E
fi CJ
CJ C
J OJ
OJ C
J C
J B
CJ 0
.0.0
.0,0
.0.0
.0.0
.0.0
.0.
4) C
J C
J CJ •O
T3
T3
T3
S C
C
W
>. ?^
E E
(dum (dum
CJ o
rse »vin art .5
w
CJ C
J CJ C
J CJ C
J C
J *o
*o "o
"o *o
*o "o
fi
S fi
B 6
fi C
;•>;•>;»->?-> ?^
w ?-> E
£ E
£ Ê
£
£
E £
E £
£
D
3 3 3 3
3
T3 *D 3
3
3
3
8 u
I Ö
.3 E
E .S
>-
BO
O.
Duration of cou East Central pre Humanities and Marks in S.S-C. Sciences Business and co West Central pn Sex (male) Khartoum area Present income Agriculture
CJ •o
B
w
Age
g
o
•o
CJ CJ
<*-o
«3 egre
Q O II U-,
vO 1—
1
o II »M
OC ^ 087 Constant - -25-
96

The world of higher education as perceived by the student
T h e above table shows the results of the stepwise regression analysis between the expected earnings of the students and the other independent (explanatory) variables. It should be noted from the above list of variables considered as explanatory that s o m e of t h e m , e.g. province of origin, Field of study and sex, are categorical variables. They are to be treated as ' d u m m y ' variables, which m e a n s that different categories are to be treated as separate variables. T o avoid multi-collinearity, one of the categories has to be left out of the analysis. For example, for sex, w e have considered only the male sex. Suppose Xj represents the variable 'sex', since w e have dropped female sex then variable Xi will assume a value 1 for the student w h o is a male, and zero otherwise. In such cases, the regression coefficient represents the relative contribution of the sex 'male' as compared with 'female'.
It would appear from Table 36 that our specification of the earnings function is able to explain only 10 per cent of the total variation in earnings. T h e explanatory 'duration of course' is the strongest with an ' F ' value 12.17. O n e year of additional study duration contributes Sf 19.80 to expected earnings. Fields of study, such as humanities and arts, business and c o m m e r c e , and sciences, d o influence earnings but in a negative way in comparison with those fields which are not in the equation, e.g. engineering and technology, health, law, etc. Similarly, the students from East Central province expect to earn m o r e than those of other regions, including K h a r t o u m area. Being a male student is a relative advantage as compared with being a female student (F = 4.03). With an F-value less than 4, age, present income per month of a student, guardian's income, marks in Secondary School Certificate d o not have any significant influence on the variations in expectations of students as regards earnings.
(ii) Determinants of expected waiting period
T h e same exercise has been applied for the expected waiting period. T h e following variables were included in the analysis as predictors of expected waiting period:
(a) age,
(b) sex
(c) field of study
(d) province of origin
(e) course duration
(f) guardian's income per m o n t h
97

From college to work: the case of the Sudan
Table 37: Regression analysis for waiting period
Explanatory Variables
Age SI. P5 036 Q47 Q53 054 Q92 FSl FS2 FS3 FS4 FS5 FS6 FS7 FS8 FS9 PI P2 P3 P4
(Constant) R 2 = .20502
B
-0.8802611D-02 -0.2628832 0.1725625 0.5739766D-03 0.1178039D-01 0.4607664D-01
-0.3057525D-02 0.1242192 0.3496942 1.016944 0.5731859 1.104954 0.2748660 0.7513047 0.6893916 2.185304 0.2716931 0.7425218D-01 0.6922031D-01 0.1839766D-01 0.7179019D-02
0.6614050
Beta
-0.07271 -0.08719 0.03572 0.03071 0.12843 0.07231
-0.04790 0.07947 0.07640 0.16057 0.14244 0.36648 0.07246 0.14121 0.17887 0.42522 0.07781 0.02272 0.02312 0.00646 0.00219
Standard error B
0.00548 0.15624 0.29156 0.00090 0.00482 0.03598 0.00354 0.07399 0.40167 0.44954 0.39057 0.37135 0.39116 0.42084 0.38418 0.41387 0.39463 0.24047 0.23902 0.23384 0.25017
F = 5.13322 degrees of freedom : 21 and 418
F
2.582 2.831 0.350 0.410 5.963 1.640 0.748 2.819 0.758 5.118 2.154 8.854 0.494 3.187 3.220
27.881 0.474 0.095 0.084 0.006 0.001
(g) student's income per month (excluding scholarship/grant)
(h) percentage of marks in Secondary School Certificate
(i) expected earnings.
All these factors could be hypothesized to influence the waiting period. Following the same method as for the expected earnings, explanation to the extent of 20.5 per cent ( = R 2 ) was obtained from the model specified above with the expected waiting period as the dependent variable. (F = 5.13, D F : 21 and 418). The results are shown in Table 37 where FSl to F S 8 are respectively the fields of studies: engineering, sciences, social science, humanities and arts, health, education and teacher training, busi-
98

The world of higher education as perceived by the student
ness and commerce, agriculture, and law. Other fields of studies have been left out. PI to P5 are the major areas of origin, namely Khartoum area, Northern Provinces, East Central Province area, Central Province area, West Central Province area. Southern Province areas have been left out to avoid multi-collinearity. Sex is represented by the symbol SI to represent the male sex. Other variables are represented by the symbol O and are taken from the questionnaire.
It can be observed that the fields of study have significant influence on the expected waiting period (with F greater than 4). L a w students expect to wait the longest, followed by science students. It is surprising that waiting period is expected to increase the higher the marks obtained in Secondary School Certificate, although to a very slight extent. (One percentage change in marks in Secondary School Certificate will increase the waiting period by .0118 months).
99

From college to work: the case of the Sudan
Table IV. 1 Crosstabulation of age by sex
Male Female Row Total
15-17
Nuaber Row percentage Column percentage Total percentage
18-20
Number Row percentage Column percentage Total percentage
21*
Number Row percentage Column percentage Total percentage
Column Total
33 45.2
6.7 4.0
397 59.5 80.9 48.1
61 70.9 12.4
7.4
491 7.4
40 54.8 11.9 4.8
270 40.5 80.6 32.7
25 29.1
7.5 3.6
335 40.6
73 8.8
667 80.8
86 10.4
826
Chi Square - 10.84682 with 2 degrees of freedom. Significance » 0.0044
Table IV.2 Crosstabulation of school finance by age
Government
Number Row percentage Column percentage Total percentage
Partial Govt. Assistance
Number Row percentage Column percentage Total percentage
Private
Number Row percentage Column percentage Total percentage
Column Total
15-17
61 9.5
' 77.2 7.4
14 9.3
17.7 1.7
4 15.4 5.1 0.5
79 9.6
18-20
534 83.2 80.3 65.2
116 76.8 17.4 14.2
15 57.7 2.3 1.8
665 81.2
21 +
47 7 . 3
6 2 . 7 5 . 7
21 1 3 . 9 2 8 . 0
2 .6
7 2 6 . 9
9 . 3 0 . 9
75 9.2
R o w total
642 7 8 . 4
151 1 8 . 4
26 3.2
819 1 0 0 . 0
Chi Square - 1 8 . 4 0 4 6 2 with 2 degrees of freedom. Significance - 0 . 0 0 1 0 .
100

The world of higher education as perceived by the student
Table IV.3
Academic
Number Row percentage Column percentage Total percentage
Technical
Number Row percentage Column percentage Total percentage
Commercial
Number Row percentage Column percentage Total percentage
Column Total
Chi Square = 21.56129 wi
Table IV.4
Mathematics
Number Row percentage Column percentage Total percentage
Biology
Number Row percentage Column percentage Total percentage
Art
Number Row percentage Column percentage Total percentage
Column Total
15-17
78 11.0 92.9 9.5
3 6.0 3.6 0.4
3 4.7 3.6 0.4
84 10.2
th 2 degrees of
Crosstabulatior
Male
68 77.3 17.2 9.6
175 51.0 44.3 24.6
152 54.5 38.5 21.4
395 55.6
18-20
578 81.6 87.2 70.3
37 74.0 5.6 4.5
48 75.0 7.2 5.8
663 80.7
freedom.
21+
52 7.3 69.3 6.3
10 20.0 13.3 1.2
13 20.3 17.3 1.6
75 9.1
Significance = 0.
i of academic stream by sex
Female
20 22.7 6.3 2.8
168 49.0 53.3 23.7
127 45.5 40.3 17.9
315 44.4
Row total
708 86.1
50 6.1
64 7.8
822 100.0
0002.
Row Total
88 12.4
343 48.3
279 39.3
710 100.0
Chi Square > 19.80211 with 2 degrees of freedom. Significance » 0.0001
101

From college to work: the case of the Sudan
Table IV. 5 Crosstabulation of academic stream by age
Mathematics
Number Row percentage Colmm percentage Total percentage
Biology
Number Row percentage Column percentage Total percentage
Art
Number Row percentage Column percentage Total percentage
Column Total
15-17
7 8.0 9.0 1.0
49 14.2 62.8 6.9
22 7.9 28.2 3.1
78 11.0
18-20
76 86.4 13.1 10.7
271 78.8 46.7 38.1
233 83.5 40.2 32.8
580 81.6
21+
5 5.7 9.4 0.7
24 7.0 45.3 3.4
24 8.6 45.3 3.4
53 7.5
Row total
88 12.4
344 48.4
279 39.2
711 100.0
Chi Square » 8.18556 with 4 degrees of freedom. Significance » 0.0850.
Table IV.6 Crosstabulation of place of birth by school finance
Government Partial Govt. Assistance Private Row total
Urban
Number Row percentage Column percentage Total percentage
Rural
Number Row percentage Column percentage Total percentage
Column Total
343 72.1 53.5 42.0
298 87.6 46.5 36.5
641 78.6
111 23.3 74.5 13.6
38 11.2 25.5 4.7
149 18.3
22 4.6 84.6 2.7
4 1.2 15.4 0.5
26 3.2
476 58.3
340 41.7
816 100.0
Chi Square - 29.53961 with 2 degrees of freedom. Significance - 0.0000
102

The world of higher education as perceived by the student
Table IV.7 Crosstabulation of place of birth by school type
Academic Technical Commercial Row total
Urban
Number 445 Row percentage 92.3 Colunn percentage 63.1 Total percentage 54.3
Rural
Number 260 Row percentage 77.2 Column percentage 36.9 Total percentage 31.7
Column Total
705 86.1
8 1.7 16.0 1.0
42 12.5 84.0 5.1
50 6.1
29 6.0
45.3 3.5
35 10.4 54.7 4.3
64 7.8
483 58.9
337 41.1
819 100.0
Chi Square = 48.06358 with 2 degrees of freedom. Significance = 0.0000
Table IV.8 Crosstabulation of place of birth by academic stream
Mathematics Biology Art Row total
Urban
Number 46 Row percentage 10.3 Column percentage 52.9 Total percentage 6.5
Rural
Number 41 Row percentage 15.6 Column percentage 47.1 Total percentage 5.8
Column 87 Total 12.3
237 53.1 69.1 33.5
106 40.5 30.9 15.0
343 48.4
163 36.5 58.6 23.0
115 43.9 41.4 16.2
278 39.3
446 63.0
262 37.0
708 100.0
Chi Square = 11.56940 with 2 degrees of freedom. Significance = 0.0031
103

Front college to work: the case of the Sudan
Table IV. 9
Crosstabulation of Reason for choice of type of education by sex
Itersonal interest
Number Row percentage Column percentage Total percentage
Academic performance
Number Row percentage Column percentage Total percentage
Better chances for higher education
Number Row percentage Column percentage Total percentage
Family preference
Number Row percentage Column percentage Total percentage
Follow friends choice
Number Row percentage Column percentage Total percentage
Employment prospects after secondary
Number Row percentage Column percentage Total percentage
Career prospects after graduation
Number Row percentage Column percentage Total percentage
Column Total
Chi Square =» 21.12704 with
Male
329 55.9 69.1 41.S
47 68.1 9.9 5.9
62 69.7 13.0 7.8
1 100.0 0.2 0.1
3 75.0 0.6 0.4
14 82.4 2.9 1.8
20 87.0 4.2 2.5
476 60.1
2 degrees of freedom.
Female
260 44.1 82.3 32.8
22 31.9 7.0 2.8
27 30.3 8.5 3.4
0 0.0 0.0 0.0
1 25.0 0.3 0.1
3 17.6 0.9 0.4
3 13.0 0.9 0.4
316 39.9
Significance =
Row Total
589 74.4
69 8.7
89 11.2
1 0.1
4 0.5
17 2.1
23 2.9
792 100.0
0.0017
104

The world of higher education as perceived by the student
Table IV. 10 Crosstabulation of Reason for choice of type of education by school type
Academic Technical Commercial Row total
Bsrsonal interest
Number Row percentage Column percentage Total percentage
Academic performance
Number Row percentage Column percentage Total percentage
Better chances for higher education
Number Row percentage Column percentage Total percentage
Family preference
Number Row percentage Column percentage Total percentage
Follow friends choice
Number Row percentage Column percentage Total percentage
Employment prospects after secondary
Number Row percentage Column percentage Total percentage
Career prospects after graduation
539 91.4 76.1 68.1
63 92.6 8.9 8.0
86 96.6 12.1 10.9
1 100.0 0.1 0.1
2 50.0 0.3 0.3
4 23.5 0.6 0.5
Number 13 Row percentage 56.5 Column percentage 1.8 Total percentage 1.6
Column 708 Total 89.4
27 4.6
67.5 3.4
2 2.9 5.0 0.3
2 2.2 5.0 0.3
0 0.0 0.0 0.0
0 0.0 0.0 0.0
6 35.3 15.0 0.8
3 13.0 7.5 0.4
40 5.1
24 4.1 54.5 3.0
3 4.4 6.8 0.4
1 1.1 2.3 0.1
0 0.0 0.0 0.0
2 50.0 4.5 0.3
7 41.2 15.9 0.9
7 30.4 15.9 0.9
44 5.6
590 74.5
68 8.6
89 11.2
1 0.1
17 2.1
23 2.9
792 100.0
Chi Square = 133.17691 with 12 degrees of freedom. Significance » 0.0000
105

From college to work: the case of the Sudan
Table IV. 11 Crosstabulation of reason for choice of type of education
Itersonal interest
Number Row percentage Column percentage Total percentage
Academic performance
Number Row percentage Column percentage Total percentage
Better chances for higher education
Number Row percentage Column percentage Total percentage
Family preference
Number Row percentage Column percentage Total percentage
Follow friends choice
Number Row percentage Column percentage Total percentage
Employment prospects after secondary
Number Row percentage Column percentage Total percentage
Career prospects after graduation
Number Row percentage Column percentage Total percentage
Column Total
by place of birth
Urban
370 63.0 78.6 46.8
33 47.8 7.0 4.2
51 57.3 10.8 6.5
0 0.0 0.0 0.0
2 50.0 0.4 0.3
4 23.5 0.8 0.5
11 47.8 2.3 1.4 471 59.6
Rural
217 37.0 68.0 27.5
36 52.2 ' 11.3 4.6
38 42.7 11.9 4.8
1 100.0 0.3 0.1
2 50.0 0.6 0.3
13 76.5 4.1 1.6
12 52.2 3.8 1.5 319
40.4
Row Total
587 74.3
69 8.7
89 11.3
1 0.1
4 0.5
17 2.2
23 2.9
790 100.0
Chi Square » 19.18106 with 6 degrees of freedom. Significance =• 0.0039
106

The world of higher education as perceived by the student
Table IV.12 Crosstabulatlon of intention after completing secondary school by sex
Male Female Row total
Work
dumber Row percentage Column percentage Total percentage
University
Number Row percentage Column percentage Total percentage
Technical institution
Number Row percentage Column percentage Total percentage
Column Total
19 47.5 3.9 2.3
398 57.3 81.1 48.2
74 81.3 15.1 9.0
491 59.4
21 52.5 6.3 2.5
297 42.7 88.7 36.0
17 18.7 5.1 2.1
335 40.6
40 4.8
695 84.1
91 11.0
826 100.0
Chi Square - 21.79594 with 2 degrees of freedom. Significance > 0.0000
Table IV.13 Crosstabulation of age by intention after completing secondary school
Work University Technical
institution Row total
15-17
Number Row percentage Column percentage Total percentage
18-20
Number Row percentage Column percentage Total percentage
21+
Number Row percentage Column percentage Total percentage
Column Total
1 1.4 2.5 0.1
30 4.5
75.0 8.6
9 10.3 22.5 1.1
40 4.8
70 95.9 10.1 8.5
561 84.1 80.6 67.8
65' 74.7 9.3 7.9
696 84.2
2 2.7 2.2 0.2
76 11.4 83.5 9.2
13 14.9 14.3 1.6
91 11.0
73 8.8
667 80.7
87 10.S
827 100.0
Chi Square - 15.39590 with 4 degrees of freedom. Significance • 0.0039.
107
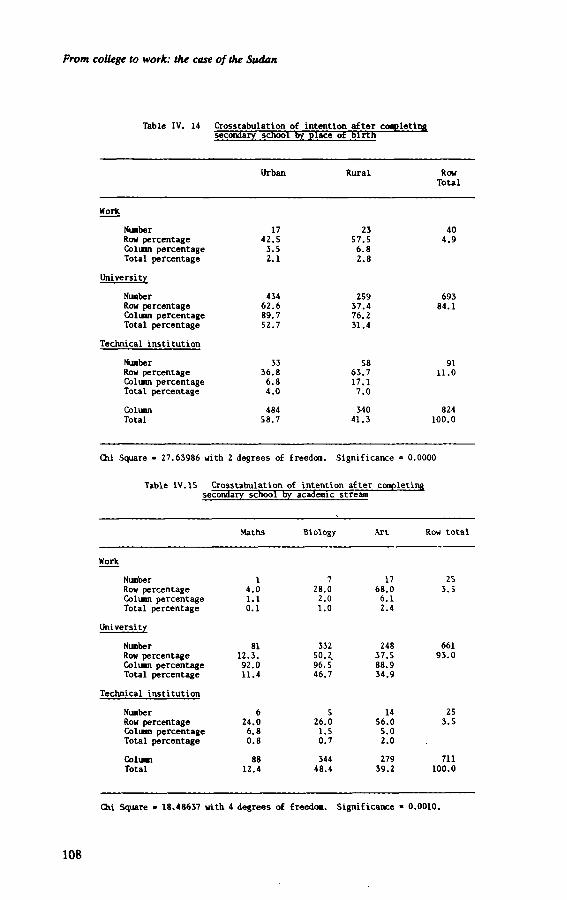
From college to work: the case of the Sudan
Table IV. 14 Crosstabulation of Intention after completing secondary school by place ot birfB
Urban Rural Row Total
Work
Number Row percentage Column percentage Total percentage
University
Nunber Row percentage Column percentage Total percentage
Technical institution
Number Row percentage Column percentage Total percentage
Column Total
17 42.5
3.5 2.1
434 62.6 89.7 52.7
33 36.8 6.8 4.0
484 58.7
23 57.5 6.8 2.8
259 37.4 76.2 31.4
58 63.7 17.1 7.0
340 41.3
40 4.9
693 84.1
91 11.0
824 100.0
Chi Square • 27.63986 with 2 degrees of freedom. Significance - 0.0000
Table IV.15 Crosstabulation of intention after completing secondary school by academic stream
Maths Biology Art Row total
Work
Number Row percentage Colimn percentage Total percentage
University
Number Row percentage Column percentage Total percentage
Technical institution
Number Row percentage Column percentage Total percentage
Column Total
1 4.0 1.1 0.1
81 12.3.
92.0 11.4
6 24.0 6.8 0.8
88 12.4
7 28.0
2.0 1.0
332 50.2. 96.5 46.7
5 26.0 1.5 0.7
344 48.4
17 68.0
6.1 2.4
248 37.5 88.9 34.9
14 56.0
5.0 2.0
279 39.2
25 3.5
661 93.0
25 3.5
711 100.0
Chi Square • 18.48637 with 4 degrees of freedom. Significance - 0.0010.
108

The world of higher education as perceived by the student
Table IV.16 Crosstabulation of place of higher education by sex
Male Female Row Total
Sudan
Number Row percentage Column percentage Total percentage
Abroad
Number Row percentage Column percentage Total percentage
Column Total
285 55.3 58.9 35.1
199 67.0 41.1 24.5
484 59.6
230 44.7 70.1 28.3
98 33.0 29.9 12.1
328 40.4
515 63.4
297 36.6
812 100.0
Corrected Chi Square = 10.16405 with 1 degree of freedom. Significance = 0.0014
Raw Chi Square = 10.64293 with 1 degree of freedom. Significance = 0.0011
Table IV.17 Crosstabulation of place of higher education by education stream
Maths Biology Art Row total
Sudan
Number Row percentage Column percentage Total percentage
Abroad
Number Row percentage Column percentage Total percentage
Column Total
63 13.5 71.6 9.0
25 10.8 28.4 3.6
88 12.6
246 52.7 71.7 35.2
97 41.8 28.3 13.9
343 49.1
158 33.8 59.0 22.6
110 47.4 41.0 15.7
268 38.3
467 66.8
232 33.2
690 100.0
Chi Square • 12.09318 with 2 degrees of freedom. Significance » 0.0024
109

From college to work: the case of the Sudan
Table IV.18 Crosstabulation of time to apply for higher education by sex
Before S.S.C.
Number Row percentage Column percentage Total percentage
After S.S.C.
Number Row percentage Column percentage Total percentage
Column Total
Male
207 64.9 42.6 25.2
279 55.7 57.4 34.0
486 59.3
Female
112 35.1 33.5 13.7
222 44.3 66.5 27.1
334 40.7
Row Total
319 38.9
501 61.1
820 100.0
Corrected Chi Square - 6.45999 with 1 degree of freedom. Significance » 0.0110
Raw Chi Square * 6.83583 with 1 degree of freedom. Significance = 0.0089
Table IV.19 Crosstabulation of time to apply for higher education by place of birth
Urban Rural Row Total
Before S . S . C .
Number Row percentage Column percentage Total percentage
After S . S . C .
Number Row percentage Column percentage Total percentage
Column Total
175 54.7 36.4 21.4
306 61.4 63.6 37.4
481 58.8
145 45.3 43.0 17.7
192 38.6 57.0 23.5
337 41.2
320 39.1
498 60.9
818 100.0
Corrected Chi Square - 3.39940 with 1 degree of freedom. Significance - 0.0652
Raw Chi Square - 3.67307 with 1 degree of freedom. Significance » 0.0553
110

The world of higher education as perceived by the student
Table IV.20 Crosstabulation of tine to apply for higher education by academic streani
Maths Biology Art Row total
Before
Number Row percentage Colimn percentage Total percentage
After
Number Row percentage Column percentage Total percentage
Colimn Total
43 15.0 49.4 6.1
44 10.5 50.6 6.2
87 12.3
149 52.1 43.8 21.1
191 45.6 56.2 27.1
340 48.2
94 32.9 33.8 13.3
184 43.9 66.2 26.1
278 39.4
40.6
419 59.4
705 100.0
Chi Square - 9.58683 with 2 degrees of freedom. Significance • 0.0083
Table IV. 21 Crosstabulation of best way to inform students by sex
Prospectus
Number Row percentage Column percentage Total percentage
Authorities
Number Row percentage Column percentage Total percentage
Media
Number Row percentage Column percentage Total percentage
Teachers
Number Row percentage Column percentage Total percentage
Column Total
Male
213 61.4 44.4 26.5
119 66. S 24.8 14.8
63 53.4 13.1 7.8
85 52.8 17.7 10.6
480 59.6
Female
134 38.6 41.2 16.6
60 33.5 18.5 7.5
55 46.6 16.9 6.8
76 47.2 23.4-9.4
325 40.0
Row Total
347 43.1
179 22.2
118 14.7
161 20.0
805 100.0
Chi Square » 8.96567 with 3 degrees of freedom. Significance » 0.0298
111

From college to work: the case of the Sudan
Table IV. 22 Crosstabulation of best way to inform students by place ot birth
Row Total
Prospectus
Nunber Row percentage Column percentage Total percentage
Authorities
Number Row percentage Column percentage Total percentage
Media
Nunber Row percentage Column percentage Total percentage
Teachers
Number Row percentage Column percentage Total percentage
Column Total
228 66.1 48.1 28.4
84 46.9 17.7 10.5
66 55.9 13.9 8.2
96 59.6 20.1 12.0
474 59.0
117 33.9 15.6 14.6
95 53.1 28.9 11.8
52 44.1 15.8
6.5
65 40.4 19.8
8.1 329
41.0
345 43.0
179 22.1
118 14.7
161 20.0
806 100.0
Chi Square - 18.43706 with 3 degrees of freedom. Significance a 0.0004
Table IV.23 Crosstabulation of best way to inform students
Prospectus
Number Row percentage Column percentage Total percentage
Authorities
Number Row percentage Column percentage Total percentage
Media
Number Row percentage Column percentage Total percentage
Teachers
Number Row percentage Column percentage Total percentage
Column Total
by academic
Maths
51 16.1 58.6 7.4
17 11.4 19.5 2.5
11 10.1 12.6
1.6
8 6.8 9.2 9.2
87 12.6
stream
Biology
169 53.5 49.9 24.4
74 49.7 21.8 10.7
48 44.0 14.2
6.9
48 40.7 14.2
6.9
339 49.0
Art
96 30.4 36.1 13.9
58 38.9 21.8
8.4
50 45.9 18.8
7.2
62 52.5 23.3 9.0
266 38.4
Row total
316 45.7
149 21.5
109 15.8
118 17.1
692 100.0
Chi Square * 23.58708 with 6 degrees of freedom. Significance - 0.0006
112

V . The higher education graduates
T h e linkage between the system of higher education and the world of work can be investigated through the graduates of post-secondary institutions w h o are in a position to assess whether the higher education system has been relevant or not to their working life. Through the assessment which the graduates can provide us with, it is possible to establish whether there are difficulties in applying the knowledge acquired in the school system to the service of the society. It is also possible to realize h o w important it is to bring closer together higher education and the labour market, and to k n o w the mechanism of reconciling individual expectations with the national objectives. The factors that influence graduates to follow a particular kind of educational and occupational career can be'identified and used for planning the development of higher education. Information on the reasons for changes in fields of study and work, and on the frequency of such changes, can help in reducing this p h e n o m e n o n where such changes are undesirable. If the changes are necessary for meeting broader social and economic objectives, they can be encouraged if information on the reasons for them is available. Such information is also useful for studying the occupational mobility necessary for the development of higher education according to economic needs.
It is not only the desired occupational career which is responsible for the inflow of students to the higher education system, there are other factors which influence the choice of a particular kind of education and occupation, such as academic record, admission quota for different disciplines, and parents' financial capacity.
In this chapter, w e discuss the fields in which the graduates studied, migration in order to pursue higher education, the job search mechanism, utilization of the graduates' training on the job, and certain other aspects of the education/employment relationship.
113

From college to work: the case of the Sudan
Reasons for choosing field of study
A s discussed in the previous chapter, 'personal liking for the field' was the reason most cited by the higher education students for choosing a field of study. The graduates were also asked to indicate w h y they had decided on a specific field of study. They were given a number of possible reasons from which to choose, and their responses are shown in Table 38.
Table 38: Reasons for choice of field of study
Reasons
Personal liking for the field Guardian's advice Advice of secondary school teachers Follow friends in same field Good employment prospects Good income Social prestige Other
N u m b e r of respondents
294 6
10 5
48 14 28 48
Adj. %
87.5 1.8 3.0 1.5
14.3 4.2 8.3
14.3
It is noted that there is a similar pattern of response from higher education students and graduates. The choice of field of study by the graduates was clearly decided by personal liking for the field. According to the responses of the graduates, advice from guardians, teachers or friends had little influence on their choice of field of study, whereas factors such as good employment prospects, high income and social prestige did play a role in their decision.
The above reasons were looked at according to different characteristics such as province, guardian's sector of employment, guardian's place of work (urban/rural), age of respondent, sex, place of birth (urban/rural), and the analysis in terms of association between the variables is given in Table 39.
It is interesting to note that six provinces and regions of origin and, in most cases, guardian's sector of employment, and age of the graduate, do not have any influence on the importance of the different factors for pursuit of higher education. However, guardian's place of work does change the importance of such factors as advice from teachers or from friends, as well as income and job prospects. The importance of income changes according to difference in the guardian's sector of employment, and age, the latter also having an influence on the change in importance of social prestige as a factor for pursuit of higher education.
114

The higher education
graduates
OS
a* X
en
oooooooo
ZZZZZZZZ
oooooooo
ZZZZZZZZ
ts
u ce u
to
x: C
J *-
C
O
C
O
8 ce
•o 3
o c
<§ Q.
•O
l.
o o o
o o
¡í! o
Z
ZZ
ZZ
^Z
co o c
3
„»
«
'"§
•2 O
.
O
zzir
jïzz
1/1
'
¿i -P
u
o '5
.c
0\
«»1
-o
-_ o c
£
i_ «
"o
E
- õ
>> B
U
O
o o o
o o
o o
zzzzz>
:zz
oo
oo
oo
oo
Z
ZZ
ZZ
ZZ
Z
2 S
CD
C
J
IB a. u
o
"<» E
„ •O
i>«
M
c 3 c w
?
5 c o-
o U j; "3
<u =
g
M'U
JS
£ o ï «8 õ
.5 "o •> S
U
Q
— S
*"> cg ce u
5 fel
Sí.
!" "
" <ñ
« 2
S
&Ü
c-¡
1
| 1
T3 C
O
z
115

From college to work: the case of the Sudan
Field of interest after completing secondary education and field study
T h e questionnaire collected information on the desired field of study as well as the one that the graduate had actually studied. This information was used to estimate a desirability index of different subjects defined as:
D = (Desired-Actual) 0.100 Desired
where 'Desired' and 'Actual' refer respectively to the number of individuals wishing to study a given subject and actually enrolled in a given subject. A significant departure from zero would indicate a marked mismatch between expectation and achievement in the choice of a field of study. A positive value would indicate higher popularity of the field and higher competition, and a negative value would indicate the reverse. Table 40 summarizes the responses of the graduates as regards the field desired against the field studied.
Table 40: Field of study desired and field actually followed
Field
Natural science Engineering and technology Health Arts Social sciences Physical education Law Business and accountancy Agriculture Veterinary science Other
Desired field
37 62 34 50 86
1 23 15 10
-2
Actually studied
28 43 9
60 92
1 72 14 12 3 2
Desirability index
+ 0.321 + 0.441
+ 2.77 -0.166 -0.065
0 -0.681
+ 0.0714 -0.166
-0
It is worth worth noting that the interests expressed by graduates while they were completing secondary education have some association w h e n they are put in relation with other variables. For example, w h e n correlating field of interest after secondary with field actually studied, a strong association appears (chi-square: 203.61 with 4 D F , significant at .0001 per cent level). B y area of birth the same relationship exists and the chi-square value is 26.11 with 10 D F (significant at .5 per cent level). T h e fields of study were grouped as science-based, arts-based and 'others'. (Tables VIA and VI.2 in the Annex to this chapter).
116

The higher education graduates
A s far as other variables are concerned, i.e. marital status, region, guardian's employment sector and place of work, the analysis does not show any association with the field of interest after secondary education (Tables V1.3 and VIA in Annex).
T h e age of the respondents and the location of the birthplace (urban or rural), do not have any association at all with the field of interest after secondary education. Certainly it is very difficult to say anything about the existing or non-existing association, for graduates have to recall their past and there is a possible bias within responses.
Changes in field of study
Graduates might have changed their field of study at any time during their higher studies, and they were asked to indicate the reasons for so doing. Their responses are give in Table 41. For those w h o did change their field of study, w e note that the main reason was because their academic performance was not satisfactory.
Table 41: Reasons for change in field of study
N o . Adj.%
(1) Lack of financial support (2) Academic performance not satisfactory (3) Family's wishes (4) After obtaining better information on
career opportunities (5) Other
W h e n the reasons for change of field of study are analyzed in comparison with other variables, sex, age and place of work appear to have an association with the different reasons for such changes. B y sex w e find that m o r e females change their field because of unsatisfactory academic performance and family influence, whereas m o r e males change their field because of lack of finance and lack of information on the p r o g r a m m e . B y age w e note that a larger proportion of older graduates changed their field because of lack of financial support and due to unsatisfactory academic performance, whilst a larger proportion of younger graduates changed their field because the family wanted them to d o so. Most of the graduates w h o changed their field of study c a m e from rural regions. (See Tables VI.5 to V1.7 in the Annex).
18 79 11
26 25
12.2 53.7 7.5
17.7 17.0
117

From college to work: the case of the Sudan
Internal migration of graduates
T h e graduates were asked whether it had been necessary for them to m o v e away from h o m e to join a higher education institution, and if so to indicate for what reason. T h e responses are given in Table 42. A s was noted in the case of the higher education students, the internal migration of graduates was also due to the lack of institutions in the different regions, except for the Khartoum region.
Table 42: Reasons for leaving h o m e province to pursue higher education
No. %
N o higher education institution in the area Local institution did not offer course desired Other Missing
214 13 31 90
61.5 3.7 8.9
25.0
B y sex, place of birth, and field studied, analysis of the distribution of responses is given below:
B y field studied, 81.3 per cent of the respondents had to m o v e away from h o m e to join a higher education institution because of lack of institutions in their area, distributing into 77.0 per cent of graduates from science-based fields and 83.6 per cent arts-based. T h e course of study desired not being offered at the local institution of higher education was the m o r e predominant reason for graduates in science-based fields (8.1 per cent) than for those from arts-based fields (3.4 per cent).
T h e reasons for migration are also associated with the sex of the graduates. M o r e male graduates (84 per cent) m o v e d due to lack of institution in their h o m e area than did female graduates (S2.9 per cent).
Finally, by place of birth, 82.2 per cent of the respondents indicated that lack of institutions in the area was the main reason for moving away from h o m e to pursue higher education. M o r e rural-born graduates (91.7 per cent) m o v e d due to lack of institutions in their area than did urban-born graduates (75.5 per cent). (See Tables, V1.8— VI. 10 in the Annex).
118

The higher education graduates
Job search mechanism
T h e role that the job-search mechanism can play in the better utilization of highly-qualified m a n p o w e r and in the interaction between the sector of higher education and the world of work is important. Information on the different ways of getting a job for different types of graduates would enlighten us on the efficiency of such interaction and suggest ways to improve upon it. W e discuss below various aspects of the job search mechanism.
Methods of recruitment
T h e graduates were asked h o w they got their first employment and also h o w they were appointed to a job matching their specialization.
(i) Appointment to first job
O u t of 348 graduates, 321 responded concerning the method by which they obtained their first job after graduation. T h e responses are given in Table 43.
Table 43: Method of finding first job after graduation
Number Adj. %
Higher education institution: Labour office: Public sector recruitment board: Other Total
The public sector recruitment board seems to be the most important mechanism for obtaining the first employment. Only 12.1 per cent of the graduates were appointed to their first job through the institution of higher education they attended. 'Other sources' have a prominent role with 21.5 per cent of the responses.
There is a high degree of association between the method of recruitment and age of respondents (chi-square = 55.57 with 6 D F ) and place of birth (chi-square = 8.06 with 3 D F ) . Most of the graduates (63.2 per cent) in the age-group 20-29 got their first appointment through the public sector recruitment board, whereas those in the older group were more dispersed in the choice of institutional mechanism for obtaining the first job. Younger graduates are mostly appointed through the public sector
39 53
160 69
321
12.1 16.5 49.8 21.5
119

From college to work: the case of the Sudan
recruitment board. A s the age of the graduate increases, the role of the recruitment board decreases and that of the higher education institution increases. This is because the public sector recruitment board was set up only recently.
A m o n g the graduates of urban origin, the majority (51.9 per cent) obtained their first job through the recruitment board, whereas for graduates of rural origin it was 45.9 per cent. The role of the institution of higher education was more important for graduates from rural areas (19.3 per cent) than for those from urban areas (8.6 per cent). The same pattern is noted when the analysis is carried out according to sex: 47.8 per cent of males and 60.4 per cent of females were appointed through the recruitment board. By place of birth, 51.9 per cent of urban and 45.9 per cent of rural graduates were appointed in this way Tables VI.11-V1.13 in the Annex).
W h e n analyzed by current employment sector, it is observed that a m o n g those having been recruited through the higher education institutions, 76.3 per cent work in the government sector, 18.4 per cent in the semi-government sector, and 5.3 per cent in the private sector, whereas amongst those recruited through the department of labour 67.9 per cent work in the government sector, 22.6 per cent in the semi-government sector and 9.4 per cent in the private sector.
A m o n g those recruited through the public sector recruitment board, 88.6 per cent were in the government sector, 9.5 per cent in the semi-government sector and 1.9 per cent in the private sector. "Finally, a m o n g those recruited through other channels, 71 per cent were in the government sector, 14.5 per cent in the semi-government sector, 10.1 per cent in the private sector, and 4.3 per cent in other sectors. The 'public sector recruitment board is the most frequently used recruitment method for the government sector with 55 per cent of all recruitment. T h e role of the recruitment board reduces with the reduction of government control on enterprises. The private enterprises depend more on the labour office (29.4 per cent) than on the recruitment board. The degree of association between method of recruitment and current employment sector is significant (chi-square = 27.88 with 9 D F ) .
(ii) Appointment to job matching specialization
A s far as methods of recruitment to obtain a job matching specialization are concerned, Table 44 gives the responses of the graduates. W e note that here also the recruitment board plays the most important role. Other sources have a prominent role with 23 per cent of the responses as was the case for finding the first job after graduation.
Analysis was carried out according to the different characteristics of the graduates. A m o n g those recruited through the higher education institutions, labour office and public sector recruitment board, the distribution by current employment sector is summarized in Table 45.
120

The higher education graduates
Table 44: Method of finding job matching specialization
Number Adj. %
Higher education institution: 37 13.7 Labour office: 35 13.0 Public recruitment sector board: 136 50.4 Other: 62 23.0
Table 45: Method of recruitment and current sector of employment
Method of Sector recruitment :
Government Semi-government Private
Higher education institution 80.6 16.7 2.8
Labour office 62.9 28.6 8.6 Public sector recruitment board 88.1 9.0 3.0
T h e channel of recruitment for the job matching specialization follows almost the s a m e pattern as that of the first job.
O u t of the total n u m b e r of females, 63.8 per cent were recruited through the public sector recruitment board, against 47.5 per cent males. There is no association between sex and the channel of recruitment for the job matching with specialization.
A m o n g those aged 4 0 and over, 5 0 per cent were appointed through 'other m e a n s ' , whereas for those aged 30-39, 21.4 per cent were appointed through the higher education institutions, 28.6 per cent through the labour office, 26.5 per cent through the public sector recruitment board, and 23.5 per cent through 'other m e a n s ' . For those aged 29 or under, 8.4 per cent were appointed through higher education institutions, 4.2 per cent through labour office, 65.7 per cent through the recruitment board, and 4.7 per cent through 'other means ' . Here also it can be noted that the role of the public sector recruitment board increases as the age of the graduate decreases. There is a very high degree of association between the age of the respondent and the m e a n s of recruitment.
There is n o association between the place of birth of the graduate and the channel of recruitment for the job matching with specialization (Table VI.14 in the Annex).
121

From college to work: the case of the Sudan
224 62 12 11 9
70.4 19.5 3.8 3.5 2.8
(Hi) Waiting period for first job
The graduates were asked to indicate h o w long they had to wait between graduation and finding their first job. Out of a total of 348 graduates, 318 responded to the question. T h e distribution is given in Table 46, from which w e note that the majority got their jobs within 6 months after graduation.
Table 46: Waiting period after graduation to obtain job
N o . %
6 months or less: 7 to 12 months: 13 to 18 months: 19 to 24 months: 25 and above:
Further analysis shows that age seems to have an association with this waiting period (chi-square = 14.48 with 8 D F ) . W e note that in the age-group 29 or under, 74 per cent of the respondents obtained their jobs within 6 months after graduation, followed by 62.5 per cent in the age-group 30-39. All the respondents of age 40 and above got their job within the first six months. It was striking to note that the age-group 30-39 had the largest proportion (6.3 per cent) waiting for m o r e than 2 years to find a job. Also a larger proportion of males than females got their job within the first six months after graduation. (See Tables VI.15 and VI.16 in the Annex).
(iv) Waiting period to obtain a job matching the specialization
A s well as being asked to indicate the period of waiting for their first jobs, the graduates were asked h o w long they had to wait to obtain a job matching their specialization. There were 242 respondents to the question and the results are given in Table 47.
W e note that although the majority of the graduates obtained jobs in their field of specialization within 6 months , it does take longer to find employment matching with specialization than to get a job of any type.
122

The higher education graduates
Table 47: Waiting period to obtain job matching specialization
No. Adj. %
6 months or less: 7 to 12 months: 13-18 months: 19-24 months:
53 48 14 27
58.4
18.3 5.3
10.3
Criteria for being selected for the job
T h e selection criteria for a job have important implications in relating education with employment. T h e graduates were therefore asked to indicate which criteria they considered had been instrumental in being selected for their jobs. These criteria are not mutually exclusive and a graduate could indicate as many of them as were relevant for getting the job. Table 48 gives the distribution of the responses.
Table 48: Distribution of selection criteria
Number Adj. %
Academic performance Work experience Aptitude tests and interviews Other
It is to be noted that the graduates considered academic performance as the most important criterion for being selected for a job, followed by aptitude tests or interviews with the prospective employers.
Change of job and reasons for change.
T h e graduates were asked whether they had changed their jobs and, if so, for what reasons. O f the 318 respondents, 178 (55.8 per cent) indicated that they had done so. It is interesting to note that the majority of the graduates had changed their jobs. A s shown in Table 49, the two most important reasons for change were better terms of service and n e w job matching specialization; these two reasons were cited by 82.6 per cent of the graduates w h o had changed their jobs.
278 39
129 12
84.2
11.9
39.2
3.6
123

From college to work: the case of the Sudan
Table 49: Reasons for change of job
Reasons N o . %
Better terms of service 69 38.8 N e w job matching line of study 78 43.8 Loss of first job 4 2.2 Other reasons 27 IS.2
Suitability of higher education received for first job
T h e graduates were asked whether they considered that their higher education was suitable for their first job after graduation. O u t of 342 respondents, 233 thought their higher education was suitable for their job. Nevertheless w e note that about one graduate out of three was not satisfied with the higher education received insofar as suitability for the first job is concerned. T h e degree of association with other criteria, is discussed below:
B y age it is revealed that amongst the graduates w h o were satisfied with their higher education 40.9 per cent were in the age-group 29 or under, 25.1 per cent in the age-group 30-39, and 2.0 per cent in the age-group 40 and above. O u t of 31.9 per cent of the respondents w h o felt that their higher education was not suitable for the job, 20.8 per cent were aged 29 or under, 10.8 per cent were in the age-group 30-39, and 0.3 per cent in the age-group 40 and above.
B y sex, a m o n g those w h o considered that their higher education was suitable for the first job, 58.5 per cent were males and 9.6 per cent females, whereas of those w h o replied negatively 26.0 per cent were males and 5.8 per cent females. B y place of birth, 45.3 per cent were from urban and 22.9 per cent from rural areas w h o responded positively, and 21.2 per cent and 10.6 per cent respectively w h o considered that their higher education w a s not suitable for the first job.
W h o should select graduates?
T h e graduates were asked their opinions concerning w h o they felt should be responsible for the selection of graduates for jobs. A s can be seen from Table 50, the majority seem to favour the public sector recruitment board, with 41.2 per cent, followed by 39.5 per cent w h o prefer the labour office attached to faculty/college.
W h e n analyzed by sex, age, place of birth, guardian's employment sector, current employment sector, place of work , n o association is noted
124

The higher education graduates
141 135
35 16 15
41.2
39.5
10.2 4.7 4.4
Table 50: Distribution of recruitment agencies
No. %
Public sector recruitment board Placement office attached to each faculty/college Placement office attached to higher education institution
Personal contacts Labour office
with the exception of place of work with a chi-square equal to 16.62 with 8 D F . B y age, of those graduates favouring the public sector recruitment board, 27.2 per cent were in the age-group 29 or under, 13.7 per cent in the age-group 30-39, and 0.3 per cent in the age-group 40 and above. T h e placement office attached to faculty or college comes second with 24.0 per cent in the age-group 29 or under, 14.3 per cent aged 30-39, and 1.2 per cent in the age-group 40 and above. However , preference remains m o r e or less the same for each recruitment method for different age groups.
According to sex, the same importance is given to recruitment board and labour office attached to faculty or college with respectively 32.7 per cent males and 8.5 per cent females and 33.3 per cent males and 6.1 per cent females. W e also note the same pattern with place of birth, current employment sector and place of work where recruitment board and labour office attached to faculty or college are favoured by the graduates.
Substitution between education and occupation
Although graduates m a y change their jobs during their occupational career, these changes can occur without changing field of specialization. But if such changes m e a n that the type of specialization needed for the job is different, this could be a problem for m a n p o w e r planners. A graduate m a y choose a job where the degree of utilization of training acquired in the formal system of higher education is minimal. If an analysis is m a d e of the education received by the graduates and their occupation, it is possible to identify those occupations which need specialized training to a very large extent, those which need such training to a moderate extent and those which do not require a specific specialization. This analysis would reveal flexibility of certain occupations vis-a-vis specialization as well as flexibility of certain types of training vis-a-vis occupations.
T o analyze this aspect of substitution between education and occupation, w e have to distinguish two different steps: (i) specialization of the
125

Front college to work: the case of the Sudan
graduates, (ii) substitution between specialization and occupation. T h e graduates were asked in which field they had specialized for their graduation and in which occupation or field they were working.
(i) It is observed from Table 51 that the majority of graduates in our survey specialized in social sciences (31.8 per cent), followed by business and accounting with 20.8 per cent, and engineering/technology and arts with 13.0 per cent each.
Table 51: Field of specialization of graduates
Natural science Engineering and technology Health Arts Social sciences Physical education Business and accounting Law Agriculture Veterinary science Other
N u m b e r
27 45 11 45
110 2
72 12 12 4 6
Adj. %
7.8 13.0 3.2
13.0 31.8 0.6
20.8 3.5 3.5 1.2 1.7
Further analysis shows that there is an association between field of specialization and the sex of the graduates (chi-square = 6.39 with 3 D F ) . Out of the total respondents, the proportion of females having studied arts-based subjects is higher than that of males (83.6 per cent and 67 per cent respectively). A m o n g the graduates w h o studied science-based subjects, there were considerably more males than females (90.7 per cent against 9.1 per cent). A m o n g the male graduates, 30.9 per cent had a science-based specialization as compared with 16.4 per cent a m o n g females. M o r e than four out of five female graduates were from arts-based subjects.
W e also note a high degree of association between the current employment sector and the field of specialization (chi-square = 31.08 with 6 D F ) . There were more graduates of science-based subjects in the government sector (proportionately) than in the others (85.7 per cent of the total science-based graduates). T h e same is noted with graduates of arts-based subjects, with 76.7 per cent of the total arts-based graduates working in the government sector. A m o n g those working in the private sector, 80.0 per cent were from arts-based subjects. However what is striking is that as the type of control changes from government to private, the percentage of
126

The higher education graduates
science-based graduates decreased from 31.3 per cent to 10 per cent whereas the proportion of arts graduates increased from 67.5 per cent to 80 per cent.
A s far as the field of work is concerned, w e note from Table 52 that the majority of the graduates were employed in the social sciences field (28.2 per cent), followed by those working in business and accounting (27.1 per cent), and the last being those working in veterinary sciences (0.7 per cent).
Table 52: Graduates field of work
Natural sciences Engineering and technology Health Arts Social sciences Physical education Business and accounting Law Agriculture Veterinary science Other Missing
N u m b e r
20 40 10 24 82 3
79 12 12 2 7
57
Adj. %
6.9 13.7 3.4 8.2
28.2 1.0
27.1 4.1 4.1 0.7 2.4
-
(ii) A s far as substitution between specialization and occupation is concerned, w e find that current job held by the graduates corresponds well with the field of training. T h e degree of association is highly significant (chi-square = 359.68 with 4 D F ) , this on the basis of the two variables grouped into broad categories, e.g. arts-based, science-based and others.
W h e n the analysis is carried out by disciplines, such association is confirmed in the sense that in most cases the percentage of graduates working in a certain field had specialized in the corresponding field of study. For example, 83.3 per cent of those w h o graduated in natural sciences and 97.4 per cent of those w h o graduated in engineering and technology were working in related fields. For veterinary science, 100 per cent of graduates in this discipline work in the related field.
The analysis shows a very high degree of association between the field of specialization and the field of work (chi-square = 1929.81 with 100 D F ) which signifies little difficulty for m a n p o w e r planners in their forecasting tasks insofar as the use of the education/occupation matrix is concerned. (See Tables V1.17 to VI.19 in the Annex).
127

From college to work: the case of the Sudan
Another way to study mobility between education and occupation is to observe the way in which individuals in each educational category are distributed over the occupational categories and vice-versa.
S o m e fields of work are more flexible in respect of training needs than others, and some specializations allow for taking up more varied types of responsibilities than others. For example, those w h o are working in the field of business and accountancy c o m e not only from this field, but also from arts, social science and even natural sciences. Those w h o are practising law also derive their main specialization from other disciplines, such as social science and business and accountancy. These fields of work are therefore more flexible. O n the other hand, as a field of work the most restrictive is natural science which derives all its graduates from that specific field of study.
. A s regards the fields of study, arts is the most flexible since almost half of these graduates are working in fields other than arts, namely social science, physical education, business and accountancy, etc. At the other extreme, business and accountancy as a field of study appears to be m o r e rigid in that almost all of them work in business and accountancy. Engineering and technology, health, law, agriculture, veterinary science, all fall into this category. Natural science graduates have some flexibility, as is noted from their distribution in such fields of work as engineering and technology, agriculture and even social science. O f course, most of them (20 out of 24 in our sample) work as natural scientists.
This kind of substitution can be interpreted both positively and negatively. W h e n it reflects flexibility of the labour market or of the education system, the phenomenon is positive. But, when such shifts in education and occupation occur due to shortage or oversupply of s o m e graduates, and if this creates disappointment a m o n g the graduates in respect of utilization of their training, then the result m a y be negative and the phenomenon could be termed as a 'mismatch' between education and occupation.
Reasons for taking a job not matching specialization
It is important to k n o w why a graduate would accept a job not fitting his or her specialization. For this purpose graduates were asked to specify the reasons that m a d e them take a job not fitting their specialization. T h e results are given in Table 53.
Flexibility of job requirements seems to be the main reason for graduates accepting jobs not related to their specialization, with 53.5 per cent. However, 25.2 per cent referred to the impossibility of finding a job matching their specialization.
W h e n the analysis is carried out according to criteria such as age, sex, place of birth, current employment sector and place of work, w e note that
128

The higher education graduates
Table 53: Reasons for taking a job not matching specialization
Could not find a job fitting specialization Flexibility of job requirements Flexibility of specialization Better future career possibilities B y promotion Other reasons
No.
29 61 12 10 5
20
there is no association with reasons for accepting a job not fitting specialization, with the exception of older graduates w h o mentioned promotion as the reason, and the larger number of male graduates accepting such jobs because of the flexibility of the job needs.
Attitudes towards employment in rural areas
In the Sudan, there is a considerable migration from the rural areas to the cities. O n e of the reasons for this rural exodus is the location of the' institutes of higher education in the urban areas. It is however important to develop the rural areas and this needs qualified manpower. T h e distribution of benefits derived from higher education, the reduction of rural exodus and the achievement of a balanced development of the country require an equitable distribution of the products of the higher education system throughout different parts of the country. A s elsewhere in the developing world, rural areas in the Sudan are neglected. O n e of the problems that face the decision-maker is to identify those factors that could attract graduates towards the rural areas. It is also necessary to identify those factors discouraging graduates from the rural sector, in order to find corrective measures.
(i) What encourages graduates to work in rural areas?
Certain factors were identified which could attract graduates to work in rural areas. Table 54 shows the distribution of the responses of the graduates as far as these factors are concerned.
F r o m the above table, it appears that the factor that would most encourage graduates to work in rural areas is their desire to contribute to rural development (51.4 per cent), followed by low cost of living (44.2 per cent), and the fact that they c o m e from a rural area (22.2 per cent). The idealistic attitude of the graduates in wanting to contribute to rural devel-
129

From college to work: the case of the Sudan
Table 54: Factors encouraging w o r k in rural areas
N o . of factors
C o m e from rural area L o w cost of living Financial incentives More chance of job promotion Contribution to rural development Other
Respondents
65 129 23 22
150 26
%
22.2 44.2 7.9 7.5
51.4 8.9
o p m e n t should be exploited by the decision-makers for the benefit of the rural areas.
What discourages graduates from working in rural areas?
T h e graduates were also asked to indicate the factors that might discourage them from working in rural areas. T h e distribution of the responses is given in Table 55.
Table 55: Factors discouraging work in rural areas
Lack of basic services Isolation from friends Fear of missing promotion Monotonous life Other
N o . of respondents
124 75
102 63 45
%
43.8 26.5 36.0 22.3 16.0
Lack of basic services is the main reason with 43.8 per cent of the respondents followed by missing promotion opportunities with 36 per cent. Also fairly important are isolation from family and friends and the dull life in rural areas. Although provision of basic services would need additional resources, it would appear that if job opportunities with career incentives for promotion could be created in the rural areas then m o r e graduates might be attracted towards villages. A s w e have seen above these have to be added to the measures which could encourage graduates to w o r k in the rural areas.
130

The higher education graduates
Factors contributing to job satisfaction
T h e opinions of graduates in respect of factors that play an important role in making a job satisfactory are based on their experience since they are already in the labour market. The importance attached to each factor can contribute in assisting the employers to take corrective action if necessary and to formulate rules and regulations for their employees. Such information can also help researchers and planners to clearly establish the role that each of the factors might play in the choice of a job by a potential employee, and therefore in the distribution of highly qualified manpower . T h e factors identified as contributing to job satisfaction, and the responses of the graduates are given in Table 56.
Table 56: Factors contributing to job satisfaction
Factors
Use of skills and initiative Creative work Opportunity for further training/study
Helpful to others Good salary G o o d working environment Travel, vacation, etc. Other
N u m b e r of respondents
280 194
284 127 150 203 33
7
%
82.4 57.1
83.5 37.4 44.4 60.1 9.8 2.1
W e note that not m u c h importance is given to good salary possibilities which is ranked fifth, whereas opportunities for further study, use of skills and initiative, and a good working environment c o m e first, second, and third. Further analysis using certain background variables has been carried out and is summarized below.
(i) Opportunity for further training and advanced study (83.5 per cent of respondents)
This factor was considered by the graduates as the most important for job satisfaction. W e note 84.5 per cent males and 15.5 per cent females, (being respectively 83.9 per cent and 81.5 per cent of the total respondents), and 65.2 per cent from urban and 34.8 per cent from rural areas, (representing respectively 82.5 per cent and 85.2 per cent of the total respondents), w h o cite this as an important factor for job satisfaction.
131

From college to work: the case of the Sudan
According to age, 63.4 per cent were in the age-group 29 or under, 34.9 per cent in the age-group 30-39 and 1.8 per cent were aged 40 or more (respectively 85.7 per cent, 81.1 per cent and 62.5 per cent of the total respondents). By current employment sector, 79.9 per cent were in the government sector, 14.0 per cent in the semi-government, 5.4 per cent in the private sector and 0.7 per cent in other sectors (representing respectively 84.5 per cent, 81.3 per cent, 78.9 per cent and 66.7 per cent of the total respondents).
(ii) Use of skills and initiative (82.4 per cent of the respondents)
It was observed that 83.9 per cent males and 16.1 per cent females (representing respectively 82.2 per cent and 83.3 per cent of the total number of males and females), cited use of skills and initiative as an important factor for job satisfaction. According to place of birth of the graduates, 64.7 per cent were from urban and 35.3 per cent from rural areas (representing respectively 80.7 per cent and 85.2 per cent of the total from urban and rural areas). By age, w e noted that 61.1 per cent were aged 29 or under, 36.8 per cent aged 30-39 and 2.1 per cent aged 40 or more (respectively 81.4 per cent, 84.4 per cent and 75.0 per cent of the total number of respondents).
Amongst the 82.4 per cent of the graduates w h o consider this factor the most important for job satisfaction, 80.4 per cent work in the government sector, 13.1 per cent in semi-government, 5.5 per cent in the private sector and 1.1 per cent in other sectors, (being respectively 83.7 per cent, 73.0 per cent and 100 per cent of the total equivalent population w h o responded). It could therefore be observed that there is not m u c h difference a m o n g the graduate sub-groups on their attitude towards this factor.
(Hi) Good working environment (60.1 per cent of the respondents)
Amongst the graduates w h o considered this factor as contributing to job satisfaction, 86.2 per cent were males and 13.8 per cent females; 62.7 per cent were from urban areas and 37.3 per cent from rural areas. According to age, 60.1 per tent were in the age-group 29 or under, 36.9 per cent were aged 30-39 and 3.0 per cent were in the age-group 40 or more.
(iv) Creative work (57.1 per cent of the respondents)
O f those graduates w h o considered that the possibility for creative work contributed to job satisfaction, 87.1 per cent were males and 12.9 per cent females (representing respectively 59.1 per cent and 46.3 per cent of the total males and total females); 66.1 per cent were from urban and 33.9 per cent from rural areas, (57.0 per cent and 56.5 per cent respectively of the total from urban and rural areas), w h o cited this as an important factor for job satisfaction.
132
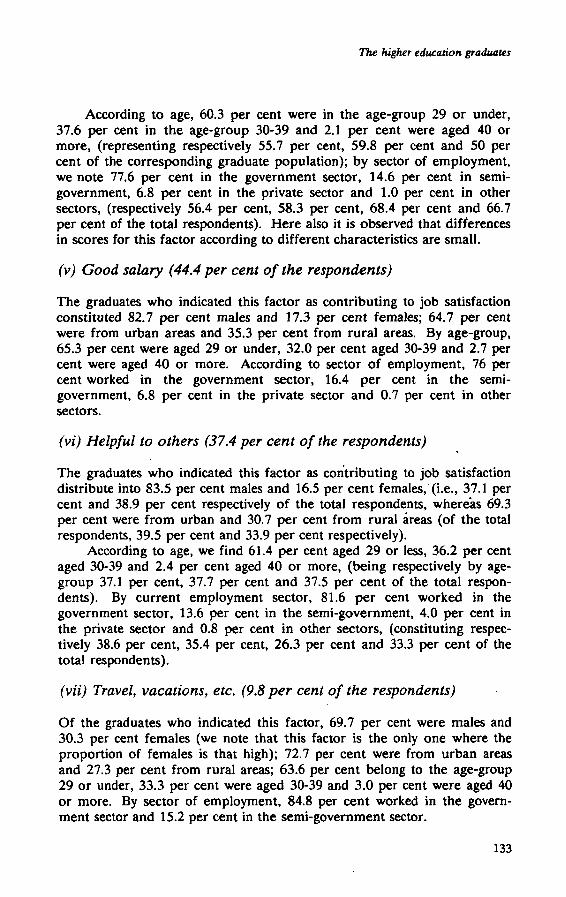
The higher éducation graduates
According to age, 60.3 per cent were in the age-group 29 or under, 37.6 per cent in the age-group 30-39 and 2.1 per cent were aged 40 or more , (representing respectively 55.7 per cent, 59.8 per cent and 50 per cent of the corresponding graduate population); by sector of employment, w e note 77.6 per cent in the government sector, 14.6 per cent in semi-government, 6.8 per cent in the private sector and 1.0 per cent in other sectors, (respectively 56.4 per cent, 58.3 per cent, 68.4 per cent and 66.7 per cent of the total respondents). Here also it is observed that differences in scores for this factor according to different characteristics are small.
(v) Good salary (44.4 per cent of the respondents)
The graduates w h o indicated this factor as contributing to job satisfaction constituted 82.7 per cent males and 17.3 per cent females; 64.7 per cent were from urban areas and 35.3 per cent from rural areas. By age-group, 65.3 per cent were aged 29 or under, 32.0 per cent aged 30-39 and 2.7 per cent were aged 40 or more. According to sector of employment, 76 per cent worked in the government sector, 16.4 per cent in the semi-government, 6.8 per cent in the private sector and 0.7 per cent in other sectors.
(vi) Helpful to others (37.4 per cent of the respondents)
The graduates w h o indicated this factor as contributing to job satisfaction distribute into 83.5 per cent males and 16.5 per cent females, (i.e., 37.1 per cent and 38.9 per cent respectively of the total respondents, whereas 69.3 per cent were from urban and 30.7 per cent from rural áreas (of the total respondents, 39.5 per cent and 33.9 per cent respectively).
According to age, w e find 61.4 per cent aged 29 or less, 36.2 per cent aged 30-39 and 2.4 per cent aged 40 or more, (being respectively by age-group 37.1 per cent, 37.7 per cent and 37.5 per cent of the total respondents). By current employment sector, 81.6 per cent worked in the government sector, 13.6 per cent in the semi-government, 4.0 per cent in the private sector and 0.8 per cent in other sectors, (constituting respectively 38.6 per cent, 35.4 per cent, 26.3 per cent and 33.3 per cent of the total respondents).
(vii) Travel, vacations, etc. (9.8 per cent of the respondents)
O f the graduates w h o indicated this factor, 69.7 per cent were males and 30.3 per cent females (we note that this factor is the only one where the proportion of females is that high); 72.7 per cent were from urban areas and 27.3 per cent from rural areas; 63.6 per cent belong to the age-group 29 or under, 33.3 per cent were aged 30-39 and 3.0 per cent were aged 40 or more. By sector of employment, 84.8 per cent worked in the government sector and 15.2 per cent in the semi-government sector.
133

From college to work: the case of the Sudan
Factors that m a k e higher education more relevant to job requirements
T h e graduates were asked to rate the factors listed below as to their importance in making higher education m o r e relevant to work requirements:
(a) Interspersing study courses with on-the-job training;
(b) making work experience a requirement for graduation;
(c) giving teaching staff the chance to follow-up n e w developments in their fields.
T h e graduates being already in the labour market are in a position to suggest some practical ideas to ensure that higher education is better related to work requirements. T h e three components given above are assumed to be important in the improvement of interaction between study and work requirements. Table 57 gives the responses of the graduates.
Table 57: W a y s to better relate higher education to job requirements
Most Not important Important important
No. % No. % No. % (i) Interspersing study
with work 164 49.0 123 36.7 48 14.3 (ii) W o r k experience a
requirement for graduation 115 35.7 82 25.5 125 38.8
(iii) Giving teaching staff opportunity to follow new developments 64 20.2 117 36.9 136 42.
If w e assign a score of 3 to most important, 2 to important and 1 to not important, w e obtain for the three factors the scores s h o w n in Table 58.
Interspersing study courses with periods of w o r k experience is considered the most important factor in making higher education m o r e relevant to work requirements.
Further analysis according to background variables shows that out of the total respondents 9.0 per cent belong to the age-group 29 or under, 4.8 per cent to the age-group 30-39, and 0.6 per cent to the age-group 40 and
134

The higher education graduates
Table 58: R a n k of the three factors
Score R a n k % to total
(i) 451 1 44.7 (ii) 312 2 30.9 (iii) 245 3 24 .3
over, w h o indicated that the first factor w a s not i m p o r t a n t in m a k i n g higher education m o r e relevant to w o r k requirements, w h e r e a s 5 2 . 8 per cent in the age -group 2 9 or u n d e r , 3 1 . 3 per cent in the a g e - g r o u p 3 0 - 3 9 a n d 1.5 per cent in the a g e - g r o u p 4 0 a n d over think this factor is important or very important.
In the a g e - g r o u p 2 9 or u n d e r , 8 5 . 5 per cent of .the graduates considered that interspersing study with periods of w o r k w a s important or very important against 14 .5 per cent w h o thought it u n i m p o r t a n t for m a k i n g higher education m o r e relevant to job requirements. In the a g e - g r o u p 3 0 - 3 9 , it w a s respectively 9 5 . 2 per cent a n d 4 .8 per cent, a n d in the age -g r o u p 4 0 a n d over, 7 1 . 5 per cent considered this factor important against 28 .6 per cent w h o felt that it w a s not important.
Accord ing to sex, w e note that out of the total respondents 8 5 . 4 per cent of m a l e s think this factor is important against 1 4 . 6 per cent w h o think it is not, whereas 8 7 . 0 per cent of females consider it important against 13 .0 per cent w h o felt that it w a s not important. Also , 8 7 . 3 per cent of the graduates f r o m u r b a n areas a n d 8 2 . 8 per cent f r o m rural areas think this factor is important or very important.
B y current e m p l o y m e n t sector, w e note that 8 5 . 7 per cent of the total respondents consider that interspersing study with w o r k periods is i m p o r tant, distributing into 6 7 . 8 per cent in the g o v e r n m e n t sector, 12.2 per cent in the s e m i - g o v e r n m e n t sector, 5.1 per cent in the private sector a n d 9 . 6 per cent in other sectors.
T h e second factor, w o r k experience as a requirement for graduation, has also b e e n analyzed according to b a c k g r o u n d variables. B y sex, w e note that 3 4 . 5 per cent of the m a l e respondents a n d 4 .3 per cent of the females think this factor is not important, w h e r e a s 4 9 . 7 per cent male s and 11 .5 per cent females think it is important or very important. B y origin, similarly out of the total respondents 2 9 . 5 per cent f r o m u r b a n a n d 12.8 per cent f rom rural areas think this factor is not important, c o m p a r e d to 3 9 . 4 per cent a n d 2 1 . 8 per cent respectively w h o consider it is important or very important.
B y age, 38 .8 per cent of the total respondents consider this factor as not important against 6 1 . 2 per cent w h o thought that it w a s . T h e y distribute respectively as follows: 2 2 . 7 per cent in the age -group 2 9 or
135

From college to work: the case of the Sudan
under, 15.8 per cent in the age-group 30-39 and 0.3 per cent in the age-group 40 and over considering it unimportant, and 39.8 per cent in the age-group 29 or under, 19.5 per cent in the age-group 30-39, and 1.8 per cent in the age-group 40 and over w h o felt it was important. By current employment sector, 60.6 per cent of the respondents indicated this factor as important or very important.
A s for the third factor, opportunities for teaching staff to follow n e w developments, it is observed that the male graduates were more concerned with such opportunities than their female counterparts (see Table VI.20 in the Annex).
Techniques for finding out about the nature and opportunities for employment
A s graduates were invited to consider the factors that could m a k e higher education more relevant to work requirements, they were also asked their opinions concerning the techniques they felt to be important for finding out about the nature of and opportunities for employment, and their effectiveness. These techniques are: (i) training on the job during study; (ii) information from prospective employers; (iii) following advertisements in mass media; (iv) consulting teaching staff. The responses of the graduates concerning these techniques are given in Table 59
Table 59: Importance
Techniques
(i) Training on the job during study
(ii) Information from prospective employers
(iii) Advertisements in mass media
(iv) Consulting teaching staff
accorded to techniques
Most important No. %
238
53
19
23
73.2
16.2
6.1
7.4
for job information
Important No. %
53
139
47
78
16.3
43.6
15.2
25.2
Not important No. %
34 10.5
127 39.8
244 78.7
209 67.4
A s can be noted from the table below, on-the-job training during study is considered to be the best way of obtaining information on the nature of and opportunities for employment. Further analysis according to background variables reveals the existence of a certain degree of association between techniques and certain variables as indicated in Table 60.
136

The higher education graduates
Table 60: Chi-square statistics for selected variables and three of the techniques
Techniques Variables Chi-square D F
(i) Training on-the-job during study Age 9.77 4 (ii) Information from prospective employers Place of birth 6.92 2
Age 8.80 4 (iii) Advertisement in mass media Age 10.03 4
T h e fourth item consulting teaching staff as a way of obtaining information on employment, did not show any significant association for such background variables as age and h o m e origin, (see Tables V1.21 to 23 in the Annex).
137

From college to work: the case of the Sudan
Table V. 1 Crosstabulation of age by employed
Paid employment
Self-employed Unpaid Row total
20-24
Number Row percentage Colinn percentage Total percentage
25-29
Number Row percentage Column percentage Total percentage
30+
Number Row percentage Column percentage Total percentage
Column Total
34 59.6 44.7 29.3
34 72.3 44.7 29.3
8 66.7 10.5 6.9
76 65.5
12 21.1 57.1 10.3
5 10.6 23.8 4.3
4 33.3 19.0 3.4
21 18.1
11 19.3 57.9 9.5
8 17.0 42.1 6.9
0 0.0 0.0 0.0
19 16.4
57 49.1
47 40.5
12 10.3
116 100.0
Chi Square = 6.16799 with 4 degrees of freedom. Significance » 0.1869
Table V. 2 Crosstabulation of employed by sex
Paid employment
Number Row percentage Column percentage Total percentage
Self-employed
Number Row percentage Column percentage Total percentage
Unpaid
Number Row percentage Column percentage Total percentage
Column Total
Male
57 76.0 64.8 49.6
13 61.9 14.8 11.3
18 54.7 20.5 15.7
88 76.5
Female
18 24.0 66.7 15.7
8 38.1 29.6 7.0
1 5.3 3.7 0.9
27 23.5
Row Total
75 65.2
21 18.3
19 16.5
115 100.0
Chi Square - 6.01760 with 2 degrees of freedom. Significance * 0.0494

The higher education graduates
Table V.3 Crosstabulation of factors of job satisfaction by field of study
Social Sciences $ Humanities
Art 4 Education
Science $ Medicine
Engineering &
Technology Agriculture Other
Row Total
Use Talents
Number Row percentage Coliim percentage Total percentage
Use Initiative
Number Row percentage Column percentage Total percentage
Creative work
Number Row percentage
Íolumn percentage otal percentage
Opportunity for further studies
Number Row percentage Column percentage Total percentage
Improve competence
Number Row percentage Column percentage Total percentage
Helpful to others
Number Row percentage Column percentage Total percentage
Good income
Number Row percentage Column percentage Total percentage
Travel
Number Row percentage Column percentage Total percentage
Better prospects
Number Row percentage
Íolumn percentage otal percentage Secure future
Number Row percentage Column percentage Total percentage
Work environment
Number Row percentage Column percentage Total percentage
Self-fulfilment
Number Row percentage
Îolumn percentage otal percentage Column Total
Ti
Û 2
11.1 1.2 0.5
«
1;!
•i 26
60.5 16.0 6.1
Û 7
77.8 4.3 1.6
12 32.4 7.4 2.8
1:! 13
31.0 8.0 3.1
60 33.1 37.0 14.1
162 38.0
2Û 0.2
1 100.0
1.3 0.2
14 77.8 18.4 3.3
25.8 10.5 1.9
0
8:8 0.0
4 11.4 5.3 0.9
1 2.3 1.3 0.2
0 0.0 0.0 0.0
0 0.0 0.0 0.0
5 13.5 6.6 1.2
3 23.1 3.9 0.7
2 4.8 2.6 0.5
37 20.4 48.7
8.7 76
17.8
1 25.0 1.1 0.2
y û
44 24.3 47.8 10.3
92 21.6
¡J
Û 1
5.6 3.3 0.2
1:1 0.2
0.2
Û
«
5 H 0.5
0 0.0 0.0 0.0
3 8.1
10.0 0.7
0
8:8 0.0
4 9.5
13.3 0.9
4 7*8
û û û
2
H 0.5
II
y 3
7.0 5.9 0.7
2Û 0.2
'1:1 0.2
6 16.2 11.8 1.4
ïi 19.0 15.7 1.9
26 14.4 51.0 6.1 SI
12.0
OOO
OOOO
ooo
oooo
1
Í.-Í 0.2
1
l:1
0.2
oooo
ooo
2 5.7
13.3 0.5
oooo
oo'o
ooo
oooo
OOOO
OOO
2 5.4
13.3 0.5
ooo
oooo
4 9.5
26.7 0.9
5 2.8
33.3 1.2 15 3.5
4 0.9
1 0.2
18 4.2
31 7.3
8 1.9
35 8.2
43 10.1
4 0.9
9 2.1
37 8.7
13 3.1
42 9.9
181 42.5
426 100.0
139

Front college to work: the case of the Sudan
Table V . 4 Crosstabulation of expected wait after graduation for first job by age
20-24 25-29 30+ Row total
No wait
Number Row percentage Column percentage Total percentage
Under 3 months
Number Row percentage Column percentage Total percentage
3-6 months
Number Row percentage Column percentage Total percentage
6-12 months
Number Row percentage Column percentage Total percentage
More than 12 months
Number Row percentage Column percentage Total percentage
Column Total
Chi Square = 19.59987 with
42 39.6 19.4 10.0
93 58.9 42.9 22.2
46 48.9 21.2 11.0
13 56.5 6.0 3.1
23 60.5 10.6 5.5
217 51.8
50 47.2 28.4 11.9
59 37.3 33.5 14.1
43 45.7 24.4 10.3
10 43.5 5.7 2.4
14 36.8 8.0 3.3
176 42.0
8 degrees of freedom.
14 13.2 53.8 3.3
6 3.8 23.1 1.4
5 5.3
19.2 1.2
0 0.0 0.0 0.0
1 2.6 3.8 0.2
26 6.2
Significance =
106 25.3
158 37.7
94 22.4
23 5.5
38 9.1
419 100.0
0.0120
140

Table V. 5
The higher e¡
Crosstabulation of expected wait aflt& graduation for first job by s e x A ' á
Male Female
No wait
Number Row percentage Column percentage Total percentage
Under 3 months
Number Row percentage Column percentage Total percentage
3-6 months
Number Row percentage Column percentage Total percentage
6-12 months
Number Row percentage Column percentage Total percentage
More than 12 months
Number Row percentage Column percentage Total percentage
Column Total
Chi Square = 4.85120 with '
88 84.6 26.9 21.2
117 74.5 35.8 28.1
73 77.7 22.3 17.5
17 73.9 5.2 4.1
32 84.2 9.8 7.7
327 78.6
I degrees of freedom.
16 15.4 18.0 3.8
40 25.5 44.5 9.6
21 22.3 23.6 5.0
6 26.1 6.7 1.4
6 15.8 6.7 1.4
89 21.4
Significance =
104 25.0
157 37.7
94 22.6
23 5.5
38 9.1
416 100.0
= 0.3029
141

From college to work: the case of the Sudan
Table V.6 Crosstabulation of expected wait after graduation for first job by course duration
Course duration 2 years 3 years 4 years 5 years 6 years
Total
No wait
Number Row percentage Column percentage Total percentage
Under 3 months
Number Row percentage Column percentage Total percentage
3-6 months
Number Row percentage Column percentage Total percentage
6-12 months
Number Row percentage Column percentage Total percentage
More than 12 months
Number Row percentage Column percentage Total percentage
Column Total
Chi Square = 92.65945
1 1.0
50.0 0.2
0 0.0 0.0 0.0
0 0.0 0.0 0.0
0 0.0 0.0 0.0
1 2.6
50.0 0.2
2 0.5
with 16 degrees
19 18.1 22.9 4.5
58 36.7 69.9 13.9
5 5.3 6.0 1.2
0 0.0 0.0 0.0
1 2.6 1.2
.0.2
83 19.9
of freedom
63 60.0 26.8 15.1
59 37.3 25.1 14.1
58 61.7 24.7 13.9
21 91.3 8.9 5.0
34 89.5 14.5 8.1
235 56.2
. Signif
109 18.1 23.5 4.5
37 23.4 45.7
8.9
21 22.3 25.9
5.0
2 8.7 2.5 0.5
2 5.3 2.5 0.5
81 19.4
i canee = 0,
3 2.9
17.6 0.7
4 2.5
23.5 1.0
10 10.6 58.8 2.4
0 0.0 0.0 0.0
0 0.0 0.0 0.0
17 4.1
.0000
105 25.1
158 37.8
94 22.5
23 5.5
38 9.1
418 100.0
142
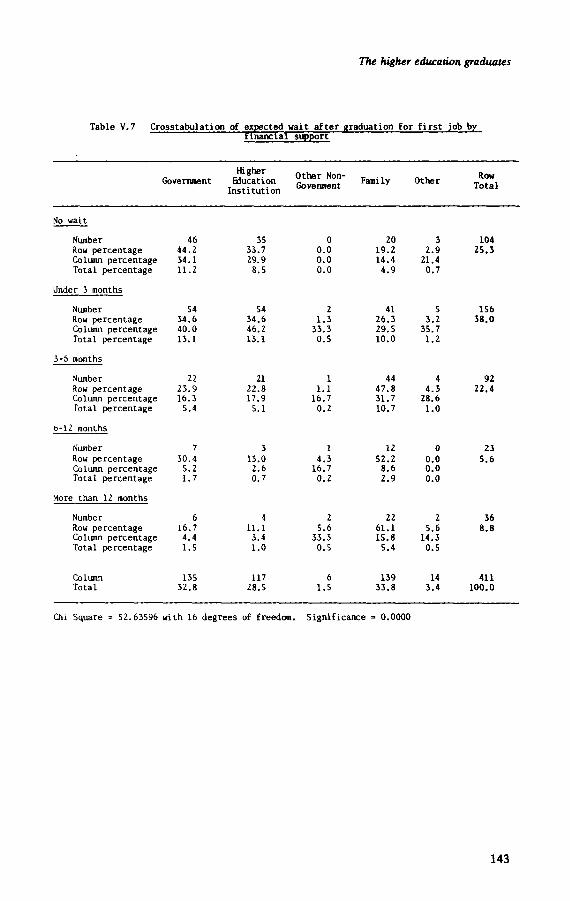
The higher education graduates
Table V.7 Crosstabulation of expected wait after graduation for first job by financial support
Government Higher
Education Institution
Other Non-Govenment
Family Other Row
Total
No wait
Number Row percentage Column percentage Total percentage
Under 3 months
Number Row percentage Column percentage Total percentage
3-6 months
Number Row percentage Column percentage Total percentage
6-12 months
Number
Row percentage Column percentage Total percentage
More than 12 months
Number Row percentage Column percentage Total percentage
Column Total
Chi Square = 52.63596
46 44.2 34.1 11.2
54 34.6 40.0 13.1
22 23.9 16.3
5.4
7 30.4
5.2 1.7
6 16.7
4 .4 1.5
135 32.8
with 16 degrees
35 33.7 29.9
8.5
54 34.6 46.2 13.1
21 22.8 17.9
5.1
3 13.0
2.6 0.7
4 11.1
3.4 1.0
117 28.5
of freedom.
0 0.0 0.0 0.0
2 1.3
33.3 0.5
1 1.1
16.7 0.2
1
4.3 16.7
0.2
2 5.6
33.3 0.5
6 1.5
Significance
20 19.2 14.4
4.9
41 26.3 29.5 10.0
44 47.8 31.7 10.7
12
52.2 8.6 2.9
22 61.1 15.8
5.4
139 33.8
=• 0.0000
3 2.9
21.4 0.7
5 3.2
35.7 1.2
4 4 .3
28.6 1.0
0 0.0 0 .0 0.0
2 5.6
14.3 0.5
14 3.4
104 25.3
156 38.0
92 22.4
23
5.6
36 8.8
411 100.0
143

From college to work: the case of the Sudan
Table V.8 Crosstabulatlon of expected wait after graduation for first job by type ot support
Free lodging 5 meals
Free lodging S grant
Grants Other Row Total
NQ wait
Number 41 Row percentage 42.7 Column percentage 20.7 Total percentage 11.2
Under 3 months
Number 82 . Row percentage S7.7 Column percentage 41.4 Total percentage 22.3
3-6 months
Number 52 Row percentage 61.9 Column percentage 26.3 Total percentage 14.2
6-12 months
Number 14 Row percentage 70.0 Column percentage 7.1 Total percentage 3.8
More than 12 months
Number 9 Row percentage 36.0 Column percentage 4.5 Total percentage 2.5
Column 198 Total 54.0
32 33.3 36.4 8.7
37 26.1 42.0 10.1
16 19.0 18.2 4.4
1 5.0 1.1 0.3
2 3.0 2.3 0.5
88 24.0
reedom.
20 20.8 33.3 5.4
21 14.8 35.0 5.7
9 10.7 15.0 2.5
2 10.0 3.3 0.5
8 32.0 13.3 2.2
60 16.3
Significance -
3 3.1
14.3 0.8
2 1.4 9.5 0.5
7 8.3
33.3 1.9
3 15.0 14.3 0.8
6 24.0 28.6 1.6
21 5.7
= 0.0000
96 26.2
0.8
142 38.7
84 22.9
20 5.4
25 6.8
367 100.0
Chi Square =• 47.95610 with 12 degrees of freedom.
144

The higher education graduates
o» o
^ o
ro
r-K
ie
OK
iH
K
Ï 0
0>
I*-
rO
^ O
O
O
O
O
o
o o
t-H r
o
O
lO
O
^(
Ot
OO
o
m
©
^
H
• •
• IO
r-
rsi
f K
Ï
Oi
OO
V
)—
••
••
iû
r-
csi
(sj
»O
oo
o
»
t--
rsi
ir>
O
rO
•
• •
H<
C<
£
r-1
• •
• N
rO
N
O
O O
O
o
o
o
NrO
Oiirt
1/IK
tO
11
oor-
N
CN
l O
.-t
c*i
t—
f»
u
t
oo
oo
o
i a
i i/>
r-
r- N
o
t<-
\o O
r~-
K>
o> i*i
r-
•-Î f-*
O
r_l ^
H
•—I
(-1
r-3 oí O
O
O
O
O
o
o
o
o o
o o
o
o o
rO
iO
i^
H
o> ^
r- o>
(VJ
• •
•
OO
-
^ tO
O
O O
O
o
o
o
o o
o o
o
o o
o>
o
»
•*
i/i
r» o
<
* i—
1
ÍM
r-
i-t O
^
fM
• •
•
r~
oí *o
>—
i r^
Lrt
\0
O
»
O
od
• •
•
(M
rj
«^
rtO
r»
-
^
i-i rH
|-~ 0
0 O
<
-H
•—
(•
••
O r
^
M
oo H
en
(M
r^
rt i/i
OO
WO
irt
^ O
Ü
tu
•a
Ki
NH
Uí N
BO
N
1
r-
<-<
l
oo* -4
O
r-j m
to
o
»
r-- o
o -o
i-«
m
^
^H
O
O O
O
o o
o
•4
\0
O
* rg
NN
O
ff ¡S. s.
ill
je
•s
§3
145

Front college to work: the case of the Sudan
Table V. 10 Crosstabulâtion of expected income by sex
SE10-60
Number Row percentage Colmn percentage Total percentage
§£61-110
Number Row percentage Column percentage Total percentage
SE111-160
Number Row percentage Column percentage Total percentage
SE161-210
Number Row percentage Column percentage Total percentage
SE211 +
Number Row percentage Column percentage Total percentage
Column Total
Male
22 52.4 8.8 6.9
121 79.1 48.4 37.8
69 86.3 27.6 21.6
17 85.0 6.8 5.3
21 84.0 8.4 6.6
250 78.1
Female
20 47.6 28.6 6.3
32 20.9 45.7 10.0
11 13.8 15.7 3.4
3 15.0 4.3 0.9
4 16.0 5.7 1.3
70 21.9
Row Total
42 13.1
153 47.8
80 25.0
20 6.3
25 7.8
320 100.0
Chi Square 3 20.51866 with 4 degrees of freedom. Significance = 0.0004
146

The higher education graduates
Table V. 11 Crosstabulation of expected income by place of birth
Rural Urban Row Total
SE10-60
Number Row percentage Column percentage Total percentage
SE61-110
Number Row percentage Column percentage Total percentage
SE111-160
Number Row percentage Column percentage Total percentage
SE161-210
Number Row percentage Column percentage Total percentage
SE211 +
Number Row percentage Column percentage Total percentage
Column Total
25 59.5 16.1 8.0
69 47.3 44.5 22.2
42 52.5 27.1 13.5
8 44.4 5.2 2.6
11 44.0 7.1 3.5
155 49.8
17 40.5 10.9 5.5
77 52.7-49.4 24.8
38 47.5 24.4 12.2
10 55.6 6.4 3.2
14 56.0 9.0 4.5
156 50.2
42 13.5
146 46.9
80 25.7
18 5.8
25 8.0
311 100.0
Chi Square = 2.74120 with 4 degrees of freedom. Significance 0.6020
147

From
colleg
e to w
ork: the case o
f the Sudan
1
5>
ï 'u
V
Í ^ o s*_g g I! Jfl
o*
r*-
i-«
«O
^
H r
*
rO,
--Í (J>
f»
«•*i r- ro
r»
Nf
OO
*t
LO O
rf
O
O
O
O
o o
o
r(
\O
CO
^
LO
^ ©
•o o
(M
O
• .
•
^4
•
•*- o O
m
O
O
O
O
H*
• .
•
(NI
>
o o
o
r-
LO C
T»
I—
OO
K1
HH
rj
N^
NK
)
O
r-J
**
l-H
U*>
rH
O
K)
•*
in
ifO
r-J
LA
p-
P»
CT
> 0
0
O
i-t ^
*M
O
i—I
•
•
•
rH
fM
t
rg r
CT
> r
ul
vO
O
OO
O
»
(M
C
T»
(-«
O,
1133
r>
«
Hirt
l/>
«T
N
CT
» l-~
M
*f
(tí Q
0
«
*¿ r
t M
CW
(0
V
C
C
MU
SM
Ï s
O
Q O
l
oo r- o
LO
J)
Ol
N
OO
O
LO
LO
> O
O
O
<T>
L
O
• •
. r-1
•
O
O O
O
>0
(O
HN
r0
\O
C"J
••T O
I-I
^,
CT
»
TT
r-i
oo
ID
cd oo
U
4-1
ctí
04
C
U
(tí V
C
*J
O
4>
e ^
o
<D
4)
1-
r&
l 8^
«
g
»n
u
3 O
Q
O
Z <
* O
(-
s IVl A 9T3S
5 s I
»u
n
oo
V
4J
«1
»c
u
« »
c
4J U
4)
e t.
u
c
u t.
üa2
L M
ï
S rf <->
ã8£
i S£21
1
1
00
4J
(tí
00
Q>
4-»
(tí
DO
C
W
(tí 4>
C
*J
U
0)
ci-u
<D
O
J 1
-
ti &8
. 8
.1-
3 (tí
ï ^
*J
O
Q
O
o¿ O
H
i«
rf
4J
3,2
148
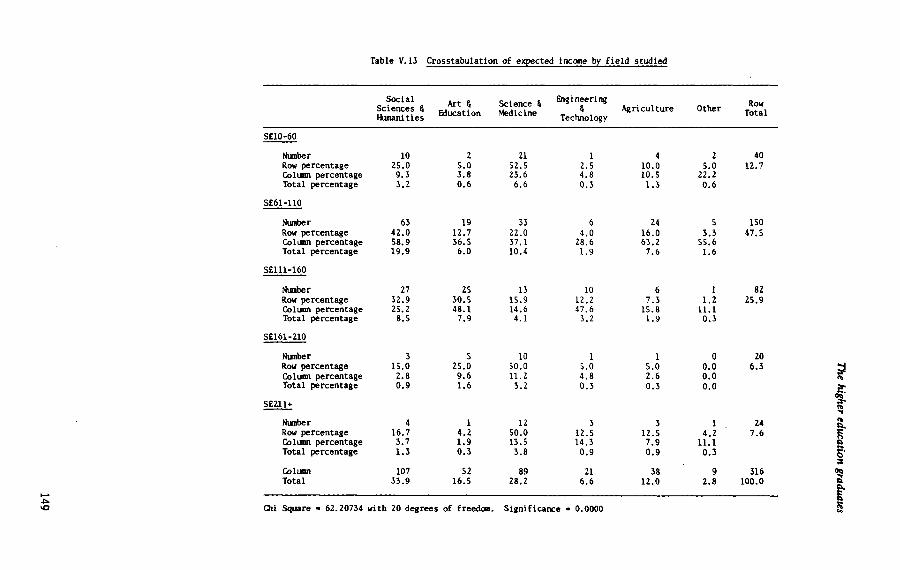
The higher education graduates
S
5 ff
Äi
'«J 1
/îX
\0 O
i-H
•
Kí
O
N
ON
«O
l/l K
> vO O
Kï
l/l fH
MN
Hi
O
.-* ^ O
O
O O
O
o
o
o
^ rH
O
^O
Wr
t O
OH
1—
1 f—
1
24 16.0 63.2 7.6
\0
Kl
CO 5
i
.—i
—• o
o
*n
l/IN
O
m
LO
O» O
»
NV
O
HI/)C
OK
I
(si •»* O
O
O
O
Oí
O
Csl ^
O
(SJ
M
r n
HO
CC
ÍO
in «*
o
) ifi *s¡
Oï
Hv
O
• .
• rs|
. (sj ^
o
>0
Lrt ^
o
sO
Ni
O>
0
LO
(S
I
•O
O
.-< *
* K
Ï .
. .
<si r- o
(M
K
í rt
(O
UO
H
UT
t ^
i—
1
t—1
O
O
ÍSI
c-J
!—«•.•
O
r-<
HI
irt
.-H
NO
l/
lO
O
OK
lifl
LO
_
H
MÍT
-rS
*-» CO
4S
3
«!T
«
V
,-H tf) .^
(9 0
W
•*4 O
-rH
a i. i
rsi
O
i—i o
eo
<£
LO
m
©
o
m (si
LO oí
TO
rsi
OI
M/
IO
fvi \0
\0
i-H
rO
t^
OO
iC
i s
O
. .
. (sj
00 O
í t
Ul
H
LO
L
O
-» O
* ÍS
I >
•
.
O
oo t-
rO *»
i--, o
» (si L
O
(SI
>
. >
»O fs
l
LO O
O »O
l^O
tH
(S
I
rtoeooi
LO
(S
| O
t—
t
HN
Ol
tO
«H
O
^-
I
r
f*
vO
lOH
•-•
rs| L
O
ui
• •o
r*
r. o>
o •
f-H
tO
fO
I:
V
où
4>
(fl M
oo tí
+J
rt 0)
C
*J
L>
4)
C I-
U
V 4>
U
18
.1-
V
00 4
) A
00
4)
*¿ rt
W
C 4J
rt
4) tí
4-» U
1
) tí
U
O
0)
4>
U
t¡¡n
ii-s
s
3E
O! O
H
.-H
til 8
*1
lili
O0 tí
+J
<q 4> tí
«Ü
C
C
h
u
4> «
U
t
üa8
. .o
3
c«
3
es
iS5
i2 3,2
!
149

From
co
llege to w
ork: the case of the Sudan
8 5
CT» O
» K
ï tO
in ^
rJ
rg ^
K)
O
rȒ ^
O
.-I O
•-•
Kï
Lft r-
O
OO
^rv
Or-
<-s
| .
. .
OO
OO
O
.-H-**
CT»
0> in
CT»
•—
••
••
NM
n fM
<*-!
O»
O
O
00
l/ï K
l «-«*
•*f r-<
r*j tsi
^ r*
*o r- ro
r i-t
irtr*
tfi
"O
i/too
«r
CT> -o o
*o 00
• •
• o
ortr-
ui
m
rsj
oo oo
\0 C
Ti «t
. .
. r-
oo ^
l/IN
H
O0
O
00 in
O
•*
r-J
-*
OO
O
D O
O
LO
©
*T (*J
Kl
OO
O
«o .
•—<
rsj
in
•s 4-»
'S
g
3 O
O
O
O
o o
o
(*-l K
l O
O
fH
O
O
o o o
o o
o o
r-j o
<?» »O
O
r-J O
O
O O
O
O
O
O*
m
rsi ^
m
CT» r^
.-«
O
O O
O
O
O
O
N0
0O
O
^ O
O
o o
o o
o o
o o
o o o
o o
o o
o o
o o
o o
o o
o o
o o
d
Jt m
tf!
s III! i. 2
oí
8I~ ^
3 «
"5Í
Hl lili!
O0
0)
« w
rt
(0 4)
C
c t-
u 1>
D M
ü o- g.
S5i8
•0> Jli
150

The higher education graduates
Table V.1S Crosstabulation of expected wait after graduation for first job by expected income
S£10 60
Number Row percentage Column percentage Total percentage
SE61-110
Number Row percentage Column percentage Total percentage
SE111-160
Number Row percentage Column percentage Total percentage
S£l61-210
Number Row percentage Column percentage Total percentage
SE211+
Number Row percentage Column percentage Total percentage
Column Total
No wait
3 7.7 3.8 1.0
27 18.2 34.2
8.8
30 38.5 38.0
9.8
7 36.8
8.9 2.3
12 52.2 15.2
3.9
79 25.7
Under 3 months
26 66.7 20.6
8.5
54 36.5 42.9 17.6
33 42.3 26.2 10.7
8 42.1
6.3 2.6
5 21.7
4.0 1.6
126 41.0
3 - 6 months
8 20.5 12.3
2.6
42 28.4 64.6 13.7
9 11.5 13.8
2.9
3 15.8
4.6 1.0
3 13.0
4.6 1.0
65 21.2
6 - 12 months
1 2.6 6.3 0.3
12 8.1
75.0 3.9
1 1.3 6.3 0.3
1 5.3 6.3 0.3
1 4.3 6.3 0.3
16 5.2
More than 12 months
1 2.6 4.8 0.3
13 8.8
61.9 4.2
5 6.4
23.8 1.6
0 0.0 0.0 0.0
2 8.7 9.5 0.7
21 6.8
Row Total
39 12.7
148 48.2
78 25.4
19 6.2
23 7.5
307 100.0
Chi Square • 45.92334 with 16 degrees of freedom. Significance * 0.0001
151

From college to work: the cast of the Sudan
Table V.16 - Crosstabulation of expected income by expected sector of employment
Government Serai -Government Private Row total
SE10-60
Number Row percentage Column percentage Total percentage
SE61-110
Number Row percentage Column percentage Total percentage
SE111-160
Number Row percentage Column percentage Total percentage
161-210
Number Row percentage Column percentage Total percentage
SE161-210
Number Row percentage Column percentage Total percentage
Column Total
Chi Square =• 65.03429 with
38 92.7 16.9 12.0
123 82.6 54.7 38.9
49 59.8 21.8 15.5
5 25.0 2.2 1.6
10 41.7 4.4 3.2
225 71.2
1 2.4 2.9 0.3
12 8.1 35.3 3.8
15 18.3 44.1 4.7
4 20.0 11.8 1.3
2 8.3 5.9 0.6
34 10;8
8 degrees of freedom. S
2 4.9 3.5 0.6
14 9.4 24.6 4.4
18 22.0 31.6 5.7
11 55.0 19.3 3.5
12 50.0 21.1 3.8
57 18.0
ignificance =•
41 13.0
149 47.2
82 25.9
20 6.3
24 7.6
316 100.0
0.000.
152

VI. The employers' perceptions
It is important» to look at the role of employers in the operation of the labour market and interaction between the enterprises and the higher education institutions. Methods of recruitment and criteria used for selecting graduates are important aspects in the placement of graduates from higher education to the world of work and these aspects cannot be ignored by the institutions of higher education. Even if there is an institutional mechanism for placing graduates from the higher education system, this mechanism has to take into account the views, attitudes, practices and expectations of the employers. With better information on the practices of the employers, the higher education institutions can orient prospective graduates towards rational employment on the one hand and .better satisfy the needs of employers on the other. It is however difficult to establish a reliable report on the employers as only 79 questionnaires were completed by the enterprises in our sample. The results, therefore, have to be interpreted and used with caution.
Characteristics of the employers
T h e employers surveyed were chosen from the government, semi-government and private sectors. A m o n g those enterprises that responded, 41 (51.9 per cent) were from the private sector. A s far as type of activity is concerned, 3 (3.8 per cent) were agricultural, 18 (23.1 per cent) industrial, 15 (19.2 per cent) commercial and 42 (53.8 per cent) in the services sector. Cross-classified by sector and type of activity, the distribution is given in Table 61.
The number of employees varies significantly from one firm to another. As regards full-time employees 34 firms (43.0 per cent) had 49 or less employees, 18 (22.8 per cent) had 50 to 99, 7 (8.9 per cent) had 100 to 199 employees, 6 (7.6 per cent) had 200 to 499, and 14 (17.7 per cent) had m o r e than 500 full-time employees. It can be noted that most of the service firms (76 p.c) are in the government sector and the majority of the industrial firms are in the semi-government sector.
153

From college to work: the case of lhe Sudan
Table 61: Sector and type of activity of the enterprises
Activity
Sector
Government N u m b e r Row % Column % Total %
Semi-Government N u m b e r Row % Column % Total %
Private N u m b e r Row % Column % Total %
Column Total
Agriculture
3 7.5
100.0 3.9
-0.0 0.0 0.0
-0.0 0.0 0.0
3 3.8
Industry
3 7.5
16.7 3.8
12 41.4 66.7 15.4
3 33.3 16.7 3.8
18 23.1
C o m m e r c e
2 5.6
13.3 2.6
9 31.0 60.0 11.5
4 44.4 26.7
5.1
15 19.2
Services
32 30.0 76.2 41.0
8 27.6 19.0 10.3
2 22.2 4.8 2.6
42 53.9
Total
40 51.3
29 37.2
9 11.5
78 100.0
Chi Square = 31.43088 with 6 degrees of freedom.
Significance = 0.0000.
For part-time employees, 71 firms (89.9 per cent) had 49 or less, 2 (2.5 per cent) had 100 to 199.1 (1.3 per cent) had 200 to 499, and 3 (3.8 per cent) had m o r e than 500 part-time employees.
Other characteristics such as n u m b e r and types of higher education graduates employed are shown in Table 62.
O u t of 76 enterprises, 69 (90.8 per cent) have a job description mechanism in their establishments against 7 (9.2 per cent) that do not.
154

The employers' perceptions
Table 62: Distribution of firms by types of graduates
Categories number of employees
49 or less 50-99 100-299 300 +
General
No % 69 87.3
8 10.1 1 1.3 1 1.3
Professional
No. 71
7 -1
% 89.9
8.9 -
1.3
Technical
No. 75 4 --
% 94.9
5.1 --
Services & administration
No: % 74 93.7
4 5.1 -1 1.3
Selection criteria for employment of graduates
With the objective of identifying the different criteria used in the selection of graduates, the following eight were identified as being generally practised in the country: (i) level of academic qualification, (ii) testing and interviews, (iii) previous work experience, (iv) recommendation, (v) general appearance, (vi) marital status, (vii) sex, and (vii) age. T h e employers were asked to indicate the degree of importance accorded to each of these criteria. T h e overall results are given in Table 63.
Table 63:
Criteria
Level of academic qualifications
Testing & interviews
Previous work experience
Recommendation
Degree of importance of different selection criteria
Very Important
3
7 49
General appearance 7 Marital status Sex Age
42 40 13
-
(3.8)
(8.9) (62.0) (8.9)
(53.2) (50.6) (16.5)
Important
11 (13.9)
30 (38.0)
23 (29.1) 7 (8.9)
44 (55.7) 16 (20.3) 13 (16.5) 39 (49.4)
Unimportant
63 (79.7)
35 (44.3)
39 (49.4) 1 (1.3)
12 (15.2) 4 (5.1)
10 (12.7) 12 (15.2)
N o response
5
11
10 22 16 17 16 15
(6.3)
(13.9)
(12.7) (27.8) (20.3) (21.5) (20.3) (19.0)
Using a three-point scale to identify the importance of each of the above criteria, a score of '3' was given to the criteria perceived as 'very important', '2 ' to those perceived to be 'important' and '1 ' to those indicated as
155

From college to work: the case of the Sudan
'unimportant'. T h e average score given to each item by the employers involved in the survey is shown in Table 64.
Table 64: R a n k of the different criteria
Criteria
Academic qualifications Testing & interviews Previous work experience Recommendation General appearance Marital status Sex Age
Average score
1.16 1.52 1.53 2.84 1.92 2.61 2.47 2.01
Rank
8 7 6 1 5 2 3 4
N o .
78 68 69 57 63 62 63 69
Total score
85 104 106 162 121 162 156 129
Table 65: Distribution of best means of recruitment
Recruitment method N o . Adjusted %
(i) 17 24.3 (ii) 3 4.3 (iii) 7 10.0 (iv) 26 37.1 (v) 17 24.3
It is clear that 'recommendation' is considered by the employers to be the most important criterion, whereas 'level of academic qualification' comes last. Marital status, sex, age and general appearance follow the most important criterion in that order; previous work experience and testing or interviews are not accorded m u c h importance. Further analysis by type of activity and sector does not s h o w any association at all with the criteria identified.
156

The employers' perceptions
Methods of recruitment
Employers were also asked to indicate which of the following they considered the best w a y to recruit graduates: (i) placement office attached to faculty or college, (ii) placement office attached to higher education institution, (iii) labour office, (iv) public sector recruitment board, or (v) through personal contacts. Their responses are given in Table 65.
W e note that the public sector recruitment board is ranked first, with 37.1 per cent, followed by placement office attached to faculty or college, and personal contacts, with 24.3 per cent each. Analysis was also carried out by sector and type of activity, as shown in Table 66.
Table 66: Method of recruitment according to sector and type of activity (1)
Sector
method
(i) (") (iii) (iv) (v)
Government
No. 12 1 1
15 7
% 17.1 1.4 1.4
21.4 10.0
Semi-Govt.
No. 5 1 5
10 7
Type of Activity
% 7.1 1.4 7.1
14.3 10.0
No. 0 1 1 1 3
Private
% 0.0 1.4 1.4 1.4 4.3
(i) (Ü) (iii) (iv) (v)
Agriculture
No. 0 0 0 1 1
% 0.0 0.0 0.0 1.4 1.4
Industry
No. 2 1 3 7 3
% 2.9 1.4 4.3
10.1 4.3
Commerce
No. 3 0 1 3 6
% 4.3 0.0 1.4 4.3 8.7
Services
No. % 11 15.9
2 2.9 3 4.3
15 21.7 7 10.1
Note: (1) Percentages are with respect to total number of cases.
A s far as the best method for recruiting graduates is concerned, w e note that both the government and semi-government sector employers prefer the public sector recruitment board. A s for personal contacts, this is quite popular with private employers. For the services firms, the public sector
157

From college to work: the case of the Sudan
recruitment board, placement office attached to faculty or college, and personal contacts are perceived to be the best methods of recruitment, in that order, (21.7 per cent, 15.9 per cent and 10.1 per cent of the service enterprises).
Importance of factors making teaching programmes and methods more relevant to job needs
A s in the case of the graduates, employers were asked about the degree of importance of certain factors which could m a k e teaching methods and programmes more relevant for job needs, as follows: (i) interspersing study courses with practical training, (ii) making practical training a requirement for graduation, (iii) giving teaching staff the opportunity to keep u p with developments in their respective fields. T h e employers' responses are given in Table 67.
Table 67: Degree of importance of factors making higher education relevant to work requirements
Factors Very important Important Unimportant
No. % No. % No. % (i) Interspersing study courses with practical training 31 44.9 28 40.6 10 14.5
(ii) Practical training as a requirement for graduation 27 39.7 20 29.4 21 30.9
(iii) Teaching staff keeping up with new developments 12 17.6 19 27.1 37 54.4
It is clear that the first factor, interspersing study courses with practical training, is considered to be the most important, followed by factor (ii) with 85.5 per cent and 69.1 per cent respectively. If w e assign a score of 3 to most important, 2 to important and 1 to unimportant w e obtain for the three factors the scores shown in Table 68.
Further analysis by sector and type of activity does not show any association with the factors identified in connection with making educational programmes and methods m o r e relevant to job needs, as can be seen from Table 69.
158

The employers' perceptions
Factor
(0 («) (iii)
Table 68: Rank of the factors
No. Total score Average score Rank
69 68 68
159 142 111
2.3 2.1 1.6
1 2 3
Table 69:
Factors
0) 00 (iii)
Importance of factors by sector and type of activity (in percentages)
Sector
Government
(1) 47.8 35.3 23.5
Agriculture
(D (2) 4.4 0.0 4.5 0.0 0.0 4.5
(2) 4.4
16.2 29.4
Type
Semi-Govt.
(1) 30.4 26.5 20.6
of activity
Industry
(1) 22.1 17.9 7.5
(2) 1.5 6.0
16.4
(2) 8.7
11.8 17.6
C o m m e r c e
(1) 14.7 15.0 7.5
(2) 5.9 4.5
11.9
(1) 7.2 7.3 1.5
(1) 44.1 32.8 29.8
Private
(2) 1.4 2.9 7.4
Services
(2) 7.4
19.4 22.4
(i)
(Ü) (iii)
Note: (1) = Most important and important (2) = Unimportant
Sectorwise, it was the government employers w h o accorded the most importance to these factors, with 47.8 per cent for factor (i), 35.3 per cent for factor (ii) and 23.5 per cent for factor (iii), whereas by type of activity it was the 'services' employers that thought these factors important, with 44.1 per cent, 32.8 per cent and 29.8 per cent respectively.
A s for incompatibility between graduates' studies and job requirements, employers think that 'lack of communication between higher education institutions and employers' is the main reason with 53.8 per cent, followed by lack of suitable training with 40.0 per cent. The distribution is shown in Table 70. W h e n analyzed by sector and type of activity there is no association between the variables.
159

From college to work: the case of the Sudan
No.
35 26
4
Adj. %
53.8 40.0 6.2
Table 70: Distribution of reasons for incompatibility between education and job needs
Lack of communication between higher education institutions and employers
Lack of suitable training Other
W o r k in rural areas as perceived by the employers
In the previous chapter, w e discussed graduates' attitudes towards work in rural areas. T h e y were invited to indicate the reasons that might encourage or discourage them in respect of jobs in rural areas. The employers were also invited to give their opinions on this issue.
(a) Reasons that encourage graduates to work in rural areas
O u t of the total n u m b e r of employers, 67 (84.8 per cent) responded to the question concerning work in rural areas. Their responses are given in Table 71.
Table 71: Reasons encouraging graduates to work in rural areas
Reasons No. %
Coming from rural area Better promotion opportunities Contribute to rural development Lower cost of living Other
46 16 11
31 14
68.7
23.9
16.4
46.3
20.9
It appears that most of the employers consider that coming from a rural area is the main factor encouraging graduates to work in rural areas, followed by lower cost of living. T h e reason accorded least importance by the employers w a s being able to contribute to rural development, contrary to the graduates' perceptions.
Further analysis by sector and type of activity is given in Table 72, from which w e note that government and semi-government employers form 61.2 per cent of the respondents w h o consider that coming from a
160

The employers' perception
s
1-
<N
O
.-( O
C
T!
—•
<-l (S
<—
1
t>
I is so
<£
i *-4 O
-
f u
CQ
U
a
•o
c U
4> V
)
>-, JD
en
C O
! c 3
«
I o ca
o.
4)
CO
E
Ô 9 c
CN
q
ci O
rt
O*
rò
CN
vb
° CJs
4>
^ 3 w
3
O
£> <
V
? >
q
rò
<r>
r-
o
d
in
•—i
on
OH
c<i •
* ö
ci
o
>r>
©
t—
Ot
ON
jl
-Govt, IUI V
GO
_ c <t>
£ c u
<u ;»
O
Ü
25.4
oo «
•n CO
to
V
u
CO X
) _
o
CO —
> U
|_
3 O
U
«*"
£ 8
o c
* 2
in
•*
q
*r "^ so
O
N CO
Ö
H
l/i rH
C>
.-i
.-i C
N .-i
.-"
Ml
c .5
=
ïîtffllf
c •a
c o a
3 o Sc S
'C
S. V
u
ca
8 u
161

From college to work: the case of the Sudan
Table 73: Reasons discouraging graduates from rural jobs
Reasons No. % Rank
(i) L a c k of basic services (ii) Isolation (iii) Loss of promot ion changes (iv) Dul l life (v) Other
34 22 34 34 17
50.7 32.8 50.7
50.7 25.4
1 4 1 1 5
rural area is the main reason encouraging graduates to w o r k in rural areas; c o m m e r c e and services employers form 51.5 per cent of the respondents for the s a m e reason.
(b) Reasons discouraging graduates from working in rural areas
T h e employers were also asked to indicate the reasons they consider discourage graduates from working in rural areas, and their responses are given in Table 73.
It is observed that lack of basic services, dull life, and loss of p r o m o tion chances are the reasons most frequently cited by the employers as discouraging graduates from working in rural areas, which are the s a m e as perceived by the graduates.
162
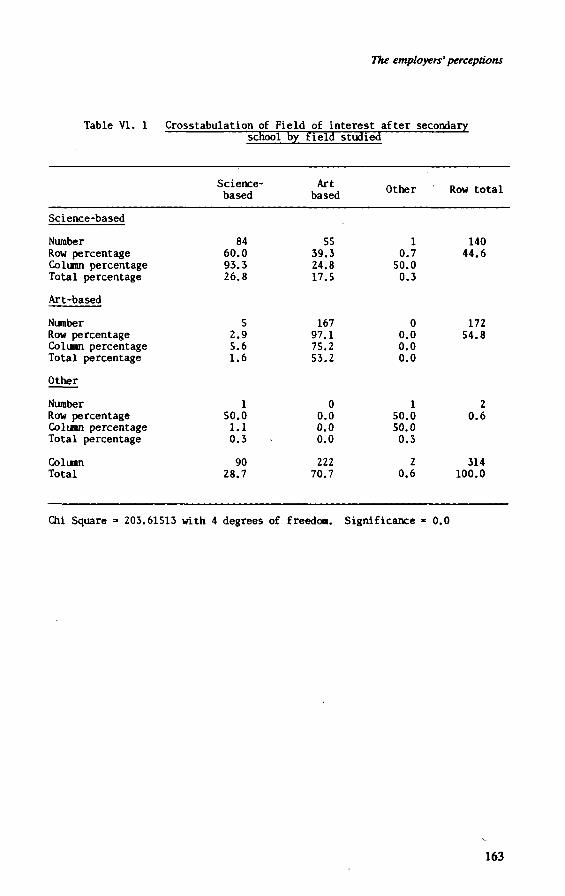
TTte employers' perceptions
Table VI. 1 Crosstabulation of Field of interest after secondary
Science-based
Number Row percentage Column percentage Total percentage
Art-based
Number Row percentage Column percentage Total percentage
Other
Number Row percentage Column percentage Total percentage
Column Total
school by
Science-based
84 60.0 93.3 26.8
5 2.9 5.6 1.6
1 50.0 1.1 0.3
90 28.7
field studied
Art based
55 39.3 24.8 17.5
167 97.1 75.2 53.2
0 0.0 0.0 0.0
222 70.7
Other
r-t
0.7 50.0 0.3
0 0.0 0.0 0.0
1 50.0 50.0 0.3
2 0.6
Row total
140 44.6
172 54.8
2 0.6
314 100.0
Chi Square =• 203.61513 with 4 degrees of freedom. Significance « 0.0
163
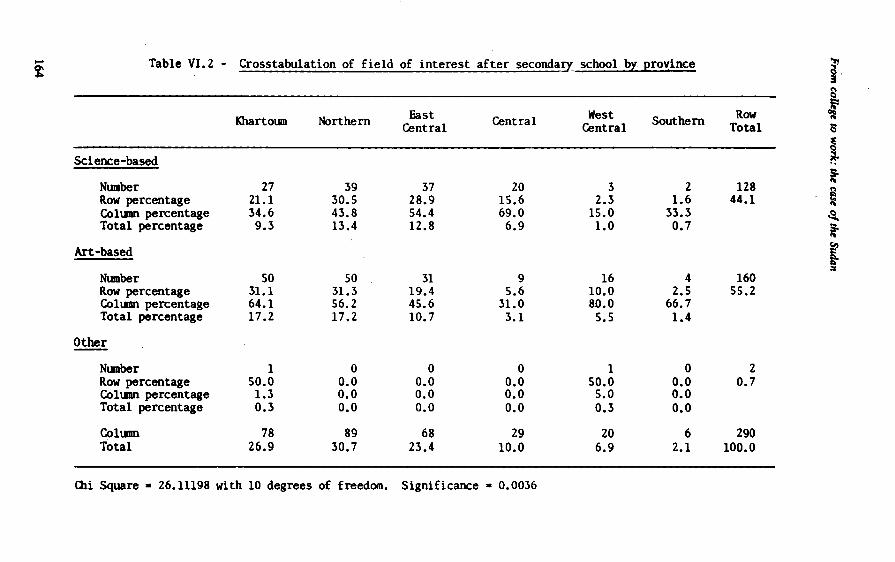
From
college to work:
the case of the Sudan
IS
e i to
U «
Id
4-1
e
8
OO
OC
i (NI
• .
• in
O
) «c
i-H
V
O
Oí
>0
O
i-l
• •
•
UlH
lO
lO
O
O
O
O
• •
• o
o
o
O)
O
(NI
. o
1—
(
e t-i
ü I o
00
,-( «N
I •
N>
Or
tl^
HK
IO
KI
HO
O
O
«NI
vO
• !-H
LO
«NI v
O
i—I
•O
o
o
o
LO
i-H
.
• •
O
OO
O
• •
• O
O
O
o
o
(M
O
o
N©
l-l
«NI
i-l O
O
lO
©
O
»
• •
• (N
| •
o
LO
o
vo
LO
r
o>
^
oo
rO
•
• •
00
*t «N
I (M
L
O
I-H
O»
L
O
00
»*•
O
to
rO
rO
>»
i-H
^H
vO
lO
(N
I •
• •
i-H
^
O»
(M
rO
»h a« c
ft o
t> v u
B
*8. IM
-3
>H
(J
Z t* QS
f° I
i-i t
o
e->
to
• •
• O
MflO
O
«O «N
I «NI
LO
• .
• i-i
vo
r~
rtif
lH
OH
HN
LO
•
• •
•-i ^
r»
lO
>O
H
i fît
O
O
O
O
00 •*
• •
• vO
*
O
O
O
tO
(N|
o
o
o
o
o>
r-. •
• •
00
• o
o
o
o
i-H
O
>0
K
Ï
O
i-H
O
LO
4) 0
0
«
«
M
«
y
«
oo
tí -y
<«
4>
tí (J
U
4)
tí I-
O
O
«
h
oo
o>
vO
(N|
.o _
3
etj 3
«d
J*
_ S
Q O
35
0
ÄÖ
H
5E
2
164

The employers' perceptions
Table VI. 3 Crosstabulation of field of interest after
Science-based
Number Row percentage Colunn percentage Total percentage
Art-based
Number Row percentage Colunn percentage Total percentage
Other
Number Row percentage Colunn percentage Total percentage
Colunn Total
secondary school
Urban
93 6S.0 43.7 29.1
119 68.0 55.9 37.2
1 50.0 0.5 0.3
213 66.6
by place
Rural
50 35.0 46.7 15.6
56 32.0 52.3 17.5
1 50.0 0.9 0.3
107 33.4
of birth
Row total
143 44.7
175 54.7
2 0.6
320 100.0
Chi Square - 0.55890 with 2 degrees of freedom. Significance - 0.7S62
Table VI. 4 Crosstabulation of field of interest after
Science-based
Number Row percentage Column percentage Total percentage
Art-based
Number Row percentage Column percentage Total percentage
Other
Number Row percentage Column percentage Total percentage
Column Total
secondary school by sex
Male
127 88.8 47.2 39.7
140 80.0 52.0 43.8
2 100.0
0.7 0.6
269 84.1
Female
16 11.2 31.4
5.0
35 20.0 68.6 10.9
0 0.0 0.0 0.0
51 15.9
Row total
143 44.7
175 54.7
2 0.6
320 100.0
3 Ú Square • 4.94186 with 2 degrees of freedom. Significance - 0.0845
165

Front College to work: the case of the Sudan
Table VI. 5 -
Lack of finance
Number Row percentage Column percentage Total percentage
Admission criteria
Number Row percentage Column percentage Total percentage
Relatives wish
Number Row percentage Column percentage Total percentage
Information received later
Number Row percentage Column percentage Total percentage
Other
Number Row percentage Column percentage Total percentage
Column Total
Crosstabulation of reason for change in tield of study
Male
11 100.0 8.3 7.5
67 88.2 50.8 45.9
6 66.7 4.5 4.1
24 96.0 18.2 16.4
24 96.0 18.2 16.4
132 90.4
Chi Square • 9.26603 with 4 degrees of freedom.
Female Row Total
0 11 0.0 7.5 0.0 0.0
9 76 11.8 52.1 64.3 6.2
3 9 33.3 6.2 21.4 2.1
1 25 4.0 17.1 7.1 0.7
1 25 4.0 17.1 7.1 0.7
14 146 9.6 100.0
Significance » 0.0548
166
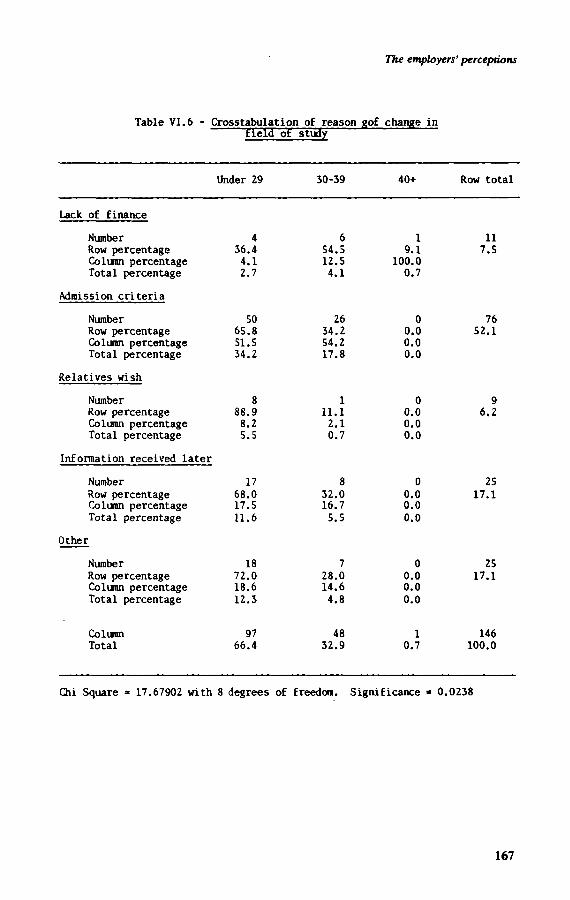
The employers' perceptions
Table VI.6
Lack of finance
Number Row percentage Column percentage Total percentage
Admission criteria
Number Row percentage Column percentage Total percentage
Relatives wish
Number Row percentage Column percentage Total percentage
- Crosstabulation of reason gof field of study
Under 29
4 36.4 4.1 2.7
50 65.8 51.5 34.2
8 88.9 8.2 5.5
Information received later
Number Row percentage Column percentage Total percentage
Other
Number Row percentage Column percentage Total percentage
Column Total
Chi Square = 17.67902 wi
17 68.0 17.5 11.6
18 72.0 18.6 12.3
97 66.4
.th 8 degrees of
30-39
6 54.5 12.5 4.1
26 34.2 54.2 17.8
1 11.1 2.1 0.7
8 32.0 16.7 5.5
7 28.0 14.6 4.8
48 32.9
freedom. Signil
change in
40+
1 9.1
100.0 0.7
0 0.0 0.0 0.0
0 0.0 0.0 0.0
0 0.0 0.0 0.0
0 0.0 0.0 0.0
1 0.7
:icanee » 0.
Row total
11 7.5
76 52.1
9 6.2
25 17.1
25 17.1
146 100.0
.0238
167

From college to work: the case of the Sudan
Table VI.7 - Crosstabulation of reason for change in field oí study by place of work
Rural Urban Semi-urban Row total
Lack of finance
Number Row percentage Column percentage Total percentage
Admission criteria
Number Row percentage Column percentage Total percentage
Relatives wish
Number Row percentage Column percentage Total percentage
Information received later
Number Row percentage Column percentage Total percentage
Other
Number Row percentage Column percentage Total percentage
Column Total
Chi Square - 15.70864 with
8 80.0 6.0 5.6
70 93.3 52.2 48.6
9 100.0
8.7 6.3
25 100.0 18.7 17.4
22 88.0 16.4 15.3
154 93.1
8 degrees
0 0, 0
5 66, 2
0, 0, 0,
0, 0, 0.
8. 33. 1.
4.
of freedom.
0 .0 .0 .0
4 .3 .7 .8
0 .0 .0 .0
0 .0 ,0 .0
2 .0 ,3 .4
6 .2
Signifi
2 20.T) 50.0 1.4
1 1.3 25.0 0.7
0 0.0 0.0 0.0
0 0.0 0.0 0.0
1 4.0 25.0 0.7
4 2.8
canee »
10 6.9
75 52.1
9 6.3
25 17.4
25 17.4
144 100.0
0.0467
168

77t« employers' perceptions
Table VI.8 Crosstabulation of reason to move away fro» hone by sex
Male Female Row Total
No institution
Number 205 Row percentage 95.8 Column percentage 84.0 Total percentage 78.5
Not desired field
Number 12 Row percentage 92.3 Column percentage 4.9 Total percentage 4.6
Other
Number 27 Row percentage 79.4 Column percentage 11.1 Total percentage 10.3
Column 244 Total 93.5
9 4.2
52.9 3.4
1 7.7 5.9 0.4
7 20.6 41.2
2.7
17 6.5
214 82.0
13 5.0
34 13.0
261 100.0
Chi Square - 12.96277 with 2 degrees of freedom. Significance - 0.0015
Table VI.9 Crosstabulation of reason to move away from home by field studied
Science- Art-based based
Others Row total
No institution
Number 57 148 0 205 Row percentage 27.8 72.2 0.0 81.3 Column percentage 77.0 83.6 0.0 Total percentage 22.6 58.7 0.0
Not desired field
Number 6 6 1 13 Row percentage 46.2 46.2 7.7 5.2 Column percentage 8.1 3.4 100.0 Total percentage 2.4 2.4 0.4
Other
Number 11 23 0 34 Row percentage 32.4 67.6 0.0 13.5 Column percentage 14.0 13.0 0.0 Total percentage 4.4 9.1 0.0
Column 74 177 1 252 Total 29.4 70.2 0.4 100.0
Chi Square - 21.12357 with 4 degrees of freedom. Significance » 0.0003.
169

From college to work: the case of the Sudan
Table VI.10
No-institution
Number Row percentage Column percentage Total percentage
Not desired field
Number Row percentage Column percentage Total percentage
Other
Number Row percentage Column percentage Total percentage
Column Total
Chi Square » 12.11399 with
Crosstabulati on of reason to move away from hone by place of birth
Urban
114 53.5 75.5 44.0
11 91.7 7.3 4.2
26 76.5 17.2 10.0
151 58.3
2 degrees of freedom.
Rural
99 46.5 91.7 38.2
1 8.3 0.9 0.4
9 23.5 7.4 3.1
108 41.7
Significance » 0,
Row Total
213 82.2
12 4.6
34 13.1
259 100.0
.0023
170

The employers' perceptions
Table VI.11 Crosstabulation of channel o£ recruitment after
Under 29
Higher education institution
Number Row percentage Column percentage Total percentage
Labour office
Number Row percentage Column percentage Total percentage
Recruitment board
Number Row percentage Column percentage Total percentage
Other
Number Row percentage Column percentage Total percentage
Column Total
17 43.6 8.5 5.3
16 30.2 8.0 5.0
127 79.4 63.2 39.6
41 59.4 20.4 12.8
201 62.6
graduation by age
30-39
20 51.3 17.7 6.2
37 69.8 32.7 11.5
31 19.4 27.4 9.7
25 36.2 22.1 7.8
113 35.2
40+
2 5.1 28.6 0.6
0 0.0 0.0 0.0
2 1.3 28.6 0.6
3 4.3 42.9 0.9
7 2.2
Row total
39 12.1
53 16.5
160 49.8
69 21.5
321 100.0
Chi Square = 55.57979 with 6 degrees of freedom. Significance » 0.0000.
171

From college to work: the case of the Sudan
Table VI.12 Crosstabulation of channel of recruitment
Higher education institution
Number Row percentage Collum percentage Total percentage
Labour office
Number Row percentage Column percentage Total percentage
Recruitment board
Number Row percentage Column percentage Total percentage
Other
Number Row percentage Column percentage Total percentage
Column Total
after graduation
Urban
18 46.2 8.6 5.6
34 65.4 16.2 10.7
109 68.6 51.9 34.2
49 71.0 23.3 15.4
210 65.8
by place of birth
Rural
21 53.8 19.3 6.6
18 34.6 16.5 5.6
50 31.4 45.9 05.7
20 29.0 18.3 6.3
109 34.2
Row Total
39 12.2
52 16.3
159 49.8
69 21.6
319 100.0
Chi Square » 8.06583 with 3 degrees of freedom. Significance = 0.0047
172

The employers' perceptions
Table VI.13 Crosstabulation
Government
Higher education institution
Number Row percentage Column percentage Total percentage
Labour office
Number Row percentage Column percentage Total percentage
Recruitment board
Number Row percentage Column percentage Total percentage
Other
Number Row percentage Column percentage Total percentage
Column Total
Chi Square = 27.88466
29 76.3 11.4 9.1
36 67.9 14.2 11.3
140 88.6 55.1 44.0
49 71.0 19.3 15.4
254 79.9
with 9 degrees
-bj of channel . of current sector
Semi-government
of
7 18.4 15.9
2.2
12 22.6 27.3
3.8
15 9.5
34.1 4.7
10 14.5 22.7
3.1
44 13.8
freedom.
recruitment . after gradua of employment
Private
2 5.3
11.8 0.6
5 9.4
29.4 1.6
3 1.9
17.6 0.9
7 10.1 41.2
2.2
17 5.3
Significance -
Other
0 0.0 0.0 0.0
0 0.0 0 .0 0.0
0 0.0 0.0 0.0
3 4.3
100.0 0.9
3 0.9
0.0010
ition
Row Total
38 11.9
53 16.7
158 49.7
69 21.7
318 100.0
173

From college to work: the case of the Sudan
Table VI.14 Crosstabulation of channel of recruitment to job matching specialization
Under 29
Higher education institution
Number Row percentage Column percentage Total percentage
Labour office
, Number Row percentage Column percentage Total percentage
Recruitment board
Number Row percentage Column percentage Total percentage
Other
Number Row percentage Column percentage Total percentage
Column Total
14 37.8 8.4 5.2
7 20.0 4.2 2.6
109 80.1 65.7 40.4
36 58.1 21.7 15.8
166 61.5
30-39
21 56.8 21.4 7.8
28 80.0 28.6 10.4
26 19.1 26.5 9.6
23 37.1 23.5 8.5
98 36.3
by age
40+
2 5.4
33.3 0.7
0 0.0 0.0 0.0
1 0.7 16.7 0.4
3 4.8 50.0 1.1
6 2.2
Row total
37 13.7
35 13.0
136 50.4
62 23.0
270 100.0
Chi Square = 60.46026 with 6 degrees of freedom. Significance = 0.0000.
174

The employers' perceptions
Table VI.15 - Crosstabulâtion of waiting period after graduation for first job by age
Under 29 30-39 40+ Row total
Less than 6 months
Number Row percentage Column percentage Total percentage
7-12 months
Number Row percentage Column percentage Total percentage
13 - 18
Number Row percentage Column percentage Total percentage
19 - 24
Number Row percentage Column percentage Total percentage
25 months +
Number Row percentage Column percentage Total percentage
Column Total
Chi Square = 14.48.78 with
148 66.1 74.0 46.5
37 59.7 18.5 11.6
5 41.7 2.5 1.6
8 72.7 4.0 2.5
2 22.2 1.0 0.6
200 62.9
70 31.3 62.5 22.0
25 40.3 22.3 7.9
7 58.3 6.3 2.2
3 27.3 2.7 0.9
7 77.8 6.3 2.2
112 35.2
8 degrees of freedom. S
6 2.7
100.0 1.9
0 0.0 0.0 0.0
0 0.0 0.0 0.0
0 0.0 0.0 0.0
0 0.0 0.0 0.0
6 1.9
iignificance *
224 70.4
62 19.5
12 3.3
11 3.5
9 2.8
318 100.0
0.0700.
175

From college to work: the case of the Sudan
Table VI.16 Crosstabulation of waiting period after graduation for first job by sex
Male Female Row Total
Less than 6 months
Number Row percentage Co limn percentage Total percentage
7-12 months
Number Row percentage Column percentage Total percentage
13 - 18 months
Number Row percentage Column percentage Total percentage
19 - 24 months
Number Row percentage Column percentage Total percentage
25 months
Number Row percentage Column percentage Total percentage
Column Total
193 86.2 73.1 60.7
45 72.6 17.0 14.2
11 91.7 4.2 3.5
8 72.7 3.0 2.5
7 77.8 2.7 2.2
264 83.0
Chi Square » 7.99867 with 4 degrees of freedom.
31 13.8 57.4 9.7
17 27.4 31.5 5.3
1 8.3 1.9 0.3
3 27.3 5.6 0.9
2 22.2 3.7 0.6
54 17.0
224 70.4
62 19.5
12 3.8
11 3.5
9 2.8
318 100.0
Significance « 0.0916
176
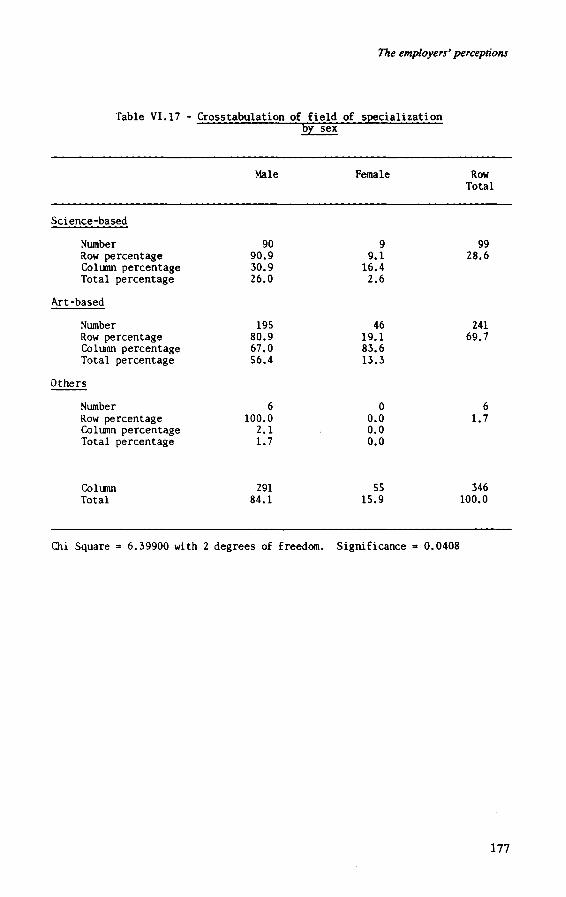
The employers' perceptions
Table VI.17 - Crosstabulation of field of specialization
Science-based
Number Row percentage Column percentage Total percentage
Art-based
Number Row percentage Column percentage Total percentage
Others
Number Row percentage Column percentage Total percentage
Column Total
by
Male
90 90.9 30.9 26.0
195 80.9 67.0 56.4
6 100.0 2.1 1.7
291 84.1
sex
Female
9 9.1 16.4 2.6
46 19.1 83.6 13.3
0 0.0 0.0 0.0
55 15.9
Row Total
99 28.6
241 69.7
6 1.7
346 100.0
Chi Square = 6.39900 with 2 degrees of freedom. Significance =» 0.0408
177

From college to won the case of lhe Sudan
Table VI . 18 - Crosstabulation of field of specialization by current sector ot employment
Science-based
Number Row percentage Column percentage Total percentage
Art-based
Number Row percentage Column percentage Total percentage
Other
Number Row percentage Column percentage Total percentage
Column Total
Chi Square =• 31.08258
Government
84 85.7 31.3 24.7
181 76.7 67.5 53.2
3 50.1 1.1 0.9
268 78.8
with 6 degrees
Serai -government
12 12.2 24.5
3.5
37 15.7 75.5 10.9
0 0.0 0.0 0.0
49 14.4
of freedom.
Private
2 2.0
10.0 0.6
16 6.8
80.0 4.7
2 33.3 10.0 0.6
20 5.9
Significance =
Other
0 0.0 0.0 0.0
2 0.8
66.7 0.6
1 16.7 33.3 0.3
3 0.9
0.0000
Row Total
98 28.8
236 69.4
6 1.8
340 100.0
178

The employers' perception
s
oo
oo
eo
oo
oo
o o
oe
oo «*~
J
oeo
o
oo
s I
s-O
OO
O
•hn
o«
rtO
l^rt
»I*!
I?
KK
>-» O
OO
O
OO
O
—O
0<
*0
OO
O
OO
O
I-I Î
"
II lljii il
a
rcent perc
perce
educa
¿B
f* -" Ills
-s £ sff i m.:
ml
Bus
•I* at»
»•Is* - g
? s
!sl lisl I I I 1
illi Ja !i
179

Front college to work: the case of the Sudan
Table VI.20
Most important
Nunber Row percentage Colmn percentage Total percentage
Important
Number Row percentage Column percentage Total percentage
Not important
Number Row percentage Column percentage Total percentage
Column Total
Crosstabulation of Staff developments
Male
59 92.2 22.2 18.6
100 85.5 37.6 31.5
107 78.7 40.2 33.8
266 83.9
to follow up new by sex
Female
5 7.8 9.8 1.6
17 14.5 33.3 5.4
29 21.3 56.9 9.1
51 16.1
Row Total
64 20.2
117 36.9
136 42.9
317 100.0
Chi Square • 6.21843 with 2 degrees of freedom. Significance - 0.0446
Table VI.21 Crosstabulation of information from prospective
Most important
Number Row percentage Column percentage Total percentage
Important
Number Row percentage Column percentage Total percentage
Not important
Number Row percentage Column percentage Total percentage
Column Total
Under 29
29 54.7 14.4 9.1
88 63.3 43.8 27.6
84 66.1 41.8 26.3
201 63.0
employers by age
30-39
21 39.6 18.6 6.6
49 35.3 43.4 15.4
43 33.9 38.1 13.5
113 35.4
40+
3 5.7
60.0 0.9
2 1.4 40.0 0.6
0 0.0 0.0 0.0
5 1.6
Row total
53 16.6
139 48.6
127 39.8
319 100.0
Chi Square - 8.80088 with 4 degrees of freedom. Significance - 0.0663.

The employers' perceptions
Table VI.22 - Crosstabulation of Information fro« prospective employers py place ot birth"
Urban Rural Row Total
Most important
Number Row percentage Colijan percentage Total percentage
Important
Number Row percentage Colinn percentage Total percentage
Not important
Number Row percentage Column percentage Total percentage
Column Total
40 75.5 19.1 12.6
97 69.8 46.4 30.6
72 57.6 34.4 22.7
209 65.9
13 24.5 12.0 4.1
42 30.2 38.9 13.2
53 42.4 49.1 16.7
108 34.1
53 16.7
139 43.8
125 39.4
317 100.0
Chi Square =• 6.92887 with 2 degrees of freedom. Significance - 0.0313
Table VI.23 Crosstabulation of advertisements in mass
Most important
Number Row percentage Column percentage Total percentage
Important
Number Row percentage Column percentage Total percentage
Not important
Number Row percentage Column percentage Total percentage
Column Total
Under 29
13 68.4 6.7 4.2
32 68.1 16.4 10.3
150 61.5 76.9 48.4
195 62.9
media by age
30-39
4 21.1 3.7 1.3
14 29.8 12.8 4.5
91 37.3 83.5 29.4
109 35.2
40+
2 10.5 33.3 0.6
1 2.1 16.7 0.3
3 1.2 SO.O 1.0
6 1.9
Row total
19 6.1
47 15.2
244 78.7
310 100.0
Chi Square - 10.03151 with 4 degrees of freedom. Significance - 0.0399.
181

VIL Findings and recommendations
W e summarize below the findings of the previous chapters and recommendations that could be derived from the preceding analysis.
Summary of findings
The Sudan's economy, as measured by the gross domestic product, has declined in real terms during the period 1977-79. The discovery and exploitation of oil, which consumes 40 per cent of the import bill, might redress the situation in the second part of the eighties. The country also has a serious problem of migration of professional and skilled labour to the neighbouring Gulf States, although this migration has helped the balance of payments through remittances..
T h e extent of primary education and literacy in the Sudan is still a major problem and attention should be focussed on developing basic educational facilities. The problem of inequality of educational opportunity becomes more serious as the level of education rises, as measured by geographical considerations (provinces) and social groups (sex). The student/teacher ratio is low at all levels compared with usual standards. The higher the level of education, the faster has been the rate of growth in enrolment, in spite of the fact that the Sudan's lowest level of education is still out of reach for the majority of children of school-going age.
T h e new educational strategy proposed by the Ministry of Education attempts to rectify the situation through a massive literacy campaign and the introduction of universal primary education for seven-year-olds by 1990/91. However, the progress m a d e in the former has been desperately limited. The rate of increase in intakes has also been too slow to achieve universal primary education by the specified date if there is not a rapid break-through. T h e use of Koranic schools and complementary schools is however a positive step in that direction. The basic problem however has been the limited allocation of resources at this level of education during the last few years. O n the other hand satisfactory progress is being m a d e in the field of technical education, where the highest rate of growth during the period 1973-80 at a rate of nearly 19 per cent per a n n u m is observed.
182

Findings and recommendations
The lack of skilled technicians has been one of the bottlenecks for development. During the last few years, disparity in distribution of education has been reduced to a certain extent.
Cost per pupil for each level of general education varies widely, mainly because of variations in total enrolment. Enrolment in higher education has increased at an average annual rate of 10.5 per cent per a n n u m during the period 1969-81. However , most of this increase has been experienced in the arts-based fields, especially at the University of Cairo (Khartoum branch), which has grown at a m u c h faster rate than enrolment at the University of Khartoum. The majority of the higher education students in the Sudan are at the University of Cairo in Khartoum, and together with students studying abroad, w e find that Sudan controls only one-third of Sudanese students' higher education. This is a very serious situation, keeping in view the developmental role of higher education.
Cost per student in higher education is also exorbitantly high because of provision of boarding facilities. These costs also vary widely from institution to institution, with the Universities of Juba and Gezira being at the top in respect of cost per student. Necessary measures must be found to reduce this cost. At present, higher education takes one-third of all public expenditure on education for a total enrolment of approximately 16,000 students under Sudanese control. This situation should not continue, given the priority of lower levels of education, and therefore economy measures must be found. O n e positive aspect of higher education is its regionaliza-tion and orientation towards professional education. Since 1975, the Sudan has been setting up higher education institutions in regions where there had not been any in the past. This is in accordance with the educational strategy formulated by the government keeping in view the development needs of the country. This is also one of the reasons for the high cost per student and higher allocation of resources to higher education. The 1982 Presidential directive calling for a university in each region will further increase the share of higher education in the national budget. Rigorous economic feasiblity studies are needed before these institutions are set up.
It is interesting to note that students of final year secondary education tend to choose a type of education mainly because of personal interest in a particular field. Advice from parents and other sources does not play an important role in the choice of a type of education. Insofar as obtaining information on higher education is concerned, students of secondary education think that the available mechanism for their guidance and counselling is sufficient, as specified by the majority of them. T h e most important source of information is considered to be the teachers.
In respect of higher education career expectations, the majority of the secondary-school students in final year think that they will go on to university education after completing their secondary education, and few of them expect to go to work. W e should mention that higher education abroad
183

From college to work: the case of the Sudan
seems to be favoured by a relatively important proportion of the student population (almost one-third). Information on access to tertiary education should be m a d e available to the students possibly through an annual prospectus, and applications for higher education should preferably take place after the examinations at the end of secondary education.
A s far as the higher education students are concerned, most of them indicated that the main reason for pursuing higher education was to obtain a specific professional qualification; study for its o w n sake was also important. A s for major source of career information, the students indicated this to be friends and relatives, rather than the teaching staff or the higher education institutions. A considerable proportion of the students had to m o v e from their h o m e area in order to pursue higher education, the main reason being that there was no college in the area. Higher education is largely financed by the state.
The main reason for choosing a field of study was that the students enjoyed that particular field. For those higher education students w h o did not follow the field of study they had wanted to,, unsatisfactory academic performance was the main reason. The majority of the students were satisfied with the course that they were following, and would not have changed even if better career information had been m a d e available to them. They also considered that their secondary education had been adequate for their higher studies.
The majority of students expect to be permanently employed in a field related to their field of study. For those w h o do not expect to work permanently in a field related to their studies, the main reason for continuing is that they enjoy the field. A n important proportion of students think that they will not have to wait, or will wait less than three months, to obtain their first job after graduation.
A s regards salary expectations, the majority of the students expect to earn more than S£.61 per month. Only 9.1 per cent expect a lower salary. However, female students expect to earn less than males. Students in science-based fields expect to earn m o r e than those in arts-based fields; those with the highest salary expectations think that they will work in the private sector.
A s far as working in rural areas is concerned, a large proportion of students appear to be willing to serve in rural areas mainly in order to have an opportunity to serve that part of the country. Lack of opportunities for further study was the main reason cited as discouraging work in rural areas. Transport and communication difficulties as well as a dull life are other reasons. A s far as factors contributing to job satisfaction are concerned, use of special talents is seen as the most important factor by the students, followed by further study opportunities.
In respect of the graduates of higher education, the main reason for their choice of field of study was personal liking for that field. A m o n g those graduates w h o changed their field of study during their higher educa-
184

Findings and recommendations
tion career, academic performance was one of the main reasons. For those graduates w h o had to m o v e away from h o m e to pursue higher education, this was due to lack of institutions in the area.
A s far as the job-search mechanism is concerned, the largest proportion of graduates found their first job through the public sector recruitment board, and considered this should be the main channel of recruitment. T h e majority of the graduates waited six months or less to get their first job, or a job matching their specialization. Academic qualifications were the main reason for being selected for the job, and a large proportion of graduates think that the education they received was suitable for their first job after graduation. T h e majority were employed in a field related to their studies. Flexibility of job requirements was the main reason for accepting a job not matching specialization; but a certain number of graduates also indicated that they had been unable to find a job matching their specialization. For those graduates w h o had changed their jobs, the reason was generally better terms of service.
The opportunity to contribute to rural development was mentioned as one of the main factors which encourage graduates to work in rural areas, followed by low cost of living. As to factors discouraging work in rural areas, lack of basic services, and missing promotion opportunities were cited.
In order to m a k e higher education more relevant to work requirements, the following two factors were considered to be the most important by the graduates: (i) interspersing study courses with short training periods, and (ii) making work experience a requirement for graduation. Training on the job was thought to be an important means by which to obtain more knowledge on the nature and opportunities for employment. Opportunity for further study, and use of skills and initiative were perceived to be the most important factors for job satisfaction, with less importance being accorded to more material aspects such as salary, travel and vacation possibilities, etc.
In selecting graduates for jobs, the employers consider the most important criterion to be 'recommendation', after which they take into consideration sex, age, marital status and general appearance. Surprisingly, the least importance is given to academic qualifications. Also, from the point of view of the employers, the best institutional mechanism for recruitment is the public sector recruitment board.
Coming from a rural area is identified as the main reason that would encourage graduates to work in rural areas, as well as lower cost of living. Lack of basic services, loss of chances for promotion, and dull life are felt by the employers to be the main reasons discouraging graduates from working in rural areas.
A s far as making higher education more relevant to job requirements, the employers indicated interspersing study with practical training, as the best way to achieve this. Lack of communication between the higher
185

From college to work: the case of the Sudan
education institutions and the enterprises was considered the main reason for incompatibility between graduates' studies and the needs of the job.
Recommendations
T h e recommendations couid be identified at two levels: macro and micro. These are listed below:
Macro-level
1. It is quite evident that any recommendation on higher education planning in Sudan must be related to the national socio-political and economic objectives as formulated in the comprehensive national plan for economic and social development.
2. There should be integration and co-ordination between economic planning, manpower planning and the higher education admission policies regarding admissions, disciplines and specializations.
3. Since the regions are responsible for drawing up and implementing their o w n programmes for general education, two types of planning m a y evolve: national planning for higher education and a regional one for general education. Therefore, it is necessary to co-ordinate planning for higher education and planning for general education in the context of regionaliza-tion.
4. There is a need to co-ordinate the policies between private and public institutions of higher education.
5. For higher education to contribute to the national development, development of scientific and technological education is imperative. Technical education at the secondary level has been developing rapidly; this should be followed up by a policy of higher education with emphasis on scientific and technological education at the higher level. T h e regional universities should take this responsibility in a fashion that could m a k e these institutes more production oriented to finance the programmes from their o w n revenues,— at least partially. In respect of the content of the programmes attention should be given also to non-technical aspects such as economic and political aspects of technological development, so as to develop negotiating capacities for national professionals with external operators.
6. Higher education is imparted not only through the formal institutions; a great deal of training at the high level takes place in the enterprises. The country should take advantage of these programmes and articulate them in a way conducive to overall national development.
186

Findings and recommendations
7. Finally, what is planned m a y not always be executable or executed. A n institutional mechanism should be set up to identify the gap between planning and implementation, not only at the higher education level but at all levels concerned with planning. This is related to item 2 above, but the scope is broadened with the inclusion of the aspect of implementation. Continuous evaluation of the plan with achievements helps to identify the bottlenecks, and corrective measures reduce the gap between targets and achievements.
Micro-level
1. Rationalization of higher education lies in preventing wastage, i.e. organization of available resources so as to enable the achievement of the fullest possible development by:
(a) establishing a monitoring system for each institution;
(b) the implications of the rising n u m b e r of students studying abroad in terms of:
(i) their social adjustment back h o m e ,
(ii) the social costs of such studies;
(iii) the appropriateness of transferring the acquired knowledge to the Sudanese context;
(c) enhancement of the research function within the institutions of higher learning.
2. T h e internal efficiency of institutions needs to be continuously evaluated in terms of the following:
(a) high failure rate a m o n g students holding foreign certificates— especially from the Gulf Secondary schools—in the first two years of their higher education.
(b) opt imum utilization of teachers' time as well as equipment and other facilities;
(c) flow-rate of students and their distribution by region, sex, socioeconomic status, etc.;
(d) cost per student;
187
From college to work: the case of the Sudan
(e) reasons for wastage;
(f) introducing the 'credit' system;
(g) policy of admission to allow for democratization of higher education.
3. Given the fact that a substantial portion of the higher education budget goes to boarding facilities for the students and that the system itself is suffering from m a n y negative aspects, there should be a critical review of the whole system.
4. Students and their parents should be encouraged to change their attitude about the role of technical education at the higher levels. This could be achieved through the following channels:
(a) opening u p possibilities for further education a m o n g the technical graduates;
(b) revising the present salary structure to m a k e technical education more attractive;
(c) improving u p o n the relationship between institutions of technical education and production enterprises.
5. T o promote cultural identity the higher education policy should e m p h a size local training to a large extent. Besides, training p r o g r a m m e s should be examined thoroughly in terms of their relevance and needs.
6. T h e method of instruction at the higher education level should be organized in such a w a y that study p r o g r a m m e s be interspersed with w o r k experience.
7. Career guidance should be introduced at the secondary level so that students can have the opportunity to better inform themselves for the choice of an educational career and subsequent occupational career. This could be done through pamphlets prepared on a regular basis by the National Council for Higher Education o n the prospects of different educational careers at the third level. Such information could assist the youth in identifying his/her role in the society and to b e c o m e m o r e motivated towards achievement in life.
8. Participation of w o m e n is to be encouraged both in higher education and in the subsequent working life to utilize the available h u m a n resources in an optimal w a y . It has been established that the educational level of the mother positively influences the education of children to a greater
188

Findings and recommendations
extent than that of the father. In respect of participation in the working life although social customs and traditions, cannot be ignored , higher education should play a role in changing attitudes that inhibit national progress through properly formulated content and methods of instruction.
9. A s has already been noted, application for tertiary education should take place after the examinations at the end of secondary education. This would help students to m a k e a more reasonable choice of their educational career.
10. Sudan, like most of the developing countries, experiences the same phenomenon in respect of students career expectations. Most of the secondary-school leavers would like to obtain a university degree, reflecting the so-called syndrome of 'the diploma disease', even though the labour market m a y be saturated with university graduates. It is difficult for the higher education system to do anything to correct the situation, except to transfer the problem of unemployment towards the lower levels of education. But if technical education could be well remunerative and if the students would not have a complex of inferiority in having such education, the problem could be partly solved. This would require secondary education's content and structure to have a strong emphasis on terminality so as to m a k e the school leaver equipped to join the working life.
11. For better prospects of employment, information should be disseminated in a two-way fashion:
(a) The employer needs to be fully involved in the process of development regarding the different disciplines and the content of training at the institutions of higher education.
(b) The students need to be oriented to the world of work through a proper counselling system, with the purpose of providing them with updated career guidance and information about the needs of the employer and the availability of jobs. It is important that such an activity be undertaken by a well- qualified staff.
12. Placement by interview is a necessary tool for selection, but is not sufficient. Other complementary tools such as aptitude tests could be explored.
13. In response to the Presidential directive of 1982 regarding the establishment of four n e w regional universities, this has to be carefully investigated with respect to:-
(a) the cost of the infrastructure,
(b) training of the staff,
189

From college to work: the case of the Sudan
(c) the adjustment of the unbalanced ratio between professionals and the middle level cadres,
(d) the suitability of the offered programmes to the local environment and needs of the regions,
(e) starting with small colleges and growing gradually to incorporate more in the future. This should be in accordance with priorities and available resources.
14. Graduates should be encouraged to work in the rural areas. It is, therefore, imperative that they should be offered s o m e financial incentives, as well as special fringe benefits in the short run. While in the long run efforts to improve the conditions of the rural settings should be part of a an overall strategy to attract qualified technicians and personnel to the rural areas.
15. Implications for further studies:-
(a) T h e cost of boarding and available facilities is an area of great concern. It is important that a study should be undertaken with the possibility of reducing the cost by looking into different alternatives to the present system.
(b) Because there is mounting concern about emigration of skilled and high-level m a n p o w e r , m u c h m o r e needs to be k n o w n about the implications of this p h e n o m e n o n : what are the motives behind emigration? W h a t is the effect of emigration on national productivity in both modern and traditional sectors? Given the present situation what is the extent of accuracy of m a n p o w e r planning n o w and in the future? W h a t is the effect of the emigrating labour force on: inflation, change in the patterns of consumption, the national wage policy, the standard of education at different levels, the inflow of hard currency through remittances and private investments at h o m e ? H o w can the situation be checked through multilateral and bilateral agreements with receiving countries?
These are s o m e of the questions that deserve critical examination with emphasis on the role which higher education could play for the development of the Sudan.
190

Appendix A QUESTIONNAIRES
191

Questionnaires
Democratic Republic of the Sudan Higher Education and Employment in the Sudan
Student Questionnaire (Secondary Schools - Final Class)
Name:
Sex:
2.1 [ ] Male 2.2 [ ] Female
Date of birth:
Place of birth:
4.1 [ ] City 4.2 [ ] Village
Name of school:
Tour school is:
6.1 [ ] Government school 6.2 [ ] Private but receives grants from the government 6.3 t ] Private
Tour school is:
7.1 [ ] Academic 7.2 [ ] Industrial 7.3 [ ] Commercial 7.4 [ ] Agricultural 7.5 [1 Technical (Women)
If your school is academic, check your option:
6.1 [ ] Science (Mathemaics) 8.2 [ ] Science (Biology) 8.3 [ ] Arts & Humanities
Check the most important reason(s) for choosing your option:
9.1 [ ] Because you are interested in this option 9.2 [ ] Tour academic record 9.3 [ ] It gives you more chances for higher education 9.4 [ ] It is your guardian's choice 9.5 [ ] You want to follow your friends' choice 9.6 [ ] For its career prospects after completing secondary school 9.7 [ ] For its career prospects after graduation from higher
education institutions
Is the information satisfactory concerning admission requirements opportunties for higher education institutions:
10.1 [ ] Tes 10.2 [ ] No
If your answer in question 10 is yes, then your source of information is (are):
11.1 [ ] Tour staff 11.2 [ ] Admission office 11.3 [ j Hass media 11.4 [ ] Guardian and friends 11.5 [ ] Others (please specify)
193

From college to work: the case of the Sudan
12. Check the option you prefer when applying to universities and higher institutes:
12.1 [ ] Applying before sitting the Sudanese secondary school certificate examination (being practised now)
12.2 [ ] After the announcement of Sudanese secondary school certificate examinations results
13. After your graduation from the secondary school you want to:
13.1 [ ] Get a job 13.2 [ ] Proceed to university education 13.3 [ j Proceed to technical education 13.4 [ ] Others (Please specify)
14. If you are interested to proceed to higher education institutions, check the relevant choice:
14.1 [ ] Higher education (in the Sudan) 14.2 [ ] Higher education (abroad)
15. If your answer to question 14 is to study abroad, check the the reason(s) for that:
15.1 [ ] Shortage of vacancies for higher education 15.2 [ ] The field of study you want to follow is not available in
the Sudan 15.3 [ ] Because of your own interest
16. The four following arrangements provide you with information about admission requirements and opportunities for higher eduoation institutions in the Sudan and abroad. Check the most relevant:
16.1 [ ] By issuing an annual prospectus, containing information on admission requiremtns and opportunities for higher education institutions in the Sudan and abroad - to be distributed to students directly with a special price (Approx. 10 PTs.) at the beginning of the year
16.2 [ ] Through admission offices 16.3 [ ] Through mass media 16.4 [ ] Through your staff
Date:
Address:
Signature:
194

Questionnaires
Democratic Republic of the Sudan Higher education and employment in the Sudan
University Student Questionnaire
Part I. Personal characteristics:
1.
1.1 Name:
1.2 Date of birth:
Sex:
2.1 [ ] Hale 2.2 [ ] Female
3.1 Place of birth:
3.2 Province:
Marital status:
4.1 [ ] Harried 4.3 [ ] Single 4.2 [ ] Divorced 4.4 [ ] Widowed
Tour religion is:
5.1 [ ] Muslim 5.3 [ ] others (specify) 5.2 [ ] Christian
Borne address:
Part II. Community -characteristics:
1. Tour nationality:
1.1 [ ] Sudanese 1.2 [ ] Non-Sudanese
2. You are coming from:
2.1 [ ] Village 2.2 [ ] City/Town
3. Name of village, town, city:
4. Tour guardian is your:
4.1 [ ] Father 4.3 [ ] Other relatives 4.2 [ ] Brother 4.4 [ ] others (specify)
5. Among your brothers and sisters you are:
5.1 [ ] The youngest 5.3 [ ] in between 5.2 [ ] The oldest
195

Front college to work: lhe case of the Sudan
6. Indicate below the level of education of your:
6.1 Completed post-secondary education 6.2 Completed junior secondary education 6.3 Completed higher secondary education 6.4 Completed primary eduation 6.5 Below primary education 6.6 No education
7. Your guardian works inr
7.1.1 f ] Government sector 7.1.2 [ ] Semi-government sector 7.1.3 [ ] Private sector
7.2 Give the occupation of your guardian:
Father Mother
8. Tour guardian's total income per month (in £S):
10.
8.1 [ ] Less than 50 8.2 [ ] 50 - 100 8.3 [ J 101 - 150
Tour guardian works in:
9.1 [ ] City/town 9.2 [ ] Village
8.4 [ ] 151 - 200 8.5 t ] More than 200
9.3 [ ] Abroad
Give the name of the city, town, village:
Part III. Secondary school characteristics:
1. Give the name of the higher secondary school:
Give the name of the province and the town where you completed your higher secondary school education:
2.1 Province
2.2 Town
After completing junior secondary education, you went to:
3.1 [ ] Higher secondary technical school 3.2 I ] Higher secondary academic school
Tour average percentage of marks in the Sudan School Certificate (or similar) was:
4.1 [ ] 40-50% 4.2 [ ] 51-60% 4.3 [ ] 61-70%
4.4 [ ] 71-80% 4.5 [ ] More than 80%
When did you complete your higher secondary education?
6. Tour higher secondary school was:
.6.1 [ ] Government school 6.2 I J Government-aided school 6.3 [ ] Private school
196

Questionnaires
7. Do you think your secondary school course was adequate background for your present course of study in respect of:
Very adequate Adequate Inadequate 7.1 Content of study [ ] [ ] [ ] 7.2 Method of teaching [ ] [ j [ ]
8. Were you working after completing higher secondary school and before entering higher education institutions?
8.1 [ ] Tes 8.2 [ ] No
8.1.1 If 'Yes' for how long?
8.1.2 What was your monthly income?
9. In what sector did you work?
9.1 [ ] Government sector 9.2 [ ] Semi-government 9.3 [ ] Private sector
Part IV. Early career information:
1. Did you get any information on career possibilities before you applied for higher education?
1.1 [ ] Yes 1.2 [ ] No
2. If 'Yes', you got if from (check as many as relevant):
2.1 [ ] Admission office of the present institution 2.2 .[ ] Staff of your higher secondary school 2.3 [ ] Previous employment you had in- the field 2.4 [ j Friends, parents or relaives 2.5 [ ] General information sources, books, newspapers 2.6 [ j Other students 2.7 [ ] others
3. Was the advice
3.1 [ ] Very satisfactory 3.2 [ ] Satisfactory 3.3 [ ] Not satisfactory
Part V. Educational career decision:
1. When you completed higher secondary school:
1.1 You wanted to follow one of the following fields of study (Please consult the list attached):
1.2 At present you are actually following:
197

From college to work: the case of the Sudan
2.
3.
5.
Tou wanted to pursue that field of study you checked in question V (1.2) beause of the following reasons:
You wanted to follow friends who took the sane field Tour parents advised you to take this course The field has good employment opportunities Good income for graudates in this field The field gives you wide choice for future careers The field gives social prestige You enjoy the field
2.1 2.2 2.3 2.4 2.5 2.6 2.7 2.8
[ ] [ ] [ ] [ ] [ ] [ ] [ ] [ ] ] Other reasons (Please specify)
If you did not actually follow the field of study you wanted, give the reason for the change:
3.1 [ ] Lack of financing 3.2 [ ] Academic performance was not satisfactory 3.3 [ ] Your family wanted you to take something else '3.4 [ ] You later got better information on career possibilities 3.5 [ ] Other reasons (Please specify)
If you had to move out of your home province for pursuing higher education, the most important reason was:
4.1 [ ] There was no college in the area 4.2 [ ] The college in the area was not satisfactory from your
point of view 4.3 [ ] The college in the area did not offer your desired course 4.4 [ J Your parents wanted you to go to another college 4.5 [ ] Other reasons (Please specify)
Why did you go to higher education? factors ) :
(Check one of the following
5.1 5.2 5.3 5.4 5.5
[ ] Obtaining specific professional qualification [ ] Scholarship grant, incentives
Study for its own sake Better employment opportunities for graduates Other factors (Please specify)
[ ] [ ] [ ]
Part VI. Current educational content:
1.
1.1 Mame of the institution of higher education you are attending
1.2 Indicate field of study (please consult the list attached)
Your field of study was:
2.1 [ ] Your first choice 2.2 [ ] Your second choice 2.3 t ï Your third choice
Is the course you are taking now satisfacory in respect of:
V. satisfactory Satisfactory Unsatisfactory 3.1 Meeting your
career objectives I ] [ ] [ ] 3.2 Meeting personal
interest [ ] [ ] [ ]
198

4. what year of study are you in at present?
5. Total duration of your course of study:
5.1 [ ] one year 5.4 [ ] four years 5.2 [ j two years 5.5 [ ] five years 5.3 [ ] three years 5.6 [ ] six years
6. You receive financial support for pursuing higher education from:
6.1 [ ] Government 6.2 t ] Higher education institution 6.3 [ ] Other non-government sponsors 6.4 [ ] Family 6.5 [ ] Others (please specify)
What type of support do you get?
7.1- [ ] Free lodging and meals 7.2 [ ] Free lodging and grant 7.3 [ ] Grant 7.4 [ ] Others (please specify)
Part VII. Current employment context:
1. If you are working, please indicate the type:
1.1 [ ] Paid employee 1.2 [ ] Self-employed 1.3 [ ] Unpaid family worker
2. Are you employed:
2.1 [ ] Full-time? 2.2 [ ] Part-time? 2.3 [ ] Occassionally (including vacations)
3. Approximately, how much do you earn per month (do not include scholarship/grants)?
Part VIII. Occupational expectations:
1. When you have completed your higher education, do you intend to seek employment in an occupation related to your major field of study?
1.1 [ ] Tes, permanently 1.2 [ ] Yes, but not permanently 1.3 [ ] No 1.4 [ ] Others (please specify)
2. If you do not expect to be permanently employed in your present field, why do you remain in this field?
2.1 [ ] The field will lead to a good career 2.2 [ ] I enjoy the field 2.3 [ ] This field gives me a wider choice of future career 2.4 [ ] It was a mistake to choose this field but it is too late
to change

From college to work: lhe case of the Sudan
In what sector do you expect to be permanently employed when you have finished your present studies?
3.1 3.2 3.3 3.4 3.5
] Government sector ] Semi-government sector ] Private sector ] Expect to work abroad ] I do not know
4. Expected amount of earnings per month:
5. If more detailed information had been available for you, would you have changed your field of study?
5.1 [ ] Tes 5.2 [ ] No 5.3 [ ] No opinion
6. How would you assess your past academic performance in the institution of higher education?
6.1 t ] Poor 6.4 [ ] Above average 6.2 [ ] Below average 6.5 [ ] Excellent 6.3 [ j Average
7. After graduation, how long do you think you will have to wait until you get a job?
7.1 [ ] No waiting at all 7.4 [ ] 6 to 12 months 7.2 [ ] Less than 3 months 7.5 [ ] More than 1 year 7.3 [ ] 3 to 6 months
8. What occupation do you expect to have after completing your present course of studies?
9. What sector do you expect to be employed in after completing your present studies?
9.1 [ ] Government sector 9.3 [ ] Private sector 9.2 [ ] Semi-government
10. What might make you work in a rural area? (Please check as many as relevant):
10.1 t ] Home is in a rural area 10.2 [ ] Financial incentives 10.3 [ ] Promotion prospects 10.4 [ j Chance to serve the rural areas 10.5 t j Low cost of living 10.6 [ ] Give any other reason which you think may be important
11. What might discourage you from taking a job in a rural area?
] Lack of tap water, electricity, etc. ] Communication and transport difficulties j Separation from friends and relatives ] Life is dull and slow ] No scope for improving competence j Possible delays in promotion j Lack of opportunities for further studies
11.8 [ ] Another reason (please specify)
11.1 11.2 11.3 11.4 11.5 11.6 11.7
t [ t [ [ [ [

12. How important do you think each of these factors is in making a job satisfactory? (Check as nany as relevant)
12.1 [ 12.2 [ 12.3 [ 12.4 [ 12.5 [ 12.6 [ 12.7 [ 12.8 [ 12.9 [ 12.10 [ 12.11 t 12.12 [ 12.13 [
] Use of special talents ] Scope of taking initiative ] Creative work ] Further studies ] Improves competence ] Helpful to others ] Good income ] Travel ] Better prospects ] Secure future ] Time for family and hobby ] Work environment ] Self-fulfilment
Fart IX. Opinion about eduational arrangements:
1. How do you rank the following arrangements of the teaching process in making your education more responsive to the world of work? (Assign rank 1 to the arrangements you prefer most and rank 5 to the one you least prefer).
1.1 t ] Educational programmes completely separated from work-related programmes
1.2 t ] Formal educational programmes interrupted with related work experience ( sandwich courses )
1.3 [ ] Work experience as a requirement for entry to higher education 1.4 [ ] Work experience as a prerequisite for certification from
the institution of higher education 1.5 [ ] Teachers being allowed to refresh their knowledge with
related field work experience 2. How would you rank the following arrangements of placement
after graduation? (Assign rank 1 to the arrangement you prefer most and rank 5 to the one you prefer least).
2.1 [ ] Placement office attached to each academic department 2.2 [ ] One placement office attached for the whole higher
education institution 2.3 [ ] Placement office attached to the department of labour 2.4 [ ] Public recruitment board 2.5 [ ] Personal contracts
3. The following list gives four way of obtaining better knowledge on conditions of works, promotion prospects etc. Please rank them in order to preference ( 1 being given to the most preferred and 4 being given to the least).
3.1 [ ] Practical job experience during study course 3.2 [ ] Personally getting information from prospective employers 3.3 [ ] Reading advertisements 3.4 t ] Discussing with staff of your institution
4. Give the address where we could contact you after you leave the higher education institution.
Signed Date

From college to work: the case of the Sudan
List of subjects under different fields of study
Natural science Biological science Chemistry Geology Physics Other physical sciences Mathematics
Engineering Chemial engineering Civil engineering Electrical engineering Mechanial engineering Mining Surveying
Health Pharmacy Medicine Nursing Hygiene Nutrition
Humanities arts Arabic English Fine arts Philosophy Religion Any other literature
Social sciences Economics including home economics Commerce History Political science Psychology Sociology and anthropology Geography Rural development Statistics Child care
Law Law Sharia
Administration Business administration Accountancy and auditing Public administration
Agriculture Agriculture Animal Vetrinary medicine Forestry
Education Education Teacher training (including
technical teacher training) Physical education

Questionnaires
Democratic Republic of the Sudan Higher education and employment in the Sudan
Graduate Questionnaire
1.1 Name:
1.2 Date of birth:
Sex:
2.1 [ ] Hale
Place of birth:
3.1 [ ] City 3.3 [ ] Village
2.2 [ ] Female
3.2 [ ] Town 3.4 [ ] Others
Province:
5. Marital status:
5.1 [ ] Married 5.3 [ ] Divorced
6. Religion:
6.1 [ ] Muslim 6.3 [ ] Others
5.2 [ J Single 5.4 [ ) Widowed
6.2 [ ] Christian
7. Your guardian is:
7.1 [ ] Your father 7.2 [ ] Other relative
8. . Give the occupation of your guardian:
9. Your guardian is working in a:
9.1 [ ] Governmental sector 9.2 [ ] Semi-governmental sector
10. Your guardian's place of work:
10.1 [ ] A city 10.3 t ] Others (working site)
9.3 [ ] Private sector 9.4 [ j Others (please specify)
10.2 [ ] A village
11. After completing secondary education:
11.1 [ ] You wanted to study (please consult the list attached):
11.2 [ ] You actually studied (please consult the list attached):
11.3 [ ] The date of your admission to a higher education institution:
203

From college to work: the case of the Sudan
12. You followed the field of study checked In question (10.1) because of the following reason(s):
13.
12. 12. 12. 12. 12. 12. 12. 12.8
] You like this field of study j Your guardian advised you to take this field of study ] According to your secondary school teachers' advice ] Tou wanted to follow friends who took the same field ] The field has good employment opportunities ] It secures a good income ] It gives social prestige ] Other (please specify) _,
If you did not actually follow the field of study you desired, check the factors responsible for the change:
13.1 13.2 13.3 13.4 13.5
] Lack of money ] Academic performance was not satisfactory ] According to your family desire ] You later got better information on career possibilities ] Other factor (please specify)
14. You moved from your home province to pursue higher education because of the following reason(s):
14.1 [ ] There was no higher education institution in the area 14.2 [ ] The institution in the area did not offer the course you desire 14.3 [ ] Any other reason (please specify)
15. Please give the name(s) of the institution!s) you attended during your post-secondary education, the academic award(s) you obtained, and the duration of each course of study:
Institution Academic award Duration
15-1 [ ] [ ] [ ] 15.2 [ ] ( ] [ ] 15.3 [ ] [ ] [ ] 15-4 [ ] [ ] [ ] 15.5 Give the actual number of years you attended before you were
awarded your first degree:
16. Please check the following list: (a) The field in which you specailize (b) The field which is the most relevant to your present job.
Fields of study (a) (b)
16. 16. 16 16. 16. 16. 16. 16.8 16.9 16.10 16.11 16.12
Natural sciences Engineering and technology Medicine and health Arts and humanities Social sciences and economics Education and physical education Management and accounts Law and Sharia Agriculture Veterinary science Fine and applied arts Others (please specify)
204

Questionnaires
17. Please check the reason(s) that lead you to join a job not suitable to your specialization:
17.1 [ ] Tou could not get a job suitable to your specialization 17.2 [ ] lour field of study was quite flexible 17.3 [ ] The needs of your job are flexible 17.4 [ ] Tour present job has better career prospects
18. Do you think that your higher education provided adequate background for your first job after graduation?
18.1 [ ] Yes 18.2 [ ] No 18.3 [ ] To some extent
19. Please check the time you took to get your first job after your graduation:
19.1 [ ] 1-6 months 19.2 [ ] 7-12 months 19.3 [ ] 13-18 months 19.4 [ ] 19-25 months 19.5 [ ] More than 25 months
20. ïou have been selected to this job through:
20.1 [ ] The institution of higher education 20.2 [ ] Department of Labour 20.3 [ ] Public Service Recruitment Board 20.4 [ ] other (please specify)
21. Please check the time that took you from graduation to get the first suitable job to your qualification:
21.1 [ ] 1-6 months 21.2 [ ] 7-12 months 21.3 [ ] 13-18 months 21.4 [ ] 19-25 months 21.5 [ ] More than 25 months
22. Tou nave been selected to this suitable job through:
22.1 [ ] The institution of higher education 22.2 [ ] Department of Labour 22.3 [ ] Public Service Recruitment Board 22.4 [ ] Other (please specify)
23. Please check the factor(s) according to which you have been selected to your suitable job:
23.1 [ ] Academic performance 23.2 [ ] Post-working experiene 23.3 [ ] Aptitute tests and interview 23.4 [ ] other factor(s) (please specify)
24. Did you change your occupation or industry?
24.1 [ ] Tes 24.2 [ ] Mo
205

From college to work: the case of the Sudan
25. If you answer in question 24 is yes, you have changed because of the following reason(s):
25.1 [ ] Better conditions of service 25.2 [ ] Better use of your training 25.3 [ ] Lost previous job 25.4 [ ] Any other reason(s) (please specify)
26. Your employment sector at present is:
26.1 [ ] Government 26.3 [ ] Private 26.2 [ ] Semi-government 26.4 [ ] Other (please specify)
27. How do you rank the following arrangements of teaching process in making higher education more responsive to world of work? (Assign rank 1 to the arrangement you prefer most and rank 2 to what you prefer more and rank 3 to the least preference)
27.1 [ ] Formal education programmes interrupted with related work experience (Sandwich courses)
27.2 [ ] Work experience as a prerequisite for certification from the institution of higher education
27.3 [ ] Teachers being allowed to refresh their knowledge with related field work experience
28. The following list gives four ways of obtaining better knowledge on condition of work, promotion prospects., etc. Please rank them in order to preference ( l being given tot the most preferred and 4 being given to the least )
28.1 [ ] Practical job experience during study course 28.2 [ j Personally getting information from prospecting employers 28.3 f ] Reading advertisments 28.4 [ ] Discussing with staff of your institution
29. Your place of work:
29.1 t ] A city 29.2 ( ] A village 29.3 [ ] Others- (sites etc.)
30. Is the province of your work different from the province you consider home? ,
30.1 [ I Yes 30.2 [ ] No
31. If your answer is yes in question 30, you moved because of the following reasons(s)
31.1 [ ] You did not get a job in your province 31.2 [ ] You could get a job but it would not be relevant
to your training 31.3 [ ] You were transferred by the employer 31.4 [ ] You did not like to work at your province 31.5 [ ] You have better career prospects outside your province 31.6 [ ] Your family moved outside your province 31.7 [ ] Any other reason(s) (please specify)
206

Questionnaires
32.1 32.2
32.3 32.4 32.5
[ [
[ t [
32. Check the most suitable arrangement of graduate placement:
] Placement office attached to each faculty ] Placement office attached to each higher education institution ] Department of Labour ] Public service Recruitment Board ] Through personal contacts
33. What might make you work in the rural areas? (please check as many as relevant)
33.1 [ ] Your home is in a rural area 33.2 [ ] Financial incentives 33.3 [ ] Promotion prospects 33.4 [ ] Chance to serve the rural areas 33.5 [ ] Low cost of living 33.6 [ ] Any other reason(s) (please specify)
34. What might discourage you from taking a job in a rural area?
34.1 [ ] Lack of services like tap water, electricity, means of transportation, etc....
34.2 [ ] Separation from friends and relatives 34.3 [ ] Possible delays of promotion and further studies 34.4 [ ] Other reasons (please specify)
35. Please check the most important four factors that make a job satisfactory:
35.1 35.2 35.3 35.4 35.5 35.6 35.7
] Use of special talents and scope of taking initiatives ] Creaive work ] Further studies and training ] Helpful to others ] Good income ] Offers travel and time for family and holidays ] Work environment
36. Name of the organization at which you are now employed:
Address:
Signature:
Date:

From college to work: the case of the Sudan
Fields of study
(A) Natural sciences (B) Engineering and technology
Biology Chemistry Geology Physics Mathematics Other natural sciences
(C) Arts and humanities
Chemical engineering Civil engineering Electrical engineering Mechanical engineering Mining Technology
(D) Medicine/health
Arabic language English language Philosophy Theology Arts
Pharmacy Medicine Dentistry Nursing Public health Nutrition
(E) Law and sharia (F) Economics and Social sciences
Lav Islamic Sharia
(6) Fine & Applied arts
Fine arts Applied arts
Economics & Home economics Commerce History Political science Psychology Sociology and soial anthorpology Geography Rural development Accounts Child care
208

Questionnaires
Democratic Republic of the Sudan Higher education and employment in the Sudan
Employers' Questionnaire
1. Mame of Organization:
2. The organization is:
2.1 [ ] Governmental 2.2 [ ] Semi-governmental 2.3 [ ] Private
The nature of your organization work:
3.1 [ ] Agriculture 3.2 [ ] Industry 3.3 [ ] Commerce 3.4 [ ] Service
The total number of employees (including professionals, technicians and labourers ) :
4.1 Full-time 4.2 Part-time
Total number of higher education institutions graduates employed at present in your organization:
Number of graduates employed in your organization compared to the total number of posts available to employ graduates:
No. employed Posts 6.1 Professional graduates (i.e. graduates
from the faculties of medicine, engineering, agriculture etc. '....)
6.2 Technicians 6.3 Graduates working in administrative
and service departments
Have you a job discription for each post?
7.1 [ ] Yes 7.2 [ ] No
How important do you think each of the following factors are for selecting graduates to your organization?
Very important Important Not important 8.1 Academic record [ ] [ ] [ ] 8.2 Aptitute tests and
interviews [ ] [ ] [ ] 8.3 Post experience in a
similar type of job 8.4 Letters of recommendation 8.5 Physical appearance 8.6 Marital status 8.7 Sex 8.8 Age
[ ] [ ] [ ] [ ] [ ] [ ]
[ ] [ ] [ ] [ ] [ ] [ ]
[ ] [ ] [ ] [ ] [ ] [ ]

From college to work: the case of the Sudan
9. Check the most Important difficulty that hinders matching graduate's qualification to your job needs:
9.1 [ ] No correspondance between the educational institution and the employers' needs
9.2 [ ] The graduates do not have the training which you would like then to have
9.3 [ ] Any other(s) (please specify)_
10. How would you rank the following arrangements of the teaching process in making education more responsive to the world of work? Assign rank (1) to the arrangement you prefer most (2) to what you prefer less, and (3) to your least preference.
10.1 [ ] Formal educational programmes interrupted with related work experience
10.2 [ ] Work experience as a pre-requisite for certification from the institution of higher education
10.3 [ ] Teachers being allowed to refresh their knowledge with related field work experience
11. If you attend post-secondary education please give the academic award(s): ;
12. Please check the following list: (a) the field in which you are specialized (b) the field which is the most relevant to your present job.
Fields of study (a) (b)
12.1 Natural sciences [ ] [ ] 12.2 Engineering and technology [• ] [ ] 12.3 Medicine and health [ ] [ ] 12.4 Arts and humanities [ ] [ ] 12.5 Economics and social sciences [ } [ ] 12.6 Education and physical education [ ] [ ] 12.7 Administration [ ] [ ] 12.6 Law and Sharia [ ] [ ] 12.9 Agriculture [ ] [ ] 12.10 Veterinary science [ ] [ ] 12.11 Fine and applied arts [ ] [ ] 12.12 Others (please specify) [ ] [ j
13. Check the degree of adequacy of your higher education to your job:
13.1 [ ] Very adequate 13.2 [ ] Adequate 13.3 [ J Inadequate
14. Check the specializations of graduates in which your organization greatly lacks:
14.1 [ ] Technologists and technicians 14.2 [ ] Professionals 14.3 [ ] Administrators 14.4 [ ] Other (please specify)
210

Questionnaires
15. Check the most sutiable arrangement from the following five arrangements of graduates placement:
15.1 [ ] Placement office attached to the faculty of the graduate 15.2 [ ] Placement office attached to the graduate higher education
institution 15.3 [ ] Department of Labour 15.4 [ ] Public Recruitment Board 15.5 [ ] Personal contacts
16. Check the reason(s) which you think is(are) important to encourage graduates to work in the rural areas:
16.1 t ] The graduate home is in a rural area 16.2 t ] Promotion prospects 16.3 [ ] Chance to serve rural areas 16.4 [ ] Low cost of living 16.5 [ ] Any other reason(s) (please specify)
17. Check the reason(s) which you think is(are) important to discourage the graduates from working the rural areas:
17.1 [ ] Lack of services like tap water, electricity and means of transport
17.2 [ ] It separates the graduate from his relatives and friends 17.3 [ ] Possible delays of promotion and further studies 17.4 [ ] Life in rural areas is dull 17.5 [ ] Any other reason(s) (please specify)
Address:
Signature:
Date:
211

Front college to work: the case of the Sudan
Fields of (A) Hatural sciences
Biology Chemistry Geology Physics Mathematics Other natural sciences
(C) Arts and humanities
Arabic language English language Philosophy Theology Arts
(E) Law and Sharia
Law Islamic Sharia
study (B) Engineering and technology
Chemical engineering Civil engineering Electrical engineering Mechanical engineering Mining Technology
(D) Medicine/health
Pharmacy Medicine Dentistry Nursing Public health Nutrition
(F) Economics and social sciences
Economics & Home economics. Commerce, History, Political science. Psychology, Sociology and social anthorpology. Geography, Rural development, Accounts and Child care
212

H E P publications and documents
M o r e than 500 titles on all aspects of educational plannning have been published by the International Institute for Educational Planning. A comprehensive catalogue, giving details of their availability, includes research reports, case-studies, seminar documents, training materials, occasional papers and reference books in the following subject categories:
Economics of education, costs and financing
Manpower and employment
Demographic studies
The location of schools and sub-national planning
Administration and management
Curriculum development and evaluation
Educational technology
Primary, secondary and higher education
Vocational and technical education
Non-formal, out-of-school, adult and rural education
Copies of the catalogue m a y be obtained from the H E P on request.
The International Institute for Educational Planning
The International Institute for Educational Planning (HEP) is an international centre for advanced training and research in the field of educational planning. It was established by Unesco in 1963 and is financed by Unesco and by voluntary contributions from individual M e m b e r States.
The Institute's aim is to contribute to the development of education throughout the world, by expanding both knowledge and the supply of competent professionals in the field of educational planning. In this endeavour the Institute cooperates with interested training and research organizations in M e m b e r States. The Governing Board of the H E P , which approves the Institute's programme and budget, consists of eight elected members and four members designated by the United Nations Organization and certain of its specialized agencies and institutes.
Chairman: Malcolm Adiseshiah (India), Chairman, Madras Institute of Development Studies
Designated Aklilu Habte, Director, Education Department, members: International Bank for Reconstruction and Development
M o h a m e d Shahari A h m a d Jabar, Director, United Nations Asian and Pacific Development Centre Wajih D . Maalouf, Chief, Agricultural Education and Extension Service, United Nations Food and Agriculture Organization Goran Ohlin, Assistant Secretary-General, Office for Development Research and Policy Analysis, Department of International Economic and Social Affairs, United Nations
Elected Henri Bartoli (France), Professor, University of Paris I, members: Pantheon-Sorbonne, Paris
Hellmut Becker (Federal Republic of Germany), Max-Planck Institute for H u m a n Development and Education, Berlin (West) and Honorary Professor, Free University of Berlin (West) Georges Ngango (Cameroon), Minister of Education, Yaounde M o h a m m a d A . Rasheed (Saudi Arabia), Director-General, Arab Bureau of Education for the Gulf States, Riyadh Sippanondha Ketudat (Thailand), President, National Petrochemical Corporation Ltd., Bangkok Victor Urquidi (Mexico), Research Professor, El Colegio de Mexico Alexandre P. Vladislavlev (USSR) , First Vice-President, All-Union Council of Scientific and Engineering Societies, ( V S N T O ) , M o s c o w
Inquiries about the Institute should be addressed to : The Director, H E P , 7-9, rue Eugène-Delacroix, 75116 Paris