frictional conditions of aa5251 aluminium alloy sheets
TRANSCRIPT

Corr Authorrsquos Address University of Stavanger N-4036 Stavanger Norway Hirpaglemuuisno 51
Strojniški vestnik - Journal of Mechanical Engineering 60(2014)1 51-60 Received for review 2013-07-12copy 2014 Journal of Mechanical Engineering All rights reserved Received revised form 2013-09-30DOI105545sv-jme20131310 Original Scientific Paper Accepted for publication 2013-10-22
0 INTRODUCTION
Deep drawing is a key manufacturing process for sheet metal products The quality of the products and the efficiency of the drawing process depend on several parameters Friction regimes encountered during deep drawing in particular are known to be extremely complex [1] and [2] This is as a result of the inherent factors such as the contact pressure sliding velocity surface roughness at sheet metal and tool interface material properties of the tool and the blank and the properties of the lubrication Moreover resistance to friction depends on texture anisotropy [3] and physicochemical factors acting on the contact surface and the dynamics of loads [4] Previous studies show that friction at the microscopic level is due to adhesion between contacting asperities the ploughing effect between asperities [5] and the appearance of hydrodynamic friction stresses [6] and [7] Few regions of the draw piece with different stress and strain states local sliding velocity contact pressure and friction conditions exist
General application of numerical simulations of sheet metal forming for proper functioning requires knowledge of suitable mathematical descriptions of friction behaviour The finite element method (FEM) as a numerical analysis approach is currently widely used in sheet metal modelling and analysis A description of the drawbead cannot generally be taken into account in the finite element simulation of sheet metal forming processes [8] and [9] The small radii of the bead and the sharp corners of the die shoulders impose a certain meshing of the sheet passing the drawbead At the same time the role of
the experimental approach remains essential [10] for developing numerical methods for the calculation of the friction coefficient and validating the results
Performance of the forming process is secured by controlling the blank holder force a straining force created by friction between the blank and the tools which partially controls the material flow This force cannot fully control the material flow because it does not make a full contact with the entire blank Fig 1 illustrates the drawbead form in deep drawing and how it generates a stable tensile force opposite to the sheet drawing direction by introducing a series of local bending straightening and reverse bending deformations on the sheet
Fig 1 Deformation of the sheet in drawbead region
This article presents the results of studies done on the two main problems experimental research on frictional conditions of AA5251 aluminium alloys using a drawbead simulator friction test in accordance with the drawbead simulator (DBS) approach proposed by Nine [11] and numerical simulations based on the results of the friction test
Frictional Conditions of AA5251 Aluminium Alloy Sheets Using Drawbead Simulator Tests and Numerical Methods
Trzepieciński T ndash Lemu HGTomasz Trzepieciński1 ndash Hirpa G Lemu2
1 Rzeszow University of Technology Department of Materials Forming and Processing Poland 2 University of Stavanger Department of Mechanical and Structural Engineering and Materials Science Norway
This article presents research results on the effect of sheet metal surface roughness lubricant conditions and sample orientation on the value of friction coefficient in the drawbead region of sheet metal-forming processes Aluminium alloys with different temper conditions were used as test materials The experimental results have ascertained several relationships showing the effect of surface profile and lubrication on the value of the friction coefficient Based on experimental measurements it may be concluded that the sample orientation and the lubrication conditions are crucial variables influencing the value of the coefficient of friction Furthermore a numerical model of the drawbead has been created in MscMARC Mentat software and several simulations have been performed to study the stressstrain state in stretched sample during drawbead simulator tests Both isotropic and anisotropic material models were used in the simulations taking into account the sample orientation with respect to the rolling direction of the sheetKeywords coefficient of friction drawbead FEM simulation friction sheet metal forming
Strojniški vestnik - Journal of Mechanical Engineering 60(2014)1 51-60
52 Trzepieciński T ndash Lemu HG
1 MATERIALS AND METHODS
11 Materials
The first task conducted in this research was an experimental work in which four kinds of aluminium alloy sheets with different temper conditions were used The sheets with temper H14 have a thickness of 08 mm while sheets with temper O H16 and H22 have a thickness of 1 mm The average sheet thickness varied between plusmn001 mm as a result of the tolerance of the sheet metal fabrication process A tensile test in the universal testing machine was carried out to determine the mechanical properties of the sheets The mechanical properties determined in this test (as given in Table 1) are yield stress Rp02 ultimate strength Rm elongation A50 anisotropy coefficient r strain-hardening coefficient C and strain-hardening exponent n The samples for the tensile tests were cut in two directions along the rolling direction (0deg)
and transverse to the rolling direction (90deg) The mechanical properties of the sheets clearly show that the used aluminium alloy sheets have a wide range of Rp02 values based on temper conditions
12 Surface Characterization
The measurement of surface roughness parameters was carried out using the Alicona InfiniteFocus instrument The main standard 3D parameters determined by this measurement (given in Table 2) are the roughness average Sa the root mean square roughness parameter Sq the highest peak of the surface Sp the maximum pit depth Sv the surface skewness Ssk the surface kurtosis Sku the 10-point peak-valley surface roughness Sz the density of summits Sds the texture aspect ratio of the surface Str the surface bearing index Sbi the core fluid retention index Sci and the valley fluid retention index Svi The surface topography of tested materials is also
Table 1 The mechanical properties of the tested sheets
Material Orientation [deg]Mechanical properties
Rp02 [MPa] Rm [MPa] A50 C [MPa] n R
AA5251 O0 68 203 018 252 0279 0607
90 72 205 025 245 0270 0870
AA5251 H140 212 234 004 254 0058 0478
45 216 240 004 271 0070 069390 210 241 004 327 0078 0786
AA5251 H160 184 232 005 253 0163 0528
90 189 236 006 242 0154 0751
AA5251 H220 111 201 019 370 0239 0535
90 122 207 021 370 0227 0793
Table 2 The surface roughness parameters of the tested sheets
MaterialSurface roughness parameters
Sa [microm] Sq [microm] Sp [microm] Sv [microm] Ssk Sku Sz [microm] Sds Str Sbi Sci SviAA5251 O 0302 0376 237 139 0267 348 326 749 0029 0241 164 0110AA5251H14 0340 0423 248 162 0298 334 33 697 0036 0243 167 0094AA5251H16 0362 041 298 208 0338 367 351 685 0041 0255 158 0112AA5251H22 0325 0401 204 153 0321 358 343 716 0031 0263 172 0104
In [Peaksmmsup2] or alternatively the unit [vertexesmmsup2] can also be used
Fig 2 Surface topography of tested materials a) AA5251 O b) AA5251 H14 c) AA5251 H16 d) AA5251 H22
Strojniški vestnik - Journal of Mechanical Engineering 60(2014)1 51-60
53Frictional Conditions of AA5251 Aluminium Alloy Sheets Using Drawbead Simulator Tests and Numerical Methods
shown in Fig 2 where each tested surface has an area of 14301times10849 mm
Fig 3 Measurement system used for friction testing 1 ndash frame 2 ndash front roll 3 - middle roll 4 - back roll 5 ndash specimen
6 ndash supporting roll 7 and 8 ndash tension members 9 and 10 ndashextensometers 11 ndash fixing pin
13 Drawbead Test
In the drawbead simulator test the sheet metal was pulled to flow between three cylindrical rolls each with a radius of 20 mm (Fig 3) The rolls have been quenched and tempered according to a minimum of 57 HRC The quenching temperature was 990 degC and the temper temperature was approximately 500 degC The test material was cut along the rolling direction into 200 mm long and 20 mm wide strips To realize various lubricated conditions both rolls and sheet specimens were degreased by using acetone for dry friction conditions and machine oil L-AN 46 of 44 mmsup2s-1 viscosity at 40 degC was used for lubricated conditions The lubricant was applied in excess to the test strips so that the film thickness could be determined by the process The sliding speed was set to 1 mms and various tribological conditions were obtained by using rolls with different surface roughness values (Ra = 032 064 and 125 μm) measured along the generating line of the rolls The rolls were made of cold-worked tool steel X165CrV12
The clearance between working rolls was adjusted and maintained at 15t (where t is the sheet thickness) The main purpose of this clearance is to prevent locking of the sheet between the rolls especially for fixed rolls The clearance value was estimated based on a trial-and-error method and experience Taking the clearance into account the total wrap angle around all rolls is about 31048deg where the highest wrap angle is on the middle roll
The pulling and clamping forces were controlled using load cells To determine the coefficient of friction carrying out two tests with two samples was found to be necessary One specimen was pulled between cylindrical rolls supported by bearings and then the measured pulling force (denoted as Droll) and the clamping force (Croll) gave the bending and unbending resistance of the sheet under ldquofrictionlessrdquo conditions respectively
The sheet is displaced between the rotating rolls so that the friction between the sheet and rolls is minimized while the second specimen is pulled between the fixed rolls Friction opposes the sliding of the sheet over the fixed rolls The combined loads required to slide and to bendunbend the sheet with the fixed rolls are then given by the measured pulling force (Dfix) and the clamping force (Cfix)
When the wrap angle of middle rolls is 180deg the coefficient of friction is calculated according to the following expression [11]
microπ
=minus
sdot
D DC
fix roll
fix
(1)
where Dfix is the pulling force obtained with the fixed rolls Droll is the pulling force obtained with the freely rotating rolls and Cfix is the normal force or clamping force obtained with the fixed beads
It has been argued in a previous study [12] that the wrap angle corresponding to the actual engagement of the strip with the roller or bead was not taken into account in the derivation done by Nine [11] Further Green [13] states that the tangent-to-tangent bead wrap assumption becomes approximately valid only at extremely deep penetrations This supports the argument that the validity of the equation derived by Nine [11] is limited to deep penetrations
When the wrap angle is not equal to 180deg the friction coefficient is calculated from [14]
microθθ
=minus
sdotD DC
fix roll
fix
sin 2
(2)
where θ is the quarter contact angle of actual engagement of the strip over the bead and a value of θ = π2 confirms a full penetration
2 NUMERICAL MODELLING
The simulation of the drawbead simulator test was conducted using MSCMarc + MENTAT 2010
Strojniški vestnik - Journal of Mechanical Engineering 60(2014)1 51-60
54 Trzepieciński T ndash Lemu HG
software Both dry friction and oil-lubricated contacts were considered The rolls were defined as rigid surfaces While conducting the modelling the aluminium sheet metal (AA5251 H14) was initially placed in a horizontal position and held by a frictionless device (Fig 4a) At the initial stage the middle roll was moved down to bend the sheet metal while the leading end of the sheet metal was fixed The middle roll was allowed to travel through the distance at which the centres of curvature for both front and back rolls and the middle roll were at the same height (Fig 4b) A displacement of 40 mm was then applied to one end of the sample when the required wrap angle was obtained The numerical analyses were performed for the AA 5251 H14 sheet tested in the following conditions sample orientation 90deg Ra of rolls 063 μm lubrication conditions
The finite element model of the blank consists of 3600 quad4 shell elements with five integration points through the shell thickness which are necessary for an acceptable solution [10] The assumed strain formulation was applied to improve the bending characteristics of the elements This can substantially improve the accuracy of the solution in terms of the computational costs of assembling the stiffness matrix An elasto-plastic material model approach was implemented and three material models have been simulated In the first material model the plastic behaviour of the metal was described by the von Mises yield criterion [15] In the second model the anisotropy of the material was established using the Hill yield criterion [16] The Hill formulation is the most frequently used yield function in many research papers on steel sheet metal forming and can be regarded as an extension of the isotropic von Mises function As reported by Cazacu and Barlat [17] the Hill formulation can also be applied for the material description of aluminium alloys
Fig 4 Geometry and boundary conditions of FEM model of drawbead simulator test a) initial configuration and b) start of
drawing stage
The material behaviour for this second formulation is specified using the following properties Youngrsquos modulus E = 70000 MPa Poissonrsquos ratio ν = 033 and mass density r = 2690 kgmiddotm-3 The isotropic hardening behaviour uses the Hollomon power-type law by which the parameters C and n (given in Table 1) are fitted on a stress-strain curve of the tensile test
In the third model the Barlat yield function has been applied [18] In the case of anisotropy material models both 0deg and 90deg sample orientations have been examined The balanced biaxial yield stress σb necessary to define Barlat material model was measured in a bulge test and a value of 278 MPa was obtained Simulations of friction tests were performed for rolls with surface roughness values of Ra = 125 microm in dry friction conditions To describe contact conditions the Coulomb friction law was applied (as described in an earlier publication by the same authors [19])
3 DISCUSSION OF EXPERIMENTAL RESULTS
31 Friction Coefficient Value
In the friction tests two sets of values for clamping and pulling forces determined for fixed and freely rotating rolls under dry friction and lubricated conditions were received The average value of friction coefficient was determined from Eq (1) after rejecting initial transient scope of load forces (Fig 5)
Fig 5 Load characteristics of friction tests for AA5251 H14 under following conditions Ra of rolls 125 mm dry friction sample
orientation at 0deg
The average values of the coefficient of friction determined in dry friction μdry and in lubricated conditions μoil are given in Table 3 Upon analysis of the friction test results the expected relationships are observed That means values of the friction coefficient in dry friction conditions are higher than those in lubrication conditions The application of machine oil reduces the value of friction coefficient but its
Strojniški vestnik - Journal of Mechanical Engineering 60(2014)1 51-60
55Frictional Conditions of AA5251 Aluminium Alloy Sheets Using Drawbead Simulator Tests and Numerical Methods
intensity depends on the surface roughness of the rolls This impact is not strongly evident and will be discussed in detail later in the article
Table 3 Friction coefficient values of tested sheets
MaterialRa (rolls)
[microm]Sample
orientation [deg]Coefficient of friction
microdry microoil
AA5251 O
0320 0259 0205
90 0262 0219
0630 0245 0194
90 0251 0201
1250 0219 0161
90 0238 0181
AA5251 H14
0320 0245 0190
90 0257 0221
0630 0222 0173
90 0243 0196
1250 0193 0140
90 0205 0159
AA5251 H16
0320 0242 0183
90 0252 0212
0630 0215 0166
90 0225 0169
1250 0188 0135
90 019 0144
AA5251 H22
0320 0238 0175
90 0253 0202
0630 0197 0149
90 0207 0157
1250 0185 0134
90 0188 0142
Fig 6 Friction coefficient value vs surface roughness [Ra] of rolls for a) AA5251 O b) AA5251 H24
As the value of the Ra parameter of the rolls increases the friction coefficient decreases for both dry friction and lubricated conditions (Fig 6) The above-mentioned relations are valid for both sample
orientations and for all tested materials For all considered friction conditions the friction coefficient values for samples cut across the rolling direction of the sheet are higher than for samples cut parallel to the rolling direction The tested sheets exhibit directional surface topography caused by the manufacturing process of the sheets (rolling) The values of the 2D amplitude roughness parameters measured parallel to the rolling direction are lower than those measured in the transverse direction to the rolling direction Furthermore rolling causes directional orientation of the material grains parallel to the rolling direction which is the source of anisotropy In that case the evolution of the surface topography during the sheet passing the draw bead is different for both sample orientations
32 Sheet Roughness
The plot of the friction coefficient versus Sa parameter for the sheet AA5251 H22 is given in Fig 7 It is observed in this plot that a local minimum of friction coefficient value at Sa = 0322 μm exists
Fig 7 The friction coefficient value vs the roughness average Sa of the sheet for orientation at 0deg
The above-mentioned relation is observed for all applied friction conditions sample orientations and surface roughness of rolls supports the conclusion that favourable conditions of friction reduction exist for this sheet
Shih et al [20] reported that roughening of asperities observed during stretching of the deformed material tends to decrease the real area of contact resulting in a lower coefficient of friction The continued increment of the value of friction coefficient for the sheet in this study (AA5251 H14) at Sa = 034 μm may be explained by the fact that (in spite of increasing surface roughness) the lubrication is unable to overcome the dominated metallic contact between the roughness asperities of contact bodies as the larger space contains the lubricant
Strojniški vestnik - Journal of Mechanical Engineering 60(2014)1 51-60
56 Trzepieciński T ndash Lemu HG
Studies show that surface textures act either as micro-traps for capturing wear debris or as micro-reservoirs that enhance lubrication [21] In the case of steel sheets [10] and [22] it is observed that higher Ra parameter value tends to produce lower friction or this tendency is observed up to a certain Ra value and the value of friction coefficient increases The roughness acts to separate the surfaces isolating the areas of direct metallic contact The larger the amplitude of the roughness the less the area of contact grows for a given amount of sliding deformation By limiting the area of direct contact during sliding the adhesion and deformation components of friction are reduced and the valleys act to trap wear debris reducing the amount of body wearing [22] However Al and Al alloys are relatively soft and a mechanically mixed layer of ultrafine particles is formed due to deformation [23] Thus high Ra values can hardly produce wear debris that act as abrasive particles
For all rollers used in the test the relation between the Sa parameter and the friction coefficient value is similar The friction coefficient value has the tendency to decrease with increases of the value of Sa parameters that represent different materials Taking all of the obtained results into account the relation between the value of Sa parameter and friction coefficient (Fig 7) is found to be opposite to that reported in previous researches [10]
33 Effect of Lubrication
In order to reduce friction and minimize sheet failure lubricants are typically applied to portions of the workpiece that undergo severe contact with dies When lubricant is applied the frictional resistance of the sheet material decreases and its strain uniformity increases This means that the application of any lubricant should result in a reduction of the value of the friction coefficient
Comparison of the values of the friction coefficient determined in dry friction and lubricated conditions demonstrate nearly linear relations (Fig 9) This is particularly evident in the case of the sample orientation at 0deg (Fig 9a)
The inclination angle of the trend line for sample orientation 0deg and 90deg are 4232deg and 4599deg respectively When the sample has a 0deg orientation a higher value of the friction coefficient in dry conditions is obtained implying the higher effectiveness of lubrication The relation for the sample orientation at 90deg (Fig 9b) is the reverse
Fig 8 Dependence of parameters Sa Ssk and Sku of tested sheets
Fig 9 Relation between the friction coefficients determined in dry friction conditions mdry and in lubrication conditions moil for
orientation at (a) 0deg and (b) 90deg
34 Lubricant Effectiveness
It is evident that rough surfaces enable lubricant adhesion to the sheet material This effect appears to be due to the manner in which the lubricant is captured by rough areas on the surface of the sheet To examine the effectiveness of the sheet lubrication the L-index was introduced defined as follows
L dry oil
dry
=minusmicro micromicro
(3)
Strojniški vestnik - Journal of Mechanical Engineering 60(2014)1 51-60
57Frictional Conditions of AA5251 Aluminium Alloy Sheets Using Drawbead Simulator Tests and Numerical Methods
As shown in Fig 10 the L-index value has a non-linear relation with the value of roughness parameter Ra of rolls In the case of a sample orientation at 0deg the value of the L-index initially decreases and then shows an increasing tendency For sample orientation at 90deg however a continuous increasing trend of the L-index value is observed The range of L-index value for the samples oriented at 0deg is higher (019 to 0275) than for the samples oriented at 90deg (0132 to 0245) therefore in the case of the samples cut parallel to the rolling direction lubricant highly reduced the friction coefficient value There is no evident relation between the temper conditions of the sheet and L-index value but for both orientations the sheet H22 exhibits the highest friction reduction In all cases the value of L-index is the highest for Ra = 125 μm As stated previously in the case of higher surface roughness of contact bodies a high volume of lubricant may be trapped in surface pits and consequently the effectiveness of lubrication is higher
Fig 10 Effectiveness of lubrication (L-index) as a function of Ra of rolls oriented at (a) 0o and (b) 90deg
4 DISCUSSION OF NUMERICAL RESULTS
The numerical simulations include Hillrsquos and Barlatrsquos materials and they were performed for both 0deg (designated as Hill 0deg Barlat 0deg) and 90deg (designated as Hill 90deg Barlat 90deg) sample orientations with respect to the rolling direction The results show that the distributions of effective strain for different yield criteria during full penetration have been varying considerably (Fig 11)
Maximal values of effective strains for Hill 0deg are higher than the values for sample cut transverse to the
rolling direction by about 0002 A similar relationship exists for Barlatrsquos material model Furthermore the points of occurrence of maximal effective strains depend on the considered material model
The distributions of normal stress and shear stress in the transverse section after drawing a distance of 20 mm are shown in Fig 12 The results in these plots show that the maximal values of the normal stress and shear stress for all material yield functions are at the edge of the sample The values of Barlatrsquos material model regarding both orientations are the closest to the isotropic model The local minimum at the middle ie section 0-Arsquo is related with deformation of the sheets during bending over the rounded bead It causes local contact of the sheet with the roll surface and thus the values of friction forces along the sample width are not constant In the case of the Hill yield model at 0deg and 90deg orientation (Hill 0deg and Hill 90deg respectively) the distribution of normal stress on the width of the sample is more uniform
The distribution of stresses for both analysed orientations is similar but the sample orientation influences the value of stresses The values of shear stress for Hillrsquos yield functions are considerably lower than other models and are more uniform especially in the middle part of the analysed width of the sample The dominant factors in determining both restraint force and blank thinning of dual-phase steel are bead penetration flow stress and strain hardening [24] In contrast the effects of anisotropy and strip drawing direction with respect to the rolling direction are found to be relatively less influential
Fig 11 The distribution of effective strain for different material models and sample orientations 0deg and 90deg
The distributions of normal stress in longitudinal section after drawing a distance of 20 mm are shown in Fig 13 The sequence of bending unbending and reverse bending of the sheet material is clearly
Strojniški vestnik - Journal of Mechanical Engineering 60(2014)1 51-60
58 Trzepieciński T ndash Lemu HG
manifested by the cyclic normal stress observed on the longitudinal section of the drawbead region
Fig 12 Stress distribution along 0-Arsquo section a) normal stress and b) shear stress
The highest values of normal stress exist in the region of the middle roll - sheet contact (CndashD) located on the side in accordance with the direction of sample pulling The second peak of stress exists in the region of back roll between CrsquondashBrsquo points The change of stress value from positive to negative is related with bending and unbending of the sheet On the sample length within the drawbead places exist where the normal stress equals zero
Fig 13 Normal stress distribution along B-Brsquo section
In addition to the comparative average values of friction test forces the average value of the friction coefficient at the same stage and the error of numerically determined friction coefficient in relation to the experimental values are tabulated in Table 4
Table 4 Comparative experimental and numerical average values of friction test forces at the second stage of the friction simulator test
SourceForce [N] Friction
coeffError []
Dfix Droll Cfix
Experiment 1803 801 1624 0196 -Isotropic model 1712 775 1582 0188 ndash408Barlatrsquos model 1817 822 1642 0192 ndash204Hillrsquos model 1697 758 1574 0189 ndash357
The results of the variation of numerically determined test force Dfix both at first and second stages (Fig 14) show that all the numerical models over-predicted the value of the friction coefficient The prediction errors of the friction coefficient for numerical models based on isotropic Barlatrsquos and Hillrsquos material models are calculated to be 408 204 and 357 respectively
Furthermore the value of average forces for the numerical model for Barlatrsquos material model is the closest to the experimental one For the rest of the FEM models (ie isotropic and Hillrsquos material models) the average values of all test forces are proportionally smaller As a result of this proportional decreasing tendency of the values of Dfix Droll and Cfix the value of friction coefficient does not diverge considerably from the experimental value (Fig 15)
Fig 14 The variation of numerical and experimental test force Dfix
Fig 15 The variation of friction coefficient value during frictional testing of the sample cut according to the rolling direction
Strojniški vestnik - Journal of Mechanical Engineering 60(2014)1 51-60
59Frictional Conditions of AA5251 Aluminium Alloy Sheets Using Drawbead Simulator Tests and Numerical Methods
5 CONCLUSIONS
The material presented in this article is based on studies conducted using two main research approaches experimental testing and numerical simulation Numerical simulations are based on the aforementioned friction test using material model that is described by isotropic and anisotropic yield criteria
The main results of the research can be summarized as follows1 Application of machine oil reduces the value of
friction coefficient but its intensity depends on the surface roughness of rolls
2 For all applied friction conditions the values of the friction coefficient for samples cut across the rolling direction of the sheet were higher than for samples cut in the rolling direction
3 It has been found that the proposed L-index value has a non-linear relation with the value of the roughness parameter For the sample orientation at 0deg the L-index value initially decreases and then continues to increase while a continuous increase of the value is observed for the sample orientation at 90deg
4 The value of friction coefficient for both dry friction and lubrication conditions decreases as the surface roughness (Ra parameter) of the rolls increases
5 Sample orientation has a clear effect on the values of the friction coefficient and effectiveness of lubrication When the sample is oriented at 0deg higher value of friction coefficient is obtained in dry conditions implying that the effectiveness of lubrication is higher For a sample orientation at 90deg the relation is the reverse
6 The yield criterion has a strong influence on the distribution of normal and shear stresses but the results for the sample orientation at both 0deg and 90deg are quite similar
7 The value of the normal stress on the width of the sheet varies This requires sensitivity analysis of the effect of sample width on the sheet deformation in drawbead simulator friction test In order to obtain representative results of numerical simulations of the Nine friction test conducting a simulation of a 3D model of the drawbead is necessary
8 In general the results demonstrate that there is an agreeable harmony between the experimental and numerical models (FEM) The study on the friction coefficient shows prediction errors of less than 5 and among the selected yield criteria
Barlatrsquos material model has the best prediction with an error of about 2
6 ACKNOWLEDGEMENT
This research was realized with financial support provided by Iceland Liechtenstein and Norway and was co-financed by European Economic Area and Norwegian Financial Mechanism under the Scholarship and Training Fund The authors would like to appreciate this financial support
7 REFERENCES
[1] Yang TS (2010) Investigation of the strain distribution with lubrication during the deep drawing process Tribology International vol 43 no 5 p 1104-1112 DOI101016jtriboint200912050
[2] Yang TS (2007) A refined friction modeling for lubricated metal forming process Tribology Letters vol 27 no 3 p 289-300 DOI101007s11249-007-9233-x
[3] Trzepieciński T Gelgele HL (2011) Investigation of anisotropy problems in sheet metal forming using finite element method International Journal of Material Forming vol 4 p 357-359 DOI101007s12289-010-0994-7
[4] Liewald M Wagner S Becker D (2010) Influence of surface topography on the tribological behaviour of aluminium alloy 5182 with EDT surface Tribology Letters vol 39 no 2 p 135-142 DOI101007s11249-010-9625-1
[5] Wilson WRD (1991) Friction models for metal forming in the boundary lubrication regime Journal of Engineering Materials and Technology vol 113 no 1 p 60-68 DOI10111512903383
[6] Lo S Yang T (2003) A new mechanism of asperity flattening in sliding contact ndash the role of tool elastic micro wedge Journal of Tribology vol 125 no 4 p 713-719 DOI10111511574518
[7] Yang T-S Lo SW (2006) Contact simulation for predicting surface topography in metal forming Tribology Letters vol 23 no 2 p 121-129 DOI101007s11249-006-9112-x
[8] Firat M Livatyali H Cicek O Fatih OM (2009) Improving the accuracy of contact-type drawbead elements in panel stamping analysis Materials and Design vol 30 no 10 p 4003-4011 DOI101016jmatdes200905022
[9] Courvoisier L Martiny M Ferron G (2003) Analytical modelling of the drawbeads in the sheet metal forming International Journal of Machine Tools amp Manufacture vol 133 no 3 p 359-370 DOI101016S0924-0136(02)01124-X
[10] Trzepieciński T (2010) 3D elasto-plastic FEM analysis of the sheet drawing of anisotropic steel sheet metals Archives of Civil and Mechanical Engineering
Strojniški vestnik - Journal of Mechanical Engineering 60(2014)1 51-60
60 Trzepieciński T ndash Lemu HG
vol 10 no 4 p 95-106 DOI101016s1644-9665(12)60035-1
[11] Nine HD (1978) Draw bead forces in sheet metal forming Proceedings of Symposium on Mechanics of Sheet Metal Forming Behavior and Deformation Analysis Plenum Press Warren p 179-211
[12] Manjula NKB Nanayakkara P Hodgson PD (2006) Determination of drawbead contacts with variable bead penetration Computer Methods in Materials Science vol 6 no 3 p 188-194 DOI10536DRODU30004084
[13] Green DE (2001) An experimental technique to determine the behaviour of sheet metal in a drawbead SAE Technical Paper Series 2001-01-1136 DOI1042712001-01-1136
[14] Nanayakkara NKBMP Kelly GL Hodgson PD (2004) Determination of the coefficient of friction in partially penetrated draw beads Steel Grips vol 2 no Supplement p 677-680 DOI10536DRODU30002855
[15] von Mises R (1913) Mechanik der festen Koumlrper im Plastisch deformablen Zustand Nachrichten von der Koumlngl Gesellschaft der Wissenschaften zu Goumlttingen Mathematisch-Physikalische Klasse Goumlttingen p 582-592
[16] Hill R (1948) A theory of the yielding and plastic flow of anisotropic metals Proceedings of the Royal Society of London Series A Mathematical and Physical Sciences vol 193 no 1033 p 281-297 DOI101098rspa19480045
[17] Cazacu O Barlat F (2003) Application of the theory of representation to describe yielding of anisotropic aluminium alloys International Journal of Engineering
Science vol 41 no 12 p 1367-1385 DOI101016S0020-7225(03)00037-5
[18] Barlat F Lege DJ Brem JC (1991) A six-component yield function for anisotropic metals International Journal of Plasticity vol 7 no 7 p 693-712 DOI1010160749-6419(91)90052-Z
[19] Lemu HG Trzepieciński T (2013) Numerical and experimental study of friction behaviour in bending under tension test Strojniski vestnik ndash Journal of Mechanical Engineering vol 59 no 1 p 41-49 DOI105545sv-jme2012383
[20] Shih H Wilson W Saha P (1996) Modelling the influence of plastic strain on boundary friction in sheet metal forming Proceedings of the NAMRC XXIV p 173-178
[21] Sedlaček M Vilhena LMS Podgornik B Vižintin J (2011) Surface topography modelling for reduced friction Strojniski vestnik ndash Journal of Mechanical Engineering vol 57 no 9 p 674-680 DOI105545sv-jme2010140
[22] Skarpelos P Morris JW (1997) The effect of surface morphology on friction during forming of electrogalvanized sheet steel Wear vol 212 no 2 p 165-172 DOI101016s0043-1648(97)00174-9
[23] Li XY Tandon KN (2000) Microstructural characterization of mechanically mixed layer and wear debris in sliding wear of an Al alloy and an Al based composite Wear vol 245 no 1-2 p 148-161 DOI101016S0043-1648(00)00475-0
[24] Livatyali H Firat M Gurler B Ozsoy M (2010) An experimental analysis of drawing characteristics of a dual-phase steel through a round drawbead Materials and Design vol 31 no 3 p 1639-1643 DOI101016jmatdes200908030

Strojniški vestnik - Journal of Mechanical Engineering 60(2014)1 51-60
54 Trzepieciński T ndash Lemu HG
software Both dry friction and oil-lubricated contacts were considered The rolls were defined as rigid surfaces While conducting the modelling the aluminium sheet metal (AA5251 H14) was initially placed in a horizontal position and held by a frictionless device (Fig 4a) At the initial stage the middle roll was moved down to bend the sheet metal while the leading end of the sheet metal was fixed The middle roll was allowed to travel through the distance at which the centres of curvature for both front and back rolls and the middle roll were at the same height (Fig 4b) A displacement of 40 mm was then applied to one end of the sample when the required wrap angle was obtained The numerical analyses were performed for the AA 5251 H14 sheet tested in the following conditions sample orientation 90deg Ra of rolls 063 μm lubrication conditions
The finite element model of the blank consists of 3600 quad4 shell elements with five integration points through the shell thickness which are necessary for an acceptable solution [10] The assumed strain formulation was applied to improve the bending characteristics of the elements This can substantially improve the accuracy of the solution in terms of the computational costs of assembling the stiffness matrix An elasto-plastic material model approach was implemented and three material models have been simulated In the first material model the plastic behaviour of the metal was described by the von Mises yield criterion [15] In the second model the anisotropy of the material was established using the Hill yield criterion [16] The Hill formulation is the most frequently used yield function in many research papers on steel sheet metal forming and can be regarded as an extension of the isotropic von Mises function As reported by Cazacu and Barlat [17] the Hill formulation can also be applied for the material description of aluminium alloys
Fig 4 Geometry and boundary conditions of FEM model of drawbead simulator test a) initial configuration and b) start of
drawing stage
The material behaviour for this second formulation is specified using the following properties Youngrsquos modulus E = 70000 MPa Poissonrsquos ratio ν = 033 and mass density r = 2690 kgmiddotm-3 The isotropic hardening behaviour uses the Hollomon power-type law by which the parameters C and n (given in Table 1) are fitted on a stress-strain curve of the tensile test
In the third model the Barlat yield function has been applied [18] In the case of anisotropy material models both 0deg and 90deg sample orientations have been examined The balanced biaxial yield stress σb necessary to define Barlat material model was measured in a bulge test and a value of 278 MPa was obtained Simulations of friction tests were performed for rolls with surface roughness values of Ra = 125 microm in dry friction conditions To describe contact conditions the Coulomb friction law was applied (as described in an earlier publication by the same authors [19])
3 DISCUSSION OF EXPERIMENTAL RESULTS
31 Friction Coefficient Value
In the friction tests two sets of values for clamping and pulling forces determined for fixed and freely rotating rolls under dry friction and lubricated conditions were received The average value of friction coefficient was determined from Eq (1) after rejecting initial transient scope of load forces (Fig 5)
Fig 5 Load characteristics of friction tests for AA5251 H14 under following conditions Ra of rolls 125 mm dry friction sample
orientation at 0deg
The average values of the coefficient of friction determined in dry friction μdry and in lubricated conditions μoil are given in Table 3 Upon analysis of the friction test results the expected relationships are observed That means values of the friction coefficient in dry friction conditions are higher than those in lubrication conditions The application of machine oil reduces the value of friction coefficient but its
Strojniški vestnik - Journal of Mechanical Engineering 60(2014)1 51-60
55Frictional Conditions of AA5251 Aluminium Alloy Sheets Using Drawbead Simulator Tests and Numerical Methods
intensity depends on the surface roughness of the rolls This impact is not strongly evident and will be discussed in detail later in the article
Table 3 Friction coefficient values of tested sheets
MaterialRa (rolls)
[microm]Sample
orientation [deg]Coefficient of friction
microdry microoil
AA5251 O
0320 0259 0205
90 0262 0219
0630 0245 0194
90 0251 0201
1250 0219 0161
90 0238 0181
AA5251 H14
0320 0245 0190
90 0257 0221
0630 0222 0173
90 0243 0196
1250 0193 0140
90 0205 0159
AA5251 H16
0320 0242 0183
90 0252 0212
0630 0215 0166
90 0225 0169
1250 0188 0135
90 019 0144
AA5251 H22
0320 0238 0175
90 0253 0202
0630 0197 0149
90 0207 0157
1250 0185 0134
90 0188 0142
Fig 6 Friction coefficient value vs surface roughness [Ra] of rolls for a) AA5251 O b) AA5251 H24
As the value of the Ra parameter of the rolls increases the friction coefficient decreases for both dry friction and lubricated conditions (Fig 6) The above-mentioned relations are valid for both sample
orientations and for all tested materials For all considered friction conditions the friction coefficient values for samples cut across the rolling direction of the sheet are higher than for samples cut parallel to the rolling direction The tested sheets exhibit directional surface topography caused by the manufacturing process of the sheets (rolling) The values of the 2D amplitude roughness parameters measured parallel to the rolling direction are lower than those measured in the transverse direction to the rolling direction Furthermore rolling causes directional orientation of the material grains parallel to the rolling direction which is the source of anisotropy In that case the evolution of the surface topography during the sheet passing the draw bead is different for both sample orientations
32 Sheet Roughness
The plot of the friction coefficient versus Sa parameter for the sheet AA5251 H22 is given in Fig 7 It is observed in this plot that a local minimum of friction coefficient value at Sa = 0322 μm exists
Fig 7 The friction coefficient value vs the roughness average Sa of the sheet for orientation at 0deg
The above-mentioned relation is observed for all applied friction conditions sample orientations and surface roughness of rolls supports the conclusion that favourable conditions of friction reduction exist for this sheet
Shih et al [20] reported that roughening of asperities observed during stretching of the deformed material tends to decrease the real area of contact resulting in a lower coefficient of friction The continued increment of the value of friction coefficient for the sheet in this study (AA5251 H14) at Sa = 034 μm may be explained by the fact that (in spite of increasing surface roughness) the lubrication is unable to overcome the dominated metallic contact between the roughness asperities of contact bodies as the larger space contains the lubricant
Strojniški vestnik - Journal of Mechanical Engineering 60(2014)1 51-60
56 Trzepieciński T ndash Lemu HG
Studies show that surface textures act either as micro-traps for capturing wear debris or as micro-reservoirs that enhance lubrication [21] In the case of steel sheets [10] and [22] it is observed that higher Ra parameter value tends to produce lower friction or this tendency is observed up to a certain Ra value and the value of friction coefficient increases The roughness acts to separate the surfaces isolating the areas of direct metallic contact The larger the amplitude of the roughness the less the area of contact grows for a given amount of sliding deformation By limiting the area of direct contact during sliding the adhesion and deformation components of friction are reduced and the valleys act to trap wear debris reducing the amount of body wearing [22] However Al and Al alloys are relatively soft and a mechanically mixed layer of ultrafine particles is formed due to deformation [23] Thus high Ra values can hardly produce wear debris that act as abrasive particles
For all rollers used in the test the relation between the Sa parameter and the friction coefficient value is similar The friction coefficient value has the tendency to decrease with increases of the value of Sa parameters that represent different materials Taking all of the obtained results into account the relation between the value of Sa parameter and friction coefficient (Fig 7) is found to be opposite to that reported in previous researches [10]
33 Effect of Lubrication
In order to reduce friction and minimize sheet failure lubricants are typically applied to portions of the workpiece that undergo severe contact with dies When lubricant is applied the frictional resistance of the sheet material decreases and its strain uniformity increases This means that the application of any lubricant should result in a reduction of the value of the friction coefficient
Comparison of the values of the friction coefficient determined in dry friction and lubricated conditions demonstrate nearly linear relations (Fig 9) This is particularly evident in the case of the sample orientation at 0deg (Fig 9a)
The inclination angle of the trend line for sample orientation 0deg and 90deg are 4232deg and 4599deg respectively When the sample has a 0deg orientation a higher value of the friction coefficient in dry conditions is obtained implying the higher effectiveness of lubrication The relation for the sample orientation at 90deg (Fig 9b) is the reverse
Fig 8 Dependence of parameters Sa Ssk and Sku of tested sheets
Fig 9 Relation between the friction coefficients determined in dry friction conditions mdry and in lubrication conditions moil for
orientation at (a) 0deg and (b) 90deg
34 Lubricant Effectiveness
It is evident that rough surfaces enable lubricant adhesion to the sheet material This effect appears to be due to the manner in which the lubricant is captured by rough areas on the surface of the sheet To examine the effectiveness of the sheet lubrication the L-index was introduced defined as follows
L dry oil
dry
=minusmicro micromicro
(3)
Strojniški vestnik - Journal of Mechanical Engineering 60(2014)1 51-60
57Frictional Conditions of AA5251 Aluminium Alloy Sheets Using Drawbead Simulator Tests and Numerical Methods
As shown in Fig 10 the L-index value has a non-linear relation with the value of roughness parameter Ra of rolls In the case of a sample orientation at 0deg the value of the L-index initially decreases and then shows an increasing tendency For sample orientation at 90deg however a continuous increasing trend of the L-index value is observed The range of L-index value for the samples oriented at 0deg is higher (019 to 0275) than for the samples oriented at 90deg (0132 to 0245) therefore in the case of the samples cut parallel to the rolling direction lubricant highly reduced the friction coefficient value There is no evident relation between the temper conditions of the sheet and L-index value but for both orientations the sheet H22 exhibits the highest friction reduction In all cases the value of L-index is the highest for Ra = 125 μm As stated previously in the case of higher surface roughness of contact bodies a high volume of lubricant may be trapped in surface pits and consequently the effectiveness of lubrication is higher
Fig 10 Effectiveness of lubrication (L-index) as a function of Ra of rolls oriented at (a) 0o and (b) 90deg
4 DISCUSSION OF NUMERICAL RESULTS
The numerical simulations include Hillrsquos and Barlatrsquos materials and they were performed for both 0deg (designated as Hill 0deg Barlat 0deg) and 90deg (designated as Hill 90deg Barlat 90deg) sample orientations with respect to the rolling direction The results show that the distributions of effective strain for different yield criteria during full penetration have been varying considerably (Fig 11)
Maximal values of effective strains for Hill 0deg are higher than the values for sample cut transverse to the
rolling direction by about 0002 A similar relationship exists for Barlatrsquos material model Furthermore the points of occurrence of maximal effective strains depend on the considered material model
The distributions of normal stress and shear stress in the transverse section after drawing a distance of 20 mm are shown in Fig 12 The results in these plots show that the maximal values of the normal stress and shear stress for all material yield functions are at the edge of the sample The values of Barlatrsquos material model regarding both orientations are the closest to the isotropic model The local minimum at the middle ie section 0-Arsquo is related with deformation of the sheets during bending over the rounded bead It causes local contact of the sheet with the roll surface and thus the values of friction forces along the sample width are not constant In the case of the Hill yield model at 0deg and 90deg orientation (Hill 0deg and Hill 90deg respectively) the distribution of normal stress on the width of the sample is more uniform
The distribution of stresses for both analysed orientations is similar but the sample orientation influences the value of stresses The values of shear stress for Hillrsquos yield functions are considerably lower than other models and are more uniform especially in the middle part of the analysed width of the sample The dominant factors in determining both restraint force and blank thinning of dual-phase steel are bead penetration flow stress and strain hardening [24] In contrast the effects of anisotropy and strip drawing direction with respect to the rolling direction are found to be relatively less influential
Fig 11 The distribution of effective strain for different material models and sample orientations 0deg and 90deg
The distributions of normal stress in longitudinal section after drawing a distance of 20 mm are shown in Fig 13 The sequence of bending unbending and reverse bending of the sheet material is clearly
Strojniški vestnik - Journal of Mechanical Engineering 60(2014)1 51-60
58 Trzepieciński T ndash Lemu HG
manifested by the cyclic normal stress observed on the longitudinal section of the drawbead region
Fig 12 Stress distribution along 0-Arsquo section a) normal stress and b) shear stress
The highest values of normal stress exist in the region of the middle roll - sheet contact (CndashD) located on the side in accordance with the direction of sample pulling The second peak of stress exists in the region of back roll between CrsquondashBrsquo points The change of stress value from positive to negative is related with bending and unbending of the sheet On the sample length within the drawbead places exist where the normal stress equals zero
Fig 13 Normal stress distribution along B-Brsquo section
In addition to the comparative average values of friction test forces the average value of the friction coefficient at the same stage and the error of numerically determined friction coefficient in relation to the experimental values are tabulated in Table 4
Table 4 Comparative experimental and numerical average values of friction test forces at the second stage of the friction simulator test
SourceForce [N] Friction
coeffError []
Dfix Droll Cfix
Experiment 1803 801 1624 0196 -Isotropic model 1712 775 1582 0188 ndash408Barlatrsquos model 1817 822 1642 0192 ndash204Hillrsquos model 1697 758 1574 0189 ndash357
The results of the variation of numerically determined test force Dfix both at first and second stages (Fig 14) show that all the numerical models over-predicted the value of the friction coefficient The prediction errors of the friction coefficient for numerical models based on isotropic Barlatrsquos and Hillrsquos material models are calculated to be 408 204 and 357 respectively
Furthermore the value of average forces for the numerical model for Barlatrsquos material model is the closest to the experimental one For the rest of the FEM models (ie isotropic and Hillrsquos material models) the average values of all test forces are proportionally smaller As a result of this proportional decreasing tendency of the values of Dfix Droll and Cfix the value of friction coefficient does not diverge considerably from the experimental value (Fig 15)
Fig 14 The variation of numerical and experimental test force Dfix
Fig 15 The variation of friction coefficient value during frictional testing of the sample cut according to the rolling direction
Strojniški vestnik - Journal of Mechanical Engineering 60(2014)1 51-60
59Frictional Conditions of AA5251 Aluminium Alloy Sheets Using Drawbead Simulator Tests and Numerical Methods
5 CONCLUSIONS
The material presented in this article is based on studies conducted using two main research approaches experimental testing and numerical simulation Numerical simulations are based on the aforementioned friction test using material model that is described by isotropic and anisotropic yield criteria
The main results of the research can be summarized as follows1 Application of machine oil reduces the value of
friction coefficient but its intensity depends on the surface roughness of rolls
2 For all applied friction conditions the values of the friction coefficient for samples cut across the rolling direction of the sheet were higher than for samples cut in the rolling direction
3 It has been found that the proposed L-index value has a non-linear relation with the value of the roughness parameter For the sample orientation at 0deg the L-index value initially decreases and then continues to increase while a continuous increase of the value is observed for the sample orientation at 90deg
4 The value of friction coefficient for both dry friction and lubrication conditions decreases as the surface roughness (Ra parameter) of the rolls increases
5 Sample orientation has a clear effect on the values of the friction coefficient and effectiveness of lubrication When the sample is oriented at 0deg higher value of friction coefficient is obtained in dry conditions implying that the effectiveness of lubrication is higher For a sample orientation at 90deg the relation is the reverse
6 The yield criterion has a strong influence on the distribution of normal and shear stresses but the results for the sample orientation at both 0deg and 90deg are quite similar
7 The value of the normal stress on the width of the sheet varies This requires sensitivity analysis of the effect of sample width on the sheet deformation in drawbead simulator friction test In order to obtain representative results of numerical simulations of the Nine friction test conducting a simulation of a 3D model of the drawbead is necessary
8 In general the results demonstrate that there is an agreeable harmony between the experimental and numerical models (FEM) The study on the friction coefficient shows prediction errors of less than 5 and among the selected yield criteria
Barlatrsquos material model has the best prediction with an error of about 2
6 ACKNOWLEDGEMENT
This research was realized with financial support provided by Iceland Liechtenstein and Norway and was co-financed by European Economic Area and Norwegian Financial Mechanism under the Scholarship and Training Fund The authors would like to appreciate this financial support
7 REFERENCES
[1] Yang TS (2010) Investigation of the strain distribution with lubrication during the deep drawing process Tribology International vol 43 no 5 p 1104-1112 DOI101016jtriboint200912050
[2] Yang TS (2007) A refined friction modeling for lubricated metal forming process Tribology Letters vol 27 no 3 p 289-300 DOI101007s11249-007-9233-x
[3] Trzepieciński T Gelgele HL (2011) Investigation of anisotropy problems in sheet metal forming using finite element method International Journal of Material Forming vol 4 p 357-359 DOI101007s12289-010-0994-7
[4] Liewald M Wagner S Becker D (2010) Influence of surface topography on the tribological behaviour of aluminium alloy 5182 with EDT surface Tribology Letters vol 39 no 2 p 135-142 DOI101007s11249-010-9625-1
[5] Wilson WRD (1991) Friction models for metal forming in the boundary lubrication regime Journal of Engineering Materials and Technology vol 113 no 1 p 60-68 DOI10111512903383
[6] Lo S Yang T (2003) A new mechanism of asperity flattening in sliding contact ndash the role of tool elastic micro wedge Journal of Tribology vol 125 no 4 p 713-719 DOI10111511574518
[7] Yang T-S Lo SW (2006) Contact simulation for predicting surface topography in metal forming Tribology Letters vol 23 no 2 p 121-129 DOI101007s11249-006-9112-x
[8] Firat M Livatyali H Cicek O Fatih OM (2009) Improving the accuracy of contact-type drawbead elements in panel stamping analysis Materials and Design vol 30 no 10 p 4003-4011 DOI101016jmatdes200905022
[9] Courvoisier L Martiny M Ferron G (2003) Analytical modelling of the drawbeads in the sheet metal forming International Journal of Machine Tools amp Manufacture vol 133 no 3 p 359-370 DOI101016S0924-0136(02)01124-X
[10] Trzepieciński T (2010) 3D elasto-plastic FEM analysis of the sheet drawing of anisotropic steel sheet metals Archives of Civil and Mechanical Engineering
Strojniški vestnik - Journal of Mechanical Engineering 60(2014)1 51-60
60 Trzepieciński T ndash Lemu HG
vol 10 no 4 p 95-106 DOI101016s1644-9665(12)60035-1
[11] Nine HD (1978) Draw bead forces in sheet metal forming Proceedings of Symposium on Mechanics of Sheet Metal Forming Behavior and Deformation Analysis Plenum Press Warren p 179-211
[12] Manjula NKB Nanayakkara P Hodgson PD (2006) Determination of drawbead contacts with variable bead penetration Computer Methods in Materials Science vol 6 no 3 p 188-194 DOI10536DRODU30004084
[13] Green DE (2001) An experimental technique to determine the behaviour of sheet metal in a drawbead SAE Technical Paper Series 2001-01-1136 DOI1042712001-01-1136
[14] Nanayakkara NKBMP Kelly GL Hodgson PD (2004) Determination of the coefficient of friction in partially penetrated draw beads Steel Grips vol 2 no Supplement p 677-680 DOI10536DRODU30002855
[15] von Mises R (1913) Mechanik der festen Koumlrper im Plastisch deformablen Zustand Nachrichten von der Koumlngl Gesellschaft der Wissenschaften zu Goumlttingen Mathematisch-Physikalische Klasse Goumlttingen p 582-592
[16] Hill R (1948) A theory of the yielding and plastic flow of anisotropic metals Proceedings of the Royal Society of London Series A Mathematical and Physical Sciences vol 193 no 1033 p 281-297 DOI101098rspa19480045
[17] Cazacu O Barlat F (2003) Application of the theory of representation to describe yielding of anisotropic aluminium alloys International Journal of Engineering
Science vol 41 no 12 p 1367-1385 DOI101016S0020-7225(03)00037-5
[18] Barlat F Lege DJ Brem JC (1991) A six-component yield function for anisotropic metals International Journal of Plasticity vol 7 no 7 p 693-712 DOI1010160749-6419(91)90052-Z
[19] Lemu HG Trzepieciński T (2013) Numerical and experimental study of friction behaviour in bending under tension test Strojniski vestnik ndash Journal of Mechanical Engineering vol 59 no 1 p 41-49 DOI105545sv-jme2012383
[20] Shih H Wilson W Saha P (1996) Modelling the influence of plastic strain on boundary friction in sheet metal forming Proceedings of the NAMRC XXIV p 173-178
[21] Sedlaček M Vilhena LMS Podgornik B Vižintin J (2011) Surface topography modelling for reduced friction Strojniski vestnik ndash Journal of Mechanical Engineering vol 57 no 9 p 674-680 DOI105545sv-jme2010140
[22] Skarpelos P Morris JW (1997) The effect of surface morphology on friction during forming of electrogalvanized sheet steel Wear vol 212 no 2 p 165-172 DOI101016s0043-1648(97)00174-9
[23] Li XY Tandon KN (2000) Microstructural characterization of mechanically mixed layer and wear debris in sliding wear of an Al alloy and an Al based composite Wear vol 245 no 1-2 p 148-161 DOI101016S0043-1648(00)00475-0
[24] Livatyali H Firat M Gurler B Ozsoy M (2010) An experimental analysis of drawing characteristics of a dual-phase steel through a round drawbead Materials and Design vol 31 no 3 p 1639-1643 DOI101016jmatdes200908030
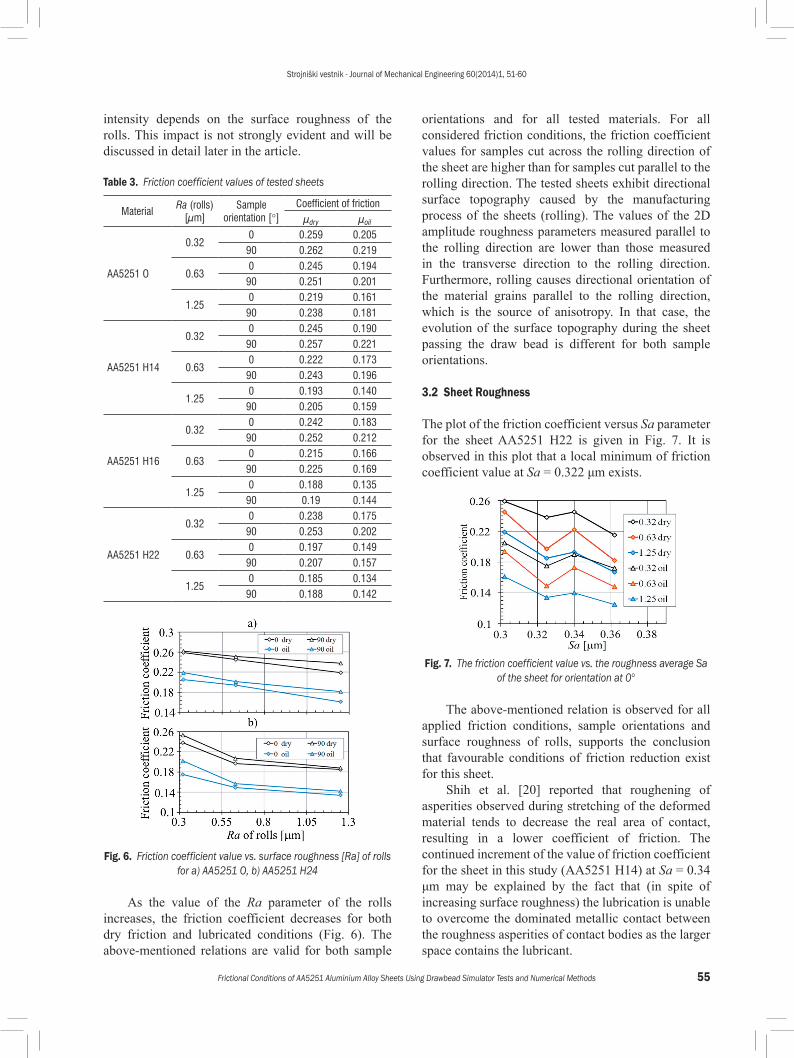
Strojniški vestnik - Journal of Mechanical Engineering 60(2014)1 51-60
60 Trzepieciński T ndash Lemu HG
vol 10 no 4 p 95-106 DOI101016s1644-9665(12)60035-1
[11] Nine HD (1978) Draw bead forces in sheet metal forming Proceedings of Symposium on Mechanics of Sheet Metal Forming Behavior and Deformation Analysis Plenum Press Warren p 179-211
[12] Manjula NKB Nanayakkara P Hodgson PD (2006) Determination of drawbead contacts with variable bead penetration Computer Methods in Materials Science vol 6 no 3 p 188-194 DOI10536DRODU30004084
[13] Green DE (2001) An experimental technique to determine the behaviour of sheet metal in a drawbead SAE Technical Paper Series 2001-01-1136 DOI1042712001-01-1136
[14] Nanayakkara NKBMP Kelly GL Hodgson PD (2004) Determination of the coefficient of friction in partially penetrated draw beads Steel Grips vol 2 no Supplement p 677-680 DOI10536DRODU30002855
[15] von Mises R (1913) Mechanik der festen Koumlrper im Plastisch deformablen Zustand Nachrichten von der Koumlngl Gesellschaft der Wissenschaften zu Goumlttingen Mathematisch-Physikalische Klasse Goumlttingen p 582-592
[16] Hill R (1948) A theory of the yielding and plastic flow of anisotropic metals Proceedings of the Royal Society of London Series A Mathematical and Physical Sciences vol 193 no 1033 p 281-297 DOI101098rspa19480045
[17] Cazacu O Barlat F (2003) Application of the theory of representation to describe yielding of anisotropic aluminium alloys International Journal of Engineering
Science vol 41 no 12 p 1367-1385 DOI101016S0020-7225(03)00037-5
[18] Barlat F Lege DJ Brem JC (1991) A six-component yield function for anisotropic metals International Journal of Plasticity vol 7 no 7 p 693-712 DOI1010160749-6419(91)90052-Z
[19] Lemu HG Trzepieciński T (2013) Numerical and experimental study of friction behaviour in bending under tension test Strojniski vestnik ndash Journal of Mechanical Engineering vol 59 no 1 p 41-49 DOI105545sv-jme2012383
[20] Shih H Wilson W Saha P (1996) Modelling the influence of plastic strain on boundary friction in sheet metal forming Proceedings of the NAMRC XXIV p 173-178
[21] Sedlaček M Vilhena LMS Podgornik B Vižintin J (2011) Surface topography modelling for reduced friction Strojniski vestnik ndash Journal of Mechanical Engineering vol 57 no 9 p 674-680 DOI105545sv-jme2010140
[22] Skarpelos P Morris JW (1997) The effect of surface morphology on friction during forming of electrogalvanized sheet steel Wear vol 212 no 2 p 165-172 DOI101016s0043-1648(97)00174-9
[23] Li XY Tandon KN (2000) Microstructural characterization of mechanically mixed layer and wear debris in sliding wear of an Al alloy and an Al based composite Wear vol 245 no 1-2 p 148-161 DOI101016S0043-1648(00)00475-0
[24] Livatyali H Firat M Gurler B Ozsoy M (2010) An experimental analysis of drawing characteristics of a dual-phase steel through a round drawbead Materials and Design vol 31 no 3 p 1639-1643 DOI101016jmatdes200908030