studies of corrosion of aluminium and 6063 aluminium alloy ...02(2690-2… · studies of corrosion...
TRANSCRIPT

International Journal of ChemTech ResearchCODEN( USA): IJCRGG ISSN : 0974-4290Vol.5, No.6, pp 2690-2705, Oct-Dec 2013
Studies of Corrosion of Aluminium and 6063 Aluminium Alloyin Phosphoric Acid Medium
Deepa Prabhu, Padmalatha*,
Department of Chemistry, Manipal Institute of Technology, Manipal University,Karnataka 576104, India
*Corres.author: [email protected]
Abstract: The corrosion behaviour of aluminium and6063 aluminium alloy was investigated in phosphoricacid of different concentrations at different temperatures. The study was done by electrochemical method, usingTafel polarization and electrochemical impedance spectroscopy (EIS) techniques. The kinetic parameters andthermodynamic parameters were calculated using Arrhenius theory and transition state theory. The surfacemorphology was studied using scanning electron microscope (SEM) with Energy dispersive X-ray (EDX). Thecorrosion rate of both the materials increased with increase in the concentration of acid as well as withtemperature. The rate of corrosion of 6063 aluminium alloy was found to be higher than that of purealuminium. Suitable mechanism was proposed for the corrosion of aluminium and 6063 aluminium alloy inphosphoric acid medium. The results obtained by Tafel polarization and electrochemical impedancespectroscopy (EIS) techniques were in good agreement with each other.Keywords: Aluminium, 6063 aluminium alloy, phosphoric acid, Tafel polarization, EIS technique, SEM-EDX.
1.Introduction
Corrosion, which is an inevitable problem faced in almost all industries can be considered as one of the worsttechnical calamity of our time. Besides from its direct loss in dollars, corrosion is a serious problem because itdefinitely contributes to the depletion of our natural resources. Corrosion studies have also become importantdue to increasing awareness of the need to conserve the world’s metal resources [1]. Now-a-days more attentionhas been paid to control the metallic corrosion, due to increasing use of metals in all fields of technology.
Corrosion studies of aluminium and aluminium alloys have received considerable attention byresearchers because of their technological importance and industrial applications. Aluminium is second to ironin terms of production and consumption. Aluminium and aluminium alloys find applications, mainly inautomobiles, aviation, household appliances, containers and electronic devices [2-5].
Aluminium and aluminium alloys have emerged as alternate materials in aerospace and in somechemical processing industries. Aluminium and aluminium alloys find vast applications because of the naturaltendency of aluminium to form a passivating oxide layer.However, in the aggressive corrosive environment theprotective layer breaks down, and the material will undergo corrosion. Reported literature reveals that extensivestudies are conducted on corrosionbehaviour ofaluminium and aluminium alloys in hydrochloric acid andsulphuric acid medium [6-10].
Phosphoric acid is a major industrial chemical, which is widely used for acid cleaning andelectorpolishing of aluminium [11]. Even though dissolution rate of aluminium in phosphoric acid is lower,

Deepa Prabhu et al /Int.J.ChemTech Res.2013,5(6) 2691
compared to the dissolution of the same in hydrochloric or sulphuric acid, it does corrode aluminium and itsalloys. Phosphoric acid is also used in pickling delicate, costly components and precision items where rerustingafter pickling has to be avoided.
According to the available literature, not much study has been done regarding the corrosion behaviourofaluminiumand 6063 aluminium alloy in phosphoric acid medium. As part of our studies with corrosionbehaviour of aluminium and aluminium alloys in different media and corrosion control of the same using greeninhibitors [12]. We report herein the results of corrosion behaviour of aluminium and 6063 aluminium alloy inphosphoric acid medium of different concentrations at different temperatures.
2. Experimental
2.1 Material
The experiments were performed with specimens of aluminium and 6063 aluminium alloy. The composition ofaluminium and 6063 aluminium alloy specimen is given in the Table 1.
Table 1.Composition of the pure aluminium (99.6%) and 6063 aluminium alloy specimen (% by weight)
Composition (%)Element Pure aluminium 6063 aluminium alloySi 0.120 0.412Fe 0.270 0.118Cu - 0.0570Mg - 0.492Al Balance Balance
2.2 Preparation of Test coupons
Cylindrical test coupes were sealed with Acrylic resin material in such a way that the areaexposed to themedium was 0.7cm2of aluminium and 1.0 cm2 of 6063 aluminium alloy. It was polished with different gradeemery papers. Further polishing was done with disc polisher using levigated alumina to get mirror surface. Itwas then dried and stored in a desiccator to avoid moisture before used for corrosion studies.
2.3 Preparation of Medium
A stock solution of phosphoric acid was prepared using analytical grade phosphoric acid (85%)anddoubledistilled water. It was standardized by potentiometric method. Phosphoric acid solutions of requiredconcentrations were prepared by appropriate dilution. Experiments were carried out using a calibratedthermostat at temperature range of 30°C - 50°C (±0.5°C).
2.4 Electrochemical measurements
Electrochemical measurements were carried out by using an electrochemical work station, (CH600D-series,U.S. Model with CH instrument beta software). The electrochemical cell used was a conventional three-electrode compartment having glass cell with a platinum counter electrode and a saturated calomel electrode(SCE) as reference. The working electrode was made up of aluminium and 6063aluminum. All the values ofpotential were measured with reference to the saturated calomel electrode. The polarization studies were doneimmediately after the EIS studies on the same electrode without any further surface treatment.
2.4 (a)Tafel polarization studies
Finely polished specimens with 0.7cm2 and 1 cm2 surface area were exposed to corrosion medium of differentconcentrations phosphoric acid (2.0 M, 1.0M, and 0.5M) at temperature range of 30°C to 50°C. The
Deepa Prabhu et al /Int.J.ChemTech Res.2013,5(6) 2692
potentiodynamic current-potential curves were recorded by polarizing the specimen to −250 mV cathodicallyand +250 mV anodically with respect to open circuit potential (OCP) at a scan rate of 0.01 V/s.
2.4(b)Electrochemical impedance spectroscopy (EIS) studies
Electrochemical impedance spectroscopy (EIS) measurements were carried out using a small amplitude acsignal of 10 mV over a frequency range of 100 kHz-0.01 Hz. The charge transfer resistance Rct was obtainedfrom Nyquist plot. The values of Rct is inversely proportional to the corrosion rate [13].
2.5Scanning electron microscopy (SEM) and Energy-dispersive X-ray spectroscopy (EDX) studies
The scanning electron microscope images were recorded to establish the interaction of acid mediumwith themetal surface using EVO 18-15-57 scanning electron microscope with Energy-dispersive X-ray spectroscopy.The surface morphology of aluminium and 6063 aluminium alloy immersed in phosphoric acid was comparedwith that of uncorroded sample.
3.Results And Discussion
3.1 Electrochemical measurements
3.1(a) Tafel polarization measurements
The effect of phosphoric acid concentrationson the corrosion rate of aluminium and 6063 aluminium alloysample was studied using Tafel polarization technique. Figure 1 and Figure 2 represents the potentiodynamicpolarization curves ofaluminiumand 6063 aluminium alloy in different phosphoric acid solutions at 30oCrespectively.
The potentiodynamic polarization parameters like corrosion potential (Ecorr), corrosion current density (icorr),anodic and cathodic slopes (ba and bc) are obtained from the polarization studies.The corrosion rate wascalculated using equation (1)
1 3270 x xmm y
xcorr
corr
M i
Z
(1)
Where 3270 is a constant that defines the unit of corrosion rate, icorr is the corrosion current density in A cm-2, ρis the density of the corroding material (g cm-3), M is the atomic mass of the metal, and Z is the number ofelectrons transferred per atom. [14]. The results of Tafel polarization measurements are reported in the Table 2and Table 3 respectively.
As can be seen from Figure 1 and Figure 2, the corrosion potential is shifted in the positive direction,when the concentration of the acid is increased. The positive shift in the corrosion potential Ecorr with theincrease in the concentration of acid indicate that the anodic process is much more affected than the cathodicprocess [15]. This observation is in accordance with Murralidharan[16],who proposed dependence of Ecorr andicorr on solution parameters.Tafel slopesremained almost unchanged indicating that acid strength do not changethe mechanism of the corrosion process.
It is evident from data of Table 2 and Table 3, corrosion rate is more in case of 6063 aluminium alloythan that of pure aluminium. The increased corrosion resistance of pure aluminium is mainly attributed towardsthe formation of stable oxide layer on its surface. As seen from Table 1, in case of 6063 aluminium alloy there isinfluence of both Silicon and Magnisium. The addition of these alloying elements could lead to thediscontinuities on the oxide film, thereby increasing the number of sites where corrosion can be initiated. Thismakes 6063 aluminium to undergo corrosion at a faster rate [17, 18].

Deepa Prabhu et al /Int.J.ChemTech Res.2013,5(6) 2693
-6.5 -6.0 -5.5 -5.0 -4.5 -4.0 -3.5 -3.0 -2.5 -2.0
-1.0
-0.9
-0.8
-0.7
-0.6
-0.5
E (
V/S
CE
)
log i (A cm-2)
0.5M 1.0M 2.0M
Fig.1. Tafel polarization curves for pure aluminium in different concentrations of phosphoricacid solutions at 30oC
-6.5 -6.0 -5.5 -5.0 -4.5 -4.0 -3.5 -3.0 -2.5 -2.0-1.1
-1.0
-0.9
-0.8
-0.7
-0.6
-0.5
E (
V/S
CE
)
log i (A cm-2)
0.5M 1.0M 2.0M
Fig. 2.Tafel polarization curves for 6063 aluminium alloy in different concentrations ofphosphoric acid solutions at 30oC
Table 2.Results of Tafel polarization studies of aluminium in phosphoric acid solutions
[H3PO4]M
Temp°C
Ecorr
(mVvs SCE)icorr
(×10-5A cm-2)ba(mVdec-1)
-bc(mVdec-1)
C.R(mm y-1)
30 -797 17.34 354 637 1.8935 -793 21.91 353 610 2.3840 -797 27.56 364 596 3.0045 -804 40.21 367 595 4.38
0.5
50 -800 47.75 379 579 5.2030 -783 25.87 336 674 2.8135 -790 30.12 348 680 3.2840 -794 41.11 353 658 4.4845 -796 55.37 358 620 6.03
1.0
50 -805 75.79 363 589 8.2630 -770 36.85 336 660 4.0135 -769 48.48 329 702 5.2840 -766 63.59 334 646 6.9345 -773 93.98 339 623 10.24
2.0
50 -782 110.7 364 588 12.06

Deepa Prabhu et al /Int.J.ChemTech Res.2013,5(6) 2694
Table 3.Results of Tafel polarization studies of 6063 aluminium alloy in phosphoric acid solutions
3.1 (b)Electrochemical impedance measurements
The corrosion behaviour ofaluminium and 6063 aluminium alloy specimens was also investigated by EIS invarious concentrations of phosphoric acid. The impedance spectra are recorded and displayed as Nyquists plotsas a function of acid strength. Nyquist plots for different concentrations of phosphoric acid are shown in theFigure 3 and 4 respectively.
From Figure 3 it is obvious that, the impedance diagrams show semicircles, indicating that the corrosionprocess is mainly charge transfer controlled [18, 19]. The general shape of the curve is similar for all individualsamples of the alloy, with large capacitive loop at high frequencies (HF) and an inductive loop at lowfrequencies (LF).Similar impedance plots have been reported in literature for the corrosion of aluminium andaluminium alloys in various electrolytes such as, sodium sulphate [20], sulphuric acid [21] etc. The HFcapacitive loop is attributed to the presence of a protective oxide film covering the surface of the metal.According to Brett [22, 23], the capacitive loop is corresponding to the interfacial reactions, particularly, thereaction of aluminium oxidation at the metal/oxide/electrolyte interface. The process includes the formation ofAl+ ions at the metal/oxide interface, and their migration through the oxide/solution interface where they areoxidized to Al3+. At the oxide/solution interface, OH- or O2- ions are also formed. The fact that all the threeprocesses are represented by only one loop could be attributed either to the overlapping of the loops ofprocesses, or to the assumption that one process dominates and, therefore, excludes the other processes [24].The other explanation offered to the high frequency capacitive loop is the oxide film itself. The origin of theinductive loop has often been attributed to surface or bulk relaxation of species in the oxide layer [25]. The LFinductive loop may be related to the relaxation process obtained by adsorption and incorporation of phosphateions on and into the oxide film [26].
The depressed semicircles of the Nyquist plots suggest the distribution of capacitance due to inhomogeneities associated with the electrode surface [27]. The EIS results are reported in Table 4 and Table 5.
An equivalent circuit of nine elements depicted in Figure 5a was used to simulate the measuredimpedance data, as shown in Figure 5b.In this equivalent circuit Rs is the solution resistance and Rct is thecharge transfer resistance. RL and L represent the inductive elements. This also consists of constant phaseelement; CPE (Q) in parallel to the series capacitors C1, C2and series resistors R1, R2, RL and Rct. RL is parallelwith the inductor L. The polarization resistance Rp and double layer capacitance Cdl can be calculated fromequations (2) and (3):
[H3PO4]M
Temp °C Ecorr
(mVvs SCE)
icorr
(×10-5
A cm-2)
ba(mVdec-1)
-bc(mVdec-1)
C.R(mm y-1)
30 −791 24.6 350 675 2.6835 −794 29.9 355 691 3.2540 −805 42.0 360 658 4.5745 -817 56.9 378 612 6.20
0.5
50 -826 74.9 388 569 8.1630 -762 38.6 334 672 4.2035 -778 50.5 343 658 5.5040 -788 69.2 350 643 7.5445 -805 96.0 369 597 10.46
1.0
50 -809 135.4 379 560 14.7530 -773 44.85 335 733 4.8835 -771 57.61 337 698 6.2740 -779 86.41 344 645 9.4145 -775 111.0 379 564 12.09
2.0
50 -794 192.4 349 537 20.97

Deepa Prabhu et al /Int.J.ChemTech Res.2013,5(6) 2695
Rp = RL + Rct + R1 + R2 (2)
Cdl = C1 + C2 (3)
It was observed that the value of CPE decreases while the value of Rp increases with increasingconcentration of acid mixture. The measured value of polarization resistance increases while the CPE valuedecreases with increasing concentration of the acid, indicating that the rate of corrosion increases with increasein concentration of acid solution. This is in agreement with the results obtained from potentiodynamicpolarization data.
The corrosion current density icorris calculated using the charge transfer resistance value, Rct, using with theStern–Geary equation (4)
a cc o r r
a c c t2 . 3 0 3 ( )
b bi
b b R
(4)
0 50 100 150 200
0
50
100
150
200
-ZII (
oh
m c
m2)
ZI (ohm cm2)
0.5M 1.0M 2.0M
Fig. 3.Nyquist Plot for aluminium in different concentrations of phosphoric acid solutions at 30oC
0 20 40 60 80 100 120
0
20
40
60
80
100
120
-ZII (
oh
m c
m2)
ZI (ohm cm2)
0.5M 1.0M 2.0M
Fig. 4.Nyquist Plot for 6063 aluminium alloy in different concentrations of phosphoric acid solutions at 30oC
Deepa Prabhu et al /Int.J.ChemTech Res.2013,5(6) 2696
Table 4.Results of ESI studies of aluminium in phosphoric acid solution
[H3PO4]M
Temp °C Rp
(ohm cm2 )CPE(μ F cm-2)
30 241.3 1535 195.9 2640 154.2 3245 102.4 46
0.5
50 85 5830 156.3 3835 130.2 4540 94.5 5845 70.2 66
1.0
50 50.2 7530 108.3 6635 76.9 8240 59.7 11045 38.0 125
2.0
50 31.2 146
Table 5: Results of ESI studies of 6063 aluminium alloy in phosphoric acid solution
Molarityof H3PO4
Temp °C Rp
(ohm cm2 )CPE(μ F cm-2)
30 162.2 3035 128.8 5140 91.5 6245 67.1 92
0.5
50 50.5 11630 101.70 6935 75.90 7840 54.00 9045 36.80 117
1.0
50 24.20 12930 80.7 13035 62.9 16540 40.8 22145 31.5 251
2.0
323 15.5 290

Deepa Prabhu et al /Int.J.ChemTech Res.2013,5(6) 2697
Fig. 5.Equivalent circuit fit for pure aluminium in 1M phosphoric acid solution at 30℃
Fig. 6.Equivalent circuit fit for 6063 aluminium alloy in 1M phosphoric acid solution at 30℃3.2 Effect of temperature
Temperature is an important parameter in studies on material corrosion. The dependence of temperature oncorrosion rate reveals valuable thermodynamic parameters like energy of activation, enthalpy of activation andentropy of activation for the corrosion process. The effect of temperature on the corrosion rate of the aluminiumand 6063 alloy was studied by measuring the corrosion rate at the temperature range of 30°C to 50°C. Figure 7and Figure 8 represents the potentiodynamic polarization curves ofaluminium and 6063 aluminium alloy in 1Mphosphoric acid solution at temperature range of 30°C to 50°C. Figure 9 and Figure 10 represents Nyquist plotsfor the same.

Deepa Prabhu et al /Int.J.ChemTech Res.2013,5(6) 2698
From both measurements it is obvious that the corrosion rate increased with increase in temperature.This is because the hydrogen evolution overpotential decreases with increase in the temperature [28]. Further,with increase in temperature, the naturally occurring oxide film becomes thin, porous and less protective. Thisresults in the rapid dissolution of the oxide film, thereby enhancing the corrosion rate.
The energy of activation of corrosion ofaluminium and 6063 aluminium alloy was calculated fromArrhenius equation (5). The Arrhenius plot (ln CR vs 1/T) at all the concentrations of phosphoric acid isrepresented in the Figure 11 and Figure 12.
aln( )E
CR BRT
(5)
Where B is a constant, R is the universal gas constant, and T is the absolute temperature.
Enthalpy of activation (∆Ha) and entropy of activation (∆Sa) were calculated from the transition state theoryequation (6),
Δ ΔCR= exp expa aS HRT
Nh R RT
(6)
Where h is Plank’s constant and N is Avagadro’s number. A plot of ln (CR/T) vs 1/T gave a straight line withslope = −∆Ha/T and intercept = ln(R/Nh) +∆Sa /R. The plots of ln(CR/T) vs1/T for the corrosion ofaluminiumand 6063 aluminium alloy in the presence of different concentrations phosphoric acid is shown in Figure 13and Figure 14.
The values of energies of activation, enthalpy of activation and entropy of activation are listed in Table6.As indicated in Table 6, value of energy of activation is greater than 20 kJ mol−1 both for aluminium and 6063aluminium alloy. This suggested that the whole process is controlled by surface reaction [29]. This phenomenonmay be due to the fact that the activation energy for the corrosion reaction is independent of concentrationpolarization and mainly due to activation polarization.
The entropy of activation is large and negative. This implies that the activated complex in the ratedetermining step represents association rather than dissociation, indicating that a decrease in disorder takesplace, in going from reactant to the activated complex [30]. The value of a increased with increase in acidconcentration reveals that dissolution of alloy is facilitated as the concentration of the acid medium increases.
-6.5 -6.0 -5.5 -5.0 -4.5 -4.0 -3.5 -3.0 -2.5 -2.0-1.1
-1.0
-0.9
-0.8
-0.7
-0.6
-0.5
E (V
/SC
E)
log i (A cm-2)
30oC 35oC 40oC 45oC 50oC
Fig. 7.Tafel polarization curves for pure aluminium at different temperatures in 1Mphosphoric acid solution

Deepa Prabhu et al /Int.J.ChemTech Res.2013,5(6) 2699
-6.5 -6.0 -5.5 -5.0 -4.5 -4.0 -3.5 -3.0 -2.5 -2.0-1.1
-1.0
-0.9
-0.8
-0.7
-0.6
-0.5
E (
V/S
CE
)
log i (A cm-2)
30oC 35oC 40oC 45oC 50oC
Fig. 8.Tafel polarization curves for 6063 aluminium alloy at different temperatures in 1Mphosphoric acid solution
0 20 40 60 80 100 120 140
0
20
40
60
80
100
120
140
-ZII (
ohm
cm
2 )
ZI (ohm cm2)
30oC 35oC 40oC 45oC 50oC
Figure 9: Nyquist plots for the corrosion of aluminium at different temperature in1Mphosphoric acid solution
0 20 40 60 80 100 120
0
20
40
60
80
100
120
-ZII (o
hm c
m2 )
ZI (ohm cm2)
30oC 35oC 40oC 45oC 50oC
Figure 10:Nyquist plots for the corrosion of 6063 aluminium alloy at different temperature in1M phosphoricacid solution

Deepa Prabhu et al /Int.J.ChemTech Res.2013,5(6) 2700
3.1x10⁻³ 3.1x10⁻³ 3.2x10⁻³ 3.2x10⁻³ 3.3x10⁻³ 3.3x10⁻³
0.6
0.8
1.0
1.2
1.4
1.6
1.8
2.0
2.2
2.4
2.6
1/T (K-1)
ln (C
R) (m
m y-1 )
0.5M 1.0M 2.0M
Fig. 11.Arrhenius plots for the corrosion of pure aluminium in phosphoric acid solution
3.1x10⁻³ 3.1x10⁻³ 3.2x10⁻³ 3.2x10⁻³ 3.3x10⁻³ 3.3x10⁻³
0.8
1.0
1.2
1.4
1.6
1.8
2.0
2.2
2.4
2.6
2.8
3.0
3.2
1/T (K-1)
ln (C
R) (m
m y-1
)
0.5M 1.0M 2.0M
Fig. 12.Arrhenius plots for the corrosion of 6063 aluminium alloy in phosphoric acid solution
3.1x10⁻³ 3.1x10⁻³ 3.2x10⁻³ 3.2x10⁻³ 3.3x10⁻³ 3.3x10⁻³
-5.2
-5.0
-4.8
-4.6
-4.4
-4.2
-4.0
-3.8
-3.6
-3.4
-3.2
1/T (K-1)
ln (C
R/T)
(mm
y-1 K-1 )
0.5M 1.0M 2.0M
Fig. 13.Plots of ln(CR/T) vs 1/T for the corrosion of aluminumin phosphoric acid solutions

Deepa Prabhu et al /Int.J.ChemTech Res.2013,5(6) 2701
3.1x10⁻³ 3.1x10⁻³ 3.2x10⁻³ 3.2x10⁻³ 3.3x10⁻³ 3.3x10⁻³
-0.2
0.0
0.2
0.4
0.6
0.8
1.0
1.2
1.4
1.6
1.8
2.0
1/T (K-1)
ln (C
R/T
) (m
m y
-1 K
-1)
0.5M 1.0M 2.0M
Fig. 14. Plots of ln(CR/T) vs 1/T for the corrosion of 6063 aluminium alloy in phosphoric acid solution.
Table 6:Activation parameters for the corrosion of aluminium and 6063 aluminium inphosphoric acid solutions
Ea
(kJ mol-1)∆Ha
(kJ mol-1)∆Sa
(J mol-1 K-1)H3PO4
(M)Pure Alloy Pure Alloy Pure Alloy
0.5 45.707 41.9868 43.155 39.4350 -56.645 -109.9341.0 50.244 43.852 47.692 41.3002 -37.858 -100.8212.0 56.784 45.6857 54.2321 43.1339 -15.3207 -91.353
3.3 SEM-EDX Studies
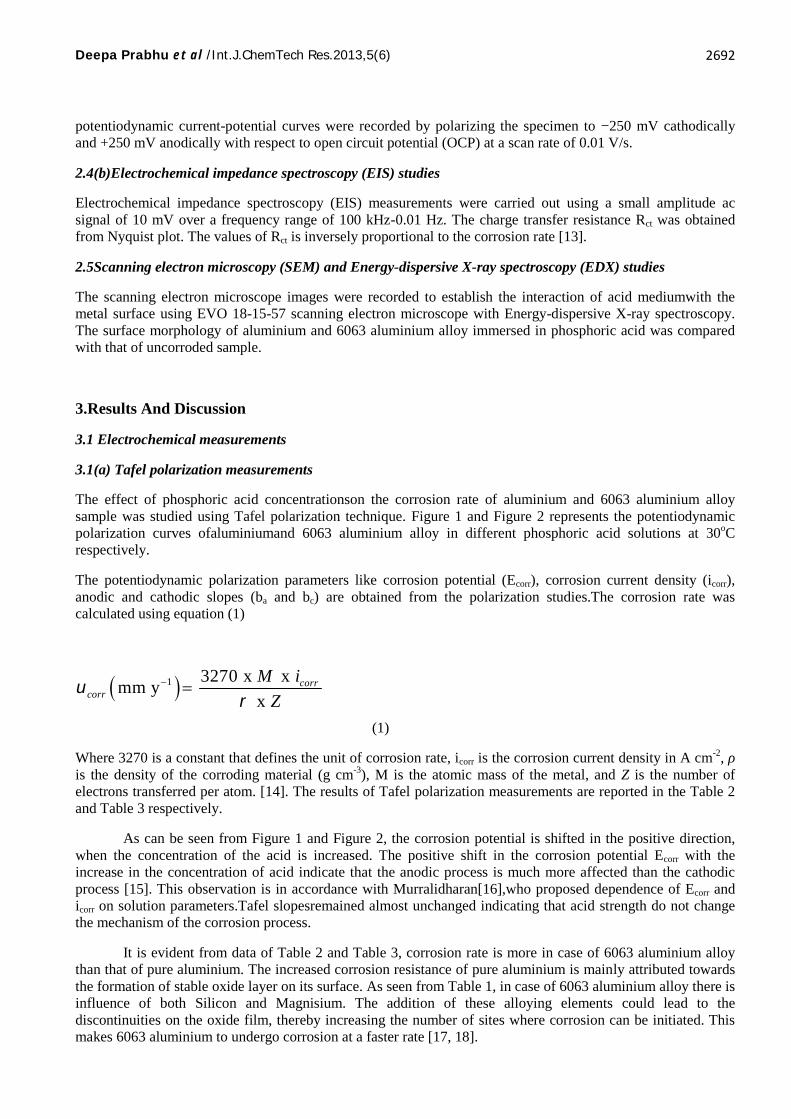
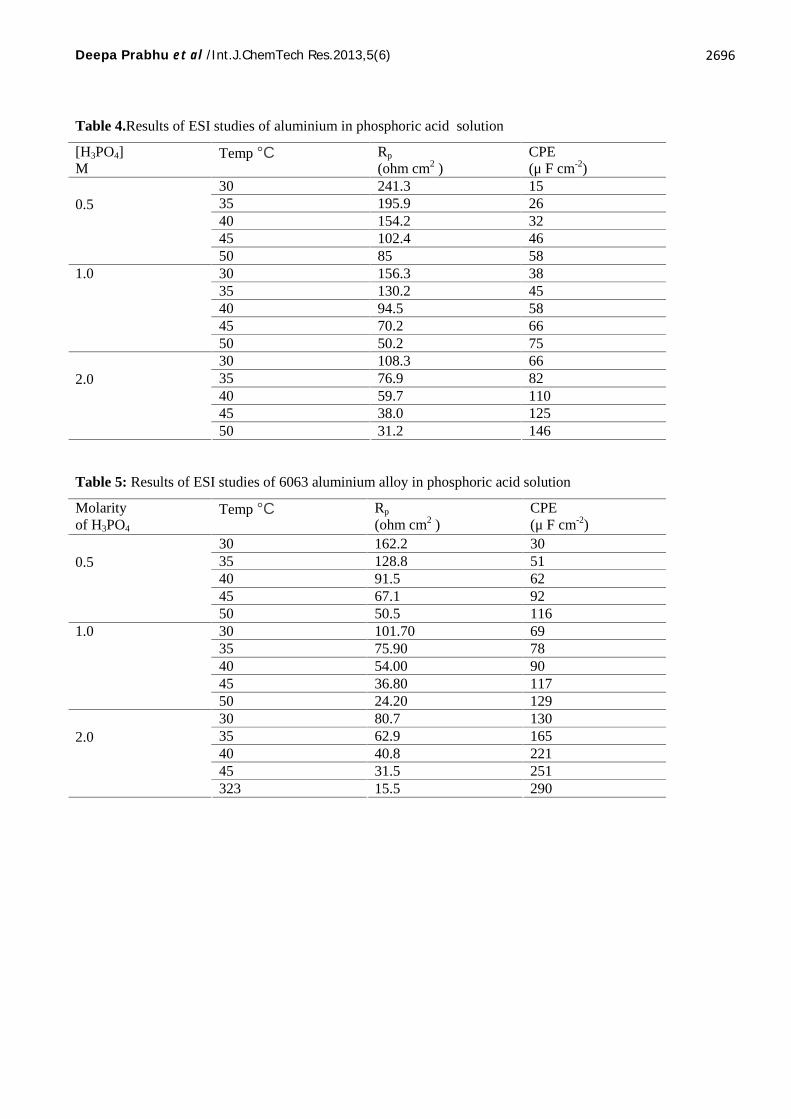
The SEM images of freshly polished surface of aluminium and 6063 aluminium alloy is given in Figure 15(a)and Figure 16(a) which show un-corroded surface with few scratches due to polishing.The surface morphologyof the aluminium and 6063 aluminium alloy sample was examined by SEM immediately after corrosion tests in1.0M phosphoric acid medium. The SEM image of corroded sample of aluminium is in Figure 15b. Figure 16bshows degradation of alloy.
For aluminium there is deposition of aluminium phosphate precipitate on the surface and for 6063aluminium alloy due to the alloying elements, it may be attributed to deposition of the phase Mg5Al8 whichmakes an anodic phase in the aluminium matrix and Si act as cathode and contribute to the intergranularcorrosion and resulting in uniform attack and making it an optimum region of dissolution [31]. Closeobservation of SEM metals images indicates the deposition of precipitates of aluminium phosphate on thesurface aluminium and magnesium phosphate on 6063 aluminium alloy.
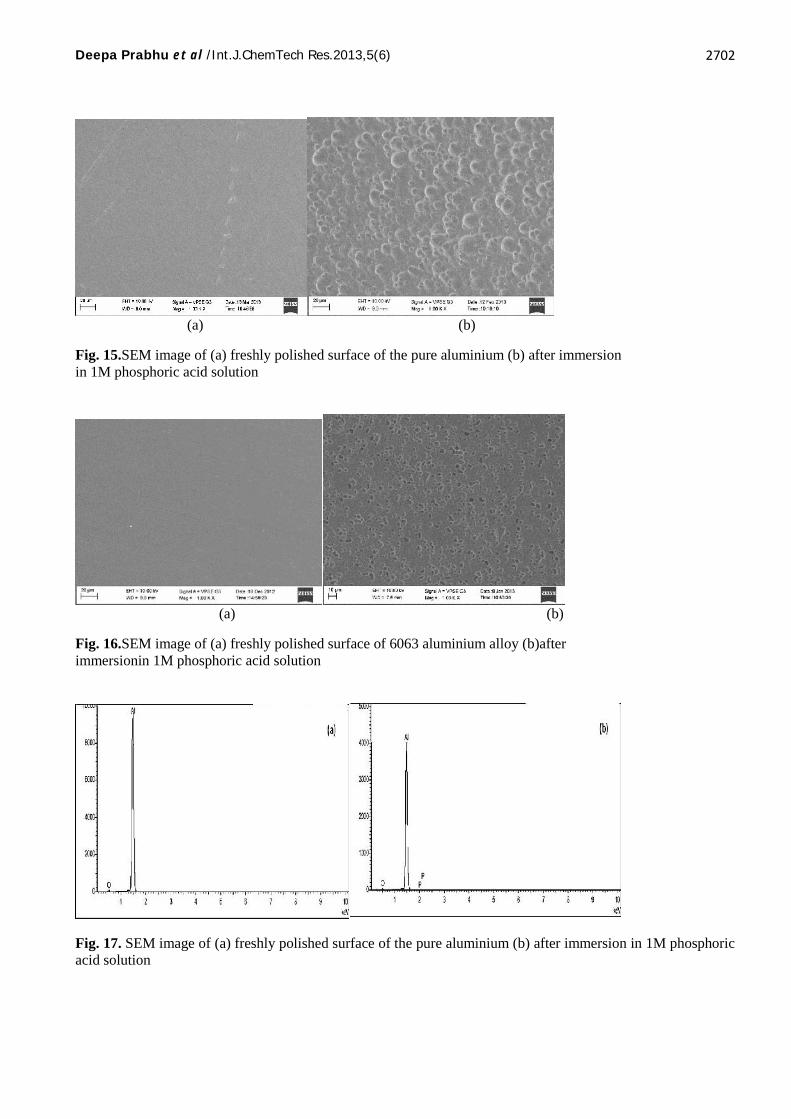
Figure 17a and Figure 18a represents EDX spectrum of the uncorroded sample of aluminium and 6063aluminium alloy.The spectrum shows peaks for aluminium and oxygen suggesting the presence of aluminiumoxide/hydroxide. Figure 17b and Figure 18b depicts the EDX spectrum for the corroded sample of both. Thepresence of peak corresponding to phosphorous indicates the attack of phosphoric acid. The results of EDXanalysis is reported in Table 7.
Deepa Prabhu et al /Int.J.ChemTech Res.2013,5(6) 2702
(a) (b)
Fig. 15.SEM image of (a) freshly polished surface of the pure aluminium (b) after immersionin 1M phosphoric acid solution
(a) (b)
Fig. 16.SEM image of (a) freshly polished surface of 6063 aluminium alloy (b)afterimmersionin 1M phosphoric acid solution
Fig. 17. SEM image of (a) freshly polished surface of the pure aluminium (b) after immersion in 1M phosphoricacid solution

Deepa Prabhu et al /Int.J.ChemTech Res.2013,5(6) 2703
Fig.18. EDX spectrum of (a) uncorroded sample of the 6063 aluminium alloy (b) 6063Aluminium alloy after immersion in 1M phosphoric acid solution.
Table 7 : EDX analysis result of aluminum, 6063 aluminium alloy in absence and presence of 1.0 MPhosphoric acid solution
Composition (%)MediumAl O Si Mg P
Aluminum 89.40 10.60 - - -
6063 aluminium alloy 94.70 4.60 0.45 0.25 -
aluminum in 1.0Mphosphoric acid
84.17 14.77 - - 1.06
6063 aluminium alloy in1.0M phosphoric acid
94.73 4.34 0.54 0.30 0.09
3.4Mechanism of corrosion process
Aluminiumand its alloys have air formed oxide film of amorphous γ alumina which initially thickens onexposure to neutral aqueous solution with the formation of a layer of crystalline hydrated alumina [32]. In acidicsolutions the anodic process of corrosion is the dissolution [33] of the metal ions from the oxide free metalsurface into the solution.
Al + H2O → AlOH(ads) + H+ + e− (7)
AlOH(ads) + 5H2O + H+ → Al3+ +6H2O +2e- (8)
Al3+ + H2O → [AlOH]2+ + H+ (9)
[AlOH]2+ +X − → [AlOHX]+ (10)
The principal cathodic process is the discharge of hydrogen ions to produce hydrogen gas.
H+ + e- → H(ads) (11)
H(ads) + H(ads)→H2 (12)

Deepa Prabhu et al /Int.J.ChemTech Res.2013,5(6) 2704
4. Conclusions
Pure aluminiumundergoes less corrosion in phosphoric acid medium when compared with 6063aluminums alloy.
The corrosion rate increase with increase in the concentration of phosphoric acid.
The corrosion rate increases with increase in temperature in both metals.
The results of Tafel polarization and EIS studies are in good agreement with one another.
Acknowledgement
Mrs.DeepaPrabhu, acknowledges Manipal University, for the Fellowship, and chemistry departmentMIT Manipal, for laboratory facilities.
References
1. Stansbury E.E and Buchanan R.A., Fundamentals of Electrochemical Corrosion ASM. InternationalMaterials Park, USA, 2000.
2. Christian Vargel Corrosion of aluminium Elsevier Ltd. NewYork, 2004.3. KostingP.R and Heins C.,Corrosion of metals by phosphoric acid. Ind. Eng. Chem., 1931,23, 140-150.4. Badaway W.A, AlKharafi F.M, and El-Azab A.S.,Electrochemical behavior and corrosion inhibition of
Al, Al-6061 and Al-Cu in neutral aqueous solutions.Corro. Sci., 1999,41, 709-727.5. Desai P.S and Kapopara S.M.,Inhibiting effect of anisidines on corrosion of aluminium in hydrochloric
acid. Ind. J. Chem. Tech.,2009, 16, 486-491.6. Paul and SigwaltJuniere M., Aluminium in the Chemistry and Food Industries. British
AluminiumCo.Ltd. London,1964, 46.7. Ating E.I., Umoren S.A., Udousoro I.I., Ebenso E.E. and Udoh A.P.,Leaves extract of Ananassativum as
green corrosion inhibitor for aluminium in hydrochloric acid solutions. Green Chemistry Letters andReviews, 2010,3, 61-68.
8. Umoren S.A., Obot I.B., Ebenso E.E., and Obi-Egbedi N.O.,The Inhibition of aluminum corrosion inhydrochloric acid solution by exudate gum from Raphiahookeri.Desalination, 2009,247,561-572.
9. Obi-Egbedi N.O., Obot I.B., and Umoren S.A.,Spondiasmombin L. as a green corrosion inhibitor foraluminium in sulphuric acid: Correlation between inhibitive effect and electronic properties of extractsmajor constituents using density functional theory. Arabian Journal of Chemistry, 2012, 5, 361-373.
10. Nnanna L.A., Anozie I.U., Avoaja A.G.I., Akoma C.S. and Eti E.P.,Comparative study of corrosioninhibition of aluminium alloy of type AA3003 in acidic and alkaline media by Euphorbia hirtaextract.African Journal of Pure and Applied Chemistry, 2011, 5, 265-271.
11. Amin Mohammed A., Mohsen Q., Omar Hazzazi A.,Synergistic effect of I− ions on the corrosioninhibition of Al in 1.0 M phosphoric acid solutions by purine. Mater. Chem Phys., 2009,114,908-914.
12. DeepaPrabhu and PadmalathaRao, Corrosion inhibition of 6063 aluminum alloy by CoriandrumsativumL seed extract in phosphoric acid medium.J. Mater. Environ. Sci., 2013, 4, 732-743.
13. Poorqasemi E., Abootalebi O., Peikari M., and Haqdar F.,Investigating accuracy of the Tafelextrapolation method in HCl solutions. Corros. Sci., 2009, 51, 1043-1054.
14. Fontana M.G., Corrosion Engineering, 3rdedn, McGraw-Hill, Singapore, 1987.15. El- Sayed, Phenothiazine as inhibitor of the corrosion of cadmium in acidic solutions. J. Appl.
Electrochem., 1997, 27, 193-200.16. Muralidharan V.S. and Rajagopalan K.S.,Kinetics and mechanism of corrosion of iron in phosphoric
acid. Corros. Sci., 1979,19,205-207.

Deepa Prabhu et al /Int.J.ChemTech Res.2013,5(6) 2705
17. Pardo A., Merino M.C., Merino S., Lopez M.D., Viejo F., Carboneras M., Influence of reinforcementgrade and matrix composition on corrosion resistance of cast aluminium matrix composites(A3xx.x/SiCp) in a humid environment. Mater.Corros.,2003, 54, 311-317.
18. Trowsdale A.J., Noble B., Harris S.J, Gibbins I.S.R., Thompson G.E. and Wood G.C.,The influence ofsilicon carbide reinforcement on the pitting behaviour of aluminium. Corros. Sci., 1996, 2, 177-191.
19. Montecelli C., Zucchi F., Brunoro G and Trabanelli G.,Corrosion and corrosion inhibition of aluminaparticulate/aluminium alloys metal matrix composites in neutral chloride solutions. J. Appl.Electrochem., 1997,27,325-334.
20. Sayed S., Abdel Rehim, Hamdi Hassan H and Mohammed Amin A.,Corrosion and corrosion inhibitionof Al and some alloys in sulphate solutions containing halide ions investigated by an impedancetechnique. Appl. Surf. Sci., 2002, 187,279-290.
21. Lenderink H.J.W., Linden M.V.D and De Wit J.H.W.,Corrosion of aluminium in acidic and neutralsolutions. ElectrochimActa, 1993, 38, 1989-1992.
22. Brett C.M.A.,The application of electrochemical impedance techniques to aluminium corrosion in acidicchloride solution. J. Appl. Electrochem. 1990, 20, 1000-1003.
23. Brett C.M.A.,On the electrochemical behaviour of aluminium in acidic chloride solution. Corro. Sci.,1992, 33,203-210.
24. Wit J.H. and Lenderink H.J.W.,Electrochemical impedance spectroscopy as a tool to obtain mechanisticinformation on the passive behaviour of aluminium. Electrochim.Acta., 1996,41, 1111-1119.
25. Frers S.E., Stefenel M.M., Mayer C. and Chierchie T.,AC-Impedance measurements on aluminium inchloride containing solutions and below the pitting potential. J. Appl. Electrochem., 1990, 20, 996-999.
26. Lorenz W.J and Mansfeld F.Determination of corrosion rates by electrochemical DC and AC methods.Corros. Sci., 1981, 21, 647-672.
27. El Hosary A.A., Saleh R.M. and Shams El Din A.M.,Corrosion inhibition by naturally occurringsubstances-I. The effect of Hibiscus subdariffa (karkade) extract on the dissolution of Al and Zn. Corro.Sci., 1972,12, 897-904.
28. Popova A., Sokolova E., Raicheva S., Christov M.,AC and DC study of the temperature effect on mildsteel corrosion in acid media in the presence of benzimidazole derivatives. Corros. Sci., 2003, 45, 33-58.
29. Bouklah M., Hammouti B., and Benkaddour M.,Thiophene derivatives as effective inhibitors for thecorrosion of steel in 0.5 m H2SO4. J. App. Electro.Chem., 2005, 35, 1095-1101.
30. AbdEi-Rehim S.S., Ibrahim M.A.M. and Khaled K.F.,-Aminoantipyrine as an inhibitor of mild steelcorrosion in HCl solution. J. Appl. Electrochem., 1999,29, 593-599.
31. Scamans G.M., Jholroyd N. and Tuck C.D.,The role of magnesium segregation in the intergranular stresscorrosion cracking of aluminium alloys. Corros. Sci., 1987, 27, 329-347.
32. Hart R.K.,The formation of films on aluminium immersed in water. Trans. Faraday Soc., 1957, 53, 1020-1027.
33. Obot I.B, Obi-Egbedi N.O, Umoren S.A. and Ebenso E.E.,Synergistic and Antagonistic Effects ofAnions and Ipomoea invulcrata as Green Corrosion Inhibitor for Aluminium Dissolution in AcidicMedium.Int. J. Electrochem. Sci., 2010, 5, 994-1007.
*****