freshwater coast...
TRANSCRIPT
Freshwater Coast Greenhouse/Floriculture Feasibility Study
Freshwater Coast Community Foundation July, 2015
The Freshwater Coast Food Hub Feasibility Study is a project of the Freshwater Coast Community Foundation, in South Carolina, and Clemson University Cooperative Extension Service.
~ 2 ~
Table of Contents I. INTRODUCTION
A. Purpose………………………………………………………………………………………………3
B. The Study Area……………………………………………………………………………………3-4
II. MAREKT ASSESSMENT
A. Background of the Greenhouse Industry……………………….………………………………….4-5
B. Current and Potential Supply of Greenhouse Goods………………………….………….……..…5-8
C. Profile of Existing Market Channels……..………………………………………………………….8
D. Selection of Product Mix…………………...……………………………………………………......8
III. EVALUATING THE ECONOMIC FEASIBILITY OF A GREENHOUSE FACILITY
A. The Proposed Greenhouse Facility…………..…………………………………………………...…9
B. Labor Requirements …………………………………………………………………………..….....9
C. Operating Statement…………………………………………………………………………...…9-10
D. Producer Returns………………………………………………...…………………………..….10-11
E. Capital Requirements……………….…………………………………………………………..11-13
F. Sensitivity Analysis- Response to Changes in Resource Base……………….………..…………...13
IV. ECONOMIC IMPACT TO THE REGION………………………………………………………………13
V. SUMMARY……………………………………………………………………………………………........14
VI. BIBLIOGRAPHY…………………………………………………………………………………….…….15
VII. ENDNOTES…………………………………………………………………………………………………16

~ 3 ~
I. Introduction:
A. Purpose
The purpose of this study is to determine the economic feasibility of establishing a greenhouse/horticulture facility in the
study area.
The goal of this study is to develop an idea of what the industry is doing as far as growth and to determine the feasibility
of an individual or individuals setting up their own greenhouse business for profit. South Carolina currently has a
horticultural market that is $242 million in annual sales receipts that encompasses 8.3% of the entire agricultural market
in the state. With the agribusiness industry continuing to grow, there is room to grow the market in this area. With most
stores buying flowers and vegetable transplants from larger facilities, there must be a cost advantage associated with the
new facility that is put in place.
Preparing for a horticultural greenhouse business requires a person who manages the daily operation well and likes to
work with his or her hands. Greenhouses are physically demanding due to the task of treating and preparing plants for a
quality to be sold.
The local area producers have not expanded horticultural product acreages to the greatest potential because the markets
they serve are too small to produce sufficient quantities for serving large grocery marketing institutions. The producers
have relied heavily upon the direct sales and farmer’s market and its produce brokers to market their crops. The market
has still not accomplished its assigned task, but it can grow steadily as market channels are identified through larger
market orders.
The members of the Freshwater Coast Market, the producer brokers and the producers using the market believe that a
centralized packinghouse/cooling facility for fresh produce might possibly:
1. Provide new outlets for marketing fresh produce because such an operation would allow the accumulation
and timely distribution of produce crops.
2. Increase the opportunity to profitably grow a more diversified produce mix within the area.
3. Encourage increased production.
4. Provide new employment opportunities on the market and surrounding area.
5. Generate additional income to local merchants within the area.
These potential benefits, if achieved, would have a positive impact on the economic and agricultural development of the
area.
B. The Study Area
The study area is defined as the Freshwater Coast Community areas surrounding the county of Abbeville. This area has
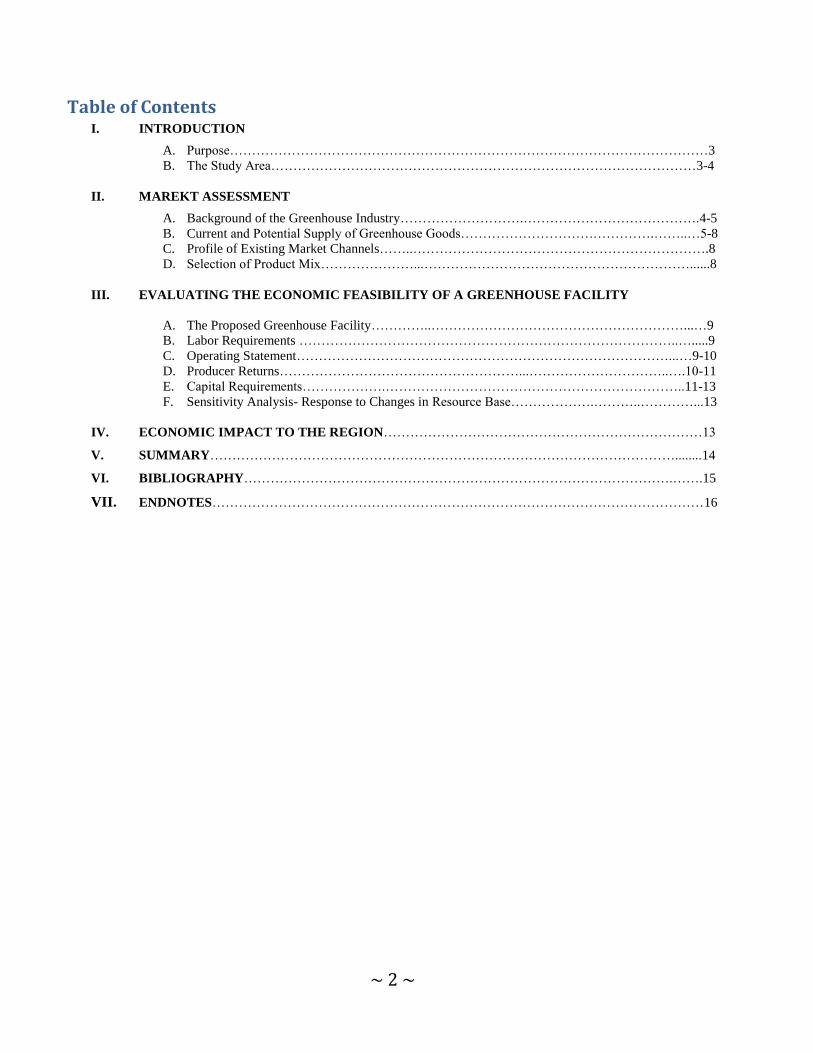
the resources (land, labor and management) necessary to provide commodities. There is a significant farm population in
the area that presently raises livestock, mostly beef cattle, and other several produce crops such as tomatoes, okra,
peppers, squash, sweet corn, cucumbers, broccoli, cabbage, spinach, collard greens, butter beans, mustard greens, peas,
radishes, hay, zucchini, snap beans, turnip greens, cantaloupes, green onions, beets, blueberries, sweet potatoes, apples,
pears, blackberries, and cilantro. A major factor limiting the expanded production of additional acreage and thus a more
diverse cropping mix is the lack of a proper cooling facility. See Figure 1.
The McCormick, Abbeville, and Starr/Iva areas are located in a part of South Carolina that has a relatively low number of
horticulture facilities. There are major cities within a fifty mile radius of the area that include Greenville, Athens, and
Augusta. These areas provide demand for plants through housing markets and landscape companies who buy plants for
decoration and seasonal operations. The population in the area provides demands for transplant vegetables to provide
food in the home-grown life style farming operations that some households prefer over mass grocery store-bought
produce. With a large rural population, plenty of potential opportunities exist for the need of plants that make up small
gardens, flower beds, and decorative plants for the purpose of landscape decoration.
~ 4 ~
Figure 1. Existing Agricultural Products Produced by Farms
II. MARKET ASSESSMENT
A. Background of the Greenhouse Industry
The greenhouse industry in the Abbeville, McCormick, and Starr/Iva areas particularly sells to the local roadside stands,
produce stands, farmer’s markets, restaurants, and direct farm sales. Some facilities sell produce out of their greenhouse
at roadside stands. These roadside stands typically are located in areas with higher traffic volumes, such as highway 72
and 221, or in the city areas where the population concentration is higher. The roadside stands share most of the same
qualities as far as marketing with produce stands.
The greenhouses that sell to farmer’s markets sell produce grown within the facility. The greenhouse owner will rent a
table at the local market to have a location for marketing and sales purposes. The farmer’s market not only provides an
outlet for farm products to be displayed but reserves a location where the marketing of goods can occur. The only limit is
that not all farmer’s markets are open all year. Both Greenwood and Abbeville markets are only open from June until
October. This small season limits the sales of produce.
Some greenhouses sell their products to local restaurants that market their goods as locally grown. This detail is an
important market piece due to the year-round demand that restaurants can offer and greenhouses can supply. By buying
locally grown products, restaurants produce a product that is beneficial to the local economy and agricultural industry,
while also allowing the local growers to have a secured market to sell to.
~ 5 ~
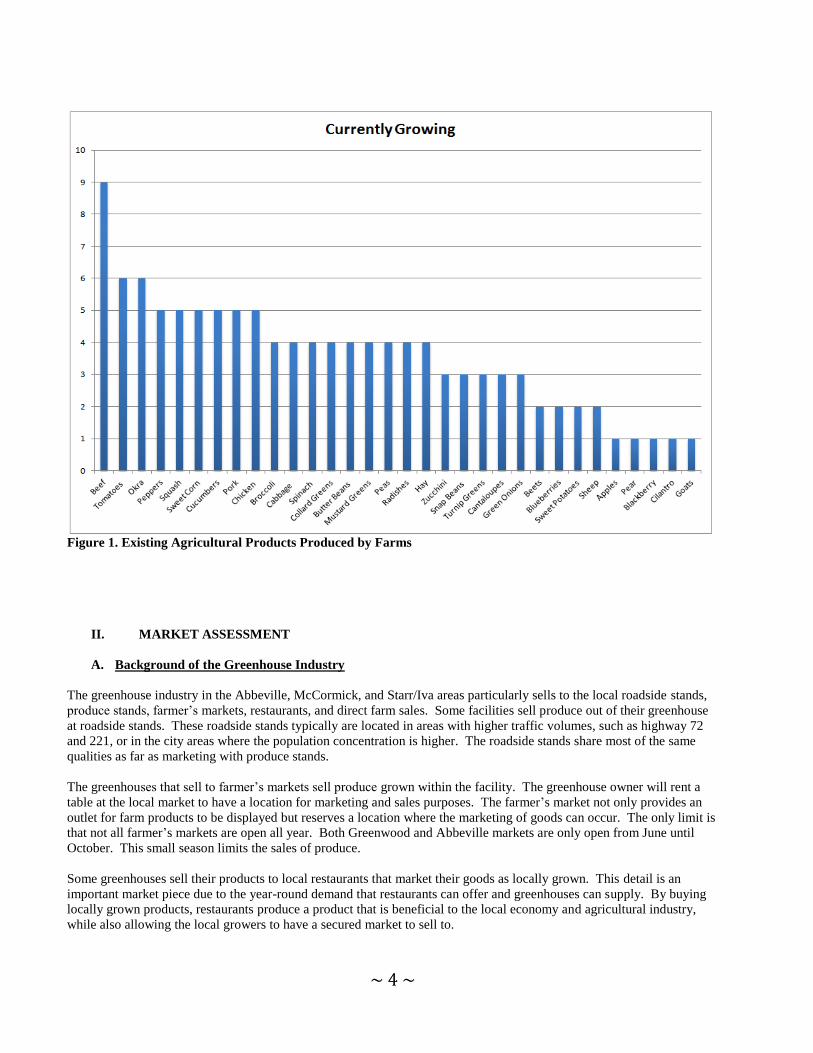
Figure 2. Market Outlets for Agricultural Products
The other market option is direct farm sales, the selling of products directly from the farm facility to the customer. This is
typically a strategy that runs hand in hand with agri-tourism. The facility could cater to the individuals who prefer to go
to the farmland and browse through the products and self-pick the products that they would like to purchase. This
marketing channel also provides an extra benefit to the consumers who visit the farm. By going to the farm to purchase,
consumers gain an understanding of the processes that take place to grow and provide the product. This method requires
investments in self-marketing and also a location accessible to the targeted consumer base.
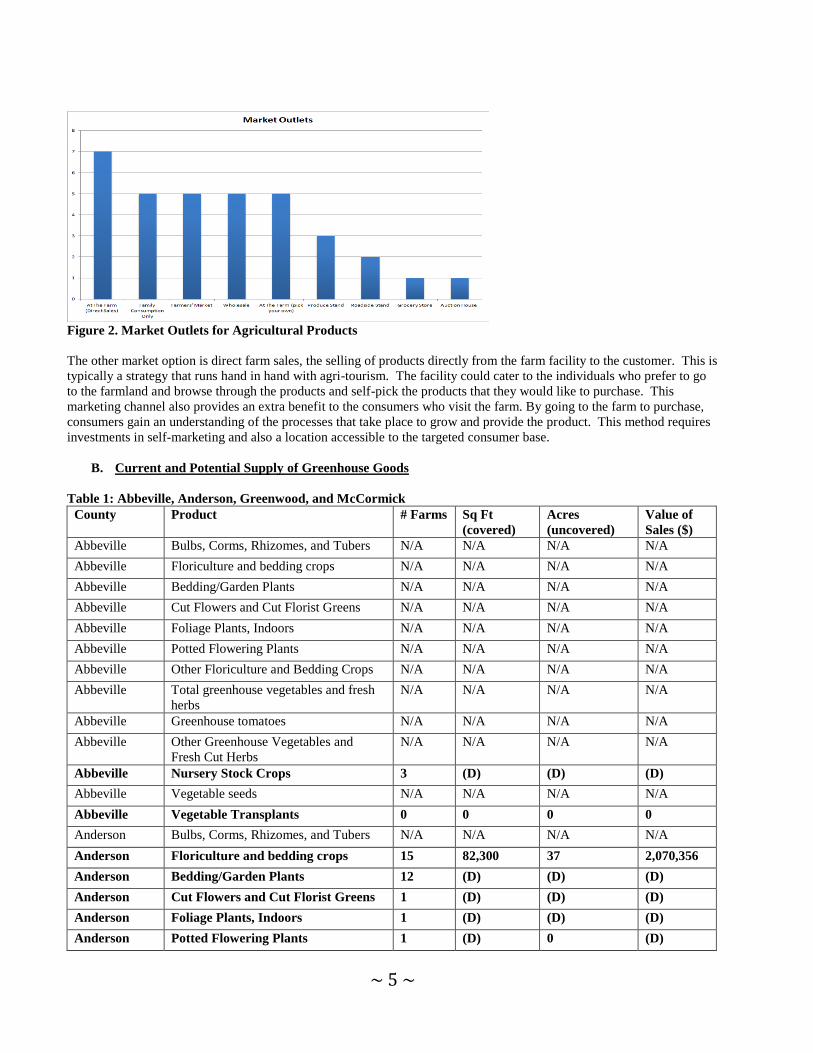
B. Current and Potential Supply of Greenhouse Goods
Table 1: Abbeville, Anderson, Greenwood, and McCormick
County Product # Farms Sq Ft
(covered)
Acres
(uncovered)
Value of
Sales ($)
Abbeville Bulbs, Corms, Rhizomes, and Tubers N/A N/A N/A N/A
Abbeville Floriculture and bedding crops N/A N/A N/A N/A
Abbeville Bedding/Garden Plants N/A N/A N/A N/A
Abbeville Cut Flowers and Cut Florist Greens N/A N/A N/A N/A
Abbeville Foliage Plants, Indoors N/A N/A N/A N/A
Abbeville Potted Flowering Plants N/A N/A N/A N/A
Abbeville Other Floriculture and Bedding Crops N/A N/A N/A N/A
Abbeville Total greenhouse vegetables and fresh
herbs
N/A N/A N/A N/A
Abbeville Greenhouse tomatoes N/A N/A N/A N/A
Abbeville Other Greenhouse Vegetables and
Fresh Cut Herbs
N/A N/A N/A N/A
Abbeville Nursery Stock Crops 3 (D) (D) (D)
Abbeville Vegetable seeds N/A N/A N/A N/A
Abbeville Vegetable Transplants 0 0 0 0
Anderson Bulbs, Corms, Rhizomes, and Tubers N/A N/A N/A N/A
Anderson Floriculture and bedding crops 15 82,300 37 2,070,356
Anderson Bedding/Garden Plants 12 (D) (D) (D)
Anderson Cut Flowers and Cut Florist Greens 1 (D) (D) (D)
Anderson Foliage Plants, Indoors 1 (D) (D) (D)
Anderson Potted Flowering Plants 1 (D) 0 (D)
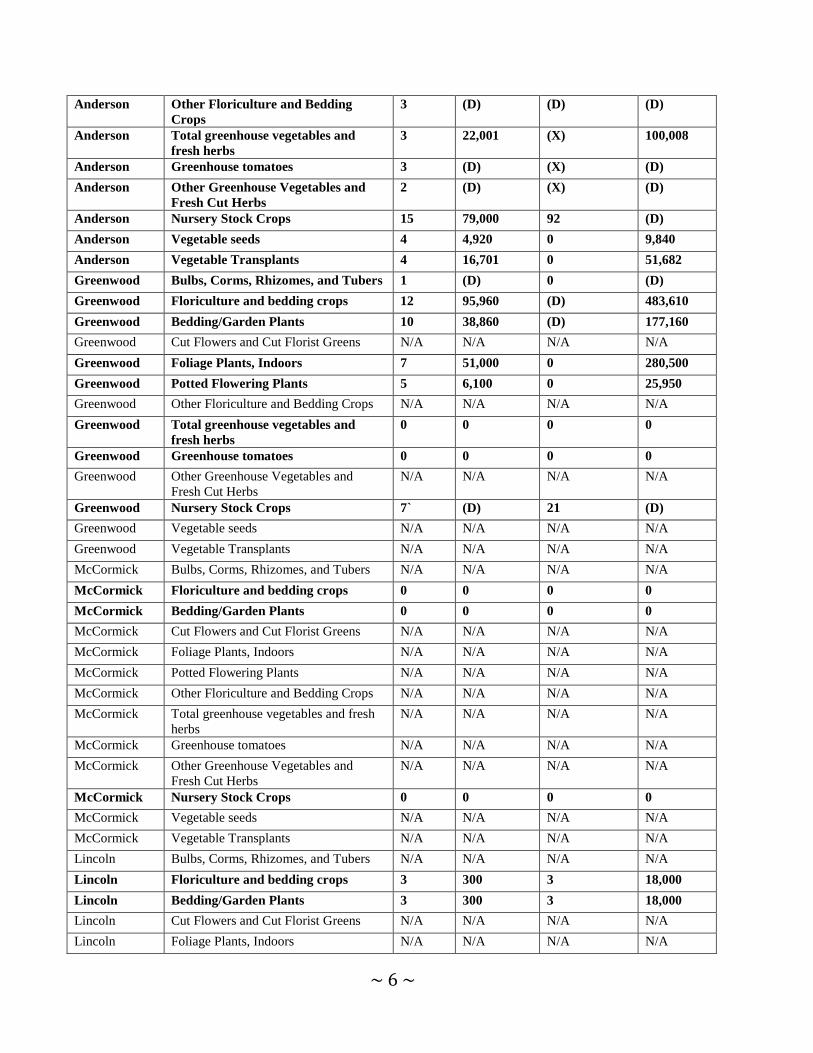
~ 6 ~
Anderson Other Floriculture and Bedding
Crops
3 (D) (D) (D)
Anderson Total greenhouse vegetables and
fresh herbs
3 22,001 (X) 100,008
Anderson Greenhouse tomatoes 3 (D) (X) (D)
Anderson Other Greenhouse Vegetables and
Fresh Cut Herbs
2 (D) (X) (D)
Anderson Nursery Stock Crops 15 79,000 92 (D)
Anderson Vegetable seeds 4 4,920 0 9,840
Anderson Vegetable Transplants 4 16,701 0 51,682
Greenwood Bulbs, Corms, Rhizomes, and Tubers 1 (D) 0 (D)
Greenwood Floriculture and bedding crops 12 95,960 (D) 483,610
Greenwood Bedding/Garden Plants 10 38,860 (D) 177,160
Greenwood Cut Flowers and Cut Florist Greens N/A N/A N/A N/A
Greenwood Foliage Plants, Indoors 7 51,000 0 280,500
Greenwood Potted Flowering Plants 5 6,100 0 25,950
Greenwood Other Floriculture and Bedding Crops N/A N/A N/A N/A
Greenwood Total greenhouse vegetables and
fresh herbs
0 0 0 0
Greenwood Greenhouse tomatoes 0 0 0 0
Greenwood Other Greenhouse Vegetables and
Fresh Cut Herbs
N/A N/A N/A N/A
Greenwood Nursery Stock Crops 7` (D) 21 (D)
Greenwood Vegetable seeds N/A N/A N/A N/A
Greenwood Vegetable Transplants N/A N/A N/A N/A
McCormick Bulbs, Corms, Rhizomes, and Tubers N/A N/A N/A N/A
McCormick Floriculture and bedding crops 0 0 0 0
McCormick Bedding/Garden Plants 0 0 0 0
McCormick Cut Flowers and Cut Florist Greens N/A N/A N/A N/A
McCormick Foliage Plants, Indoors N/A N/A N/A N/A
McCormick Potted Flowering Plants N/A N/A N/A N/A
McCormick Other Floriculture and Bedding Crops N/A N/A N/A N/A
McCormick Total greenhouse vegetables and fresh
herbs
N/A N/A N/A N/A
McCormick Greenhouse tomatoes N/A N/A N/A N/A
McCormick Other Greenhouse Vegetables and
Fresh Cut Herbs
N/A N/A N/A N/A
McCormick Nursery Stock Crops 0 0 0 0
McCormick Vegetable seeds N/A N/A N/A N/A
McCormick Vegetable Transplants N/A N/A N/A N/A
Lincoln Bulbs, Corms, Rhizomes, and Tubers N/A N/A N/A N/A
Lincoln Floriculture and bedding crops 3 300 3 18,000
Lincoln Bedding/Garden Plants 3 300 3 18,000
Lincoln Cut Flowers and Cut Florist Greens N/A N/A N/A N/A
Lincoln Foliage Plants, Indoors N/A N/A N/A N/A
~ 7 ~
Lincoln Potted Flowering Plants N/A N/A N/A N/A
Lincoln Other Floriculture and Bedding Crops N/A N/A N/A N/A
Lincoln Total greenhouse vegetables and fresh
herbs
N/A N/A N/A N/A
Lincoln Greenhouse tomatoes N/A N/A N/A N/A
Lincoln Other Greenhouse Vegetables and
Fresh Cut Herbs
N/A N/A N/A N/A
Lincoln Nursery Stock Crops 0 0 0 0
Lincoln Vegetable seeds N/A N/A N/A N/A
Lincoln Vegetable Transplants N/A N/A N/A N/A
Elbert Bulbs, Corms, Rhizomes, and Tubers N/A N/A N/A N/A
Elbert Floriculture and bedding crops 1 (D) (D) (D)
Elbert Bedding/Garden Plants 1 (D) (D) (D)
Elbert Cut Flowers and Cut Florist Greens N/A N/A N/A N/A
Elbert Foliage Plants, Indoors 0 0 0 0
Elbert Potted Flowering Plants 0 0 0 0
Elbert Other Floriculture and Bedding Crops N/A N/A N/A N/A
Elbert Total greenhouse vegetables and
fresh herbs
1 (D) (X) (D)
Elbert Greenhouse tomatoes 1 (D) (X) (D)
Elbert Other Greenhouse Vegetables and
Fresh Cut Herbs
N/A N/A N/A N/A
Elbert Nursery Stock Crops 2 0 (D) (D)
Elbert Vegetable seeds N/A N/A N/A N/A
Elbert Vegetable Transplants N/A N/A N/A N/A
Table 1 gives an idea of how many facilities in the area perform a specific function and produce a certain crop. Anderson
seems to have the most diverse product outputs. This is an observation about the number of products, not the number of
farms. One or two farms may produce many types of products in smaller quantities, but they still account for the larger
diversity of sales in the area. This table comes from the Ag Census prepared by the National Agricultural Statistics
Service. The abbreviations (D) and (X) were set in the tables by the census creators. The abbreviation (D) stands for data
being withheld to avoid disclosing data for individual farms and (X) stands for data that is not applicable to the survey or
is not useful.
After struggling through the great recession from the beginning of 2008 until late 2009 and into recovery, the greenhouse
industry has not fully bounced back. The industry greatly depends on how well the housing industry is developing. More
houses mean more lawns that need to be taking care of and a higher demand for aesthetic flowers and other visually
pleasing plants. The new trends for homegrown foods, healthier diets, and independence have led to higher numbers of
individuals who plant their own gardens and/or grow their own vegetables. These higher numbers have increased the
demand for vegetable transplants that allow individuals to provide fresh homegrown vegetables that do not take as long to
grow because they are a full plant rather than a seed. This trend occurs in Anderson with a large part of the sales coming
from flowering plants or visually aesthetic and bedding plants group. With over $2,000,000 coming from this market
alone, the revenue depicts that with many housing areas comes a large demand for this group. Greenwood has had annual
revenues that almost reached $500,000.
As housing continues to develop in the area the demand for these plants will grow. The trend for homegrown or fresh
food can be seen in the data for vegetable transplants, greenhouse tomatoes and fresh herbs. These sales directly correlate
with the idea that people tend to buy healthier foods that are easily accessible and provided within a close proximity.
Vegetable transplants provide people with a way to get these fresh vegetables from their own local sources. Currently
there are only four competitors, all located in Anderson, for vegetable transplants within the entire Freshwater Coast
~ 8 ~
Community area. There are other major competitors as far as large corporation greenhouses that supply local farm and
garden stores, such as Bonnie Plants. The closest Bonnie Plant operation is located in Spartanburg, SC.
Some barriers of entry into the market come with receiving certification for growing nursery crops. In order to sell
outside of the local market, there will be some barriers as far as being cost competitive with major corporate competitors
such as Bonnie Plants. This barrier will require sales reps and larger marketing strategies that would increase the overall
costs associated with the operation. Another obvious barrier is the overall starting costs of building a facility and
maintaining the operating costs until revenues begin to flow in.
In regards to the inputs into the facility, most inputs would be relatively easy and convenient to have shipped to the site
through a major greenhouse supply company. If the facility owner chooses to go to a greenhouse supply center, the
closest one is located in Columbia, SC. Due to the high price of gas/diesel and travel, it seems that the price of shipping
directly to the site will be cheaper for most inputs such as seeds, trays, and other smaller inputs.
C. Profile of Existing Market Channels
The existing market facilities include three South Carolina Certified roadside markets in Abbeville and one in
McCormick. Producers can sell their products to local restaurants that look for locally grown quality food products.
Other facilities that buy or market greenhouse products include farmer’s markets and hardware stores. The horticultural
products grown in these greenhouses would market at the farmer’s markets, restaurants, and roadside stands that are
located throughout the area. The aesthetic plants would be marketed at local businesses that sell the flowering plants or
vegetable transplants. They would also be sold alongside the food products at farmer’s markets and roadside markets.
Both food products and aesthetic plants can also be sold directly from the facility by utilizing the agri-tourism market.
The Certified South Carolina Grown product is a brand that is beneficial to these specific facilities since it allows the
marketing of local produce as fresh and healthy. This brand also helps with the marketing of the products made in the
area by allowing an increasing confidence with consumers to boost the amount of sales.
When selling transplants to a local farm and garden supply store, the product must be able to compete with the larger
producers that are shipping their products to this area. Some facilities may be willing to pay a slightly higher price for a
local grown product, but the quality of the transplants must overcome the cost. Since this type of product cannot be
differentiated from other products of the same type, producers must guarantee that the quality of the product is better than
what is being sold by similar companies. This guarantee will make or break the sale of the product in a commodity
market. 50% of vegetable growers are predicted to buy transplants to be used on their individual farms. This number is
based on national trends of continuing growth in demand. In the Freshwater Coast Community area, this number
translates to about 25 out of the 165 farmers that have been surveyed.
D. Selection of Product Mix
In selecting the product mix for a greenhouse production, the demand surrounding the facility must be considered. We
have determined that the top nine vegetables grown in the area will be tomatoes, okra, peppers, squash, sweet corn,
cucumbers, broccoli, and cabbage. After conducting the financial study, we determined that radishes turned out to be
more profitable than squash. Using this data we can select the top nine vegetables grown to use as the crop enterprises in
our study. These plants will be greenhouse-grown transplants. We are aware that other options of plants can be grown
within the facility, but we chose these nine specific plants as examples to test the feasibility of growing products using the
popular plants in the area.
~ 9 ~
III. EVALUATING THE ECONOMIC FEASIBILITY OF A GREENHOUSE FACILITY
A. The Proposed Greenhouse Facility
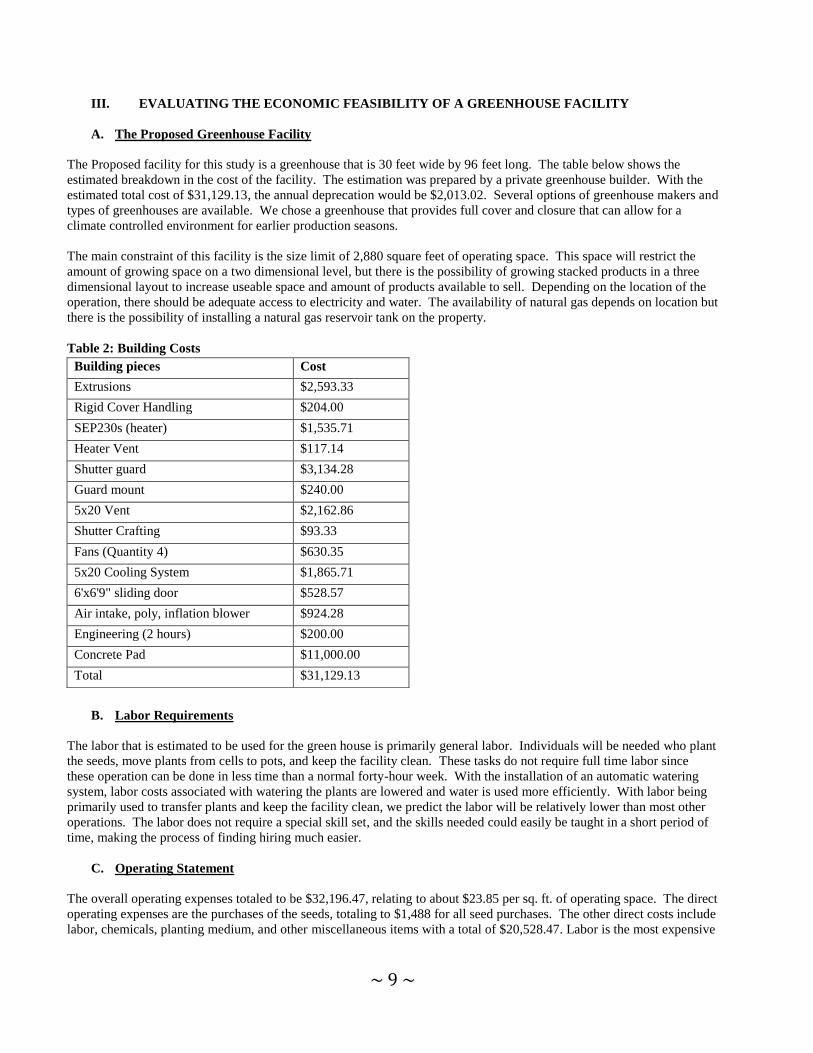
The Proposed facility for this study is a greenhouse that is 30 feet wide by 96 feet long. The table below shows the
estimated breakdown in the cost of the facility. The estimation was prepared by a private greenhouse builder. With the
estimated total cost of $31,129.13, the annual deprecation would be $2,013.02. Several options of greenhouse makers and
types of greenhouses are available. We chose a greenhouse that provides full cover and closure that can allow for a
climate controlled environment for earlier production seasons.
The main constraint of this facility is the size limit of 2,880 square feet of operating space. This space will restrict the
amount of growing space on a two dimensional level, but there is the possibility of growing stacked products in a three
dimensional layout to increase useable space and amount of products available to sell. Depending on the location of the
operation, there should be adequate access to electricity and water. The availability of natural gas depends on location but
there is the possibility of installing a natural gas reservoir tank on the property.
Table 2: Building Costs
B. Labor Requirements
The labor that is estimated to be used for the green house is primarily general labor. Individuals will be needed who plant
the seeds, move plants from cells to pots, and keep the facility clean. These tasks do not require full time labor since
these operation can be done in less time than a normal forty-hour week. With the installation of an automatic watering
system, labor costs associated with watering the plants are lowered and water is used more efficiently. With labor being
primarily used to transfer plants and keep the facility clean, we predict the labor will be relatively lower than most other
operations. The labor does not require a special skill set, and the skills needed could easily be taught in a short period of
time, making the process of finding hiring much easier.
C. Operating Statement
The overall operating expenses totaled to be $32,196.47, relating to about $23.85 per sq. ft. of operating space. The direct
operating expenses are the purchases of the seeds, totaling to $1,488 for all seed purchases. The other direct costs include
labor, chemicals, planting medium, and other miscellaneous items with a total of $20,528.47. Labor is the most expensive
Building pieces Cost
Extrusions $2,593.33
Rigid Cover Handling $204.00
SEP230s (heater) $1,535.71
Heater Vent $117.14
Shutter guard $3,134.28
Guard mount $240.00
5x20 Vent $2,162.86
Shutter Crafting $93.33
Fans (Quantity 4) $630.35
5x20 Cooling System $1,865.71
6'x6'9" sliding door $528.57
Air intake, poly, inflation blower $924.28
Engineering (2 hours) $200.00
Concrete Pad $11,000.00
Total $31,129.13

~ 10 ~
cost associated with production of transplants. Packing and sorting expenses total to $10,180. This expense category
stems straight from the costs associated with labeling the final pots. Table 3 shows a full breakdown of operating costs.
Table 3: Seed Costs
Input: Cost per seed: Quantity: Total Cost:___
Tomato seed $0.10 2400 $240
Okra seed $0.03 4800 $144
Pepper seed $0.16 2400 $384
Radish seed $0.01 7200 $72
Sweet Corn seed $0.02 4800 $96
Cucumber seed $0.07 4800 $336
Broccoli seed $0.04 2400 $96
Cabbage seed $0.02 2400 $48
Greens seed $0.01 7200 $72
Totals: ------- 38400 $1488________
The direct operating costs are all derived from the purchase of seed. These values are all derived by taking total packet
prices and dividing the number of seeds in a packet by the price.
Table 4: Other Direct Costs:
Input: Cost per unit: Quantity: Total Cost:
Herbicide $100.00 1 $100.00
Fungicide $50.00 1 $50.00
Potting Medium (cubic ft) $6.25 577 $3,606.25
Water/Heat/Elec. $2000.00 1 $2,000.00
Supplies $200.00 1 $200.00
Fertilizers (lbs.) $0.65 300 $195.00
Plant inserts/trays $1.55 750 $1,162.50
Fuel/Oil/Repairs/Maintenance $1500.00 1 $1,500.00
Others $500.00 1 $500.00
Totals: ---------- --------- $9,313.75__
Table 5: Packing, Storage and Market Costs:
Inputs: Cost Per Unit: Quantity: Total Cost:
Final pots $0.25 21,600 $5,400
Labels & Stickers $0.05 21,600 $1,080
Hauling and Marketing $160.00 20 $3,200
Others $500.00 1 $500
Totals: --------- --------- $10,180______
Most of the direct costs have to do with the inputs that go into production including utilities, the medium for potting,
chemicals to help with high yield production and pest control. Packing, storage, and market costs, hauling and
transportation costs will require some special attention to allow for cost savings due to the high price of fuel for
transporting goods. The labeling of goods is important to the greenhouse industry because goods must be properly
identified and ordered.
D. Producer Returns
The table below shows the estimated revenue, total cost, total profit, unit cost, unit price, and unit profit for all products.
The price of $4 was set as a baseline price for the similar transplant pots using 3x3 inch peat pots for easy replanting or
transplanting. With an average yield of 16 3” pots per square foot of space, we estimate a total of 21,600 pots will be
made in an area totaling to 1,350 square foot. This estimate assumes that all of the seeds will propagate. We estimate that
tomatoes, peppers, broccoli, and cabbage will propagate one plant per transplant, whereas okra, sweet corn, and
cucumbers will be two plants per transplant. Radishes and greens will propagate three plants per transplant.

~ 11 ~
This model also predicts yearly revenue for one growing season out of a greenhouse. In this model, we use a growing
season that is a few months long to prepare transplants for the spring planting. The time that it takes for returns will occur
after the plants have grown and put into the pots for sale. Once sales begin, the cash flow will begin to have positive
revenues. This facility could be used to grow other products throughout the year such as herbs, flowers, etc.
Table 6: Product Returns:
Products: Unit Price: Unit cost: Total Profit: Total Cost: Total Revenue:
Tomatoes $4.00 $2.79 $2,903.52 $6,696.48 $9,600
Okra $4.00 $2.75 $2,999.52 $6,600.48 $9,600
Peppers $4.00 $2.85 $2,759.52 $6,840.48 $9,600
Radishes $4.00 $2.72 $3,071.52 $6,528.48 $9,600
Sweet Corn $4.00 $2.73 $3,047.52 $6,552.48 $9,600
Cucumbers $4.00 $2.83 $2,807.52 $6,792.48 $9,600
Broccoli $4.00 $2.73 $3,047.52 $6,552.48 $9,600
Cabbage $4.00 $2.71 $3,095.52 $6,504.48 $9,600
Greens $4.00 $2.72 $3,071.52 $6,528.48 $9,600
Totals: ------- ------- $26,803.68 $59,596.32 $86,400
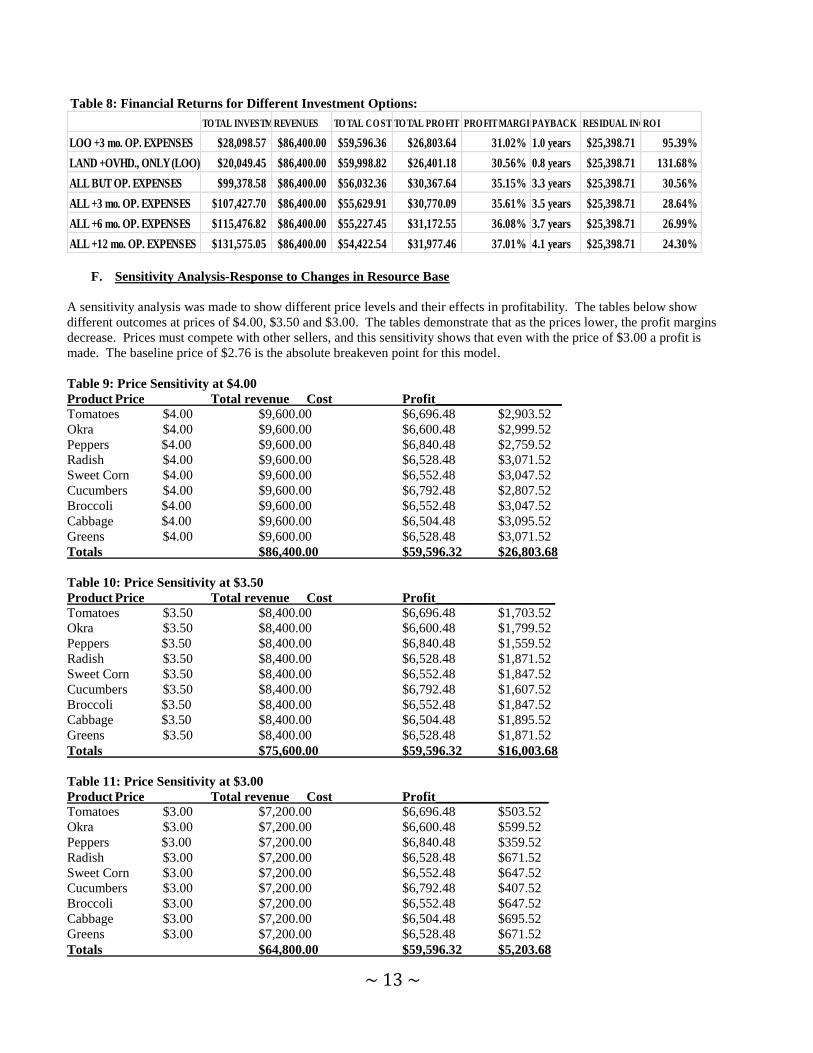
E. Capital Requirements
The table below shows the capital requirements needed for particular parts of the operation including total investment,
revenues, total cost, total profit, profit margins, payback time, residual income, and ROI. The row categories are: a) land
plus overhead, plus three months of operating expenses; b) land plus overhead only; c) all expenses but operating
expenses; d) all expenses plus three months operating; e) all expenses plus six months operating; and f) all expenses plus
twelve months operating. The total working capital for 3 months is $8,049.12. This number comes from taking the first
row total investment minus the second row total investment number. The total investment needed to start-up the
operation is $99,378.58. This value does not include operating costs for any particular amount of time. The maximum
initial investment for full expenses plus 12 months of operations is $131,575.05.
In terms of loan options, there is a general small business loan 7a program with the U.S. Small Business Administration.
There is also a Rural Micro-entrepreneur Assistance Program through the USDA which provides microloans, training,
and technical assistance. This assistance comes through utilizing the institutions that are either non-profit such as
Freshwater Coast Community Foundation or higher learning institutions such as Clemson University. These institutions
are vital in gaining financial assistance from programs such as the Rural Micro-entrepreneur Assistance programs and
others. Each loan will have its own set of conditions and financing requirements.
Institutions are available to give consultation on these matters such as Clemson Extension Service and the Small Business
Development Center in the area. According to this table, the best Return on Investment (ROI) comes from borrowing
money for land and overhead costs only. Accordingly, the out-of-pocket cost will total $20,049.45. The additional costs
of borrowing for equipment, operating expenses (labor included), and facilities are $111,525.60, for 12 months of
operation. The table below provides the full assessment of the costs per square foot for all of the operating expenses as
well as the profit based off of the revenues from the table above.

~ 12 ~
Table 7: Total Expenses and Net Profit
OPERATING EXPENSES Unit Cost/Sq Ft Total
DIRECT OPERATING COSTS>>>>>>>>>>>>>>>>>>>>>>>>>>>>>>>>>>>>>>>>>>>>>>>>>>>>>>>>>>> $1.10 $1,488.00
Tomatoes SQ FT $0.18 $240.00
Okra SQ FT $0.11 $144.00
Peppers SQ FT $0.28 $384.00
Radish SQ FT $0.05 $72.00
Sweet Corn SQ FT $0.07 $96.00
Cucumbers SQ FT $0.25 $336.00
Broccoli SQ FT $0.07 $96.00
Cabbage SQ FT $0.04 $48.00
Greens SQ FT $0.05 $72.00
OTHER DIRECT COSTS>>>>>>>>>>>>>>>>>>>>>>>>>>>>>>>>>>>>>>>>>>>>>>>>>>>>>>>>>>>>>>> $15.21 $20,528.47
LABOR SQ FT $8.31 $11,214.72
HERBICIDE SQ FT $0.07 $100.00
FUNGICIDE SQ FT $0.04 $50.00
POTTING MEDIUM SQ FT $2.67 $3,606.25
WATER, HEAT & ELECTRICITY SQ FT $1.48 $2,000.00
SUPPLIES SQ FT $0.15 $200.00
FERTALIZERS (20-20-20) SQ FT $0.14 $195.00
Plant inserts/Trays SQ FT $0.86 $1,162.50
FUEL, OIL, REPAIRS AND MAINTENANCE SQ FT $1.11 $1,500.00
EQUIPMENT LABOR SQ FT $0.00 $0.00
Others SQ FT $0.37 $500.00
PACKING, STORAGE & MKT COSTS>>>>>>>>>>>>>>>>>>>>>>>>>>>>>>>>>>>>>>>>>>>>> $7.54 $10,180.00
Final Pots SQ FT $4.00 $5,400.00
LABELS & STICKERS SQ FT $0.80 $1,080.00
HAULING & MARKETING SQ FT $2.37 $3,200.00
OTHERS SQ FT $0.37 $500.00
TOTAL OP. EXPENSES : $23.85 $32,196.47
INTEREST RATE : 5.00% OPERATING PROFIT : per SQ FT $40.15 $54,203.53
CAPITAL COSTS >>>>>>>>>>>>>>>>>>>>>>>>>>>>>>>>>>>>>>>>>>>>>>>>>>>>>>>>>>>>>>>>>>> $3.83 $5,173.82
INTEREST ON INITIAL INVENTORY 9.0 Months SQ FT $0.04 $55.80
INTEREST ON WORKING CAPITAL 9.0 Months SQ FT $0.85 $1,151.57
INTEREST ON EQUIPMENT / FURNITURE / … SQ FT $1.79 $2,410.00
INTEREST ON BUILDINGS AND ASSETS SQ FT $1.15 $1,556.46
OVERHEAD & OWNERSHIP COSTS >>>>>>>>>>>>>>>>>>>>>>>>>>>>>>>>>>>>>>>>>>>>>>>>>>>>> $16.46 $22,226.07
BUSINESS EXPENSES SQ FT $6.30 $8,499.45
ADIMINISTRATIVE EXPENSES SQ FT $5.59 $7,550.00
PERSONAL EXPENSES SQ FT $0.00 $0.00
LABOR: MANAGAMENT & ADMINISTRATIVE SQ FT $0.00 $0.00
DEPRECIATION: MACHINERY & EQUIPMENT SQ FT $3.08 $4,163.60
DEPRECIATION: BUILDING & OTHERS SQ FT $1.49 $2,013.02
TOTAL FIXED EXPENSES : $20.30 $27,399.89
TOTAL EXPENSES : $44.15 $59,596.36
NET PROFIT : per SQ FT $19.85 $26,803.64
~ 13 ~
Table 8: Financial Returns for Different Investment Options:
F. Sensitivity Analysis-Response to Changes in Resource Base
A sensitivity analysis was made to show different price levels and their effects in profitability. The tables below show
different outcomes at prices of $4.00, $3.50 and $3.00. The tables demonstrate that as the prices lower, the profit margins
decrease. Prices must compete with other sellers, and this sensitivity shows that even with the price of $3.00 a profit is
made. The baseline price of $2.76 is the absolute breakeven point for this model.
Table 9: Price Sensitivity at $4.00
Product Price Total revenue Cost Profit___________________
Tomatoes $4.00 $9,600.00 $6,696.48 $2,903.52
Okra $4.00 $9,600.00 $6,600.48 $2,999.52
Peppers $4.00 $9,600.00 $6,840.48 $2,759.52
Radish $4.00 $9,600.00 $6,528.48 $3,071.52
Sweet Corn $4.00 $9,600.00 $6,552.48 $3,047.52
Cucumbers $4.00 $9,600.00 $6,792.48 $2,807.52
Broccoli $4.00 $9,600.00 $6,552.48 $3,047.52
Cabbage $4.00 $9,600.00 $6,504.48 $3,095.52
Greens $4.00 $9,600.00 $6,528.48 $3,071.52
Totals $86,400.00 $59,596.32 $26,803.68
Table 10: Price Sensitivity at $3.50
Product Price Total revenue Cost Profit__________________
Tomatoes $3.50 $8,400.00 $6,696.48 $1,703.52
Okra $3.50 $8,400.00 $6,600.48 $1,799.52
Peppers $3.50 $8,400.00 $6,840.48 $1,559.52
Radish $3.50 $8,400.00 $6,528.48 $1,871.52
Sweet Corn $3.50 $8,400.00 $6,552.48 $1,847.52
Cucumbers $3.50 $8,400.00 $6,792.48 $1,607.52
Broccoli $3.50 $8,400.00 $6,552.48 $1,847.52
Cabbage $3.50 $8,400.00 $6,504.48 $1,895.52
Greens $3.50 $8,400.00 $6,528.48 $1,871.52
Totals $75,600.00 $59,596.32 $16,003.68
Table 11: Price Sensitivity at $3.00
Product Price Total revenue Cost Profit_________________
Tomatoes $3.00 $7,200.00 $6,696.48 $503.52
Okra $3.00 $7,200.00 $6,600.48 $599.52
Peppers $3.00 $7,200.00 $6,840.48 $359.52
Radish $3.00 $7,200.00 $6,528.48 $671.52
Sweet Corn $3.00 $7,200.00 $6,552.48 $647.52
Cucumbers $3.00 $7,200.00 $6,792.48 $407.52
Broccoli $3.00 $7,200.00 $6,552.48 $647.52
Cabbage $3.00 $7,200.00 $6,504.48 $695.52
Greens $3.00 $7,200.00 $6,528.48 $671.52
Totals $64,800.00 $59,596.32 $5,203.68
TO TAL INVESTMENTREVENUES TOTAL CO ST TO TAL PRO FIT PRO FIT MARGINPAYBACK RESIDUAL INCOMERO I
LOO +3 mo. OP. EXPENSES $28,098.57 $86,400.00 $59,596.36 $26,803.64 31.02% 1.0 years $25,398.71 95.39%
LAND +OVHD., ONLY (LOO) $20,049.45 $86,400.00 $59,998.82 $26,401.18 30.56% 0.8 years $25,398.71 131.68%
ALL BUT OP. EXPENSES $99,378.58 $86,400.00 $56,032.36 $30,367.64 35.15% 3.3 years $25,398.71 30.56%
ALL +3 mo. OP. EXPENSES $107,427.70 $86,400.00 $55,629.91 $30,770.09 35.61% 3.5 years $25,398.71 28.64%
ALL +6 mo. OP. EXPENSES $115,476.82 $86,400.00 $55,227.45 $31,172.55 36.08% 3.7 years $25,398.71 26.99%
ALL +12 mo. OP. EXPENSES $131,575.05 $86,400.00 $54,422.54 $31,977.46 37.01% 4.1 years $25,398.71 24.30%
~ 14 ~
IV. ECONOMIC IMPACT TO THE REGION
The creation of a greenhouse facility will positively impact the area. By providing more to the tax base in the area the
county will benefit from the extra tax dollars coming from this business. The residents of the community will benefit
from the available and convenient goods being provided by the greenhouse, allowing buyers to spend the money they
saved at other local businesses. The jobs provided by this operation will provide additional income into the community.
There is a low environmental impact due to the small area taken up by the greenhouse. The products coming from the
greenhouse will positively impact local food growth, further lowering overall environmental impact due to lower
transport costs.
V. SUMMARY
The introduction of a greenhouse facility will help fill the gap that exists within the agricultural industry in the area.
Certain opportunities have not been taken advantage of in the market, and the greenhouse facility can help individuals
take these opportunities.
Greenhouses allow growing seasons to extend past what the current climate allows. This extended time allows farmers to
get plants ready for transplanting earlier with lower travel costs in the area. By providing this commodity, local farmers
have the ability to get quality plants to increase their chances of harvesting a quality crop as well as quickening the time a
farmer can have his crop planted.
Using all of the assumptions in this study, a greenhouse facility can be feasible and profitable. The financial analysis
proves that utilizing 47% of the total two dimensional area will lead to a profit of $5,203.68 to $26,803.68 depending on
the prices of the goods sold.
With everything considered, there are several positive factors to beginning a greenhouse operation. There is room for
improvement and lower costs than those provided by this study. If an individual uses their own innovation and mastering
of skills to create an efficient working facility, even more profitability can be made. Since we cannot accurately estimate
an individual’s efficiency or innovation, we have not included this factor into this study.
~ 15 ~
VI. BIBLIOGRAPHY
"Code of Laws - Title 46 - Chapter 33 - Shipment And Sale Of Trees, Plants And Shrubs." Code of Laws - Title 46 -
Chapter 33 - Shipment And Sale Of Trees, Plants And Shrubs. South Carolina Legislature, n.d. Web. 02 July 2015.
"45-2092 Farmworkers and Laborers, Crop, Nursery, and Greenhouse." U.S. Bureau of Labor Statistics. U.S. Bureau of
Labor Statistics, 25 Mar. 2015. Web. 02 July 2015.
"Introduction." 2012 Census of Agriculture (2012): n. pag. Ag Census. USDA National Agricultural Statistics Service.
Web. 2 July 2015.
Kelley, Terry W., George E. Boyhan, Darbie M. Granberry, Stormy Sparks, David Langston, Stanley Culpepper, Paul E.
Sumner, and Greg Fonsah. "Commercial Production of Vegetable Transplants (B 1144)."Commercial Production
of Vegetable Transplants. UGA Extension, 4 Jan. 2014. Web. 02 July 2015.
Lambe, David P., Stacy A. Adams, and Ellen T. Paparozzi. "Estimating Construction Costs for a Low-Cost Quonset-style
Greenhouse." University of Nebraska Lincoln Extension, 2012. Web. 2 July 2015.
London, James B. "The Impact of the Agribusiness Sector on the South Carolina Economy." (n.d.): n. pag. Palmetto
AgriBusiness Council. South Carolina Department of Agriculture, Jan. 2015. Web. 2 July 2015.
Mahr, Marcy, Jeff Pilsner, Ana Bokstrom, Mick Wilson, and George Meier. "North Slocan Community Greenhouse
Feasibility Study." North Slocan Community Greenhouse Feasibility Study (2010): n. pag.Slocan District Chamber
of Commerce. Slocan District Chamber of Commerce, Oct. 2010. Web.
"Nursery, Greenhouse, Floriculture, Sod, Mushrooms, Vegetable Seeds, and Propagative Materials Grown For Sale: 2012
and 2007." 2012 Census of Agriculture - County Data (n.d.): n. pag. United State Department of Agricutlure.
USDA National Agricultural Statistics Service, 2 May 2014. Web. 2 July 2015.
"Nursery, Greenhouse, Floriculture, Sod, Mushrooms, Vegetable Seeds, and Propagative Materials Grown for Sale: 2012
and 2007." 2012 Census of Agriculture - State Data (n.d.): n. pag. United State Department of Agricutlure. USDA
National Agricultural Statistics Service, 2 May 2014. Web. 2 July 2015.
Nursery, Greenhouse, Floriculture, Sod, Mushrooms, Vegetable Seeds, and Propagative Materials Grown For Sale: 2012
and 2007. N.p.: USDA National Agricultural Statistics Service, n.d. 2012 Census of Agriculture - County Data.
Web. 2 July 2015.
Robbins, James, Dr. "Starting a Greenhouse Business (Part 1) Some Basic Questions." (n.d.): n. pag. University of
Arkansas Division of Agriculture. University of Arkansas Division of Agriculture, 28 Oct. 2013. Web. 2 July 2015.

~ 16 ~
Freshwater Coast Greenhouse/Floriculture Feasibility Study
The study was funded by the Freshwater Coast Community Foundation Entrepreneurial Education Grant Program that
was awarded to Clemson University Cooperative Extension Service.
Clemson University Cooperative Extension Service offers its programs to people of all ages regardless, of race, color, sex,
religion, national origin, disability, political beliefs, sexual orientation, marital or family status and is an equal
opportunity employer.
On behalf the Project Team, we would like to thank all of the people who collaborated to this project with their expertise
and support.
Authors
Joe McNinch, Clemson University
Will Ferreira, FCCF-Clemson University Cooperative Extension Service Alliance
Collaborations
Cody White, Clemson University
Sally Caldwell, Erskine College
Lance Tade, West Carolina Rural Telephone Cooperative