frequency of tidal storm surge at new york harbor (new york) and newark bay (new jersey)
TRANSCRIPT

Coastal Engineering, 6 (1982) 281--298 Elsevier Scientific Publishing Company, Amsterdam -- Printed in The Netherlands
281
FREQUENCY OF TIDAL STORM SURGE AT NEW YORK HARBOR (NEW YORK) AND NEWARK BAY (NEW JERSEY)
ARMANDO BALLOFFET t, MICHAEL L. SCHEFFLER= and THOMAS F. SERGP
t Tippetts-Abbett-McCarthy-Stratton (TAMS) New York, N Y (U.S.A.) and Columbia Uni;,cvsity, New York, N Y (U.S.A.) = Stone & Webster Engineering Corporation Boston, MA 02107 (U.S.A.)
Tippetts.Abbett-McCarthy-Stratton (TAMS), New York, N Y (U.S.A.)
(Received July 7, 1981; accepted for publication February 10, 1982)
ABSTRACT
Balloffet, A., Scheffler, M.L. and Sergi, T.F., 1982. Frequency of tidal storm surge at New York Harbor (New York) and Newark Bay (New Jersey). Coastal Eng., 6: 281-- 298.
A joint probability analysis of storm tides is made for the Battery, New York (U.S.A.), and Newark Bay, New Jersey (U.S.A.). Storm tides are caused by either low-pressure coastal storms (northeasters) or hurricanes. The analysis uses existing gage data at the Battery to construct frequency/probability curves of peak surge elevations and tidal amplitudes. These are used in a computer program to combine standard storm surge stages and tidal stage curves to produce an artificial storm tide with given peak elevation and incremental frequency. These peak elevations and incremental frequencies are ranked to produce cumulative frequency curves for northeasters and hurricanes. A fre- quency curve is obtained for Newark Bay via correlation.
INTRODUCTION
The results of a probability analysis of storm tides for the Battery, New York, and Newark Bay, New Jersey, are presented (Fig. 1). The joint prot~ ability analysis is used to determine the frequency of storm tides induced by either northeaster or hurricane storms. A storm tide represents a combina- tion of several factors: prevailing mean sea level (MSL); astronomic tidal phase and range; and storm surge. Each of these varies as a function of time and can have an assigned frequency or probability that is statistically inde- pendent. These assigned frequencies and probabilities are determined from gage records and predicted astronomic tides.
The joint probability technique has been applied to coastal flooding by Myers (1970). Subsequent investigations (Myers and Overland, 1977; Ha, 1977) have been completed along the east coast from Florida to New Jersey for th e National Weather Service. This study has been performed by Tippetts, Abbett, McCarthy Stratton (TAMS) for the Federal Emergency Management
0378-3839/82/0000-0000/$02.75 O 1982 Elsevier Scientific Publishing Company

282
÷ BRONX
LONG ISLAN[
E,4$T RIVER
EAST NEWARK
NEWARK
HOBOKEN
QUEENS
ELIZABETH
OF LIBERTY
ISLAND
BROOKLYN JFK
STATEN ISLAND
;OW£R NEW YORK BRY
RARITAN BAY
Fig. 1. Location map.
Agency (FEMA). The joint probability method is used in this paper to assign frequencies
to various combinations of tidal phases and ranges and storm surges. _
Analysis of existing- gage data.Obsv~ i ~ stage Ve~us referred to a p r e V ~ g MSL;. s e p m ~ " i n t 0 ~ o i i O m i c ~ d s ~ m Surge components, and C~sifiedas northeaster or hUrriC~e' eVents. •
283
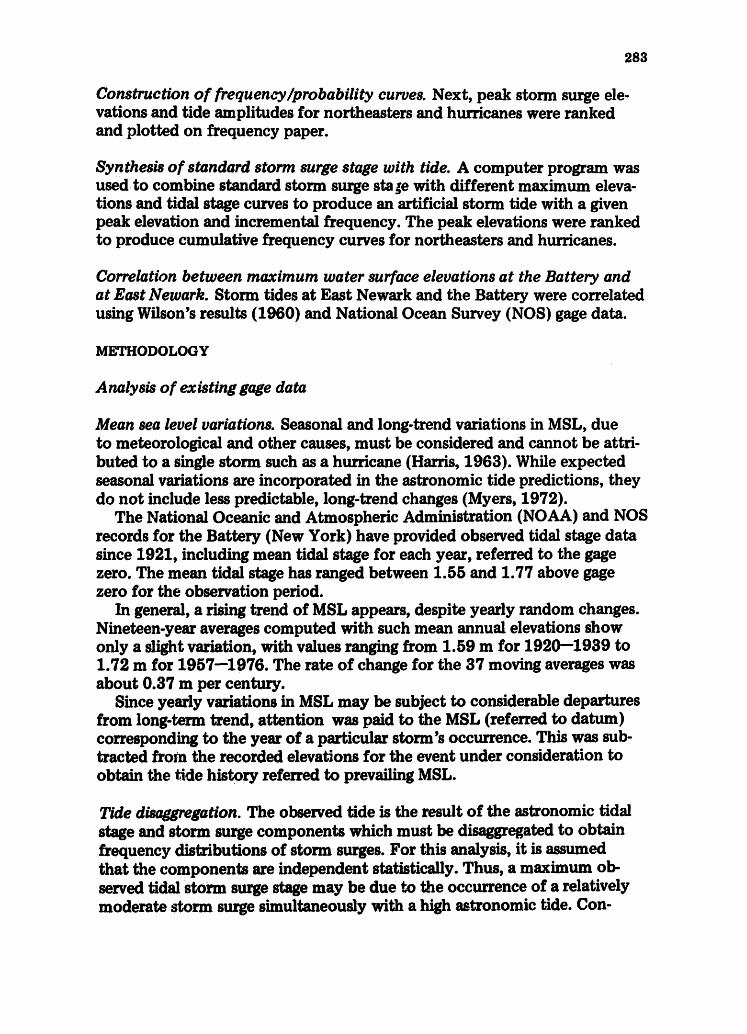
Construction of frequently~probability curves. Next, peak storm surge ele- vations and tide amplitudes for northeasters and hurricanes were ranked and plotted on frequency paper.
Synthesis of standard storm surge stage with tide. A computer program was used to combine standard storm surge sts je with different maximum eleva- tions and tidal stage curves to produce an artificial storm tide with a given peak elevation and incremental frequency. The peak elevations were ranked to produce cumulative frequency curves for northeasters and hurricanes.
Correlation between maximum water surface elevations at the Battery and at East Newark. Storm tides at East Newark and the Battery were correlated using Wflson's results (1960) and National Ocean Survey (NOS) gage data.
METHODOLOGY
Analysis of existing gage data
Mean sea level variations. Seasonal and long-trend variations in MSL, due to meteorological and other causes, must be considered and cannot be attri- buted to a single storm such as a hurricane (Harris, 1963). While expected seasonal variations are incorporated in the astronomic tide predictions, they do not include less predictable, long-trend changes (Myers, 1972).
The National Oceanic and Atmospheric Administration (NOAA) and NOS records for the Battery (New York) have provided observed tidal stage data since 1921, including mean tidal stage for each year, referred to the gage zero. The mean tidal stage has ranged between 1.55 and 1.77 above gage zero for the observation period.
In general, a rising trend of MSL appears, despite yearly random changes. Nineteen-year averages computed with such mean annual elevations show only a slight variation, with values ranging from 1.59 m for 1920--1939 to 1.72 m for 1957--1976. The rate of change for the 37 moving averages was about 0.37 m per century.
Since yearly variations in MSL may be subject to considerable departures from long-term trend, attention was paid to the MSL (referred to datum) corresponding to the year of a particular storm's occurrence. This was sub- tracted from the recorded elevations for the event under consideration to obtain the tide historY referred to prevailing MSL.
Tide disaggrvgation. The observed tide is the result of the astronomic tidal stage and storm surge components which must be disaggregated to obtain frequency distributions of storm surges. For this analysis, it is assumed that the components are independent statistically. Thus, a maximum ob- served tidal Storm surge stage may be due to the occurrence of a relatively moderate storm surge simultaneously with a high astronomic tide. Con-

284
versely, an extraordinary storm surge, if it occurs at low astronomic tide, will produce a moderate tidal surge stage. This was the case in the 1950 north- easter surge (Pore and Barrientos, 1976).
The astronomic tide component was assumed equal to the predicted tide for the date and time of the storm surge. Predicted high- and low-tide stages were available from 1963 to present, In addition, tidal constituents were used to compute the astronomic tides for the period from 1926 to 1962, using the standard harmonic equation (Schureman, 1958). For this, a com- puter program was written to determine high and low tidal stages and their times of occurrence. The results of this program were checked with published values.
A disaggregation computer program analyzed observed tidal stage and ob- tained the storm surge. This program computed the differences between ob- served and predicted tidal stage over a given time interval.
HT t TI HI+2, TZ+~ ./
.
J J ÷ t T I M E
Fig. 2. Sinusoidal interpolation, schematic.
The recorded and predicted tidal stages were entered as two sequences of maxima and minima, referred to yearly MSL prevailing during the storm. The program sinusoidally interpolates between observed and predicted maxi- mum and minimum tidal stages. Intermediate points are computed at A T- hour increments for the duration of the storm as shown in Fig. 2. The for- mula used for the intermediate points between any high and low value is as follows:
!...:-.,l ) hj = . 2 sin ~ ( 2 ' j - T z ) + P X 1.5708, +R (i)
where
//I+ I ; Hz = the input values of successive, high or low tidal stages Ti = time of the predicted or observed tide

285
J TP P
R h
= time index where Tr. 1 ~> Tj >I T~ = tidal period (T~÷ 1 - Tz) • 2 = phase constant P = 3 when Hz+ 1 ~> Hz
P= I when Hz.1 <~ H~ = datum reference = (/-/i + HI ÷ 1 ) / 2 ffi tidal stage at time Tj
After all points for the observed and predicted tidal stages are computed, the values for the predicted tidal stage are subtracted from the observed tidal stage at each time interval.
The analysis was prefaced by an inspection of the history of promising storms, as recorded by the Monthly Weather Review weather tracking charts and the Corps of Engineers.
A total of 563 northeaster events were analyzed for the period between . .
1926 and 1976, and their peak storm surge elevations were ranked by the program. A total of 22 hurricane events similarly were analyzed for the period between 1963 and 1976 for candidate storms selected by TAMS (Neumann et at., 1978). There storm analyses were added to those made for the period starting in 1926 (Wilson, 1960; Harris, 1963; and Pore and Barrientos, 1976).
Construction of frequency probability curves
Frequency distribution of peak surges at the Battery. Frequency distribu- tions for northeaster and hurricane surges at the Battery were determined by ranking the values obtained using the procedures described above.
Figures 3 and 4 show these two cumulative distribution curves. The surge computed for Hurricane Donna (1960) is 1.62 m, which is 0.3 m less than estimated by Gofseyeff and Panuzio (1962) because it was computed using MSL prevailing in September 1960 rather than datum MSL. This was in agreement with Harris (1963).
Probability distribution of astronomic tides at the Battery. To establish a probability of astronomic tides at the Battery, only range variations occur- ring at ~he spring-neap cycle and phase changes during the semi-diurnal cycle were considered.
Following the procedure used by Myers (1970), it was assumed that the amplitude probability obtained for the January tide represents the north- easter season, while the amplitdue probability obtained for September rep- resents the hurricane season.
Using the aforementioned program for tide generation from tidal consti- tuents, high tides (referred to MSL) were obtained and ranked in equal class intervals for each January and September between 1950 and 1968. This period of 19 years covers a complete cycle in the tide generation. Figures 5 and 6 show the probability curves. Probabilities were computed as the ratios

-i
z Is
•
..
i,
• •
~..
:,
...
..
,.,
' ~
.,~ 76
.~e,
:
~
I.SO
! .~
.,,e
5
..
.'ii;
HIG
H
.:~
. '~
s
• .
.~.
• -.:
~
6as
.. ~1
.
,. -
~OO
s 4
5 :~
• .
t O
9 01
1 0
7
0,1
0.S
0.
4 0
5
02
Q
I 0.
OS
0011
001'
0-O
li 0J
0S
00
4
0~)3
FR
EQ
UE
NC
Y
PE
R Y
EA
R
Fill.
3.
Cum
ulat
ive
dist
ribu
tion
cur
ve.
Nor
thea
ster
sur
ges
at t
he B
atte
ry (
New
Yor
k).
1950
J f
f
LEG
EN
D
A
Igii
3-1
9?
tl
DE
TA
ILE
D S
AM
PLE
0 Il
l2i*
IliT
G
SA
MP
LE
W
ITH
LE
SS
O
lET
&IL
ED
li
2Q
-liI
S
PO
NT
ION
~L-
LOW
P
RO
JEC
TIO
N
CU
RV
E '
.
HIG
H I
~IIO
dEC
TIQ
N C
UR
VE
.
L0W
P
N)J
OO
Z 00
1000
9 0
00
7
00
06
00
04
•000
3
tO
O0
,/

287
ZOO
oo
I ";'5 - -
f ,50 - -
t.25 - -
w
I,=. z 1.00 - - o
E ~ 0 .75 - -
0 . 5 0 - -
O.Z5
O o
J O
o.oo i ! I I . [ I . I I . . . . . I I I I _ I I I ,J J tO 0.9 O~ 0.7 0.6 0.5 0.4 ~ 3 0,2 0.10090.0800"r 0.06 005 0 0 4 005 002
FREQUENCY PER YEAR
O.Of
Fig. 4. Cumulative distribution curve. Hurricane surges at the Battery (New York) 19o-7--1976.
1.25
1.00
s, bJ 0.75 I - k~
p z o 0.SO
0.~5
I J . . I I I I I I .. I, I I i ! . 1 . I .... I I I , I I I 0.0l 0 ~ 04 0.Z 0.S ! 2 ~, 10 Z0 30 40 50 60 70 80 90 ~ 98 99 99a gg.• 99,g9
A C C U M U L A T E 0 PERCENT
Fig. 5' Probability distribution of predicted high tide. The Battery (New York) 1950-- 1968.

288
! Z 5
I .Ol
0.?~
• - - . j
V - - -
0.50
0.25
t I I I I ~! [ _1 i I l I I I . I I i 1 I, 1 1 0-0! 005 0.1 02. 05 ! 2 5 10 20 30 40 50 60 70 80 90 95 96 99 90.e 9g.9 99.~J
ACCUMULATE~O PI='RC[ NT
Fig. 6. Probability distribution of predicted high tide. The Battery (New York) 1950-- 1968.
of the number in each class to the total number of high tides computed for each month. Next, the semi-diurnal tides were represented by sinusoids with variable semi-amplitudes having the same frequency distribution as the high tides, according to the following expression:
H,,=A, sin(~pX IX t )
where At TP t
(2)
= mean semi-amplitude for class interval with assigned probability f = tidal period (12.4 hours) = the time interval assigned (1.0333 hours) by dividing the tidal period
into twelve equal increments. = index in the semi-diurnal cycle (1 to 12)
The frequency ascribed to each astronomic tide computed with the above expression was assumed equal to f/12. The values of H~t were ranked and classified in equal class intervals.
Synthesis of standard storm surge stage with tide
Model surges. Standard shapes for northeaster and hurricane surges were a d o p ~ f o r s t 0 ~ , t i d e frequency ~ y ~ s , with the m ~ p t i 0 n tha t fre- quenCieS ign~ to their cOrgespoti~g peaks Could be ~n'b~ tO the corresponding surge time histories.

289
Northeaster surge standard shape. To obtain a standard shape for northeaster surges, a study was made of the largest of these surges on record which oc- curred in 1950 and 1953. The shapes of these surges were assumed represen- tative of typical northeasters. Figure 7 presents the standard shape derived in this manner.
Both surges lasted for 48 hours or longer and showed a crest segment with a duration of about 12 hours. The shape of this crest segment could be approximated by two symmetrical second-degree parabolas with the difference between thecrest elevation and the elevations within six hours of the crest given by y = ax 2.
,~PARASOLA
* I i I
0 24 6 I 1 . [6 , . 24
30 20 IO I0 20 30
T I M E { H O U R S )
Fig. 7. Nor theas te r surge. S tandard shape.
The rising and falling limbs of the surge shape beyond six hours before or after the crest time were assumed to be straight lines; the total base time for the surge hydrograph was established at 48 hours. The ordinates at both ends of the surge were assumed equal to 0.15 m. The area under the hydro- graph, therefore, could be established if the crest elevation, H, and the ele- vation, d, at six hours before or after the crest, are known.
When mean ordinates obtained with the standard shape and mean ordi- nates obtained with the 1950 and 1953 surges were compared, it was con- cluded that, assuming d = 0.45 H would result in a crest with a shape which, applied to the v~lues of H resulting from the historic surges, would have areas reasonably close to the areas under the historic surges for the 48-hour base time. This resulted m the following expression for the parabola co- efficient:
a = 0.015277778 H
Hurricane surge standard shape. The hurricane surge shape differs from the northeaBter surge irt that it is usually shorter and may present alternations wi~h a period of the same order of magnitude as the normal semi-diurnal tide period.
Wilson (1960) has derived standard storm surge shapes which have been used in previous studies (TAMS, 1970, 1975). It was decided to apply this shape' to the hurricane surgP, used for this study, since it would be consis-

290
tent with previous investigations. Then, to adjust the surge hydrograph to a given maximum height, all ordinates of the standard shape were changed proportionally, without changing base time. -
Figure 8 shows the hurricane surge ordinates normalized with respect to its peak. It also shows that the positive part of the surge could be approxi- mated to the standard shape used for northeaster surges, with adequate adjustment of the parabola coefficient, straight portion of the risin[~-limb, and corresponding durations. The negative part of the surge would not be relevant to the determination of the highest level obtained by shifting the occurrence of the surge on an astronomic tide.
I " 0 . ' Z t9
0,i 0 W N
0 Z O ~
--0-1
- 0 . ;
- 0 . !
- 0.4
/v
/
T I M E { H O U R S )
Fig. 8. Hurricane surge. Standard shape. ,~ r
Flood studies made for coas~d areas are concerned mostly with maxJmtml sea elevations produced by storm tides, Therefore, the abov~mentioned fr~ quency analysis of peak elevations is adequate for flood studies inthat case.
Peak elevation probability in e s ~ ~ e ;~eas, where there ~ e no suitable gage records, must be o b ~ e d by calculating derived tides through routing the tidesat the mouth. While peak e!evation at the mouth is determinant

291
of p robab ih~Sf inunc~a'tion at seaward areas, surge volumes become more i m p o ~ t h e determination of peak eleva~ons in areas located further upland. If enough storage volume is available, a higher short-duration surge at the mouth of a tidal stream may result in a lower elevation inland ths~z a lower, but longer, surge.
Frequency distribution o f tide and surge. The surges were class~i~d in equal class intervals according to Figs. 3 and 4, and their mean v a l ~ 8f, were paired with the corresponding incremental frequency valuf~ f' (occurrences per year).
Next, the frequency of occurrence of a given s u r g c ~ a k in conjunction with an astronomic tide phase was obtained as the~ '~duct : ff'/12.
The following step was construction of hydro~.phs for either hurricane or northeaster surges as fitte~ to the surge vai,~/Sf, and adding them to the astronomic tide computed with the sinuso[~ ~f~equation 2, using a phase so that Hit corresponded to the max~r,~m, sl~,~g~ St,. The surge hydrograph was then shifted by A T increments and a maximum surge height was computed for each shift. Various increments using a finer time step were tried with little variation in the final computed frequencies. Tl~is was done using an aggregation computer program.
The maximum ordinate of such compound tide was obtained and a fre- quency f f ' /12 was ascribed to it. These maximum ordinates were classified in order of decreasing magnitude, and cumulative frequency distribution curves were obtained for the occurrence of northeaster and hurricane ~tor.~, tides at the Battery.
Finally, in order to obtain a cumulative frequency distribution of storm surge stage at the Battery, the northeaster and hurricane distributions were combined. Since both frequencies may be assumed to be related to inde- pendent events occurring during one year, the combined frequency of oc- currence of a given high water elevation is equal to the sum of the partial frequencies due to either northeasters or hun'icanes.
Correlation betwee~ maximum water surface elevations at the Battery and at East Newark
The above-described studies ],ave. been done using records available a'~ the Battery (New York). Wilson (1960) established graphical correlations of storm-tide elevations between Fort Hamilton and various points in the ~ a of New York Bay, including East Newark Bay . /~ i s correlation may be used to transpose storm tides from the Battery to ~ast Newark, and may be written approximately as follows:
= 1 . 0 6 HF. HEN = maximum storm tide at East ~ewark (meters, MSL) HFH = maximum storm tide at Fort ~Iamilton (meters, MSL)

292
To obtain the above relationship Wilson used h~trly obse~ked tidal stage data obtained for the 1938 and 1944 hurricanes and for thd~950 and 1953 northeaster, which may be considered appropriate examples of critical events for ~'ooth kinds of s~.orms.
For th~ study an additional correlation analysis was made using the re- corded da~y maximum elevations at the Battery and at East Newark Bay, L~.~otead of~using simultaneous elevations recorded for each storm. This was done to c~.~k the correlation analysis made by Wilson, because transient lc;cal conditions might be conducive to random errors in the reiationqhip between m~zimum elevations at both stations obtained from p ~ s ofsimul- taneous obs~vations. In addition, this correlation analysis refers to maxi- mum elevati~s at East Newark, rather than to the progression of such levels before ~ after the peak.
The correlat~ela~.,lat~\analysis was made using 77 pairs of peak tidal stages covering t h e p e ~ b e t w e e n 1938 and 1970. This series does not h-lclud~ the tide produced by Hurricane Donna (1960) at East Newark, which was not included in the available records for these studies, as the gage was not operational during the storm.
The following relationships were.used for the convlation analysis: linear, log-log, and semi-log. The linear relationship resulted ii,. the least standard error of estimate and was given by the following expressions:
HES ffi 1.03 HB + 0.07 (meters)
R ffi 0.96 (correlation coefficient)
r = 0,08 (standard error of the estimate, meters)
This correlation was etermined with elevations at the Battery (HB) varying between 1.08 and 2.;~9 mMSL, the latter corresponding to the northeaster of 1953, which was the second highest elevation in the 51-year record between 1926 and 1976.
DISCUSSION OF RESULTS
Tide-frequency distribution at the Battery (New York)
The extrapolation of the frequency distribution of northeaster surges ap- pears to be difficult because of the 1950 storm surge. Figure 3 shows two plausible extrapolation lines drawn visually giving different weight to its representative point.
In addition, Fig. 3 shows two different distributions for the lower north- easter surges, corresponding respectively to the analyses made witha detailed sample from 1963 to 1976, and with the complete sample from 1926 to 1976. It appears that the long ~unple did not include some l0WS~es which o c c ~ before 1963 and; therefore, their frequencies m a y b e understated.
To test the sensitivity of then0rtheaster Surge frequency in the determina-
298
tion of the frequency of ',.;he storm tides, two differe~ distributions were used. The first included ~ c high protection line shov~ ;~Fig. 3 for the occasional surges, and the lower line for the more freque~t~surges, provided by the 1926--1976 sample. The second distribution included the low pro , ~c t io n line shown on Fig. 3 and the higher line for the more frequent surges, provide4 by the 1963--1976 sample.
The aggregation program was used to combine the SepteL~ber and January astronomic tides and the northeaster and hurricane surges, respectively
• - ~ t e
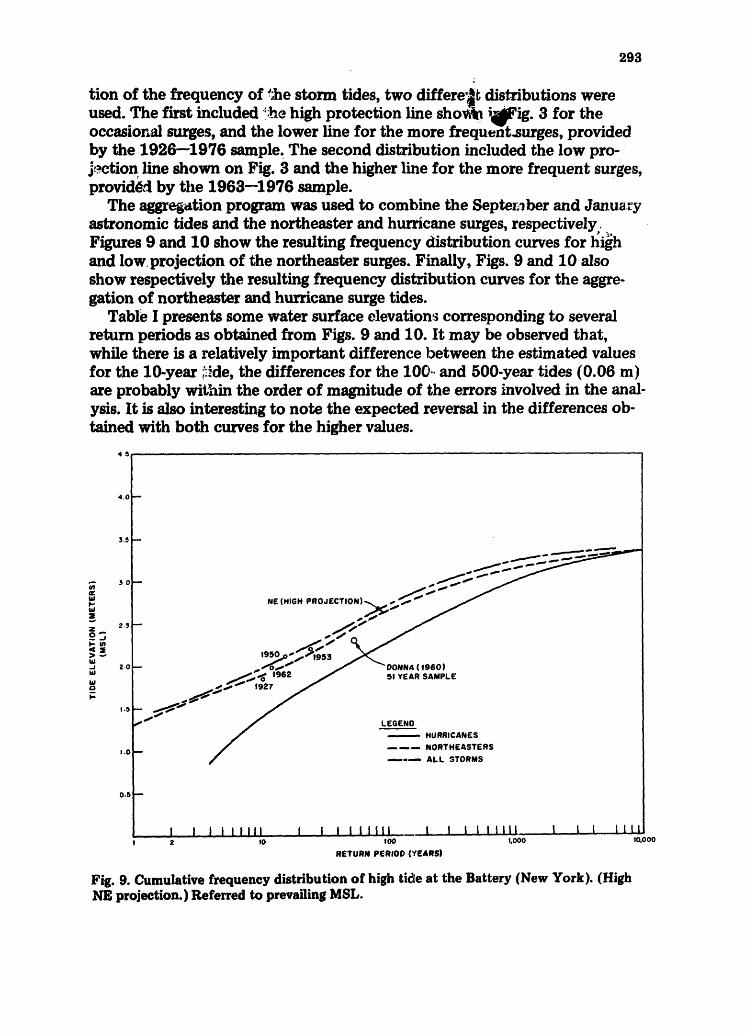
Figures 9 and 10 show the resulting frequency distribution curves for high and low projection of the northeaster surges. Finally, Figs. 9 and 10 also show respectively the resulting frequency distribution curves for the aggre- gation of northeaster and hurricane surge tides.
Table I presents some water surface elevation~ corresponding to several return periods as obtained from Figs. 9 and 10. It may be observed that, while there is a relatively important difference between the estimated values for the 10-year ~:~de, the differences for the 100.. and 500-year tides (0.06 m) are probably within the order of magnitude of the errors involved in the anal- ysis. It is also interesting to note the expected reversal in the differences ob- tained with both curves for the higher values.
45
O1 iv #- tU I
Z o5 i - i n
lu
r-
4.0
3.5
30
2.5
2.0
1.5
J.O
0.5
N [ (HIGH P R O J E C T I O N ) ~
- . ~ "
~_ 1962 * ~ , w 1927
_ >.~~ p ~
DONNA(1960) SIYEAR SAMPLE
LEGENO • HURRICANES
- - - - , , - - N O R T H E A S T E R S
- - - - - - - - - , A L L STORMS
t I I I l l l i l i l I l l i l l l i i I I l l l l l 1 [ I s o I o o I, ooo
RETURN PERIOD (YEARS)
I I I 10,000
Fig. 9. Cumulative frequency distribution of high tide at the Battery (New York). (High NE projection.)Referred to prevailing MSL.

294
4.5
4 . 0 ~
3 . 5
~ 2 .0
1.5
1.0
0.5
O0
,NE (LOW PROJECTION) , ~ j ~ , ~ . - ~ . v
/ ~.~.~.~- _ (
. , ~ f w~ ~ ,,- . . . N O R T H E A S T E R . ~ ~ • HURRICANES S
1 I I I I I I I I I I I l l l i l l I I I i l l l l l I i I I I I I 2 10 tOO ~)00 10,000
RETURN PE,,o0 ~VEARS~ Fig. 10. Cumulative frequency distribution of high tide at the Battery (New York) (low NE projection). Referred to prevailing MSL.
TABLE I
Surge tide elevations at the Battery
Return period (years)
Elevations (m, MSL)
Fig. 9 Fig. 10 Recommended , . =
10 1.98 2.16 1.98 100 2.71 2.77 2.71 500 3.08 3.02 3.02.
It may be concluded, that the use of any one of the northeaster distribu- tion curves does not change significantly the resulting estimates within the frequency range used (100 and 500 years) to delineate the basic floodiines in Federal Flood Insurance Studies. For comparison, points corresponding to recorded high tides have been plotted:on Fig. 9, where the circles depict the plotting positions of thee!evationsco~responding to the five highest
vailing during the occurrence of. the Sto~.~ i ~ m a Y ~ o b s e r v ~ t i i a t the p0si-

295
tion for the tide of hurricane Donna (1960) is plotted at 2.35 m MSL, com- pared with the recorded 2.50 m referred to the 1929 datum. The difference of 0.21 m is close to the difference between the 1960 MSL and the 1929 MSL datum. The plotted points show that the joint frequency curve result- ing from the "high projection" northeaster frequency curve fits the north- easter points and that it is conservative with respect to the plotting position of the 1960 hurricane tide. It is recommended, therefore, that this curve be used for frequency analyses involving up to the 100-year event.
On the other hand, the high projection curve would tend to give too much weight to the plotting position of the surge of 1950, which probably had a return period considerably longer than 51 years, although no information was available to ascertain this fact. It is recommended that the low projec- tion curve be used for events with return periods of more than 200 years.
Figure 11 shows the recommended frequency curve for the Battery (New York) where the fivehighest recorded elevations again have been plotted for comparison. All elevations shown are referred to prevailing MSL.
4 ~
4 0
3 5
3.0
2 5 v
" " 2 .0
t . 5
1.0
O.S
m
~THE BATTERY ( N . Y )
~ . o . ~ -~953 ~ ~O.NA 119601
1 9 2 7
I I I i I I I I I I i I I I I I l i I I I I t l l l l I I I I I I i i 2 10 100 I.O00 IO~)O0
R E T U R N PERIOD ( Y E A R S )
Fig. 11. Frequency distribution curves, high storm tides at the Battery (New York) and East Newark (New Jersey). Referred to prevailing MSL.
Tide-frequency distribution at East Newark (New Jersey)
Table II shows elevations computed for East Newark alternatively using the two correlation formulas presented before. It may be observed that
296
TABLE II
Surge tide elevations at East Newark (referred to prevailing MSL)
Return period (years) Wilson's correlation (m) High tide correlation(m)
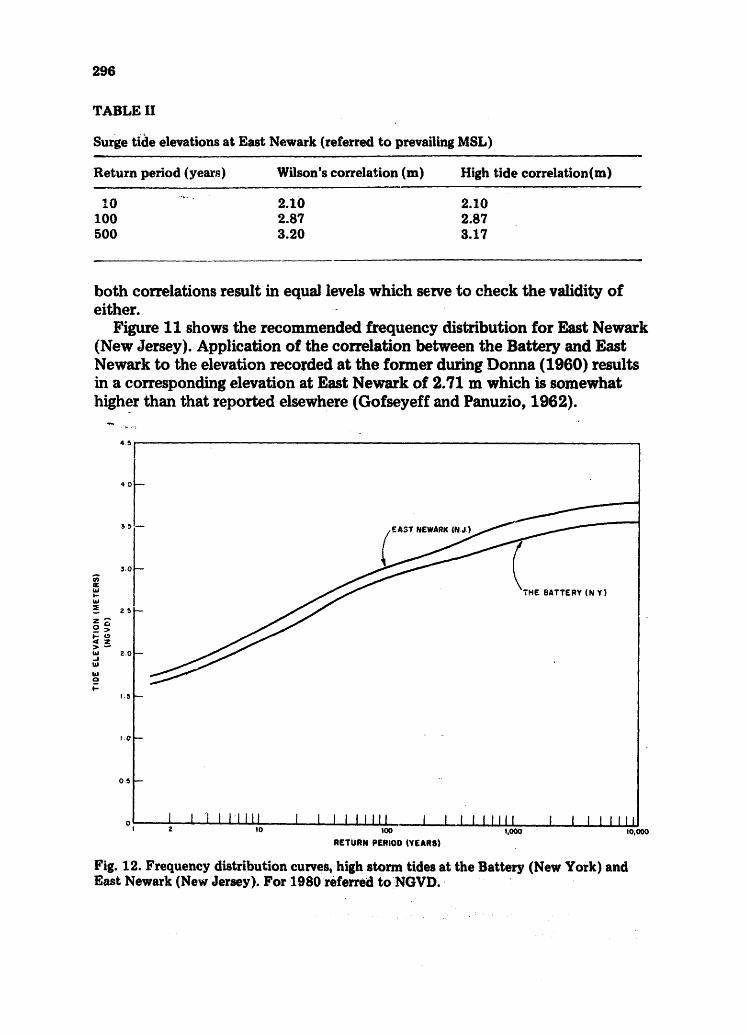
I0 ...... 2.10 2.10 100 2.87 2.87 500 3.20 3.17
both correlations result in equal levels which serve to check the validity of either.
Figure 11 shows the recommended frequency distribution for East Newark (New Jersey). Application of the correlation between the Battery and East Newark to the elevation recorded at the former during Donna (1960) results in a corresponding elevation at East Newark of 2.71 m which is somewhat higher than that reported elsewhere (Gofseyeff and Panuzio, 1962).
¢r W
W
45 I
40
1 0
0 S
o I .I ] 1 i ' 1111 I I I I ! 1 1 1 1 . I I I I ! 1 1 1 1 I i I 1 I I I I 2 I0 I00 1,000 I0,000
n~Tus~ p~.~oo ~V~ARS~
Fig. 12. Frequency distribution curves, high storm tides at the Battery (New York) and East Newark (New Jersey), For 1980 referred to NGVD, ~

297
TABLE III
Surge tide elevations. 1980 estimate (m, NGVD)
R~eturn period (years) The Battery (New York)
10 100 500
2.13 2.90 3.20
East Newark (New Jersey) , _ J l j
2.29 3.05 3.35
Comparison of surges
The foregoing study has shown that, for a given frequency, the northeaster surge tides at the Battery are higher than the hurricane surge tides up to a return period of around 1000 years for the low projection northeaster curve. This period is better than 10,000 years for the high protection northeaster surge curve.
Adjustment of frequency curve for planning (1980)
As stated above, the elevation frequency curves presented in Figs. 9, 10, and 11 have been referred to MSL prevailing at the year of occurrence of the storm. To refer these curves to the National Geodetic Vertical Datum of 192Ff(NGVD), it is necessary to correct the elevations to take into considera- tion the change in MSL from 1929 to the date used for planning. The correc- tion for 1980 is approximately 0.18 m, which should be added to the eleva- tions shown for each frequency. ~-
Figure 12 shows the recommended 1980 ~ Frequency curves for the Battery and Ea~ Newark. Table III shows tidal ele~ ~tions for the Battery and East Newark for return periods of 10, 100 and 500 years.
ACKNOWLEDGMENTS
These studies were made by Tippetts.Abbett-McCarthy-Stratton (TAMS) under a contract with the Federal Emergency Management Agency. The per- mission granted to publish the results is appreciated.
Mr. John Laudano and Mr. Alfonso Perdomo, TAMS, Civil Engineers, greatly a~sisted in the reduction of storm data for the computer program analyses. Their efforts are acknowledged.
REFERENCES
Gofseyeff, S. aud Panuzio, F.L., 1962. Hurricane studies of New York Harbor. P~oc. ASCE WW1, ~.merican Society of Civil Engineers, New York, February, pp. i--28.

298
Harris, D.L., 1963. Characteristics of the hurricane storm surge. Weather Bureau Tech. Pap. No. 48. U.S. Department of Commerce, Washington, D.C., 139 pp.
Ho, F.P., 1977. Hurricane tide frequencies on the Atlantic coast. Proc. 15th Coastal Eng. Conf., American Society of Civil Engineers, New York, pp. 19---22.
Myers, V.A. and Overland, J.E., 1977. S~orm tide frequencies for Cape Fear River. J. Waterway, Port, Coastal Ocean Div., 103 (WW4): 519--535.
Myers, V.A., 1970. Joint probability method of tide frequency analysis applied to Atlan- tic City and Long Beach Island, New Jersey. U.S. Department of Commerce, Environ- mental Science S~rvices Administration, Weather Bureau, Washington, D.C., 10g pp.
Heumann, C.J. et p~., 197 8. Tropical Cyclones of the North Atlantic Ocean, 1871--1977. National Climat~ Center, Asheville, N.C., 170 pp.
Pore, N.A. and Barrientos, C.S., 1976. Storm Surge, Marine Ecosystems Analysis (MESA) Program, New York Bight Project, Atlas Monograph 6, New York Sea Grant Institute, Albany, N.Y., 44 pp.
Schureman, P., 1940. A manual of harmonic analysis and prediction of tides. Published by U.S.C. & G.S., No. 98, Washington, D.C., (1958 reprint), 317 pp.
Swanson, R.L., 1976. Tides. Marine Ecosystems Analysis (MESA) Program, New York Bight Project, Atla~ Monograph 4, New York Sea Grant Institute, Albany, N.Y., 34 pp.
Tippetts-Abbett-McCarthy-Stratton, 1970. Reclamation and flood protection works along the Hackensack River from its mouth to Omdell Reservoir. Report presented to the New York District, U.S. Army Corps of Engineers, New York, N.Y., July, 35 pp.
Tippetts-Abbett-McCarthy-Stratton, 1975. Hackensack Meadowlands mathematical study. Report presented ~o the New York District, U.S. Army Corps of Engineers, New York, N.Y., June, 45 pp.
U.S. Department of Commerce, National Oceanic and Atmospheric Administration, National Ocean Survey, 1979. Tide tables, high and low water predictions, Washington, D.C., 293 pp.
Wilson, B.W., 1960. The prediction of hurricane storm-tides in New York Bay. Beach Erosion Board, Office of the Chief of Engineers, Corps of Engineers, R.M. 120, Washing. ton D.C., 170 pp.