freestanding communities workgroup · pdf file · 2017-12-18the official moti on at...
TRANSCRIPT

Metro Vision Issues Committee Agenda June 3, 2015 Page 1
REVISED AGENDA
METRO VISION ISSUES COMMITTEE
Wednesday, June 3, 2015 4 p.m.
1290 Broadway First Floor Boardroom
1. Call to Order 2. Public Comment
The chair requests that there be no public comment on issues for which a prior public hearing has been held before the Board of Directors. Please note the public will have the opportunity to speak on specific items on the Metro Vision Plan between the staff presentation and committee discussion.
3. Summary of May 6, 2015 Meeting (Attachment A)
ACTION ITEMS
4. *Move to direct staff to work with the Transportation Advisory Committee to develop 2016-2021 TIP Waiting List recommendations for MVIC’s consideration
(Attachment B) Steve Cook, MPO Planning Manager, Transportation Planning & Operations
5. *Move to recommend to the Board of Directors Metro Vision foundational measures
and targets as agreed to during the meeting (Attachment C) Brad Calvert, Metro Vision Manager, Regional Planning & Operations Time will be allotted after the staff presentation for the public to provide comment on this
item prior to MVIC deliberation. Those providing comment will be limited to 3 minutes.
INFORMATIONAL ITEM
6. Presentation on key elements from the Connected Region (transportation) element of Metro Vision
(Attachment D) Jacob Riger, Transportation Planning Coordinator, Transportation Planning & Operations
*Motion Requested
Persons in need of auxiliary aids or services, such as interpretation services or assisted listening devices, are asked to contact DRCOG at least 48 hours in advance of the meeting by calling (303) 480-6701

Metro Vision Issues Committee Agenda June 3, 2015 Page 2
ADMINISTRATIVE ITEMS 7. Other Matters 8. Next Meeting – July 1, 2015 9. Adjournment

ATTA
CH
A
3

METRO VISION ISSUES COMMITTEE MEETING SUMMARY May 6, 2015
MVIC Members Present: Bob Roth – Aurora; Eva Henry – Adams County; Bill Holen – Arapahoe County; Sue Horn – Bennett; Tim Plass – Boulder; Elise Jones – Boulder County; George Teal – Castle Rock; Cathy Noon – Centennial; Tim Mauck – Clear Creek County; Robin Kniech – Denver; Roger Partridge – Douglas County; Ron Rakowsky – Greenwood Village; Shakti – Lakewood; Phil Cernanec – Littleton; Jackie Millet – Lone Tree; Ashley Stolzmann – Louisville; John Diak – Parker; Val Vigil – Thornton; Herb Atchison – Westminster. Others present: Larry Mugler – Arapahoe County; Mac Callison – Aurora; Daniel Dick – Federal Heights; Kent Moorman – Thornton; Tim Kirby – CDOT; Will Toor – Southwest Energy Efficiency Project; Max Gibson – Jefferson County Public Health; Brad Weinig, Tiana Patterson – Enterprise Community; Jennifer Schaufele, Executive Director, and DRCOG staff. Call to Order The meeting was called to order at 4:03 p.m.; a quorum was present. Public Comment No public comment was received. The chair noted that a separate public comment period would be provided in between the staff presentation on agenda item #4 and committee discussion. Summary of April 1, 2015 Meeting The summary was accepted as submitted. Presentation on Metro Vision Foundational Measures Brad Calvert, Metro Vision Manager, provided a briefing on the foundational measures (FM) as outlined in the agenda materials. Will Toor, Southwest Energy Efficiency Project, commented on foundational measure 6, related to Greenhouse Gas Emissions. He expressed support for strengthening the goal, which is currently at 60 percent reduction. The various foundational measures were introduced and members participated in informal polling on the foundational measures to determine those that members wanted to discuss further. Foundational measures (FM) 8, 7, 10, 9a and 9b (with non-road related modes added), 2, and 1a (moving forward as performance measure), were not identified by members for further discussion. FM 6 – some members felt the target should be higher than 60 percent, some felt 60 percent was a good target. Staff was asked to provide additional data on whether 60 percent is the correct goal. Jackie Millet moved to re-vote on FM 6 based on the discussion and information provided by staff. The motion to re-vote was seconded and passed unanimously.
4

Metro Vision Issues Committee Summary May 6, 2015 Page 2 The vote to support FM 6 was 14 in favor and 2 opposed. Members agreed to move FM 6 forward with a target of 60 percent. Jackie Millet noted that she was told by Lone Tree staff the vote to move the foundational measures forward to MVIC was not unanimous, as staff reported. Staff noted while the informal straw polls on the individual foundational measures may not have been unanimous, the official motion at the end to move the slate of foundational measures forward was unanimous. FM 3 – Members asked for additional information on the modeling used for this measure. Some members felt that the measure shouldn’t include a target, as the Board doesn’t have influence over housing or transportation costs. Others felt that there are opportunities to effect change in these areas, such as with transportation dollars. FM 9a and 9b – while these measures weren’t discussed, members agreed to move both 9a and 9b forward. FM 4 – Staff noted the data used in the measure is set by HUD through the American Community Survey. A suggestion was made rather than using a number; the same “band” of data should be used as the survey is updated. Due to time constraints, discussion on foundational measures 1, 3, 4, and 5 will continue at the June meeting. Staff was directed to bring back additional information based on discussion by members. Robin Kniech requested that data be provided in the memo. Presentation on key elements from the Connected Region (transportation) element of Metro Vision Due to time constraints, this presentation was deferred to the June meeting. Other Matters No other matters were discussed. Next Meeting The next meeting is scheduled for June 3, 2015. Adjournment The meeting adjourned at 6:00 p.m.
5

ATTA
CH
B
6

To: Chair and Members of the Metro Vision Issues Committee From: Jennifer Schaufele, Executive Director 303-480-6701 or [email protected]
Meeting Date Agenda Category Agenda Item # June 3, 2015 Action 4
SUBJECT Development of protocols and a rank-ordered waiting list of projects eligible for future funding in the 2016-2021 Transportation Improvement Program (TIP), should additional funds become available.
PROPOSED ACTION/RECOMMENDATIONS Direction to staff to work with the Transportation Advisory Committee (TAC) to develop recommendations for MVIC.
ACTION BY OTHERS N/A
SUMMARY The final step in completing the 2016-2021 Transportation Improvement Program (TIP) document is to develop protocols and a rank-ordered waiting list of projects eligible for future funding in the 2016-2021 TIP, should additional funds become available. The TIP approved by the DRCOG Board in April contained a placeholder (Appendix E) for the insertion of the waiting list. There are nearly $300 million worth of TIP project requests currently eligible for the waiting list. These projects had all applied for the TIP, but were not selected for funding. It is impossible to know if or how much additional federal funding may become available to DRCOG during the 4-year TIP cycle. As a result, the development of a waiting list is important so a new call for projects doesn’t have to be conducted, which would enable more timely allocation of the funding surplus. Past TIP waiting lists have proven very useful in this respect. There are optional methods for creating the project waiting list, considering such attributes as project score and the type of project, or other criteria. Specific protocols must also be established for selecting projects from the waiting list. Type of funds, as well as how close to the next TIP cycle funds become available will be among the variables considered. Staff requests the opportunity to work with TAC to develop waiting list and protocol recommendations for MVIC’s consideration later this summer.
PREVIOUS DISCUSSIONS/ACTIONS April 15, 2015 – DRCOG Board approval of 2016-2021 TIP
PROPOSED MOTION Move to direct staff to work with the Transportation Advisory Committee to develop 2016-2021 TIP Waiting List recommendations for MVIC’s consideration
7
Metro Vision Issues Committee June 3, 2015 Page 2
ATTACHMENT Link: 2016-2021 TIP ADDITIONAL INFORMATION
If you need additional information, please contact Jennifer Schaufele, Executive Director, at 303-480-6701 or [email protected]; or Steve Cook, MPO Planning Manager, at 303-480-6749 or [email protected].
8

ATTA
CH
C
9

To: Chair and Members of the Metro Vision Issues Committee From: Jennifer Schaufele, Executive Director 303-480-6701 or [email protected]
Meeting Date Agenda Category Agenda Item # June 3, 2015 Action 5
SUBJECT MVIC will continue discussion and recommend to the Board of Directors foundational measures for inclusion in Metro Vision.
PROPOSED ACTION/RECOMMENDATIONS Recommend initial foundational measures and targets to the Board of Directors for inclusion in Metro Vision.
ACTION BY OTHERS At MVIC’s request TAC provided guidance on Foundational Measures 3, 6, 7, 8, 9a, 9b and 10.
SUMMARY Item #4 on MVIC’s May 6, 2015 agenda sought action on the proposed foundational measures for Metro Vision. Discussion and straw polling in May indicated that MVIC may be ready to advance several of the proposed foundational measures for Board consideration. Four foundational measures were either not discussed or there was direction to continue the discussion in June. Each proposed foundational measure and its status is shown below: Foundational Measure (FM) Baseline Target Status
1 Share of the region’s housing and employment located in urban centers
9.3 percent of housing (2014)
36.3 percent of employment (2014)
Increase to 25 percent of region’s housing and 50 percent of region’s employment by 2040
Will be discussed in June
2 Housing density within the urban growth boundary/area (UGB/A)
1,300 units per square mile (2014)
25 percent increase between 2014 and 2040
Covered at May MVIC
3
Share of the region’s population living in areas with combined housing and transportation costs less than or equal to 45 percent of income for the regional typical household
41 percent (2013) Increase to 50 percent by 2040*
Discussion not completed at May MVIC – will be discussed in June
4 Share of the region’s households earning less than $50,000 per year that are housing cost burdened
69.4 percent (2013) Decrease to 60 percent by 2040
Discussion not completed at May MVIC – will be discussed in June

Metro Vision Issues Committee June 3, 2015 Page 2
Foundational Measure (FM) Baseline Target Status
5
Share of the health facilities located in urban centers, in rural town centers, or within ½ mile of a rapid transit station or ¼ mile of a high-frequency bus stop
54.4 percent (2013) Increase to 75 percent by 2040
Will be discussed in June
6 Surface transportation related greenhouse gas emissions per capita
26.8 lbs./person (2010) 60 percent decrease between 2010 and 2040
Covered at May MVIC
7 Non-SOV (single occupancy vehicle) mode share to work
25.5 percent (2013) Increase to 35 percent by 2040
Covered at May MVIC
8 Daily vehicle miles traveled (VMT) per capita
25.4 daily VMT per capita (2010)
Reduce 10 percent from the 2010 level by 2040
Covered at May MVIC
9a Average travel time variation (TTV) (peak vs. off-peak)
1.22 (2011) 1.33 or less Covered at May MVIC
9b Person delay per trip 1.7 minutes (2015) 2 minutes or less Covered at May MVIC
10 Number of traffic fatalities 176 (2013) Less than 100 per year by 2040
Covered at May MVIC
In June MVIC will focus on Foundational Measures 1, 3, 4, and 5. A synthesis of information previously provided to MVIC follows. The information below also includes staff responses to questions posed by MVIC during previous meetings.
FM 1: Share of region’s housing and employment located in urban centers
Foundational Measure (FM) Baseline Target
1 Share of the region’s housing and employment located in urban centers
9.3 percent of housing (2014)
36.3 percent of employment (2014)
Increase to 25 percent of region’s housing and 50 percent of region’s employment by 2040
Synthesis of information previously provided: • In Metro Vision 2035 the Board established a target of accommodating 50
percent of new housing and 75 percent of new employment in designated urban centers between 2005 and 2035.

Metro Vision Issues Committee June 3, 2015 Page 3
o Available employment datasets do not distinguish between employment moving within the region and new jobs created, or jobs moving into the region from outside the region – therefore it is not possible to track “new” employment.
o The proposed alternative approach would track the overall share of the region’s housing and employment located in urban centers.
o Achieving the current Metro Vision 2035 target would result in 22 percent of region’s housing and 48 percent of region’s employment being located in urban centers in the year 2040.
• Recent trends show that housing and employment grew faster in urban centers than it did in the region. o The share of region’s housing located in urban centers grew 1.0 percentage point
to 9.3 percent (2006-2014). Projecting this trend forward, the share of the region’s housing in urban centers would increase to 12 percent by 2040.
o The share of region’s employment located in urban centers grew 1.3 percentage points to 36.3 percent (2005-2014). Projecting this trend forward, the share of the region’s employment in urban centers would increase to 43 percent by 2040.
• Scenarios DRCOG staff explored in 2013 revealed the positive impact of
focusing growth in urban centers. o Scenarios that focused growth in urban centers and in other areas well-served by
transit reduced VMT per capita. Scenarios that did not focus housing and employment growth in urban centers and in other areas well-served by transit showed VMT per capita increasing or remaining flat when compared to current assumptions.
o Urban center- and transit-focused growth scenarios had the highest percentage of trips to work via non-SOV modes when compared to other modeled scenarios. These scenarios also showed the greatest decrease in GHG emissions per capita.
• Urban center designations and boundary adjustments may help meet the target. o Through the Metro Vision amendment process local governments can designate
new and revised urban centers – more urban centers could result in a larger share of population and employment in these areas (e.g. 39 FasTracks stations currently do not have an associated urban center).
o Early urban center designations focused on concentrations of employment uses and not the more balanced approach (housing and employment) that is more typical of recent designations. Future adjustments to existing urban center boundaries could focus on including housing located just outside existing employment-focused centers.
MVIC questions during May discussion: • MVIC did not discuss FM 1 in May – no clarifying questions were asked.

Metro Vision Issues Committee June 3, 2015 Page 4
FM 3: Share of the region’s population living in areas with combined housing and
transportation costs less than or equal to 45 percent of income for the regional typical household
Foundational Measure (FM) Baseline Target
3
Share of the region’s population living in areas with combined housing and transportation costs less than or equal to 45 percent of income for the regional typical household
41 percent (2013) Increase to 50 percent by 2040*
Synthesis of information previously provided: • Housing and transportation are typically the two largest components of a
household budget. o Researchers have identified 45% of income as a key affordability benchmark for
combined housing and transportation costs.
• The original proposed measure and target used a regional average of combined housing and transportation costs calculated with a new model – the Location Affordability Index (LAI) version 2 – from USDOT and HUD. Staff’s thinking on this measure has evolved over the past few months (see information below and following bullet). o Staff previously expressed some concern about the LAI version of the Housing +
Transportation costs model: The HUD/DOT model introduced a complicated new approach with no
additional statistical estimation advantage. Ongoing HUD/DOT commitment to updates remains unclear. Low resolution of detail: LAI model results only available down to Census
Tract o MVIC and TAC discussions revealed concern about using a regional average that
“washes out” the variance between sub-areas in the region that may experience very different transportation cost impacts on households.
• The Center for Neighborhood Technology (CNT) recently updated neighborhood
level (Census Block Group) data – Housing and Transportation (H+T) Affordability Index. o CNT originally developed the H+T methodology, but at the time the initial measure
and target were proposed the supporting data was significantly out of date. CNT recently integrated updated neighborhood-level data with a revised transportation cost estimation model.
Metro Vision Issues Committee June 3, 2015 Page 5
o Staff met with one of the original developers of the H+T Index and gained more confidence in the underlying data and model assumptions:
The CNT model is more straightforward and has a more proven statistical approach when compared to the LAI model
CNT has an ongoing commitment to update both the underlying data and the model (extending back to 2006 – which also allows for benchmarking)
Better data resolution at the neighborhood scale (Census Block Group vs. Census Tract)
• In May, MVIC considered the TAC recommended revision to this measure. TAC recommended a measure that would quantify the percentage of the region’s residents living in areas that fell below the affordability benchmark (45%). DRCOG staff is supportive of the TAC recommendation.
MVIC questions during May discussion: • Can the wording of the proposed foundational measure be simplified?
o Staff proposal: “Share of region’s population living in areas with housing and transportation costs affordable to the typical household in the region.”1
• Can staff provide info about how widely used the model is and how much work went into its development? o Staff is aware of several regional entities using the H+T data for a variety of
applications: Knoxville, TN (TPO) Washington DC (MWCOG) San Francisco (MTC) Minneapolis-St. Paul (Metropolitan Council) Chicago (CMAP) States and cities are also using this data
o CNT released the first version of the H+T Index in 2006. The second version, using data from Census 2010 came out in 2011. CNT released the third version at the end of March.
o CNT has continued to develop and refine the H+T Index with funding support from federal government partners and non-profit foundations.
Each version has been subjected to the scrutiny of academics and other peer reviewers (e.g. through the Transportation Research Board).
o The H+T Index is now in a suite of CNT tools called the “Location Efficiency Hub.”
1 The term “affordable to the typical household” can be documented as “45 percent of income” in a manner similar to the term “housing cost burdened” and the “30 percent of income” guideline for housing cost burdened status.

Metro Vision Issues Committee June 3, 2015 Page 6
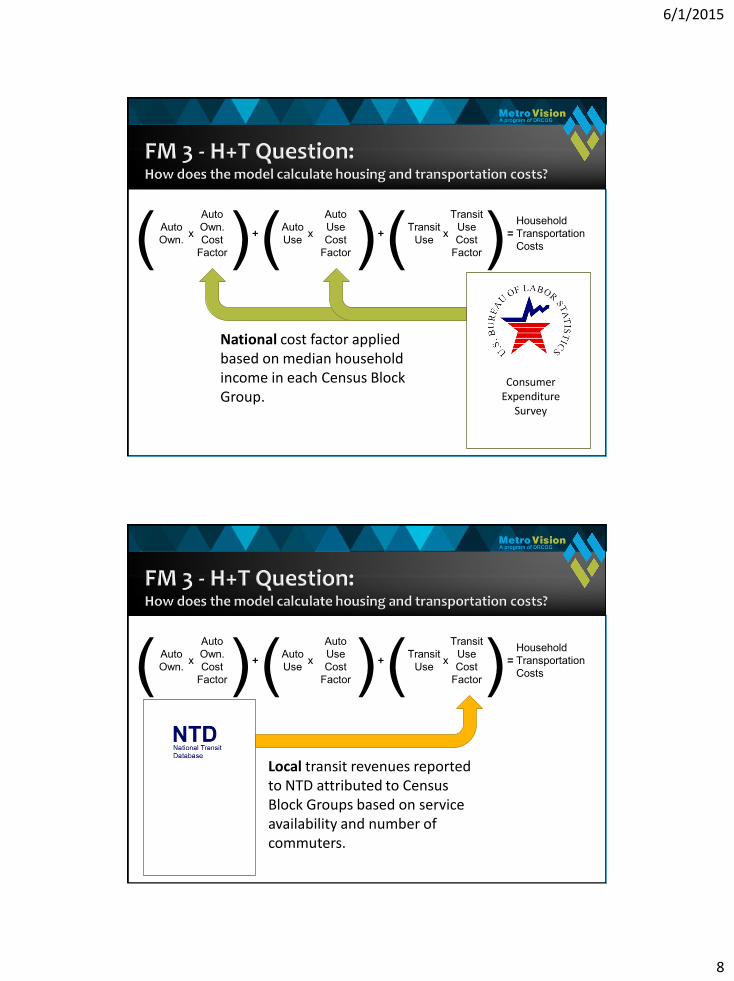
• How does the model calculate housing and transportation costs? o Housing cost data is pulled directly from observed data in the US Census Bureau’s
American Community Survey (ACS). o Figure 1 below graphically illustrates how transportation costs are estimated. o Under the TAC recommendation DRCOG staff would identify each Census Block
Group in the region where housing plus transportation costs are lower than or equal to 45% of the income for the regional typical household. The total population in these Census Block Groups would be used to determine the share of the region’s population living in areas with H+T costs below the 45% affordability benchmark.
Figure 1. Household Transportation Cost Estimation
• What modes of travel are represented in the H+T Index?
o Transportation costs are estimated based on auto ownership, auto use, and transit use.
o While there are no walking or bicycling costs, neighborhoods with predictive variables that suggest higher rates of walking and bicycling are assigned lower estimated auto ownership and auto use costs.
• Does the region have the ability to “move the needle” toward the target on this
measure? o Chicago’s regional plan points to the importance of supporting transportation
alternatives and shortening trips to reduce the costs of congestion and travel for all residents.
o In April DRCOG staff noted the connection other proposed foundational measures have with household transportation costs. Reducing VMT would lower fuel and maintenance costs and increasing the share of people using non-SOV modes to
( Auto Own.* x
Auto Own. Cost
Factor† ) + ( Auto Use* x
Auto Use Cost
Factor† ) + ( Transit Use* x
Transit Use Cost
Factor‡ ) = Household Transportation Costs
* - Observations of the independent/predictor variables – median household income, household size, commuters per household, household residential density, walkability and street connectivity, transit connectivity and access, and employment access and diversity – are used to estimate the dependent variables of auto ownership, auto use, and transit use at the neighborhood level (Census Block Group).
† - Cost factors for auto ownership and auto use are derived from the national Consumer Expenditure Survey (CES) from the US Bureau of Labor Statistics (BLS). Median household income for a neighborhood (Census Block Group) is used to apply the appropriate cost factor.
‡ - The cost factor for transit use is derived from RTD fare box revenue as reported to the National Transit Database (NTD). Revenues are attributed to each county based on the number of stops and frequency of trips. County sub-totals are then attributed proportionally to a neighborhood (Census Block Group) based on the number of transit commuters as observed in the ACS.

Metro Vision Issues Committee June 3, 2015 Page 7
travel to and from work may contribute to more households that are able to reduce the total number of cars in their household – which will impact the fixed costs of auto ownership and associated costs.
FM 4: Share of the region’s households that are housing cost burdened (spending
30% or more of income on housing) Foundational Measure (FM) Baseline Target
4 Share of the region’s households earning less than $50,000 per year that are housing cost burdened
69.4 percent (2013) Decrease to 60 percent by 2040
Synthesis of information previously provided: • Being housing cost burdened occurs when a household pays more than 30
percent of their gross household income towards housing costs. o For renters: rent, utilities (if not paid for by landlord) o For owners: mortgage payments, utilities, and condominium or mobile home fees
(where appropriate) o The spending patterns of these households are impacted - ultimately the region’s
economic growth and local sales tax revenues may also be impacted. • In April, MVIC asked staff if this measure could be focused on different income
levels. o Staff subsequently provided information on the different “income bands” the ACS
uses to report this data (less than $20,000; $20,000 to $34,999; $35,000 to $49,999; $50,000 to $74,999; and $75,000 or more).
o In May staff recommended modifying the measure to focus on households earning less than $50,000 per year.
75% of all housing cost burdened households in the region earn less than $50,000 per year.
Between 2010 and 2013, the percentage of households earning less than $50,000 that were housing cost burdened increased from 68.1% to 69.4%.
o Staff also provided information on an alternative, focusing on households earning less than $75,000 per year.
90% of all housing cost burdened households in the region earn less than $75,000 per year.
Between 2010 and 2013 the percentage of households earning less than $75,000 that were housing cost burdened remained at 57.2%.
o Between 2010 and 2013, the percentage of all households that were housing cost burdened decreased from 38.3% to 36.2%.

Metro Vision Issues Committee June 3, 2015 Page 8
MVIC questions during May discussion: • Is there a way to focus on certain households without specifying a specific
income number? o The American Community Survey (ACS) collects these data from a sample of
households on a rolling monthly basis. ACS aggregates samples into one-, three-, or five-year periods. The Census Bureau determines the “income bands” that are reported. A measure focusing on specific income levels, rather than a regional total of cost burdened households, will need to rely on data provided by the ACS.
• Does the region have the ability to “move the needle” toward the target on this
measure? o The Healthy, Inclusive and Livable Communities element of the DRAFT Metro
Vision plan notes several regional and local actions that can contribute to a region where “diverse housing options meet the needs of residents of all ages, incomes and abilities” – a core plan outcome defined by ad hoc working group of Board members that focused on integrating the issue of housing into Metro Vision. Three example actions proposed by the ad hoc group are listed below.
Regional: Convene local government officials and housing experts to identify ways to expand affordable, accessible workforce and senior housing development opportunities in local communities.
Local: Review local plans and regulations to ensure they encourage a mix of housing types and densities.
Local: Consider incentives to support affordable, accessible, workforce and senior housing, particularly within centers and other areas that are or may be served by transit.
FM 5: Share of health facilities in urban centers, in rural town centers, or near high frequency transit
Foundational Measure (FM) Baseline Target
5
Share of the health facilities located in urban centers, in rural town centers, or within ½ mile of a rapid transit station or ¼ mile of a high-frequency bus stop
54.4 percent (2013) Increase to 75 percent by 2040
Synthesis of information previously provided: • Proposed measure offers one way to gauge the ability of the region’s residents
to access health care. o Increased access to health facilities benefits patients/clients, and it also connects
workers to places of employment in a rapidly growing employment sector.

Metro Vision Issues Committee June 3, 2015 Page 9
• Between 2006 and 2013, the share of health facilities in urban centers, 2014 rural town centers, within ½ mile of 2014 rapid transit stations, or within ¼ mile from 2014 high frequency bus stops remained around 55%. o 2006: 55.3% (440 of 796) o 2009: 53.2% (499 of 938) o 2013: 54.4% (653 of 1201)
• Promising trends that may work in favor of the region achieving this target
include: o The rapid transit network expansion will connect existing facilities and open up new
sites for development o As a rapidly growing job sector future urban centers may form around major health
facilities throughout the region. MVIC questions during May discussion: • MVIC did not discuss FM 5 in May – no clarifying questions were asked.
PREVIOUS DISCUSSIONS/ACTIONS Previous MVIC Metro Vision Discussions/Actions: May 7, 2014 – MVIC Meeting Summary June 4, 2014 – MVIC Meeting Summary July 2, 2014 – MVIC Meeting Summary August 6, 2014 – MVIC Meeting Summary October 1, 2014 – MVIC Meeting Summary February 4, 2015 – MVIC Meeting Summary March 4, 2015 – MVIC Meeting Summary April 1, 2015 – MVIC Meeting Summary May 6, 2015 – MVIC Meeting Summary
PROPOSED MOTION Move to recommend to the Board of Directors Metro Vision foundational measures and targets as agreed to during the meeting.
ATTACHMENT Presentation Slides – Metro Vision Foundational Measures (continued) – 6/3/2015 Draft Metro Vision Plan (consolidated based on MVIC feedback) - Link
ADDITIONAL INFORMATION If you need additional information, please contact Jennifer Schaufele, Executive Director, at 303-480-6701 or [email protected]; Brad Calvert, Metro Vision Manager, Regional Planning and Operations at 303-480-6839 or [email protected]

6/1/2015
1
Staff Presentation
Public Comment Revised process outlined in April Board packet
MVIC Deliberation and Action Focus on Foundational Measures 1, 3, 4, and 5
Action: Motion(s) to recommend foundational measures and targets to Board of Directors

6/1/2015
2
Foundational Measure Context Metro Vision Principles Metro Vision Key Terms DRAFT Metro Vision Outcomes
Protects and enhances the
region’s quality of life
Is aspirational, long-range and
regional in focus
Offers ideas for local
implementation
Respects local plans
Encourages communities to work together
Remains dynamic and flexible
Established in 1992

6/1/2015
3
Outcomes Where do we want to be?
Strategies and Actions How can we get there (“move the needle”)?
Measures How can we tell if we’re
getting there?
Foundational Measure (FM) Baseline Target Status
1 Share of the region’s housing and
employment located in urban centers
9.3 percent of housing (2014) 36.3 percent of employment (2014)
Increase to 25 percent of region’s housing and 50
percent of region’s employment
by 2040
Will be discussed in June
2 Housing density within the urban growth boundary/area (UGB/A)
1,300 units per square mile (2014)
25 percent increase between 2014 and 2040
Covered at May MVIC
3
Share of the region’s population
living in areas with combined housing and transportation costs less than or equal to 45 percent of income for the regional typical household
41 percent (2013) Increase to 50 percent by 2040*
Discussion not completed at May MVIC – will be discussed in June
4 Share of the region’s households
earning less than $50,000 per year that are housing cost burdened
69.4 percent (2013) Decrease to 60 percent by 2040
Will be discussed in June
5
Share of the region’s health
facilities located in urban centers, in rural town centers, or within ½ mile of a rapid transit station or ¼ mile of a high-frequency bus stop
54.4 percent (2013) Increase to 75 percent by 2040 Will be discussed in June

6/1/2015
4
Foundational Measure (FM) Baseline Target Status
6 Surface transportation related greenhouse gas emissions per capita
26.8 lbs./person (2010)
60 percent decrease between 2010 and 2040
Covered at May MVIC
7 Non-SOV (single occupancy vehicle) mode share to work
25.5 percent (2013) Increase to 35 percent by 2040 Covered at May MVIC
8 Daily vehicle miles traveled (VMT) per capita
25.4 daily VMT per capita (2010)
Reduce 10 percent from the 2010 level by 2040
Covered at May MVIC
9a Average travel time variation (TTV) (peak vs. off-peak) 1.22 (2011) 1.33 or less Covered at May MVIC
9b Person delay per trip 1.7 minutes (2015) 2 minutes or less Covered at May MVIC
10 Number of traffic fatalities 176 (2013) Less than 100 per year by 2040 Covered at May MVIC
Foundational Measure (FM) Baseline Target
1 Share of the region’s housing and employment
located in urban centers
9.3 percent of housing (2014) 36.3 percent of employment (2014)
Increase to 25 percent of region’s housing and 50
percent of region’s
employment by 2040
3 Share of the region’s population living in areas with
combined housing and transportation costs less than or equal to 45 percent of income for the regional typical household
41 percent (2013) Increase to 50 percent by 2040
4 Share of the region’s households earning less than
$50,000 per year that are housing cost burdened 69.4 percent (2013) Decrease to 60 percent by 2040
5 Share of the region’s health facilities located in urban
centers, in rural town centers, or within ½ mile of a rapid transit station or ¼ mile of a high-frequency bus stop
54.4 percent (2013) Increase to 75 percent by 2040

6/1/2015
5
Foundational Measure (FM) Baseline Target
1 Share of the region’s housing and
employment located in urban centers
9.3 percent of housing (2014)
36.3 percent of employment (2014)
Increase to 25 percent of region’s housing and 50
percent of region’s employment by 2040
Housing 2006-2014: +1.0 percentage point
Employment 2005-2014: +1.3 percentage points
• Trend includes recession
• Does not account for future designations or boundary adjustments
2040 (Based on Trend):
Housing: 12%
Employment: 43%
Foundational Measure (FM) Baseline Target
1 Share of the region’s housing and
employment located in urban centers
9.3 percent of housing (2014)
36.3 percent of employment (2014)
Increase to 25 percent of region’s housing and 50
percent of region’s
employment by 2040
Target extrapolated from Metro Vision 2035:
• 50% of new housing
• 75% of new employment
Apply 2040 Projections assuming
50/75 target
• 22% share of region’s housing in urban centers
• 48% share of region’s employment in urban centers
6/1/2015
6
Foundational Measure (FM) Baseline Target
3
Share of the region’s population
living in areas with combined housing and transportation costs less than or equal to 45 percent of income for the regional typical household
41 percent (2013) Increase to 50 percent by 2040
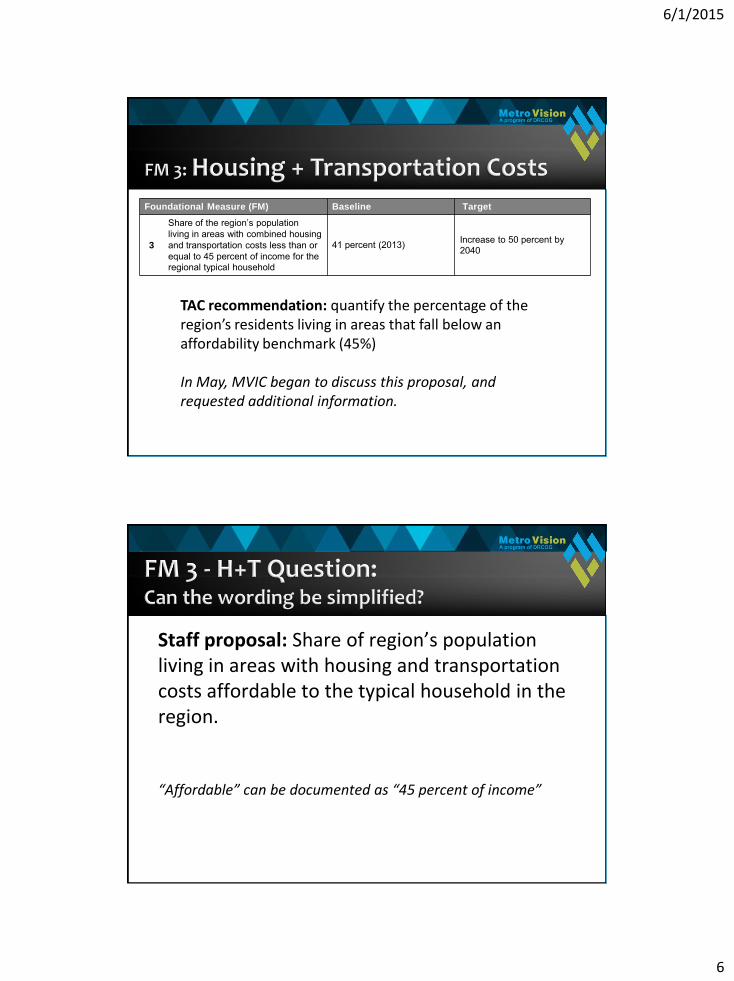
TAC recommendation: quantify the percentage of the region’s residents living in areas that fall below an affordability benchmark (45%) In May, MVIC began to discuss this proposal, and requested additional information.
Staff proposal: Share of region’s population living in areas with housing and transportation costs affordable to the typical household in the region. “Affordable” can be documented as “45 percent of income”

6/1/2015
7
( Auto Own. x
Auto Own. Cost
Factor ) + ( Auto Use x
Auto Use Cost
Factor ) + ( Transit Use x
Transit Use Cost
Factor ) = Household Transportation Costs
( Auto Own. x
Auto Own. Cost
Factor ) + ( Auto Use x
Auto Use Cost
Factor ) + ( Transit Use x
Transit Use Cost
Factor ) = Household Transportation Costs
Local independent/predictor variables used to statistically estimate these three dependent variables Census Block Group.
6/1/2015
8
( Auto Own. x
Auto Own. Cost
Factor ) + ( Auto Use x
Auto Use Cost
Factor ) + ( Transit Use x
Transit Use Cost
Factor ) = Household Transportation Costs
National cost factor applied based on median household income in each Census Block Group.
Consumer Expenditure
Survey
( Auto Own. x
Auto Own. Cost
Factor ) + ( Auto Use x
Auto Use Cost
Factor ) + ( Transit Use x
Transit Use Cost
Factor ) = Household Transportation Costs
Local transit revenues reported to NTD attributed to Census Block Groups based on service availability and number of commuters.

6/1/2015
9
Reduce VMT Support transportation alternatives Shorten trips Mix land uses
Opportunity in the region to reduce cars/household
fuel and maintenance
costs
car payments, insurance, etc.
Foundational Measure (FM) Baseline Target
4 Share of the region’s households
earning less than $50,000 per year that are housing cost burdened
69.4 percent (2013) Decrease to 60 percent by 2040
Housing cost burdened: households spending 30% or more of their income on housing
• Adverse impacts on household spending patterns • Risks regional economic growth • Limits local sales tax revenues

6/1/2015
10
Foundational Measure (FM) Baseline Target
4 Share of the region’s households
earning less than $50,000 per year that are housing cost burdened
69.4 percent (2013) Decrease to 60 percent by 2040
Original Proposal: Foundational Measure (FM) Baseline Target
Orig. 4
Share of the region’s households
that are housing cost burdened 36.2 percent (2013) Reduce to 25 percent by 2040
Current Proposal: Focuses on households earning less than $50,000
Foundational Measure (FM) Baseline Target
4 Share of the region’s households
earning less than $50,000 per year that are housing cost burdened
69.4 percent (2013) Decrease to 60 percent by 2040
Households 2010 2011 2012 2013
Less than $50,000
Cost Burdened 296,571 294,449 296,661 299,094
Not Cost Burdened 138,832 133,483 132,383 131,764
Total in Categories 435,403 427,932 429,044 430,858
% Cost Burdened 68.1% 68.8% 69.1% 69.4%
Households 2010 2011 2012 2013
Less than $75,000
Cost Burdened 363,713 361,623 361,845 361,485
Not Cost Burdened 271,897 268,038 268,702 270,300
Total in Categories 635,610 629,661 630,547 631,785
% Cost Burdened 57.2% 57.4% 57.4% 57.2%

6/1/2015
11
DRAFT Outcome 14: Diverse housing options meet the needs of residents of all ages, incomes and abilities
Regional: Convene local government officials and
housing experts to identify ways to expand affordable, accessible workforce and senior housing development opportunities in local communities.
Local: Review local plans and regulations to ensure they encourage a mix of housing types and densities.
Local: Consider incentives to support affordable, accessible, workforce and senior housing, particularly within centers and other areas that are or may be served by transit.
Examples of Actions Proposed by Ad Hoc
Group
Foundational Measure (FM) Baseline Target
5
Share of the region’s health facilities
located in urban centers, in rural town centers, or within ½ mile of a rapid transit station or ¼ mile of a high-frequency bus stop
54.4 percent (2013) Increase to 75 percent by 2040
• 2006: 55.3% (440 of 796)
• 2009: 53.2% (499 of 938)
• 2013: 54.4% (653 of 1201)
Obtained past years’ data from CDPHE
• No changes from past materials

6/1/2015
12

A
TTAC
H D
31

To: Chair and Members of the Metro Vision Issues Committee From: Jennifer Schaufele, Executive Director 303-480-6701 or [email protected]
Meeting Date Agenda Category Agenda Item # June 3, 2015 Information 6
SUBJECT Staff will provide an overview of the transportation element of the draft Metro Vision plan: A Connected Multimodal Region.
PROPOSED ACTION/RECOMMENDATIONS No action requested. This item is for information.
ACTION BY OTHERS N/A
SUMMARY The transportation element of the March 2015 draft Metro Vision Plan is titled: A Connected Multimodal Region. This element will become the policy basis for the new Metro Vision Regional Transportation Plan (MVRTP) being prepared this year. As with other Metro Vision elements, the draft transportation element was shaped by stakeholder input, particularly from the Transportation Advisory Committee (TAC) and Metro Vision Planning Advisory Committee (MVPAC). Three key desired regional outcomes are identified:
• A well-connected, regional multimodal transportation system • A safe, dependable, and efficiently-operated transportation system • A transportation system contributing to a better quality of life
For each outcome, further objectives, strategies, and supportive actions are described in the element. Several performance measures are also identified to help track the region’s progress toward the transportation objectives. Five of those measures are proposed as foundational measures with associated performance targets, which MVIC has been reviewing. Staff will provide a thorough overview of the draft A Connected Multimodal Region element of Metro Vision and ask for MVIC input and guidance.
PREVIOUS DISCUSSIONS/ACTIONS N/A
PROPOSED MOTION N/A
LINK March 2015 Draft: A Connected Multimodal Region element of Metro Vision
ADDITIONAL INFORMATION If you need additional information, please contact Jennifer Schaufele, Executive Director, at 303-480-6701 or [email protected], or Jacob Riger, Transportation Planning Coordinator, at 303-480-6751 or [email protected].
32