frdc report – project 2008/085
TRANSCRIPT

Assessing possible environmental causes behind the reduced
colonisation of Western Rock Lobster puerulus collectors by
a wide suite of speciesFRDC Report – Project 2008/085Simon de Lestang – Department of Fisheries
Jason How – Department of Fisheries Shelley Foster – University of Western Australia
Fisheries Research Report No. 218, 2011
Fisheries Research Division Western Australian Fisheries and Marine Research Laboratories PO Box 20 NORTH BEACH, Western Australia 6920
Fisheries Research andDevelopment Corporation
Australian Government

ii Fisheries Research Report [Western Australia] No. 218, 2011
Correct citation:
de Lestang, S., How, J. and Foster, S. (2011). Assessing possible environmental causes behind the reduced colonisation of Western Rock Lobster puerulus collectors by a wide suite of species. FRDC project 2008/085. Fisheries Research Report No. 218. Department of Fisheries, Western Australia. 60pp.
Enquiries:
WA Fisheries and Marine Research Laboratories, PO Box 20, North Beach, WA 6920 Tel: +61 8 9203 0111 Email: [email protected] Website: www.fish.wa.gov.au ABN: 55 689 794 771
A complete list of Fisheries Research Reports is available online at www.fish.wa.gov.au
© Department of Fisheries, Western Australia. April 2011. ISSN: 1035 - 4549 ISBN: 978-1-921845-15-4
Copyright Fisheries Research and Development Corporation and Department of Fisheries 2011.
This work is copyright. Except as permitted under the Copyright Act 1968 (Cth), no part of this publication may be reproduced by any process, electronic or otherwise, without the specific written permission of the copyright owners. Information may not be stored electronically in any form whatsoever without such permission.
Disclaimer
The authors do not warrant that the information in this document is free from errors or omissions. The authors do not accept any form of liability, be it contractual, tortious, or otherwise, for the contents of this document or for any consequences arising from its use or any reliance placed upon it. The information, opinions and advice contained in this document may not relate, or be relevant, to readers' particular circumstances. Opinions expressed by the authors are the individual opinions expressed by those persons and are not necessarily those of the publisher, research provider or the FRDC.
The Fisheries Research and Development Corporation plans, invests in and manages fisheries research and development throughout Australia. It is a statutory authority within the portfolio of the federal Minister for Agriculture, Fisheries and Forestry, jointly funded by the Australian Government and the fishing industry.
The Fisheries Research and Development Corporation plans, invests in and manages fisheries research and development throughout Australia. It is a statutory authority within the portfolio of the federal Minister for Agriculture, Fisheries and Forestry, jointly funded by the Australian Government and the fishing industry.

Fisheries Research Report [Western Australia] No. 218, 2011 iii
Contents
Non Technical Summary ..................................................................................................... 2Outcomes achieved to date ............................................................................................ 3Acknowledgments .......................................................................................................... 3
1.0 Background ................................................................................................................... 4
2.0 Need ............................................................................................................................... 6
3.0 Objectives ...................................................................................................................... 6
4.0 Methods ......................................................................................................................... 74.1 Objective 1 .............................................................................................................. 74.2 Objective 2 .............................................................................................................. 9
4.2.1 Collection ..................................................................................................... 94.2.2 In-situ preservation ...................................................................................... 104.2.3 Sieving and Storage ..................................................................................... 104.2.4 Sorting and Identification ............................................................................ 10
4.3 Objectives 3 & 4 ..................................................................................................... 104.3.1 Study sites .................................................................................................... 104.3.2 Environmental Data .................................................................................... 134.3.4 Data Analysis ............................................................................................... 13
4.4 Objective 5 .............................................................................................................. 14
5.0 Results / Discussion ...................................................................................................... 155.1 Objective 1 & 2 ...................................................................................................... 155.2 Objective 3 .............................................................................................................. 19
5.2.1 Community Structure ................................................................................... 195.2.2 Environmental Influence on Community Structure .................................... 22
5.3 Objective 4 ............................................................................................................. 245.3.2 Orders influencing community composition changes ................................. 245.3.3 Environmental impacts on taxa abundance ................................................ 26
5.3.3.1 Tropical / Sub-tropical locations ................................................... 275.3.3.2 Temperate ...................................................................................... 28
5.3.4 Correlations of taxa abundance and puerulus settlement ............................ 315.3.4.1 Community-level ........................................................................... 315.3.4.2 Tropical / Sub-tropical ................................................................... 325.3.4.3 Temperate ...................................................................................... 32
5.4 Objective 5 .............................................................................................................. 33
6.0 Benefits and adoption .................................................................................................. 34
7.0 Further development .................................................................................................... 34
8.0 Planned outcomes and conclusions ............................................................................. 35

iv Fisheries Research Report [Western Australia] No. 218, 2011
9.0 References ..................................................................................................................... 36
10.0 Appendices .................................................................................................................... 3810.1 Appendix A – Staff ................................................................................................ 3810.2 Appendix B – Obtaining water movement data .................................................... 38
10.2.1 Background .................................................................................................. 3810.2.2 Methods ........................................................................................................ 3910.2.3 Results / Discussion ..................................................................................... 39
10.3 Appendix C – National Introduced Marine Pests ................................................. 4210.4 Appendix D – Raw Data ........................................................................................ 43

Fisheries Research Report [Western Australia] No. 218, 2011 1
2008/085 Assessing possible environmental causes behind the reduced colonisation of Western Rock Lobster puerulus collectors by a wide suite of species
PRINCIPAL INVESTIGATOR: Dr S. de Lestang
ADDRESS: Department of Fisheries PO Box 20 North Beach, W.A. 6920 Telephone: 08 92030174 Fax: 08 92030199
Objectives1) Begin monitoring the community composition of marine flora and fauna along the Western
Australian coastline during this current poor settlement period.
2) Develop standard methodology for monitoring the spatial and temporal variability in the settlement of marine flora and fauna.
3) Determine what environmental parameters may be linked to the majority of variation in the floral and faunal communities colonizing puerulus collectors, focusing on those relating to puerulus settlement.
4) Identify indicator marine flora and fauna species for monitoring the influences of environmental change on Western Australian marine environment.
5) Detect any known or potential introduced marine pests within the Western Australian environment.

2 Fisheries Research Report [Western Australia] No. 218, 2011
Non Technical Summary
This project was initiated as part of a response to the lower than expected puerulus settlement for the western rock lobster (Panulirus cygnus) on the Western Australian coast during 2008. This departure of settlement rates from a long standing relationship with environmental variables (e.g. water temperature, Leeuwin Current), corresponded with anecdotal information that there appeared to be a reduction in the colonization of the collectors by other invertebrate species, namely shrimps and crabs. The puerulus monitoring occurs monthly with 10 locations from Coral Bay to Cape Mentelle. The aim of this project was to establish the methodology for monitoring macro invertebrate communities associated with puerulus collectors and the environmental conditions that may be influencing these communities along the coast. The project could also identify what species could potentially be used as indicators to monitor climate change effects along the West Australian coast and enable the detection of some potential marine pests, using an existing sampling regime.
This project began during the second of two seasons (2008/09 and 2009/10) when settlement was well below that expected based on historical relationships. As a result this project has produced a baseline of community composition data against which to compare future compositions with variations in puerulus levels.
The standard methodology established during this project was consistent with a number of other similar studies, both in terms of the detail of taxonomic classification and the number of samples obtained for any one site and season. Five sites spanning over 1000 km of coastline from Coral Bay to Warnbro were examined for each of two seasons (winter and spring), with two of these sites examined for all four seasons. This allowed for an examination of the spatial and seasonal variation of the macro invertebrate communities.
Overall 157 740 individuals were counted from 55 samples that were processed encompassing 67 taxa. Amphipoda was the dominant Order encompassing almost half of all individuals and three times greater in abundance than the second most abundant taxa (Class – Gastropoda), which in turn were, double that of Isopoda, Tanaidacea and Ostracoda (Class). Choa taxa accumulation curves were produced for each sample, which at the order classification level, indicated that four replicate samples were sufficient to account for the majority of the within sample variation in community composition. This current work indicates that Order may be close to the preferred level of taxonomic resolution as it provides more information on community structure than the Phyla or Class level and as such will be used for subsequent analysis.
The compositions of the communities were found to vary significantly both spatially and seasonally , with the main difference occurring between sites located in the tropics/sub-tropics, from those in temperate locations. This was mainly attributable to the greater abundance of taxa in the temperate locations compared with the tropics. Spatial and monthly variation in environmental parameters measured during this study did not correlate well with variation in the structure of the communities despite their clear spatial and temporal differences. The dominant separation of tropical/subtropical from temperate locations probably indicates the importance of the surrounding habitat with the settlement on the collectors. Benthic habitat variation has yet to be quantified, but will be the focus of further work. The positive relationships between the abundance of some taxa and water temperature and the negative relationships between abundance and water motion may be related to levels of productivity and habitat stability, respectively. In the temperate locations, copepods displayed a significant negative relationship with puerulus abundance, which may reflect their different seasonal variation in abundance.

Fisheries Research Report [Western Australia] No. 218, 2011 3
Climate change in the West Australian coastal zone is predicted to result in increased water temperatures and salinity and less frequent and severe storm events. These environmental factors were found to significantly influence the abundance of a number of taxa found commonly on the collectors. These relationships, along with the discovery of some individuals outside of their normal distributional range, such as the tropical species Strombus mutabilis being found at Dongara, indicates that the monitoring of a range of species on the puerulus collectors can provide an indication of the localised environment and the impact of climate change.
While no introduced or marine pest species were identified in this study, a protocol was established, in collaboration with West Australian Museum and marine pest specialists within the Department of Fisheries, to monitor future samples for marine pests that may settle on the collectors.
This project has provided a valuable baseline indication of the macro invertebrate communities associated with puerulus collectors during a period of below average settlement. The methodology developed will provide a cost effective way to monitor these communities, with a number of taxa potentially providing valuable information to monitor environmental change along the West Australian coast. It will also enable the assessment of whether the annual variation in puerulus settlement is reflected in the change to other macro invertebrates.
Outcomes achieved to date1. A sampling regime was developed (four replicate samples for each location) that was
appropriate to adequately describe the macro invertebrate community at the Order level, with this level of taxonomic resolution providing a robust measure of community composition. The monitoring program has been adopted by the Department of Fisheries and integrated into the current puerulus monitoring program. This has resulted in a cost-effective long-term monitoring program assessing faunal communities.
2. This study has provided a baseline to compare future community changes with changes in puerulus settlement.
3. The monitoring of a range of species on the puerulus collectors will enable an assessment of the impact of climate change on the macro invertebrate community.
4. A protocol was established, in collaboration with West Australian Museum to monitor future samples for marine pests that may settle on the collectors.
Keywords
Marco invertebrate communities, puerulus, western rock lobster, Panulirus cygnus, environmental effects, habitat, marine pests
Acknowledgments
This project required the collection of considerable samples from puerulus collectors along the coast. This was not possible without the assistance of the puerulus monitoring team, Mark Rossbach, Owen Young, Josh Dornan, Rhys Allen and Adam Eastman. Samples were also provided from collectors serviced by contractors at Cape Mentelle and Point Quobba and Coral Bay, so thanks must go to Dennis Cuthburt, Tim Meecham and the Department of Environment and Conservation staff from the Exmouth office, particularly, Claire O’Calloghan and Huw Dilley.

4 Fisheries Research Report [Western Australia] No. 218, 2011
Taxonomic expertise was provided willingly from Dr. Anne Brearley (University of Western Australia) and Dr. Andrew Hosie (Western Australia Museum), which enabled the identification of potential range extension of gastropoda species and fine scale taxonomic resolution of Decapoda (particularly crabs).
The initial concept for this project was developed by Dr. Matthew Pember, with Dr. David Abdo as the initial Principal Investigator. Their initiation of the project and continued interest in the project was of considerable assistance.
The Fisheries Research Development Corporation, as part of their Tactical Research Fund, provided funding central to the undertaking of this project.
1.0 Background
The western rock lobster fishery is the largest single species fishery in Australia, and the first fishery world wide to attain Marine Stewardship Council certification (Caputi et al 2008). The management of this fishery has been aided by the ability to predict catches three to four years in advance, based on the strong relationship between puerulus settlement and future catch (Caputi et al. 1995 and de Lestang et al. 2009).
Puerulus are the post-larval / settlement phase of the western rock lobster (Panulirus cygnus), and is a non-feeding free-swimming stage that moves from an offshore region in the vicinity of the continental shelf break to the near-shore areas before moulting to a juvenile form (Phillips 1972, Phillips and Macmillan 1987). Puerulus have been found to settle mainly in areas with macroalgal or seagrass cover on or near hard substrates (Phillips et al. 2003). This settlement behaviour enabled the development of puerulus collectors designed to mimic these habitat qualities, which therefore provided a platform from which the recruitment rate of puerulus could be monitored (Phillips 1972; Caputi et al. 1995). Some puerulus collectors have been monitored for over 40 years, with sampling conducted on every full moon period at the same sites using the same type of collectors. This has provided a very valuable long-term data set of settlement rates (Caputi et al. 2008).
Levels of puerulus settlement at most sites show very strong relationships with environmental variables that occur during their 9-11 month larval life. The most significant relationships exist between offshore water temperatures during their early larval life and the frequency of frontal storms towards the end of the larval period, i.e. during settlement (Caputi et al 2001). Recently however, there have been two years (2008/09 and 2009/10) of unexpectedly low levels of puerulus settlement, with the relationships with water temperature and storms not explaining their levels (Brown 2009).
These anomalous low puerulus settlements instigated a risk assessment workshop to identify the potential causes behind the low puerulus settlement (Brown 2009). There were several potential causes considered, with the two major ones being a reduction in the breeding stock (in particular areas) and alterations to the oceanographic / climatic conditions (either short or long term) (or a combination of both). An outcome of this workshop was the identification of several projects that would increase understanding of the causes behind the low levels of puerulus settlement (Brown 2009).
There was anecdotal evidence from West Australian Department of Fisheries staff servicing the puerulus collectors who had noticed that, with the drop in puerulus, there had been a

Fisheries Research Report [Western Australia] No. 218, 2011 5
concomitant decline in other fauna typically associated with the puerulus collectors, e.g. shrimps and crabs. This project was initiated to determine the links between the abundance of puerulus and other relatively similar species on the collectors to aid in understanding the likely causes behind the recent low puerulus settlements.
Environmental determinants of recruitment can affect larval dispersal, as well as survival of larval and juvenile stages (de Lestang et al. in press). Factors influencing growth and survival include temperature, salinity, water motion, light and nutrient availability, while large scale dispersal is largely driven by oceanic currents (Jenkins et al. 2009). Even in a single location, these environmental factors can be highly variable through time. Temporal patterns can be observed on various levels such as diurnal, seasonal or inter-annual. Of these, seasonality is a characteristic of almost all ecosystems and animals have evolved means by which to cope with variability in their environment imposed by seasonal changes (Gili & Petraitis 2009). Seasons determine the input of energy from solar radiation and in turn, control the annual cycles of oceanographic and atmospheric conditions.
Populations may respond to seasonal changes in the environment, becoming more abundant with increased food availability. Alternatively, organisms may respond behaviourally or physiologically to environmental seasonality (Gili & Petraitis 2009). As a response to reduced food availability, individuals may reallocate their food resources to storage and consequently become less active. The crab, Carcinus maenas, moves offshore in winter to avoid wave action and the extremely low nearshore temperatures, while returning inshore in spring and summer to breed (Hunter & Naylor 1993). Alternatively, animals may migrate offshore in summer to breed (e.g. Panulirus cygnus, Caputi et al. 2008) or to avoid high water temperature / low oxygen waters (e.g. Portunus pelagicus, de Lestang et al., 2003). Since organisms tend to respond to a suite of environmental conditions rather than a single factor, studies incorporating a combination of environmental factors, are more likely gain an accurate understanding of the effects of seasonality on abundances and community structure. Nutrients and food availability are key factors affecting benthic communities, which in turn are affected by water temperature and light availability. In this study the impacts of a suite of environmental parameters on community structure have been examined, with potential indicator taxa identified to examine future influences of environmental changes on the marine environment.
Finally, the examination of taxa settling on puerulus collectors provides the opportunity to detect any marine pests. The translocation of marine organisms from their natural environment to another area is assisted by human activity, in particular by the global movement of vessels (commercial and recreational) where organisms are moved about in ballast water and as biofouling on vessel hulls. This translocation of marine organisms is a world-wide problem and second only to habitat change and loss, in reducing global biodiversity (Millennium Ecosystem Assessment 2005). It is estimated that one, in six - ten, of displaced marine organisms will become Introduced Marine Pests (IMP; Anonymous 2002). Marine environments which are highly disturbed/modified have increased vulnerability to invasion by IMPs.
The Australian and state/territory governments are implementing Australia’s National System for the Prevention and Management of Marine Pest Incursions (the National System). It is the National Introduced Marine Pests Coordination Group (NIMPCG) that is coordinating the measures and arrangements under the National System. NIMPCG have identified 55 species (Appendix C) to target when undertaking IMP monitoring around Australia.
This project provides an excellent opportunity to detect any of these identified species as part of a rigorous existing monitoring program.

6 Fisheries Research Report [Western Australia] No. 218, 2011
The novel aspect of this research required first the development a standard methodology for sampling flora and fauna associated with the puerulus collectors, and then the implementation of this during the current low settlement period to establish a dataset that could be compared to future samples collected during times of varying levels of puerulus settlement.
2.0 Need
Western Rock Lobster puerulus settlement has been unexpectedly low over the past two settlement years (2008/09 and 2009/10), with the 2008/09 settlement being the lowest on record. This extremely weak settlement has occurred despite environmental conditions being favourable for an above average settlement (i.e. a strong Leeuwin Current, warm sea temperatures and la Niña conditions). The recent poor settlements could be attributed to a number of possible scenarios, including, reduced egg production from depleted brood stock or a shift/change in oceanic conditions possibly due to climate change. Understanding what scenario(s) are responsible will be crucial for the effective conservation and management of the Western Rock Lobster stock, and ultimately the longevity of the fishery. Anecdotal evidence suggests that colonisation of the puerulus collectors by a number of other species commonly found during processing of these collectors have also been extremely low in recent times. . Establishing a baseline for marine flora and fauna communities colonising the puerulus collectors over a range of 1000 km during this time of extremely low settlement (i.e. prior to the end of the settlement season in April 2009) and determining how these communities vary in relation to the varied environmental conditions experienced, will provide valuable information as to what may be influencing puerulus settlement. If settlement of other marine flora and fauna show a related response to that of the Western Rock Lobster pueruli, it could indicate environmental change may be responsible for the decreased settlement. This data will complement other research, such as the oceanographic modeling research (FRDC project 2008/087 and 2009/018), and is crucial to the effective management of the Western Rock Lobster fishery. Furthermore, this spatial analysis conducted on a monthly scale has the potential to further identify possible indicator species of localised environmental conditions that could continue to be monitored as part of the standard Western Rock Lobster puerulus monitoring program.
3.0 Objectives1. Begin monitoring the community composition of marine flora and fauna along the Western
Australian coastline during this current poor settlement period.
2. Develop standard methodology for monitoring the spatial and temporal variability in the settlement of marine flora and fauna.
3. Determine what environmental parameters may be linked to the majority of variation in the floral and faunal communities colonizing puerulus collectors, focusing on those relating to puerulus settlement.
4. Identify indicator marine flora and fauna species for monitoring the influences of environmental change on Western Australian marine environment.
5. Detect any known or potential introduced marine pests within the Western Australian environment.

Fisheries Research Report [Western Australia] No. 218, 2011 7
4.0 Methods
4.1 Objective 1
Begin monitoring the community composition of marine flora and fauna along the Western Australian coastline during this current poor settlement period.
In March 2009, there were nine sites monitored as part of the Department of Fisheries puerulus program. An additional site was established in May 2009 at Coral Bay to examine puerulus settlement in an area north of the commercial fishery (Figure 1).
Figure 1. Location of puerulus monitoring sites (red) along the West Australian coast, with the boundary of the fishery and zones for the Western Rock Lobster Managed Fishery (dotted line).

8 Fisheries Research Report [Western Australia] No. 218, 2011
The collection of all flora and fauna associated with the puerulus collectors began in May 2009 at all ten puerulus monitoring sites. Monthly collections continued from the ten sites (when logistically possible) until the writing of this report (August 2010), resulting in over 750 samples from this 15-month period. The collection of samples is planned to continue. The period of sampling to date encompasses a time of unexpectedly low puerulus settlement (Figure 2).
Figure 2. Puerulus settlement rates at Dongara (Seven Mile Beach) for the last four settlement seasons, compared with the long term average (red) from (http://www.fish.wa.gov.au/docs/pub/PuerulusSettlement/). Black box indicates the current collection period of floral and faunal samples from the collectors.
The settlement season during which sampling began was one of two (potentially more) seasons when settlement was well below that expected based on historical environmental relationships between offshore water temperature and settlement rates (Figure 3). Subsequently, collection of flora and fauna associated with puerulus collectors provide a baseline of community structure information against which to compare community composition when (if) puerulus levels increase.

Fisheries Research Report [Western Australia] No. 218, 2011 9
Offshore (25-28 S, 109-112 E) Renyolds SST in February
Don
gara
/Jur
ien
Puer
ulus
Inde
x
1982
1983
19841995
1985
1986 1987
1988
1989
19901991
19921993
1994
1996
1997
1998
1999
2000
2001
2002
20032004
2005
20062007
20082009
22.5 23 23.5 24 24.5 25 25.5
020
4060
8010
012
014
016
018
020
022
0
2010
Figure 3. Relationship between offshore water temperatures and the settlement index for Dongara and Jurien. Red numbers indicate years of settlement outlying the linear relationship, with the green arrow and year indicating the location of the expected settlement for the 2010/11 season.
4.2 Objective 2
Develop standard methodology for monitoring the spatial and temporal variability in the settlement of marine flora and fauna.
This study used a pre-existing puerulus monitoring protocol, which provided a through sampling framework that has been rigorously tested statistically (Caputi et al. 2008). Sampling specific to this project required, in-situ preservation, laboratory sieving and permanent storage, sorting and identification and finally, data recording of floral and faunal compositions.
4.2.1 Collection
Collectors were sampled every full moon period (five days either side of the full moon), with each sheet removed and placed face down in a rack for shaking over a collection tray. An aluminium shaker frame is slid over the P.V.C. backing board and, holding the shaker by the handles, operators gave 20 “bangs” of the frame onto the upper lip of the collection tray. The tray was then checked for puerulus before the sheet was banged another 10 times over the tray. If any more pueruli appear in the tray after the second set of shaking, then the panel is given another ten shakes, with this process continuing until no further pueruli appear. The sheet is then removed from the frame with the process repeated for the remaining two sheets.

10 Fisheries Research Report [Western Australia] No. 218, 2011
After all three sheets have been shaken, the number of puerulus and post-puerulus are counted and removed. Puerulus data is entered into the database for later analysis along with the rest of the community composition data. This has been the standard methodology since the inception of sampling in the late 1960s.
4.2.2 In-situ preservation
The flora and fauna dislodged through the aforementioned collection process are retained in the collection tray. The contents of this tray are then poured into a labelled calico bag before being secured closed with a cable tie. The calico bag acts as a sieve, retaining all particular matter and releasing water. Once the water has drained out of the bag it would then be placed into a drum of ethanol for initial preservation, where it was stored until sorting.
4.2.3 Sieving and Storage
Upon returning to the laboratory, the contents of each calico bag were separately run through a 500 μm sieve to aid in the removal of fine particulate matter (i.e. silt) which when present can make sorting of a sample very difficult and time consuming. Once sieved, the samples were then placed into a labelled plastic container and filled with fresh 70% ethanol for storage until sorting.
4.2.4 Sorting and Identification
Mobile invertebrates were the dominant taxa in the samples and hence they have been the initial focus of sorting and identification. Additional effort was applied to identifying as precisely as possible those species belonging to the same Class (Malacostraca) as Panulirus cygnus because it was felt that a member of this group was most likely to have similar behaviours. Fauna were sorted and counted into various taxonomic groups. A range of texts were used to assist sorting and identification (including Jones & Morgan 1994 and Shepherd et al. 1997, parts I, II & III), as well as taxonomic assistance offered by Dr. Anne Brearley (University of Western Australia) and Dr. Andrew Hosie (Western Australia Museum). Macro algae were removed from the sample and stored separately for future identification and recording. The abundance of taxa was recorded for each sample.
4.3 Objectives 3 & 4
Determine what environmental parameters may be linked to the majority of variation in the floral and faunal communities colonizing puerulus collectors, focusing on those
relating to puerulus settlement.
Identify indicator marine flora and fauna species for monitoring the influences of environmental change on Western Australian marine environment.
4.3.1 Study sites
Due to the time-consuming nature of processing the faunal samples, this study has focussed on analysing five of the ten puerulus monitoring sites for macro invertebrate community structure (samples from other sites have been stored for future analysis). Locations chosen spanned the entire fishery (Figure 4), representing a spatial separation of over 11o in latitude (over 1000km), and consisted of historically good and average settlement sites (Figures 4, 5).

Fisheries Research Report [Western Australia] No. 218, 2011 11
At each site up to four replicate collectors were analysed for both winter (August 2009), and spring (November 2009). At Dongara and Warnbro, autumn (May 2009) and summer (January 2010) were also analysed.
Figure 4. Location of sites where samples were analysed for two seasons (small circles) and those where four season were examined (large circles).
Sampling seasons were structured so as to sample months that included a contrast in puerulus settlement rates where possible (Figure 5).

12 Fisheries Research Report [Western Australia] No. 218, 2011
Figure 5. Numbers of puerulus recorded at the five locations during the sampling period. (Circles indicate the month of sampling other species on the collectors).
Puerulus monitoring sites (Figure 1 & 4) as shown here for Dongara, typically have puerulus collectors in the lee of a near shore reef, on or near small patch reefs or seagrass meadows (Figure 6).
Figure 6. Schematic diagram of the location of puerulus collectors (T1-6 & B1-6) showing breaking waves (breaks) on the near shore reef and patches of inshore reef (open polygons). Location of wave logger (filled circle) and temperature logger (filled square) are also shown.

Fisheries Research Report [Western Australia] No. 218, 2011 13
4.3.2 Environmental Data
With climate change in the Indian Ocean and more specifically the West Australian coastal zone predicted to result in increased water temperatures, increased salinity and less frequent and severe storm events (Maunsell Australia 2009), we examined the effect of the temperature, salinity and wave magnitude, on individual taxa abundances. This was to elucidate any potential indicator taxa for monitoring the influence of environmental change on the West Australian coast.
Each site had a high-resolution temperature logger secured to one of the collector moorings (Stowaway Tidbit temperature logger TBI32), approximately 2 m below surface. This recorded water temperature every hour to the nearest 0.1°C. Temperature measurements from the loggers were compared to a mercury thermometer measurement, carried out during monthly collections and measurements were standardised if significant differences were found (Pearce et al. 1999).
An existing wave logger design was modified as part of this study (Appendix B) and deployed at each location to record static acceleration every 10 minutes on the vertical and horizontal axis, resulting in a relative water motion reading (Evans & Abdo 2010).
During the puerulus collection fieldwork, two water samples were collected to determine salinity.
Equipment loss or failure resulted in not all sites having all available environmental parameters measured. Water movement data was not available at Warnbro and Lancelin for winter (August 2009) as logger design was being modified (see Appendix B). Estimates of Warnbro water movement were estimated based on a linear relationship between monthly water movement either side of August (e.g. from July 2009 to October 2009).
With the loss of the initial loggers design from Lancelin, no estimates of water movement were available prior to October 2009. As such, water movement at this site was estimated based on correlations with water movement recorded at similar nearby sites. The most similar site (based on the magnitude of variation in the ratios of water movements) was Dongara. The loss of two separate loggers at Point Quobba, resulted in no water movement data for this site. As such, Point Quobba water movement was given the maximum-recorded water movement of any site for each season. From the loss of both wave loggers and puerulus collectors at this site due to water movement, coupled with personal observations, this is a conservative estimate of water movement at this site.
As only one salinity measure was available for Point Quobba, it was removed from analysis when tropical sites were examined independently.
The establishment of the new site at Coral Bay during this project resulted in a few additional logistical issues resulting in no temperature or salinity measures being taken at this site at the time of sampling. Salinity was removed from analysis when tropical sites were examined independently.
4.3.4 Data Analysis
The data were examined using Primer 6 (Clarke & Warwick 2001) to examine taxa accumulation curves to assess the level of sampling required to account for the majority of species present, community composition differences (non-metric multi dimensional scaling – nMDS; analysis of similarity –ANOSIM), identify taxa responsible for possible differences (SIMPER), as well as impacts of environmental parameters on community composition (BIOENV).

14 Fisheries Research Report [Western Australia] No. 218, 2011
Univariate analysis was also conducted on specific groups of taxa to further investigate trends identified from multivariate analysis. This was done using R (R Development Core Team 2009) with appropriate transformations (ln (x+constant) predominantly) to satisfy the assumptions of normality and equal variance (Clark and Warwick, 2001).
4.4 Objective 5
Detect any known or potential introduced marine pests within the Western Australian environment.
As part of the process of sorting the samples all specimens were compared to a list of 55 marine pests as identified by National Introduced Marine Pests Coordination Group (Appendix C), and introduced marine species (Wells et al. 2009).

Fisheries Research Report [Western Australia] No. 218, 2011 15
5.0 Results / Discussion
5.1 Objective 1 & 2
Develop standard methodology for monitoring the spatial and temporal variability in the settlement of marine flora and fauna.
Overall 157 740 individual were counted from the 55 samples that were processed encompassing 67 taxa (Table 1).
Choa taxa accumulation curves were produced for each sample (season and site - Figure 7). At the order classification level, four replicate samples appeared sufficient to account for the majority of the within sample variation in community composition (Figure 7).
Figure 7. Choa taxa accumulation curves, indicating the average number of orders (±sd) for each location (averaged over the seasons), using data from a varying number of samples per month (1- 4) for Warnbro (blue), Lancelin (green), Dongara (pink), Point Quobba (orange) and Coral Bay (red).

16 Fisheries Research Report [Western Australia] No. 218, 2011
Tabl
e 1.
Ta
xono
mic
gro
ups
(bol
d) a
nd th
eir t
axon
omic
leve
l use
d fo
r the
initi
al s
ortin
g of
mac
ro in
verte
brat
es.
Phyl
umSu
b-ph
ylum
Cla
ssSu
b-cl
ass
Ord
erSu
bord
erIn
frao
rder
Fam
ilySu
b Fa
mily
Gen
usSp
ecie
s / T
axon
Plat
yhel
min
thes
Nem
erte
ans
Ann
elid
a
Poly
chae
ta
Mol
lusc
a
Gas
trop
oda
Mol
lusc
a
Gas
tropo
daO
pist
hobr
anch
iaN
udib
ranc
hia
Mol
lusc
a
Gas
tropo
daO
pist
hobr
anch
iaC
epha
lasp
idea
Mol
lusc
a
Poly
plac
opho
ran
Mol
lusc
a
Biv
alvi
a
Ath
ropo
daC
helic
erat
aA
rach
nida
A
carif
orm
esP
rost
igm
ata
H
alac
arid
ae
Arth
ropo
daC
helic
erat
aPy
cnog
onid
a
Arth
ropo
daC
rust
acea
Ost
raco
da
Mot
tled
hairy
Arth
ropo
daC
rust
acea
Ost
raco
da
Dim
pled
Arth
ropo
daC
rust
acea
Ost
raco
da
Big
yel
low
sof
tA
rthro
poda
Cru
stac
eaC
opep
oda
Arth
ropo
daC
rust
acea
Mal
acos
traca
D
ecap
oda
Ple
ocye
mat
aC
arid
ae
Arth
ropo
daC
rust
acea
Mal
acos
traca
D
ecap
oda
Ple
ocye
mat
aP
alin
ura
Pal
inur
idae
Pa
nulir
us
Arth
ropo
daC
rust
acea
Mal
acos
traca
D
ecap
oda
Ple
ocye
mat
aH
eter
otre
mat
aP
ortu
noid
aeTh
alam
itina
eTh
alam
itaTh
alam
ita s
ima
Arth
ropo
daC
rust
acea
Mal
acos
traca
D
ecap
oda
Ple
ocye
mat
aH
eter
otre
mat
aP
ortu
noid
aeTh
alam
itina
eTh
alam
itaTh
alam
ita a
dmet
eA
rthro
poda
Cru
stac
eaM
alac
ostra
ca
Dec
apod
aP
leoc
yem
ata
Het
erot
rem
ata
Por
tuno
idae
Thal
amiti
nae
Thal
amita
Thal
amita
woo
dmas
oni
Arth
ropo
daC
rust
acea
Mal
acos
traca
D
ecap
oda
Ple
ocye
mat
aH
eter
otre
mat
aP
ortu
noid
aeTh
alam
itina
eTh
alam
itaTh
alam
ita d
anae
Arth
ropo
daC
rust
acea
Mal
acos
traca
D
ecap
oda
Ple
ocye
mat
aH
eter
otre
mat
aP
ortu
noid
aeTh
alam
itina
eTh
alam
itaTh
alam
ita p
arvi
dens
Arth
ropo
daC
rust
acea
Mal
acos
traca
D
ecap
oda
Ple
ocye
mat
aH
eter
otre
mat
aP
ortu
noid
aeP
ortu
nina
eP
ortu
nus
Port
unus
pub
esce
nsA
rthro
poda
Cru
stac
eaM
alac
ostra
ca
Dec
apod
aP
leoc
yem
ata
Het
erot
rem
ata
Por
tuno
idae
Por
tuni
nae
Por
tunu
s Po
rtun
us s
p. 1
Arth
ropo
daC
rust
acea
Mal
acos
traca
D
ecap
oda
Ple
ocye
mat
aH
eter
otre
mat
aM
ajid
aeIn
achi
nae
Dum
eaD
umea
latip
esA
rthro
poda
Cru
stac
eaM
alac
ostra
ca
Dec
apod
aP
leoc
yem
ata
Het
erot
rem
ata
Maj
idae
Inac
hina
eD
umea
Maj
id D
umea
sm
ooth
Arth
ropo
daC
rust
acea
Mal
acos
traca
D
ecap
oda
Ple
ocye
mat
aH
eter
otre
mat
aM
ajid
aeE
pial
tinae
Aca
ntho
nyx
Aca
ntho
nyx
eury
sero
che
Arth
ropo
daC
rust
acea
Mal
acos
traca
D
ecap
oda
Ple
ocye
mat
aH
eter
otre
mat
aM
ajid
aeE
pial
tinae
Aca
ntho
nyx
Aca
ntho
nyx
sp. 2
Arth
ropo
daC
rust
acea
Mal
acos
traca
D
ecap
oda
Ple
ocye
mat
aH
eter
otre
mat
aM
ajid
aeE
pial
tinae
Sim
ocar
cinu
sSi
moc
arci
nus
obtu
siro
stru
sA
rthro
poda
Cru
stac
eaM
alac
ostra
ca
Dec
apod
aP
leoc
yem
ata
Het
erot
rem
ata
Maj
idae
Maj
inae
Sch
izop
hrys
Schi
zoph
rys
rufe
scen
sA
rthro
poda
Cru
stac
eaM
alac
ostra
ca
Dec
apod
aP
leoc
yem
ata
Het
erot
rem
ata
Maj
idae
Maj
inae
Arth
ropo
daC
rust
acea
Mal
acos
traca
D
ecap
oda
Ple
ocye
mat
aH
eter
otre
mat
aM
ajid
aeE
pial
tinae
Men
aeth
ius
Arth
ropo
daC
rust
acea
Mal
acos
traca
D
ecap
oda
Ple
ocye
mat
aH
eter
otre
mat
aM
ajid
ae
M
ajid
tria
ngle
cra
b

Fisheries Research Report [Western Australia] No. 218, 2011 17
Arth
ropo
daC
rust
acea
Mal
acos
traca
D
ecap
oda
Ple
ocye
mat
aH
eter
otre
mat
aM
ajid
ae
U
nkno
wn
Maj
idA
rthro
poda
Cru
stac
eaM
alac
ostra
ca
Dec
apod
aP
leoc
yem
ata
Het
erot
rem
ata
Xan
thid
aeZa
lasi
inae
A
ctae
a pe
roni
iA
rthro
poda
Cru
stac
eaM
alac
ostra
ca
Dec
apod
aP
leoc
yem
ata
Het
erot
rem
ata
Xan
thid
ae
Xa
nthi
d cl
own
crab
Arth
ropo
daC
rust
acea
Mal
acos
traca
D
ecap
oda
Ple
ocye
mat
aH
eter
otre
mat
aX
anth
idae
Xant
hid
blus
hing
cra
bA
rthro
poda
Cru
stac
eaM
alac
ostra
ca
Dec
apod
aP
leoc
yem
ata
Het
erot
rem
ata
Hym
enos
omat
idae
H
alic
arci
nus
Hal
icar
cinu
s ov
atus
Arth
ropo
daC
rust
acea
Mal
acos
traca
D
ecap
oda
Ple
ocye
mat
aH
eter
otre
mat
aH
ymen
osom
atid
ae
Hal
icar
cinu
sH
alic
arci
nus
sp. 2
Arth
ropo
daC
rust
acea
Mal
acos
traca
D
ecap
oda
Ple
ocye
mat
aH
eter
otre
mat
aH
ymen
osom
atid
ae
Hal
icar
cinu
sH
alic
arci
nus
sp. 3
Arth
ropo
daC
rust
acea
Mal
acos
traca
D
ecap
oda
Ple
ocye
mat
aH
eter
otre
mat
aH
ymen
osom
atid
ae
Hal
icar
cinu
sH
alic
arci
nus
sp. 4
Arth
ropo
daC
rust
acea
Mal
acos
traca
D
ecap
oda
Ple
ocye
mat
aH
eter
otre
mat
aH
ymen
osom
atid
ae
Hal
icar
cinu
sH
alic
arci
nus
sp. 5
Arth
ropo
daC
rust
acea
Mal
acos
traca
D
ecap
oda
Ple
ocye
mat
aH
eter
otre
mat
aH
ymen
osom
atid
ae
Hal
icar
cinu
s
Arth
ropo
daC
rust
acea
Mal
acos
traca
D
ecap
oda
Ple
ocye
mat
aH
eter
otre
mat
aP
ilum
nida
eP
ilum
nina
eP
ilum
nus
Pilu
mnu
s sp
. 1A
rthro
poda
Cru
stac
eaM
alac
ostra
ca
Dec
apod
aP
leoc
yem
ata
Het
erot
rem
ata
Pilu
mni
dae
Arth
ropo
daC
rust
acea
Mal
acos
traca
D
ecap
oda
Ple
ocye
mat
aTh
orac
otre
mat
aG
rasp
idoi
dea
Pla
gusi
inae
Pla
gusi
aPl
agus
ia s
p. 1
Arth
ropo
daC
rust
acea
Mal
acos
traca
D
ecap
oda
Ple
ocye
mat
aTh
orac
otre
mat
aG
rasp
idoi
dea
Pla
gusi
inae
Pla
gusi
aPl
agus
ia s
p. 2
Arth
ropo
daC
rust
acea
Mal
acos
traca
D
ecap
oda
Ple
ocye
mat
aA
nom
ura
Gal
athe
idae
Arth
ropo
daC
rust
acea
Mal
acos
traca
D
ecap
oda
Ple
ocye
mat
aA
nom
ura
Por
cella
nida
e
Pisi
dia
Arth
ropo
daC
rust
acea
Mal
acos
traca
D
ecap
oda
Ple
ocye
mat
aD
rom
inac
eaD
rom
iidae
Arth
ropo
daC
rust
acea
Mal
acos
traca
D
ecap
oda
Pleo
cyem
ata
Meg
alop
e
Arth
ropo
daC
rust
acea
Mal
acos
traca
D
ecap
oda
Ple
ocye
mat
aTh
orac
otre
mat
aG
rasp
idoi
dea
Pla
gusi
inae
Plag
usia
Meg
alop
e
Arth
ropo
daC
rust
acea
Mal
acos
traca
D
ecap
oda
Pleo
cyem
ata
Meg
alop
e
Arth
ropo
daC
rust
acea
Mal
acos
traca
D
ecap
oda
Pleo
cyem
ata
Meg
alop
e
Arth
ropo
daC
rust
acea
Mal
acos
traca
M
ysid
acea
Arth
ropo
daC
rust
acea
Mal
acos
traca
C
umac
ea
Arth
ropo
daC
rust
acea
Mal
acos
traca
Ta
naid
acea
Arth
ropo
daC
rust
acea
Mal
acos
traca
Is
opod
aA
nthu
ridae
Arth
ropo
daC
rust
acea
Mal
acos
traca
Is
opod
aFl
abel
lifer
a
Arth
ropo
daC
rust
acea
Mal
acos
traca
Is
opod
aVa
lvife
ra
Arth
ropo
daC
rust
acea
Mal
acos
traca
Is
opod
aA
sello
ta
Janu
ridae
Arth
ropo
daC
rust
acea
Mal
acos
traca
A
mph
ipod
a
Arth
ropo
daC
rust
acea
Mal
acos
traca
A
mph
ipod
aC
apre
llida
e
Sipu
ncul
a
Ech
inod
erm
ata
S
telle
roid
eaA
ster
oide
a
Ech
inod
erm
ata
S
telle
roid
eaO
phiu
roid
ae
Ech
inod
erm
ata
Ec
hino
idea
Ech
inod
erm
ata
C
rinoi
dea

18 Fisheries Research Report [Western Australia] No. 218, 2011
Taxa were identified to their lowest possible taxonomic level (Table 1), which resulted in some taxa being identified to species and some only to class. This enabled an examination on how the measure of community composition changed according to the level of taxonomic resolution. Taxa were aggregated from their lowest taxonomic resolution up to order, class or phyla with the resulting community structure examined. Where individuals were only examined to a higher taxonomic level e.g. Nermetea, this identification, despite being a phyla level, was used as its lowest taxonomic resolution so as to incorporate all individuals in the analysis. A second stage MDS (Primer 6; Warwick and Clarke 2001) was used to examine the relatedness of community structure produced from the phyla, class, order and taxa (down to species level) analysis (Table 2).
Table 2. Correlation (permuted) of community structure from macro invertebrate assemblages analysed at different taxonomic levels from Phyla to lowest taxa level (L.Taxa). All correlations were highly significant (p<0.001).
Phyla Class OrderClass 0.772Order 0.678 0.946L.Taxa 0.605 0.890 0.957
There was a very high, and significant (p<0.001) similarity of community structure between macro-invertebrate assemblages at the phyla to lowest possible taxa level. The highest similarity was between the lowest possible taxa and order assemblages (shaded grey), but classification to the phyla level also produced a similar community structure to that of the lowest possible taxa. However the only taxa that were identified to a finer scale than Order were the Malacostraca. Therefore examining the data set at the lowest possible taxonomic level resulted in all taxa except the Malacostraca still being examined at the Order level. Further work is required to identify many of the non-Malacostraca down to lower taxonomic levels.
This analysis suggests that the Order level provides more information on community structure than either the Phyla or Class levels. Since this level was the lowest level identified for many taxa, the analysis appears to be indicating that finer scale identification is preferable. However, the identification of individuals to species level, as was undertaken for many taxa of the Malacostraca, is a labour intensive process that requires advanced taxonomic skills. A good description of community structure at higher levels of taxonomic resolution is the preferred option as it reduces much of the necessary taxonomic expertise and time taken to process samples. This enables greater efficiency in processing samples, and would reduce the overall cost of this monitoring program in the future. This current work indicates that Order may be close to the preferred level of taxonomic resolution and as such will be used for subsequent analysis, however future work will further examine this finding.
The current puerulus-monitoring program run by the Department of Fisheries (Caputi et al 2008) provided a cost-effective opportunity to monitor the spatial and temporal variation in community composition. The spatial array of sites spanned 1000 km and provided one of the largest spatial scales known to examine macro invertebrate community composition on artificial collectors. This combined with monthly samples provided an opportunity to examine long-term inter-annual temporal patterns as well as seasonal or monthly variation. Artificial collectors, such as these puerulus collectors, have been shown to provide a representative community composition to adjacent natural systems, providing a valuable management tool to examine changes in community composition of the habitats (Edgar and Klumpp 2003).

Fisheries Research Report [Western Australia] No. 218, 2011 19
Studies utilising similar methods have been conducted elsewhere in Australia and have been aimed at examining spatial, seasonal or inter annual patterns in community structure. Methodologies from these studies were broadly similar, with preservation of samples either using Formalin (10%) (Edgar 1991), ethanol (Cameron 2009) or a combination of the two (Gatt 2009). While there is some debate as to the appropriate sieve size, the use of the 500 μm sieve here is comparable with Edgar (1991) and intermediate of Cameron (1 mm; 2009) and Gatt (350 μm; 2009).
The level of replication determined as appropriate by this study and the level of taxonomic resolution also appear to be consistent with previous work. Three replicate collectors were used in a New South Wales study (Gatt 2009) while a study in South Australia used 5 – 12 collectors, with a finer taxonomic resolution, though no species accumulation curve was used to assess the appropriate number of replicates (Cameron 2009). The use of four replicate collectors was appropriate for this study to adequately describe the macro invertebrate community at the Order level (Figure 4), with this level of taxonomic resolution providing a robust measure of community composition.
5.2 Objective 3
Determine what environmental parameters may be linked to the majority of variation in the floral and faunal communities colonizing puerulus collectors, focusing on
those relating to puerulus settlement
5.2.1 Community Structure
Given the similarity in community structure using a range of taxonomic levels (Objective 2 – Table 2), the following analyses were undertaken at the Order level.
Of the 157 740 individuals identified, Amphipoda was the dominant Order encompassing almost half of all individuals (Figure 8). Amphipods were over three times greater in abundance than the second most abundant taxa (Class – Gastropoda), which in turn were, double that of Isopoda, Tanaidacea and Ostracoda (Class). To reduce the impact of these dominant taxa on the overall community structure analysis, transformations were applied (either forth-root or natural logarithm depending on the form of analysis) to all abundance data (see later).

20 Fisheries Research Report [Western Australia] No. 218, 2011
Figure 8. Abundance of individuals from all samples according to their taxonomic order. * indicates taxa classified to a higher taxonomic resolution than Order.
Prior to non-metric multivariate analysis all abundance data was forth-root transformed to remove ‘skewness’ from the data and to down-weigh the influence of very abundant taxa (Clark and Warwick, 2001). nMDS of the community composition of macro-invertebrates at an Order level showed a marked separation between different sites and seasons (Figure 9). ANOSIM confirmed both the spatial and temporal separations in community composition were significant (R=0.875; p<0.001 and R=0.465; p<0.001, respectively). Pairwise examination of groups (location and season) showed that significant differences in community composition existed between all sites and most seasons with the exception of spring and autumn (Table 3).

Fisheries Research Report [Western Australia] No. 218, 2011 21
Table 3. Pairwise comparisons of spatial and seasonal factors. C – Coral Bay; Q – Point Quobba; D – Dongara; L – Lancelin; W – Warnbro | S – Summer; A – Autumn; W – Winter; Sp – Spring;
Group 1 Group 2 R statistic Sig. Level (%)Spatial Differences
C D 1 0.1C L 1 0.3C Q 0.915 0.1C W 1 0.1D L 0.63 0.1D Q 1 0.2D W 0.833 0.1L Q 1 0.1L W 0.656 0.1Q W 1 0.3
Temporal DifferencesW Sp 0.469 0.1W S 0.688 0.2W A 0.406 1.7Sp S 0.448 0.2Sp A 0.214 9.2S A 0.417 0.1
The main separation of sites existed between the two northern sites (to the left of the MDS plot) and the three southern sites (to the right of the MDS plot – Figure 9.) Within each site the winter samples separated out and were located above corresponding spring and summer samples for that location. The southern locations (on the right of the MDS plot) also showed a progressive distribution from the top of the plot to the bottom, with the most southern location (Warnbro) being positioned at the bottom and the most northern location of these three (Dongara) being at the top.

22 Fisheries Research Report [Western Australia] No. 218, 2011
Figure 9. nMDS of collectors from Coral Bay (red), Point Quobba (pink), Dongara (orange), Lancelin (green), and Warnbro (blue), for winter (w), spring (sp), summer (s) and autumn (a).
Geographical separation of locations was the most dominant factor in the variation of community composition as illustrated by the high ANOSIM significance value. This separation in community composition between locations at a large spatial scale has also been recorded in other studies, though the spatial separation of sites was not as great as seen in this study. Cameron (2009) revealed very different community composition between sites within different fishing zones for lobsters (Jasus edwardsii) in South Australia, with sites separated by at least 300 km.
The spatial separation of sites shown in this study occur both between climate zones (tropical/sub-tropical and temperate), as well as latitudinally within the temperate climate zone.
Seasonal variation was also not unexpected, with this being recorded previously for macrofaunal composition associated with puerulus collectors in N.S.W (Gatt 2009). However, samples from the same season across multiple years at the same sites, were not similar, indicating inter-annual variation in community composition (Gatt 2009). As the samples collected during this study do not encompass multiple years changes in community composition have not been examined.
5.2.2 Environmental Influence on Community Structure
A number of studies on western rock lobster, that have highlighted environmental influences on puerulus settlement rates and locations (Caputi & Brown 1993; Caputi et al 2001; Caputi 2008). They demonstrate that puerulus settlement is influenced primarily by the Leeuwin Current, which controls both the magnitude and peak locations of settlement, and the occurrence of westerly winds in winter/spring. In this study we examined relationships

Fisheries Research Report [Western Australia] No. 218, 2011 23
between the community composition and localised temperature, salinity and water movement. BIOENV, which relates environmental measures with changes in community composition, failed to detect any significant relationships between the community composition of all sites and seasons and either water temperature, salinity or water movement (Rho=0.177, p>0.4).
However, the distinct separation of tropical/sub-tropical locations (Coral Bay and Point Quobba) from the temperate locations (Dongara, Lancelin and Warnbro) and the apparent latitudinal separation of the temperate sites, and seasons within these temperate sites, (summer and winter separated from each other with autumn and spring intermetiate), would seem to indicate a potential thermal driver on community composition. There is obviously another factor causing these seperations, especially the very marked spatial separation between the northern and southern locations. The most obvious difference between the tropical/sub-tropical and temeperate locations, apart from oceanic condictions, seems to be the localised habitat around the collectors (Plate 1). Habitat surrounding the collectors located in temperate areas are dominated by either macroalgae or seagrass beds associated with limestone reef (Plate 1a). The tropical/sub-tropical sites are surrounded by coral communities with little to no seagrass being present (Plate 1b).
Plate 1. Comparison of surrounding bethos from a) temperate (Lancelin – seagrass/limestone complex with wave logger in the background) and b) tropical (Coral Bay – coral reef).
Previous studies have demonstrated the influence surrounding habitats have on the macro invertebrate community composition (Virnstein and Howard 1987, Wildsmith et al. 2005, Stella et al. 2010). Exact habitat composition at each site are yet to be quantified, but continued research is planned to explore the effects of these differences as a potential driver of the community structures reported here.
Flora associated with collectors was separated from the faunal component, but has not been identified to date. Epiphytes have been shown to influence the invertebrate community structure (Martin-Smith 1993), and with some of the samples processed in this project containing large amounts of epiphytic algae, this may play an important role in community structure.
When BIOENV analysis was used to examine environmental effects on community composition in just either the tropics/sub-tropics (Rho=0.429, p>0.35) or temperate (Rho=0.211, p>0.3) locations, it still failed to determine any significant correlations between environmental factors and community structure.

24 Fisheries Research Report [Western Australia] No. 218, 2011
5.3 Objective 4
Identify indicator marine flora and fauna species for monitoring the influences of environmental change on Western Australian marine environment.
5.3.2 Orders influencing community composition changes
There were a total of 24 orders (or higher taxonomic levels) that were identified from the five sites. As a result, most sites had representatives of that order within their species composition (Figure 10).
Figure 10. Presence (filled square) or absence of an order (or higher – denoted with *) within the macro-invertebrate community from the five sampled sites.
Most noticeably was the presence of almost all orders at the Warnbro (southern most) site, with reduced numbers of orders progressively present in more northern sites. Ostracoda were not recorded at the northern locations of Coral Bay or Point Quobba, while Sipuncula were only recorded at these northern locations.
As there was limited difference in the occurrence of orders between locations, changes in community compositions were largely driven by changes in the relative abundances of these orders as opposed to their presence or absence at certain locations. There was a clear and significant (p<0.001) difference in the mean abundances of individuals from the five locations (Figure 11).

Fisheries Research Report [Western Australia] No. 218, 2011 25
Figure 11. Mean abundance (±SE) of all individuals collected at the five sites. Letters indicate where significant pair-wise differences occur.
Point Quobba had the lowest mean abundance of all sites and was significantly lower than all other sites except for Dongara. Contrasting this was Warnbro, which had the highest relative abundance, and significantly more than Dongara and Point Quobba. With the exception of Coral Bay, there appears to be an increasing trend in mean abundance from sites in a more southerly (temperate) direction. This is mainly driven by the abundances of amphipods since they contributed at least 70% to the total abundances at each site.
Orders that contributed most to community composition differences between locations (as determined by SIMPER) were examined individually (Figure 12).

26 Fisheries Research Report [Western Australia] No. 218, 2011
Figure 12. Mean untransformed abundance (±SE) of key orders for differentiating community structure, by site. * Indicates taxa only classified to a higher taxonomic resolution than Order.
Variation of Orders abundances accounts for the majority of the dissimilarity between sites (Figure 12) and between seasons at a site, as opposed to the presence or absence of particular Orders. The lack of Ostracoda was a major driving factor in the difference in communities between the northern topical/sub-tropical locations and those situated to the south. However, the reduced abundance of Tanaidacea, Bivalvia, Isopoda and Cumacaea at these sites, also significantly contributed to the difference in community structure.
5.3.3 Environmental impacts on taxa abundance
The habitat surrounding the collectors appears to be a main factor influencing community compositions at each location. Therefore the data set has been split into tropical/sub-tropical and temperate locations to further examine relationships between environmental factors and the abundance of individual Orders.

Fisheries Research Report [Western Australia] No. 218, 2011 27
5.3.3.1 Tropical / Sub-tropical locations
Of the 18 Orders present in tropical/sub-tropical locations, ten showed a significant relationship with either temperature or water movement (Table 4).
Table 4. Coefficients and their significance from multiple linear regression of Order abundance (log(x+1)) at Tropical / Sub-tropical sites and temperature (Temp) and relative water movement (Wave). Bold indicates significant coefficients.
Order Intercept Temp Wave AdjustedR squares
Amphipoda 7.0584 -0.0958 -1.1754 -0.0616Tanaidacea -22.0321* 1.003** 0.5055 0.5862Isopoda 12.4761 -0.4329 -1.6268* 0.0655Decapoda 1.1913 -0.0271 -0.2237 0.0041Cumacea -3.8579 0.1548 0.3019 0.1555Pycnogonida * -6.1146 0.2453 0.4785 0.1555Copepoda * 19.4109 -0.5101 -2.7524* 0.2635Bivalvia * 12.3612 -0.4027 -2.01* 0.3576Gastropoda * -10.2063 0.6409* 1.075 0.2919Polyplacophoran * 4.1935 -0.0805 -1.501** 0.6066Nudibranchia -19.8024* 0.8911* 0.6251 0.4023Cephalaspidea -1.6961 0.0797 0.0372 -0.1231Ophiuroidae * 2.8845 0.029 -2.1669* 0.5841Echinoidea * 2.2016 -0.0616 -0.3675 -0.1149Polychaeta * 18.068 -0.5257 -3.35*** 0.3826Platyhelminth * -2.5462 0.153 -0.5055 0.6406Acariformes 28.8152* -0.8726 -6.1833*** 0.7521Sipuncula * -4.9871 0.2112 0.2366 0.0767
The abundances of Tanaidacea, Gastropoda and Nudibranchia, were all positively related to water temperature with the Tanaidacea showing the strongest relationship (Figure 13).
Figure 13. Relationship between the abundance (log(x+1) transformed) of taxa and water temperature for tropical and sub-tropical sites (Coral Bay and Point Quobba).

28 Fisheries Research Report [Western Australia] No. 218, 2011
The abundance of seven Orders all showed significant negative relationships with water movement, with reducing abundances occurring at increasing levels of water movement. Acariformes were only found in the lowest water movement period (i.e. November at Coral Bay) (Figure 14).
Figure 14. Relationship between the abundance (log(x+1) transformed) of taxa and relative water movement for tropical and sub-tropical sites (Coral Bay and Point Quobba).
5.3.3.2 Temperate
Of the 22 Orders that occurred at the temperate sites (Dongara, Lancelin and Warnbro), nine demonstrated significant effects with water temperature, water movement or salinity. Of these, five varied significantly with two of these factors (Table 5).
Fisheries Research Report [Western Australia] No. 218, 2011 29
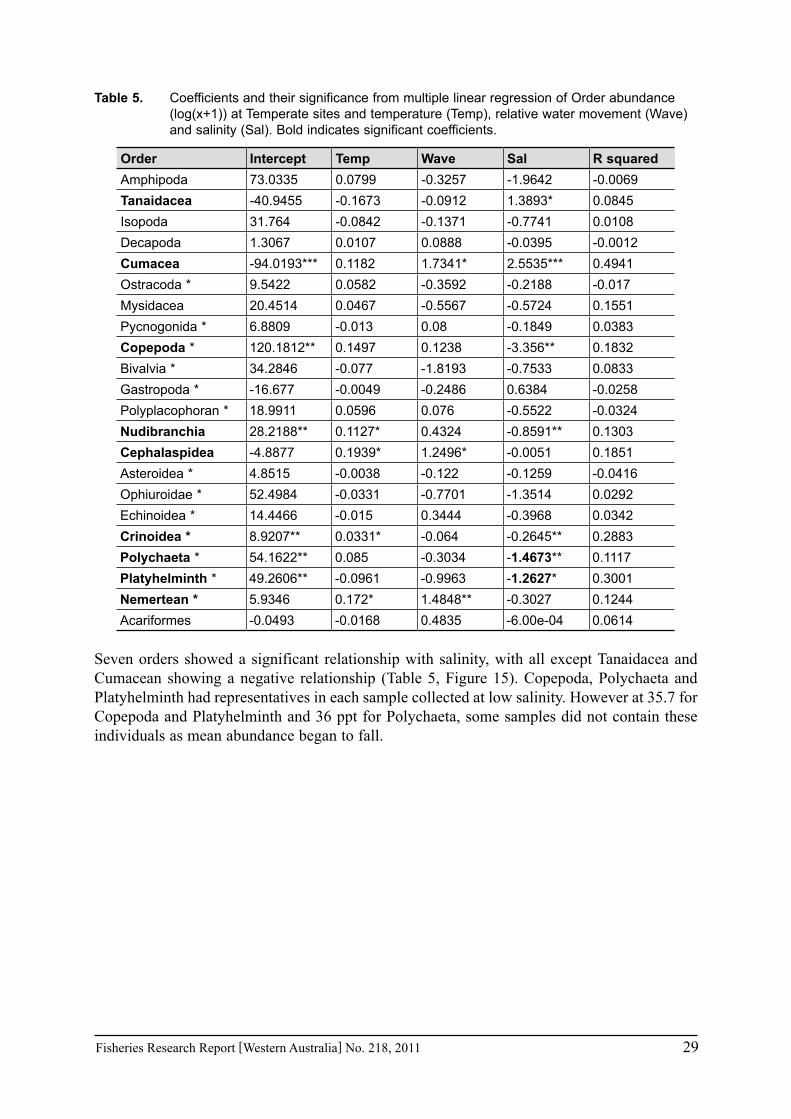
Table 5. Coefficients and their significance from multiple linear regression of Order abundance (log(x+1)) at Temperate sites and temperature (Temp), relative water movement (Wave) and salinity (Sal). Bold indicates significant coefficients.
Order Intercept Temp Wave Sal R squaredAmphipoda 73.0335 0.0799 -0.3257 -1.9642 -0.0069Tanaidacea -40.9455 -0.1673 -0.0912 1.3893* 0.0845Isopoda 31.764 -0.0842 -0.1371 -0.7741 0.0108Decapoda 1.3067 0.0107 0.0888 -0.0395 -0.0012Cumacea -94.0193*** 0.1182 1.7341* 2.5535*** 0.4941Ostracoda * 9.5422 0.0582 -0.3592 -0.2188 -0.017Mysidacea 20.4514 0.0467 -0.5567 -0.5724 0.1551Pycnogonida * 6.8809 -0.013 0.08 -0.1849 0.0383Copepoda * 120.1812** 0.1497 0.1238 -3.356** 0.1832Bivalvia * 34.2846 -0.077 -1.8193 -0.7533 0.0833Gastropoda * -16.677 -0.0049 -0.2486 0.6384 -0.0258Polyplacophoran * 18.9911 0.0596 0.076 -0.5522 -0.0324Nudibranchia 28.2188** 0.1127* 0.4324 -0.8591** 0.1303Cephalaspidea -4.8877 0.1939* 1.2496* -0.0051 0.1851Asteroidea * 4.8515 -0.0038 -0.122 -0.1259 -0.0416Ophiuroidae * 52.4984 -0.0331 -0.7701 -1.3514 0.0292Echinoidea * 14.4466 -0.015 0.3444 -0.3968 0.0342Crinoidea * 8.9207** 0.0331* -0.064 -0.2645** 0.2883Polychaeta * 54.1622** 0.085 -0.3034 -1.4673** 0.1117Platyhelminth * 49.2606** -0.0961 -0.9963 -1.2627* 0.3001Nemertean * 5.9346 0.172* 1.4848** -0.3027 0.1244Acariformes -0.0493 -0.0168 0.4835 -6.00e-04 0.0614
Seven orders showed a significant relationship with salinity, with all except Tanaidacea and Cumacean showing a negative relationship (Table 5, Figure 15). Copepoda, Polychaeta and Platyhelminth had representatives in each sample collected at low salinity. However at 35.7 for Copepoda and Platyhelminth and 36 ppt for Polychaeta, some samples did not contain these individuals as mean abundance began to fall.

30 Fisheries Research Report [Western Australia] No. 218, 2011
Figure 15. Relationship between the abundance (log(x+1) transformed) of taxa and salinities for temperate locations.
Five Orders showed significant relationships for more than one environmental parameter (Table 4). Cumacea showed a positive relationship for both salinity (blue dots) and water movement as represented by lines at low (5th quantile), mid (mean) and high (95th quantile) (Figure 16). The Nudibrachia demonstrated a significant negative relationship with salinity, however a positive relationship with temperature (as represented by lines for low, mid and high). Finally, there was a significant positive relationship for temperature and wave in Cephalaspidea and Nemertean abundance.
Figure 16. Relationship between the abundance (log(x+1) transformed) of taxa and multiple environmental parameters for the temperate locations. Salinities are shown in light blue dots), water movement in red lines and temperature in dark blue lines. The multiple lines represent three levels of the second most influential parameter in the multiple regression (low (5th quantile), mid (mean) and high (95th quantile).

Fisheries Research Report [Western Australia] No. 218, 2011 31
The positive relationships between the abundance of some taxa and water temperature and the negative relationships between abundance and water motion may be related to levels of productivity and habitat stability, respectively.
All of the fauna examined during this study are polikotherms, whose metabolic rate and activity levels are proportional to the ambient temperature. Periods of increased activity, i.e. feeding and reproduction, would increase the likelihood of many of these fauna encountering and settling on the collectors, thus increasing their abundance in our samples. The negative relationship with water movement (Figure 14) is probably an indication of how difficult in may be for many of these fauna to remain associated with the collectors during periods of high wave action, rather than reflecting a reduced abundance in the area. This is not surprising since periods of high wave action often lead to one or a number of puerulus collectors snapping their chain moorings and washing up on the beach.
There were several orders that demonstrated potential changes in their abundance associated with changing environmental conditions in both the tropical/sub-tropical and temperate locations. With increased sampling and validation of these results, many of these taxa may be used as future indicators of environmental change along the West Australian coast.
The relationships between taxa abundance and environmental variables examined above reflect environmental effects within a year and latitudinally. The correlations within a year may reflect general seasonal variations between abundance and environmental variable rather than a cause and effect. Variations in abundance and taxa between years are necessary to examine these relationships further.
Identification of some taxa to a species level has provided interesting information, and suggests that finer scale identification may be advantageous for reasons other than for describing the community composition. While not yet completed, the finer scale classification of Gastropoda has already identified the juvenile Strombus mutabilis at Dongara during winter, a species that has typically been thought to be restricted to tropical waters (Anne Brearley pers. comm.). This may be an example of a shift in this species range, with range shifts previously demonstrated in species as a response to increasing water temperatures (Perry et al. 2005). With water temperatures increasing off the Western Australian coast (Peace and Feng 2007) and predicted to continue, incursions of more tropical species in temperate collectors may become more prevalent. The warm, south-flowing Leeuwin Current also plays a significant role in the distribution of tropical species further south, particularly during La Nina periods when the Leeuwin Current is flowing strongly (Pearce and Hutchins 2009).
5.3.4 Correlations of taxa abundance and puerulus settlement
5.3.4.1 Community-level
The community composition differed significantly (Rho=0.246, p<0.001) between samples containing puerulus and those where they were absent (Figure 17a). This was also the case when the number of puerulus was categorised as none (0), low (1-4), moderate (5-9) or high (10+), (Rho=0.273, p<0.001) (Figure 17b).

32 Fisheries Research Report [Western Australia] No. 218, 2011
Figure 17. nMDS of community composition showing samples which had a) puerulus (red) or no puerulus (open circle) and b) none (open circle), 1-4 (black), 5-9 (blue) or 10+ (red) puerulus.
Communities containing lobsters were predominantly found in the tropical/subtropical locations to the right of the MDS, with a small cluster on the left of the nMDS at more northern temperate sites (Figure 17a). The categorical approach to puerulus numbers showed no significant difference between the high and moderate puerulus settlement samples, and similarly between the none and low puerulus settlement samples. Again the high and moderate sites appeared to be associated with the tropical/sub-tropical sites compared to the lower settlement samples in the temperate region. SIMPER analysis yielded, unsurprisingly, similar Order abundance difference for puerulus presence absence or categorical settlement as those found between sites, particularly tropical/subtropical and temperate locations.
Due to this obvious separation of tropical/sub-tropical and temperate locations again with puerulus abundances, coupled with significant variation in the timing of puerulus settlement (Figure 5), potential relationships between puerulus and other taxa abundance were explored separately for the tropical/sub-tropical (Coral Bay and Point Quobba) and temperate (Dongara, Lancelin and Warnbro) locations.
5.3.4.2 Tropical / Sub-tropical
The abundances of none of the taxa were found to vary significantly with puerulus abundance.
5.3.4.3 Temperate
In the temperate locations, the Class Copepoda showed a significant negative relationship between its abundance (log (x+1) transformed) and that of puerulus abundance (log (x+1) transformed) (Figure 18).

Fisheries Research Report [Western Australia] No. 218, 2011 33
Figure 18. Relationship between the abundance of puerulus (log (x+1)) and that of Copepods. Dashed line indicates the significant regression line.
The occurrence this significant negative relationships between lobsters and Copepoda in the temperate sites, may be reflective of juvenile lobster predation. Though his study focused on larger lobsters than was captured from the puerulus collectors, MacArthur (2009) found that Crustacea was a major taxa ingested by lobsters.
While there is a significant relationship between abundances of different Copepoda and that of puerulus, due to the current low puerulus settlements, it is difficult to assess with any certainty the validity of this relationship or the lack of identification of other potentially important taxa, which may show a relationship with puerulus abundance. It is also possible that the above relationship reflects seasonal variation in abundance of both taxa. Continued monitoring on an annual basis may see these initial patterns continue, though may also elucidate further significant patterns.
5.4 Objective 5
Detect any known or potential introduced marine pests within the Western Australian environment.
Currently, none of the samples processed have produced individuals from the list of marine pests (Appendix C). Classification of specimens to a finer taxonomic level will provide more certainty to this finding.

34 Fisheries Research Report [Western Australia] No. 218, 2011
6.0 Benefits and adoption
This project provided the ability to initiate the monitoring of flora and fauna associated with puerulus collectors during a period of low puerulus settlement. This project enabled a standard methodology to be developed to adequately capture the variation in community structure, such that possible effects of changes in environmental conditions can be monitored.
The monitoring program developed by this project has been adopted by the Department of Fisheries and integrated into the current puerulus monitoring program. This has therefore resulted in the start of a cost-effective long-term monitoring program assessing faunal communities.
In addition, this project modified and deployed a series of water movement loggers at sites throughout the coast. This is providing a valuable data-stream of localised water movement patterns, against which a number of other biological and ecological programs can compare results.
7.0 Further development
Due to the time-consuming nature of the sorting and identification process, future development will focus on increased taxonomic resolution where possible. Additional sites will also be added to the analysis, but most work will focus on examining the habitat or epiphytic influences on community structure. To fully examine possible links between puerulus numbers and co-existing fauna and flora, annual variations in puerulus abundance are required for assessment.

Fisheries Research Report [Western Australia] No. 218, 2011 35
8.0 Planned outcomes and conclusions
All objectives of this project have been met, providing an important baseline against which to compare future environmental changes on some of the floral and faunal communities on the West Australian coast.
Monitoring began during a period of low puerulus settlement to provide a baseline of current macro-invertebrate community composition. While only 5 sites and selected months were examined as part of this report, the collection of samples from the remaining sites and all months will allow more-detailed retrospective analysis of these samples.
A standard methodology has been developed and implemented to capture the biological and environmental data from sites along the West Australian coast. The methodology is broadly consistent with that of previous studies, and its utilisation of a pre-existing monitoring program makes it very cost effective. Analysis on number of collectors necessary to describe the community structure and the level of taxonomic resolution required conducted as part of this study, has further reduced and streamlined the collection of this valuable information.
The majority of variation between samples was spatial, though a significant temporal pattern also existed. Despite this, temperature, salinity and water movement didn’t directly influence community composition. Further research into epiphytic and habitat influence may elucidate potential mechanisms in structuring macro invertebrate communities.
While environmental parameters didn’t influence the community structure as a whole, there were significant correlations with taxa abundance and environmental conditions. Similarly there were taxa that showed a significant correlation in their abundance and that of puerulus settlement, however these need to be confirmed by examining annual variation. Due to the preliminary nature of this project, it was not possible to definitively identify correlates with either environment or puerulus settlement. However, the continuation of the project through a period of improved puerulus settlements may provide greater contrast against which to identify potential indicator taxa. The collection of tropical species in temperate locations (e.g. Strombus mutabilis) does highlight the benefit of such a monitoring program to identify shifts in species’ range.
Finally, no introduced marine pests identified. With increasing taxonomic resolution, greater certainty as to the occurrence of marine pests can be attained.

36 Fisheries Research Report [Western Australia] No. 218, 2011
9.0 ReferencesAnonymous. (2002). Nationally Listed Threatened Species and Ecological Communities under
the Commonwealth Environment Protection and Biodiversity Conservation Act 1999. http://www.environment.gov.au/biodiversity/threatened/publications/recovery/guidelines/pubs/recovery-2002.pdf.
Brown, R. (2009). Western Rock Lobster Low Puerulus Settlement Risk Assessment Workshop Held 1 and 2 April 2009. Western Australian Department of Fisheries, 3rd Floor The Atrium, 168 St Georges Terrace, Perth, Western Australia, 6000.
Cameron, S. (2009) Spatial and temporal variation in the colonisation of Jasus edwardsii puerulus collectors within South Australian waters. Honours Thesis. Flinders University.
Caputi N. and Brown R.S. (1993) The effect of environment on puerulus settlement of the western rock lobster (Panulirus cygnus) in Western Australia. Fisheries Oceanography 2: 1-10.
Caputi, N. (2008) Impact of the Leeuwin Current on the spatial distribution of the puerulus settlement of the western rock lobster (Panulirus cygnus) and implications for the fishery of Western Australia Fisheries Oceanography 17(2): 147-152.
Caputi N., Melville-Smith R., de Lestang S., How J., Thomson A., Stephenson P., Wright I. and Donohue K. (2008) Stock Assessment for the West Coast Rock Lobster Fishery - Draft, Department of Fisheries Western Australia, Perth.
Caputi, N., Brown, R.S. and Chubb, C.F. (1995). Regional prediction of the western Rock Lobster, Panulirus cygnus, commercial catch in Western Australia. Crustaceana, 68: 213-226.
Caputi N., Chubb C.F. and Pearce A. (2001) Environmental effects on recruitment of the western rock lobster, Panulirus cygnus. Marine and Freshwater Research 52: 1167-1174.
Carlton, J.T. (1985). Transoceanic and interoceanic dispersal of coastal marine organisms. The biology of ballast water. Oceanography and Marine Biology Annual Review 23: 13-374.
Clarke K.R. and Warwick R.M. (2001) Change in marine communities: an approach to statistical analysis and interpretation, Vol. PRIMER-E Ltd., Plymouth.
de Lestang, S., Hall, N.G. and Potter, I.C. (2003). Influence of a deep artificial entrance channel on the biological characteristics of the blue swimmer crab Portunus pelagicus in a large microtidal estuary. Journal of Experimental Marine Biology and Ecology. 295: 41-61.
de Lestang, S., Caputi, N. and Melville-Smith, R. (2009). Using fine-scale catch predictions to examine spatial variation in growth and catchability of Panulirus cygnus along the west coast of Australia. New Zealand Journal of marine and Freshwater Research. 43: 443-455.
de Lestang, S., Bellchambers, L.M., Caputi, N., Thomson, A.F., Pember, M.B., Johnston, D.J. and Harris, D.C. in press. Stock-recruitment-environment relationship in a Portunus pelagicus fishery in Western Australia. Wakefield Publication.
Edgar, G.J. (1991) Distribution patterns of mobile epifauna associated with rope fibre habitats within the Bathurst Harbour Estuary. Estuarine, Coastal and Shelf Science 33: 589-604.
Edgar, G.J. and Klumpp, D.W. (2003) Consistencies over regional scales in assemblages of mobile epifauna associated with natural and artificial plants of different shape. Aquatic Biology 75: 275-291.
Evans, S.N. and Abdo, D.A. 2010. A cost effective technique for measuring relative water movement for studies of benthic organisms. Marine Freshwater Research 61: 1327-1335
Gatt, A.H. (2009) Diversity and dynamics of the epifaunla assemblage of the larval lobster collection devices. Honours Thesis, University of New South Wales.
Gili J. and Petraitis P. (2009) Seasonal Dynamics. In: Wahl M (ed) Marine Hard Bottom Communities: Patterns, Dynamics, Diversity and Change. Springer, Berlin, Heidelberg, p 191-200.

Fisheries Research Report [Western Australia] No. 218, 2011 37
Hunter E. and Naylor E. (1993) Intertidal migration by the crab Carcinus maenas. Marine Ecology Progress Series 101: 131-138.
Jenkins S.R., Marshall D. and Fraschetti S. (2009) Settlement and Recruitment. In: Wahl M. (ed) Marine Hard Bottom Communities: Patterns, Dynamics, Diversity and Change. Springer-Verlag, Berlin, p 177-190.
Jones D.S. and Morgan G.J. (1994) A Field Guide to Crustaceans of Australian Waters, Vol. Reed Books, Chatswood, N.S.W.
MacArthur, L.D. (2009) Landscape structure influences the abundance, size structure, movements and trophic linkages of the western rock lobster, Panulirus cygnus, in shallow coastal waters. PhD Thesis. Edith Cowan University.
Martin-Smith, K.M. (1993)Abundance of mobile epifauna: the role of habitat complexity and predation by fishes. Journal of Experimental Marine Biology and Ecology 174:243-260.
Maunsell Australia. (2009). Climate Change Risk Assessment for the Australian Indian Ocean Territories. P.93. (http://www.ag.gov.au/www/agd/rwpattach.nsf/VAP/(3273BD3F76A7A5DEDAE36942A54D7D90)~Final+Report+CKI+and+CC.pdf/$file/Final+Report+CKI+and+CC.pdf).
Millennium Ecosystem Assessment. (2005). Ecosystems and human well-being: Biodiversity synthesis. World Resources Institute, Washington DC.
Padilla, D.K., Chotokowski, M.A. and Buchan, L.A.J. (1996). Predicting the spread of Zebra mussels (Dreissena polymorpha) to inland waters using boater movement patterns. Global Ecological and Biogeographical Letters 5: 353-359.
Pearce A., Rossbach M., Tait M. and Brown R. (1999) Sea temperature variability off Western Australia 1990 to 1994, Fisheries Research Division, Perth.
Peace, A. and Feng, M. (2007) Observations of warming on the Western Australian continental shelf. Marine and Freshwater Research, 2007, 58, 914–920.
Perry A.L., Low P.J., Ellis J.R. and Reynolds J.D. (2005) Climate change and distribution shifts in marine fishes. Science 308:1912-1915.
Phillips B. (1972) A semi-quantitative collector of the puerulus larvae of the western rock lobster Panulirus longipes cygnus George (Decapoda, Palinuridea). Crustaceana 22:147-154.
Phillips, B.F. and Macmillan, D.L. (1987) Antennal receptors in puerulus and postpuerulus stages of the rock lobster Panulirus cygnus (Decapoda: Palinuridae) and their potential role in puerulus navigation. Journal of Crustacean Biology 7(1): 122-135.
Phillips, B.F., Melville-Smith, R., Rossbach, M., Cheng, Y.W., Caputi, N., Thomson, A., Mills, D. and Crear, B. (2003). Towards establishing techniques for large scale harvesting of pueruli and obtaining a better understanding of mortality rates. FRDC Project 1998/302. p. 138.
R Development Core Team (2009) R: A Language and Environment for Statistical Computing, R Development Core Team, R Foundation for Statistical Computing, Vienna, Austria, http://www.R-project.org.
Shepherd S.A., Davies M. and Thomas M.I. (1997) Marine invertebrates of Southern Australia (Parts I, II and III), Vol. South Australian Research and Development Institute & The Flora and Fauna of South Australia Handbooks Committee, Adelaide.
Stella, J.S., Jones, G.P. and Pratchett, M.S. (2010) Variation in the structure of pepifaunal invertebrate assemblages among coral hosts. Coral Reefs. DOI:10.1007/s00338-010-0648-8.
Virnstein,R.W. and Howard, R.K. (1987) Motile epifauna of marine macrophytes in the Indian River Lagoon, Florida. II. Comparisons between drift algae and three species of seagrass. Bulletin of Marine Science 41(1): 13-26.

38 Fisheries Research Report [Western Australia] No. 218, 2011
Wells, F.E., McDonald, J.I. and Huisman, J.M. (2009) Introduced marine species in Western Australia, Department of Fisheries, Perth, Western Australia. 97pp.
Wildsmith M.D., Potter I.C., Valensi F.J. and Platell M.E. (2005) Do the assemblages of benthic macroinvertebrates in nearshore waters of Western Australia vary among habitat types, zones and seasons? Journal of the Marine Biological Association of the United Kingdom 85:217-232.
10.0 Appendices
10.1 Appendix A – Staff
The following staff was involved in this project at some stage, either directly employed or provided in-kind support:
Dr. Simon de Lestang
Mr. Jason How
Miss Shelly Foster
Dr David Abdo
Dr Matthew Pember
Mr Mark Rossbach
Mr Owen Young
Mr Josh Dornan
Mr Rhys Allen
Mr Adam Eastman
Mr Scott Evans
Mr Nick Konzewitsch
Mr Alan Pearce
Ms. Claire O’Calloghan
Mr Huw Dilley
Mr Adrian Thomson
Dr Nick Caputi
10.2 Appendix B – Obtaining water movement data
10.2.1 Background
Water movement, through either wind, swell or current driven movement is a major environmental impact on community structure. Previous means of means of collecting such information often required the use of expensive equipment. However, recent work has developed a more cost-effective way to measure relative water movement between locations (Evans and Abdo 2010).
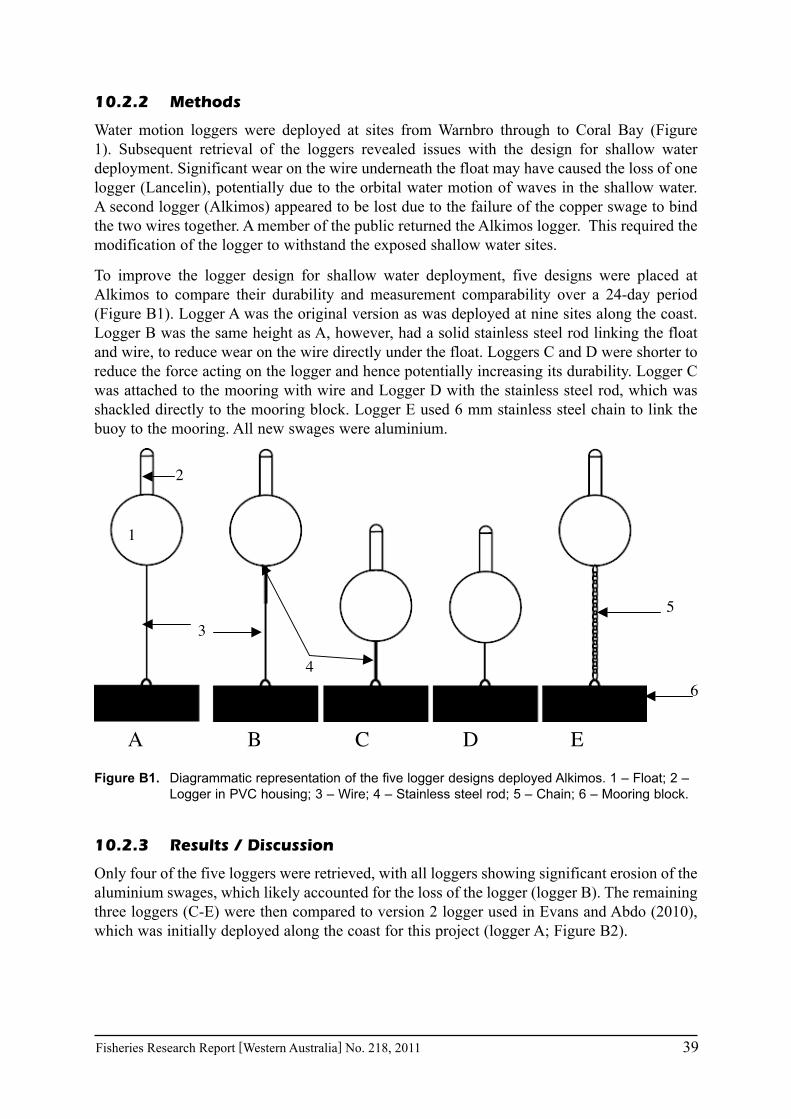
Fisheries Research Report [Western Australia] No. 218, 2011 39
10.2.2 Methods
Water motion loggers were deployed at sites from Warnbro through to Coral Bay (Figure 1). Subsequent retrieval of the loggers revealed issues with the design for shallow water deployment. Significant wear on the wire underneath the float may have caused the loss of one logger (Lancelin), potentially due to the orbital water motion of waves in the shallow water. A second logger (Alkimos) appeared to be lost due to the failure of the copper swage to bind the two wires together. A member of the public returned the Alkimos logger. This required the modification of the logger to withstand the exposed shallow water sites.
To improve the logger design for shallow water deployment, five designs were placed at Alkimos to compare their durability and measurement comparability over a 24-day period (Figure B1). Logger A was the original version as was deployed at nine sites along the coast. Logger B was the same height as A, however, had a solid stainless steel rod linking the float and wire, to reduce wear on the wire directly under the float. Loggers C and D were shorter to reduce the force acting on the logger and hence potentially increasing its durability. Logger C was attached to the mooring with wire and Logger D with the stainless steel rod, which was shackled directly to the mooring block. Logger E used 6 mm stainless steel chain to link the buoy to the mooring. All new swages were aluminium.
B C D EA
1
2
3
4
5
6
Figure B1. Diagrammatic representation of the five logger designs deployed Alkimos. 1 – Float; 2 – Logger in PVC housing; 3 – Wire; 4 – Stainless steel rod; 5 – Chain; 6 – Mooring block.
10.2.3 Results / Discussion
Only four of the five loggers were retrieved, with all loggers showing significant erosion of the aluminium swages, which likely accounted for the loss of the logger (logger B). The remaining three loggers (C-E) were then compared to version 2 logger used in Evans and Abdo (2010), which was initially deployed along the coast for this project (logger A; Figure B2).

40 Fisheries Research Report [Western Australia] No. 218, 2011
0
0.5Av
1
erag
1.5ail 2y
2.5
Wat
e
3
r M3.5n
4
09
2/09
/09
4/09
/09
6/09
/09
12/0
9/09 09
20/0
9/09
22/0
9/09
Date
31/0
8/
8/09
/09
10/0
9/09
1 164/09 /0
18/0
9//09
9/09
e D
otio
A C D E
Figure B2. Average daily water motion for the four logger designs (see Fig. B1) retrieved.
Logger E didn’t correlate well with logger A (r2 = 0.56) compared to loggers C and D that had an r2 of 0.98 and 0.99 respectively.
Given logger D’s good correlation with logger A, the stainless steel rod from the float eliminating a potential weak point and the direct attachment to the mooring block through a shackle (no need for swages), this was seen as the most appropriate design for determining relative water movement in shallows water (<3m). This design was then deployed at all 10 sites along the coast.
Water movement data has been collected from 9 sites, with the recent design providing data since October 2009 (Figure B3). Data was unavailable for Quobba due to the logger being lost due to storms and, with the site now no longer being monitored, a replacement logger was not installed.

Fisheries Research Report [Western Australia] No. 218, 2011 41
Figure B3. Magnitude of relative water movement from nine sites along the Western Australian coast.

42 Fisheries Research Report [Western Australia] No. 218, 2011
10.3 Appendix C – National Introduced Marine Pests
Coordination Group 55 pest monitoring species
l Chaetoce vAlexandrium u Chaetoce ornisAlexandrium Psuedo-n s taAlexandrium eDinophysisn a Beroe ovaGymnodium t Mnemiop yiPfisterisia pi Acartica t
Bonnemaiso Blackford niCaulerpa racCaulerpa tax Sabella sp anCodium frag il Hydroides huGrateloupis t u Marenzel pSargassum mUnidaria pin lanus e sWomersleye c Balanus im u
Corbula amu Callinecte uirectu Carcinusm s
imnoperna i Charybdisarenar Eriocheir s
corbula Hemigrap g eusa s i ap an sa pa s harrisiina
Perna viridis DidemnumCrassostrea
Asteriasa siCrepidula foRapana ven Neogobiu n us
Siganus luPsuedodiap s Siganus r sTortanus de at Tridentige at
Tridentige ci
BALLASs
Alexandrium catenela roscon olutus minut m rosconcavic monilatum itzschia eria tamar nseorvegic ta catena um sisleidscicida onsa
nia hamifera ia virgi caemosaifoliaile frag
allanz diant
iise
urutur laria sp .uticum
natifida Ba burneulla seta ea provis s
rensis s sapid sEnsisd s aenuL fortune japonicaMya
riia pp.
Va gibba sis san uinMusculist enhousa Hemigr
Rhithrosis tak oi
MytilopsisPerna per
llei nopeu
spp.gigas
muren srnicataosa s mela ostom
ridustomus mariniu ivulatuxtrilob us r barb us
r bifas atus
T WATERDinoflagellate Diatoms
Ctenophorans
HULL F
Copepods
OULINGAlgae
Fish
Group and S S s
ves
pecies Group and pecie
Bival
Cnidarians
Polychaetes
Barn
Gastropods
Ascidians
acles
Crabs
Seastar

Fisheries Research Report [Western Australia] No. 218, 2011 43
10.4 Appendix D – Raw Data
Taxa ID NAmphipod WM2 2328Caprellid WM2 14Tanaid WM2 238Flabellifera WM2 23cf Januridae WM2 562Shrimp WM2 132Cumacean WM2 2Mottled hairy WM2 58Dimpled WM2 1Big yellow soft WM2 10Copepod WM2 299Bivalve WM2 68Gastropoda WM2 122Opistho nudibranch WM2 1Ophiuroid WM2 30Echinoid WM2 4Polychaete WM2 24Polychaete WM2 65Platyhelminth WM2 1Arachnid mite WM2 3Majid Dumea latipes WM2 9Majid Schzophrys rufescens
WM2 1
Halicarcinus ovatus WM2 3Halicarcinus sp. 2 WM2 1Pilumnid Pilumnus sp. 1 WM2 2Porcellanidae Pisidia sp. WM2 1Amphipod WM3 1436Caprellid WM3 86Tanaid WM3 605Flabellifera WM3 22cf Januridae WM3 354Shrimp WM3 28Cumacean WM3 2Mottled hairy WM3 191Dimpled WM3 8Big yellow soft WM3 5Pycnogonid WM3 2Copepod WM3 299Bivalve WM3 30Gastropoda WM3 167
Taxa ID NPolyplacophoran WM3 2Opistho nudibranch WM3 3Asteroid WM3 1Ophiuroid WM3 8Echinoid WM3 2Polychaete WM3 23Polychaete WM3 35Platyhelminth WM3 20Halicarcinus ovatus WM3 1Halicarcinus sp. 3 WM3 1Amphipod WM4 1695Caprellid WM4 109Tanaid WM4 283Flabellifera WM4 43cf Januridae WM4 464Shrimp WM4 138Cumacean WM4 2Mottled hairy WM4 211Dimpled WM4 147Big yellow soft WM4 30Pycnogonid WM4 1Copepod WM4 135Bivalve WM4 274Gastropoda WM4 453Polyplacophoran WM4 1Opistho nudibranch WM4 2Opistho bubble shell WM4 1Ophiuroid WM4 145Echinoid WM4 10Polychaete WM4 47Polychaete WM4 35Platyhelminth WM4 8Majid Dumea latipes WM4 12Halicarcinus ovatus WM4 1Halicarcinus sp. 2 WM4 1Unknown Halicarcinus WM4 3Pilumnid Pilumnus sp. 1 WM4 3Porcellanidae Pisidia sp. WM4 3Unidentified WM4 2Amphipod WM6 1039Caprellid WM6 2

44 Fisheries Research Report [Western Australia] No. 218, 2011
Taxa ID NTanaid WM6 154Flabellifera WM6 46cf Januridae WM6 205Anthuridae WM6 1Shrimp WM6 368Cumacean WM6 1Mottled hairy WM6 33Dimpled WM6 4Big yellow soft WM6 15Copepod WM6 121Bivalve WM6 73Gastropoda WM6 141Opistho nudibranch WM6 1Ophiuroid WM6 25Polychaete WM6 21Polychaete WM6 29Platyhelminth WM6 1Majid Dumea latipes WM6 29Halicarcinus ovatus WM6 1Halicarcinus sp. 3 WM6 1Unknown Halicarcinus WM6 1Pilumnid Pilumnus sp. 1 WM6 1Porcellanidae Pisidia sp. WM6 3Unidentified WM6 1Amphipod WA2 1027Tanaid WA2 146Flabellifera WA2 82cf Januridae WA2 322Valvifera WA2 13Shrimp WA2 27Mottled hairy WA2 34Dimpled WA2 10Pycnogonid WA2 1Copepod WA2 54Bivalve WA2 65Gastropoda WA2 63Ophiuroid WA2 12Echinoid WA2 1Polychaete WA2 17Polychaete WA2 25Platyhelminth WA2 3Arachnid mite WA2 2Majid Dumea latipes WA2 2
Taxa ID NHalicarcinus ovatus WA2 5Halicarcinus sp. 2 WA2 1Halicarcinus sp. 3 WA2 1Pilumnid Pilumnus sp. 1 WA2 1Porcellanidae Pisidia sp. WA2 1Amphipod WA3 1148Caprellid WA3 9Tanaid WA3 237Flabellifera WA3 20cf Januridae WA3 727Valvifera WA3 7Cumacean WA3 1Mottled hairy WA3 29Dimpled WA3 4Pycnogonid WA3 1Copepod WA3 77Bivalve WA3 64Gastropoda WA3 217Ophiuroid WA3 3Polychaete WA3 24Polychaete WA3 6Platyhelminth WA3 6Majid Dumea latipes WA3 1Halicarcinus ovatus WA3 1Halicarcinus sp. 2 WA3 1Unknown Halicarcinus WA3 1Unidentified WA3 1Amphipod WA4 1020Caprellid WA4 15Tanaid WA4 220Flabellifera WA4 65cf Januridae WA4 402Shrimp WA4 31Cumacean WA4 2Mottled hairy WA4 65Dimpled WA4 80Big yellow soft WA4 5Copepod WA4 46Bivalve WA4 124Gastropoda WA4 314Polyplacophoran WA4 1Ophiuroid WA4 101Echinoid WA4 2

Fisheries Research Report [Western Australia] No. 218, 2011 45
Taxa ID NPolychaete WA4 20Polychaete WA4 24Platyhelminth WA4 8Majid Dumea latipes WA4 2Unknown Majid WA4 1Halicarcinus ovatus WA4 2Unknown Halicarcinus WA4 1Unidentified WA4 1Amphipod WA6 1053Caprellid WA6 3Tanaid WA6 467Flabellifera WA6 48cf Januridae WA6 468Valvifera WA6 12Shrimp WA6 162Cumacean WA6 1Mottled hairy WA6 18Dimpled WA6 12Big yellow soft WA6 1Copepod WA6 48Bivalve WA6 251Gastropoda WA6 368Polyplacophoran WA6 1Ophiuroid WA6 103Echinoid WA6 2Polychaete WA6 38Polychaete WA6 11Platyhelminth WA6 8Majid Dumea latipes WA6 7Halicarcinus ovatus WA6 4Halicarcinus sp. 2 WA6 7Pilumnid Pilumnus sp. 1 WA6 1Amphipod WN2 6265Caprellid WN2 1Tanaid WN2 544Flabellifera WN2 54cf Januridae WN2 1146Anthuridae WN2 1Shrimp WN2 34Cumacean WN2 1Mottled hairy WN2 78Dimpled WN2 15Big yellow soft WN2 1
Taxa ID NMysid WN2 2Copepod WN2 200Bivalve WN2 81Gastropoda WN2 371Asteroid WN2 1Ophiuroid WN2 43Echinoid WN2 1Polychaete WN2 545Polychaete WN2 11Platyhelminth WN2 9Majid Dumea latipes WN2 4Unknown Majid WN2 1Halicarcinus sp. 2 WN2 1Unidentified WN2 1Amphipod WN3 1407Tanaid WN3 339Flabellifera WN3 16cf Januridae WN3 562Shrimp WN3 29Mottled hairy WN3 22Big yellow soft WN3 1Copepod WN3 58Bivalve WN3 63Gastropoda WN3 299Polychaete WN3 23Polychaete WN3 7Platyhelminth WN3 2Halicarcinus sp. 2 WN3 1Halicarcinus sp. 3 WN3 1Unidentified WN3 1Megalopae 2 small clear WN3 1Amphipod WN4 5214Caprellid WN4 12Tanaid WN4 516Flabellifera WN4 23cf Januridae WN4 945Anthuridae WN4 1Shrimp WN4 20Cumacean WN4 2Mottled hairy WN4 169Dimpled WN4 122Big yellow soft WN4 2Mysid WN4 1

46 Fisheries Research Report [Western Australia] No. 218, 2011
Taxa ID NPycnogonid WN4 1Copepod WN4 91Bivalve WN4 303Gastropoda WN4 579Polyplacophoran WN4 4Opistho nudibranch WN4 2Ophiuroid WN4 176Echinoid WN4 1Polychaete WN4 49Polychaete WN4 12Platyhelminth WN4 13Majid Dumea latipes WN4 2Halicarcinus ovatus WN4 3Halicarcinus sp. 2 WN4 6Halicarcinus sp. 3 WN4 1Halicarcinus sp. 4 WN4 2Unknown Halicarcinus WN4 1Unidentified WN4 1Amphipod WN6 2660Tanaid WN6 49Flabellifera WN6 74cf Januridae WN6 311Shrimp WN6 48Cumacean WN6 3Mottled hairy WN6 84Dimpled WN6 16Big yellow soft WN6 1Copepod WN6 51Bivalve WN6 128Gastropoda WN6 249Asteroid WN6 1Ophiuroid WN6 114Polychaete WN6 45Polychaete WN6 4Platyhelminth WN6 12Nemertean WN6 1Majid Dumea latipes WN6 3Unknown Majid WN6 1Halicarcinus ovatus WN6 2Halicarcinus sp. 2 WN6 2Porcellanidae Pisidia sp. WN6 1Megalopae 2 small clear WN6 1Amphipod WJ2 2047
Taxa ID NCaprellid WJ2 24Tanaid WJ2 81Flabellifera WJ2 37cf Januridae WJ2 252Shrimp WJ2 6Mottled hairy WJ2 453Dimpled WJ2 12Big yellow soft WJ2 8Mysid WJ2 2Copepod WJ2 12Bivalve WJ2 108Gastropoda WJ2 501Polyplacophoran WJ2 4Ophiuroid WJ2 57Polychaete WJ2 62Polychaete WJ2 89Platyhelminth WJ2 2Majid Dumea latipes WJ2 3Pilumnid Pilumnus sp. 1 WJ2 7Megalopae 2 small clear WJ2 1Amphipod WJ3 4990Caprellid WJ3 8Tanaid WJ3 37Flabellifera WJ3 48cf Januridae WJ3 95Valvifera WJ3 3Shrimp WJ3 9Mottled hairy WJ3 203Dimpled WJ3 2Big yellow soft WJ3 5Mysid WJ3 14Copepod WJ3 113Bivalve WJ3 74Gastropoda WJ3 634Polyplacophoran WJ3 6Opistho nudibranch WJ3 1Asteroid WJ3 1Ophiuroid WJ3 17Crinoid WJ3 1Polychaete WJ3 32Polychaete WJ3 79Platyhelminth WJ3 4Halicarcinus sp. 5 WJ3 1

Fisheries Research Report [Western Australia] No. 218, 2011 47
Taxa ID NPilumnid Pilumnus sp. 1 WJ3 1Unidentified WJ3 1Amphipod WJ5 2412Caprellid WJ5 45Tanaid WJ5 166Flabellifera WJ5 73cf Januridae WJ5 506Shrimp WJ5 45Cumacean WJ5 6Mottled hairy WJ5 832Dimpled WJ5 53Big yellow soft WJ5 14Copepod WJ5 646Bivalve WJ5 122Gastropoda WJ5 515Polyplacophoran WJ5 2Ophiuroid WJ5 259Crinoid WJ5 1Polychaete WJ5 77Polychaete WJ5 95Platyhelminth WJ5 3Majid Dumea latipes WJ5 4Majid Schzophrys rufescens
WJ5 1
Unknown Majid WJ5 1Halicarcinus sp. 2 WJ5 1Halicarcinus sp. 3 WJ5 1Unknown Halicarcinus WJ5 1Pilumnid Pilumnus sp. 1 WJ5 3Unidentified WJ5 1Megalopae 2 small clear WJ5 1Amphipod WJ6 1962Tanaid WJ6 35Flabellifera WJ6 10cf Januridae WJ6 40Valvifera WJ6 2Anthuridae WJ6 1Shrimp WJ6 54Mottled hairy WJ6 3Big yellow soft WJ6 1Copepod WJ6 104Bivalve WJ6 7Gastropoda WJ6 60
Taxa ID NOpistho nudibranch WJ6 7Echinoid WJ6 1Polychaete WJ6 41Polychaete WJ6 84Platyhelminth WJ6 1Majid Dumea latipes WJ6 8Unknown Majid WJ6 1Halicarcinus ovatus WJ6 4Amphipod LA1 1065Tanaid LA1 745Flabellifera LA1 35cf Januridae LA1 147Shrimp LA1 10Cumacean LA1 22Mottled hairy LA1 316Dimpled LA1 30Copepod LA1 7Bivalve LA1 69Gastropoda LA1 594Polyplacophoran LA1 2Ophiuroid LA1 11Echinoid LA1 1Polychaete LA1 11Polychaete LA1 57Majid Dumea latipes LA1 4Simocarcinus obtusirostrus
LA1 1
Halicarcinus ovatus LA1 4Halicarcinus sp. 3 LA1 2Pilumnid Pilumnus sp. 1 LA1 6Grapsid Plagusia sp. 2 LA1 2Amphipod LA3 1023Tanaid LA3 146Flabellifera LA3 62cf Januridae LA3 218Valvifera LA3 3Shrimp LA3 22Cumacean LA3 12Mottled hairy LA3 16Copepod LA3 4Bivalve LA3 2Gastropoda LA3 252Polyplacophoran LA3 3

48 Fisheries Research Report [Western Australia] No. 218, 2011
Taxa ID NOphiuroid LA3 2Polychaete LA3 9Polychaete LA3 20Majid Dumea latipes LA3 2Unknown Majid LA3 1Halicarcinus ovatus LA3 1Pilumnid Pilumnus sp. 1 LA3 5Amphipod LA4 2448Tanaid LA4 768Flabellifera LA4 48cf Januridae LA4 985Valvifera LA4 2Shrimp LA4 131Cumacean LA4 54Mottled hairy LA4 456Dimpled LA4 4Copepod LA4 258Bivalve LA4 4Gastropoda LA4 1000Polyplacophoran LA4 6Opistho bubble shell LA4 1Asteroid LA4 1Ophiuroid LA4 39Polychaete LA4 72Polychaete LA4 25Platyhelminth LA4 1Nemertean LA4 1Arachnid mite LA4 2Majid Dumea latipes LA4 7Majid Acanthonyx sp. 2 LA4 4Majid Majinae LA4 1Halicarcinus ovatus LA4 1Unknown Halicarcinus LA4 1Pilumnid Pilumnus sp. 1 LA4 3Amphipod LA5 1080Caprellid LA5 3Tanaid LA5 520Flabellifera LA5 45cf Januridae LA5 415Valvifera LA5 7Anthuridae LA5 1Shrimp LA5 64Cumacean LA5 59
Taxa ID NMottled hairy LA5 292Dimpled LA5 2Big yellow soft LA5 1Copepod LA5 206Bivalve LA5 4Gastropoda LA5 945Opistho nudibranch LA5 2Ophiuroid LA5 9Polychaete LA5 91Polychaete LA5 10Platyhelminth LA5 2Nemertean LA5 8Arachnid mite LA5 6Portunid Thalamita parvidens
LA5 1
Majid Dumea latipes LA5 2Pilumnid Pilumnus sp. 1 LA5 1Unidentified LA5 1Amphipod LN1 984Tanaid LN1 278Flabellifera LN1 168cf Januridae LN1 108Valvifera LN1 1Anthuridae LN1 6Shrimp LN1 36Lobster LN1 2Cumacean LN1 4Mottled hairy LN1 484Dimpled LN1 7Big yellow soft LN1 1Mysid LN1 2Copepod LN1 6Bivalve LN1 107Gastropoda LN1 735Ophiuroid LN1 31Echinoid LN1 5Polychaete LN1 14Polychaete LN1 9Majid Dumea latipes LN1 6Majid Acanthonyx sp. 2 LN1 2Unknown Majid LN1 2Halicarcinus ovatus LN1 1Halicarcinus sp. 3 LN1 1

Fisheries Research Report [Western Australia] No. 218, 2011 49
Taxa ID NPilumnid Pilumnus sp. 1 LN1 3Unidentified LN1 1Amphipod LN3 592Tanaid LN3 234Flabellifera LN3 71cf Januridae LN3 198Anthuridae LN3 3Shrimp LN3 9Cumacean LN3 12Mottled hairy LN3 170Copepod LN3 8Bivalve LN3 13Gastropoda LN3 529Asteroid LN3 1Ophiuroid LN3 12Polychaete LN3 20Polychaete LN3 3Majid Dumea latipes LN3 3Pilumnid Pilumnus sp. 1 LN3 5Amphipod LN4 857Tanaid LN4 166Flabellifera LN4 28cf Januridae LN4 266Anthuridae LN4 2Shrimp LN4 42Cumacean LN4 14Mottled hairy LN4 389Big yellow soft LN4 2Mysid LN4 3Copepod LN4 15Bivalve LN4 7Gastropoda LN4 863Polyplacophoran LN4 7Asteroid LN4 1Ophiuroid LN4 69Polychaete LN4 8Polychaete LN4 4Platyhelminth LN4 3Nemertean LN4 1Majid Dumea latipes LN4 1Majid Acanthonyx sp. 2 LN4 3Unknown Majid LN4 2Pilumnid Pilumnus sp. 1 LN4 4
Taxa ID NUnidentified LN4 2Amphipod LN5 732Caprellid LN5 3Tanaid LN5 302Flabellifera LN5 27cf Januridae LN5 183Anthuridae LN5 4Shrimp LN5 23Cumacean LN5 12Mottled hairy LN5 502Dimpled LN5 4Big yellow soft LN5 2Mysid LN5 1Copepod LN5 147Bivalve LN5 4Gastropoda LN5 763Polyplacophoran LN5 2Ophiuroid LN5 39Polychaete LN5 37Polychaete LN5 6Platyhelminth LN5 6Nemertean LN5 1Arachnid mite LN5 1Majid Dumea latipes LN5 1Majid Acanthonyx sp. 2 LN5 5Unknown Majid LN5 5Halicarcinus ovatus LN5 2Halicarcinus sp. 2 LN5 1Halicarcinus sp. 5 LN5 1Pilumnid Pilumnus sp. 1 LN5 4Unidentified LN5 1Amphipod DM1 555Tanaid DM1 90Flabellifera DM1 20cf Januridae DM1 105Anthuridae DM1 5Shrimp DM1 86Cumacean DM1 34Mottled hairy DM1 251Big yellow soft DM1 8Copepod DM1 30Bivalve DM1 23Gastropoda DM1 387

50 Fisheries Research Report [Western Australia] No. 218, 2011
Taxa ID NOpistho bubble shell DM1 44Ophiuroid DM1 2Polychaete DM1 187Polychaete DM1 1Platyhelminth DM1 2Nemertean DM1 12Portunid Thalamita sima DM1 2Majid Dumea latipes DM1 15Majid Menaethius sp. DM1 2Unknown Majid DM1 1Xanthid Actaea peronii DM1 1Amphipod DM3 129Tanaid DM3 85Flabellifera DM3 2cf Januridae DM3 19Shrimp DM3 11Cumacean DM3 11Mottled hairy DM3 142Big yellow soft DM3 4Bivalve DM3 14Gastropoda DM3 22Opistho bubble shell DM3 1Ophiuroid DM3 2Polychaete DM3 12Platyhelminth DM3 1Majid Dumea latipes DM3 15Xanthid Actaea peronii DM3 4Unidentified DM3 1Amphipod DM5 1614Tanaid DM5 87Flabellifera DM5 20cf Januridae DM5 83Valvifera DM5 1Anthuridae DM5 2Shrimp DM5 28Cumacean DM5 6Mottled hairy DM5 70Copepod DM5 1Bivalve DM5 20Gastropoda DM5 259Ophiuroid DM5 1Polychaete DM5 20Polychaete DM5 2
Taxa ID NNemertean DM5 2Majid Dumea latipes DM5 20Halicarcinus ovatus DM5 1Halicarcinus sp. 2 DM5 1Halicarcinus sp. 5 DM5 2Unidentified DM5 2Amphipod DM6 523Tanaid DM6 700Flabellifera DM6 1cf Januridae DM6 109Shrimp DM6 7Cumacean DM6 15Mottled hairy DM6 275Big yellow soft DM6 1Copepod DM6 5Bivalve DM6 109Gastropoda DM6 1129Opistho bubble shell DM6 4Ophiuroid DM6 26Polychaete DM6 45Polychaete DM6 3Platyhelminth DM6 1Nemertean DM6 16Majid Dumea latipes DM6 14Majid Menaethius sp. DM6 1Xanthid Actaea peronii DM6 2Halicarcinus sp. 3 DM6 1Halicarcinus sp. 5 DM6 1Amphipod DA1 331Tanaid DA1 203Flabellifera DA1 7cf Januridae DA1 39Valvifera DA1 1Shrimp DA1 29Cumacean DA1 7Mottled hairy DA1 30Big yellow soft DA1 4Copepod DA1 12Bivalve DA1 4Gastropoda DA1 110Opistho bubble shell DA1 2Ophiuroid DA1 3Polychaete DA1 13

Fisheries Research Report [Western Australia] No. 218, 2011 51
Taxa ID NPolychaete DA1 18Majid Dumea latipes DA1 3Halicarcinus ovatus DA1 1Unknown Halicarcinus DA1 1Amphipod DA3 418Tanaid DA3 19Flabellifera DA3 2cf Januridae DA3 67Shrimp DA3 4Cumacean DA3 2Mottled hairy DA3 26Dimpled DA3 2Copepod DA3 4Bivalve DA3 12Gastropoda DA3 280Polychaete DA3 5Polychaete DA3 11Majid Dumea latipes DA3 1Majid Menaethius sp. DA3 1Halicarcinus sp. 5 DA3 1Unidentified DA3 1Amphipod DA5 396Tanaid DA5 245cf Januridae DA5 122Shrimp DA5 4Mottled hairy DA5 8Dimpled DA5 1Bivalve DA5 6Gastropoda DA5 58Ophiuroid DA5 1Polychaete DA5 9Polychaete DA5 2Halicarcinus ovatus DA5 2Amphipod DA6 233Tanaid DA6 37Flabellifera DA6 1cf Januridae DA6 25Shrimp DA6 6Cumacean DA6 1Mottled hairy DA6 24Big yellow soft DA6 1Bivalve DA6 51Gastropoda DA6 466
Taxa ID NOphiuroid DA6 2Echinoid DA6 1Polychaete DA6 10Polychaete DA6 46Nemertean DA6 1Xanthid Actaea peronii DA6 1Halicarcinus ovatus DA6 1Amphipod DN1 685Tanaid DN1 277Flabellifera DN1 19cf Januridae DN1 19Valvifera DN1 4Shrimp DN1 55Lobster DN1 1Cumacean DN1 8Mottled hairy DN1 74Big yellow soft DN1 22Copepod DN1 3Bivalve DN1 14Gastropoda DN1 69Ophiuroid DN1 6Polychaete DN1 11Polychaete DN1 20Platyhelminth DN1 1Halicarcinus ovatus DN1 2Halicarcinus sp. 2 DN1 1Amphipod DN3 1832Tanaid DN3 84Flabellifera DN3 6cf Januridae DN3 13Shrimp DN3 25Lobster DN3 3Cumacean DN3 9Mottled hairy DN3 376Big yellow soft DN3 1Copepod DN3 1Bivalve DN3 31Gastropoda DN3 244Opistho bubble shell DN3 1Ophiuroid DN3 1Polychaete DN3 5Platyhelminth DN3 1Halicarcinus ovatus DN3 3

52 Fisheries Research Report [Western Australia] No. 218, 2011
Taxa ID NHalicarcinus sp. 2 DN3 1Halicarcinus sp. 5 DN3 1Unidentified DN3 1Amphipod DN5 1352Tanaid DN5 1405Flabellifera DN5 7cf Januridae DN5 385Valvifera DN5 4Shrimp DN5 19Lobster DN5 5Cumacean DN5 2Mottled hairy DN5 57Dimpled DN5 2Copepod DN5 1Bivalve DN5 25Gastropoda DN5 264Ophiuroid DN5 2Polychaete DN5 17Polychaete DN5 22Majid Dumea latipes DN5 2Majid Acanthonyx sp. 2 DN5 1Halicarcinus ovatus DN5 2Unknown Halicarcinus DN5 1Pilumnid Pilumnus sp. 1 DN5 1Amphipod DN6 1180Tanaid DN6 90cf Januridae DN6 15Shrimp DN6 9Lobster DN6 2Cumacean DN6 5Mottled hairy DN6 2304Dimpled DN6 2Big yellow soft DN6 20Copepod DN6 1Bivalve DN6 259Gastropoda DN6 436Ophiuroid DN6 8Echinoid DN6 1Polychaete DN6 69Polychaete DN6 29Platyhelminth DN6 1Amphipod DJ1 759Tanaid DJ1 204
Taxa ID NFlabellifera DJ1 51cf Januridae DJ1 26Valvifera DJ1 1Anthuridae DJ1 1Shrimp DJ1 78Cumacean DJ1 68Mottled hairy DJ1 278Big yellow soft DJ1 7Bivalve DJ1 6Gastropoda DJ1 968Polyplacophoran DJ1 2Opistho bubble shell DJ1 2Ophiuroid DJ1 8Polychaete DJ1 73Polychaete DJ1 2Halicarcinus ovatus DJ1 1Halicarcinus sp. 5 DJ1 2Pilumnid Pilumnus sp. 1 DJ1 2cf Dromiidae sp. 1 DJ1 1Amphipod DJ3 604Tanaid DJ3 840Flabellifera DJ3 9cf Januridae DJ3 33Shrimp DJ3 56Cumacean DJ3 98Mottled hairy DJ3 256Dimpled DJ3 1Big yellow soft DJ3 13Copepod DJ3 82Bivalve DJ3 22Gastropoda DJ3 953Opistho bubble shell DJ3 1Ophiuroid DJ3 14Polychaete DJ3 12Polychaete DJ3 4Portunid Thalamita sima DJ3 1Majid Dumea latipes DJ3 1Unknown Majid DJ3 1Xanthid Actaea peronii DJ3 1Unknown Halicarcinus DJ3 1Unidentified DJ3 3Amphipod DJ5 881Tanaid DJ5 397

Fisheries Research Report [Western Australia] No. 218, 2011 53
Taxa ID NFlabellifera DJ5 9cf Januridae DJ5 50Anthuridae DJ5 3Shrimp DJ5 59Lobster DJ5 1Cumacean DJ5 109Mottled hairy DJ5 238Dimpled DJ5 1Big yellow soft DJ5 1Copepod DJ5 141Bivalve DJ5 32Gastropoda DJ5 1185Polyplacophoran DJ5 1Opistho bubble shell DJ5 1Ophiuroid DJ5 3Polychaete DJ5 30Polychaete DJ5 17Arachnid mite DJ5 1Portunid Thalamita sima DJ5 1Majid Dumea latipes DJ5 1Halicarcinus ovatus DJ5 1Halicarcinus sp. 2 DJ5 2Pilumnid Pilumnus sp. 1 DJ5 2Amphipod DJ6 130Tanaid DJ6 820Flabellifera DJ6 1cf Januridae DJ6 24Shrimp DJ6 37Cumacean DJ6 37Mottled hairy DJ6 1145Dimpled DJ6 5Copepod DJ6 18Bivalve DJ6 268Gastropoda DJ6 562Polyplacophoran DJ6 2Ophiuroid DJ6 12Polychaete DJ6 37Polychaete DJ6 7Portunid Thalamita sima DJ6 3Halicarcinus sp. 2 DJ6 1Amphipod QAA 337Tanaid QAA 1cf Januridae QAA 4
Taxa ID NShrimp QAA 9Copepod QAA 17Gastropoda QAA 261Opistho nudibranch QAA 1Opistho bubble shell QAA 1Polychaete QAA 2Majid Acanthonyx euryseroche
QAA 7
Megalopae 2 small clear QAA 1Amphipod QAB 318Tanaid QAB 2cf Januridae QAB 1Shrimp QAB 22Lobster QAB 2Copepod QAB 63Bivalve QAB 1Gastropoda QAB 199Opistho nudibranch QAB 4Echinoid QAB 1Polychaete QAB 8Polychaete QAB 1Portunid Thalamita admete
QAB 2
Portunid Thalamita woodmasoni
QAB 2
Majid Acanthonyx euryseroche
QAB 2
Megalopae 1 large red QAB 1Amphipod QAC 87Tanaid QAC 4Shrimp QAC 6Copepod QAC 273Gastropoda QAC 274Opistho nudibranch QAC 1Polychaete QAC 3Portunid Thalamita woodmasoni
QAC 4
Majid Dumea latipes QAC 1Grapsid Plagusia sp. 1 QAC 3Unidentified QAC 1Amphipod QAD 298Tanaid QAD 1Flabellifera QAD 1cf Januridae QAD 1

54 Fisheries Research Report [Western Australia] No. 218, 2011
Taxa ID NShrimp QAD 11Copepod QAD 25Gastropoda QAD 328Opistho nudibranch QAD 3Ophiuroid QAD 1Echinoid QAD 1Polychaete QAD 1Portunid Thalamita woodmasoni
QAD 2
Majid Dumea smooth QAD 1Amphipod QN1 860Tanaid QN1 18Flabellifera QN1 1Shrimp QN1 136Lobster QN1 5Cumacean QN1 1Pycnogonid QN1 2Copepod QN1 40Bivalve QN1 1Gastropoda QN1 1572Polyplacophoran QN1 2Opistho nudibranch QN1 12Opistho bubble shell QN1 1Ophiuroid QN1 4Echinoid QN1 1Polychaete QN1 19Majid Dumea smooth QN1 1Majid Acanthonyx euryseroche
QN1 2
Majid triangle crab QN1 1Pilumnid smooth QN1 2Grapsid Plagusia sp. 1 QN1 3c.f. Galatheidae QN1 1Unidentified QN1 1Megalopae 1 large red QN1 1Megalopae 2 small clear QN1 1Amphipod QN2 649Tanaid QN2 10Shrimp QN2 34Lobster QN2 12Copepod QN2 36Gastropoda QN2 953Opistho nudibranch QN2 15
Taxa ID NPolychaete QN2 5Polychaete QN2 2Platyhelminth QN2 1Majid Acanthonyx euryseroche
QN2 2
Unknown Majid QN2 1Pilumnid Pilumnus sp. 1 QN2 1Megalopae 3 large clear 1 spine
QN2 1
Amphipod QN3 1316Tanaid QN3 7cf Januridae QN3 1Shrimp QN3 47Lobster QN3 13Copepod QN3 37Gastropoda QN3 179Opistho nudibranch QN3 2Ophiuroid QN3 1Polychaete QN3 5Polychaete QN3 1Platyhelminth QN3 1Sipunculid QN3 2Portunid Thalamita danae
QN3 1
Portunid Portunus pubescens
QN3 1
Grapsid Plagusia sp. 1 QN3 1Unidentified QN3 1Megalopae 1 large red QN3 2Amphipod CA1 3039cf Januridae CA1 11Shrimp CA1 12Lobster CA1 9Copepod CA1 43Gastropoda CA1 207Polychaete CA1 18Portunid Portunus sp. 1 CA1 8Majid Acanthonyx euryseroche
CA1 18
Megalopae 1 large red CA1 1Megalopae 2 small clear CA1 1Amphipod CA2 725cf Januridae CA2 12Shrimp CA2 11

Fisheries Research Report [Western Australia] No. 218, 2011 55
Taxa ID NLobster CA2 7Copepod CA2 172Bivalve CA2 1Gastropoda CA2 132Polychaete CA2 16Portunid Portunus pubescens
CA2 1
Portunid Portunus sp. 1 CA2 11Majid Acanthonyx euryseroche
CA2 9
Unknown Majid CA2 1Grapsid Plagusia sp. 1 CA2 9Megalopae 1 large red CA2 1Amphipod CA3 1245Flabellifera CA3 1cf Januridae CA3 17Shrimp CA3 70Lobster CA3 6Copepod CA3 15Bivalve CA3 2Gastropoda CA3 363Polyplacophoran CA3 1Polychaete CA3 93Polychaete CA3 2Portunid Thalamita admete
CA3 1
Portunid Portunus sp. 1 CA3 5Majid Dumea smooth CA3 1Majid Acanthonyx euryseroche
CA3 32
Grapsid Plagusia sp. 1 CA3 7Megalopae 1 large red CA3 3Megalopae 2 small clear CA3 4Amphipod CA4 2524Tanaid CA4 1Flabellifera CA4 1cf Januridae CA4 23Shrimp CA4 87Lobster CA4 17Copepod CA4 38Bivalve CA4 2Gastropoda CA4 217Echinoid CA4 1Polychaete CA4 58
Taxa ID NPolychaete CA4 3Portunid Thalamita admete
CA4 2
Portunid Portunus pubescens
CA4 5
Portunid Portunus sp. 1 CA4 5Majid Acanthonyx euryseroche
CA4 16
Unidentified CA4 1Megalopae 2 small clear CA4 2Megalopae 3 large clear 1 spine
CA4 1
Amphipod CN1 1814Tanaid CN1 10cf Januridae CN1 69Shrimp CN1 17Lobster CN1 1Copepod CN1 360Bivalve CN1 3Gastropoda CN1 210Polyplacophoran CN1 3Opistho nudibranch CN1 5Ophiuroid CN1 12Polychaete CN1 52Polychaete CN1 9Platyhelminth CN1 1Arachnid mite CN1 108Portunid Portunus pubescens
CN1 4
Portunid Portunus sp. 1 CN1 3Unknown Majid CN1 1Grapsid Plagusia sp. 1 CN1 1Amphipod CN2 3592Tanaid CN2 5cf Januridae CN2 30Shrimp CN2 23Copepod CN2 870Gastropoda CN2 332Polyplacophoran CN2 2Opistho nudibranch CN2 6Opistho bubble shell CN2 2Ophiuroid CN2 9Echinoid CN2 1Polychaete CN2 34

56 Fisheries Research Report [Western Australia] No. 218, 2011
Taxa ID NPolychaete CN2 16Platyhelminth CN2 2Arachnid mite CN2 108Portunid Thalamita admete
CN2 2
Portunid Portunus pubescens
CN2 3
Portunid Portunus sp. 1 CN2 2Majid Acanthonyx euryseroche
CN2 2
Unknown Majid CN2 5Unidentified CN2 1Megalopae 1 large red CN2 2Megalopae 2 small clear CN2 1Amphipod CN3 1780Tanaid CN3 15cf Januridae CN3 110Shrimp CN3 80Copepod CN3 339Bivalve CN3 6Gastropoda CN3 375Polyplacophoran CN3 5Opistho nudibranch CN3 14Ophiuroid CN3 18Polychaete CN3 39Polychaete CN3 19Platyhelminth CN3 1Arachnid mite CN3 66Sipunculid CN3 1Portunid Thalamita admete
CN3 8
Portunid Portunus pubescens
CN3 10
Portunid Portunus sp. 1 CN3 9Majid Acanthonyx euryseroche
CN3 10
Unknown Majid CN3 2Xanthid clown crab CN3 1Grapsid Plagusia sp. 1 CN3 1c.f. Galatheidae CN3 2Megalopae 3 large clear 1 spine
CN3 3
Amphipod CN4 1216Tanaid CN4 12
Taxa ID Ncf Januridae CN4 85Shrimp CN4 68Lobster CN4 1Copepod CN4 75Bivalve CN4 10Gastropoda CN4 334Polyplacophoran CN4 2Opistho nudibranch CN4 6Ophiuroid CN4 4Echinoid CN4 4Polychaete CN4 35Polychaete CN4 11Platyhelminth CN4 1Arachnid mite CN4 61Portunid Thalamita admete
CN4 1
Portunid Portunus pubescens
CN4 12
Portunid Portunus sp. 1 CN4 4Majid Acanthonyx euryseroche
CN4 5
Xanthid blushing crab CN4 1c.f. Galatheidae CN4 1Unidentified CN4 1Megalopae 3 large clear 1 spine
CN4 2