frdc final report design standard - pir.sa.gov.au · title: frdc final report design standard...
TRANSCRIPT

Developing a fishery independent estimate of
biomass for Snapper (Chrysophrys auratus)
M.A. Steer, R. McGarvey, A. Oxley, A.J. Fowler, G. Grammer, T.M Ward,
E. Westlake, D. Matthews and J. Matthews
June 2017
FRDC Project No 2014/019

ii
© 2017 Fisheries Research and Development Corporation and South Australian Research and Development Institute. All rights reserved. ISBN: 978-1-921563-96-6
Developing a fishery independent estimate of biomass for Snapper (Chrysophrys auratus).
2014/019
2017
Ownership of Intellectual property rights Unless otherwise noted, copyright (and any other intellectual property rights, if any) in this publication is owned by the Fisheries Research and Development Corporation and the South Australian Research and Development Institute. This work is copyright. Apart from any use as permitted under the Copyright Act 1968 (Cth), no part may be reproduced by
any process, electronic or otherwise, without the specific written permission of the copyright owner. Neither may information be stored electronically in any form whatsoever without such permission.
This publication (and any information sourced from it) should be attributed to Steer, M.A., McGarvey. R., Oxley, A., Fowler, A.J., Grammer, G., Ward, T.M., Westlake, E., Matthews, D. and Matthews, J. South Australian Research and Development Institute (Aquatic Sciences) 2017, Developing a fishery independent estimate of biomass for Snapper (Chrysophrys auratus). Adelaide, June.
Creative Commons licence All material in this publication is licensed under a Creative Commons Attribution 3.0 Australia Licence, save for content supplied by third parties, logos and the Commonwealth Coat of Arms.
Creative Commons Attribution 3.0 Australia Licence is a standard form licence agreement that allows you to copy, distribute, transmit and adapt this publication provided you attribute the work. A summary of the licence terms is available from creativecommons.org/licenses/by/3.0/au/deed.en. The full licence terms are available from creativecommons.org/licenses/by/3.0/au/legalcode.
Inquiries regarding the licence and any use of this document should be sent to: [email protected]
Disclaimer The authors warrant that they have taken all reasonable care in producing this report. The report has been through the SARDI internal review process, and has been formally approved for release by the Research Chief, Aquatic Sciences. Although all reasonable efforts have been made to ensure quality, SARDI does not warrant that the information in this report is free from errors or omissions. SARDI does not accept any liability for the contents of this report or for any consequences arising from its use or any reliance placed upon it. Material presented in these Administrative Reports may later be published in formal peer-reviewed scientific literature.
The information, opinions and advice contained in this document may not relate, or be relevant, to a readers particular circumstances. Opinions expressed by the authors are the individual opinions expressed by those persons and are not necessarily those of the publisher, research provider or the FRDC.
The Fisheries Research and Development Corporation plans, invests in and manages fisheries research and development throughout Australia. It is a statutory authority within the portfolio of the federal Minister for Agriculture, Fisheries and Forestry, jointly funded by the Australian Government and the fishing industry.
Researcher Contact Details FRDC Contact Details
Name:
Address:
Phone:
Fax:
Email:
Dr Michael Steer
SARDI (Aquatic Sciences)
2 Hamra Ave, West Beach, South Australia, 5024
08 8207 5435
08 8207 5481
Address:
Phone:
Fax:
Email: Web:
25 Geils Court
Deakin ACT 2600
02 6285 0400
02 6285 0499
www.frdc.com.au
In submitting this report, the researcher has agreed to FRDC publishing this material in its edited form.

iii
Contents
Contents ................................................................................................................................................. iii
Acknowledgments ................................................................................................................................. vi
Abbreviations ....................................................................................................................................... vii
Executive Summary ........................................................................................................................... viii
Introduction ......................................................................................................................................... 11
Background ......................................................................................................................................11
The Daily Egg Production Method (DEPM) ...................................................................................11
South Australian Snapper Fishery....................................................................................................13
Need .................................................................................................................................................14
Objectives ............................................................................................................................................. 15
Method .................................................................................................................................................. 16
Development of a DEPM for Snapper: ............................................................................................16
Study area ..................................................................................................................................16 Ichthyoplankton surveys ............................................................................................................18 Adult Reproductive Parameters .................................................................................................22 Spawning Biomass (Bsp) ............................................................................................................25
Cost-Benefit Analysis ......................................................................................................................26
Results................................................................................................................................................... 27
DEPM ..............................................................................................................................................27
Snapper Egg Validation .............................................................................................................27 Egg Density (Pt) ........................................................................................................................27 Spawning Area (A) ....................................................................................................................30 Daily Egg Production (D0) ........................................................................................................30 Female Weight (W) ...................................................................................................................32 Sex Ratio (R) .............................................................................................................................33 Batch Fecundity (F) ...................................................................................................................34 Spawning Fraction (S) ...............................................................................................................34 Spawning Biomass (SB) ............................................................................................................35 Sensitivity Analysis ...................................................................................................................36
Cost-Benefit Analysis ......................................................................................................................37
Discussion ............................................................................................................................................. 40
Feasibility of using the DEPM to assess Snapper Stocks ................................................................40
Level of Confidence in the Estimate of Biomass .............................................................................41
Application in the Assessment and Management of Snapper ..........................................................43
Refining the Method for Snapper.....................................................................................................44
Conclusion ............................................................................................................................................ 45
Implications .......................................................................................................................................... 47
References ............................................................................................................................................ 49
Recommendations ............................................................................................................................... 53
Extension and Adoption ...................................................................................................................... 53
Project coverage ...............................................................................................................................53

iv
Appendices ........................................................................................................................................... 54
APPENDIX 1: Derivation of a new stage-tow-specific egg density (D0) estimator .......................54
APPENDIX 2. Estimating parameters for an allometric relationship of Snapper batch
fecundity to body weight .................................................................................................................59
APPENDIX 3. An extended DEPM estimator of spawning biomass, accounting for body-
weight specific dependence of batch fecundity and population structure ........................................61
APPENDIX 4. Computing standard errors for the DEPM spawning biomass estimate .................64
APPENDIX 5: Staff ........................................................................................................................68
Tables
Table 1. The description of the nine (IX) stages of Snapper embryo development used in this study.
Numbers in parentheses indicate the equivalent developmental stages ascribed by McGlennon (2003). .. 20
Table 2. The relative proportion (%) of Snapper eggs encompassed by the five spatial spawning closures
that were implemented in 2013 for each of the DEPM surveys. * includes formalin-corrected samples. .. 28
Table 3. Snapper surveys areas, spawning areas, and the proportion of spawning area, by survey and year,
computed from GIS contour mapping of the egg survey estimates, defined as interpolated egg densities >
0.1 eggs.m-2. * includes formalin-corrected samples. ................................................................................. 30
Table 4. Estimates of D0, the mean egg density at time of spawning for each survey region and year. Values
of D0 are given for five a priori values of egg mortality Z, with the middle value (Z = 0.4 day-1) used to
estimate of spawning biomass in this study. * includes formalin-corrected samples.................................. 32
Table 5. Population sex ratio (R) by weight (± standard error) for each survey region and year. * indicates
the combination of all gulf specific samples due to insufficient regional samples. .................................... 33
Table 6. Population spawning fraction (S) by weight (± standard error) for each survey region and year. *
indicates the combination of all gulf specific samples due to insufficient regional samples. ..................... 35
Table 7. Snapper spawning biomass estimates (t ± standard error), and the estimated total number of female
Snapper in the spawning population, by region and year. * includes formalin-corrected egg samples. .... 36
Table 8. The results of a qualitative ‘score-based’ assessment of the potential benefits of the ‘fishery-
dependent’ program that is currently used to assess South Australia’s Snapper Fishery in comparison with
three proposed alternative programs; ‘Fishery-independent’, ‘Augmented’ and ‘Integrated’. Scores are
averaged across six independent assessments undertaken by two fisheries managers, three fisheries scientists
and a fisheries modeller. .............................................................................................................................. 39
Figures
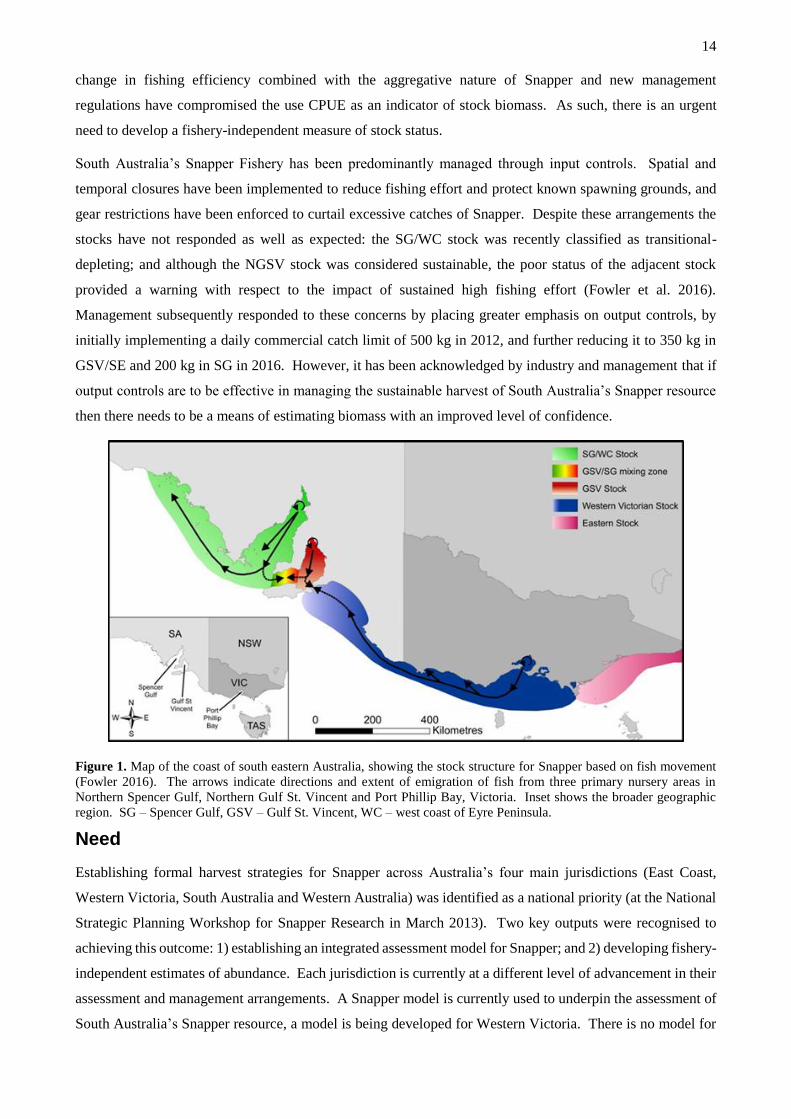
Figure 1. Map of the coast of south eastern Australia, showing the stock structure for Snapper based on fish
movement (Fowler 2016). The arrows indicate directions and extent of emigration of fish from three
primary nursery areas in Northern Spencer Gulf, Northern Gulf St. Vincent and Port Phillip Bay, Victoria.
Inset shows the broader geographic region. SG – Spencer Gulf, GSV – Gulf St. Vincent, WC – west coast
of Eyre Peninsula. ........................................................................................................................................ 14
Figure 2. DEPM Survey area. Locations of ichthyoplankton sampling stations (black dots) throughout South
Australia’s Spencer Gulf (partitioned into northern (NSG) and southern regions (SSG)) and Gulf St. Vincent
(northern (NGSV) and southern (SGSV) regions). Zones are represented by roman numerals, and the five
spatial spawning closures are identified in red. ........................................................................................... 17
Figure 3. Stage specific Snapper egg dimensions, including the mean (mm ± standard error) maximum egg
diameter, oil globule diameter, and maximum perivitelline space for live eggs and those preserved in 5%
formalin and 96% ethanol (ETOH). ............................................................................................................ 20
Figure 4. The nine stages of Snapper egg development in live eggs (Live) and after various treatments:
preservation in 5% formalin (Formalin); preservation in 96% EtOH (EtOH); and after application of the In

v
Situ Hybridisation (ISH) technique (ISH (EtOH)). The stages follow the characteristics of embryonic
development described by Norriss and Jackson (2002), McGlennon (2003) and Cassie (1956). See document
text for specific descriptions. B: blastoderm; BP: blastopore; CF: caudal fold; EM: embryo; EY: eye; H:
head; OG: oil globule; OC: optic cup; P: pigment; PV: perivitelline space; S: somite; TL: tail; Y: yolk... 21
Figure 5. A histological section of an ovary collected from a female Snapper in spawning condition. Note
the co-occurrence of un-yolked (UNY), advanced yolked (ADY) and hydrated (HYD) oocytes, along with
post-ovulatory follicles (POF) which is indicative of asynchronous oocyte development and high frequency
spawning (i.e. daily). ................................................................................................................................... 25
Figure 6. Snapper egg densities (eggs.m-2) for each of the four DEPM surveys. A minimum egg density of
0.1 eggs.m-2 was calculated using interpolated GIS software (ArcGIS) used to define the outer boundary of
spawning activity for each survey. .............................................................................................................. 29
Figure 8. Daily cycle of spawning of South Australian Snapper. Spawning times were derived for each egg
by subtracting the estimated age (in hours) from the time it was sampled. All data were combined across
all DEPM surveys. The daylight hours are indicated by the sun icon. ....................................................... 31
Figure 9. The frequency of the estimates of daily egg production (D0) for each sample tow undertaken in the
2013 and 2014 DEPM surveys. All tows that fell outside the spawning area (Asp) were excluded from the
analysis. ....................................................................................................................................................... 31
Figure 10. Weight frequencies of South Australian Snapper combined from the fishery-dependent market
sampling program and fishery-independent adult sampling for each of the four regions. Mean Snapper
weights are indicated by red arrows. ........................................................................................................... 33
Figure 11. Batch fecundity versus body weight for South Australian Snapper. Upper panel: Fit of measured
batch fecundity using maximum likelihood. The error bars indicate estimated 95% confidence intervals
(shown as grey error bars in both panels). Lower panel: Comparison of the batch fecundity by weight
relationship for Snapper derived in this study with previous published studies. ......................................... 34
Figure 12. Comparison of the Snapper spawning biomass estimates (t ± standard error) with the commercial
catch of Snapper for Spencer Gulf 2013 and 2015; and Gulf St. Vincent 2014 and 2015. ......................... 36
Figure 13. Snapper spawning biomass estimates from the eight DEPM surveys, computed assuming five
different values for egg mortality rate (Z). 95% confidence intervals are shown for each spawning biomass
estimate. ....................................................................................................................................................... 37
Figure 14. A schematic representation of the ‘fishery-dependent’ program that is current used to assess
South Australia’s Snapper Fishery and the relative cost differential (as % change) with three proposed
alternative programs; ‘Fishery-independent’, ‘Augmented’ and ‘Integrated’. ............................................ 38
Figure 15. Examples of successful hybridisation of the molecular Snapper probe. Snapper eggs are stained
blue clearly differentiating them from other fish eggs collected from the DEPM ichthyoplankton surveys.
..................................................................................................................................................................... 40

vi
Acknowledgments We gratefully acknowledge the Fisheries Research and Development Corporation (FRDC) for providing
significant funding for this project. Primary Industries and Regions South Australia (PIRSA) Fisheries and
Aquaculture, on behalf of South Australia’s Marine Scalefish Fishery, also provided considerable financial
support. Thanks also to the Marine Fishers Association (MFA) for on-going support through the project.
Many people contributed to various aspects of the project. We thank South Australian Museum staff (Leanne
Wheaton, Ralph Foster, and Steve Donnellan) and SARDI Aquatic Sciences personnel (Graham Hooper,
Matthew Lloyd, Lorenzo Andreachio, Owen Burnell and George Giatas) for assistance with the collection
and provision of reference tissues; and Greg Jenkins (CIT, WA) Kim Smith and Gary Jackson (Dept.
Fisheries, WA) for the provision of Bream eggs and larval specimens. We also gratefully thank Florence
Pradillon (Laboratoire Environment Profond, Institut Français de Recherche pour l’Exploitation de la Mer,
Plouzané, France) and Jörg Peplies (Max-Planck-Institut für marine Mikrobiologie, Bremen, Germany) for
providing direction and helpful comment with the molecular component of this study.
SARDI’s Matthew Lloyd, Alex Ivey, Mick Drew, Lorenzo Andreachio, Graham Hooper, Troy Rogers and
Bruce Jackson valuably contributed to the ichthyoplankton and adult sampling programs. We are indeed
grateful for the support of the RV Ngerin crew (Darren Nohlmans, Chris Small, Jason Nichols and Andrew
Sellick) who ensured the research cruises were undertaken safely and efficiently. Thanks are extended to
Bruce Jackson, Matthew Lloyd, Alyssa Giannoni (SARDI) for their tireless dedication in sorting plankton
samples in the laboratory. Sarah Laurence (Department of Environment, Water and Natural Resources)
administered the Marine Parks Permit to undertake scientific research (#MR00033-1). PIRSA Fisheries
Managers, Keith Rowling and Jonathan McPhail, provided valuable advice on the benefits and implications
of the outcomes of this research project.
This report was reviewed by Dr Paul Rogers and Dr Jonathan Smart from SARDI Aquatic Sciences, Mr
Jonathan McPhail and Mr Jon Presser from PIRSA Fisheries and Aquaculture, as well as an anonymous
external reviewer. The report was approved for release by Dr Stephen Mayfield, Science Leader, Fisheries,
SARDI Aquatic Sciences.

vii
Abbreviations
ACRONYM MEANING
CPUE Catch Per Unit Effort
DEPM Daily Egg Production Method
DNA Deoxyribonucleic Acid
ETOH Ethanol
FAACC Formalin Acetic Acid Calcium Chloride
FRDC Fisheries Research and Development Corporation
FTE Full Time Employee
GAM Generalised Additative Model
GIS Geographical Information System
GSV Gulf St. Vincent
HRP-DNA Horseradish Perioxidase
ISH In Situ Hybridisation
MSF Marine Scalefish Fishery
NGSV Northern Gulf St. Vincent
NSG Northern Spencer Gulf
NSW New South Wales
PIRSA Primary Industries and Regions, South Australia
POF Post Ovulatory Follicles
PPB Port Phillip Bay
Qld Queensland
RNA Ribonucleic Acid
rRNA Ribosomal Ribonucleic Acid
SA South Australia
SAFCOL South Australian Fisherman's Co-Operative Limited
SARDI South Australian Research and Development Institute
SE South East
SG Spencer Gulf
SG/WC Spencer Gulf/West Coast
SGSV Southern Gulf St. Vincent
SSG Southern Spencer Gulf
Vic Victoria
VNN Veronoi Natural Neighbour
WA Western Australia
WC West Coast
WVS Western Victorian Stock

viii
Executive Summary
Overview
This study was undertaken by the South Australia Research and Development Institute (SARDI). Through
overcoming considerable technical challenges, this study was the first to successfully develop a relatively
non-destructive molecular probe that can reliably identify Snapper (Chrysophrys auratus) eggs and larvae
in mixed ichthyoplankton samples. This highly-specific molecular probe targets Snapper ribosomal (r)RNA
and when conjugated with a reactive molecule produces a highly visible blue colour in positive reactions.
Snapper eggs are subsequently easily detected using a standard stereo dissecting microscope. This novel
use of an established molecular technique has re-invigorated the capability of using the daily egg production
method (DEPM) to provide a fishery-independent estimate of spawning biomass for Snapper and has also
increased its applicability to other species where egg identification has been problematic. This research has
reduced the need to exclusively rely on fishery-dependent catch and effort data to assess Snapper fisheries
and has demonstrated that the incorporation of the DEPM into South Australia’s existing assessment
program is relatively cost-effective and likely to benefit the management and industry. Adding the DEPM
will contribute an extra unbiased source of information that can be synthesised with existing fishery-
dependent data streams that will lead to more confident assessments of the stock and ensure the long term
sustainability of the State’s Snapper resource.
Background
The recent change in fishing efficiency combined with the aggregative nature of Snapper and new
management regulations have compromised the use of catch per unit effort (CPUE) as a suitable indicator
of stock biomass. As such, there is an urgent need to develop a fishery-independent measure of stock status.
The DEPM has been suggested to be a feasible, fishery-independent, technique to estimate Snapper biomass
(Zeldis and Francis 1998, McGlennon 2003, Jackson et al. 2012) and has been successfully used as an on-
going assessment tool for South Australia’s Sardine Fishery (Ward et al. 2016). Difficulties identifying
Snapper eggs has prevented the development of this method in southern Australia, as the characteristics of
Snapper eggs makes them difficult to visually distinguish from other species that also spawn during the
same time. Molecular validation of the identification of fish eggs and larvae has become an essential
component of some existing DEPM programs (Neira et al. 2014). Given the advancements in molecular
ecology, it was suggested that further investigation into developing a DEPM for Snapper was warranted.
Aims/objectives
1. To develop a DEPM for Snapper that provides the most accurate estimate of biomass and integrates
with the on-going assessment and management of the resource.
2. To undertake a cost-benefit analysis to explore whether the DEPM can be used as a routine assessment
tool to inform the sustainable management of South Australia’s Snapper Fishery.

ix
Methodology
Three surveys to estimate DEPM parameters were conducted over three years from SARDI’s RV Ngerin.
Each survey was done in early December to coincide with the peak spawning season. The first survey was
carried out in Spencer Gulf from 11-14 December 2013; the second survey was undertaken in Gulf St.
Vincent from 11-16 December 2014; and the third and final survey was carried out from 1-12 December
2015 and encompassed both gulfs.
During DEPM surveys the RV Ngerin was anchored in known fishing grounds to target adult Snapper using
baited hand-lines. Because of the regional variation in growth rates and population size/age structure, adult
Snapper were targeted in the northern and southern regions of the survey area. Additional Snapper samples
were sourced from the commercial fishery. The size structure, along with key reproductive parameters (i.e.
sex ratio, spawning fraction, batch fecundity) were determined from the adult sampling program.
All ichthyoplankton samples collected in 2013 and 2014 were preserved in 95% ethanol and refrigerated at
4°C prior to sorting. Samples collected in 2015 were preserved in 5% buffered seawater formalin, whereas
every fifth sample was preserved in 95% ethanol and refrigerated at 4°C prior to sorting and molecular
analysis. All samples were pre-sorted into ‘possible’ and ‘unlikely’ Snapper eggs on the basis of
morphological characteristics. Snapper eggs from the ethanol-preserved samples were validated using the
in situ hybridisation (ISH) molecular technique developed as part of this project. The validation rates were
retrospectively applied to the formalin-preserved samples. Total daily egg production and spawning area
was calculated for each survey. This study extended the traditional spawning biomass DEPM estimator to
incorporate the inherent size-dependence of batch fecundity and variation in population size frequency, as
a function of adult weight.
A cost-benefit analysis was undertaken to assess the feasibility of implementing a DEPM for Snapper as an
on-going assessment tool. The existing ‘fishery-dependent’ program was used as the baseline for
comparison with: (1) an exclusively fishery-independent program; (2) an augmented program that
substitutes components of the existing assessment with the DEPM; and (3) a fully integrated program that
incorporates the DEPM into the existing assessment.
Results
This study successfully designed and validated an in situ hybridisation (ISH) approach to identify Snapper
eggs (and larvae) from field-collected ichthyoplankton samples using the mitochondrial 16S ribosomal RNA
gene as a target for a specific oligonucleotide probe. This overcame the previous egg identification barrier
that had inhibited the development of the DEPM as a reliable assessment tool for South Australian Snapper.
Although there were changes in the sampling methodology over the course of the study, the derived
estimates of spawning biomass for Snapper generally aligned with the recent status assignment of the South
Australian stocks, reflective of the relative levels of commercial catch, and broadly agreed with the

x
industry’s assessment of the resource. Estimates of spawning biomass were consistently higher for the Gulf
St. Vincent biological stock in comparison to the Spencer Gulf/West Coast stock.
Applying the DEPM for Snapper is a feasible method to determine a fishery-independent estimate of
spawning biomass. A cost-benefit analysis indicated that incorporating the DEPM, either through its full
integration into the current assessment program or augmenting it to rely less on fishery-dependent data
sources, would benefit the assessment and management of the South Australian Snapper Fishery.
Implications
This project has effectively broadened the capability of using DEPM as a viable fisheries assessment tool
for any multiple spawning species that produces pelagic eggs that are difficult to identify and can be sampled
effectively.
This research has reduced the need to exclusively rely on fishery-dependent catch and effort data to assess
Snapper fisheries. Adding the DEPM into the existing Snapper stock assessment program will contribute
an extra unbiased source of information that can be synthesised with the fishery-dependent data streams and
lead to more confidence in assessments of the stocks. From this, greater confidence can be placed on the
consideration of implementing output controls in the future refinement of the Snapper specific harvest
strategy. This level of information can be used to qualitatively assess the effectiveness of a series of spatial
‘spawning’ closures that were implemented in South Australia in 2013 as part of recent Snapper
management strategies.
Finally, this project plays an important role in the global advancement of the DEPM. The overarching
challenge in most DEPM programs relates to improving the precision of the biomass estimate. Effort is
continually directed at reducing the inherent variance associated with the integrated biological parameters.
The new statistical procedures developed as part of this investigation to account for the variation in South
Australia’s Snapper populations, can be more widely applied and further refined in other DEPM based
programs.
Keywords
Snapper, Chrysophrys auratus, Spawning Biomass, Daily Egg Production Method, South Australia,
In-situ Hybridisation, Egg Identification, Cost-Effective Application.

11
Introduction
Background
Each Australian mainland State supports a commercial Snapper (Chrysophrys auratus) fishery with a
combined harvest of approximately 1,200 t (Fowler et al. 2016). Although the stock boundaries of Snapper
are not clearly defined, a recent national status assessment was evaluated across four jurisdictions; East Coast
(includes Queensland, New South Wales and Eastern Victoria), Western Victoria, South Australia, and
Western Australia (Fowler et al. 2016). Management arrangements and assessment processes are inconsistent
among jurisdictions and the status of some Snapper stocks could not be determined due to a lack of information.
There is a need to align the national assessment for Snapper and develop cross-jurisdictional management
strategies to ensure the sustainable harvest of the resource.
A model that integrates fishery-dependent data and population biology metrics to estimate the biomass of a
fish stock is a tool for stock assessment. Snapper-specific fishery models have been developed for WA, SA
and Qld. The fishery-dependent statistics collected for Snapper are typically complex as they include catch
and effort information from a variety of sectors (e.g., commercial, recreational, trawl, and charter) and multiple
gear types (e.g., hand-line, long-line, mesh nets, and trawl nets). For some jurisdictions these data are either
temporally incompatible, sporadically collected, or absent. Such inconsistencies compromise the reliability of
stock assessment models based solely on fishery-dependent data. In these situations, fishery managers
commonly adopt a precautionary approach rather than developing prescriptive harvest strategies to ensure
long-term sustainability. The integration of fishery-independent estimates of biomass into statistical models
can alleviate multi-sectorial and multi-gear issues and provide unbiased measures of stock status that can be
used to develop formal harvest strategies.
The Daily Egg Production Method (DEPM)
Estimating biomass from fishery-independent surveys is becoming increasingly more valuable in supporting
assessment and management frameworks in modern fisheries. The Daily Egg Production Method (DEPM)
has been successfully used to provide an unbiased estimate of spawning biomass for a range of small pelagic
species (e.g. Australian Sardine Sardinops sagax, Australian Anchovy Engraulis australis, Blue Mackerel
Scomber australasicus) consequently providing a key biological performance indicator that informs species-
specific harvest strategies (Stratoudakis et al. 2006, Ward et al. 2011). However, there has been limited
extension and application of this method to demersal finfish species. Zeldis and Francis (1998) were the first
to apply the DEPM to a Snapper population in New Zealand. Although they indicated wide confidence
intervals around the mean estimate of spawning biomass, they identified that the method was a viable
assessment tool and “probably” applicable to other demersal finfish with similar life-history characteristics.
This method estimates the spawning biomass of a fish stock by combining measurements of the density of
pelagic eggs and estimates of a range of adult parameters obtained from an intensive field sampling program.
It relies on the premise that the biomass of spawning adults can be calculated by dividing the mean number of

12
eggs produced per unit mass of adult fish (Lasker 1985). Total daily egg production is the product of mean
daily egg production (P0) and total spawning area (A). Mean daily fecundity is calculated by dividing the
product of mean sex ratio (by weight, R), mean batch fecundity (F), mean spawning fraction (S) by mean
female weight (W). Spawning Biomass (SB) is calculated according to the following equation:
𝑺𝑩 =𝑷𝟎×𝑨
(𝑹×𝑭×𝑺 𝑾)⁄. [Equation 1]
Western Australia is the only jurisdiction that has successfully integrated DEPM into its assessment of Snapper
(Jackson and Cheng 2001, Jackson et al. 2012). Difficulties identifying Snapper eggs has prevented the
development of this method throughout southern Australia, as the characteristics of Snapper eggs makes them
difficult to visually distinguish from other species that also spawn during the same time; e.g. flathead
(Platycephalidae). Relying on morphological criteria for such differentiation alone can present problems such
as the over-estimation of spawning biomass due to incorrect egg identification (Fox et al. 2005). A recent
validation study indicated that Snapper eggs collected in Western Australia were not always correctly
identified with visual methods, with rates of misidentification ranging from 0% to 100%, depending on the
location from where the plankton sample was taken (Dias et al. 2016)
Molecular validation of the identification of fish eggs and larvae is an essential component of some existing
DEPM programs (Neira et al. 2014) and provides an opportunity to extend application of the method to species
where egg identification has been problematic. To date, validation methods have relied on destructive
sampling, where eggs and larvae are initially identified, ascribed a developmental stage, and their DNA or
RNA is chemically extracted for analysis destroying the specimens. This process is typically applied to a sub-
set of samples to ensure confidence in morphological identifications (e.g. Ward et al. 2016) or determine a
‘correction factor’ (Neira et al. 2014). In situ hybridisation (ISH) approaches may provide a more streamlined
and non-destructive validation alternative (Pradillion et al. 2007). ISH involves the development of a species-
specific oligonucleotide probe that targets ribosomal RNA and uses horseradish peroxidase (HRP-DNA) to
produce a colour reaction. Coloured eggs and larvae could potentially be identified under a standard stereo
microscope, separated from mixed species samples, staged and archived. ISH is a powerful and relatively
cost-effective diagnostic technique and has successfully identified a variety of marine taxa, including Bacteria
and Archaea (DeLong et al. 1989), diatoms (Scholin et al. 1997), and invertebrate larvae and eggs (Mountford
et al. 2007, Pradillion et al. 2007, Thomas et al. 2011). It may also be broadly applicable for identifying fish
eggs and larvae, although is yet to be achieved.
A major assumption in the DEPM is that adult parameters used to calculate spawning biomass are constant
over the range and duration of the survey (Stratoudakis et al. 2004). This assumption, however, is likely to be
violated if the spawning area encompasses numerous sub-populations or spans across different physical
environments, where the target species exhibits considerable phenotypic or genotypic diversity. Not
accounting for such diversity can potentially bias parameter estimation, and result in imprecise or bias
estimates of spawning biomass. In situations where the spatial distribution of adult sampling sites extends
throughout the survey area spawning biomass can be calculated using a ‘post-stratification’ process to account

13
for spatial differences in spawning rates (Piquelle and Stauffer, 1985). In these circumstances spawning
biomass estimates are calculated independently for each stratum.
A recent study used a combination of population-based demographics and physical and chemical
characteristics of Snapper otoliths, to partition South Australian Snapper into three distinct stocks: the Spencer
Gulf/West Coast Stock (SG/WC); the Gulf St. Vincent Stock (GSV); and the Western Victorian Stock (WVS)
(Fowler 2016) (Figure 1). Each of these stocks is considered to be self-sustaining and dependant on a
significant primary nursery area (Fowler 2016). The northern gulfs are the nursery areas for the SG/WC and
GSV stocks, whereas, the WVS stock extends westward from Port Phillip Bay (PPB), Victoria into the south
east region of South Australia (Figure 1). The regional extent of these stocks depends on the emigration of
sub-adult and adult fish. There appears to be minimal movement among regional sub-populations. Most
recaptures in a tagging study were made within 20 km of the tag site (i.e. residents), relatively few adult
Snapper moved distances that would justify them being recognised as ‘migrants’ (Jones 1981, 1984). This life
history model is reflected in the population demography, as there are considerable differences in the size/age
structures and growth trajectories among regional sub-populations (Fowler et al. 2013). Given this variation,
there is a need to determine if there are similar regional differences in reproductive biology.
The reproductive biology of Snapper has been extensively studied throughout its geographic range (Crossland
1977, Fowler and Jennings 2003, Wakefield 2006, Jackson 2007, Sumpton and Jackson 2010, Saunders et al.
2012). It is a multiple batch spawner with indeterminate fecundity and asynchronous oocyte development
(Saunders 2009). Individual fish spawn over consecutive days and ovulation is highly synchronised within an
aggregation (Crossland 1977, Scott et al.1993). Snapper aggregate to spawn within a range of 15-22 °C.
However, there is strong evidence of regional adaptation of spawning behaviour associated with sea surface
temperature (Crossland 1980, McGlennon 2003, Saunders 2009, Pecl et al. 2014). Seasonal spawning typically
occurs during the austral winter in tropical latitudes and austral spring/summer in temperate latitudes (Pecl et
al. 2014). Investigation into the reproductive biology of South Australian Snapper has, so far, exclusively
focused on the Northern Spencer Gulf sub-population (McGlennon 2003, Saunders 2009; Fowler unpublished
data).
South Australian Snapper Fishery
There has been a dramatic switch in the spatial structure of South Australia’s Snapper Fishery over the past
decade. Spencer Gulf (SG) has traditionally yielded the State’s highest Snapper catches, however, in recent
years it has been replaced by Gulf St. Vincent (GSV) and the South East (SE) (Fowler et al. 2016). This shift
has been a consequence of a reduction in the commercial harvest in northern and southern SG coupled with an
unprecedented increase in catches from northern GSV. Commercial fishers rapidly responded to this increase
by adjusting their fishing behaviour, shifting from conventional hand-line gear to light-weight, long-line
technology to maximise their fishing efficiency. Catch per unit effort (CPUE) in this sector increased
exponentially and the fishery “boomed” in NGSV raising concerns about the long-term sustainability of the
resource. Management responded with a suite of changes including imposing daily trip limits to curtail
excessive catches five spatial closures to protect Snapper spawning aggregations in 2013/14. The recent
14
change in fishing efficiency combined with the aggregative nature of Snapper and new management
regulations have compromised the use CPUE as an indicator of stock biomass. As such, there is an urgent
need to develop a fishery-independent measure of stock status.
South Australia’s Snapper Fishery has been predominantly managed through input controls. Spatial and
temporal closures have been implemented to reduce fishing effort and protect known spawning grounds, and
gear restrictions have been enforced to curtail excessive catches of Snapper. Despite these arrangements the
stocks have not responded as well as expected: the SG/WC stock was recently classified as transitional-
depleting; and although the NGSV stock was considered sustainable, the poor status of the adjacent stock
provided a warning with respect to the impact of sustained high fishing effort (Fowler et al. 2016).
Management subsequently responded to these concerns by placing greater emphasis on output controls, by
initially implementing a daily commercial catch limit of 500 kg in 2012, and further reducing it to 350 kg in
GSV/SE and 200 kg in SG in 2016. However, it has been acknowledged by industry and management that if
output controls are to be effective in managing the sustainable harvest of South Australia’s Snapper resource
then there needs to be a means of estimating biomass with an improved level of confidence.
Figure 1. Map of the coast of south eastern Australia, showing the stock structure for Snapper based on fish movement
(Fowler 2016). The arrows indicate directions and extent of emigration of fish from three primary nursery areas in
Northern Spencer Gulf, Northern Gulf St. Vincent and Port Phillip Bay, Victoria. Inset shows the broader geographic
region. SG – Spencer Gulf, GSV – Gulf St. Vincent, WC – west coast of Eyre Peninsula.
Need
Establishing formal harvest strategies for Snapper across Australia’s four main jurisdictions (East Coast,
Western Victoria, South Australia and Western Australia) was identified as a national priority (at the National
Strategic Planning Workshop for Snapper Research in March 2013). Two key outputs were recognised to
achieving this outcome: 1) establishing an integrated assessment model for Snapper; and 2) developing fishery-
independent estimates of abundance. Each jurisdiction is currently at a different level of advancement in their
assessment and management arrangements. A Snapper model is currently used to underpin the assessment of
South Australia’s Snapper resource, a model is being developed for Western Victoria. There is no model for

15
the East Coast. South Australia and Western Victoria are at a point where fishery-independent estimates of
biomass would considerably enhance their respective stock assessment programs.
The need for a DEPM assessment is urgent in South Australia as recent structural changes in the Snapper
fishery have compromised the integrity of the time series of fishery-dependent statistics that have been relied
on to assess the resource in the past. Fishery-independent estimates of Snapper biomass are required to feed
into the existing stock assessment model to ensure that future assessments and harvest strategies are developed
from unbiased information. This research direction has been unanimously supported by stakeholders in South
Australia’s Snapper Fishery. The Western Victorian fishery is likely to encounter similar issues to South
Australia, particularly as their fishery is dominated by the recreational sector where the routine collection of
catch and effort data to integrate into the assessment process is often challenging.
Although the principal objective in developing a DEPM is to provide an unbiased, fishery-independent,
estimate of Snapper biomass, there are a number of additional benefits. The most useful relates to gaining a
greater understanding of the spatial distribution and abundance patterns of Snapper eggs to infer spawning
activity. This is particularly relevant given PIRSA’s recent implementation of five spatial closures, ranging in
area from 200 to 315 km2, to protect spawning Snapper in 2013/14 as part of their new management strategy.
Information gained during the proposed study would be able to quantitatively assess the relative effectiveness
of these spawning closures.
Objectives
1. To develop a DEPM for Snapper that provides the most accurate estimate of biomass and integrates
with the on-going assessment and management of the resource.
2. To undertake a cost benefit analysis to explore whether the DEPM can be used as a routine assessment
tool to inform the sustainable management of South Australia’s Snapper Fishery.

16
Method
Development of a DEPM for Snapper:
Successful application of the DEPM critically relies on the collection of adequate samples of eggs from
throughout the spawning area, reliable identification of eggs and concurrent adult sampling to determine their
spawning condition.
Study area
Three DEPM surveys were undertaken and refined over three years. Each survey was done in early December
to coincide with the peak spawning season (McGlennon 2003, Saunders 2009). These surveys were conducted
during the State-wide seasonal closure of the Snapper fishery from midday 1 November to midday 15
December. This ensured that the reproductive behaviour of the Snapper population was relatively undisturbed
by fishing activity for approximately one month prior to sampling. The first survey was carried out in Spencer
Gulf from 11-14 December 2013 and consisted of 195 stations that encompassed known Snapper spawning
areas. Most stations conformed to a 2 x 4 nm grid pattern, however, the four spatial closures were sampled
more intensively (2 x 2 nm) (Figure 2). All stations were confined to waters >10 m deep. The second survey
was undertaken in Gulf St. Vincent from 11-16 December 2014. This survey consisted of 216 stations that
were arranged in a stratified pattern, where sampling intensity decreased from a 2 x 2 nm grind in the northern
part of the Gulf, extending to 2 x 4 nm throughout the middle section, and culminating into a 4 x 4 nm pattern
in the south (Figure 2). This sampling pattern was adopted because, unlike Spencer Gulf, the key Snapper
spawning areas within Gulf St. Vincent are relatively unknown. The third and final survey was carried out
from 1-12 December 2015 and encompassed both gulfs. The spatial structure of these surveys were slightly
modified in comparison to previous years. An extra 25 stations, arranged in a 4 x 2 nm grid pattern, was added
to Spencer Gulf extending its spatial coverage further south. Ten stations were omitted from the western end
of Investigator Strait in Gulf St. Vincent due to time and weather limitations (Figure 2).
As Snapper exhibit considerable latitudinal phenotypic variation, with the northern-most sub-populations of
the gulfs growing faster and attaining larger sizes than those further south (Fowler et al. 2014), each gulf was
partitioned into northern and southern regions (Figure 2). Estimates of spawning biomass were calculated for
each of these regions separately. The spatial resolution of the sampling area was refined to a series of zones
to accommodate subsequent processing of pooled egg samples.

17
Figure 2. DEPM Survey area. Locations of ichthyoplankton sampling stations (black dots) throughout South Australia’s
Spencer Gulf (partitioned into northern (NSG) and southern regions (SSG)) and Gulf St. Vincent (northern (NGSV) and
southern (SGSV) regions). Zones are represented by roman numerals, and the five spatial spawning closures are identified
in red.

18
Ichthyoplankton surveys
Plankton sampling
The three plankton surveys were undertaken from the RV Ngerin. Plankton samples were collected at each
station using paired bongo nets. Each net had an internal diameter of 0.57 m, 500 μm mesh and plastic cod-
ends. The nets were vertically deployed to within 5 m of the seabed and retrieved at a speed of ~1 m.s-1.
General Oceanics TM 2030 flow-metres and factory-calibrated coefficients were used to estimate the distance
travelled by the net for each tow. The wire length during each deployment was measured to the nearest metre
using a digital counter (General Oceanics). Where there were discrepancies of >500 units between paired
flow-metre readings, the relationship between wire length released and flow-metre reading was used to
determine the correct value which was substituted for the erroneous reading. Upon retrieval of the nets, they
were washed down and the plankton samples were rinsed from the two cod-ends and combined into a 1L
sample container. All samples collected in 2013 and 2014 were preserved in 95% ethanol and refrigerated at
4°C prior to sorting. Samples collected in 2015 were preserved in 5% buffered seawater formalin, whereas
every fifth sample was preserved in 95% ethanol and refrigerated at 4°C prior to sorting and molecular analysis.
The preservation method was amended in 2015 as unforeseen technical challenges delayed the development
of the ISH probe, placing an increased reliance on the visual identification of Snapper eggs in the event that
the ISH probe was unsuccessful. This decision was made as morphological characteristics are easier to
distinguish in formalin-preserved samples compared to those stored in ethanol (Figure 3.). It was anticipated
that the validated Snapper eggs from the ethanol-preserved samples would be used to ‘correct’ the Snapper
egg counts derived from the formalin-preserved samples if the ISH technique was reliable.
Identifying Snapper eggs
Snapper egg reference samples were obtained from broodstock maintained at the South Australian Aquatic
Sciences Centre, SARDI Aquatic Sciences. Spawning was induced via the implantation of a slow release
cholesterol/cellulose LHRHa pellet (see Ham and Hutchinson 2003) and the resultant eggs were incubated at
ambient temperature (≈18-21°C) in an on-site flow through system. Egg samples (n > 5,000) were collected
throughout the embryonic developmental period, with approximately half preserved in 96% ethanol and
refrigerated at 4°C, and the remaining half preserved in 5% buffered formalin. These samples covered all
stages of egg development from 30 minutes after spawning to hatching (≈36 hrs). Digital images were taken
of live, ethanol- and formalin-preserved eggs throughout the developmental series. Images were captured under
both transmitted and reflected light at 2.5x magnification on a stereo microscope (Leica MS5). The maximum
diameter of the egg and oil globule and width of the perivitelline space were measured (to the nearest 0.01 µm)
for up to 30 replicate eggs at each developmental stage and for each preservation method. Embryonic
descriptions of Snapper by Norriss and Jackson (2002), McGlennon (2003) and Cassie (1956) were used to
inform stage descriptions. This study delineated nine egg stages of Snapper eggs (Table 1). The stages were
based on distinguishable developmental features and aimed to cover similar time periods (Figure 4: Stages I
to IX).

19
Plankton samples were sorted using either a Ward Counting Wheel or a modified Sedgwick-Rafter sorting tray
under a stereo dissecting microscope. All teleost eggs were removed from each plankton sample and separated
into two categories: ‘possible’ and ‘unlikely’ Snapper eggs. The main diagnostic features used to classify
‘possible’ Snapper eggs were established from the reference material: eggs were spherical ranging from 0.7 to
1.0 mm in diameter; had a smooth chorion; small perivitelline space (0.01 to 0.15 mm); prominent,
unsegmented yolk; a single oil globule ranging from 0.15 to 0.30 mm in diameter; pigmentation spots on the
oil globule that appeared during the mid to later stages of embryonic development; and pigment pattern (as
described in Cassie (1956), Norriss and Jackson (2002), McGlennon (2003)) (Figure 3 and Figure 4). All
remaining eggs were separated as ‘unlikely’ Snapper eggs.
All eggs were retained in fresh 95% ethanol and refrigerated at 4°C, prior to species validation through
molecular analysis. The formalin-preserved eggs collected during the 2015 surveys were retained for
morphological identification.
Snapper Egg Validation
Snapper eggs were identified from the ‘possible’ and ‘unlikely’ ethanol-preserved samples using an in situ
hybridisation molecular technique. This technique utilises an oligonucleotide probe that binds with Snapper-
specific DNA that can be colour-labelled (blue) through oxidisation (Figure 4). This technique requires
mechanically piercing the chorion of each egg to expose the internal embryonic tissue to the molecular probe.
Although the structural integrity of the eggs was compromised by this technique they could still be assigned a
developmental stage.
All ‘possible’ Snapper egg samples were analysed separately, whereas the ‘unlikely’ egg samples were pooled
into their respective spatial zones. This two stage validation process was undertaken to determine the success
rate of identifying Snapper eggs based entirely on ‘possible’ morphological diagnostic features and the
proportion of Snapper eggs that failed to be detected from within the ‘unlikely’ Snapper egg samples. These
metrics provided a ‘correction-factor’ which was then applied to the formalin-preserved samples collected in
2015. Each zone was ‘corrected’ independently.
Egg ageing
Each Snapper egg was assigned an average age (in hours) using the temperature dependent embryonic
developmental key developed by McGlennon (2003). This key is described by the following equation:
𝒚𝒊,𝒕 = 𝟑𝟔. 𝟏𝟓𝟖 . 𝒆(−𝟎.𝟏𝟐𝒕) 𝒊𝟎.𝟖𝟐𝟕 [Equation 2]
Where yi,t is the average age of the ith stage at temperature t°C. The parameters were solved for Snapper
through a structured egg incubation experiment described in McGlennon (2003). Egg stages were standardised
to this study’s nine stage scheme by calculating the mean of McGlennon’s (2003) equivalent developmental
stages (Table 1).

20
Table 1. The description of the nine (IX) stages of Snapper embryo development used in this study. Numbers in
parentheses indicate the equivalent developmental stages ascribed by McGlennon (2003).
STAGE * DESCRIPTION
I (1, 2) < 64 Cells. Individual cells are discernible in live eggs, but have a rough ‘bubbled’ appearance when preserved in ethanol and formalin.
II (3, 4) Blastoderm covers less than half of the yolk.
III (5, 6) Blastoderm covers more than half of the yolk, becoming hemispherical. The blastopore is not yet formed.
IV (7, 8) Blastopore apparent, the embryonic axis forms, and the head becomes distinct.
V (9) Blastopore is closed, optic vesicles visible, first myomeres visible, sparse pigment spots on the dorsal and ventral surfaces of the embryo.
VI (10, 11)
Embryo extends 50% around the yolk. Tail becomes bulbous and begins to separate from the yolk. Pigment appears on oil globule (as stellate melanophores) and become more prominent on the embryo and yolk sac.
VII (12, 13) Embryo extends 66% around yolk. The tail lifts from the yolk and extends to the oil globule. Caudal finfold begins to develop. Melanophores appear more prominent on the anterior end of the embryo.
VIII (14, 15) Embryo extends 75% around the yolk. Head structure and caudal finfold are well developed. The tail extends beyond the oil globule.
IX (16) Embryo is almost fully developed, tail long and twisted off embryo axis. Oil globule is posteriorly located near the anus.
Figure 3. Stage specific Snapper egg dimensions, including the mean (mm ± standard error) maximum egg diameter, oil
globule diameter, and maximum perivitelline space for live eggs and those preserved in 5% formalin and 96% ethanol
(ETOH).

21
Figure 4. The nine stages of Snapper egg development in live eggs (Live) and after various treatments: preservation in
5% formalin (Formalin); preservation in 96% EtOH (EtOH); and after application of the In Situ Hybridisation (ISH)
technique (ISH (EtOH)). The stages follow the characteristics of embryonic development described by Norriss and
Jackson (2002), McGlennon (2003) and Cassie (1956). See document text for specific descriptions. B: blastoderm; BP:
blastopore; CF: caudal fold; EM: embryo; EY: eye; H: head; OG: oil globule; OC: optic cup; P: pigment; PV: perivitelline
space; S: somite; TL: tail; Y: yolk.

22
Egg density (Eggssurv)
Egg density under one square metre of water (Eggssurv) was estimated at each station according to:
𝑬𝒈𝒈𝒔𝒔𝒖𝒓𝒗 =𝑪×𝑫
𝑽 [Equation 3]
where C is the number of eggs in each sample, V is the volume of water filtered (m3) estimated using the
flowmeters and D is the maximum depth (m) to which the net was deployed.
Estimates of spawning area (Asp)
The Veronoi natural neighbour (VNN) method (Watson 1981) was applied using the geographic information
system package ‘ArcGIS’ to generate a polygon around each sampling station with the boundary as the
midpoint equidistant between each station. The area represented by each station (km2) was then determined
and defined the overall sampling area for each of the annual surveys. Geostatistical kriging refined the extent
of the spawning area (Asp) within the sampled area. This method interpolated the georeferenced point data
(eggs.m-2 at each sampling station) to predict the intermediate values through a Gaussian process governed by
prior covariances. A minimum egg density of 0.1 eggs.m-2 was used to define the outer boundary of spawning
activity for each survey and determine the extent of Asp.
Daily egg production (D0)
The timing of egg release for Snapper occurs throughout the day, making the traditional approach of estimating
mean density at time of peak spawning (P0) inappropriate for Snapper (McGlennon 2003; Jackson 2007). A
new method was developed to estimate daily egg production (D0) for Snapper, which accounts for the
continuous spawning pattern (see Appendix 1). This method accounts for loss of eggs through natural
mortality (Z) from the time of spawning to the time of sampling for each observed egg stage in each of the
plankton tows, rather than for the overall population through a least squares regression (Lo 1991) or from a
prior assumed Z determined from a generalised linear model (GLM) (Bernal et al. 2011). Mean daily egg
production was estimated using assumed instantaneous mortality rates, ranging from 0.2 to 0.6 day-1.
Adult Reproductive Parameters
Sampling methods
During DEPM surveys the RV Ngerin was anchored in known fishing grounds to target adult Snapper using
baited hand-lines. Because of the regional variation in growth rates and population size/age structure (Fowler
et al. 2013), adult Snapper were targeted in the northern and southern regions of the survey area. Time of
capture was recorded and fish were measured (caudal fork length to the nearest cm) and weighed using a
marine balance (0.01 kg). Fish were eviscerated, sexed and macroscopically assigned a maturity stage
according to Saunders et al. (2012). The gonads were dissected and weighed (1 g). All advanced ovaries (
Stage III) were subjected to detailed histological and batch fecundity analyses. For each of these ovaries a
small tissue section was dissected from the centre of one ovarian lobe, placed in a histological cassette and
preserved in FAACC for further microscopic analysis. For hydrated (Stage IV) ovaries a sub-section of
approximately 10% by weight was dissected from the remaining lobe and weighed (1 g). This section was cut

23
longitudinally and the oocytes hose-washed from the connective lumen, collected in a 500 μm sieve,
transferred to a 1L container and preserved in 5% sea water buffered formalin for later batch fecundity analysis.
Additional adult samples were sourced from the commercial fishing sector via the centralised SAFCOL market
upon the reopening of the fishery (December 15th of each year). This sampling program occurred over two
stages: the first involved targeting commercial catches from regions of interest and measuring the size of each
Snapper within the catch. The second stage involved processing a sub-sample of the catch to obtain further
biological information according to the procedure outlined above. The landing details, such as the capture
date and location, of these market-sourced fish were cross-referenced from the fisher’s compulsory catch return
logs.
Female weight (𝑵𝒘𝒇𝒆𝒎
)
Traditionally the mean female body weight is used as a standard parameter to estimate spawning biomass. For
species, such as adult Sardines and other small pelagic fish (California northern anchovy, Parker 1980; blue
mackerel, Ward et al. 2009) where female body size is not multi-modal, the population mean is an appropriate
measure. The size structure of Snapper, however, is typically variable, due to the sporadic temporal variation
in recruitment and spatial variation in growth rates (McGarvey and Feenstra 2004, Fowler and McGlennon
2011). Ignoring this variation would reduce the accuracy of the spawning biomass estimates. To account for
this variation this study divided the Snapper population into 26 weight classes, ranging from 0.5 to 13.5 kg,
grouped into 0.5 kg bins and this size-dependence was incorporated into the estimate of spawning biomass
(Appendices 3 and 4).
Batch Fecundity (𝑭𝒃𝒂𝒕𝒄𝒉)
Formalin-preserved oocyte samples stripped from stage IV ovaries were rinsed in a 150 μm sieve to remove
the preservative. Rinsed oocytes were transferred into a glass beaker and filled with water to a standard 1L
volume. This 1L sample was thoroughly mixed to ensure the oocytes were evenly distributed throughout the
solution. Ten to 15 1 mL sub-samples were pipetted from the mixture and examined using a Sedgwick Rafter
tray under a stereo dissecting scope using transmitted light. For each sub-sample, hydrated oocytes (>700 μm)
were counted. The average number of hydrated oocytes per mL was calculated. The final estimate of batch
fecundity (Fbatch) was calculated for each fish according to Equation 4:
𝑭𝒃𝒂𝒕𝒄𝒉 = [(�̅�𝒔𝒖𝒃 ×𝟏,𝟎𝟎𝟎)
𝑾𝒔𝒆𝒄𝒕] × 𝑾𝒐 [Equation 4]
Where, �̅�𝑠𝑢𝑏 is the mean count of hydrated eggs per mL, 𝑊𝑠𝑒𝑐𝑡 is the weight of the sub-section of ovary and
𝑊𝑜 is the whole weight of the paired ovaries.
The relationship between female weight (W) and batch fecundity was determined by linear regression and used
to estimate the batch fecundities of mature females in all samples. The allometric function for Fbatch against
weight was taken as a continuous variable.
ˆ ( )batchF W W . [Equation 5]

24
A maximum likelihood estimator that accounted for heteroscedasticity in the spread of the residuals was used
in the model fit to estimate the parameters and (see Appendix 2). For comparative purposes, derived
estimates of batch fecundity for Snapper were compiled from the literature (Fowler 2000; Jackson 2007;
Saunders 2009). The weight-dependent batch fecundity parameter estimates, along with estimated error
structure, were incorporated into the size-dependent estimation of spawning biomass (Appendices 3 and 4).
Sex ratio (R)
Quantities of mature males and females in each sample were used to estimate the sex ratio (�̅�𝑖) according to
Equation 6:
�̅�𝒊 =𝑭𝒊
(𝑭𝒊+ 𝑴𝒊). [Equation 6]
Where 𝐹𝑖 and 𝑀𝑖 are the respective total weights of mature males and females in sample i.
The population mean sex ratio (𝑅) was weighted by sample size according to Equation 7:
𝑹 = ∑ [�̅�𝒊 ×𝒏𝒊
𝑵]. [Equation 7]
Where, �̅�𝑖 is the mean sex ratio of each sample, n is the number of fish in sample i and N is the total number
of fish collected in all samples. Standard errors were determined using a mean ratio estimator (Rice 1995).
Spawning fraction (S)
The estimates of spawning fraction (S) were calculated as the mean proportion of females that were in
spawning condition during the survey period. Histological sections were prepared from the FAACC preserved
ovarian tissue samples for microscopic analysis. Tissue was sectioned at 6 μm and stained with haemotoxylin
and eosin. Several sections from each ovary were examined to determine the presence/absence of post-
ovulatory follicles (POFs). Females were determined to be in spawning condition if ovaries contained hydrated
oocytes and/or POFs (Figure 5). Given Snapper are known to spawn daily (Scott et al. 1993; Wakefield 2010),
it was assumed that the presence of POFs indicated that spawning had occurred within 24 hrs of capture. The
mean spawning fraction of the population was calculated from the average of the sample means weighted by
the proportional sample size according to Equation 8.
𝑺 = ∑ [�̅�𝒊 ×𝒏𝒊
𝑵]. [Equation 8]
Where, 𝑆�̅� is the mean spawning fraction of each sample, n is the number of fish in sample i and N is the total
number of fish collected in all samples. Standard errors were determined using a mean ratio estimator (Rice
1995).

25
Figure 5. A histological section of an ovary collected from a female Snapper in spawning condition. Note the co-
occurrence of un-yolked (UNY), advanced yolked (ADY) and hydrated (HYD) oocytes, along with post-ovulatory
follicles (POF) which is indicative of asynchronous oocyte development and high frequency spawning (i.e. daily).
Spawning Biomass (Bsp)
This study extended the traditional spawning biomass DEPM estimator (Equation 1) to incorporate the inherent
size-dependence of batch fecundity and variation in population size frequency, as a function of adult weight.
Adult Snapper market samples were partitioned into 26 weight classes. In three of four regions, these showed
an approximately bimodal distribution that reflects sporadic recruitment of Snapper year classes typical for
this species, but would be poorly approximated by a single mean weight. Similarly, because adult females span
such a wide range of body sizes, estimates of egg production are made substantially more precise by
incorporating the dependence of batch fecundity on female body weight. The full derivation of the spawning
biomass estimation formula below (Equation 9) incorporating size dependence of adults is given in Appendix
3:
0ˆ
N
sp w wsp w
batch N
w w
w
P wD A
BS R F P
. [Equation 9]
To compute confidence intervals on this size-dependent estimate of spawning biomass, the delta approximation
method, first applied by Parker (1980) to the classic DEPM biomass estimate, was applied. The derivation of
this method is given in Appendix 4.

26
Cost-Benefit Analysis
Given the urgent need to provide a fishery-independent assessment of biomass for Snapper and the potential
for the on-going use of the DEPM as a means of addressing this need, there is a clear requirement to determine
the feasibility of this assessment tool through a cost/benefit analysis.
The staff and operating costs associated with substituting or augmenting the existing assessment program with
DEPM estimates of spawning biomass were compared. Costs shared by the two methods and potential savings
were identified. The salary and operating costs in the budget for the current Snapper Fishery assessment
program in the ‘Service Level Agreement’ developed with PIRSA and industry were identified. The estimated
costs of a DEPM program were determined from the staffing requirements and operating expenses associated
with the field and laboratory components of this project.
The existing ‘fishery-dependent’ program was used as the baseline for comparison with: (1) an exclusively
fishery-independent program; (2) an augmented program that substitutes components of the existing
assessment with the DEPM; and (3) a fully integrated program that incorporates the DEPM into the existing
assessment. The cost of each program is presented as a percentage change against the baseline assessment.
The flow-on benefits of the proposed assessment programs in assigning stock status and management advice
for Snapper to industry are complex. Consequently, it is difficult to ascribe a meaningful monetary value that
can be directly compared against their known costs. Instead, the benefit of each of the program’s outputs were
categorically scored across three key areas to provide a qualitative analysis of their relative value. These are:
(1) assessing fishery performance; (2) the level of biological information provided; and (3) achieving the
objectives of management. A series of key performance indicators, derived from the objectives of the current
Snapper harvest strategy outlined the MSF Management Plan (PIRSA 2013), were identified within each of
these three areas. Scores ranged from 0 (low) to 5 (high). The average score for each benefit was calculated
from six separated assessments, which included three fisheries scientist, a fishery modeler, and two fishery
managers.

27
Results
DEPM
Snapper Egg Validation
Of the 416 ‘possible’ eggs collected from the 2013 Spencer Gulf survey, 81 were confirmed to be Snapper
through ISH hybridisation, representing a 19.5% identification success rate when relying on coarse
morphological characteristics. This success rate increased to 80.2% in samples collected from Gulf St. Vincent
in 2014, where 73 Snapper eggs were positively identified from 91 ‘possible’ eggs. A parallel molecular
investigation indicated that non-hybridised eggs from the possible Snapper egg samples represented a range
of different fish species, including species of the families Carangidae (trevally), Callionymidae (stinkfish),
Cynoglossidae (sole), Gerreidae (silverbelly), Labridae (wrasse), Mullidae (mullet), Neosebastidae
(scorpionfish), Pinguipedidae (wavy grubfish), Platycephalidae (flathead), Sillaginidae (whiting) and
Tetrapontidae (striped perch). Twenty Snapper eggs were identified from 31,493 ‘unlikely’ eggs sampled
from Spencer Gulf in 2013, representing 0.06% of the entire sample. Similarly, 130 Snapper eggs were
identified from 12,334 eggs from the corresponding sample collected in Gulf St. Vincent in 2014, representing
1.1%. These samples also included large quantities of conspicuous Anchovy (Engraulis australis) eggs
consequently inflating overall counts.
Every fifth plankton sample collected during the 2015 DEPM surveys was preserved in ethanol for ISH
molecular analysis. This resulted in a total of 40 (of 202) samples in GSV and 43 (of 212) samples in SG.
Consequently, the quantities of eggs collected were considerably lower than the previous surveys. Of the 3,937
ethanol-preserved eggs collected from SG in 2015, eight were pre-sorted as ‘possible’ Snapper eggs; however,
none were confirmed through ISH analysis. Of the remaining ‘unlikely’ eggs, 18 were positively identified as
Snapper, representing 0.46% of the entire sample. In total 3,285 fish eggs were collected from GSV in 2015
and preserved in ethanol. Seven were considered ‘possible’ Snapper eggs of which two were confirmed,
representing a 28.6% identification success rate. Twenty of the remaining 3,278 ‘unlikely’ eggs were
positively identified as Snapper, representing 0.61% of the sample.
The relative proportions of validated Snapper eggs in both the ‘possible’ and ‘unlikely’ ethanol-preserved
samples collected during the 2015 surveys were used to adjust the formalin-preserved egg counts for each of
the sampling zones (see Figure 2).
Egg Density (Pt)
The overall distribution pattern of Snapper eggs within Spencer Gulf in 2013 and 2015 was similar. Relatively
high density patches of eggs up to 10 eggs.m2 were observed around Point Lowly, north of the gulf (Zone III),
close to the ‘Illusion’ spawning closure (Zone IX) and southwest of the ‘Jurassic Park’ spawning closure (Zone
XXIII) (Figure 6). Egg densities, however, were highest during 2013, particularly through the central corridor
of the gulf where they peaked at 28.0 eggs.m2 (Zone IX) (Figure 6). Low quantities (<5 eggs.m2) of Snapper
eggs were found throughout the southern boundary of the extended survey area in 2015.

28
A clear spawning ‘hot-spot’ was identified off Edithburgh in Gulf St. Vincent in 2014, where egg densities
peaked at 97.4 eggs.m2 (Zone VIII) (Figure 6). Egg densities exceeded 10 eggs.m2 at each sampling station
within this central western zone (VIII). Despite a few small patches of eggs that exceeded 4 eggs.m2 within
the northern half of the gulf, the distribution of eggs throughout this region was relatively uniform. Low level
spawning activity was observed throughout most of the southern gulf with a relatively large isolated patches
of eggs >1.0 eggs.m2 located in the south-eastern corner (Zone XVIII) (Figure 6). The distribution of eggs in
2015 was patchier, particularly throughout the southern gulf. Similar to the previous survey, low level
spawning activity was observed in the south-eastern corner of the gulf. The extent of spawning in the northern
gulf was also reduced, with the bulk of eggs aggregated at densities of 1-5 eggs.m2 within a narrow band
located in the centre of the gulf. Egg density peaked at 6.2 eggs.m2 within the centre of this band (Zone VI)
(Figure 6).
Determining the proportion of eggs encompassed by the closed areas provides some indication as to their
relative effectiveness in protecting spawning Snapper. The ‘Illusion’ closure encompassed the greatest
proportion of eggs during the 2013 survey, with approximately 9% of all eggs surveyed within Spencer Gulf
located within the boundaries of this closed area (Table 2). The remaining three closures contained a further
0.86% of the eggs, ranging from 0.09% for ‘Estelle Star’ to 0.4% for ‘Jurassic Park’. This level of ‘protection’
was not maintained in 2015, where the total proportion of eggs located within the four closed areas was
approximately 1.3% (Table 2). With the exception of ‘Jurassic Park’ which was devoid of eggs during the
2015 survey, the closures afforded similar levels of protection, each accounting for approximately 0.5% of the
total eggs surveyed within the gulf. The single closed area in Gulf St. Vincent accounted for 0.15% of eggs
sampled in 2014, and no Snapper eggs were detected within it in 2015 (Table 2).
Table 2. The relative proportion (%) of Snapper eggs encompassed by the five spatial spawning closures that were
implemented in 2013 for each of the DEPM surveys. * includes formalin-corrected samples.
YEAR GULF CLOSURENO. EGGS
(CLOSED)
TOTAL
EGGS% EGGS
ESTELLE STAR 2.63E+06 3.02E+09 0.09%
ILLUSION 2.82E+08 3.02E+09 9.34%
JURASSIC PARK 1.22E+07 3.02E+09 0.40%
SANTA ANNA 1.12E+07 3.02E+09 0.37%
TOTAL 3.08E+08 3.02E+09 10.20%
ESTELLE STAR 7.05E+06 2.05E+09 0.34%
ILLUSION 9.25E+06 2.05E+09 0.45%
JURASSIC PARK 0.00E+00 2.05E+09 0.00%
SANTA ANNA 9.63E+06 2.05E+09 0.47%
TOTAL 2.59E+07 2.05E+09 1.26%
GSV 1.79E+07 1.16E+10 0.15%
TOTAL 1.79E+07 1.16E+10 0.15%
GSV 0.00E+00 2.76E+09 0.00%
TOTAL 0.00E+00 2.76E+09 0.00%2015 GULF ST. VINCENT*
2013 SPENCER GULF
2015 SPENCER GULF*
2014 GULF ST. VINCENT

29
Figure 6. Snapper egg densities (eggs.m-2) for each of the four DEPM surveys. A minimum egg density of 0.1 eggs.m-2
was calculated using interpolated GIS software (ArcGIS) used to define the outer boundary of spawning activity for each
survey.

30
Spawning Area (A)
The extent of the area surveyed within each gulf was modified over the course of the study. A greater area
was surveyed in Gulf St. Vincent compared with Spencer Gulf on both occasions (Table 3). The relative
proportion of spawning area was consistently greater in the northern gulfs. Approximately 58% of the survey
area contained Snapper eggs of densities >0.1 eggs.m-2 in Spencer Gulf in 2013 (Table 3). This was reduced
to 41% in 2015. Similarly, 80.2% of the survey area in GSV 2014 displayed evidence of spawning activity.
This was subsequently reduced to approximately 36% in 2015 (Table 3). It is important to note, however, that
the 2015 estimates included formalin-corrected egg samples, and are likely to be less accurate than the previous
(2013, 2014) samples.
Table 3. Snapper surveys areas, spawning areas, and the proportion of spawning area, by survey and year, computed from
GIS contour mapping of the egg survey estimates, defined as interpolated egg densities > 0.1 eggs.m-2. * includes
formalin-corrected samples.
Daily Egg Production (D0)
Individual spawning time for each egg was estimated by subtracting its age from the time of day it was sampled.
Combining these data across all surveys indicated that Snapper spawn throughout the day, with spawning
activity increasing from late morning through to 2300 hours (Figure 7). With the exception of an irregular
peak in spawning activity identified at 1100 hours, which was inflated by a single sample containing a high
number of Snapper eggs, spawning activity appeared to steadily increase from midday and peak during the
evening (1700 to 2100 hours) (Figure 7). There was evidence of low level spawning during the other times of
the day. Given this continuous spawning pattern, a ‘peak’ spawning time could not be determined.
YEAR GULF REGIONSURVEY
AREA (km2)
SPAWNING
AREA (A )
AREA WITH
EGGS (%)
NSG 1837.83 1188.28 64.66
SSG 2968.22 1611.71 54.30
TOTAL 4806.05 2799.98 58.26
NSG 1623.73 800.62 49.31
SSG 4310.22 1631.74 37.86
TOTAL 5933.95 2432.36 40.99
NGSV 3161.73 2563.17 81.07
SGSV 4860.04 3871.30 79.66
TOTAL 8021.77 6434.48 80.21
NGSV 3161.73 1651.79 52.24
SGSV 4476.43 1094.13 24.44
TOTAL 7638.16 2745.92 35.95
2015 GULF ST. VINCENT*
2013 SPENCER GULF
2015 SPENCER GULF*
2014 GULF ST. VINCENT

31
Figure 7. Daily cycle of spawning of South Australian Snapper. Spawning times were derived for each egg by subtracting
the estimated age (in hours) from the time it was sampled. All data were combined across all DEPM surveys. The
daylight hours are indicated by the sun icon.
The distribution of estimates of mean daily egg production (D0) for each sample tow were over-dispersed for
the 2013 and 2014 DEPM surveys, where the majority of sampling stations yielded zero-egg counts (Figure
8). This was accentuated in GSV in 2014 where approximately 60% of the stations surveys within the defined
spawning area had estimated daily egg production rates that were less than 1 eggs.day-1.m-2. These estimates
were less frequent in SG in 2013 accounting for approximately 35% of the samples. In both surveys the
northern gulfs contained more stations with relatively high egg densities that exceeded production rates of 7
eggs.day-1.m-2 compared with the southern gulfs. A similar dataset was not calculated for the 2015 DEPM
surveys as the proportions of validated Snapper eggs in both the ‘possible’ and ‘unlikely’ samples were used
to adjust the formalin-preserved egg counts.
Figure 8. The frequency of the estimates of daily egg production (D0) for each sample tow undertaken in the 2013 and
2014 DEPM surveys. All tows that fell outside the spawning area (Asp) were excluded from the analysis.
At an assumed instantaneous mortality rate of 0.4 day-1 mean daily egg production (D0) ranged from 1.54 to
20.67 eggs.day-1.m-2 throughout the study (Table 4). Egg production was consistently higher in the northern

32
gulfs, with the difference ranging from 2.0 to 2.1 times greater in Spencer Gulf and 4.4 to 10.2 times greater
in Gulf St. Vincent. Gulf St. Vincent was up to 6.4 times more productive than Spencer Gulf. The influence
of increasing mortality rates from 0.2 to 0.6 day-1 had a variable influence on mean egg production, increasing
estimates of D0 by 19.2% in NSG in 2013 up to 34.4% in NSG in 2015 (Table 4).
Table 4. Estimates of D0, the mean egg density at time of spawning for each survey region and year. Values of D0 are
given for five a priori values of egg mortality Z, with the middle value (Z = 0.4 day-1) used to estimate of spawning
biomass in this study. * includes formalin-corrected samples.
Female Weight (W)
Weight frequency histograms for the northern and southern regions of each gulf were reconstructed from length
data using an allometric length-weight relationship. As previously noted by Fowler et al. (2013), the
size/weight composition of the regional populations were different in each gulf. Greater proportions of large
Snapper, exceeding 6 kgs, were evident in the northern gulfs, whilst the southern gulfs were dominated by <
2 kg fish. These regional differences were emphasised in Gulf St. Vincent, where there was an absence of
Snapper > 8 kg in the southern gulf and individuals weighing up to 14 kg in the northern gulf (Figure 9). The
large range in Snapper weights suggests that substantial improvement in biomass estimates would be achieved
by explicitly accounting for the size structure of South Australian Snapper compared with the standard DEPM
approach of using a mean weight. This more refined approach was adopted in this study (Appendix 2).
0.2 0.3 0.4 0.5 0.6
NSG 2.97 3.09 3.23 3.38 3.53
SSG 1.38 1.46 1.54 1.64 1.74
NSG 6.71 7.22 7.78 8.37 9.02
SSG 3.45 3.64 3.84 4.05 4.28
NGSV 18.36 19.48 20.67 21.95 23.31
SGSV 4.14 4.42 4.73 5.06 5.42
NGSV 11.39 12.07 12.80 13.57 14.40
SGSV 1.11 1.18 1.25 1.33 1.41
MORTALITY (Z )
2015 GULF ST. VINCENT*
YEAR GULF REGION
2013 SPENCER GULF
2015 SPENCER GULF*
2014 GULF ST. VINCENT
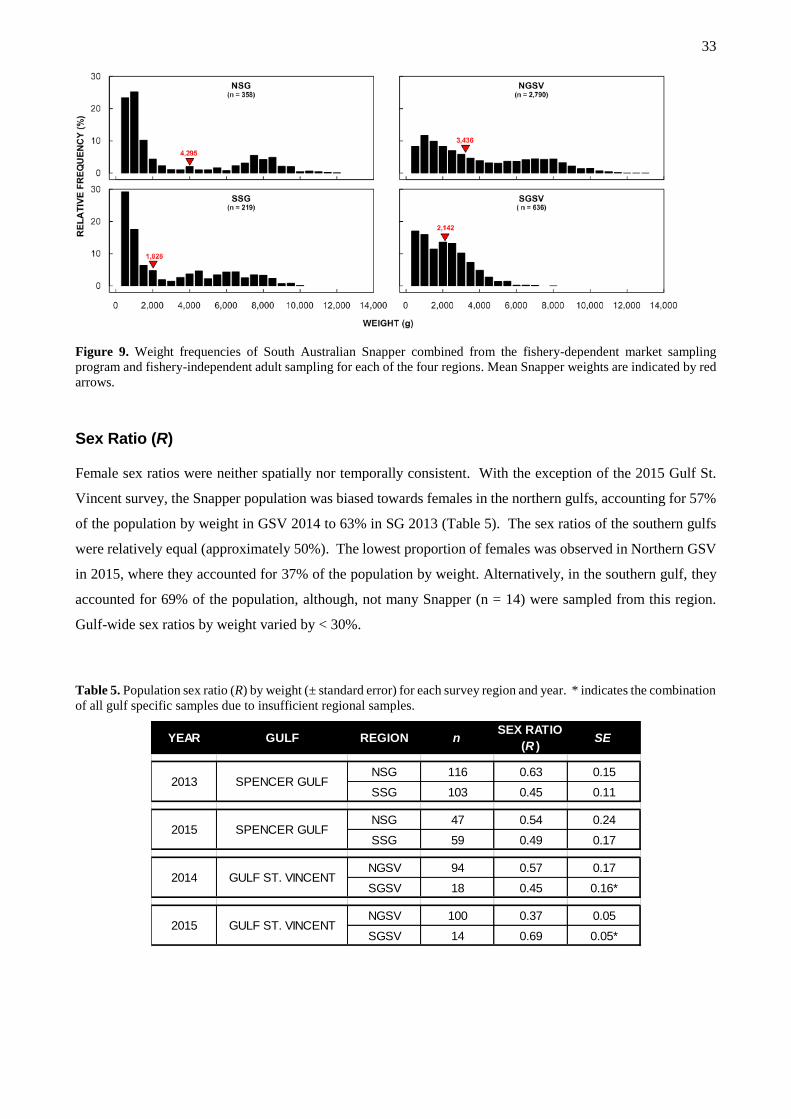
33
Figure 9. Weight frequencies of South Australian Snapper combined from the fishery-dependent market sampling
program and fishery-independent adult sampling for each of the four regions. Mean Snapper weights are indicated by red
arrows.
Sex Ratio (R)
Female sex ratios were neither spatially nor temporally consistent. With the exception of the 2015 Gulf St.
Vincent survey, the Snapper population was biased towards females in the northern gulfs, accounting for 57%
of the population by weight in GSV 2014 to 63% in SG 2013 (Table 5). The sex ratios of the southern gulfs
were relatively equal (approximately 50%). The lowest proportion of females was observed in Northern GSV
in 2015, where they accounted for 37% of the population by weight. Alternatively, in the southern gulf, they
accounted for 69% of the population, although, not many Snapper (n = 14) were sampled from this region.
Gulf-wide sex ratios by weight varied by < 30%.
Table 5. Population sex ratio (R) by weight (± standard error) for each survey region and year. * indicates the combination
of all gulf specific samples due to insufficient regional samples.
YEAR GULF REGION nSEX RATIO
(R )SE
NSG 116 0.63 0.15
SSG 103 0.45 0.11
NSG 47 0.54 0.24
SSG 59 0.49 0.17
NGSV 94 0.57 0.17
SGSV 18 0.45 0.16*
NGSV 100 0.37 0.05
SGSV 14 0.69 0.05*
2015 SPENCER GULF
2014 GULF ST. VINCENT
2015 GULF ST. VINCENT
2013 SPENCER GULF

34
Batch Fecundity (F)
The relationship between batch fecundity (F) and total female weight (W) was best described by allometric
linear regression. No statistical differences were detected between the relative slopes (analysis of covariance,
year*weight interaction: F2, 109 = 0.07, p = 0.94) nor intercepts (year: F2, 109 = 0.23, p = 0.53) of the linear
relationships between years. Consequently all data were combined into a single analysis and fitted using
maximum likelihood (Figure 10; see Appendix 2). This overall relationship was similar to previous studies
that examined reproduction and spawning dynamics of Snapper in South Australia over the past 16 years
(Figure 10).
Figure 10. Batch fecundity versus body weight for South Australian Snapper. Upper panel: Fit of measured batch
fecundity using maximum likelihood. The error bars indicate estimated 95% confidence intervals (shown as grey error
bars in both panels). Lower panel: Comparison of the batch fecundity by weight relationship for Snapper derived in this
study with previous published studies.
Spawning Fraction (S)
All three surveys were carried out when either half, or the majority, of the females within the population were
in spawning condition, with spawning fractions ranging from 50% in NGSV in 2015 to 82% in NSG in 2015
(Table 6). At the time of these surveys, the spawning fractions were consistently higher in NSG in both 2013
and 2015, with >72% of the females contributing to the spawning population. This was up to 28% higher than
SSG where an estimated 55% of the females exhibited physical evidence of spawning activity. This marked
regional difference was not evident in Gulf St. Vincent, where spawning fractions differed by < 7% between

35
the northern and southern regions in both years. Spawning fractions within this gulf exceeded 75% in 2014
and declined to approximately 50% in 2015 (Table 6).
Table 6. Population spawning fraction (S) by weight (± standard error) for each survey region and year. * indicates the
combination of all gulf specific samples due to insufficient regional samples.
Spawning Biomass (SB)
Given the changes in the 2015 survey methodology, where estimates of egg densities for the formalin-
preserved samples were coarsely adjusted at the ‘zonal’ level, the associated estimates of spawning biomass
cannot be directly compared with the previous surveys (SG 2013 and GSV 2014). However, considering this
incompatibility, it was generally observed that estimates of spawning biomass were consistently lower in SG
compared with GSV (Table 7). Furthermore, the regional estimates of spawning biomass displayed the same
trend within each gulf over their respective surveys, where they were consistently higher in southern SG and
northern GSV (Table 7).
All Snapper eggs collected during the 2013 SG and 2014 GSV surveys were validated using the ISH molecular
technique, consequently there is greater confidence in the estimates of spawning biomass obtained from these
surveys, compared with the 2015 surveys that applied a ‘zonal’ egg correction factor. At an assumed egg
mortality rate of 0.4 day-1 the estimate of Snapper spawning biomass in SG in 2013 was 280 t with a standard
error of 55% (Table 7). Snapper spawning biomass in GSV 2014 was an order of magnitude higher at an
estimated 2,780 t with a standard error of 52%. The Snapper population was estimated to consist of 45,194
females in SG 2013 and 421,619 females in GSV 2014 (Table 7). The commercial catch of Snapper in the
corresponding years was 50.1 t in NSG 2013 and 430 t in GSV 2014, representing approximately 18% and
15% of the estimated spawning biomass, respectively (Figure 11).
The 2015 estimates of spawning biomass, which included the ‘zonal’ egg correction to account for the
formalin-preserved egg samples, exhibited the same trend where the spawning biomass was higher in GSV
compared with SG. Snapper spawning biomass in GSV was estimated at 1,856 t (± 684 t) consisting of 172,155
YEAR GULF REGION n
SPAWNING
FRACTION
(S )
SE
NSG 54 0.72 0.29
SSG 43 0.58 0.23
NSG 28 0.82 0.23
SSG 28 0.54 0.18
NGSV 54 0.76 0.12
SGSV 7 0.71 0.11*
NGSV 34 0.50 0.12
SGSV 7 0.57 0.08*
2014 GULF ST. VINCENT
2015 GULF ST. VINCENT
2013 SPENCER GULF
2015 SPENCER GULF

36
females, which was approximately three times greater than SG which had an estimated spawning biomass of
592 t (± 355 t), and consisted of 91,566 females (Table 7). The corresponding commercial catch of Snapper
was 47 t in NSG 2015 and 380 t in GSV 2015, representing approximately 7.9% and 21.0% of the estimated
spawning biomass, respectively (Figure 11).
Table 7. Snapper spawning biomass estimates (t ± standard error), and the estimated total number of female Snapper in
the spawning population, by region and year. * includes formalin-corrected egg samples.
Figure 11. Comparison of the Snapper spawning biomass estimates (t ± standard error) with the commercial catch of
Snapper for Spencer Gulf 2013 and 2015; and Gulf St. Vincent 2014 and 2015.
Sensitivity Analysis
Like the method of Bernal et al. (2011), the modified DEPM estimation method derived in this study assumed
that individual surveys cannot yield usable estimates of egg mortality rate (Z). This is because mortality would
need to be measured as a variation of egg density over time, and DEPM surveys measure variation over space.
To counter this, prior values of Z are often assumed, and used as input quantities. There were marginal
differences in the estimates of spawning biomass when various assumed mortality rates ranging from 0.2 to
YEAR GULF REGIONNUMBER OF
FEMALES
SPAWNING BIOMASS
(SB ) t (± SE)% SE
NSG 24,466 132 (54 - 210) 59%
SSG 20,728 148 (74 - 222) 50%
TOTAL 45,194 280 (127 - 433) 55%
NSG 34,882 220 (61 - 379) 72%
SSG 56,684 371 (175 - 567) 53%
TOTAL 91,566 592 (237 - 946) 60%
NGSV 259,008 1,933 (912 - 2,954) 53%
SGSV 162,611 847 (424 - 1,270) 50%
TOTAL 421,619 2,780 (1,336 - 4,224) 52%
NGSV 156,959 1,804 (1,143 - 2,466) 37%
SGSV 15,196 52 (29 - 74) 44%
TOTAL 172,155 1,856 (1,171 - 2,540) 37%
2015 GULF ST. VINCENT*
2013 SPENCER GULF
2015 SPENCER GULF*
2014 GULF ST. VINCENT

37
0.6 day-1 were modelled (Figure 12). This was relatively consistent for all eight DEPM surveys, where all
spawning biomass estimates fell within the 95% confidence intervals of each other, regardless of the assumed
Z value. The greatest divergence was evident in the NGSV 2014 survey for which the estimates spanned
approximately 463 t. Conversely, there was less than 25 t difference in spawning biomass estimates across the
ranges of Z values for the NSG 2013 survey (Figure 12).
Figure 12. Snapper spawning biomass estimates from the eight DEPM surveys, computed assuming five different values
for egg mortality rate (Z). 95% confidence intervals are shown for each spawning biomass estimate.
Cost-Benefit Analysis
The cost differential between the exclusively fishery-independent program and the fully integrated assessment
compared to the existing ‘baseline’ fishery-dependent program ranged from -42.3% to +26.5%, respectively
(Figure 13). The augmented program, which omitted the fishery modelling component of the assessment and
placed greater reliance on the estimate of spawning biomass derived from the DEPM, represented a 7.5%
increase in cost.
Although there are cost savings of an exclusively fishery-independent program, the estimated overall benefit
is less (-0.2 points) than the current fishery-dependent program (Table 8). The strength in the current program
relates to improving biological knowledge of Snapper spawning dynamics and supporting environmental
processes, but trades off against the level of information required to assess the performance of the fishery.
Furthermore, without reference to any fishery-dependent metrics this program scores poorly against the
essential management objectives in ascribing the status of the stock (-0.8 points) and determining the allocation
of shares amongst the other sectors (-2.6 points). Despite these short-comings in achieving these specific
management objective, there is considerable benefit in undertaking this program to assess and optimise the
location of spawning closures (+3.8 points) (Table 8).
The integrated program which encompasses all available sources of information currently available is 26.5%
more expensive than the current program (Figure 13). This increase in cost translates to a 31.5 point
improvement in overall benefit, representing a 74.3% increase. A 1% increase in cost for this program

38
subsequently converts to a 2.8% increase in benefit. The greatest benefits were associated with the level of
biological information the program was expected to provide, scoring 21.5 points, which was more than double
the relative amount provided by the baseline program. The program was also considered to provide greater
benefit in terms of the associated estimates of fishable (spawning) biomass and harvest fractions, and also
improved level of information to support the assignment of ‘stock status’.
The augmented program, which substituted the fishery modelling component with the DEPM represented a
7.5% increase in cost. The overall benefit of this program was 25.7 points greater than the baseline program,
representing an increase of 60.6% (Table 8). This translated to an 8.1% increase in benefit for every 1%
increase in cost, which was the most cost-effective of the three proposed alternative programs. Excluding the
fishery modelling component clearly impacted on the relative value of the model-derived fishery performance
indicators (i.e. fishable biomass, harvest fraction, egg production and recruitment), scoring 2.8 points less than
the fully integrated program. The provision of biological information, however, scored the same as the
integrated program, whereas the relative benefits in achieving management objectives was 2.3 points less
(Table 8). This reduction was mostly evident in ‘ensuring the long-term sustainable harvest’ (-1.0 points) and
determining the ‘stock status’ (-0.7 points) of the resource.
Figure 13. A schematic representation of the ‘fishery-dependent’ program that is current used to assess South Australia’s
Snapper Fishery and the relative cost differential (as % change) with three proposed alternative programs; ‘Fishery-
independent’, ‘Augmented’ and ‘Integrated’.
PROJECT MANAGEMENT
FISHERY DEPENDENT
CATCH & EFFORT
STATISTICS
BIOLOGICAL SAMPLING
(SIZE/AGE)
FISHERY MODELLING
BIOMASS ESTIMATE
PROJECT MANAGEMENT PROJECT MANAGEMENT PROJECT MANAGEMENT
FISHERY INDEPENDENT
EGG SURVEY
BIOLOGICAL SUB
SAMPLING
(REPRODUCTION)
MOLECULAR ANALYSIS
BIOMASS ESTIMATE
ANALYSIS / REPORTING ANALYSIS / REPORTING
AUGMENTED
CATCH & EFFORT
STATISTICS
BIOLOGICAL SAMPLING
(SIZE /AGE/REPRODUCTION)
EGG SURVEY
MOLECULAR ANALYSIS
BIOMASS ESTIMATE
ANALYSIS / REPORTING
INTEGRATED
CATCH & EFFORT
STATISTICS
BIOLOGICAL SAMPLING
(SIZE /AGE/REPRODUCTION)
FISHERY MODELLING
EGG SURVEY
MOLECULAR ANALYSIS
ANALYSIS / REPORTING
BIOMASS ESTIMATE
-42.25%COST $ +7.52% +26.51%

39
Table 8. The results of a qualitative ‘score-based’ assessment of the potential benefits of the ‘fishery-dependent’ program
that is currently used to assess South Australia’s Snapper Fishery in comparison with three proposed alternative programs;
‘Fishery-independent’, ‘Augmented’ and ‘Integrated’. Scores are averaged across six independent assessments
undertaken by two fisheries managers, three fisheries scientists and a fisheries modeller.
BENEFITSFISHERY-
DEPENDENT
FISHERY-
INDEPENDENTAUGMENTED INTEGRATED
1. ASSESSING FISHERY PERFORMANCE
TRENDS IN CATCH & EFFORT 4.7 0.0 4.8 4.8
FISHABLE (SPAWNING) BIOMASS 1.8 3.2 3.3 3.8
HARVEST FRACTION 1.8 1.7 3.2 3.8
EGG PRODUCTION 1.7 1.5 2.3 3.5
RECRUITMENT 2.7 1.5 3.0 3.5
ALLOCATION 2.8 0.7 3.2 3.2
SCORE (/30) 15.3 8.5 19.8 22.7
2.LEVEL OF BIOLOGICAL INFORMATION
AGE/SIZE STRUCTURE 4.5 0.8 4.5 4.5
REPRODUCTION 2.8 3.0 4.3 4.3
EARLY LIFE HISTORY 0.3 2.3 2.3 2.3
PATTERNS OF SPAWNING 1.2 3.3 4.0 4.0
PLANKTON ASSEMBLAGE (OTHER SPECIES) 0.0 3.0 3.2 3.2
ENVIRONMENTAL PARAMETERS (TEMP, SALINITY) 0.2 3.0 3.2 3.2
SCORE (/30) 9.0 15.5 21.5 21.5
3. ACHIEVING MANAGEMENT OBJECTIVES
STOCK STATUS 3.3 2.5 3.8 4.5
ENSURE LONG-TERM SUSTAINABLE HARVEST 2.5 3.0 3.3 4.3
MAINTAIN CATCHES WITHIN ALLOCATION 3.8 1.2 3.8 3.8
MINIMISE IMPACT ON ECOSYSTEM 1.2 1.2 1.8 1.8
TAKE ACCOUNT OBJECTIVES OF OTHER SECTORS (REC) 2.3 1.7 2.7 3.0
OPTIMISE SPAWNING CLOSURES* 0.7 4.5 4.5 4.8
SCORE (/30) 13.8 14.0 20.0 22.3
TOTAL SCORE (%) 42.4 42.2 68.1 73.9

40
Discussion
Feasibility of using the DEPM to assess Snapper Stocks
This study successfully designed and validated an in situ hybridisation (ISH) approach to identify Snapper
eggs (and larvae) from field-collected ichthyoplankton samples using the mitochondrial 16S ribosomal RNA
gene as a target for a specific oligonucleotide probe (see Oxley et al. unpublished). This highly-specific
molecular probe targets Snapper ribosomal RNA and when conjugated with a reactive molecule produces a
visible colour in positive reactions. Snapper eggs are subsequently coloured blue and easily detected under a
standard stereo dissecting microscope (Figure 14). The relatively non-destructive nature of this probe
represents a significant advancement in its application in DEPM programs as the developmental stage and
subsequent age of each egg can be accurately determined and archived. The 100% efficacy of the probe was
validated through a series of structured tests, including: identifying Snapper eggs in mixed plankton samples
spiked with a known amount of reference material; in samples that contained closely related species (i.e. Black
Bream, Acanthopagrus butcheri); across the entire embryonic developmental sequence (i.e. from < 4hrs post
fertilisation to hatching); and from field-collected ichthyoplankton samples (Oxley et al. unpublished).
Figure 14. Examples of successful hybridisation of the molecular Snapper probe. Snapper eggs are stained blue clearly
differentiating them from other fish eggs collected from the DEPM ichthyoplankton surveys.
Applying the molecular probe to egg samples that were visually pre-sorted to contain ‘possible’ Snapper eggs
which were separated from ‘unlikely’ Snapper eggs on the basis of gross morphological characteristics such
as egg size, oil globule dimensions, and embryo morphology, indicated that approximately 19% to 80% were
misidentified depending on the origin of the sample. Conversely, a small proportion (< 2%) of fish eggs that

41
were ‘unlikely’ to be from Snapper were confirmed as Snapper. Further genetic analysis indicated that those
eggs that were misidentified represented a range of different fish species, including species from the families
Carangidae (Mackerel), Callionymidae (Stinkfish), Cynoglossidae (Sole), Gerreidae (Silverbelly), Labridae
(Wrasse), Mullidae (Mullet), Neosebastidae (Scorpionfish), Pinguipedidae (Wavy Grubfish), Platycephalidae
(Flathead), Sillaginidae (Whiting) and Tetrapontidae (Striped Perch) (Oxley et al. unpublished). Similar visual
misidentification rates were reported for Snapper in ichthyoplankton samples collected from Western
Australia, with misidentified eggs including Common Jack Mackerel (Trachurus declivis), Rusty Flathead
(Inegocia japonica) and Longhead Flathead (Leviprora inops) (Dias et al. 2016). These results highlight the
importance of using molecular-based techniques to validate morphological identification of eggs in application
of the DEPM (Neira et al. 2014; Dias et al. 2016). The ISH method developed in this study can be extended
to other species where egg identification has been problematic, such as King George Whiting (Sillagnodes
punctatus) (Fowler 2000), and some carangids (i.e. Yellow Scad, Trachurus novaezelandiae, and Silver
Trevally, Pseudocaranx dentex) (Keane and Lyle 2015, Ward and Grammer 2016).
Level of Confidence in the Estimate of Biomass
Currently, the determination of stock status of South Australia’s Snapper Fishery is assisted through
assessment of fishery performance indicators that are compared against trigger reference points (Fowler et al.
2016). There are two sets of fishery performance indicators, ‘general’ and ‘biological’ (PIRSA 2013). The
general performance indicators are based entirely on commercial fishery statistics, whereas the biological
performance indicators are based on output from a computer-based model, The model, ‘SnapEst’, integrates
all fishery and biological data available on population structure and outputs a time series of four parameters:
fishable biomass; harvest fraction; egg production; and recruitment (McGarvey and Feenstra 2004). The most
recent stock assessment identified considerable divergence between trends in the biomass of Snapper derived
from the empirical data and output from the fishery model. Clear declining trends in fishery catch, effort and
catch rates (CPUE) coupled with evidence of poor recruitment derived from an absence of early year classes
in the population age structure suggested declining biomass in the SG/WC stock leading to it being assigned a
status of ‘transitional-depleting’. Conversely, the SnapEst model interpreted broad age structures which
included the presence of old (>10 years) fish and reduced levels of fishing effort as low exploitation, and
subsequently inferred an increasing fishable biomass (Fowler et al. 2016). Greater emphasis was placed upon
the empirical data in the assessment as it was acknowledged that the model does not have the capacity to
resolve the inherent complexities within the fishery that relate to: dynamic fisher behaviour; advancing fishing
technologies; reactive management arrangements; and Snapper habitat use and migration. However, it was
understood that these complexities also introduced a level of subjectivity in the interpretation of fishery-
dependent catch and effort data. Fishery management and industry were aware of these issues and initiated
the development of the current project to explore whether a fishery-independent estimate of biomass for
Snapper was achievable.
Fishery-independent estimates of spawning biomass for Snapper, derived from the DEPM in this study, aligned
with the recent status assignment of the SG/WC and GSV stocks, reflected the relative levels of commercial

42
catch, and broadly agreed with the industry’s assessment of the resource, where biomass was an order of
magnitude higher in GSV compared with SG. It must be recognised, however, that a primary focus of this
study was to determine the feasibility of using the DEPM as an assessment tool for Snapper. Changes in the
egg sampling methodology were employed during the 2015 surveys as a contingency measure in the event the
egg validation component of the study was unsuccessful. As such, the associated estimates of spawning
biomass for SG and GSV in 2015 should be interpreted cautiously and greater emphasis placed on the biomass
estimates derived for SG in 2013 and GSV in 2014. In these two years, fishery-independent estimates of
spawning biomass were 280 t in SG (2013) and 2,780 t in GSV (2014). The corresponding estimates of fishable
biomass derived from the fishery-dependent SnapEst model were approximately 7,000 t and 14,500 t,
respectively (Fowler et al. 2016); suggesting that the model estimates were unrealistically inflated.
The DEPM provides unbiased estimates of spawning biomass for the survey period (Parker 1980) and, in most
cases, is assumed to be the absolute estimate of abundance for a given year (Stratoudakis et al. 2006).
However, estimates are typically imprecise with coefficients of variation generally exceeding 30% (Alheit
1993; Stratoudakis et al. 2006). Error variances in this study bounded the mean by approximately 50%, and
were comparable to previous studies (Zeldis and Francis 1998; Jackson et al. 2012). There are numerous
sources of biological variation that contribute to the imprecision of the biomass estimates, specifically relating
to the size structure of spawning population, relative spawning fraction, batch fecundity, population sex ratio
and egg density estimates (Alheit 1993). This study adopted new statistical approaches to account for the wide
variation in the population size structure typical of Snapper, body-weight specific dependence on batch
fecundity, and variation in the timing of spawning to refine estimates of daily egg production (Appendices 3
and 4). These approaches extended the traditional use of DEPM which have been largely confined to small
pelagic fish that do not exhibit the same level of variation in population demography and spawning dynamics
evident for Snapper, and are likely to have improved the accuracy of the biomass estimate. Although
accounting for these sources of variation was a significant improvement, it is recognised that the uncertainty
in estimates of mean daily egg production remains a key source of error. This is not unique to Snapper, but is
rather a ubiquitous issue with the DEPM that is strongly influenced by the spatial variability in egg abundance,
associated estimates of daily egg mortality rates, and the relative effectiveness of using vertical tows to sample
disparate patches of eggs (Dickey-Collas et al. 2012). This issue is typically evidenced by over dispersed
datasets that are characterised by a high proportion of zero egg counts (Pepin and Helbig 2012, Figure 8) and
in many cases precludes the calculation of biologically meaningful egg mortality rates (Z) (Somarakis et al.
2002). Daily egg mortality rate, in this study, was assumed to be 0.4 day-1, which was well within the published
range for Snapper (-1.59 to 1.4 day-1, Zeldis and Francis (1988); McGlennon (2003); Jackson et al. (2012)).
Altering these rates from 0.2 to 0.6 day-1 had little effect on the overall estimates of spawning biomass implying
that other sources of uncertainty are more influential than the assumed value of Z. It is likely that altering the
egg sampling methodology to ensure that sampling size was more consistent with egg patches and involved
sampling a greater volume of water would increase the probability of encountering eggs in a patchy
environment and improve the precision of estimates of mean egg density at each site (McGarvey, unpublished).

43
Despite the inherent variance within DEPM estimates of biomass, it is important to consider its relative value
in relation to the fishery-dependent alternative. Strong inconsistencies among the data sources that integrate
into the current SnapEst model introduces considerable uncertainty in its output. Furthermore, the model
struggles to reconcile the persistence of old fish in a population that is undergoing ‘transitional-depletion’,
because, theoretically, low levels of fishing effort coupled with the presence of old fish is indicative of a
sustainable resource. This interpretation, however, ignores the transfer of fishing effort towards other species
as the Snapper resource becomes economically unviable to fish, or potential behavioural differences of older
fish that may reduce their relative catchability (Fowler et al. 2016). The DEPM overcomes these deficiencies,
as it provides an estimate of the absolute abundance of the stock.
Application in the Assessment and Management of Snapper
Relying exclusively on fishery-independent sources would not adequately support the appropriate future
management of South Australia’s Snapper Fishery. Regular DEPM surveys of each of the main Snapper stocks
(i.e. SG/WC and GSV), would provide suitable information to assess stock status and develop management
strategies (i.e. output controls) that would improve long-term sustainability. However, there would be
insufficient information to meet other important management objectives that relate to maintaining catch
allocations and access between the fishing sectors (i.e. commercial, recreational and traditional). Similarly,
there would be a lack of important biological information obtained from fishery-dependent catch sampling
programs to track trends in the demography of the population, particularly the appearance and relative strength
of recruiting cohorts.
The integration of DEPM into existing fishery-dependent programs is relatively common, and in many cases
the unbiased estimates of spawning biomass are used to ‘tune’ indirect assessment methods like catch-at-age
analysis or biomass-based models (Jacobson et al. 1994; Deriso et al. 1996; Murua et al. 2010; Ward et al.
2015). A simplified cost benefit analysis indicated that a fully integrated assessment approach would provide
a 2.8% rate of return on investment in the improvement of the assessment and management of Snapper. This
program would include tuning the existing SnapEst model with the DEPM output, however, it remains
unknown as to whether this would improve the overall confidence of the resulting biological performance
indicators, or whether the strong inconsistencies in the input fishery-dependent data would continue to
compromise model outputs. Substituting the SnapEst modelling component with the DEPM in an augmented
assessment program appears to be the most-cost effective approach, yielding a return on investment of
approximately 8%. The costing of these programs fits within the current triennial assessment schedule, where
a full scale assessment is undertaken for Snapper every three years with limited interrogation of commercial
catch and effort data in the intervening years. The regularity of the DEPM surveys, either as part of a fully
integrated or augmented program, would depend on the specific objectives of the Snapper harvest strategy,
which is scheduled for review in 2018, and associated budget considerations.
The DEPM provides a suite of extra information that may add ‘value’ to the assessment and management of
the resource. Essential fish habitats, realised spawning areas and spatial variability in spawning behaviour can
all be derived from DEPM surveys (Dickey-Collas et al. 2012). Furthermore, information on regional

44
hydrodynamics, ichthyoplankton distributions, relative productivity and environmental conditions are
routinely collected, which may be of use in the assessment of broader ecosystem function. The patterns of egg
density identified in this study provided an important insight into the relative effectiveness of the five Snapper
spawning spatial closures that were implemented in 2013. All of the closures were strategically placed to
encompass either wrecks or benthic structure that were known to support large quantities of Snapper. Those
located in Spencer Gulf were the most effective, particularly the ‘Illusion’ closure which encompassed 9.3%
of the eggs surveyed in 2013, offering clear protection to spawning Snapper during the time of the survey.
Collectively, the four SG closures encompassed 10.2% of the eggs in 2013. Conversely, the ‘GSV’ closure in
GSV offered little protection (<1%) as most of the spawning activity occurred further south. Nevertheless, the
information derived from these surveys can be used to optimise the location of these Snapper spawning
closures in the future and the methodology will also be relied upon in refining the recently implemented spatial
closure for King George Whiting in South Australia’s southern gulfs (Steer et al. 2016 - FRDC project No.
2016-003).
Refining the Method for Snapper
Throughout the course of this investigation three key areas of improvement were identified to enhance the
application of the DEPM in the assessment of South Australian Snapper stocks. They specifically related to:
maximising the effectiveness of the egg sampling methodology; streamlining the identification of Snapper
eggs from mixed ichthyoplankton samples; and rationalising the level of data processing.
An important consideration in ecological field studies is to adopt a survey design that maximises the precision
of absolute population density estimates in spatially clustered populations. McGarvey et al. (unpublished)
demonstrated that long, narrow transects were consistently more precise than square quadrats in even
moderately clustered populations. This finding could improve ichthyoplankton surveys and associated DEPM
spawning biomass estimates. Snapper eggs are positively buoyant immediately post-fertilization and tend to
become more neutrally buoyant during development (Kitajima et al. 1993; Nahas et al. 2003). Consequently,
their relative abundance is likely to be higher at the sea surface (Parsons et al. 2014). Furthermore, the
aggregative nature of adult Snapper along with their ability to spawn throughout the day contributes to the
patchiness in the distribution of eggs (Jackson 2007). So far, Snapper eggs have been sampled using either
short vertical or oblique net tows with insufficient replication to achieve optimal precision (Zeldis 1993;
McGlennon 2003; Jackson 2007). SARDI has recently purchased a high speed plankton sampler (‘Gulf VII’
or ‘Nackthai’ net) that is designed to undertake controlled oblique tows throughout the water column over
longer distances. This new sampler could improve sampling efficiency and contribute to the optimisation of
the precision estimates of mean daily egg production. However, this will require validation by comparing its
relative performance against traditional samplers (Ward et al. 2017 – FRDC 2017-027).
The Snapper egg identification and validation component of this study was extremely challenging. The robust
nature of the eggs, particularly their tough protective extracellular casing (or ‘chorion’), was highly resistant
to chemical dissolution (see Oxley et al. unpublished). Consequently, the specific molecular probe was unable
to penetrate the chorion and hybridise with the embryonic ribosomal RNA. To counter this, each egg was

45
manually perforated to expose the embryonic tissue, allowing positive hybridisation in all Snapper eggs tested
(see Oxley et al. unpublished). It was anticipated that throughout the course of this three-year study the
molecular validation method would improve our understanding of Snapper embryo taxonomy and inform
future visual egg identification methods, potentially alleviating the need to perforate each egg. Despite storing
eggs in formalin during the 2015 surveys, which precludes molecular validation but clearly preserves the
morphological characteristics of the egg and developing embryo (Steedman, 1976; Keane 2015), the visual
identification of Snapper eggs was not 100% conclusive (see also Dias et al. 2016). In order to streamline the
egg identification component of the DEPM, it is suggested that future surveys rely exclusively on the unbiased
molecular validation technique, alleviating the source of error associated with visual identification.
Considerable data computation was required to derive an estimate of spawning biomass and its associated error
variance for Snapper over the eight DEPM surveys. Unlike traditional DEPM programs, this project extended
the statistical analysis to account for the inherent size-dependence in Snapper reproductive output and
population structure (Appendix 3). Furthermore, it derived a new method to estimate egg density at time of
spawning, where instead of accounting for loss of eggs through mortality for the overall population, it
accounted for each observed egg in each individual sample. This was necessary to overcome the challenge of
ascribing a specific time of spawning to Snapper as they spawn at different times throughout the day (Appendix
1). The formula required to integrate the error variance associated with each set of DEPM inputs, for the eight
spatially distinct egg surveys, and across five assumed values of mortality (i.e. Z = 0.2 to 0.6 eggs.day-1) was
onerous (Appendix 4). For fisheries to be effectively managed, particularly those that require information to
set subsequent harvest strategies (i.e. quota setting, scheduling seasonal closures), it is important that the
information is delivered in an appropriate time frame. Future development of an ‘R’ based statistical package
to specifically deal with the complex dataset generated from a standardised Snapper DEPM program would be
highly beneficial and contribute to the timely delivery of biomass estimates to fisheries management and
industry.
Conclusion
The work carried out in the study is a considerable improvement on the previous attempts to apply the DEPM
to assess South Australia’s Snapper Fishery. The ability to positively identify Snapper eggs through the novel
use of an established molecular technique has re-invigorated the capability of using the DEPM to provide a
fishery-independent estimate of spawning biomass for Snapper and has also increased its applicability to other
species where egg identification has been problematic. Furthermore, the extension of the traditional statistical
approaches to account for the inherent variation in Snapper population dynamics has contemporised the
method to provide more precise, unbiased biomass estimates. Despite the acknowledged level of imprecision
associated with estimates of biomass in this study, a characteristic ubiquitously observed in DEPM based
assessments, the overall trends aligned with the recent status assignment of the South Australian Snapper
stocks and broadly agreed with the industry’s assessment of the resource. A relatively simple cost benefit
exercise indicated that the incorporation of the DEPM would benefit the assessment and management of South

46
Australia’s Snapper resource, either through its full integration into the current assessment program or
augmenting it to rely less on compromised fishery-dependent data sources. It is likely that the incorporation
of the proposed methodological refinements, which include improving the sampling techniques; streamlining
laboratory processing; and rationalising data collection and analysis, would improve the DEPM’s overall
efficiency and increase the precision of the future assessments.

47
Implications
The flow-on implications of this study are diverse. Firstly, the successful development of the relatively non-
destructive molecular probe to positively detect Snapper eggs in mixed ichthyoplankton samples is a major
advancement for DEPM programs. This project has effectively broadened the capability of using DEPM as a
viable fisheries assessment tool for any multiple spawning species that produces pelagic eggs that are difficult
to identify and can be sampled effectively. Furthermore, the technique is equally capable of identifying larval
fish, or any other biogenic material of interest, from mixed plankton samples.
Secondly, this research has reduced the need to exclusively rely on fishery-dependent catch and effort data to
assess Snapper fisheries. The Snapper-specific molecular probe can be shared with other agencies that are
required to assess the status of their local Snapper stock (i.e. WA Fisheries; NSW Department of Primary
Industries; Fisheries Victoria; Queensland Department of Agriculture, Fisheries and Forestry; NIWA New
Zealand). Its application in assessing the Western Victorian Snapper stock (WVS) would be of particular
value, as the majority of the spawning population occurs within Port Phillip Bay which is a relatively small
enclosed body of water that can conveniently accommodate a DEPM survey (Hamer and Conron 2016).
Recent studies have indicated that at times of exceptionally high spawning success in Port Phillip Bay,
movement of resultant offspring into south-east South Australian coastal waters can be extensive (Fowler
2016).
Thirdly, the relative cost-effectiveness of incorporating the DEPM in South Australia’s current fishery
assessment program for Snapper, either through its full integration or via an augmented program, provides
options that are likely to benefit management and industry. Adding the DEPM will contribute an extra
unbiased source of information that can be synthesised with the existing fishery-dependent data streams that
will lead to more confidence assessments of the stocks. From this, greater confidence can placed on the
consideration of implementing output controls in the future refinement of the Snapper specific harvest strategy.
South Australia’s Sardine Fishery provides a clear example of how the DEPM derived estimate of spawning
biomass is the key biological performance indicator that underpins a tiered harvest strategy (Ward et al. 2015).
Fourthly, the intensive DEPM surveys have provided considerable information relating to Snapper early life
history, particularly the spatial distribution and abundance of Snapper eggs that identify areas of high spawning
activity. This level of information can be used to qualitatively assess the effectiveness of a series of spatial
‘spawning’ closures that were implemented in South Australia in 2013 as part of the recent Snapper
management strategies. The relative value of this information has been broadly acknowledged by management
and industry as the technique is currently being adopted to assess key spawning grounds for King George
Whiting in South Australia’s southern gulfs to inform future management of the fishery (Steer et al. 2016 -
FRDC project No. 2016-003).
Finally, this project plays an important role in the global advancement of the DEPM. The overarching
challenge in most DEPM programs relates to improving the precision of the biomass estimate. Effort is
continually directed at reducing the inherent variance associated with the integrated biological parameters.

48
The new statistical procedures developed to account for the variation in South Australia’s Snapper populations,
can be more widely applied and further refined in other DEPM based programs.

49
References
Alheit J (1993) Use of the daily egg production method for estimating biomass of clupeoid fishes: a review
and evaluation. Bulletin of Marine Science 53(2): 750-767.
Bernal M, Somarakis S, Witthames PR, van Damme CJG, Uriarte A, Lo NCH, Dickey-Collas M (2012) Egg
production methods in marine fisheries: An introduction. Fisheries Research, 117, 1-5
Cassie RM (1956) Early development of the Snapper, Chrysophrys auratus Forster. Transactions of the Royal
Society of New Zealand, 83, 705-713.
Crossland J (1977) Fecundity of the snapper, Chryosprys auratus (Picces: Sparidae) from the Hauraki Gulf,
New Zealand. Journal of Marine and Freshwater Research 11(4): 767-775.
Crossland J (1980) The number of snapper, Chrysophrys auratus (Forster), in the Hauraki Gulf, New Zealand,
based on egg surveys in 1974-75 and 1975-76. Fisheries Research Bulletin, NZ Ministry of Agriculture and
Fisheries 22: 38pp.
Dias PJ, CB Wakefield, DV Fairclough, G Jackson, MJ Travers, M Snow (2015) Real-time PCR validation of
visually identified Snapper Chrysophrys auratus (Sparidae) eggs. Journal of Fish Biology, 88: 811-819.
Dickey-Collas M, Somarakis S, Witthames PR et al. (2012) Where do egg production methods for estimating
fish biomass go from here? Fisheries Research, 117-118, 6 -11.
DeLong EF, GS Wickham, NR Pace (1989) Phylogenetic strains: ribosomal RNA-based probes for the
identification of single cells. Science, 243: 1360-1363.
Derison RB, JT Barnes, LD Jacobson, PR Arenas (1996) Catch-at-age analysis for Pacific sardine (Sardinops
sagax). 1983-1995. CalCofI 37: 175-187.
Fowler AJ, PR Jennings (2003) Dynamics in 0+ recruitment and early life history of snapper (Pagrus auratus,
Sparidae) in South Australia. Marine and Freshwater Research 54: 941-956.
Fowler AJ, McGlennon D (2011) Variation in productivity of a key snapper, Chrysophrys auratus, fishery
related to recruitment and fleet dynamics. Fisheries Management and Ecology 18: 411-423.
Fowler AJ, R McGarvey, P Burch, JE Feenstra, WB Jackson, MT Lloyd (2013) Snapper (Chrysophyrs auratus)
Fishery. Fishery Assessment report to PIRSA Fisheries and Aquaculture. South Australian Research and
Development Institute (Aquatic Sciences), Adelaide. F2007/000523-3. SARDI Research Report Series No.
713. 103 pp.
Fowler AJ, K Hall, BM Gillanders (2004) Adult migration, population replenishment and geographic structure
for Snapper in SA. Final Report to FRDC (Project No. 2002/001). South Australian Research and
Development Institute (Aquatic Sciences), Adelaide. SARDI Publication Number RD04/0163, 152 pp.
Fowler AJ, R McGarvey, J Carroll, JE Feenstra, WB Jackson, MT Lloyd (2016) Snapper (Chrysophyrs
auratus) Fishery. Fishery Assessment report to PIRSA Fisheries and Aquaculture. South Australian Research
and Development Institute (Aquatic Sciences), Adelaide. F2007/000523-4. SARDI Research Report Series
No. 930. 82 pp.
Fox CJ, MI Taylor, R Pereya, MI Villasana, C Rico (2005) TaqMan DNA technology confirms likely
overestimation of cod (Gadus morhua L.) egg abundance in the Irish Sea: implications for the assessment of
the cod stock and mapping of spawning areas using egg-based methods. Molecular Ecology, 14: 879-884.
Ham JM, Hutchinson WG (2003) Spawning and larval rearing research on King George Whiting (Sillaginodes
punctata) relevant to aquaculture and fisheries biology. Fisheries Research and Development Corporation,
Project Number 1997/314. 136 pp.
Hamer P, S Conron (2016) Snapper stock assessment 2016. Fisheries Victoria Science Report Series No. 10,
Fisheries Victoria, Queenscliff.
Lasker R (1985) An egg production method for estimating spawning biomass of pelagic fish: application to
the northern anchovy (Engraulis mordax). US Dep. Commer. NOAA Tech. Rep. NMF 36, 99pp.

50
Jackson G, YW Cheng (2001) Parameter estimation with egg production to estimate snapper, Pagrus auratus,
biomass in Shark Bay, Western Australia. Journal of Agricultural, Biological, and Environmental Statistics,
6(2): 243-257.
Jackson G (2007) Fisheries biology and management of pink snapper, Pagrus auratus, in the inner gulfs of
Shark Bay, Western Australia. Doctoral Thesis, Murdoch University, Western Australia.
Jackson G, YW Cheng, CB Wakefield (2012) An evaluation of the daily egg production method to estimate
spawning biomass of Snapper (Pagrus auratus) in inner Shark Bay, Western Australia, following more than a
decade of surveys 1997-2007. Fisheries Research, 117-118: 22-34.
Jacobson LD, NCH Lo, JT Barnes (1994) A biomass-based assessment model of northern anchovy, Engraulis
mordax. Fishery Bulletin 92: 711-724.
Jones GK (1981) Biological research on snapper (Chrysophrys auratus syn. Unicolor) and an analysis of the
fishery in Northern Spencer Gulf. SAFISH 5-8.
Jones GK (1984) A review of the commercial fishery for snapper (Chrysophrys auratus) in South Australian
waters. Discussion Paper, Department of Fisheries, South Australia.
Keane JP (2015) Genetic identification of Blue Mackerel (Scober australasicus) and Tailor (Pomatomus
saltatrix) eggs. In. Ward TM, G Grammer, A Ivey, J Carroll, J Keane, J Stewart, L Litherland (2015) Egg
distribution, reproductive parameters and spawning biomass of Blue Mackerel, Australian Sardine and Tailor
off the east coast during late winter and early spring. Final Report to FRDC Project No 2014/033, 86 pp.
Keane JP, JM Lyle (2015) Genetic identification of Jack Mackerel eggs. In. Ward TM, Burnell O, Ivey A,
Carroll J, Keane J, Lyle J, Sexton, S. Summer spawning patterns and preliminary daily egg production method
survey of Jack Mackerel and Australian Sardine off the East Coast. Final Report to FRDC (Project No.
2013/053). 64 pp.
Kitajima C, Y Yamane, S Matsui, Y Kihara, M Furuichi (1993) Ontogenetic change in buoyancy in early stage
of red sea bream. Nippon Suisan Gakkaishi 59: 209-216.
Lo NCH, Ruiz YAG, Cervantes MJ, Moser HG, Lynn RJ (1996) Egg production and spawning biomass of
Pacific Sardine (Sardinops sagax) in 1994, determined by the daily egg production method. CalCofi Rep. 37:
160-174
McGarvey R, Feenstra JE (2004) Stock assessment models with graphical user interfaces for key South
Australian marine finfish stocks. Final Report to FRDC (Project No. 1999/145). South Australian Research
and Development Institute (Aquatic Sciences), Adelaide, 176 pp.
McGarvey R, P Burch, JM Matthews (unpublished) Ecological field survey design precision: allocation, shape,
and number of sample plots. Ecological Modelling.
McGlennon D (2003) The fisheries biology and population dynamics of Snapper Pagrus auratus in northern
Spencer Gulf, South Australia. Ph.D. Thesis, University of Adelaide, Adelaide, Australia.
Mountfort D, L Rhodes, J Broom, M Gladstone, J Tyrrell (2007) Fluorescent in situ hybridisation assay as a
species-specific identifier of the northern Pacific seastar, Asterias amurensis. New Zealand Journal of Marine
and Freshwater Research, 41: 283-290.
Murua H, L Ibaibarriaga, P alvarez, M Santos, M Korta, M Santurtun, L Motos (2010) The daily egg production
method: a valid tool for application to European hake in the Bay of Biscay? Fisheries Research 104: 100-110.
Nahas EL, G Jackson, CB Pattiaratchi, GN Ivey (2003) Hydrodynamic modelling of snapper Pagrus auratus
egg and larval dispersal in Shark Bay, Western Australia: reproductive isolation at a fine spatial scale. Marine
Ecology Progress Series 265: 213-226.
Neira FJ, Perry RA, Burridge CP, Lyle JM, Keane JP (2014) Molecular discrimination of shelf-spawned eggs
of co-occurring Trachurus spp. (Carangidae) in southeastern Australia: a key step to future egg-based biomass
estimates. ICES Journal of Marine Science, 72: 614-624.
Norriss JV, Jackson G (2002) Identifying the developmental stages of preserved eggs of Snapper, Pagrus
auratus, from Shark Bay, Western Australia. Fisheries Research Report [Western Australia], 142, 1-29.

51
Oxley APA, SR Catalano, ML Wos-Oxley, E Westlake, G Grammer, MA Steer (unpublished). Using in situ
hybridization (ISH) to extend the Daily Egg Production Method (DEPM) to new species. Molecular Ecology
Resources.
Parker K (1980) A direct method for estimating northern anchovy, Engraulis mordax, spawning biomass.
Fisheries Bulletin: 514-544.
Parsons DM, CJ Sim-Smith, M Cyer, MP Francis, B Hartill, EG Jones, A Le Port, M Lowe, J McKenzie, M
Morrison, LJ Paul, C Radford, PM Ross, KT Spong, T Trnski, N Usmar, C Walsh, J Zeldis (2014) Snapper
(Chrysophrys auratus): a review of life history and key vulnerabilities in New Zealand. New Zealand Journal
of Marine and Freshwater Research 48(2): 256-283.
Pecl G, T Ward, F Briceno, A Fowler, S Frucher, C Gardner, P Hamer, K Hartmann, J Hartog, A Hobday, E
Hoshino, S Jennings, B Le Bouhellec, A Linnane, M Marzloff, S Mayfield, C Mundy, E Ogier, A Sullivan, S
Tracey, G Tuck, S Wayte (2014) Preparing fisheries for climate change: identifying adaptation options for four
key fisheries in South Eastern Australia. Fisheries Research and Development Corporation, Project 2011/039.
Pepin P, Helbig JA (2012) Sampling variability of ichthyoplankton surveys- exploring the roles of scale and
resolution on uncertainty. Fisheries Research 117-118: 137-145.
Picquelle S, G Stauffer (1985) Parameter estimation for an egg production method of northern anchovy
biomass. In An egg production method for estimating spawning biomass of pelagic fish: application to the
northern anchovy, Engraulis mordax, R. Lasker, ed, NOAA Tech. Rep. NMFS 36:7-16.
PIRSA (2013) Management Plan for the South Australian Commercial Marine Scalefish Fishery. PIRSA
Fisheries and Aquaculture, Adelaide. The South Australian Fishery Management Series, Paper No. 59, 143
pp.
Pradillon F, A Schmidt, J Peplies, N Dubilier (2007) Species identification of marine invertebrate early stages
by whole-larvae in situ hybridisation of 18S ribosomal RNA. Marine Ecology Progress Series, 333: 103-116.
Rice, J (1995) Mathematical statistics and data analysis. Pacific Grove, CA: Duxbury.
Scholin CA, P Miller, K Buck, F Chavez, P Harris, P Haydock, J Howard, G Cangelosi (1997) Detection and
quantification of Pseudo-nitzchia australis in cultured and natural populations using LSU rRNA-targeted
probes. Liminology Oceanography, 425: 1265-1272.
Saunders RJ (2009) The reproductive biology and recruitment dynamics of snapper, Chrysophrys auratus.
Doctoral Thesis, University of Adelaide, South Australia.
Saunders RJ, AJ Fowler, BM Gillanders (2012) The spawning dynamics of snapper (Chrysophrys autatus) in
northern Spencer Gulf. New Zealand Journal of Marine and Freshwater Research 46: 491-510.
Scott SG, JR Zeldis, NW Pankhurst (1993) Evidence of daily spawning in natural populations of the New
Zealand snapper Pagrus auratus (Sparidae). Environmental Biology of Fishes 36: 149-156.
Somarakis S, C Koustsikopoulos, A Machias, N Tsimenides (2002) Applying the daily egg production method
(DEPM) to small stocks in highly heterogeneous seas. Fisheries Research 55: 193-204.
Steedman HF (1976) Examination, sorting and observation fluids. In. Steedman HF (ed) Zooplankton fixation
and preservation. Monographs on Oceanographic Methodology, 4. UNESCO. 182-183.
Steer MA, MJ Doubell, A Oxley, R McGarvey. (2016) King George Whiting spawning dynamics in South
Australia’s southern gulfs: to inform improved assessment and management of the resource. FRDC Project
2016/003.
Stratoudakis Y, Bernal M, Ganias K, Uriarte A (2006) The daily egg production method: recent advances,
current applications and future challenges. Fish and Fisheries, 7: 35-57.
Sumpton WD, S Jackson (2010) Reproductive biology of snapper (Pagrus auratus) in subtropical areas of its
range and management implication of reproductive differences with temperate populations. Asian Fisheries
Science 23: 194-207.
Thomas Y, C Belliard, P Garen, T Gueguen, C Montagnani (2011) Development of in situ hybridisation using
16S rRNA gene to monitor black-lip pearl oyster, Pinctada margaritifera, larvae in plankton samples. Aquatic
Living Resources, 24: 27-34.

52
Wakefield CB (2006) Latitudinal and temporal comparisons of the reproductive biology and growth of
snapper, Pagrus auratus (Sparidae), in Western Australia. Doctoral Thesis, Murdoch University, Western
Australia.
Wakefield CB (2010) Annual, lunar and diel reproductive periodicity of a spawning aggregation of snapper
Pagrus auratus (Sparidae) in a marine embayment on the lower west coast of Australia. Journal of Fish
Biology 77: 1359-1378.
Ward TM, Rogers PJ, McLeay LJ, McGarvey R (2009) Evaluating the use of the daily egg production method
for stock assessment of blue mackerel, Scomber austrasicius. Journal of Marine and Freshwater Research 62:
112-128.
Ward TM, P Burch, LJ McLeay, AR Ivey (2011) Use of the daily egg production method for stock assessment
of sardine, Sardinops sagax, lessons learned over a decade of application off southern Australia. Reviews in
Fisheries Science 19: 1-20.
Ward TM, G Grammer (2016) Commonwealth small pelagic fishery: fishery assessment report 2015. Report
to the Australian Fisheries Management Authority. South Australian Research and Development Institute
(Aquatic Sciences), Adelaide, SARDI Publication No. F2010/0002707-7. SARDI Research Report Series No.
931, 31 pp.
Ward TM, AR Whitten, AR Ivey (2015) South Australian Sardine (Sardinops sagax) Fishery: Stock
Assessment Report 2015. Report to PIRSA Fisheries and Aquaculture. South Australian Research and
Development Institute (Aquatic Sciences), Adelaide. F2007/000765-5. SARDI Research Report Series No.
877. 103 pp.
Watson DF (1981) Computing the n-dimensional Delaunay tessellation with application to Voronioi polytopes.
Computer Journal 24(2) 167-172
Zeldis JR, RICC Francis (1988) A daily egg production method estimate of snapper biomass in Hauraki Gulf,
New Zealand. ICES Journal of Marine Science 55: 522-534.
Zeldis J (1993) Applicability of egg surveys for spawning-stock biomass estimation of snapper, orange roughy,
and hoki in New Zealand. Bulletin of Marine Science 53: 864-890.

53
Recommendations
It is recommended that the results of this study be broadly disseminated to PIRSA Fisheries and Aquaculture
(managers); the Commercial, Recreational and Charter Boat sectors of the South Australian Marine Scalefish
Fishery (MSF); DPI Vic; DAFF Qld; NSW DPI; national and international fisheries scientists; general public.
Extension and Adoption
It is expected that there will be considerable engagement with PIRSA and industry regarding the integration
of the DEPM into the on-going assessment of South Australia’s Snapper stocks and associated harvest strategy
development. This may serve as an example to other jurisdictions and lead to an alignment of the national
assessment capabilities for Snapper and develop cross-jurisdictional management strategies to ensure the
sustainable harvest of the resource.
Project coverage
If applicable report on any media, industry or government article on the project.
2015
The Lead: http://www.theleadsouthaustralia.com.au/industries/primary-industries/turning-eggs-blue-will-aid-
in-snapper-tally/
18 March 2015: Food Navigator Asia: http://www.foodnavigator-asia.com/Policy/Turning-eggs-blue-will-
transform-snapper-fisheries
2017
11 January 2017: ABC Country Hour SA: http://www.abc.net.au/news/rural/programs/sa-country-hour/2017-
01-11/sa-country-hour-11-january-2017/8175740
13 January 2017: ABC online http://www.abc.net.au/news/2017-01-12/snapper-eggs-turned-blue-to-help-
fish-management/8177772
13 January 2017: Sport Fishing magazine: http://www.sportfishingmag.com/red-snapper-eggs-turned-blue
13 January 2017: WAFIC: http://www.wafic.org.au/news/turning-snapper-eggs-blue-help-fisheries-
management/
March 2017: Channel 10 Scope TV featuring snapper blue eggs (Not aired yet)

54
Appendices
APPENDIX 1: Derivation of a new stage-tow-specific egg density (D0) estimator
Introduction
In this Appendix we describe and mathematically detail a new method to estimate 0D , the DEPM survey
measured mean egg density at time of spawning (also known as 0P ). We adopted the approach recommended
by McGarvey and Kinloch (2001) and Bernal et al. (2011a; 2011b) where mortality rate from any given survey
was not attempted.
Estimating mortality, a change over time, from DEPM survey samples is not generally feasible. Vertical tow
egg samples vary only in space, and afford no repeated sampling over time at any single location or patch of
spawned eggs. So information on a temporal change in egg density is minimal or absent. Moreover, the sample
variation in space of egg counts for South Australian Snapper, and for many pelagic fish stocks is large, often
immense. The distribution is typically highly skewed with many zeros and a few very high counts, so estimates
of mean egg density averaged over space are imprecise. To extract a temporal signal for morality from such
highly variable data would be challenging even if there were repetition over time. To counter this, we assume
a set of plausible values for instantaneous egg mortality rate ( Z in days-1) based on previous literature and
compute the 0D estimate for each assumed Z .
Overview of method
The principal innovation of this new method for estimating 0D is to account for mortality loss (from the time
of spawning to the time of observed sample measurement) for each observed egg stage in each individual
vertical sample tow, rather than for the overall population through a least squares linear regression (Lo 1985)
or from a prior assumed Z in a GAM (Bernal et al. 2011b). This individual egg density at time of spawning
0, ,i sD is computed from the observed egg density by stage and tow ,
obs
i sD , where stage is subscripted by s and
tows vary over subscript i . Several advantages accrue by accounting for egg mortality and converting to a
time rate for each stage-tow sample of eggs individually.
One important challenge in applying DEPM to South Australian Snapper is that the timing of egg release is
not well approximated by a single daily instantaneous time of spawning, such as midnight, in each 24-hour
day. In this project, Snapper were found to spawn over approximately 16 hours from 11:00 to 2:00, with some
spawning evident in every hour of the day (Figure 7) Therefore, the standard DEPM method of assigning egg
age based on (1) an assumed fixed instantaneous spawning hour in each day, (2) the time of day each vertical
tow sample was taken, and (3) an adjudicated allocation of stage/tow samples into day 1 or day 2 is not
employable with South Australian Snapper.

55
The stage-tow-mortality-specific method we present below for estimating 0D does not require allocating each
stage/tow sample to either day 1 or day 2. Since the methods for making this binomial allocation involve
additional assumptions, this removes one source of DEPM estimate uncertainty. The assumption of a single
instantaneous spawning time each day also carries additional error in egg ageing since, in reality, spawning
times vary. Moreover, this variation in spawning time can also confound the allocation of samples to day 1 or
day 2 in the standard DEPM treatment of stage/tow egg samples.
In place of a breakdown of samples into day 1 and day 2, we require only the stage- and temperature-dependent
egg ageing relationship used in all DEPM analysis. From that, the average lifespan of eggs is computed. To
obtain a daily egg production rate from the measured egg density per unit area, we divide by this average time
eggs exist, and so can be observed in the water column. Specifically, for each stage s and sample i , we divide
,
obs
i sD after accounting for expected mortality from time of spawning, which is a survey measure of egg density
per unit area, by the expected hatching time
( ( )iH T in days), to obtain 0, ,i sD , which is a rate of eggs spawned per day and also per m2.
Estimator derivation
Each measured egg density from each combination of stage and survey tow is a data point in this estimator.
We treat survey tows as independent as in most DEPM estimators. By dividing each vertical tow into day 1
and day 2, most DEPM estimators also effectively treat days 1 and 2 in each tow as independent. Here, we
instead sum the measured egg density at spawning from all observed stages in each tow, to get one sample
measure of eggs spawned per unit area per unit time from each vertical tow. Summing across stages is possible
by this new method because each 0, ,i sD is individually adjusted for mortality back to spawning time, and also
converted to a rate per day by dividing by the expected egg lifespan for each stage individually prior to
summing. In other words, each 0, ,i sD estimates the same quantity of eggs released at time of spawning per
unit area per unit time. Because the observed measure of eggs per m2 for each stage is individually converted
to a rate per day, we must sum over all stages in each tow to get a sample measure of total eggs spawned per
day per m2. We have confirmed this 0D model estimation logic, devised under this project, using basic
simulations in Excel that are summarised briefly below.
As in previous DEPM estimators, we assume an exponential survival of eggs over the time (age) from
spawning to the time of vertical tow sample measurement. Using prior South Australian Snapper egg
development experiments in the laboratory by McGlennon (2003), we applied the McGlennon formula for the
average age of an egg, given the stage and temperature (T ):
0.827( , ) 36.158 exp 0.12M Ma s T T s . (A2.1)
The conversion from the 16 stage categories ( Ms ) that McGlennon (2003) defined to the 9 stages used to stage
Snapper eggs in this study ( Ss ) (Table A2.1).

56
Table A2.1. Conversion mapping of stages applied in the McGlennon staging formula, from 1 to 16, to the 9
egg stage categories applied in the current study.
Egg stages defined by
McGlennon (2003) ( Ms )
Egg stages used in this
study ( Ss )
1.5 1
3.5 2
5.5 3
7.5 4
9 5
10.5 6
12.5 7
14.5 8
16 9
From the staging formula we can derive an estimated egg duration (hatching age), as a function of T. The
hatching time ( ( )H T ) is taken as the age of the last stage prior to hatching (McGlennon (2003) stage Ms =16)
plus half the difference in age between the last two defined stages:
(16, ) (15, )
( ) (16, )2
a T a TH T a T
(A2.2)
From the observed temperature [ ]T i in each tow i , the expected hatching time ( [ ])H T i is computed.
Based on the logic given in the preceding section, 0, ,i sD is computed as follows:
0, , , exp ( [ ], [ ]) ( [ ])obs
i s i s M SD D Z a s s T i H T i . (A2.3)
The egg density at time of spawning, per day per m2, for each vertical tow i is the sum over all stages of
observed egg densities:
0, 0, ,i i s
s
D D . (A2.4)
Finally, the estimate of mean egg density 0D , for each survey, is obtained by averaging over all in tows:

57
0 0,
1i
ii
D Dn
. (A2.5)
For the surveys undertaken in this project, where some eggs were identified as Snapper within survey zones
of approximately 5-12 tows in addition to the egg samples where Snapper eggs were identified by individual
tow, the final egg density was computed by taking a weighted average over zones, weighting by zonal
spawning area, zoneA :
0 0 0,
in
1 1zone
zone izonezone i zonezone i
zone
D A D DA n
. (A2.6)
Simulation testing of the new stage-tow specific 0D estimator
To test the accuracy of the new stage-tow-specific 0D estimator, we constructed a basic data simulator in
Excel with two purposes. The first purpose was to test that (1) dividing by hatching time and inverting mortality
losses for each stage and tow (Eq. 2.3), and then summing over stages (Eq. 2.4) and averaging over tows (Eq.
2.5), recovered the correct (simulation assumed) population egg density at time of spawning. Second, we
sought to test the impact on estimate reliability of variations in the actual spawning times over 24 hour days.
Simulation Method
This egg spawning simulation accounts for no variation in space. Only hourly spawning times are represented.
A user-specified number of eggs (per m2) are spawned in each hourly time step of the simulation. 7 days of
spawning were simulated, with spawning proportion by hour permitted to vary. The proportion of eggs
spawned in each hour of the 24-hour day, was repeated for each of the 7 days.
Mortality of eggs, and so the declining egg numbers with stage of each cohort, were computed assuming a
negative exponential decline. Average ages of each hourly cohort are computed directly from the McGlennon
formula, given temperature. A single temperature, constant in time, was assumed, though this could vary if
desired. Given mortality rate, age, and the number of eggs spawned in each hour, the egg population numbers
of all 9 stages of each hourly cohort are computed for each daily hour over 7 days.
The times of spawning and subsequently of persistence for each hourly cohort are explicit for purposes of
specifying times of sampling. Adding stage age to the spawning time of each hourly cohort gives the average
hour and day in which each stage and hourly cohort existed, and so was observable in the water column. Taking
the midpoints between each average age, the beginning and end times of each stage for each hourly cohort
were computed. For each given time when egg density was sampled (hourly time, in decimal days), the density
of eggs present and so measured (for these two simulation purposes, without error) by a vertical tow was
computed.
From sampled egg densities (per m2) by stage sampled, we apply the stage-tow specific 0D estimator to obtain
each single vertical tow measure of 0D .

58
Stage-Tow-Specific D0 Estimator Simulation Test Results
To achieve the first purpose, we imposed a scenario that assumes an identical density of 100 eggs spawned per
m2 in all 24 hours of each day. This gives a daily egg production of 2400 eggs m-2. Applying the stage-tow
specific estimator yielded an estimate of 2417.3 eggs m-2, or 0.721% above the true value of 2400.
This difference of 0.721% is sufficiently small so as to confirm the accuracy of the stage-tow-specific 0D
estimator and could possibly be explained by a number of approximations, for example, the hourly discreteness
of simulation time steps.
For the second purpose, using the observed spawning proportions, by hour, that were back-computed from the
data averaged over all regions/surveys (Figure 7), with a scenario of repeatedly sampling for egg density once
hourly over a 24 hour period, the average of 24 hourly tows gave 1.0072 compared to a true value (for this
simulation) of 1.
This difference of 0.721% is identical (to at least 7 significant digits) to the error obtained with the entirely
different scenario of the first purpose described above. Such close (effectively identical) agreement suggests
that the difference may lie in the approximations made to construct the simulation.
Thus accepting that the 0.721% difference obtained for the two scenarios tested is negligibly small and is
plausibly due to the simulation approximations used to test it rather than to the estimation method we here
sought to test, these simulations confirm the accuracy of the stage-tow-specific 0D estimator.
References
Bernal, M., Stratoudakis, Y., Wood, S., Ibaibarriaga, L., Uriarte, A., Valdés, L., & Borchers, D. (2011a). A
revision of daily egg production estimation methods, with application to Atlanto-Iberian sardine. 1. Daily
spawning synchronicity and estimates of egg mortality. ICES Journal of Marine Science: Journal du
Conseil, 68(3), 519-527.
Bernal, M., Stratoudakis, Y., Wood, S., Ibaibarriaga, L., Valdés, L., & Borchers, D. (2011b). A revision of
daily egg production estimation methods, with application to Atlanto-Iberian sardine. 2. Spatially and
environmentally explicit estimates of egg production. ICES Journal of Marine Science: Journal du Conseil,
68(3), 528-536.
Lo, N. C. H. (1985). Egg production of the central stock of northern anchovy, Engraulis mordax, 1951-82.
Fishery Bulletin, 83(2), 137-150.
McGarvey, R., & Kinloch, M. A. (2001). An analysis of the sensitivity of stock biomass estimates derived
from the daily egg production method (DEPM) to uncertainty in egg mortality rates. Fisheries Research,
49(3), 303-307.
McGlennon, D. (2003). The fisheries biology and population dynamics of Snapper Pagrus auratus in
northern Spencer Gulf, South Australia (Doctoral dissertation).

59
APPENDIX 2. Estimating parameters for an allometric relationship of Snapper batch fecundity to body weight
Introduction
To model the relationship of eggs released per female per day (batch fecundity) versus Snapper body weight,
an allometric relationship was assumed. Other models were tested using least squares fits and an allometric
was found to be the best fitting model. The allometric function for batch fecundity
(batchF ) versus weight taken as a continuous variable (W) is
ˆ ( )batchF W W . (A3.1)
Examining the scatterplot of observations in this relationship (Figure 10), there is a non-uniform spread of
residuals, that is, the residuals increase with body mass along x. To account for the increasing spread of
observations about the model predicted mean, the fit to these data was formulated as a maximum likelihood
estimate.
In this Appendix, we describe the maximum likelihood estimator including the error structure which specifies
the assumed dependence of the residuals on body weight, write out the likelihood function, and present the
final weight-dependent batch fecundity parameter estimates used in the DEPM spawning biomass estimation
(Appendix 4).
Method
A normal likelihood was used. The standard deviation of the likelihood which quantifies the spread of residuals
about the curve of Equation 3.1 was (like the mean itself) written as an allometric function of body weight:
1
0( )W W (A3.2)
The normal negative log likelihood is written:
2
21
ˆ ( )ln 0.5 ln 2 ( )
2 ( )
Fbatch batch
ni i
i
i i
F W FL W
W
, (A3.3)
where the set of Fn observations of female Snapper weight and batch fecundity is denoted by
, ; 1,batch
i i FW F i n , and where ˆ ( )batch
iF W is the model (3.1) evaluated at each observed body weight, iW .
The four model parameters 0 1, , , were estimated by numerically minimising the negative log
likelihood, giving the values of Table A3.1.
Table A3.1. Batch fecundity symbols, their estimated parameter values, and 95% confidence bounds (CB) on
each parameter.
Symbol Parameter estimated value 95% CBs (lower, upper)

60
137.3 (126.9, 149.0)
0.910 (0.900, 0.920)
0 11.70 (10.31, 13.43)
1 0.741 (0.731, 0.753)
The resulting allometric model fit curve and associated modelled spread of observations about this curve are
plotted in Figure 10.

61
APPENDIX 3. An extended DEPM estimator of spawning biomass, accounting for body-weight specific dependence of batch fecundity and population structure
Introduction
Snapper vary over a much wider range of body sizes than adult sardines and other small pelagic species, and
therefore size-dependence of adult population parameters is stronger. Snapper batch fecundity (eggs released
per female per day) has an allometric dependence on body mass (Appendix 3) that varies over about an order
of magnitude among South Australian Snapper. In addition, the size-frequency data for Snapper are far from
normal (Figure 9). Due to highly sporadic temporal variation in recruitment, South Australian Snapper show
a widely bi-model size-frequency structure. This renders inaccurate the approximation of a single mean female
body weight made in nearly all prior DEPM studies.
To improve accuracy, one objective is to develop a DEPM estimator of spawning biomass that incorporates
explicit size-dependence of adults. This Appendix will derive and present new formulas for an extended DEPM
adult spawning biomass estimation method.
Output estimates of the size-dependence extended DEPM method will be twofold: the total number of
spawning females, and the total spawning biomass.
Model derivation
In order to incorporate size-dependence of batch fecundity and population size frequency, both as functions of
adult weight class, we derive the spawning biomass estimate from first principles, incorporating the same or
similar logic that previous DEPM estimators presumably did (though Parker’s seminal paper (1980) does not
present this derivation, instead citing previous work). The population is divided into 26 weight classes, ranging
from 0.5 to 13.5 kg, grouped into 0.5 kg bins. The derivation is achieved by forming two equations for average
total daily egg production of the population under study, and equating them.
First, an expression for total eggs produced per day can be derived from adult reproductive parameters (Table
1), including the total number of females in the adult population to be estimated.
In any given weight class, subscripted by w, the eggs produced equals the batch fecundity of an average actively
spawning female of that weight (batch
wF ), times the proportion of female Snapper actively spawning during the
DEPM survey (the spawning fraction S , assumed constant with size), times the total number of adult females
in the spawning area (fem
wN ).
Summing over all weight classes, the following expression is obtained for the total number of eggs spawned
per day in the spawning area:
adult batch fem
w w
w
Eggs F N S . (A4.1)

62
SAFCOL market samples provide the proportions of female Snapper in the population by weight class,
assuming that the market sampling of the catch reflects the size structure of the spawning population, and
further assuming sexual dimorphism for Snapper, which is supported by biological studies and widely assumed
for most Snapper assessments. Female Snapper numbers by weight class can be written as a product of the
total number of Snapper females (,fem TotN , to be estimated) times the Snapper number proportion by weight
class (N
wP ):
,fem fem Tot N
w wN N P . (A4.2)
Substituting (2) into (1) gives the first expression for total population egg production:
,adult fem Tot batch N
w w
w
Eggs N S F P . (A4.3)
A second expression for total egg production can be obtained from the DEPM survey. The eggs released by
all spawning females per day equals the survey-measured egg density, the mean number of eggs spawned per
24-hour day per m2 ( 0D ), times the total spawning area (spA in m2):
0
surv spEggs D A . (A4.4)
By equating the two expressions (3) and (4) for the total eggs produced per day in the spawning area and
solving, an estimate is obtained for the total number of females in the spawning area:
, 0
spfem Tot
batch N
w w
w
D AN
S F P
. (A4.5)
To obtain an estimate of total spawning biomass (spB ), including males, we multiply the estimated number of
females in each weight class (Equation 2) by the mean weight ( ww , taking the midpoint of each weight class),
and divide by the sex ratio given as a proportion by weight of females ( R , assumed constant):
,fem Totsp N
w w
w
NB P w
R . (A4.6)
Finally, inserting (5) into (6), we obtain a closed form solution for total spawning biomass in which size
dependence of batch fecundity and of population structure are explicit:
0
spsp N
w wbatch Nww w
w
D AB P w
S R F P
(A4.7)

63
Table A4.1. Variables used in the derivation, and their definitions.
Variable Description
w Weight class subscript
0D Survey measured total Snapper egg production, per day, in given region and year
batch
wF Batch fecundity, the number of eggs produced per day by an average female of
weight w on the days when she is actively spawning
N
wP
Population number proportions by weight class, w, from market catch samples
ww Mean weight in each weight class (taken as the midpoint)
S Spawning fraction, proportion of female Snapper actively spawning in days of egg
survey
spA Area of active Snapper spawning in given region and year, see Figure 6
R Sex ratio, the proportion of the population, in biomass, that is female
fem
wN Estimated number of females in the spawning population, by weight class, w
,fem TotN Estimated number of females in the spawning population, total
spB Estimated spawning biomass of the population, both sexes included
adultEggs Total eggs produced by females inside the spawning area for a given region and
year, estimated from adult reproductive parameters
survEggs Total eggs produced by females inside the spawning area for a given region and
year, estimated from DEPM survey-measured egg density.

64
APPENDIX 4. Computing standard errors for the DEPM spawning biomass estimate
Introduction
In this Appendix, we describe the methods used to compute confidence intervals for spawning biomass
estimates from the eight surveys.
The estimation of confidence intervals applied is the delta approximation method. This is a standard approach
to estimating approximate confidence intervals for an estimator that is written as function of a set of variables
(see e.g. Cassella and Berger 2002). The DEPM spawning biomass estimator (Appendices 2 and 4), is written
as a function of measured egg density and spawning area, and adult spawning parameters, whose variances
(the standard errors squared) were estimated individually. The delta method applies a first-order Taylor
approximation assuming the uncertainty in inputs are not large compared with the input estimate values
themselves.
A delta function estimate for adult-weight-frequency DEPM spawning biomass
For spawning biomass (spB ), the input quantities are the six inputs to Eq. A4.7, namely 0D , S, R , {
N
wP },
and {batch
wF } defined in Appendix 4. Since the mean weights ( ww ) are taken as the midpoints of each weight
bin, the mean weights ( ww ) have no uncertainty.
The spawning biomass estimation formula (from Appendix 4) is:
0
spsp N
w wbatch Nww w
w
D AB P w
S R F P
. (A4.7)
The delta approximation formula for the variance of spawning biomass, given in terms of the variances of the
input quantities (two of which, {N
wP }, and {batch
wF }, are vectors over the 26 weight bins) is written following
Casella and Berger (2002):
22 2
0
0
2 22
ˆ ( ) ( ) ( )
( ) ( ) ( )
sp sp spsp
sp
sp
sp sp spN batch
w wN batchw ww w
B B BV B V D V A V S
D A S
B B BV R V P V F
R P F
. (A5.1.)
Here the partial derivatives (0
spB
D
, etc.) are all evaluated at the mean (point) estimate values of the independent
variables 0 , , , ,{ },{ }N batch
sp w wD A S R P F . The variances of the inputs to the DEPM spawning biomass
estimate, 0( ), ( ), ( ), ( ),{ ( )},{ ( )}N batch
sp w wV D V A V S V R V P V F , must be supplied as prior inputs, generated
from the prior estimation of these independent variables, i.e. from the standard errors squared.

65
Computing prior input variances
The prior variance for 0D ( 0( )V D ) was estimated by the textbook (2s n ) variances of a sample mean, the
square of the standard error. In future estimates, this will be computed from the sum of square differences (2s
) among all vertical tows in each survey. In these surveys, where the 0D estimates were computed from egg
density measurements aggregated into zones that included multiple vertical tows, we used a standard weighted
square difference sum among zones of each survey to compute 2s , where
,surv zonen is the number of zones in
each survey. The weighting by zone
(,Surv ZoneW ) is simply the area proportion covered by each zone in each survey region:
,
,
,
,
1
Surv Zone
Surv iZone
Surv iZone n
Surv iZone
iZone
AW
A
. (A5.2)
The weighted mean over zones for 0D in each survey were computed as
,
0, , 0, ,
1,
1 Surv Zonen
Surv Surv iZone Surv iZone
iZoneSurv Zone
D W Dn
. (A5.3)
The variance for this estimate of a weighted mean is computed as
,
2
0, , 0, , 0,
1,
1( )
Surv Zonen
Surv Surv iZone Surv iZone Surv
iZoneSurv Zone
V D W D Dn
. (A5.4)
Variances for the spawning areas (spA ) were difficult to quantify and uncertainty in spawning area was
omitted (setting all ( )spV A =0) in these confidence interval estimates.
Like 0D , the prior variances for spawning fractions S ( ( )V S ) were also computed as the variance of a
weighted mean using the method described for 0( )V D in Eqs. A5.2-A5.4. For ( ),V S the variation is computed
as the weighted sum of square differences among all four locations where adult Snapper were sampled (by rod
and line fishing), undertaken for each of the eight surveys. Weightings were by proportional numbers of adult
female Snapper sampled in each adult sample location.
The variance for the mean of female sex ratio ( ( )V R ) was statistically estimated as a ratio estimator. Inputs
to the estimate of spawning fraction ratio fem totR N N in each survey (from n repeated samples of adult
Snapper at different locations) were numbers of females ( )femN and total adults ( totN ) sampled at these
locations. The variance of a ratio estimate (see e.g. Rice 1995) is estimated by standard Taylor expansion (delta
approximation) as

66
2
2
12 cov ,
fem fem
tot fem fem tot
tot tot tot
N NV R V N V N N N
n N N N
. (A5.5)
To compute the input variances for the weight-frequency proportions ({ ( )N
wV P }), standard multinomial
proportion sampling errors were assumed. The formula for the variance of these multinomial weight
proportions is given by
(1 )
( )N N
N w ww
P PV P
n
(A5.6)
for all n = 26 weight bins w (each 0.5 kg). Because multiple years were needed to provide sufficient Snapper
weight-bin proportion sample sizes, and to cover all survey years given that South Australian Snapper size-
frequency market samples are taken in only two of every three years, one set of {N
wP }, and so one set of {
( )N
wV P } were computed for each of the four regions, and used for both years of survey in each region.
The variances for the batch fecundities {batch
wF } were computed from the computed error bars of the fit (Figure
10), reflecting the spread of residuals. These fit errors are estimated in the maximum likelihood fit of batch
fecundity versus body weight from the two parameters defining the spread of observations about the normal
likelihood (Eq. A3.2 of Appendix 3). The estimated variances of batch fecundity for each weight bin w are:
12
2
0( ) ( )batch
w w wV F w w . (A5.7)
Discussion
Given that { } and { }N batch
w wP F are vectors each of 26 elements (26 weight bins) the total number of
independent variables in this Taylor expansion formula is 56. Since each derivative is itself a relatively lengthy
mathematical expression, deriving the explicit formula for Eq. A5.1 is not practically feasible by ordinary pen
and paper algebra. For this reason, we derived an explicit variance estimation formula by coding Eq. A5.1 in
Mathematica symbolic manipulation language and performed the derivation using machine calculus and
algebra. This produced a formula 17 pages long that was incorporated into a single Mathematica function. This
was applied to the eight survey datasets (consisting of the point estimates for each of the 56 DEPM inputs, at
which the derivatives were evaluated, and their 56 prior variances
0( ), ( ), ( ), ( ),{ ( )},{ ( )}N batch
sp w wV D V A V S V R V P V F . Combining these permitted numerical evaluation of
Eq. A5.1 for each survey, providing the estimate of variance, and so also standard error (the square root of the
variance) for the estimate of spawning biomass of each DEPM survey.
Because multiple prior values for egg mortality Z of {0.2, 0.3, 0.4, 0.5, 0.6} were assumed, for each Z , a
full set of 56 point estimates for 0D , S , etc. (in R, Appendices 2 and 4) and their prior input variances (in R
or Excel) for each survey were generated. Running the delta estimator over Z values produced independent
estimates of variance and so also confidence interval for each Z and survey.

67
The uncertainties for survey egg density ( 0D ) were highly skewed. With zero as a lower bound for egg density
by tow, negative residuals (for 0D ’s by tow below the mean) were also bounded. A few very large values of
0D produced much larger positive residuals above the mean of 0D . To more accurately characterise
confidence intervals for 0D , a simple method was sought to summarise this asymmetry in the confidence
intervals above and below the estimated mean which serves as the point estimate of 0D . The most simple
method is to simply compute different variances, and so also standard errors using only the negative and
positive residuals for two separate sums of squares, giving two estimate of variance, rather than one, denote
them 0( )V D and 0( )V D .
There is additional uncertainty in the reported spawning biomass estimates from this project due to the
breakdown in the sampled eggs stored in formalin or ethanol. Only the latter could be genetically identified as
Snapper, so additional stages of the estimation were implemented to apply the binomial proportions of Snapper
in the ethanol samples to scale up Snapper egg density from the total egg densities (all species) in the formalin
samples. Uncertainty in this additional stage was omitted in these estimation methods developed under this
project for future stock assessment applications since future samples will all be stored in ethanol for genetic
identification using the genetic egg species identification techniques developed in this project that was found
to be highly effective. The statistical methods developed here, and in Appendices 1 and 3, assume the
application of genetic egg species identification.
References
Casella, G. and Berger, R.L., 2002. Statistical inference (Vol. 2). Pacific Grove, CA: Duxbury.
Rice, J., 1995. Mathematical statistics and data analysis. Pacific Grove, CA: Duxbury.

68
APPENDIX 5: Staff
Dr Mike Steer (Principal Investigator) (SARDI Finfish Sub-program Leader)
Dr Rick McGarvey (Co-Investigator) (SARDI Fisheries Modelling Program Leader)
Dr Andrew Oxley (Co-Investigator) (SARDI Molecular Ecology Sub-program Leader)
Dr Tim Ward (Co-Investigator) (SARDI Marine Environment Program Leader)
Dr Tony Fowler (Co-Investigator) (SARDI Principle Scientist Finfish)
Dr Gretchen Grammer (SARDI Research Scientist)
Dr Sarah Catalano (SARDI Senior Research Services Officer)
Ms Emma Westlake (SARDI Research Services Officer)
Mr Damian Matthews (SARDI Research Services Officer)
Mr Bruce Jackson (SARDI Senior Research Services Officer)
Mrs Janet Matthews (SARDI Research Services Officer)
FV Ngerin crew: Mr Darren Nohlmans, Mr Jason Nichols, Mr Andrew Sellick