fraser of allander institute · 2020-06-17 · fraser of allander institute at a glance n the...
TRANSCRIPT

Vol 41 No 3
Fraser of AllanderInstitute
Economic Commentary

ForewordDeloitte is proud to support the Fraser of Allander Institute Economic Commentary. The Institute’s research demonstrates the overall resilience Scotland has shown in the first half of the year, despite political and economic uncertainty.
Scotland’s rich history of innovation, and its ability to adapt, change, invent and re-invent has helped it weather the storms of uncertainty that have presented themselves over the last few years. The research highlights, with due caution, that our economy continues to recover, albeit at a delicate pace.
If this is to continue, innovation must be at the heart of everything we do. It’s a word which is often heard these days, and there are countless examples of where genuine innovation has already played an important role in the development of our most economically important sectors.
We’ve seen it in financial services, as the sector moves further towards the adoption of technology in its practices. Fintech has the potential to completely transform the Scottish financial landscape, with Edinburgh acting as a UK and worldwide hub. We’ve seen many of these businesses first-hand in our own Digital Studio, where we’re working to help companies of all sizes make better use of digital technologies, turning their innovations into commercial reality.
In energy and resources, centres such as the Oil and Gas Technology Centre (OGTC) have emerged to promote innovation at every level of the supply chain. The centre has brought new technologies to the North East and has played an important role in mitigating against the impact of the sustained low oil price.
It’s also instilled in family businesses, which have made innovation part of their culture. As highlighted in the recent Scottish Family Business Top 100 report, they’re part of the engine room for the Scottish economy, contributing significantly to employment, economic output and to the communities in which they find themselves.
We recently hosted Sir Howard Bernstein, who has been credited with the regeneration of Manchester, at an event in Aberdeen. He spoke about the four pillars for change that will deliver a prosperous future for Aberdeen: growth, people, civic engagement and infrastructure funding.
Across Scotland, we should aim to turn these recommendations into action. The message that resonated following Sir Howard’s speech was that Scotland can, and must do better. Given the recent challenges our economy has faced, we should be proud of Scotland for its resilience, but the ambition must always be to strive to improve.
Scotland remains an attractive place to do business, and it is, without question, an economically rich nation. We need to continue to foster an environment which allows companies to grow, innovate and enter new markets, ensuring Scotland remains a key location for international investment.
The months ahead will see economic policy in Scotland being debated, and it’s important that this discussion isn’t just held within the walls of government and parliament. The participation of the business community in this debate is absolutely critical. As the lifeblood of the Scottish economy, businesses have a pivotal job to do in Scotland’s resurgence.
John Macintosh Tax PartnerDeloitte September 2017
2 Fraser of Allander Institute
For regular analysis on the Scottish economy and public finances please see our blog
www.fraserofallander.org
Economic Commentary
3Foreword
7Outlook and appraisal
6At a glance
5Summary
24Policy Context
Fraser of Allander Institute Contents
22Forecasts
3Economic Commentary, September 2017

The Scottish economy returned to growth in the first 3 months of 2017. The upturn was driven by a bounce back in a number of manufacturing sectors. These same sectors had been some of the hardest hit in recent times, so holding on to such gains will be a success in its own right.
Scottish unemployment is now at its lowest rate since the Labour Force Survey was first collected back in 1992. But newly revised data published last month confirmed that the economy contracted – albeit marginally – in 2016. And growth over the year remains below trend.
The latest leading indicators suggest that the economy continues to recover, albeit at a relatively fragile pace.
The latest Fraser of Allander – Royal Bank of Scotland Scottish Business Monitor published in July showed both a rise in repeat business and in new orders. The latest surveys also show that some sectors – such as tourism – have had a relatively buoyant summer. However, households still appear wary of the economic outlook. Consumer confidence remains negative with Scottish households more concerned about the outlook than those in the UK.
In looking forward, the greatest cloud on the immediate horizon remains the Brexit negotiations.
As we have argued on a number of occasions, we believe that the decision to leave the EU will act as a long-term break on Scotland’s (and UK’s) growth potential. But as with all economic change, there will be winners and losers. Preparation will be key.
Irrespective of the long-term effects, the immediate concern facing many businesses is the potential for the exit process itself to go awry. We are now 15 months on from the referendum with a deal likely to
Summarybe needed in just over a year’s time. But very little progress – if any – seems to have been made on the key elements of the UK’s terms of exit.
‘No deal’ would clearly not be in the interests of either the UK or the EU. The potential risks from such a ‘cliff-edge’ scenario, with companies finding themselves outside the Single Market and Customs Union, would be severe indeed.
Whilst a detailed agreement will not be reached until the end of the process, the longer we wait for evidence that serious progress is being made, the greater the likelihood that companies and investors will start to plan for the worst.
Some things are clearly out of the hands of the UK Government but one area they could provide greater clarity on is over the specific powers they envisage being transferred to the Scottish Parliament post-Brexit. Clarity on this would help enable preparatory discussions to take place between business and the devolved administrations.
On balance our forecasts are based upon the assumption that a constructive deal between the UK and the EU is reached. Should this not occur, outcomes toward the lower end of our forecast range are more likely.
Our forecasts remain broadly the same as they were in June. The GDP data to be published next month will hopefully confirm that the welcome gains in the first three months of 2017 continued into the months that have followed. Overall, we expect growth to pick-up this year and next but to remain fragile.
Fraser of Allander Institute September 2017
4 Fraser of Allander Institute

Fraser of Allander Institute
At a glance n The Scottish economy returned to welcome
growth in the first quarter of 2017, with quarterly growth of +0.7% - significantly faster than UK growth of +0.2%.
n But the upturn comes on the back of a challenging couple of years. Annual growth to the end of March 2017 was around a quarter of its long-term trend.
n At the same time, much of the growth in Q1 2017 appears to have been driven by one off factors and sales to the rest of the UK.
n Whatever the source of such growth, the hope will be that this can act to build momentum through the remainder of the year.
n The labour market continues to hold up remarkably well but productivity and earnings continue to fall.
n Most near-term indicators show growth through the summer but uncertainty still weighs heavily on the outlook.
n Our assessment is broadly the same as it was back in June - we believe that the Scottish economy will grow more quickly this year than last, but that such growth is likely to remain below trend. Our central forecast is for growth of 1.2% in 2017, 1.4% in 2018 and 1.7% in 2019.
n Unemployment will continue to remain low, although a gradual adjustment back to more normal ‘long-term levels’ is likely.
FAI labour market forecast to 2019
Source: Fraser of Allander Institute
Source: Fraser of Allander Institute
FAI forecast Scottish GVA growth (%) by sector, 2017 to 2019
FAI Scottish GVA forecast range 2017 to 2019
Source: Fraser of Allander Institute
2017 2018 2019
Employee jobs 2,448,600 2,481,900 2,523,700
% employee job growth over year
+0.8% +1.4% +1.7%
ILO unemploy-ment 104,400 128,750 134,500
Rate (%) 1 4.0 4.8 4.9
GVA 1.2 1.4 1.7
Production 1.3 1.6 1.9
Construction 0.7 0.9 1.1
Services 1.2 1.4 1.7
-3%
-2%
-1%
0%
1%
2%
3%
4%
2006 2007 2008 2009 2010 2011 2012 2013 2014 2015 2016 2017 2018 2019
Annu
al G
VA G
row
th
Forecast
* Actual data to Q1 2017, central forecast with forecast uncertainty for 2017 – 2019. Uncertainty bands sourced from accuracy of past forecasts at different forecast horizons
Notes:
Absolute numbers are rounded to the nearest 50.
1. Rate calculated as total ILO unemployment divided by total of eco-nomically active population aged 16 and over.
5Economic Commentary, September 2017
Fraser of Allander Institute
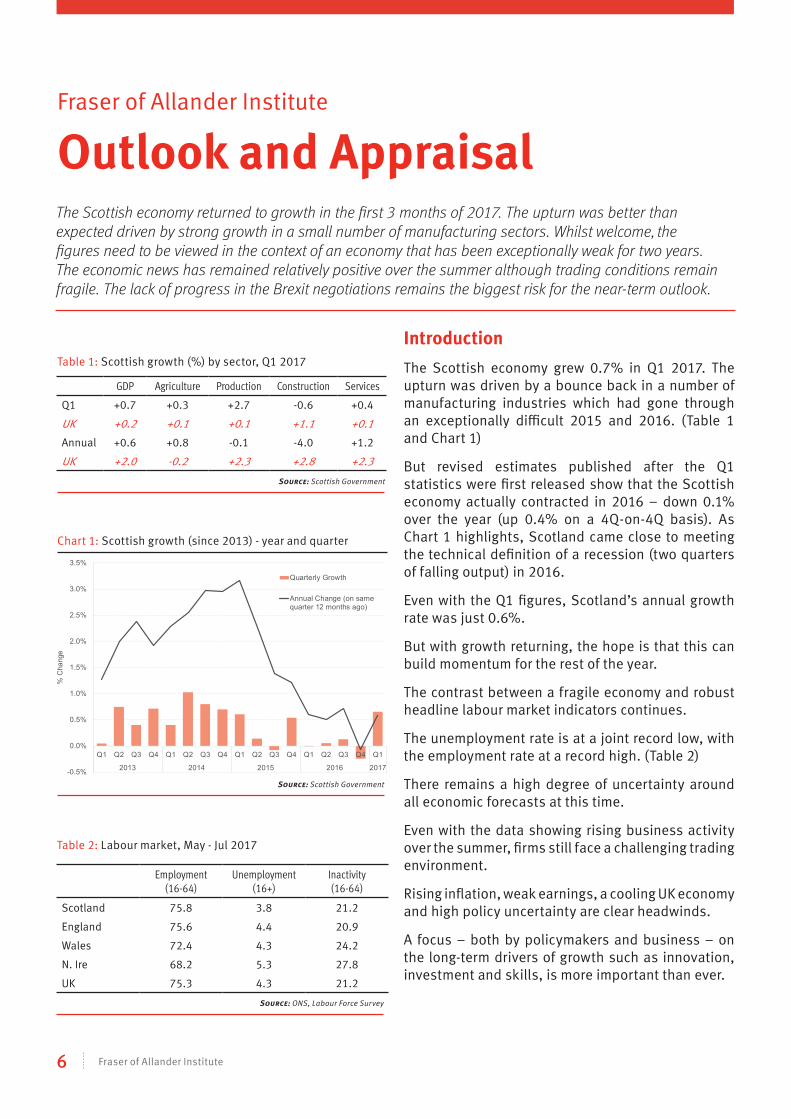
Outlook and Appraisal The Scottish economy returned to growth in the first 3 months of 2017. The upturn was better than expected driven by strong growth in a small number of manufacturing sectors. Whilst welcome, the figures need to be viewed in the context of an economy that has been exceptionally weak for two years. The economic news has remained relatively positive over the summer although trading conditions remain fragile. The lack of progress in the Brexit negotiations remains the biggest risk for the near-term outlook.
Introduction
The Scottish economy grew 0.7% in Q1 2017. The upturn was driven by a bounce back in a number of manufacturing industries which had gone through an exceptionally difficult 2015 and 2016. (Table 1 and Chart 1)
But revised estimates published after the Q1 statistics were first released show that the Scottish economy actually contracted in 2016 – down 0.1% over the year (up 0.4% on a 4Q-on-4Q basis). As Chart 1 highlights, Scotland came close to meeting the technical definition of a recession (two quarters of falling output) in 2016.
Even with the Q1 figures, Scotland’s annual growth rate was just 0.6%.
But with growth returning, the hope is that this can build momentum for the rest of the year.
The contrast between a fragile economy and robust headline labour market indicators continues.
The unemployment rate is at a joint record low, with the employment rate at a record high. (Table 2)
There remains a high degree of uncertainty around all economic forecasts at this time.
Even with the data showing rising business activity over the summer, firms still face a challenging trading environment.
Rising inflation, weak earnings, a cooling UK economy and high policy uncertainty are clear headwinds.
A focus – both by policymakers and business – on the long-term drivers of growth such as innovation, investment and skills, is more important than ever.
Source: Scottish Government
Table 1: Scottish growth (%) by sector, Q1 2017
GDP Agriculture Production Construction Services
Q1 +0.7 +0.3 +2.7 -0.6 +0.4
UK +0.2 +0.1 +0.1 +1.1 +0.1
Annual +0.6 +0.8 -0.1 -4.0 +1.2
UK +2.0 -0.2 +2.3 +2.8 +2.3
Chart 1: Scottish growth (since 2013) - year and quarter
Source: Scottish Government
-0.5%
0.0%
0.5%
1.0%
1.5%
2.0%
2.5%
3.0%
3.5%
Q1 Q2 Q3 Q4 Q1 Q2 Q3 Q4 Q1 Q2 Q3 Q4 Q1 Q2 Q3 Q4 Q1
2013 2014 2015 2016 2017
% C
hang
e
Quarterly Growth
Annual Change (on samequarter 12 months ago)
Table 2: Labour market, May - Jul 2017
Source: ONS, Labour Force Survey
Employment(16-64)
Unemployment(16+)
Inactivity(16-64)
Scotland 75.8 3.8 21.2
England 75.6 4.4 20.9
Wales 72.4 4.3 24.2
N. Ire 68.2 5.3 27.8
UK 75.3 4.3 21.2
6 Fraser of Allander Institute

The global economy
The outlook for the global economy has improved, with growth picking up across most of Scotland’s major international trading partners. (Table 3)
This outlook, alongside greater investor risk appetite, has supported rises in equity and corporate bond prices over the past year.
The IMF’s latest forecast from July has global growth rising from 3.2% in 2016 to nearer 3.5% this year and next – not that far off long-term average rates of growth. (Table 4)
Stronger growth typically supports a more positive outlook for commodity prices.
However, in contrast to most other commodities, oil prices have fallen recently as developments in supply continue to outweigh demand prospects.
Scotland’s oil and gas producers will need to work with a short to medium term oil price of just $50 to $55. (Chart 2)
In terms of Scotland’s two principal export markets – the US and Europe – the outlook is positive.
Quarterly US GDP growth is expected to remain strong, leading to annual growth of above 2%.
Strong jobs market data and an anticipated fiscal stimulus should help sustain robust US growth.
The recovery in Europe continues apace. Consumer and business confidence is now at its highest level in 7 years, with positive signs for exports and investment. (Chart 3)
But whilst European unemployment continues to fall, it remains high with painful structural adjustments still needed.
Even by 2018, Euro Area unemployment is projected to be close to 8%.
The recovery has helped – in part – to support a stronger Euro relative to Sterling.
Sterling is still around 15% below its peak in June 2015 (see Chart 4). In recent days, Sterling has risen on the back of speculation of a rise in interest rates.
Disappointingly, we have yet to see much evidence of this improved global outlook and competitive Sterling boosting UK net trade.
Source: Thomson Reuters Datastream
Chart 3: Market confidence in EU – highest in 7 years
Source: Thomson Reuters Datastream, European Commission
-50
-40
-30
-20
-10
0
10
20
30
2007 2008 2009 2010 2011 2012 2013 2014 2015 2016 2017
Net
bal
ance
of c
onfid
ence
(+v
e &
-ve)
Industry Services Consumer Retail Construction
Table 3: Key export markets: annualised growth (Scottish export share)
Source: IMF & Export Statistics Scotland
2016 2017
H1 H2 Q1 Q2
UK (63%) 1.5 2.3 0.9 1.2
EU (16%) 1.8 2.0 2.0 2.3
US (6%) 1.4 2.3 1.2 2.6
China (1%) 6.7 6.8 6.9 6.9
Table 4: Global outlook - % growth (July revisions)
Source: IMF
2016 2017 2018
World 3.2 3.5 (Hold) 3.6 (Hold)
G7 1.7 2.0 (Hold) 1.9 (-0.1)
Euro Area 1.8 1.9 (+0.2) 1.7 (+0.1)
Emerging/Developing 4.3 4.6 (+0.1) 4.8 (Hold)
World Trade 2.3 4.0 (+0.2) 3.9 (Hold)
Chart 2: Commodity prices recovering but outlook for oil showing no sign of re-bounding
0
20
40
60
80
100
120
Jan 14 Jul 14 Jan 15 Jul 15 Jan 16 Jul 16 Jan 17 Jul 17
Inde
x (2
014=
100)
Agricultural prices Industrial metals prices Oil price
7Economic Commentary, September 2017
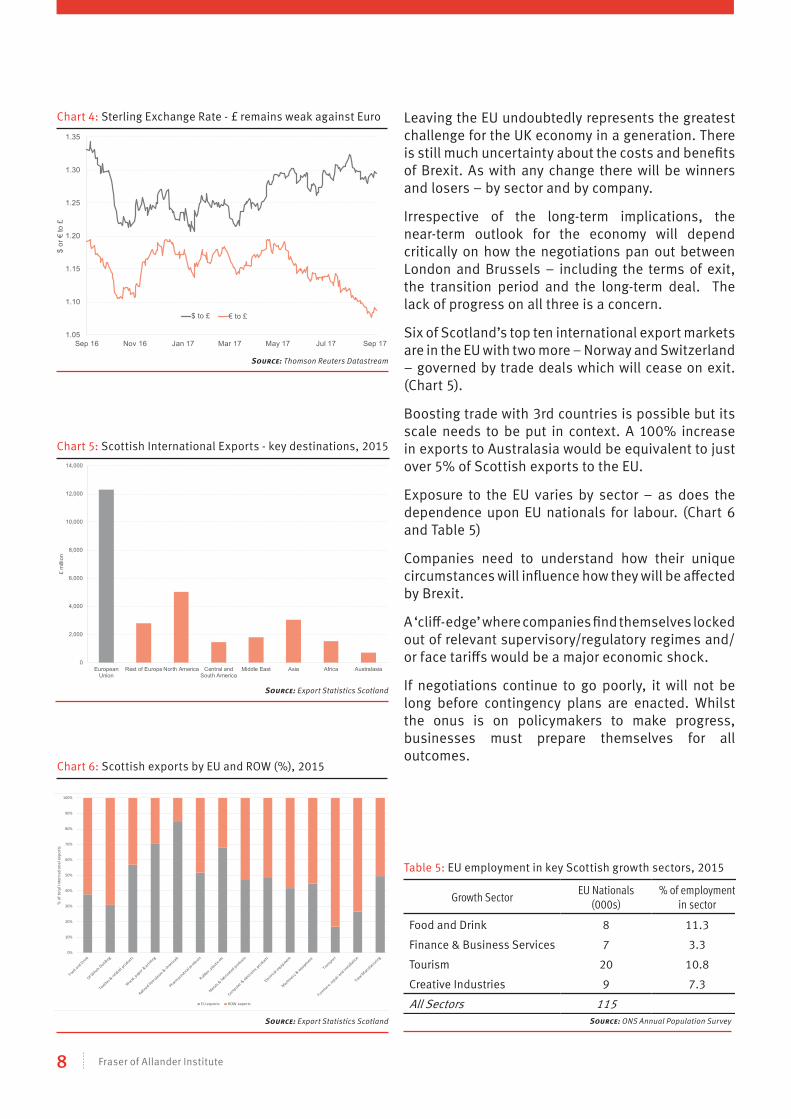
Leaving the EU undoubtedly represents the greatest challenge for the UK economy in a generation. There is still much uncertainty about the costs and benefits of Brexit. As with any change there will be winners and losers – by sector and by company.
Irrespective of the long-term implications, the near-term outlook for the economy will depend critically on how the negotiations pan out between London and Brussels – including the terms of exit, the transition period and the long-term deal. The lack of progress on all three is a concern.
Six of Scotland’s top ten international export markets are in the EU with two more – Norway and Switzerland – governed by trade deals which will cease on exit. (Chart 5).
Boosting trade with 3rd countries is possible but its scale needs to be put in context. A 100% increase in exports to Australasia would be equivalent to just over 5% of Scottish exports to the EU.
Exposure to the EU varies by sector – as does the dependence upon EU nationals for labour. (Chart 6 and Table 5)
Companies need to understand how their unique circumstances will influence how they will be affected by Brexit.
A ‘cliff-edge’ where companies find themselves locked out of relevant supervisory/regulatory regimes and/or face tariffs would be a major economic shock.
If negotiations continue to go poorly, it will not be long before contingency plans are enacted. Whilst the onus is on policymakers to make progress, businesses must prepare themselves for all outcomes.
Chart 4: Sterling Exchange Rate - £ remains weak against Euro
Source: Thomson Reuters Datastream
1.05
1.10
1.15
1.20
1.25
1.30
1.35
Sep 16 Nov 16 Jan 17 Mar 17 May 17 Jul 17 Sep 17
$ or
€ to
£
$ to £ € to £
Chart 5: Scottish International Exports - key destinations, 2015
Source: Export Statistics Scotland
Chart 6: Scottish exports by EU and ROW (%), 2015
Source: Export Statistics Scotland
Table 5: EU employment in key Scottish growth sectors, 2015
Source: ONS Annual Population Survey
Growth SectorEU Nationals
(000s)% of employment
in sector
Food and Drink 8 11.3
Finance & Business Services 7 3.3
Tourism 20 10.8
Creative Industries 9 7.3
All Sectors 115
0
2,000
4,000
6,000
8,000
10,000
12,000
14,000
EuropeanUnion
Rest of Europe North America Central andSouth America
Middle East Asia Africa Australasia
£ m
illion
0%
10%
20%
30%
40%
50%
60%
70%
80%
90%
100%
% o
f tot
al in
tern
atio
nal e
xpor
ts
EU exports ROW exports
8 Fraser of Allander Institute

The UK economyUK economic growth slowed significantly during the 1st half of 2017.
Growth had been strong in 2016, confounding expectations that post-referendum uncertainty would impact on growth. Indeed, growth quickened in the 2nd half of 2016. (Chart 7)
But as we have outlined in earlier Economic Commentaries, underneath the headline figures there have always been concerns about the nature of that growth – in particular, the fact that it was propped up by a boom in consumption supported by increased borrowing and reduced savings.
This could not last.
Household consumption grew by just 0.1% in Q2 2017 – the weakest rate of growth since late 2014. The slowdown is impacted by two further factors. (Chart 8)
Firstly, the spike in inflation has had a significant impact on real earnings. (Chart 9)
Secondly, driven, in part, by uncertainty over the economic outlook, households appear to be holding off on discretionary spending.
Spending on durable goods (which tend to slow during periods of heightened uncertainty) has fallen sharply – and is now growing at its slowest rate since 2013. (Chart 10)
Chart 7: Slowing UK economic growth during 1st half of 2017
Source: Thomson Reuters Datastream, ONS
0
0.5
1
1.5
2
2.5
3
3.5
4
0
0.1
0.2
0.3
0.4
0.5
0.6
0.7
0.8
Q1 Q2 Q3 Q4 Q1 Q2 Q3 Q4 Q1 Q2
2015 2016 2017
Annu
al c
hang
e (%
)
Qua
rterly
cha
nge
(%)
Quarterly Growth (RHS) Annual Growth (LHS)
Chart 8: Recent strong growth in household consumption falling sharply as inflation rises
Source: Thomson Reuters Datastream, ONS
-3.0
-2.0
-1.0
0.0
1.0
2.0
3.0
4.0
5.0
2007 2008 2009 2010 2011 2012 2013 2014 2015 2016 2017
Mon
thly
Ear
ning
s (%
cha
nge
year
on
year
)
Nominal Earnings Real Earnings
Chart 9: Falling UK regular average weekly earnings growth: 3-month on a year ago
Source: Thomson Reuters Datastream, ONS
Chart 10: Household spending by product type: confidence appears to be acting as a break on durable goods
Source: Thomson Reuters Datastream, ONS
-8
-6
-4
-2
0
2
4
6
8
10
12
2010 2011 2012 2013 2014 2015 2016 2017
% c
hang
e on
yea
r ago
Durable goods Semi-durable goods Non-durable goods
0
0.5
1
1.5
2
2.5
3
0.0
0.2
0.4
0.6
0.8
1.0
1.2
Q1 Q2 Q3 Q4 Q1 Q2 Q3 Q4 Q1 Q2
2015 2016 2017
Qua
rterly
Cha
nge
(% o
n 12
mon
ths
ago)
Qua
rterly
Cha
nge
(%)
Household Consumption (LHS) CPI Inflation (RHS)
9Economic Commentary, September 2017

With government spending still highly constrained, the hope was that exports and business investment would take up the slack from weaker growth in household spending.
But we have yet to see much evidence of this.
The UK’s trade deficit widened by a further £400 million in July (Chart 11).
Despite Sterling falling significantly, export growth has been sluggish (Chart 12).
Some of this might reflect temporary factors – e.g. firms operating on fixed long-term contracts meaning that it could take time for the lower value of Sterling to pass through to competiveness.
But some of the explanation is undoubtedly because many exporters rely on imports in their own production processes and business models. So for them, a Sterling depreciation is a zero sum game.
As Chart 13 highlights, business investment has been flat-lining for the best part of 18 months.
There was a modest pick-up of investment in the first three months of the year but this was followed by flat growth over the three months to June.
On the one hand, the UK’s relatively robust growth in recent times – it had been one of the fastest growing economies since 2014 in the G7 – should have created positive conditions for investment.
But uncertainty over Brexit – coupled with rising costs in securing international finance – seems to be putting a break on firms investing at the current time.
For example, two fifths of respondents to a recent CBI survey reported that Brexit had negatively affected business investment decisions.
And the Bank of England’s network of agents also found evidence that – whilst investment intentions have improved over the summer – some larger firms, and those more exposed to a potential change in trading arrangements with EU, have been delaying medium to long term investments.
Chart 11: UK Net trade balance remains weak - with little sign of a boost from the low value of sterling
Source: Thomson Reuters Datastream, ONS
Chart 12: Deprecation in Sterling but weak growth in exports
Source: Thomson Reuters Datastream, ONS
90
95
100
105
110
115
120
Q1 Q2 Q3 Q4 Q1 Q2 Q3 Q4 Q1 Q2 Q3 Q4 Q1 Q2 Q3 Q4 Q1 Q2
2013 2014 2015 2016 2017
Inde
x 20
13 Q
1 =
100
Goods exports Sterling effective exchange rate Services exports
Chart 13: Weak business investment: possible drag on long-term economic growth
Source: Thomson Reuters Datastream, ONS
-20,000
-15,000
-10,000
-5,000
-
5,000
10,000
1997 2002 2007 2012 2017
UK
Net
Tra
de -
chai
ned
volu
me
mea
sure
(£ m
illion
)
96
98
100
102
104
106
108
110
112
114
116
-4%
-2%
0%
2%
4%
6%
8%
10%
12%
14%
16%
2013 2014 2015 2016 2017
Q1
2013
Inde
x =
100
Ann
ual G
row
th (
%)
Annual change in business investment (Q on Q) (RHS)
Business Investment 2013 Q1 = 100 (LHS)
10 Fraser of Allander Institute

The UK economic outlookMost forecasters predict that the UK economy will grow at just over 1.5% this year. Slower than in 2016 and below trend. (Chart 14)
The OBR had expected growth to slow slightly during the 2nd half of 2017 so, given the data published for the year thus far, the UK will do well to meet current forecasts.
That being said, most near-term indicators of business activity – despite the uncertainty – continue to show relatively healthy trading conditions.
The IHS Markit PMI remains strong (above the cut-off of 50 which marks the boundary between expansion and contraction). Conditions appear to be challenging in construction but manufacturing is close to a three year high. (Chart 15).
Business sentiment remains – on the whole – weak but positive. The CBI’s measure of business confidence was positive for the third quarter in a row this summer.
But consumer spending is expected to slow further as inflation continues to suppress real earnings and households reign back on some of the debt built up in recent times. (Chart 16)
In August, the Bank of England’s team of agents found evidence of consumers becoming increasingly cautious about their spending and trading down to cheaper products or brands.
Inflation is now 2.9% and well above the Bank’s target of 2%. See Chart 17 for international comparisons of inflation.
This is well above earnings growth. Already we are beginning to see the political implications of this, with a push toward lifting the public sector pay cap.
Rising inflation is likely to make it particularly challenging for households exposed to rising food and fuel prices. It will also make it much more challenging for families reliant on working age benefits which continue to be frozen in cash terms.
Chart 14: Evolution of UK forecasts for 2017
Source: HM Treasury
Chart 15: PMIs for UK remains positive – although construction weaker than services or manufacturing
Source: IHS Markit
Chart 16: UK consumer credit growth by source since 2013
Source: Bank of England
-2
0
2
4
6
8
10
12
2013 2014 2015 2016 2017
% g
row
th &
per
cent
age
poin
ts
Credit card
Other (non-credit card)
Dealership car finance
Consumer credit growth (per cent)
-2
-1.5
-1
-0.5
0
0.5
1
1.5
2
2.5
3
3.5
Jun Jul Aug Sep Oct Nov Dec Jan Feb Mar Apr Jun Jul Aug
2016 2017
Annu
al G
row
th (
%)
Average UK Forecast
Highest and lowest UK Forecast
40
42
44
46
48
50
52
54
56
58
60
2015 2016 2017
Bal
ance
of R
espo
nden
ts (
>50
= ex
pans
ion)
Services Manufacturing Construction
11Economic Commentary, September 2017
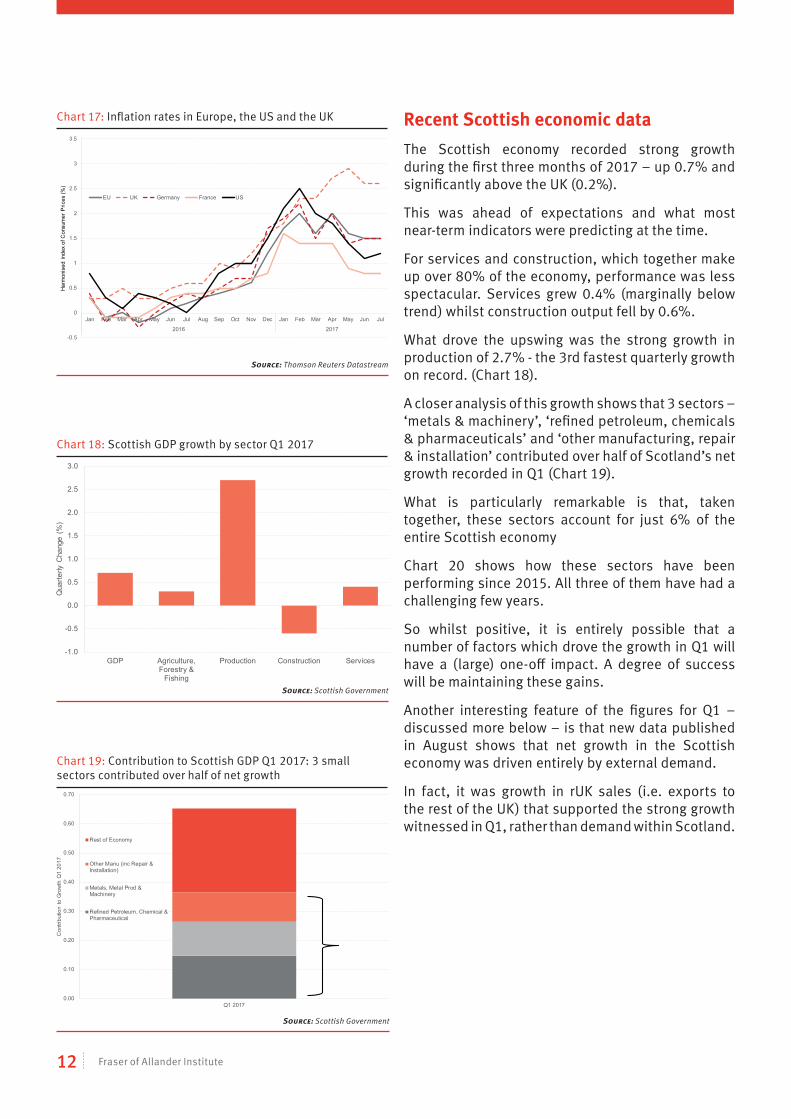
Recent Scottish economic dataThe Scottish economy recorded strong growth during the first three months of 2017 – up 0.7% and significantly above the UK (0.2%).
This was ahead of expectations and what most near-term indicators were predicting at the time.
For services and construction, which together make up over 80% of the economy, performance was less spectacular. Services grew 0.4% (marginally below trend) whilst construction output fell by 0.6%.
What drove the upswing was the strong growth in production of 2.7% - the 3rd fastest quarterly growth on record. (Chart 18).
A closer analysis of this growth shows that 3 sectors – ‘metals & machinery’, ‘refined petroleum, chemicals & pharmaceuticals’ and ‘other manufacturing, repair & installation’ contributed over half of Scotland’s net growth recorded in Q1 (Chart 19).
What is particularly remarkable is that, taken together, these sectors account for just 6% of the entire Scottish economy
Chart 20 shows how these sectors have been performing since 2015. All three of them have had a challenging few years.
So whilst positive, it is entirely possible that a number of factors which drove the growth in Q1 will have a (large) one-off impact. A degree of success will be maintaining these gains.
Another interesting feature of the figures for Q1 – discussed more below – is that new data published in August shows that net growth in the Scottish economy was driven entirely by external demand.
In fact, it was growth in rUK sales (i.e. exports to the rest of the UK) that supported the strong growth witnessed in Q1, rather than demand within Scotland.
Chart 17: Inflation rates in Europe, the US and the UK
Source: Thomson Reuters Datastream
Chart 18: Scottish GDP growth by sector Q1 2017
Source: Scottish Government
-1.0
-0.5
0.0
0.5
1.0
1.5
2.0
2.5
3.0
GDP Agriculture,Forestry &
Fishing
Production Construction Services
Qua
rterly
Cha
nge
(%)
Chart 19: Contribution to Scottish GDP Q1 2017: 3 small sectors contributed over half of net growth
Source: Scottish Government
0.00
0.10
0.20
0.30
0.40
0.50
0.60
0.70
Q1 2017
Con
tribu
tion
to G
row
th Q
1 20
17
Rest of Economy
Other Manu (inc Repair &Installation)
Metals, Metal Prod &Machinery
Refined Petroleum, Chemical &Pharmaceutical
-0.5
0
0.5
1
1.5
2
2.5
3
3.5
Jan Feb Mar Apr May Jun Jul Aug Sep Oct Nov Dec Jan Feb Mar Apr May Jun Jul
2016 2017
Har
mon
ised
inde
x of
Con
sum
er P
rices
(%)
EU UK Germany France US
12 Fraser of Allander Institute

Chart 21: Scottish & UK GDP per head: Q1 2015 to Q1 2017
Source: Scottish Government
99
100
101
102
103
Q1 Q2 Q3 Q4 Q1 Q2 Q3 Q4 Q1
2015 2016 2017
GD
P p
er c
apita
gro
wth
(20
15 Q
1 =
100)
Scotland UK
Therefore, whilst welcome, the recent figures should not disguise the relative fragility in the Scottish economy that has been persistent since the end of 2014.
Even with Q1’s results, the Scottish economy grew by just 0.6% (and 0.4% on a 4Q-on 4Q basis) for the year as a whole. This is below long-term trend and UK growth of 2.0% for the same period.
When measured in terms of output per head, a similar story emerges (Chart 21).
A divergence of this scale is deemed to be sufficient to trigger the emergency borrowing powers in the Fiscal Framework to cope with ‘asymmetric shocks’. This is defined as when Scottish growth is less than 1% and more than 1 percentage point smaller than the UK as a whole.
Indeed, output in the Scottish economy actually contracted in 2016 – falling 0.1% over the year (driven in part by the closure of the Longannet power station).
And growth over the past six months has averaged just 0.2%.
Of course, it is also entirely possible that the figures for 2016 and Q1 2017 may be revised in the future.
Economic statistics are always subject to revision, as new data becomes available and models and methodologies are updated.
Interestingly, there have been major revisions over the years to the scale of the recession during the financial crisis – with the downturn now much less severe than at first thought.
Chart 22 shows the scale of the recession as estimated in April 2012, April 2014 & April 2016, and finally today (Aug 2017).
In 2012, the peak to trough decline in output (between 2008 and 2009) was estimated at 5.8%. Now the same recession is estimated to have been just 3.9% - about 1/3 less.
Chart 22: Scotland during the Great Recession – perhaps not as great as first thought!
Source: Scottish Government
92
94
96
98
100
102
104
106
108
Q1 Q2 Q3 Q4 Q1 Q2 Q3 Q4 Q1 Q2 Q3 Q4 Q1 Q2 Q3 Q4 Q1 Q2 Q3 Q4 Q1 Q2 Q3 Q4
2006 2007 2008 2009 2010 2011
2006
= 1
00
Aug_17Apr_16Apr_14Apr_12
Chart 20: Performance of 3 sectors which drove Scottish growth in Q1 since Q1 2015
Source: Scottish Government
80
85
90
95
100
105
Q1 Q2 Q3 Q4 Q1 Q2 Q3 Q4 Q1
2015 2016 2017
Out
put
by s
ecto
r (Q
1 20
15 =
100
)
ManufacturingRefined Petroleum, Chemical & PharmaceuticalMetals, Metal Prod & MachineryOther Manu (inc Repair & Installation)
13Economic Commentary, September 2017

Drivers of growthOne way of looking at how well-balanced growth is in the economy is to look at ‘domestic’ demand – i.e. from Scotland – compared with external demand.
Sustainable growth will show up, not only as steady growth across all sectors, but also shared growth in the sources of demand.
In ‘net terms’ - the domestic market did not grow at all during Q1 2017. Growth in consumption and government spending was offset by a fall in capital investment. (Chart 23)
It was trade that boosted growth. And within that, UK net exports grew 3.0% compared to 0.3% growth in international exports.
That being said, Scotland’s overall trade deficit shows no sign of going away. (Chart 24)
All this adds to the note of caution that is needed when viewing the results for Q1. In short, growth was driven by a small number of sectors bouncing back from a tough couple of years; and, it was demand in the rest of the UK – rather than in Scotland – that propped up the headline results.
The hope however, is that this bounce back will act as a catalyst for momentum to build across the wider economy through the remainder of 2017.
Similar to the UK, household spending had been the dominant driver of growth in Scotland in recent times.
However, the pace of consumption growth has slowed. Q1 saw the smallest contribution to overall growth since 2014. (Chart 25).
One area of concern continues to be business investment. Over the year, investment in Scotland was down 7.6% (falling 3.0% in Q1).
Business investment has been on a downward trend since 2015 as a share of total investment in the economy (Chart 26). Whatever the explanation for this, with investment key to long-term growth it needs to turnaround soon.
Chart 23: Drivers of growth Q1 2017 - weak domestic demand but strong export growth to the UK and ROW
Source: Scottish Government
-2.0%
-1.5%
-1.0%
-0.5%
0.0%
0.5%
1.0%
1.5%
2.0%
2.5%
Q1 Q2 Q3 Q4 Q1 Q2 Q3 Q4 Q1 Q2 Q3 Q4 Q1
2014 2015 2016 2017
Con
tribu
tion
to G
DP
Gro
wth
(%
poi
nt)
Households General GovernmentGross Fixed Capital Formation Net TradeNominal GDP Growth
Chart 24: Q1 growth in exports does not eliminate Scotland’s trade deficit
Source: Scottish Government
Chart 25: Contribution of expenditure components to growth in GDP – since 2014
Source: Scottish Government
-0.6%
-0.4%
-0.2%
0.0%
0.2%
0.4%
0.6%
0.8%
1.0%
DomesticDemand
HouseholdConsumption
Government Gross FixedCapital
Formation
rUK Net Trade ROW Net Trade GDP
Con
tribu
tion
to Q
1 G
DP
grow
th (
% p
oint
)
Domestic Demand External Demand
-4,000
-3,500
-3,000
-2,500
-2,000
-1,500
-1,000
-500
0
2007 2008 2009 2010 2011 2012 2013 2014 2015 2016 2017
£ m
illion
Net Trade
14 Fraser of Allander Institute

Performance by SectorAs highlighted above, manufacturing bounced back strongly in Q1 2017. That being said, activity is still significantly lower than it was just a couple of years ago.
Construction activity continues to decline. The sector has been in recession since 2016. But as Chart 27 highlights, this appears to be a return to more normal levels of infrastructure demand. Infrastructure output peaked in 2015 at the time a number of major projects were being delivered.
In services, some key ‘professional’ sectors – finance & insurance, real estate, transport & communication, and the professional, scientific & administrative support sector – have performed well in recent times. (Chart 28)
All four – which together make-up 35% of the Scottish economy – have grown over the most recent quarter and the year.
The retail and wholesale, accommodation and food industries have in contrast continued to face a challenging period. Retail and wholesale was down 1.2% over the year whilst accommodation and food services fell 2.2%.
Similar to the wider Scottish economy, house prices have been growing but at a slow pace.
According to Nationwide, over the year, house prices grew by 1.8% in Scotland compared to 2.8% in the UK. But as Chart 29 highlights prices in Scotland actually fell back a little in Q2.
Chart 26: Falling business investment as a share of total investment in the economy - since 2008
Source: Scottish Government
0
200
400
600
800
1,000
1,200
2011 2012 2013 2014 2015 2016
£ m
illion
Housing Infrastructure Other public Private industrial Private commercial
Chart 27: Construction output (value): growth in infrastructure easing off
Source: ONS
Chart 28: Robust growth in professional and financial service related sectors in Scotland in recent quarters
Source: Nationwide
-1.5%
-1.0%
-0.5%
0.0%
0.5%
1.0%
1.5%
2.0%
97
98
99
100
101
102
103
104
Q1 Q2 Q3 Q4 Q1 Q2 Q3 Q4 Q1 Q2 Q3 Q4 Q1 Q2
2014 2015 2016 2017
% c
hang
e on
pre
viou
s qu
arte
r
Seas
onal
ly A
djus
ted
Inde
x: 2
014
Q1
= 10
0
Quarterly Growth (RHS) Seasonally Adj. Index (LHS)
Chart 29: House prices in Scotland
Source: Scottish Government
0%
10%
20%
30%
40%
50%
60%
2008 2009 2010 2011 2012 2013 2014 2015 2016 2017
% o
f tot
al G
ross
Fix
ed C
apita
l For
mat
ion
Business Investment General Government Dwellings Costs of ownership transfer on non-produced assets
90
95
100
105
110
115
Q1 Q2 Q3 Q4 Q1 Q2 Q3 Q4 Q1 Q2 Q3 Q4 Q1
2014 2015 2016 2017
Inde
x 20
14 Q
1 =
100
Transport, Information & CommunicationFinancial & Insurance ActivitiesReal Estate ActivitiesProfessional, Scientific, Administrative & Support Services
15Economic Commentary, September 2017

The Scottish labour marketWhatever the challenges in the wider economy, Scotland’s headline labour market figures remain –at first glance – strong.
The number of people employed in Scotland is now at the highest rate since the Labour Force Survey started to be collected on a consistent basis in 1992.
Scotland’s unemployment rate of just 3.8% is a joint record low.
Compared to the UK, Scotland now has a higher employment rate and a lower unemployment rate. (Table 6)
The unemployment rate in Scotland has fallen on a broadly consistent basis over the past 12 months (Chart 30). And the increase in employment in the past year has been substantial, with the number of people in work rising by 44,000.
As Chart 31 shows, this has been driven, in part, by an increase in self-employment. While the self-employment series can be volatile, we are clearly seeing something of a trend. Indeed, self employment is up 20% over the last decade.
Self-employment can encompass a wide range of activities from driving a taxi or being a courier driver, through to being an accountant or lawyer.
Partly as a result of technological innovation, the self-employed are now a much more diverse group.
For some, self-employment can be associated with better labour market outcomes, more flexibility in work patterns and higher wages. But for others it may come with less stable or rewarding opportunities and fewer employment protections.
The developments in self-employment are part of a wider trend toward non-standard work patterns.
Since the financial crisis, there has been a rise in part-time employment of around 10%.
Table 6: Scottish and UK labour market, May-Jul 2017
Source: ONS, Labour Force Survey (LFS)
Chart 30: Scottish employment & unemployment Rate: since 2008
Source: ONS, LFS
Chart 31: Scottish employment & self-employment: since 2008
Source: ONS, LFS
Employment Unemployment Inactivity
(16-64) (16+) (16-64)
Scotland 75.8% 3.8% 21.2%
Quarterly Change +1.8 -0.2 -1.6
Annual Change +1.8 -0.9 -1.0
UK 75.3% 4.3% 21.2%
Quarterly Change +0.5 -0.2 -0.3
Annual Change +0.8 -0.5 -0.3
66
67
68
69
70
71
72
73
74
75
76
77
0
1
2
3
4
5
6
7
8
9
10
2008 2009 2010 2011 2012 2013 2014 2015 2016 2017
Em
ploy
men
t R
ate
(16-
64)
Une
mpl
oym
ent
Rat
e (1
6+)
Unemployment Rate (16+)
Employment Rate (16-64)
250,000
260,000
270,000
280,000
290,000
300,000
310,000
320,000
330,000
340,000
2,100,000
2,200,000
2,300,000
2,400,000
2,500,000
2,600,000
2,700,000
2008 2009 2010 2011 2012 2013 2014 2015 2016 2017
Self
empl
oyed
Empl
oyee
s
Total employment (LHS) Employees (RHS) Self employed (LHS)
16 Fraser of Allander Institute
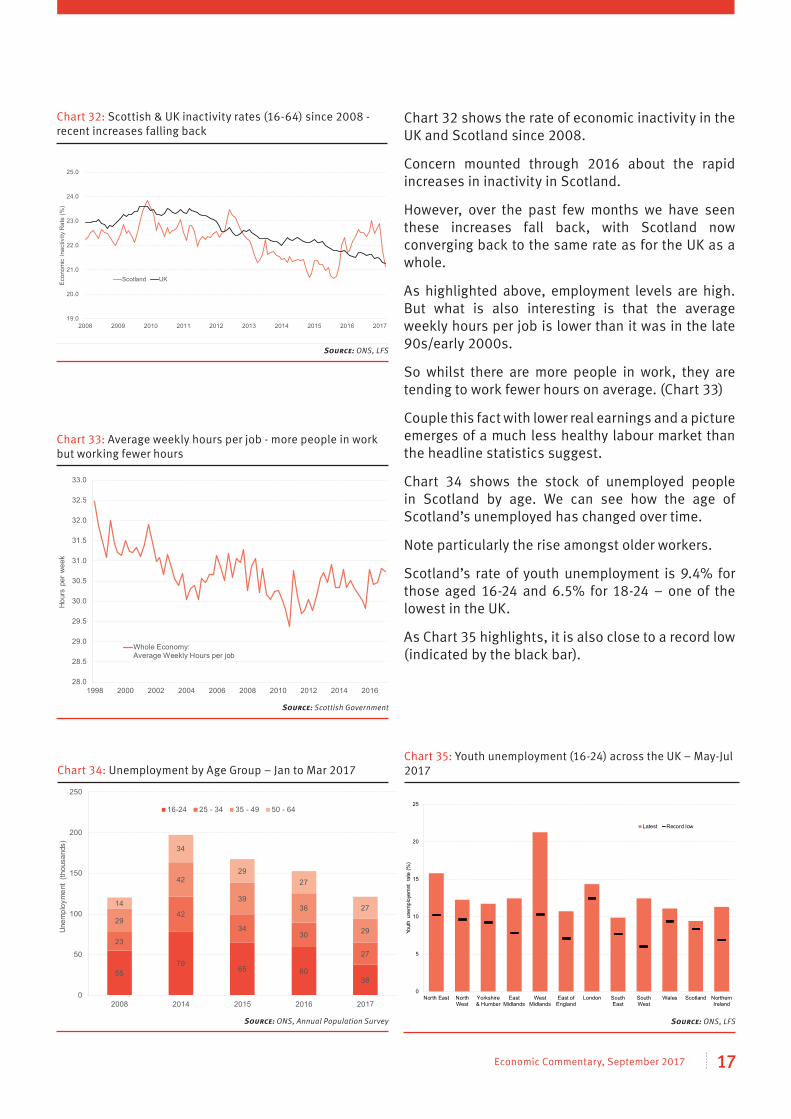
Chart 32 shows the rate of economic inactivity in the UK and Scotland since 2008.
Concern mounted through 2016 about the rapid increases in inactivity in Scotland.
However, over the past few months we have seen these increases fall back, with Scotland now converging back to the same rate as for the UK as a whole.
As highlighted above, employment levels are high. But what is also interesting is that the average weekly hours per job is lower than it was in the late 90s/early 2000s.
So whilst there are more people in work, they are tending to work fewer hours on average. (Chart 33)
Couple this fact with lower real earnings and a picture emerges of a much less healthy labour market than the headline statistics suggest.
Chart 34 shows the stock of unemployed people in Scotland by age. We can see how the age of Scotland’s unemployed has changed over time.
Note particularly the rise amongst older workers.
Scotland’s rate of youth unemployment is 9.4% for those aged 16-24 and 6.5% for 18-24 – one of the lowest in the UK.
As Chart 35 highlights, it is also close to a record low (indicated by the black bar).
Chart 32: Scottish & UK inactivity rates (16-64) since 2008 - recent increases falling back
Source: ONS, LFS
Chart 33: Average weekly hours per job - more people in work but working fewer hours
Source: Scottish Government
28.0
28.5
29.0
29.5
30.0
30.5
31.0
31.5
32.0
32.5
33.0
1998 2000 2002 2004 2006 2008 2010 2012 2014 2016
Hour
s pe
r wee
k
Whole Economy:Average Weekly Hours per job
Chart 34: Unemployment by Age Group – Jan to Mar 2017
Source: ONS, Annual Population Survey
5579
65 6038
23
42
3430
27
29
42
3936
29
14
34
2927
27
0
50
100
150
200
250
2008 2014 2015 2016 2017
Unem
ploy
men
t (th
ousa
nds)
16-24 25 - 34 35 - 49 50 - 64
Chart 35: Youth unemployment (16-24) across the UK – May-Jul 2017
Source: ONS, LFS
0
5
10
15
20
25
North East NorthWest
Yorkshire& Humber
EastMidlands
WestMidlands
East ofEngland
London SouthEast
SouthWest
Wales Scotland NorthernIreland
Yout
h un
empl
oyem
nt r
ate
(%)
Latest Record low
19.0
20.0
21.0
22.0
23.0
24.0
25.0
2008 2009 2010 2011 2012 2013 2014 2015 2016 2017
Eco
nom
ic I
nact
ivity
Rat
e (%
)
Scotland UK
17Economic Commentary, September 2017

As we have outlined before, in recent years Scotland has closed the productivity gap with the UK – both in terms of output per hour and output per job. (Chart 36)
But the UK’s record is not one to be proud of. UK productivity lags behind our key competitors – with UK productivity 15% below the G7 average.
And in recent months, Scottish productivity has slipped back again – with output per hour falling 1.5% over the year.
This could reflect a number of factors including the creation of low-paid jobs and low levels of business investment.
Whatever the cause, stimulating productivity is crucial not only for growth prospects but also household income.
Boosting manufacturing activity will be key to this. As Chart 37 highlights, average levels of productivity tend to be higher than in other sectors. This is one of the reasons why policymakers are so keen to support growth in the sector.
OutlookThe emerging economic data over the summer has been – in the main – relatively positive for Scotland.
For the second quarter in a row, the FAI-Royal Bank of Scotland Business Monitor for Q2 2017 showed an increase in the net balance of firms reporting both repeat business and new business volumes improving. (Chart 38).
Whilst the overall net balance is low by historic standards, it is the first time since mid-2015 that both key indicators have been positive.
The Bank of Scotland PMI was 52.2 during August (where >50 marks a balance of firms reporting an expansion in their activities) – just short of a three year high.
The Scottish figure is still lagging the UK average of 54.0 but as Chart 39 highlights, Scotland is now back in the pack of UK regions and nations after being the weakest region for a number of months.
Chart 36: Output per hour and output per job : since 2008
Source: Scottish Government
94
96
98
100
102
104
106
108
110
112
2008 2009 2010 2011 2012 2013 2014 2015 2016 2017
2008
= 1
00
Output per hour Output per job
Chart 37: Productivity (output per job) by sector, 2016
Source: FAI/RBS Business Monitor
-20
-10
0
10
20
30
Q1 Q2 Q3 Q4 Q1 Q2 Q3 Q4 Q1 Q2 Q3 Q4 Q1 Q2
2014 2015 2016 2017
Net B
alan
ce (>
0 P
ositi
ve n
ew/re
peat
bus
ines
)
Vol of repeat business
Vol of new business
Chart 38: Scottish Business Monitor suggests growth continuing in Q2
Source: Scottish Government
0
10,000
20,000
30,000
40,000
50,000
60,000
70,000
80,000
Whole economy Non-Manf prod Manufacturing Construction Services
£ pe
r job
18 Fraser of Allander Institute

In contrast to the slightly more positive sentiment within the business community, levels of consumer confidence have remained weak.
The GfK Consumer Confidence Index (where 0 = balance) was -16 in August.
This was up on July’s 12 month low of -22 but clearly it still remains very negative – and not far off the low witnessed in the immediate aftermath of the EU referendum.
The UK index has itself weakened over the summer, but remains ‘better’ than for Scotland at -10. (Chart 40)
One of the apparent reasons for the decline in consumer confidence undoubtedly relates to how households are viewing the outlook for inflation.
The proportion of consumers who believe that prices will “increase faster” over the next 12 months – either “by a lot” or “by a little”- makes up the majority view. (Chart 41)
It is no surprise therefore that many believe that their financial situation (and that of the economy) will deteriorate over the coming months.
With inflation expected to peak toward the tail end of this year, the outlook for consumers should hopefully start to become more positive in the months ahead, helping to boost growth.
Business surveys also reveal some interesting information about how sectors are performing.
The Fraser of Allander Institute helps support the publication of the Scottish Chambers of Commerce Quarterly Economic Indicator which monitors – alongside a number of other factors – levels of business optimism in construction, retail, tourism, manufacturing, and financial and business services.
As Chart 42 highlights, the level of optimism across most sectors is higher than it was back in 2016.
Optimism in the tourism sector leads the way and this sits with wider reports of the sector having a strong 2017.
Optimism in the construction sector is also positive, which offers some hope to a sector that has been under pressure in recent times.
Chart 39: Scottish PMI – bounce back over the summer but trend of lagging most other parts of UK continues
Source: Lloyds PMI
Chart 40: Consumer confidence remains negative – and worse than for UK as a whole ( >0 = more optimistic)
Source: GfK
-25
-20
-15
-10
-5
0
5
10
Aug
Sep
Oct
Nov
Dec Jan
Feb
Mar
Apr
May Jun
Jul
Aug
Sep
Oct
Nov
Dec Jan
Feb
Mar
Apr
May Jun
Jul
Aug
2015 2016 2017
Net B
alan
ce
Scotland UK
Chart 41: Household expectations for prices over the next 12 months
Source: GfK
0
10
20
30
40
50
60
May Jun Jul Aug Sep Oct Nov Dec Jan Feb Mar Apr May Jun Jul Aug
2016 2017
% o
f res
pond
ents
Increase more rapidly Increae at same rate Increase at slower rateStay about the same Fall
40
45
50
55
60
65
2015 2016 2017
Pur
chas
ing
Man
ager
s In
dex
(>50
= E
xpan
sion
)
Scotland Other parts of UK
19Economic Commentary, September 2017

The one downside continues to be in retail, where despite the official retail sales index showing growth in Q2 (Chart 43), overall optimism remains very weak.
One trend that is emerging quite strongly in the data is a rise in recruitment difficulties. (Chart 44)
In construction and tourism for example, around 60% of businesses in the latest Scottish Chambers of Commerce survey are finding recruitment difficulties an issue.
At the same time, there is also evidence that costs are beginning to have an impact on many firms.
As mentioned above, the FAI/RBS Scottish Business Monitor is reporting growing business orders with tourism and financial services doing particularly well and exports growing.
But the weak pound is also putting pressure on businesses through rising costs. (Chart 45)
56% of all businesses stated that costs rose over the last quarter. Just one in 16 (6%) reported a fall.
Chart 42: Optimism positive in most sectors - with tourism leading the way - but confidence remains weak in retail
Source: Scottish Chambers of Commerce
Chart 43: Rise in retail sales index – Q2 2017
Source: Scottish Government
Chart 44: Recruitment difficulties rising across sectors
Source: Scottish Chambers of Commerce
Chart 45: RBS/FAI Business Monitor trends in costs by sector
Source: FAI / RBS Business Monitor
-30
-20
-10
0
10
20
30
Q1 Q2 Q3 Q4 Q1 Q2
2016 2017
Net
bal
ance
(>
0 op
timis
tic)
Construction
Financial & Busines Services
Manufacturing
Retail
Tourism
0%
10%
20%
30%
40%
50%
60%
70%
80%
Q1 Q2 Q3 Q4 Q1 Q2 Q3 Q4 Q1 Q2 Q3 Q4 Q1 Q2 Q3
2014 2015 2016 2017
Net
Bal
ance
of F
irm R
espo
nses
(%
)
Manufacturing Primary Distribution Tourism
Exp
ecte
d
-3.0%
-2.0%
-1.0%
0.0%
1.0%
2.0%
3.0%
92
94
96
98
100
102
104
106
108
Q1 Q2 Q3 Q4 Q1 Q2 Q3 Q4 Q1 Q2
2015 2016 2017
% c
hang
e on
the
quar
ter
Growth in Small/Medium sized retailers (RHS)Growth in Large retailers (RHS)Total value of retail sales since 2015 (LHS)
0
10
20
30
40
50
60
70
80
90
Q1Q4Q3Q2Q1Q4Q3Q2Q1
201720162015
Rec
ruitm
ent
diffi
culti
es (%
of r
espo
nden
ts)
Manufacturing Construction Financial Services Retail Tourism
20 Fraser of Allander Institute

Before turning to our forecasts, it is helpful to review what our latest ‘nowcasts’ are saying about the immediate outlook.
Our nowcasts use the latest official and unofficial data from a variety of sources (e.g. business and employment surveys) to provide a statistical prediction of what current quarterly growth figures might look like. Our latest figures, including data up to the start of September 2017, predict growth of between 0.3% to 0.4% in Q2 and Q3 of 2017.
Turing to our forecasts, as in the past, we report a central forecast but calculate uncertainty bands to set out a likely range within which we predict Scottish economic growth will lie.
Overall, our forecasts are little changed on June.
Our assessment is still the same - we believe that the Scottish economy will grow this year, but predict that such growth will remain below trend.
In making the forecasts, a number of judgement calls are required.
Firstly, as we have highlighted above, the Scottish economy has been weak now for two years. To the extent that this represents a cyclical downturn, then we could expect the economy to grow more quickly in the near term as it makes up lost ground.
Chart 47 shows the statistical output gap for Scotland – i.e. the difference between actual output and trend. By currently being ‘below trend’ a pick-up with faster growth is likely at some point.
Secondly, we clearly do not live in ‘normal’ times. Brexit uncertainty is beginning to have a cooling impact on the UK economy (Table 8). Scotland is unlikely to be immune from such effects.
Thirdly, some of the challenges that the Scottish economy has faced in recent times are more structural in nature – e.g. the maturity of the North Sea basin. To the extent that such effects are significant, then we should not expect the economy to bounce back as strongly.
Table 7: Nowcasts for Q2 2017 and Q3 2017 for Scotland
Source: Fraser of Allander Institute
Q2 Q3
Quarterly Growth +0.38% +0.43%
Annualised Growth +1.52% +1.71%
Table 8: Latest growth forecasts for the UK economy
Source: HM Treasury
2017 2018 2019
Bank of England 1.7 1.6 1.8
OBR 2.0 1.6 1.7
NIESR 1.7 1.9 2.0
European Commission 1.8 1.3 n/a
IMF 1.7 1.5 1.6
ITEM Club 1.5 1.3 n/a
Chart 46: Nowcasts vs. 1st release of GDP estimates
Source: Fraser of Allander Institute
Chart 47: Scottish Output Gap - currently below statistical trend
Source: Fraser of Allander Institute
-0.4%
-0.2%
0.0%
0.2%
0.4%
0.6%
0.8%
1.0%
2015 Q1 2015 Q3 2016 Q1 2016 Q3 2017 Q1 2017 Q3
Qua
rterly
Gro
wth
1st GDP Estimate published Nowcast
-8
-6
-4
-2
0
2
4
6
8
10
1964 1968 1972 1976 1980 1984 1988 1992 1996 2000 2004 2008 2012 2016
Out
put
gap
(%) -
HP
Filt
er m
etho
d
Output Gap
Forecasts
21Economic Commentary, September 2017

0.0
0.2
0.4
0.6
0.8
1.0
1.2
1.4
1.6
1.8
2.0
2017 2018 2019
% c
ontri
butio
n to
GD
P g
row
th
Households Government Investment Trade (RUK) Trade (ROW) GDP growth, %
All things considered, our central forecast is for growth of around 1.2% this year. (Table 9)
Given Q1’s growth of 0.7%, this will be achieved if the Scottish economy matches its average quarterly growth rate for the remainder of the year.
Services will continue to make the greatest overall contribution to growth, however in absolute terms, growth in production is forecast to be slightly higher (remember that services comprise a much greater share of output than manufacturing in Scotland).
Professional services and business services in particular are placed to do well. Tourist facing businesses – such as hotels – have had a strong summer and this should continue into the autumn (boosted by the weak pound).
We expect that the outlook for manufacturing will continue to be more positive – albeit some of the strong growth witnessed in the first three months of the year is unlikely to be sustained.
The anticipated pick-up in food and drink has started to materialise and should continue as the low value of sterling supports growth overseas.
We have maintained our central forecast for growth at 1.4% in 2018 and revised up our outlook for 2019 to 1.7%. (Chart 48)
We expect the growth gap between Scotland and the UK to remain over the next couple of years, but to continue to narrow.
Weak earnings growth will mean that household spending – and the industries that they support (e.g. in retail) – will not be as strong as in 2016.
We expect the pressure on earnings to spill-over into 2018 before earnings pick back up again in 2019. (Chart 49)
As greater certainty over the UK’s position post-Brexit becomes clearer, we should see some pick-up in investment. Of course, there remains a significant degree of uncertainty about the outlook and what this might mean for business. So this is arguably the element of our forecast with the greatest risk.
Table 9: Forecast Scottish GVA growth (%) 2017 to 2019
Source: Fraser of Allander Institute
2017 2018 2019
GVA 1.2 1.4 1.7
Production 1.3 1.6 1.9
Construction 0.7 0.9 1.1
Services 1.2 1.4 1.7
Chart 48: Growth to pick-up in 2018 and 2019 but outlook remains uncertain
Source: Fraser of Allander Institute
Chart 49: Contribution to FAI forecast 2017 to 2019: household contribution to fall back
Source: Fraser of Allander Institute
-3%
-2%
-1%
0%
1%
2%
3%
4%
2006 2007 2008 2009 2010 2011 2012 2013 2014 2015 2016 2017 2018 2019
Annu
al G
VA G
row
th
Forecast
* Actual data to Q1 2017, central forecast with forecast uncertainty for 2017 – 2019. Uncertainty bands sourced from accuracy of past forecasts at different forecast horizons
22 Fraser of Allander Institute
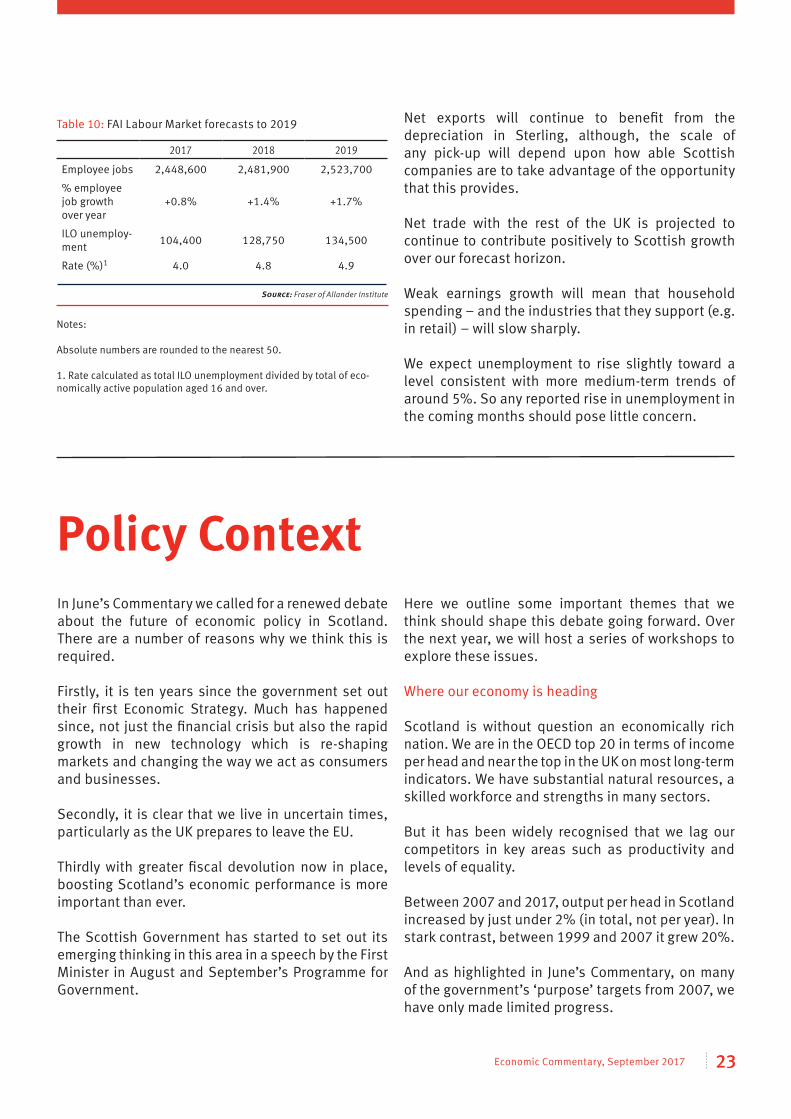
Net exports will continue to benefit from the depreciation in Sterling, although, the scale of any pick-up will depend upon how able Scottish companies are to take advantage of the opportunity that this provides.
Net trade with the rest of the UK is projected to continue to contribute positively to Scottish growth over our forecast horizon.
Weak earnings growth will mean that household spending – and the industries that they support (e.g. in retail) – will slow sharply.
We expect unemployment to rise slightly toward a level consistent with more medium-term trends of around 5%. So any reported rise in unemployment in the coming months should pose little concern.
Table 10: FAI Labour Market forecasts to 2019
Source: Fraser of Allander Institute
In June’s Commentary we called for a renewed debate about the future of economic policy in Scotland. There are a number of reasons why we think this is required.
Firstly, it is ten years since the government set out their first Economic Strategy. Much has happened since, not just the financial crisis but also the rapid growth in new technology which is re-shaping markets and changing the way we act as consumers and businesses.
Secondly, it is clear that we live in uncertain times, particularly as the UK prepares to leave the EU. Thirdly with greater fiscal devolution now in place, boosting Scotland’s economic performance is more important than ever.
The Scottish Government has started to set out its emerging thinking in this area in a speech by the First Minister in August and September’s Programme for Government.
Here we outline some important themes that we think should shape this debate going forward. Over the next year, we will host a series of workshops to explore these issues.
Where our economy is heading Scotland is without question an economically rich nation. We are in the OECD top 20 in terms of income per head and near the top in the UK on most long-term indicators. We have substantial natural resources, a skilled workforce and strengths in many sectors.
But it has been widely recognised that we lag our competitors in key areas such as productivity and levels of equality.
Between 2007 and 2017, output per head in Scotland increased by just under 2% (in total, not per year). In stark contrast, between 1999 and 2007 it grew 20%.
And as highlighted in June’s Commentary, on many of the government’s ‘purpose’ targets from 2007, we have only made limited progress.
2017 2018 2019
Employee jobs 2,448,600 2,481,900 2,523,700
% employee job growth over year
+0.8% +1.4% +1.7%
ILO unemploy-ment 104,400 128,750 134,500
Rate (%)1 4.0 4.8 4.9
Notes:
Absolute numbers are rounded to the nearest 50.
1. Rate calculated as total ILO unemployment divided by total of eco-nomically active population aged 16 and over.
Policy Context
23Economic Commentary, September 2017

Answering these questions is not easy. And ultimately it will require trade-offs. But a greater role for robust policy evaluation is essential.
A new Strategic Board for Enterprise and Skills has been established. For the Board to assess and ensure the efficacy of this activity they need better information and data on the impact of current policy than we currently have.
The Board’s focus is on Scotland’s skills and enterprise agencies. We would argue that a wider remit is required to extend to all of the public sector – including Scottish Government policies. That way the focus can centre upon the actual outcomes we are trying to achieve, rather than individual policies or the performance of individual institutions.
This will not only help avoid policies being designed, expanded, and defended by assertion rather than evidence, but will offer practical guidance about where resources should be directed.
Priorities and picking winners
Armed with this information, the next step is to actually identify priorities.
In a recent speech, the First Minister identified high-tech and digital innovation as having the greatest potential to impact on growth in the future.
Whilst there is much to agree with in this diagnosis, the important next step is what the government actually does to support that vision.
Re-focussing priorities – with scarce resources – will inevitably lead to winners and losers.
Businesses who presently receive support, could see their service withdrawn in the face of greater investment elsewhere.
This would not be without controversy. But the very fact that the First Minister emphasised a willingness to look at how to “make the most of the money we already spend” – estimated at £2bn per annum on economic development and skills– is perhaps the most significant shift in the government’s approach to economic policymaking that we have seen in some time.
Given the challenges over the last decade – from the financial crisis to oil and gas – the fact that Scotland has maintained its position on many international rankings can be viewed as an achievement.
But the ambition must be to do better.
In looking to the future we need to better define what success looks like.
Part of this is setting out clear and realistic targets for what we want to achieve. These targets should be anchored on the key outcomes of sustainable, inclusive, economic growth.
Public bodies should be encouraged to develop their own ambitious targets and metrics against which they can be judged.
At the same time, we know that the nature of our economy is rapidly changing and whilst this brings opportunities it also brings challenges.
The economic policy debate needs to focus on identifying and preparing for these future trends.
Knowing what works and improving evaluation
With a clear vision of where we want to get to, actually getting there requires a step change in how we design and implement policy.
This means focussing much more – and much more determinedly– on learning what actually works in practice in Scotland.
Most would agree with the overarching principles of the current Economic Strategy. Of course, where opinions differ is how best to realise these ambitions.
But what is of most importance is being guided by evidence on whether a policy or programme is achieving all that is intended of it.
If it is, can it be extended, or rolled-out more widely? If not, why is it not working?
Is the overall policy design right but the practical delivery of the policy poor? Are more resources needed?
24 Fraser of Allander Institute
Instead, businesses – and the wider public sector and third sector – need to pro-actively engage and shape priorities in the months ahead.
At the same time, whilst there is much that government can do to create an environment which encourages high-tech and digital innovation, to realise faster economic growth businesses themselves need to take greater risks; in their investments; in R&D; and their export strategies.
This requires not only the necessary skills to innovate but the leadership within business to seize the opportunities for the future. In a country the size of Scotland, there are also more opportunities for collaboration between businesses, key sectors and higher education.
Conclusions
If the government are serious about a change in emphasis, we could see the policy landscape become much more dynamic.
This is to be welcomed. In a rapidly changing world policymaking needs to become less inclined towards rigidity.
Now that the Scottish Government has set out its thinking, we hope that others from across the political spectrum and beyond come forward with their own constructive ideas to help inform this crucial debate.
The Budget
Ultimately the proof of how ambitious policymakers intend to be will reveal itself in the upcoming budget debate.
As we will outline in our Scotland’s Budget: 2017 publication later in September, the public finances remain under pressure both from a tight settlement from Westminster and high profile manifesto pledges.
Reading between the lines from recent statements, the Scottish Government has opened the door to further tax rises. But here they face a challenging balancing act, supporting greater investment in public services – including economic development initiatives – while retaining a competitive tax base.
What is clear is that businesses will seek clarity on how the government’s position on raising revenue sits with their ambitions to build a more dynamic and innovative economy.
The role of business
The next few months promises to set the scene for a robust debate on economic policy in Scotland for the next few years and beyond.
It is important that this is not just a debate to be had between government and Parliament.
For more in-depth analysis of the Scottish, UK and global economies, become a member of the new FAI membership scheme:
www.strath.ac.uk/fraser
25Economic Commentary, September 2017

As part of a leading technological University and Scotland’s number one business school, we understand the importance of global thinking.
Our Department of Economics is home to the Fraser of Allander Institute, Scotland’s leading independent economic research institute.
The institute is offering a one day CPD course, “Understanding the Scottish Economy”, which is being held at the business school on 28th November. The course is designed for professionals in the private, public and third sectors who are interested in gaining an understanding of the economy and its impact on their organisation.
No prior formal background in economics is required and you will be taught by people with real-world experience of public policy and business.
To register for this event visit:
www.strath.ac.uk/fraser
Understanding the Scottish Economy
A one day Fraser of Allander CPD course
TIM
ES
HIGH
ER
E DUC
ATIO
N
A world leading business school on your doorstep
26 Fraser of Allander Institute

Fraser of Allander Institute University of Strathclyde 199 Cathedral StreetGlasgow G4 0QU Scotland, UK
Telephone: 0141 548 3958 Email: [email protected]: www.strath.ac.uk/fraserFollow us on Twitter via @Strath_FAI