fraser of allander economic commentary · fraser economic commentary page 2 volume 34 number 2 ....
TRANSCRIPT

FRASER ECONOMIC COMMENTARY
Fraser of Allander
economic commentary
November 2010 Vol 34 No 2
© University of Strathclyde, 2010 The University of Strathclyde is a charitable body, registered in Scotland, number SC015263
Outlook and appraisal ........................................................4 The Scottish economy Forecasts of the Scottish economy ....................................22 Review of Scottish Business Surveys ................................37 Overview of the labour market............................................41 Economic perspectives Under-employment of Scottish graduates Irene Mosca and Robert Wright .......................................49 Wildlife tourism in Scotland – the example of grouse Shooting Stewart Dunlop and Adam Smith .....................................56 The anatomy of high growth firms in Scotland Ross Brown and Colin Mason ..........................................67 The qualifications/jobs mismatch in Scotland John Sutherland ...............................................................77
NOVEMBER 2010 PAGE 1

FRASER ECONOMIC COMMENTARY
PAGE 2 VOLUME 34 NUMBER 2
The Fraser of Allander Economic Commentary was first published in 1975. The new association between PricewaterhouseCoopers and the University of Strathclyde’s Business School provides the Fraser of Allander Institute with the support to continue the Commentary, and we gratefully acknowledge this support. The Fraser of Allander Institute is a research unit within the Department of Economics at the University of Strathclyde in Glasgow. The Institute carries out research on the Scottish economy, including the analysis of short-term movements in economic activity. Its researchers have an international reputation in modelling regional economies and in regional development. One-off research projects can be commissioned by private and public sector clients. If you would like further information on the Institute’s research or services, please contact the Institute Administrator on 0141 548 3958 or email the Institute at [email protected]. The Fraser of Allander Institute was established in 1975 as a result of a donation from the Hugh Fraser Foundation. We gratefully acknowledge the contribution of the Buchanan and Ewing Bequest towards the publication costs of the Commentary. PwC support the production of the Economic Commentary but have no control of its editorial content, including, in particular, the economic forecasts. PwC produces its own regular review of UK and international economic prospects, the next issue of which will be published on their website: http://www.pwc.co.uk/eng/publications/uk_economic_outlook.html

FRASER ECONOMIC COMMENTARY
Notes to contributors The editors welcome contributions to the Economic Perspectives section. Material submitted should be of interest to a predominately Scottish readership and written in a style intelligible to a non-specialist audience. Contributions should be submitted to Cliff Lockyer [email protected] Articles accepted for publication should be supplied electronically and conform to the guidelines available from Isobel Sheppard [email protected] The copyright for all material published in the Economic Commentary rests with the University of Strathclyde. If you are interested in receiving copies of press releases and being kept informed of other publications associated with the Commentary please click on the following link: http://www.strath.ac.uk/frasercommentary/registration and complete the registration form. Fraser of Allander Institute Department of Economics University of Strathclyde Sir William Duncan Building 130 Rottenrow Glasgow G4 0GE t: +44 (0) 141 548 3958 f: +44 (0) 141 548 5776 e: [email protected] w: http://www.strath.ac.uk/fraser/
NOVEMBER 2010 PAGE 3

FRASER ECONOMIC COMMENTARY
Outlook and
appraisal
Overview The Scottish and UK economies strengthened appreciably in their recovery from recession in the 2nd quarter of this year. Preliminary UK data for the 3rd quarter indicates some weakening but at 0.8% over the quarter growth exceeded expectations. Scottish GDP growth fell again in the first quarter, by -0.2%, and with zero growth in 2009q3 and 0.1% growth in the final quarter of 2009, there is a case for arguing that the Scottish economy did not emerge from recession until the 2010q2, two quarters after the UK. The Scottish economy went into recession one quarter later than the UK. The fall in Scottish GDP during the 'recession' to 2010q1 was therefore -5.81% compared to a fall of -6.32% during the recession in the UK, still less severe than the UK. But with growth of 1.3% in the 2010q2, compared to 1.2% in the UK, the Scottish bounce back was considerable. However, there is reason to believe that an unsustainable bounce back in construction and re-stocking were key reasons for the strength of the recovery in the second quarter which would tend to fade away in later quarters. The 0.8% preliminary estimate of UK 3rd quarter growth in part appeared to contradict that assumption, but construction growth remained strong to the incredulity of many associated with the industry. We still await further data to ascertain the spending composition of the 3rd quarter UK growth rate and whether temporary re-stocking was still a principal driver, or whether there had been a pick-up in more sustainable export and investment growth. In the absence of 3rd quarter Scottish GDP data until publication in late January, we must rely on survey evidence. This suggests a weakening in the Scottish growth, but sectors with a strong export focus such as engineering continued to recover, perhaps buoyed by a favourable sterling exchange rate. Those sectors and companies relying
PAGE 4 VOLUME 34 NUMBER 2

FRASER ECONOMIC COMMENTARY
more on domestic demand appeared less robust, as household and corporate confidence weakened, perhaps in part due to the uncertain prospect raised by the forthcoming public spending cuts. Business confidence and optimism about the future remained largely weak. There are concerns about bank lending, especially in construction, as bank deleveraging raises the likely cost and availability of funding loans for new investment and for refinancing of existing debt. While GDP in Scotland is now clearly rising so too is unemployment! GDP has fallen by about the same proportion in Scotland as the UK during the recession but Scottish unemployment has risen more to a rate above the UK. From an analysis of the data this puzzle may be 'explained' as follows. First, a comparable GDP fall, other things equal, might have been expected to push up the Scottish unemployment rate by more than the UK for simple arithmetic reasons since the Scottish rate was initially appreciably below the UK rate. Secondly, unemployment rose more quickly than the UK after 2009Q2 because inactivity rose more quickly in the UK. Thirdly, there was significant measured job loss in Scotland in 2010Q1. Inactivity rose strongly in Scotland dampening the rise in unemployment but suggesting that Scottish unemployment may continue to rise relative to the UK if some or all of the increased numbers of inactive workers decide to return to the labour market. Finally, there is the possibility that measurement error is clouding the outcome. If some of the measured surge in Scottish job losses actually occurred before 2009Q4 then that in itself would account for some of the faster rise in unemployment. By 2010q1 the contraction in Scottish jobs over the recession was, at -4.47%, a lot greater than the UK contraction of -2.54%. Total Scottish employment had fallen by -114,000, Scottish unemployment had risen by 112,000 and Scottish and UK inactivity had moved to comparable levels. So, maybe there isn't a puzzle at all! And while considerable
personal and family pain lies behind such job losses there may be a silver lining for the Scottish economy. The greater Scottish job loss and comparable GDP change suggests a relative rise in Scottish productivity. If so, average Scottish competitiveness will have risen. Looking forward, the UK monetary policy environment remains supportive with interest rates held at 0.5% but with additional monetary expansion put on hold at the most recent MPC meeting. UK inflation stands at 3.1%, high by international standards, so the MPC must trade off potential inflationary risk against the prospect of weakening growth and a continuing output gap. Fiscal policy is markedly contractionary. Following the Comprehensive Spending Review the expected cut in the Scottish government's budget is expected to be around 11% by 2014-15. We have re-estimated the impact of this cut in DEL, which in the previous Commentary we took to be 14%. Total job losses range from -49, 000 in the flex-price case to -113,000 in the fixed-price case, with GVA falling by just over -1% and just under -3.5%. Public sector job losses range from just under 60,000 to a little under 71,000. Private sector job losses are moving towards 43,000 in the fixed price case but when wages and prices are flexible there is a private sector job gain of 10,500. In this latter case, as before, there is a 'crowding-in' effect on private sector activity due to the fall in wages and intermediate input prices improving the competitiveness of the sector. However, the 'crowding-in' effect is relatively weak and certainly insufficient to offset the public sector job losses. Of course, the Scottish government has options which in effect may change the measured Scottish structural and behavioural relationships that are present in our model. If these are exercised in the forthcoming Budget, the GVA and job loss could be lower. There is considerable uncertainty whether private sector growth will pick up sufficiently
NOVEMBER 2010 PAGE 5

FRASER ECONOMIC COMMENTARY
PAGE 6 VOLUME 34 NUMBER 2
to offset the planned contraction in public spending. Such a private sector recovery is currently much dependent on the growth of exports and investment because household spending remains subdued as families deal with the aftermath of the financial crisis and recession. Companies are becoming cash rich as rising profits increase their cash holdings. They are therefore in a position to begin investing on a much increased scale. Companies main concern will be uncertainty about demand and export demand in particular. They will also be concerned about the availability of bank lending to support own resources. While there is clear evidence of growth in the world economy, the weakness of the US economy is a cause for concern. Against this background we are forecasting GVA growth of 1% this year, which is greater than our June forecast of 0.7%. Household spending is recovering but increases only marginally this year, then increases slightly in 2011 and is close to trend in 2012. The rise in planned welfare cuts since our last forecast will take out nearly £2bn of demand from Scottish households by 2014-15. The timing is uncertain but we expect it to contribute to the weak growth of household spending. Export growth picks up this year as the growth of world trade recovers. There is strong positive growth for Scottish exports both to rest of world and rest of UK, with the latter weaker due to the fiscal consolidation. Private sector investment growth in 2010 is revised up from our June forecast and the rebound continues into 2011 and 2012 after a recession that produced one of the most severe contractions in private investment in modern times. The fiscal consolidation has broadly the same aggregate impact as forecast in June. All these reasons taken together lead to a forecast of 1.1% GDP growth in 2011 and 1.9% in 2012. That is the same as the June forecast for 2011 but slightly lower for 2012. Our fear is that the greater welfare spending cuts may dampen growth in 2012 compared to our previous forecast. Compared to the UK these forecasts suggest that the recovery
continues to be weaker in Scotland than the UK, especially in 2011. In the labour market, net jobs grow by -0.6% in 2010, +1.0% in 2011, and +1.8% in 2012. By 2012, total jobs are forecast to be around 47,000 lower than the last peak in 2008. By sector, the burden of jobs losses is borne by the service sector in 2010 with net job losses of just under 14,000. Construction loses just above 900 jobs this year, while jobs are gained - just under 2,000 - in production as manufacturing especially expands. Positive but fairly weak jobs growth occurs in all aggregate sectors in 2011 and 2012. We predict that unemployment will continue to rise into next year peaking at around 286,000 before falling to just under 262,000 in 2012. Recent GDP performance The Scottish economy grew by 1.3% during the second quarter of this year, according to official data released on October 20th1. This was slightly faster than the UK growth rate of 1.2%. Over the year to 2010 Q2 Scottish GDP in constant basic prices fell by 1.7%, while UK GDP fell by 1.5%. Figure 1 shows the quarterly movements in Scottish and UK GDP. In the first quarter of the year Scottish GDP had fallen again, by -0.2%, compared to a rise of 0.2% in the UK. Indeed, with 2009 Q4 data now revised down to 0.1% growth from 0.2% earlier it could be argued that Scotland continued in recession until 2010 Q1, thereby coming out of recession in the second quarter some 2 quarters after the UK. But the new revised Scottish data also reveal that the economy did not go into recession until 2008 Q3, one quarter later than the UK. The comparative overall GDP performance of Scotland and the UK over the recession and subsequent recovery is given in Table 1. The table reveals that scale of the recession was slightly weaker in Scotland at -5.69% compared to a fall of -6.32% in the UK. Dating the trough of the recession as occurring in 2009 Q3 we can see that the recovery of 1.21% of GDP is weaker here than in the UK where GDP has grown by 2% since the trough of the recession in 2009 Q3. In the 2nd quarter 2010, the service sector – accounting for 74% of overall GVA on 2007 weights – grew by 0.3% in Scotland but by almost 0.6% in UK – see Figure 2.

FRASER ECONOMIC COMMENTARY
Figure 1: Scottish and UK Quarterly GDP growth, 1998q2 to 2010q2
-2.5
-2.0
-1.5
-1.0
-0.5
0.0
0.5
1.0
1.5
2.0
2.5
Perc
ent
Scotland
UK
Over the year to 2010 Q2, GVA in Scottish services fell by -1.2% compared to a fall of -1% in the UK. The comparative overall GVA performance of Scottish and UK services over the recession and subsequent recovery is given in Table 2. The first point to note from Table 2 is that the recession was shallower in services compared to the economy as a whole
with GVA falling by -4.36%. The recession in Scottish services was also shallower than in UK services where GVA fell by -4.64%. But the UK service sector, as with the economy as a whole, is recovering more quickly growing by 1.55% since the recession trough compared to growth of 0.18% in Scottish services.
Table 1: Scottish: and UK GDP: recession and recovery Scotland UK GDP fall in recession -5.69% -6.32% Change from peak to 2010 Q2 -4.55% -4.45% GDP recovery to 2010 Q2 1.21% 2.00% Table 2: Scottish and UK Services GVA: recession and recovery Scotland UK GVA fall in recession -4.36% -4.64% Change from peak to 2010 Q2 -4.18% -3.16% GVA recovery to 2010 Q2 0.18% 1.55%
NOVEMBER 2010 PAGE 7

FRASER ECONOMIC COMMENTARY
Figure 2: Scottish and UK services GVA growth at constant basic prices 1998q2 to 2010q2
-2.5
-2.0
-1.5
-1.0
-0.5
0.0
0.5
1.0
1.5
2.0
2.5
Perc
ent
Scotland
UK
Figure 3: Scottish and UK financial services GVA growth at constant basic prices 1998q2 to 2010q2
-8
-6
-4
-2
0
2
4
6
8
%
Year
Scottish Financial Services
UK Financial Services
PAGE 8 VOLUME 34 NUMBER 2

FRASER ECONOMIC COMMENTARY
Table 3: Scottish and UK Manufacturing GVA: recession and recovery Scotland UK GVA fall in recession -11.44% -14.58% Change from peak to 2010 Q2 -9.10% -10.91% GVA recovery to 2010 Q2 2.64% 4.30%
Table 4: Scottish and UK Construction GVA: recession and recovery Scotland UK GVA fall in recession -13.64% -14.50% Change from peak to 2010 Q2 -2.56% -5.97% GVA recovery to 2010 Q2 12.82% 9.97%
Within services, the main sectoral drivers of recovery in 2010 Q2 were retail & wholesale (10% of overall GVA), real estate & business services (REBS) (20% of GVA), and other services (5% of GVA). Retail and wholesale grew by 1.8%, REBS by 1.7%, and other services by 0.4%. GVA did not change in public administration, education & health (21% of overall GVA), while output fell in hotels & catering (3% of GVA), financial services (8% of GVA), and transport & communication (7% of GVA), by -1.0%, -2.1% and -2.4%, respectively. Retail & wholesale exhibited much stronger growth than in the UK where the sector grew by only 0.2%. Conversely financial services was much weaker in Scotland with the UK sector only contracting by -0.3% – see Figure 3. The manufacturing sector in Scotland - accounting for 13% of overall GVA - grew by 2.2% in 2010 Q2 compared to the somewhat weaker growth performance of UK manufacturing which grew by 1.6% - see Figure 4. Over the year to the second quarter manufacturing contracted by -3.5% in Scotland and by -3.1% in the UK. The comparative overall GVA performance of Scottish and UK manufacturing over the recession and subsequent recovery is given in Table 3. The recession is shown to have had a much stronger impact on Scottish and UK manufacturing than the economy as a whole, and its principal component the service sector. Scottish manufacturing lost -11.44% of its output during the recession while UK manufacturing suffered an even greater output loss of -14.58%. But despite a good start, and better performance in the most recent quarter, the recovery in Scottish manufacturing has been weaker than its UK counterpart with growth of 2.64% compared to 4.30% in the UK. Within manufacturing, the performance of engineering and allied industries was encouraging in 2010 Q2. The sector overall accounts for under 4% of economy-wide output, with
electrical engineering, 'electronics', accounting for around one half of the sector's output, while mechanical engineering and transport equipment account almost equally for the remainder. Electronics grew by 6.5% in the quarter compared to 3.3% in the UK, while mechanical engineering was weaker growing by 0.3% compared to much stronger growth of 5.2% in the UK. Transport equipment, on the other hand, grew robustly in Scotland, by 10.1%, while its UK counterpart contracted by -0.8%. Growth was fairly broadly spread within manufacturing, suggesting that the industry may finally be reaping the benefits of a lower sterling exchange rate. Metals and metal products grew by 3.2% (5.1% in UK), textiles, footwear, leather and clothing grew by 4.6% (5.4% in UK), chemicals & manmade fibres grew by 2.6% (-0.9% in UK) and other manufacturing grew by 0.3% (1.4% in UK). Only two principal manufacturing sectors contracted in the second quarter: refined petroleum and nuclear fuel processing cut back by -3%, while food, drink and tobacco experienced a small fall of -0.1%. But within the latter sector , the drinks sector contracted significantly with output falling -3.3% (-1.6% in UK). In the remaining food and tobacco sector GVA grew by 3.9% (1.8% in UK). Finally, the construction sector grew exceptionally strongly in both Scotland and the UK. With growth of 10.4% and 9.5%, respectively, the sector has bounced back significantly after recession as Figure 5 indicates. The comparative overall GVA performance of Scottish and UK construction over the recession and subsequent recovery is given in Table 4. In construction, the output lost during the recession was clearly the greatest of all the principal sectors, with GVA falling by -13.64% in Scotland and even larger -14.5% in the UK. Moreover, by the end of the second quarter GVA was only 2.56% lower than the previous peak before the recession in Scotland and 5.97% lower in the UK. The sector has therefore experienced a classic 'V' shaped recession in both Scotland and the UK,
NOVEMBER 2010 PAGE 9

FRASER ECONOMIC COMMENTARY
Figure 4: Scottish and UK manufacturing GVA growth at constant basic prices 1998q2 to 2010q2
-7.0
-6.0
-5.0
-4.0
-3.0
-2.0
-1.0
0.0
1.0
2.0
3.0
4.0
Perc
ent
ScotlandUK
Figure 5: Scottish and UK construction GVA Volume Growth 1998q2 - 2010q2
-8
-6
-4
-2
0
2
4
6
8
10
12
%
ScotlandUK
PAGE 10 VOLUME 34 NUMBER 2

FRASER ECONOMIC COMMENTARY
NOVEMBER 2010 PAGE 11
Figure 6: Growth of key sectors in Scotland 1998q2 to 2010q2
50.0
70.0
90.0
110.0
130.0
150.0
170.0
Public Sector (210) Hotels and Catering (32)
Transport & Communication (68) Real Est. & Business Services (200)
Retail & Wholesale (101) Other Services (49)
Electronics (17) Financial Services (76)
Chemicals (14) Food & Drink (30)
Figure 7: ILO unemployment rates, Scotland and the UK
3
4
5
6
7
8
9
10
11
12
Jan‐Mar 199
3
Jul‐Sep
199
3
Jan‐Mar 199
4
Jul‐Sep
199
4
Jan‐Mar 199
5
Jul‐Sep
199
5
Jan‐Mar 199
6
Jul‐Sep
199
6
Jan‐Mar 199
7
Jul‐Sep
199
7
Jan‐Mar 199
8
Jul‐Sep
199
8
Jan‐Mar 199
9
Jul‐Sep
199
9
Jan‐Mar 200
0
Jul‐Sep
200
0
Jan‐Mar 200
1
Jul‐Sep
200
1
Jan‐Mar 200
2
Jul‐Sep
200
2
Jan‐Mar 200
3
Jul‐Sep
200
3
Jan‐Mar 200
4
Jul‐Sep
200
4
Jan‐Mar 200
5
Jul‐Sep
200
5
Jan‐Mar 200
6
Jul‐Sep
200
6
Jan‐Mar 200
7
Jul‐Sep
200
7
Jan‐Mar 200
8
Jul‐Sep
200
8
Jan‐Mar 200
9
Jul‐Sep
200
9
Jan‐Mar 201
0
%
Scotland
UK

FRASER ECONOMIC COMMENTARY
with activity apparently picking up more quickly in Scotland. The latest preliminary estimate for UK GDP in the third quarter suggests the fast pace of improvement in the sector in the UK has continued with growth of 4% posted. It is difficult to be certain whether the rapid return to growth in construction will be wholly or partially sustained. Anecdotal evidence from the industry in Scotland appears sceptical of such a rebound. There are several explanations offered for the rapid revival: postponed activity due to bad weather in the early part of the first quarter; the delayed consequence of the fiscal stimulus; the consequence of the 'flurry' of construction contracts signed off by the previous UK Labour government. None of these explanations is very convincing. Figure 6 provides data on the recent GVA output performance in key Scottish industry sectors before, during and after the recession. The data clearly show evidence of recovery across several, but not all, sectors. Third quarter survey evidence Scottish GVA statistics for the 3rd quarter 2010 will not be available until 20 January 2011. While 3rd quarter GVA statistics were made available for the UK 26 October, they represent a first release and are usually revised considerably. The Scottish data coming later are more reliable and less subject to marked revision. In the meantime we must rely on survey data to try and gauge the performance of the Scottish economy in the 3rd quarter. A detailed Review of Business Surveys appears later in this Commentary. What that review makes clear is that the surveys offered a mixed view of the Scottish economy during that period. This in part is due to the coverage of the surveys varying between different sectors of the economy. So, surveys of Scottish engineering and oil and gas are fairly bullish both in terms of actual and expected performance. Outside the engineering sector there is some consensus that growth weakened in the 3rd quarter compared to the second quarter - mirroring the UK GVA data - but the CBI survey was more upbeat about expected activity in the the fourth quarter than the SCBS, which noted a fall in confidence, a fading of the signs of recovery experienced in the 2nd quarter, and a downward revision of future expectations for the fourth quarter and for the year ahead. So, the surveys appear to broadly agree that growth in the Scottish economy slowed in the third quarter but sectors with a strong export focus such as engineering continued to recover, perhaps buoyed by a favourable sterling exchange rate. Those sectors and companies relying more on domestic demand appear less robust, as household and corporate confidence weakened, perhaps in part due to the uncertain prospect raised by the forthcoming public spending cuts. Business confidence and optimism about the future remains largely weak. Finally, sentiment in the construction sector appears at odds with buoyancy present in the official GVA statistics, with declining confidence and concerns about the availability and cost of bank finance.
Recent labour market performance The recent performance of the Scottish labour market has been a cause for concern. Indeed, this performance has posed something of a puzzle because while GDP and output change in Scotland over the recession was no worse than the UK, the deterioration in the unemployment rate in Scotland has been much worse. Furthermore, the Scottish unemployment rate went above the UK rate in the second quarter of this year. Figure 7 tracks the quarterly Scottish and UK unemployment rates from the beginning of 1993 until the second quarter of this year. During this period there was one key stylised fact and three distinct phases. The stylised fact is that both the Scottish and UK economies enjoyed falling trend unemployment until the recent recession. Secondly, Scottish unemployment was below UK unemployment until the 3rd quarter 1995 - a probable lagging consequence of the fact that Scotland did not suffer a recession in 1990-91, whereas the UK did. From the 3rd quarter 1995 until the second quarter 2006, Scottish unemployment was higher than the UK. But after that, from the 3rd quarter 2006 until the 1st quarter of this year, Scotland enjoyed a superior unemployment performance. This superior unemployment performance may have been due to the following reason. Scottish GDP growth was a little less than the UK but overall the mid 2000's was one of strong growth. This growth may have been associated with a lower unemployment rate in Scotland because a faster UK growth rate was required to keep unemployment stable2. In order to seek to explain the puzzle concerning Scottish GDP and unemployment change during the recent recession we have begun a small programme of systematic research on that relationship. The first fruits of that research are presented in Box 1 in the Forecasts of the Scottish Economy section of this Commentary. What we are seeking to do is examine statistically, the relationship between GDP change and unemployment. As output rises, the demand for labour will rise and unemployment will fall, assuming other things, such as productivity, hours of work, inactivity, remain unchanged. This negative relationship between changes in GDP and unemployment is known as Okun's Law after the US economist Arthur Okun who specified and provided a statistical estimate of the relationship for the US. Estimating this relationship for the UK going back to 1971 shows that it is not stable. We have less data for Scotland and so are able to estimate the relationship only back as far as 1995. What our results show is that the relationship holds for Scotland and the UK, with the UK unemployment rate slightly more sensitive than the Scottish rate to GDP changes. We are also able to calculate from the estimation, the rate of growth of GDP consistent with a stable unemployment rate. This proves to be 2% per annum for both Scotland and the UK - around 0.5% per quarter. But
PAGE 12 VOLUME 34 NUMBER 2

FRASER ECONOMIC COMMENTARY
Figure 8: GVA and jobs in recession and recovery: Scotland and UK
90
91
92
93
94
95
96
97
98
99
100
101
2008q1 2008q2 2008q3 2008q4 2009q1 2009q2 2009q3 2009q4 2010q1 2010q2
Scotland GVA
Scotland Total Employment
UK GVA
UK Total Employment
the research of others also reveals that the relationship changes over the business cycle, particularly recessions as for example hours of work, labour productivity and inactivity changes. This proves to be the case in the most recent recession where we can identify a significant break in the relationship in the last two years - 8 quarters - of the 15 year sample. The sensitivity of unemployment rate changes to changes in GDP has risen during the recession in both Scotland and the UK. Moreover, the sensitivity of the Scottish unemployment rate to the change in GVA rose above that estimated for the UK. We now need to explain why and how the sensitivity of the Scottish unemployment rate to GDP change has risen. For the moment, until more rigorous research is done, we feel that some interesting insights can be obtained from casual empiricism. Figure 8 plots GVA and employment in Scotland and the UK during the recession and recovery. The figure clearly shows that the decline in Scottish GVA broadly tracked the decline in the UK but was slightly shallower. However, if 2010Q1 is taken as the final quarter of the Scottish recession given the fall again in GVA in that quarter, we can estimate the drop in GVA during the recession to be -5.81% in Scotland and -5.83% in the UK. One doesn't need to be a statistician to suggest that there is
no significant difference between the two. But total employment performance does differ. A key event is what happened between 2009Q4 and 2010Q1. Scotland lost more than fifty thousand jobs, while the UK experienced a slight fall. Prior to the final quarter of last year, the Scottish jobs market had held up remarkably well, with employment falling by -2.39% while GVA fell by -5.62%. The job loss was less than the UK employment fall of -2.54% with GVA falling by -5.83%. But after the significant haemorrhage of Scottish jobs over the winter by 2010Q1 employment had fallen by -4.47% since the peak prior to the start of recession compared to -2.83% in the UK. While of little comfort to those who lost their jobs, the bigger jobs cutback in Scotland implies that productivity may have improved relative to the UK, which might help Scotland's recovery. Figure 9 charts the behaviour of unemployment numbers in Scotland and the UK during the recession and recovery indexed to 100 for the start of recession. What the figure reveals is that the rise in unemployment in Scotland broadly tracked the UK during the recession until 2009Q2 when it began to surge upwards while UK unemployment numbers largely stabilised. Two questions arise from this chart. First, why did unemployment in Scotland surge after 2009Q2? Secondly, why was there not a further marked upwards surge in 2010Q1? The answer lies in what was happening to inactivity.
NOVEMBER 2010 PAGE 13

FRASER ECONOMIC COMMENTARY
Figure 9: Unemployment in recession and recovery, Scotland and UK
90
100
110
120
130
140
150
160
170
180
190
200
210
2008q1 2008q2 2008q3 2008q4 2009q1 2009q2 2009q3 2009q4 2010q1 2010q2
Scotland unemployment
UK Unemployment
Figure 10: Inactivity in recession and recovery: Scotland and UK
96
97
98
99
100
101
102
103
104
105
2008q1 2008q2 2008q3 2008q4 2009q1 2009q2 2009q3 2009q4 2010q1 2010q2
Scotland inactive
UK inactive
PAGE 14 VOLUME 34 NUMBER 2

FRASER ECONOMIC COMMENTARY
Table 5: Composition of the Fiscal tightening in 2014-15 £ billion March 2010 budget June 2010 budget October 2010
spending review Tax 21.5 29.8 29.8 Spending 50.9 82.8 80.5 Investment spending 17.2 19.3 17 Current spending 33.7 63.5 63.5 of which:
Debt interest 7 10 10 Benefits -0.3 10.7 17.7
Public services 27 42.8 35.7 Total tightening 72.4 112.6 110.3
% Spending 70 74 73 % Tax 30 26 27
Source: Institute for Fiscal Studies Figure 10 charts the numbers inactive in Scotland and the UK during the recession and recovery indexed to 100 for the start of recession. This chart shows that inactivity in Scotland, while a little more volatile, broadly tracked the UK until the first quarter of 2009. But from 2009Q2 inactivity rose quickly in the UK but remained broadly stable, rising slightly, until 2009Q4. Given output and employment were following broadly similar paths in Scotland and UK during this sub-period, this suggests that the surge in Scottish unemployment relative to the UK after 2009Q1 was due to a greater propensity of recently unemployed Scottish workers to offer themselves for work than their rest of UK counter parts. However, in the winter of 2009-10 the significant loss of Scottish jobs appears to have produced a surge in inactivity as large numbers dropped out of the jobs market, so that high and rising unemployment did not increase much more quickly than in the previous 3 quarters. So, to summarise. The puzzle of Scottish unemployment rising more quickly than the UK, and so rising above the UK, at a time of comparable GDP change may be 'explained' as follows. First, a comparable GDP fall, other things equal, might have been expected to push up the Scottish unemployment rate by more than the UK for simple arithmetic reasons since the Scottish rate was initially appreciably below the UK rate. Secondly, unemployment rose more quickly than the UK after 2009Q2 because inactivity rose more quickly in the UK. Thirdly, there was significant measured job loss in Scotland in 2010Q1. Inactivity rose strongly in Scotland dampening the rise in unemployment but suggesting that Scottish unemployment may continue to rise relative to the UK if some or all of the increased numbers of inactive workers decide to return to the labour market. Finally, there is the possibility that measurement error is clouding the outcome. If some of the
measured surge in Scottish job losses actually occurred before 2009Q4 then that in itself would account for some of the faster rise in unemployment. By 2010q1 the contraction in Scottish jobs over the recession was, at -4.47%, a lot greater than the UK contraction of -2.54%. Total Scottish employment had fallen by -114,000, Scottish unemployment had risen by 112,000 and Scottish and UK inactivity had moved to comparable levels. So, maybe there isn't a puzzle at all! The CSR and fiscal consolidation The UK picture The UK coalition government is seeking to remove the UK's structural budget deficit and stabilise its debt position by the end of the present Parliament in 2015. To achieve this, the government announced in its June Budget a fiscal tightening of £113bn - around 16% of government spending and 75% of current borrowing. On October 20th the government produced its Comprehensive Spending Review (CSR) outlining £81bn of proposed spending cuts, with the remainder to be financed by higher taxes, such as the increase in VAT to be introduced next January. UK spending departments are to experience an average real cut of just over 11% and welfare spending is to fall by £18bn. Table 5, produced by the Institute for Fiscal Studies (IFS) in London, outlines the key changes between the CSR, the June coalition Budgets, and the March Budget of the previous Labour government. Key points to note about the CSR in terms of the potential macro and socio economic consequences are as follows. First, the fiscal tightening by 2014-15 at £110bn is slightly
NOVEMBER 2010 PAGE 15

FRASER ECONOMIC COMMENTARY
less than the £113bn of the June Budget, but considerably more than the £72bn proposed by the Labour government in its March Budget. Secondly, the balance between spending cuts and tax rises is similar across all three budgets being close to a 70:30 split. Thirdly, the reduction in spending on public services and hence the cuts in departmental expenditure limits (DEL) is less in the CSR than in the June Budget. The average cut in department DEL by 2014-15 is just over 11% compared to 14% in the June Budget. Fourthly, the relief for spending on public services and departmental DEL is made possible by an increase in the cut in welfare benefits to nearly £18bn. The June Budget contained just under £11bn planned benefit cuts, while the March Budget planned to raise benefits slightly. Fifthly, the CSR reduced the planned cut in investment from £19.3bn to £17bn thus accounting for the slightly reduced fiscal tightening between June and the CSR. The cut in investment is now the same as in the March Budget but this still means that department's capital budgets are still being slashed by -29%. Finally, IFS has analysed the distributional consequences of the CSR and concludes that by 2014-15 the tax reforms and welfare benefit cuts are regressive within the bottom 90% of the income range with the poorest paying a relatively greater share of their income. Added to this is the Treasury's own analysis is that the planned cuts it department expenditures and hence public services is
regressive for those expenditures that can be modelled. None of this analysis by IFS and Treasury assumes behavioural change in response to tax and welfare reforms and spending cuts. Scottish consequences and impact Table 6 shows the Treasury view of the real budget (DEL) available to the Scottish government following the CSR. The real fall in the Scottish DEL of -10.6% is lower than the fall in the overall UK DEL because of the differential pattern of spending cuts across departments and the workings of the Barnett formula. Comparable programmes such as health and education have been significantly protected in the UK, in real terms, rising - for the resource element - by 1.3% in the former and falling by -3.4% in the latter. However, the cut in the Scottish government's capital budget is at -38% greater than the -29% cut in capital budgets in the UK. This is again due to the pattern of UK cuts and the operation of the Barnett formula. Two Barnett comparable capital programmes have been cut significantly in the UK: school building, house building, and hospitals, so that by 2014-15 the capital budgets of: Education is to be cut by -60%, CLG Communities is to be cut by 74%, and NHS capital is to be cut by 17%.
Table 6: Scotland's DEL - Treasury view
£bn in real terms
2010-11 2011-12 2012-13 2013-14 2014-15 % change Resource DEL Excl depreciation
24.8 24.3 24.1 23.7 23.1 -6.8
Change -0.5 -0.3 -0.4 -0.5
Capital DEL 3.4 2.5 2.4 2.1 2.1 -38.4
Change -0.9 -0.1 -0.3 0.0
Total DEL 28.2 26.8 26.5 25.7 25.2 -10.6
The Scottish government take a slightly different view from the UK Treasury of their budget. This is shown in Table 7. Table 7: Scotland's DEL - Scottish government view
£bn in real terms
2010-11 2011-12 2012-13 2013-14 2014-15 % change
Resource DEL 25.3 24.3 24.1 23.7 23.1 -8.6%
Change -1.0 -0.3 -0.4 -0.5
Capital DEL 3.3 2.5 2.4 2.1 2.1 -36.5
Change -0.8 -0.1 -0.3 0.0
Resource non-cash DEL 0.6 0.6 0.7 0.7 0.7 16.7
Total DEL 29.2 27.4 27.2 26.4 25.9 -11.3
PAGE 16 VOLUME 34 NUMBER 2

FRASER ECONOMIC COMMENTARY
The difference between the two views largely amounts to the Scottish government's inclusion in the 2010-11 baseline of Scotland's £387m share of the £6bn emergency cuts introduced by the UK coalition government after the election, which the UK government agreed could be postponed until fiscal year 2011-12. The Treasury has removed this sum from the 2010-11 baseline while the Scottish government includes it. The Scottish government also includes end year flexibility (EYF) monies drawn down in its 2010-11 figure, plus depreciation. The result is a slight difference in the real cut over the period, -10.6% for the Treasury, and -11.3% for the Scottish government. But the big problem is the change between this fiscal year and the next fiscal year. There is a real cut of £1.8bn according to the Scottish government figures and a smaller real cut of
£1.4bn. In cash terms, the two figures are £1.3bn and £0.9bn. While the Treasury's logic for removing the postponed cuts from the 2010-11 baseline seems correct according to accounting convention, the Scottish government is also correct to highlight the fact that spending in cash terms will be £1.3bn lower next year. We have taken the expected real cut in the Scottish DEL to be 11% by 2014-15 and undertaken the same analysis using our computable general equilibrium model (CGE) that was presented in the previous Commentary. In that analysis a 14% DEL cut was assumed. The new job and GDP estimates are provided in Table 8.
Table 8: Impact on GVA and Jobs of an 11% cut in Scottish DEL
Jobs GVA Fixed price Flex price Fixed price Flex price
Private services -35,087 6,382 -2.86% 0.36%
Manufacturing -2,207 3,028 -0.75% 0.72%
Construction -4,887 533 -3.39% 0.11%
Other private -449 575 -0.99% 0.86%
Private total -42,630 10,517 -2.12% 0.48%
Public -70,853 -59,104 -8.31% -6.72%
Total -113,483 -48,587 -3.46% -1.07%
As before there are two simulations: a fixed-price analysis, where the cut in DEL leads to a straight reduction in the demand for goods and services produced in the Scottish economy; and a flex-price analysis, where wages and output prices respond to changes in demand and substitution is possible. Total job losses range from - 49, 000 in the flex-price case to -113,000 in the fixed-price case, with GVA falling by just over -1% and just under -3.5%. Public sector job losses range from just under 60,000 to little under 71,000. Private sector job losses are moving towards 43,000 in the fixed price case but when wages and prices are flexible there is a private sector job gain of 10,500. In this latter case, as before, there is a 'crowding-in' effect on private sector activity due to the fall in wages and intermediate input prices improving the competitiveness of the sector. However, the 'crowding-in' effect is relatively weak and certainly insufficient to offset the public sector job losses. Of course, the Scottish government has options which in effect may change the measured Scottish structural and behavioural relationships that are present in our model. If these are exercised the GVA and job loss could be lower.
Scottish government budget options The excellent Independent Budget Review (IBR) considers cost savings and revenue raising options as a means of limiting cuts to front-line services. Some indication is also provided by IBR on where spending cuts might be made. But it is highly unlikely that the need for spending cuts will be removed by the adoption of some of these other options. What is required is the adoption of a rational process that links fiscal consolidation to the objectives of the Scottish government. Economic stabilisation, economic growth and social justice would appear to be key. And these objectives may be mutually exclusive to some degree: a potential trade-off between equity versus efficiency and growth. For example, the CBI seems to think so and is asking the UK and Scottish governments to prioritise spending on supporting growth e.g. infrastructure at the expense of welfare payments. But how much one should trade-off equity for growth and efficiency is a value judgement and hence a political decision. That said, we would argue that spending cuts should be applied according to the rules of a rational choice model. Blocks of spending should be defined at least to Level 4, but ideally, in certain areas, further below. Cuts should then be applied first to those spending areas where the marginal
NOVEMBER 2010 PAGE 17

FRASER ECONOMIC COMMENTARY
value per pound spent to government – and hence the electorate and wider community – is least. This would rule out ‘salami slicing’ and suggests that some functions/services with low marginal value should be removed altogether. The application of this principle would rule out ring-fencing Level 1 spending areas such as the health budget, and hopefully, would also rule out ring-fencing of Level 2 and 3 spending areas. This is because ring fencing implies that every activity upon which money is spent in the health budget has a higher marginal value per pound spent than spending activity under all other budgets - an unlikely proposition. However, some health spending will have a very high marginal value, perhaps spending on treatment of cancer and heart disease. It is rational to protect such areas, subject to the scale of the overall reduction in the assigned budget. The government will not want the fiscal adjustment to destabilise the economy or damage long-run economic growth, which it is seeking to raise. We would offer the following guidance to help protect these important objectives. Stabilisation The aim should be to minimise the effect of fiscal consolidation on demand in the economy, so reducing secondary job losses. There is a limited role here for the government of a small open economy. But where cuts have to be made, or charges and taxes introduced, the changes should focus on spending areas with lower employment effects and income effects e.g. public administration rather than social work activities; on recipients who have lower marginal spending propensities from income received e.g. the rich as opposed to the poor, and on consumption rather than investment expenditures. Cutting public investment can contribute to a reduction in aggregate demand in the economy as well as affecting growth. High quality academic research by Alesina and Perotti in 1996 notes that “ … fiscal adjustments relying primarily on tax increases and cuts in public investment tend not to last and are contractionary.” Against this background it is disappointing to note that capital spending has been cut disproportionately at the UK level as part of the fiscal consolidation. The Scottish government's capital budget is being cut by 36% to 38% by 2014-15, It is essential that the government explores all means possible to protect public capital investment, including the most effective funding mechanisms. One possibility would be for funds to be transferred from the resource - or current spending - budget to capital spending, which is allowed within the rules. Economic growth The aim here should be to protect the supply potential of the Scottish economy and the drivers of growth. Research suggests that innovation and R&D are critical to growth with investment especially in infrastructure, enterprise, and skills
also having an important role to play. Therefore the government should consider how best to focus and protect spending in such areas. Innovation and R&D: The government should continue to do everything it can to help the private sector undertake R&D and innovate, include facilitating technology transfer. This requires the protection of university research and policies to enhance commercialisation. Infrastructure projects and investment: We noted above the importance of investment to stabilisation. It is also important to growth. But the issue isn't simply about trying to protect public investment. It is important to continue to encourage private sector investment and seek to remove any market or institutional obstacles that stand in its way. Inward FDI and related export promotion must continue to play a crucial role in Scottish economic growth allowing us to link into world growth hubs. Policy effort in this area should not be reduced. Enterprise: Scottish Enterprise and the enterprise network is an easy target for many people. Yet, Scotland has a sustained history of a low-business birth-rate and weak business enterprise: viz. low innovation and R&D. There are legitimate questions about how the SE and the network secures it’s goals but abolishing and returning the function to the civil service is not the answer as the Welsh experience shows. Skills: Are important to regional competitiveness, to attracting FDI and hence to growth. But they are necessary for growth not sufficient. A dynamic economy with high productivity firms will attract in skilled workers from other regions and nations. All of which begs the question whether we need the skills development policy infrastructure that we currently have? So, faced with the biggest fiscal cutback for many a year, the Scottish government should be bold and imaginative. There are other options to spending cuts but it is unlikely that the need for spending cuts can be removed by these other options. Cuts should follow a rational choice rule where activities of least marginal value per pound spent are cut first. This would rule out ‘salami slicing’ and ring fencing of whole budget areas such as health spending. And, in the light of the Government’s economic stabilisation and growth objectives, efficient policy spending that promotes the drivers of growth should be protected. Will the fiscal consolidation work? The UK coalition government is seeking to remove the UK's structural budget deficit and stabilise its debt position by the end of the present Parliament in 2015. But there are many risks and uncertainties to be confronted along the way.
PAGE 18 VOLUME 34 NUMBER 2

FRASER ECONOMIC COMMENTARY
An economy is not like a household where steps taken to balance the budget will work providing the household is disciplined enough to stick to the plan. At the economy level there are significant interdependencies and uncontrollable factors that will affect the outcome. The key factor is the growth of the economy. If the UK and Scottish economies improve their pace of recovery from recession so that growth is more than sufficient to offset the 6% to 7% fall in aggregate demand caused by the fiscal consolidation, then a future recession will be avoided. But growth will have to be considerably faster if unemployment is to stabilise and then fall. Faster growth is also required in order to ensure that tax revenues rise, transfer payments fall and the government's finances improve as the coalition hopes. There are favourable precedents. In the UK in 1991 at the end of that recession public sector employment stood at just over 6 million . In the next 4 years 650,000 jobs were lost and 850,000 by 1997. The UK managed this adjustment with an overall rise in employment as the economy grew by 3.1% per annum. On present UK government plans some 490,000 public sector jobs are to go. However, the problem is that the recent recession was so much more severe than in the early 1990s. The Office of Budget Responsibility is forecasting growth of 2.6% per annum and many private forecasters consider that projection to be too optimistic. For example, the National Institute for Economic and Social Research forecast in late October that the UK economy will be much weaker than the OBR predicts. NIESR predicts that a recession will avoided but a projected weaker recovery and the fiscal brake on growth means that the public finances improve much more slowly than the OBR and the UK government expects. With so much spare capacity after the recession, and a weaker Scottish recovery there appears little hope that the fiscal cutbacks will 'crowd in' much private sector growth here in Scotland. Worse, the fiscal cutbacks may damage business and consumer confidence so weakening private sector growth at a time when the world recovery from recession is faltering. Added to this, despite the many bright spots in the Scottish economy, Scotland's record of weak entrepreneurship, a low business birth rate, inadequate research and development and low innovation, makes one cautious that we can secure the growth in investment and exports that is required. Forecasts In the Scottish and UK economies the recovery from recession strengthened appreciably in the 2nd quarter of this year. Recent preliminary UK data for the 3rd quarter indicates some weakening but at 0.8% over the quarter growth exceeded expectations. Scottish GDP growth fell again in the first quarter, by -0.2%, and with zero growth in 2009q3 and 0.1% growth in the final quarter of 2009, there is a case for arguing that the Scottish economy did not
emerge from recession until the 2010q2, two quarters after the UK. The Scottish economy went into recession one quarter later than the UK. The fall in Scottish GDP during the 'recession' to 2010q1 was therefore -5.81% compared to a fall of -5.83% during the recession in the UK, an almost identical outcome. But with growth of 1.3% in the 2010q2, compared to 1.2% in the UK, the Scottish bounce back was considerable. However, there is reason to believe that an unsustainable bounce back in construction and re-stocking were key reasons for the strength of the recovery in the second quarter which would tend to fade away in later quarters. The 0.8% preliminary estimate of UK 3rd quarter growth in part appeared to contradict that assumption, but construction growth remained strong to the incredulity of many associated with the industry. We still await further data to ascertain the spending composition of the 3rd quarter UK growth rate and whether temporary re-stocking was still a principal driver, or whether there had been a pick-up in more sustainable export and investment growth. In the absence of 3rd quarter Scottish GDP data until publication in late January, we must rely on survey evidence. This suggests a weakening in Scottish growth, but sectors with a strong export focus such as engineering continued to recover, perhaps buoyed by a favourable sterling exchange rate. Those sectors and companies relying more on domestic demand appeared less robust, as household and corporate confidence weakened, perhaps in part due to the uncertain prospect raised by the forthcoming public spending cuts. Business confidence and optimism about the future remained largely weak. There are concerns about bank lending, especially in construction, as bank deleveraging raises the likely cost and availability of funding loans for new investment and for refinancing of existing debt. The UK monetary policy environment remains supportive with interest rates held at 0.5% but with additional monetary expansion - quantitative easing via the Asset Purchase Facility - put on hold at the most recent MPC meeting. UK inflation stands at 3.1%, high by international standards, so the MPC must trade off potential inflationary risk against the prospect of weakening growth and a continuing output gap. Fiscal policy is markedly contractionary, as the discussion above on the Comprehensive Spending Review (CSR) notes, and there is considerable uncertainty whether private sector growth will pick up sufficiently to offset the planned contraction in public spending. A private sector recovery is currently much dependent on the growth of exports and investment because household spending remains subdued as families deal with the aftermath of the financial crisis and recession. Companies are becoming cash rich as rising profits has increased their cash holdings. They are therefore in a position to begin investing on a much increased scale. Companies main concern will be uncertainty about demand and export demand in particular. While there is clear evidence of growth in the world economy, the weakness of the US economy is a cause for concern. The latest US jobs
NOVEMBER 2010 PAGE 19

FRASER ECONOMIC COMMENTARY
PAGE 20 VOLUME 34 NUMBER 2
figures, indicating 150,000 net new jobs created in October, should be acknowledged and welcomed. But employment in the US is still 7.5 million below the level before the recession and high levels of unemployment would, given population growth, continue for many years if future jobs growth continued at that rate. The concern about the economy is shared by the Fed prompting it to introduce this week a new programme of quantitative easing. Opinion is divided on the likely efficacy of the initiative in raising US growth. But the likely depressing effect on the nominal dollar exchange rate while tending to raise global demand, other things equal, appears to be worsening the 'currency wars' problem with China in particular as it seeks to defend against capital inflows, upward pressure on the renminbi and loss of international competitiveness. In sum, the risk is increasing of protectionist responses that slow the growth of
world trade and the global recovery even as global demand is rising. It is against this background that we have prepared our latest forecasts. The underlying background, assumptions and predictions are discussed fully in the Forecasts of the Scottish economy section below. We present here only a summary of the main results. GVA Forecasts Table 9 presents our forecasts for Scottish GVA - GDP at basic prices - for 2010 to 2012. As before we present a central forecast, which we hold to be most probable and high growth and low growth forecasts which define the range of outcomes in which Scottish growth is likely to fall. In the subsequent discussion we concentrate mainly on the central forecast.
Table 9: Forecast Scottish GVA Growth in three scenarios, 2010-2012
GVA Growth (% per annum)
2010
2011
2012
High growth 1.3 2.1 2.4 June forecast 1.4 2.1 2.8
Central 1.0 1.1 1.9 June forecast 0.7 1.1 2.1
Low growth 0.5 0.3 1.0 June forecast 0.0 0.1 0.7
Positive growth is forecast in all years and on all 3 scenarios. GVA growth at 1% is forecast to be stronger this year than in our June forecast of 0.7%. Household spending is recovering but increases only marginally this year, then increases slightly in 2011 and is close to trend in 2012. The rise in planned welfare cuts since our last forecast will take out nearly £2bn of demand from Scottish household by 2014-15. The timing is uncertain but we expect it to contribute to the weak growth of household spending. Export growth picks up this year as the growth of world trade recovers. There is strong positive growth for Scottish exports both to rest of world and rest of UK, with the latter weaker due to the fiscal consolidation. Investment growth in 2010 is revised up from our June forecast and the rebound continues into 2011 and 2012 after a recession that produced one of the most severe contractions in investment in modern times. The fiscal consolidation has broadly the
same aggregate impact as forecast in June with Scotland experiencing a major cut in public spending on both resource and capital account next year. All these reasons taken together lead to a forecast of 1.1% GDP growth in 2011 and 1.9% in 2012. That is the same as the June forecast for 2011 but slightly lower for 2012. Our fear is that the greater welfare spending cuts may dampen growth in 2012 compared tom our previous forecast. Compared to the UK these forecasts suggest that the recovery continues to be weaker in Scotland than the UK, especially in 2011. Employment forecasts Table 10 presents our forecasts for net employee jobs for the 3 years on the 3 scenarios.
Table 10: Forecast Scottish net jobs growth in three scenarios, 2010-2012
2010 2011 2012 High growth -7,000 42,300 50,404
June forecast -20,399 35,142 53,059 Central -12,794 21,224 39,141
June forecast -33,546 14.856 44,612 Low growth -22,700 4,400 21,100
June forecast -48,129 6,036 6,615

FRASER ECONOMIC COMMENTARY
Table 10 indicates that our jobs forecast for 2010 is appreciably different from June on all scenarios. This is in part due to changes in the latest official employee jobs data, which significantly revises down estimates for employment in 2009. Our lower forecast takes account of that. In addition, our employment forecasts also reflect stronger predicted GDP growth in some scenarios and years after allowing for a changing forecast of productivity increases. Net jobs grow by -0.6% in 2010, +1.0% in 2011, and +1.8% in 2012. By 2012 total jobs are forecast to be around 47,000 lower than the last peak in 2008. By sector, the burden of
jobs losses is borne by the service sector in 2010 with net job losses of just under 14,000. Construction loses just above 900 jobs this year, while jobs are gained - just under 2,000 - in production as manufacturing especially expands. Positive but fairly weak jobs growth occurs in all aggregate sectors in 2011 and 2012. Unemployment forecasts The key unemployment forecasts are summarised in Table 10 below.
Table 11: ILO unemployment rate and claimant count rate measures of unemployment under each of the three forecast scenarios
2010 2011 2012 ILO unemployment rate High growth 9.1% 9.6 8.2 Central 9.3% 10.7 9.7
Numbers 245,056 286,821 261,730 Low growth Claimant count rate High growth 4.8% 5.1 4.3 Central 5.2% 5.9 5.4
Numbers 143,214 167,623 152.959 Low growth 5.9% 7.2% 7.0%
The ILO rate is our preferred measure since it identifies those workers who are out of a job and are looking for work, whereas the claimant count simply records the unemployed who are in receipt of unemployment benefit. We noted in the discussion above of labour market performance during the recession that while job change is a key determinant of unemployment, it also depends on movements in inactivity i.e. the numbers not looking for work. We noted how inactivity rose last year in Scotland. The paradox is that as job prospects pick up inactivity can fall and unemployment may rise. We predict that unemployment will continue to rise into next year peaking at around 286,000 before falling to just under 262,000 in 2012. Brian Ashcroft 5 November 2010 ____________________ Endnotes 1 The latest data include the implementation of significant methodological developments and improvements to the data: updated weights to 2007; benchmarking to input-output data to 2007; replacement of panel estimation with ratio estimation for production industries; and introduction of an improved measure for health service output.
2 In the statistical work on Okun's Law that we discuss below there is a suggestion that the growth required to keep unemployment stable in the 2000s was 0.6% per quarter in the UK compared to 0.5% - over a little longer period - in Scotland.
NOVEMBER 2010 PAGE 21

FRASER ECONOMIC COMMENTARY
The Scottish
economy
Forecasts of the Scottish economy
Economic background As developed economies across the world adjust and recover from the global financial crises and the recession of 2008-9, recent data suggests that after four quarters of negative growth, Scotland has (in Q2) seen a quarter of growth largely outwith most expectations. This has come on the back of three quarters of anaemic growth performance (0.0%, 0.1% and -0.2%) while the unemployment rate and level has continued to increase. While this apparent dichotomy is analysed in more detail in an earlier section, the response of the labour market to changes in the level of activity will be important for our forecasts of both. The UK monetary policy environment remains generally supportive, even in light of continuing above target inflation figures, given continuing uncertainty about the strength of the recovery. The Bank of England’s monetary policy committee (MPC) has kept interest rates on hold at 0.5%, where they have now remained for twenty-one months. The level of assets purchased through the Asset Purchase Facility (APF) remains at £200 billion. The minutes of the MPC’s October 2010 meeting reveal fears that the stronger than anticipated return to growth seen in the first half of 2010 will not continue into the second half, and a “modest deceleration” in growth as the inventory cycle fade. With UK inflation remaining above target at 3.1% in September, the MPC was divided on its decision. The votes reveal that most (7) of the (9 member) MPC voted to keep interest rates at the same level, and the size of the APF unchanged, with one member arguing for an increase in interest rates, and another voting for no change in the rates, but an expansion of the APF facility. The Bank’s November Inflation report (due for release after this Commentary) should make interesting reading, as additional information on the extent of spare capacity, the outlook for inflation, and activity becomes known. It would appear that the majority of members of the MPC continue to see an expansion of the APF as being more likely; however this will depend on the changes in key variables revealed in forthcoming data. The much anticipated Comprehensive Spending Review reported on the 20th of October 2010. This has set out the Conservative-Liberal Democrat coalition government’s spending plans for the four (financial) years starting in April 2011. Looking firstly at the spending allocated to the Scottish Government through the HM Treasury calculated Barnett formula, Scotland’s per capita share of proportionate changes in comparable programme spending in England decides the changes in the funding allocated to Scotland. The outcome of the CSR is that (in real terms) the Resource budget for Scottish Government spending will be reduced by 6.8% over the four years to £25.4 billion, while the Capital budget for Scotland is to fall by 38% to £2.3 billion. As we
PAGE 22 VOLUME 34 NUMBER 2

FRASER ECONOMIC COMMENTARY
NOVEMBER 2010 PAGE 23
noted in June’s commentary, reductions in expenditure will, other things being equal, reduce demand in Scotland and so dampen economic activity. That being said, the outturn figures from the CSR suggest a (slightly) smaller than expected decline in overall spending, and less than anticipated in the Chief Economic Advisor’s June scenarios for Scottish public expenditure. The counterpoint to slightly smaller reductions in government spending is larger reductions in payments direct to Scottish households through the (UK) the welfare system. These will have an additional knock-on impact on household spending, although the specific timing of these reductions, and the particular Scottish incidence of these, are not yet known. The spending decisions of the Scottish Government will be announced later this year, with debate in the Scottish Parliament early in 2011. We intend to focus on the impact of these spending decisions for the Scottish economy as the Scottish Budget process continues, and report on this in the Commentary in the new year. In parallel developments, in the last month the Scottish Government, through their Scottish National Accounts Project (SNAP), has released “experimental” “in development” data in the form of a series of Quarterly National Accounts for Scotland, dating back to Q1 1998. This is a phenomenal dataset, which should provide great opportunities to study, in never-before-available detail, the dynamics of economic change in Scotland over the last twelve years. From this, for instance, we can see that (central and local) government spending in Scotland – i.e. non-capital spending – constitutes around 25% of Scottish GDP, although this has risen in the last year as GDP fell and government spending didn’t fall by as much. Given this, the scale, and impacts, of next years changes in government spending will have important consequences for the Scottish economy. The Scottish economy In the last quarter for which data are available (Q2 2010, published on 20th October 2010), Gross Value Added (GVA) for Scotland rose by 1.3% from the previous quarter (Q1 2010). This was the largest quarterly increase in Scottish GVA in four years, and comparable to the 1.2% growth for the UK seen in Q2 2010. Only six quarters since data for Scotland began in 1995, saw a higher rate of quarterly growth than that measured in Q2 2010. However, growth in Q1 2010 was revised downwards from 0.0% to -0.2% meaning that we have not seen two consecutive quarters with the same direction of growth since the declines observed in Q2 and Q3 2009. The length of the recession in Scotland has now been revised with the latest data released, and shows that Scotland saw four quarters of declining GVA: from Q3 2008 to Q2 2009. Since then, growth of 0.0%, 0.1% and -0.2% showed an anaemic recovery, and while Q2 2010’s growth figure showed a significant increase above this level, specific (one-off) factors might explain this, and downside risks remain for future growth. This said, the fact that these latest GVA data suggest that in many Production sectors,
and the Construction sector, significant positive growth was observed, there would appear to be some encouraging signs. Overall, growth in the Service sectors was weak. The Scottish “Manufacturing” sector, accounting for 13.0% of Scottish GVA, was up slightly (2.2%) during Q2 2010, and has recovered all the losses from 2009. It remains, however, around 9% lower than its pre-recession peak. The largest sector within Manufacturing – “Engineering and Allied Industries” – grew by 5.6% in the last quarter, while there was also growth in “Metals and Non-metal products” and “Chemicals and Man-made Fibres”. “Food, drink and tobacco” GVA fell slightly on the quarter, with declines in the “Drink” sector not enough to offset the growth in the “Food” sector. “Drink” sector GVA has been less badly affected than most other sectors in the Scottish economy, and is up almost 4% over the last year. It is perhaps surprising, but undeniably encouraging, that after a year and a half of decline, Q2 2010 has given us a picture of positive growth across much of the Production side of the Scottish economy. “Construction” in Scotland (accounting for 7.6% of GVA) was up a spectacular 10.4% in Q2, making up most of its decline since Q3 2008. Over the year, it was down 3.2%. The reasons for this rebound might include good weather allowing the completion of properties, or the following through of investment plans postponed by the recession. This would necessitate a cautious position regarding the ability of the sector to continue to grow at this rate. Certainly, Scottish Government revisions to GVA estimates produced since the last time we reported in June 2010 have particularly affected our previous understanding of the dynamics of the “Construction” sector. The largest revisions to its previous growth rate were seen in this sector when statistics were benchmarked against improved data. The strong pro-cyclical nature of this sector would be expected to be useful as a barometer for the strength of the investment outlook in the Scottish economy, and improved data on this sector is certainly to be welcomed. The Service industries (responsible for just under 74% of Scottish GVA, and 83% of jobs in the Scottish economy in December 2009) grew by 0.3% in Q2 2010. Like the economy as a whole, the four recent quarters have seen alternative positive and negative growth rates. The sector was down 1.2% over the year so far. Within the Service industries, the strongest growth in Q2 2010 was seen in “Retail and Wholesale” (+1.8%) and “Real estate and business services” (+1.7%). Over the year however, only “Retail and wholesale” (+1.4%) and “Public admin, Education and Health” (+0.0%) did not contract. None of the three sub-sectors in “Public admin, Education and Health” grew in Q2 2010, while “Public administration and defence” shrank by 0.2%. Labour market developments in Scotland to the end of August 2010 (published in October 2010) showed that employment (aged 16+) was up by 10,000 over the most

FRASER ECONOMIC COMMENTARY
Box 1: The link between GVA growth and unemployment rate changes Okun’s Law (Okun, 1962) is a statistical relationship which shows the tendency for periods of economic growth to be associated with a growing demand for labour inputs, and so a declining unemployment rate, and vice-versa. The relationship between GVA growth and the unemployment rate therefore we would expect to be negative. This specific relationship has been widely tested in the economic literature, both for nations and regions. We can use the history of changes in GVA and the unemployment rate to estimate this relationship for the UK and Scotland. Our intention is to begin to shed light on the extent to which recently observed changes in the unemployment rate would be consistent with the scale of GVA growth over this period. If this relationship has changed recently, we attempt to examine if there has been a “break” in the longer-term relationship between these variables, which could coincide with the recession of 2008-9. For the UK as a whole, we have quarterly data from 1971Q1 to 2010Q2. We estimate the “difference” version of Okun’s Law which links changes in the unemployment rate (∆ur) to changes in GVA (∆GVA) and an intercept term (α): (∆ur) = α + β(∆GVA) We are interested in the coefficients (α and β (“Okun’s coefficient”)) estimated from this equation, since β gives us the change in the unemployment rate which is associated with a 1% change in GVA. The formula (-α/β) gives us the rate of quarterly GVA growth which would be associated with a stable unemployment rate (i.e. is neither increasing or decreasing) (Knotek, 2007). Estimating this equation for the UK as whole over 1971Q1 to 2010Q2, we get the results below. Figure B1
y = ‐2.2309x + 0.0165R² = 0.2966
‐0.100
‐0.050
0.000
0.050
0.100
0.150
‐0.040 ‐0.030 ‐0.020 ‐0.010 0.000 0.010 0.020 0.030 0.040 0.050
Quarterly ch
ange
in un
employmen
t rate
Quarterly change in GVA
UK GVA change and unemployment rate change, 1971Q2‐2010Q2
Boxes in red are six quarters of negative GVA growth between 2008Q2 and 2009Q3
The negative relationship between changes in the unemployment rate and GVA growth is observed, with a β coefficient of -2.23. This means that a 1% change in the GVA growth rate is associated with a change in the unemployment rate of 2.23%. For the UK over this period, a quarterly growth rate of (-0.0165/-2.2309) 0.7%, corresponding to an annual growth rate of 3.0%, would be needed to maintain the unemployment rate at a stable level. We see from Figure B1 that many quarters have seen outcomes for GVA and unemployment rate changes different from that predicted by the line of best fit. Points above the line of best fit show where the increase in the unemployment rate has been greater than that which would be suggested by the estimated relationship. Points below the line suggest unemployment rate outcomes that have been “better” than would be expected for a given GVA change. Four of the six periods of negative GVA growth in the recent recession show large distance from this line (these are shown in red in Figure B1).
PAGE 24 VOLUME 34 NUMBER 2

FRASER ECONOMIC COMMENTARY
The Okun’s Law relationship for the UK is however not stable over time. Simply estimating the relationship for each decade in turn we see large changes, particularly for the 1970s compared to the rest of our sample. This is consistent with much of the literature on Okun’s Law (Knotek, 2007). A number of studies have found that the value of “Okun’s coefficient” is quite different in periods of recession, as well as recent dynamics which appear to suggest a breaking down of the simple relationship between these variables as given by the equation above (Knotek, 2007). For Scotland, as might be expected, we have less data than is available for the UK. Our quarterly GVA series only goes back to 1995 Q1, meaning that we have 62 quarters worth of data on GVA growth and the unemployment rate. Estimating the difference version of Okun’s Law for our Scottish sample, we find: ∆ur = 0.0163 – 3.2265 (∆GVA) Meaning that each 1% change in GVA is associated with a 3.2% change in the unemployment rate in that quarter. The (annual) level of GVA growth consistent with a stable unemployment rate is estimated to be 2.0%. For the UK over the same period, we estimate the following relationship: ∆ur = 0.0193 – 3.8521 (∆GVA) The (annual) rate of GVA growth for the UK consistent with a stable unemployment rate is also 2.0%. Therefore, the data suggests, firstly, that over this sample period the unemployment rate in the UK is more sensitive to GVA changes than it is in Scotland, and, secondly, that the GVA growth needed for stable unemployment is comparable in these two datasets. Without further analysis and access to a longer term time series, we are cautious in our conclusions. We can, however, examine how these relationships have fared during the recession of 2008-9. Estimating for the pre-recession period as well as the recession period, we get the following results. (For comparison we include the results again over the whole sample). Table B1
Scotland UK Period Q1 1995-Q2
2010 Q1 1995-Q2
2008 Q3 2008-Q2
2010 Q1 1995-Q2
2010 Q1 1995-Q2 2008 Q3 2008-Q2 2010
β -3.2265 * -4.1632 -3.8521 -2.0788 -3.9541 α 0.0163 * 0.0682 0.0193 0.0054 0.0287 (-α/β) 2.04%�p.a. * 6.71% p.a. 2.02% p.a. 1.04% p.a� 2�9���p.a.
Notes: * indicates that coefficients are not statistically significant, and so we do not report these. This would be consistent with the line of best fit being horizontal, with no significant relationship between GVA growth and unemployment rate changes. The Okun’s coefficients (β) estimated suggests that there has been a break in the relationship over the whole fifteen-year sample, in the last eight quarters. Instability in the Okun’s coefficient are a typical feature of this relationship, and have been explained by a changing relationship between unemployment rate changes and GVA growth in periods of recession, as well as changing relationships between these two variables over the last thirty years. Our estimates suggest that the sensitivity of unemployment rate changes to given changes in GVA has increased significantly during the recession for Scotland more than for the UK as a whole. This would be consistent with the line of best fit in Figure B1 becoming “steeper”. As noted above, further research into this apparently simple macroeconomic relationship could investigate the extent to which the large increases in unemployment rates are indicative of a changing relationship between that and GVA growth. We intend this to be an initial illustrative assessment of this relationship, to which we intend to return in later issues. References Knotek, E.S. (2007), “How useful is Okun’s Law?”, Economic Review, Federal Reserve Bank of Kansas City, 4th Quarter 2007, p. 73-103. Okun, A.M. (1962), “Potential GNP: Its measurement and significance”, American Statistical Association, Proceedings of the Business and Economics Statistics Section, pp. 98-104.
NOVEMBER 2010 PAGE 25

FRASER ECONOMIC COMMENTARY
PAGE 26 VOLUME 34 NUMBER 2
recent quarter, but down by 53,000 over the year. Between June and August 2010, employment of those aged over 16 stood at 2,452 thousand. The employment rate for those aged 16 to 64 has fallen by 1.6 percentage points over the year, while it has risen by 0.2 percentage point in the last three months, and now stands at 70.3%. Rising labour market inactivity had been a continuing feature of the Scottish labour market over the recent past and has fallen (slightly) in the last quarter. Inactivity of the 16-64 age group fell by 0.5% in the last three months, with inactivity standing at 779,000. Over the year, the largest increases in reasons for inactivity given were studying (up 15,000) and those who wanted a job (up 9,000). The data on inactivity suggest that increases in inactivity rates are especially high in the 16-17 age group, and males 18-24. Looking at unemployment, the number of people over the age of 16 who were unemployed rose by 13,000 compared to the previous three months. The rate of increase in unemployment increased from a 10,000 increase in unemployment in the previous three months, and these are significant increases. Over the last year, the numbers of unemployed rose by 37,000. As of June to August 2010, the ILO level of unemployment stood at 231,000. The preliminary estimate of those receiving unemployment-related benefits – a more up to date, but less complete, measure of unemployment than the ILO definition - stood at 134,500 in September 2010. It therefore remains at a level comparable to one year ago. The possible increasing “dislocation” between GVA changes and unemployment rate changes is discussed in more detail in Box 1. While the number receiving unemployment benefits has fallen since January 2010, and the rate of those in work or receiving benefits who do receive benefits has reduced from 5.0% to 4.8% over this time, the level of “claimant count” unemployment is nine thousand higher than May 2009. Over the year, (a net) 2,600 more women have begun receiving unemployment benefits, while (a net) 6,900 men have moved off Jobseekers Allowance. The aggregate picture of falls in the number of claimants since January 2010 appears to be driven by the movements of male claimants, as the number of female claimants has increased month on month since the start of 2009. Final demand and recent trends The Fraser of Allander Institute (FAI) forecasting model acknowledges the drivers of economic activity in the Scottish economy to be (household) consumption, (central and local) government spending, investment, tourism and exports (to the rest of the UK and the rest of the World). For all three scenarios considered – High, Central and Low - recent movements in each of these measures, and most up-to-date survey evidence for future trends, are discussed below. As noted earlier, first (albeit “partial” and “experimental”) Quarterly National Accounts for Scotland were released as
part of ongoing work in the Scottish Government’s Scottish National Accounts Project on the 20th of October 2010. These provide quarterly series for GDP (I) and GDP (E) dating back from Q2 2010 to Q1 1998. This is vitally important data for our understanding of past and current activity in the Scottish economy and its publication is to be applauded. These data in this publication have however, come too late to be systematically incorporated into this issues forecast – although we make use of this data where it appears to be superior to that which we had previously. For instance, there was previously no Scottish series for Investment, and so those data on Scottish Investment expenditures are incorporated in this issue. We look forward to closer examination of all those data in the Quarterly National Accounts for Scotland over the coming months and future Commentaries. Consumption Data on household consumption expenditures in Scotland being developed by the Scottish Government through the Scottish National Accounts Project (SNAP) were published on 20th of October 2010 in the Quarterly National Accounts for Scotland discussed in the paragraph above. These showed that Q2 2010 saw the fourth quarter of increases in nominal household expenditure, following three earlier quarters of reductions (Q4 2008 to Q2 2009). These figures are in ‘Nominal’ terms however, so the real increase in spending will be lower, and may be negative since the quarterly increase is less than the quarterly RPI series for the UK. This confirms the evidence from previous quarters that the reduction in household expenditure is moderating, but it is unlikely that this growth in nominal expenditure is signalling a return to strong positive real growth in Scottish household consumption expenditure. The introduction of 20% VAT from 1st January 2011 may be expected to, other things being equal, cause households to bring some (non-perishable) purchases forward to Q4 2010, so we would expect that Q1 2011 may see a slowdown in household expenditures. Furthermore, and while there appears to be uncertainty over the specific timings, any reductions in household incomes from changes to the UK welfare payments system would be expected to, over the coming years, cause household spending to be lower than it otherwise would be. The specific incidence on Scotland of these changes remains to be understood, as does its timing. As previously noted in Forecasts, household credit facilities are understood to have been crucial for the (pre-crises) growth of household expenditure, in turn funding the the movement of the Scottish economy towards a more service-oriented structure, with the provision of goods for household consumption. The decline in the availability of credit facilities to households, as well as households continued reluctance to take on credit in uncertain economic conditions as they rebalance and pay down debts, will continue to dampen household spending over the coming quarters, and perhaps years.
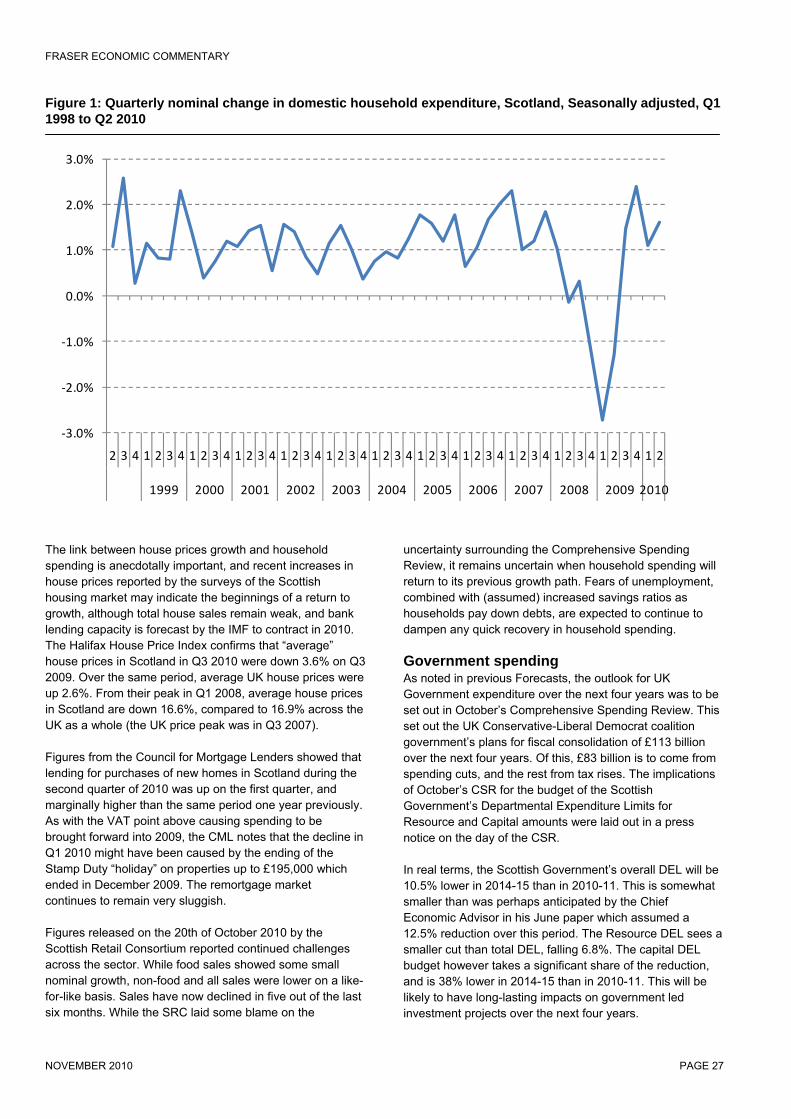
FRASER ECONOMIC COMMENTARY
Figure 1: Quarterly nominal change in domestic household expenditure, Scotland, Seasonally adjusted, Q1 1998 to Q2 2010
‐3.0%
‐2.0%
‐1.0%
0.0%
1.0%
2.0%
3.0%
2 3 4 1 2 3 4 1 2 3 4 1 2 3 4 1 2 3 4 1 2 3 4 1 2 3 4 1 2 3 4 1 2 3 4 1 2 3 4 1 2 3 4 1 2 3 4 1 2
1999 2000 2001 2002 2003 2004 2005 2006 2007 2008 2009 2010
The link between house prices growth and household spending is anecdotally important, and recent increases in house prices reported by the surveys of the Scottish housing market may indicate the beginnings of a return to growth, although total house sales remain weak, and bank lending capacity is forecast by the IMF to contract in 2010. The Halifax House Price Index confirms that “average” house prices in Scotland in Q3 2010 were down 3.6% on Q3 2009. Over the same period, average UK house prices were up 2.6%. From their peak in Q1 2008, average house prices in Scotland are down 16.6%, compared to 16.9% across the UK as a whole (the UK price peak was in Q3 2007). Figures from the Council for Mortgage Lenders showed that lending for purchases of new homes in Scotland during the second quarter of 2010 was up on the first quarter, and marginally higher than the same period one year previously. As with the VAT point above causing spending to be brought forward into 2009, the CML notes that the decline in Q1 2010 might have been caused by the ending of the Stamp Duty “holiday” on properties up to £195,000 which ended in December 2009. The remortgage market continues to remain very sluggish. Figures released on the 20th of October 2010 by the Scottish Retail Consortium reported continued challenges across the sector. While food sales showed some small nominal growth, non-food and all sales were lower on a like-for-like basis. Sales have now declined in five out of the last six months. While the SRC laid some blame on the
uncertainty surrounding the Comprehensive Spending Review, it remains uncertain when household spending will return to its previous growth path. Fears of unemployment, combined with (assumed) increased savings ratios as households pay down debts, are expected to continue to dampen any quick recovery in household spending. Government spending As noted in previous Forecasts, the outlook for UK Government expenditure over the next four years was to be set out in October’s Comprehensive Spending Review. This set out the UK Conservative-Liberal Democrat coalition government’s plans for fiscal consolidation of £113 billion over the next four years. Of this, £83 billion is to come from spending cuts, and the rest from tax rises. The implications of October’s CSR for the budget of the Scottish Government’s Departmental Expenditure Limits for Resource and Capital amounts were laid out in a press notice on the day of the CSR. In real terms, the Scottish Government’s overall DEL will be 10.5% lower in 2014-15 than in 2010-11. This is somewhat smaller than was perhaps anticipated by the Chief Economic Advisor in his June paper which assumed a 12.5% reduction over this period. The Resource DEL sees a smaller cut than total DEL, falling 6.8%. The capital DEL budget however takes a significant share of the reduction, and is 38% lower in 2014-15 than in 2010-11. This will be likely to have long-lasting impacts on government led investment projects over the next four years.
NOVEMBER 2010 PAGE 27

FRASER ECONOMIC COMMENTARY
Figure 2: Quarterly growth in (nominal) gross fixed capital formation in Scotland, Q1 1998 to Q2 2010
‐10%
‐5%
0%
5%
10%
15%
2 3 4 1 2 3 4 1 2 3 4 1 2 3 4 1 2 3 4 1 2 3 4 1 2 3 4 1 2 3 4 1 2 3 4 1 2 3 4 1 2 3 4 1 2 3 4 1 2
1999 2000 2001 2002 2003 2004 2005 2006 2007 2008 2009 2010
Our forecasts capture the extent to which government spending is felt across the economy, and the knock-on impacts on activity and employment at the sectoral level of changes in the sectors whose output is important for the demands of the public sector. Put simply, the forecasting model will see reductions in government spending as directly affecting the public administration, education, health and social work sectors, and at the same time affecting those sectors which rely on public sectors for buying their outputs (which will include suppliers to the public sector in the private sectors). The Quarterly National Accounts for Scotland show us that (Central and Local) Government spending is a vital element in Scottish economic activity. Over the period Local government has remained broadly constant at around directly contributing 10% of Scottish economic activity, while Central Government’s share of economic activity has increased from around 13% to over 17%. Including the linkages between other (including non-public) sectors and Central and Local government, it becomes clear that changes to their expenditure will have important consequences for the Scottish economy. Investment As previously noted, there were no separate National Statistics on investment in Scotland. The Quarterly National Accounts for Scotland improves this situation considerably
by providing the first series for Scottish Investment. Quarterly changes in this (nominal) series is shown in Figure 2 below. This reveals an upsurge in investment expenditure in Q2 2010 of 9.7%, which would concur with the strong growth in the “Construction” sector in this period. It also reveals the extent to which Investments declined through the 2008-9 recession, and had shown volatility over the last twelve years. Business investment figures reported for the UK, which were previously used as proxies of Scottish investment growth, showed in Q2 2010 growth of only 1.4%. This is a simple vindication of the need for (as much as possible) Scottish-specific data Tourism Elsewhere in the Commentary, we report weak and weakening confidence in the tourism sector across Scotland. Occupancy levels remain flat compared to previous years and with falling average daily spending and flat demand from overseas. Many hotels appear set to continue discounting in Q4, with those intending to hire staff falling from two-thirds to one half. Figures from the Quarterly National Accounts for Scotland show that spending by (non-Scottish) tourists is worth approximately 3.1% of Scottish GDP in the most recent quarter. This share has varied slightly over the last decade, rising to over 4.0% in 2003, and falling below 3.0% for three quarters – all in the last
PAGE 28 VOLUME 34 NUMBER 2

FRASER ECONOMIC COMMENTARY
three years. While the general trend of non-Scottish tourism spending has been upward over the last decade, the last two years have seen considerable volatility. Q2 2010 was the poorest second quarter for five years in nominal terms for non-Scottish tourism spending, which could indicate that the sector may struggle to produce growth over the year. Exports to the rest of the UK Preliminary estimates of GDP growth for the UK in the 3rd quarter of 2010, published on the 26th of October 2010, revealed that growth continued for the fourth consecutive
quarter, up by 0.8%: almost double what analysts had predicted, but down from a growth of 1.2% in Q2. As noted before, the rest of the UK is the most important trading partner for Scottish industries, the demand for Scottish exports will depend crucially on the path of growth which occurs in the UK. Scottish Input-Output tables for 2007, also published in October 2010, showed that exports to the rest of the UK were slightly less than two-thirds of all Scottish exports.
Table 1: GDP growth forecasts for top five export markets for ROW exports from Scotland, % year on year change, plus United Kingdom and Euro Area 2010 2011 IMF (October 2010) OECD (June 2010 IMF (October 2010) OECD (June 2010) 1 United States 2.6 3.2 2.3 3.2 2 France 1.6 1.7 1.6 2.1 3 Germany 3.3 1.9 2.0 2.1 4 The Netherlands 1.7 1.2 1.9 2.0 5 Ireland -0.3 -0.7 2.3 3.0 United Kingdom 1.7 1.3 2.0 2.5 Euro Area 1.7 1.2 1.5 1.8 Sources: International Monetary Fund, World Economic Outlook, October 2010 and OECD Economic Outlook, June 2010. Recent forecasts for UK GDP growth in 2010 show a strong rebound from the declines seen in 2009. The Office for Budgetary Responsibility’s forecast from June 2010 was for 1.2% growth in 2010, and 2.3% and 2.8% in 2011 and 2012 respectively. Household consumption growth in their forecast is anticipated to remain weak, rising by only 0.2% in 2010, and reaching growth of 1.7% in 2012. As we have noted previously, much of the growth forecast for the UK comes exports: forecasted to rise 4.3% in 2010, 5.5% in 2011 and 6.3% in 2012. As noted elsewhere in this Commentary, Scottish Engineering Review produced the most optimistic survey, including rising export orders, for the Manufacturing sector (the largest export sector in Scotland). Other surveys of that sector were less hopeful, with confidence dimmed, and evidence of increasing spare capacity. Exports to the rest of the world Recent forecasts for the growth in world trade were produced by the OECD in their “Economic Outlook”, published in June 2010. These are unchanged from their May 2010 forecasts. On the 3rd of November they presented their next “Economic Outlook”, however the detailed information on their forecasts are not available until after this issue of the Commentary. Overall, world trade, which fell by 11.0% in 2009, is predicted to increase by 10.6% in 2010, and to grow by 8.4% in 2011. As well as the OECD’s assessment, the IMF publishes a twice year “World Economic Outlook”, the most recent one from October 2010. In this, they forecast world trade in 2010 to increase by
11.4% in 2010 and 7.0% in 2011. As well as the value in finding new markets, growth in existing markets for Scottish goods will be an important driver of the extent to which exports can drive the economic recovery. The major (non-UK) importers of Scottish goods, and the recent IMF and OECD forecasts for GDP growth in these countries are given in Table 1. Whilst the development of existing destinations for Scottish goods and services is vital to the export-led recovery for Scotland, opening up previously underdeveloped markets could offer greater scope for economic gains over the next three years. Despite upward revisions for the major (non-UK) destinations for Scottish exports, growth continues to be forecast to be relatively slow to return in 2010, particularly for the EU economies to which Scotland has traditional exported its non-UK exports (although Germany continues to be a clear exception to the rule this year). With most countries hoping for export-led growth, competition in world trade will be high. With the benefit of a floating exchange rate, however, the competitiveness of UK goods and services has improved and could, other things being equal, provide an initial stimulus to exports. In the longer-term, however, finding new markets for Scottish goods and services will be crucial for the extent to which export-led growth can provide a stable foundation for economic recovery. In past forecasts we have used experimental statistics on Manufacturing exports to the Rest of the World by quarter
NOVEMBER 2010 PAGE 29

FRASER ECONOMIC COMMENTARY
produced by the Scottish Government as part of the Scottish National Accounts Project. The most recent data, published in October 2010, covers the period from Q1 2002 to Q2 2010. These data showed that over the year to the end of the 2009 Manufacturing exports from Scotland – which account for roughly two-thirds of Scottish exports to the rest of the world – fell by 9.2% in real terms (stripping out the
impact of inflation). This was slightly less than that given in earlier data. After four quarters of falls in the real value of ROW manufacturing exports to Q2 2009, the last four quarters has seen a steady, if choppy, recovery. The quarterly growth in ROW manufacturing exports is shown in Figure 3.
Figure 3: ROW manufacturing exports, change on previous quarter, 2002-2010
‐10.0%
‐8.0%
‐6.0%
‐4.0%
‐2.0%
0.0%
2.0%
4.0%
6.0%
8.0%
1 2 3 4 1 2 3 4 1 2 3 4 1 2 3 4 1 2 3 4 1 2 3 4 1 2 3 4 1 2 3 4 1
2002 2003 2004 2005 2006 2007 2008 2009 2010
While highly volatile, we can see that manufacturing (ROW) export growth – has not been more than 3.5% in any quarter. On an annual basis, the best years for ROW export growth in the last nine years saw growth of 4.1%. Simple arithmetic suggests that with (net) exports to the rest of the world contributing around 35-40% of GDP in Scotland, and the domestic side of the economy relatively flat, or contracting in the coming years, export growth will need to increase significantly compared to previous levels to provide the boost to Scottish activity and income. In terms of sectoral ROW export growth, (with the exception of “Engineering and Allied Industries”, which is the largest sub-sector of exports to ROW) all of the manufacturing sectors identified showed greater exports in real terms in Q2 2010 than in Q2 2009, with exports up by 2.7%. The largest annual increases were evident in “Metals and Metal Products” (+33%) and “Wood, Pulp, Paper, Publishing and Printing” (+30%). The forecasts: Background As with the forecasts published in the last six Commentaries, we give three alternative scenarios for growth, employment and unemployment in the Scottish economy between 2010 and 2012. We give a “Central” case, with “High growth” and “Low growth” as two respectively upper and lower growth alternatives. We intend
these to capture the range of outcomes that are possible, given that there are considerable uncertainties surrounding any specific single or point estimates. While we do not give explicit probabilities for each of these outcomes, we see the “Central” scenario as being that which is most likely, while “High growth” and “Low growth” reveal the possible range of outcomes for the Scottish economy from 2010 to 2012. The forecasts: Detail In the three scenarios considered, the following elements are assumed to influence the factors of demand, and therefore economic activity, in the Scottish economy: Household In the “Central” scenario, we forecast that the significant reduction in Household spending seen in 2009 moderates, but overall expenditure growth only increases marginally in 2010, in part due to expenditure brought forward from 2011 when VAT will be higher, but also due to continuing attempts to increase household savings rates and pay down debts. Aggregate Household expenditure in 2011 and 2012 is forecast to increase slightly from weak 2010 levels, although spending growth in 2011 is damaged by the VAT increase and only by 2012 does household spending return close to trend expenditure growth. The increased element of the UK fiscal tightening coming from welfare reductions,
PAGE 30 VOLUME 34 NUMBER 2

FRASER ECONOMIC COMMENTARY
means that, to the extent that these payments funds household spending, household spending is lower than it otherwise would be (or would be with larger reductions in Government spending). In “Low growth”, household expenditure remains broadly flat through 2010 and falls slightly in 2011. As with previous scenarios, it isn’t until 2012 that household spending sees a return to positive growth in “Low growth”. In “High growth”, spending responds faster than in “Central”, returning to sluggish, but positive, growth in 2010 before seeing a return to pre-2008 trend expenditure growth through 2011 and increasing marginally above trend in 2012. Government In “Central” we forecast an increase in government spending in Scotland through 2010 on 2009 levels, but this
is the final year of government spending growth expected for the short-term. As we have noted before, the delaying of reductions in aggregate spending until next year means that the reduction in 2011 will be greater as a result. This is expected to be the largest single year reduction in expenditure of this period of fiscal consolidation. From 2011, we forecast annual real terms reductions in aggregate Government spending in Scotland, which are reduced by 4.2% in 2012 compared to 2011, and 4.9% lower in 2011 on 2010. In “High growth”, government spending is still lower in 2011 and 2012 compared to the previous year’s total, with less tightening across government budgets at the UK level in comparable spending programmes. Across all scenarios however, government spending in Scotland is lower, as would be expected.
Figure 4: GVA growth 2005-2009 and forecasts for Scotland 2010 to 2012, annual real
‐5.0%
‐4.0%
‐3.0%
‐2.0%
‐1.0%
0.0%
1.0%
2.0%
3.0%
4.0%
5.0%
2005 2006 2007 2008 2009 2010 2011 2012
High
Central
Low
OBR (UK)
Exports In “Central” we anticipate a return to growth in world trade in 2010 consistent with international opinion, with a commensurate return to relatively strong positive growth in demand for Scottish exports from the rest of the world returning through 2010, 2011 and 2012, in part due to the increased competitiveness of Scottish products. In “High growth” and “Low growth”, this return to positive growth in exports to the rest of the world from Scotland takes less and more time, respectively. Exports to the rest of UK follow a similar pattern returning to slightly positive growth in 2010
across all three scenarios, albeit that, due to the measures introduced in the CSR, growth in domestic demand in the rest of the UK is forecast to be slightly lower in 2010 and 2011 than we assumed previously. In all three scenarios, however, export growth is forecast for each of these three years. Tourism Tourism is forecast to recover slowly from the challenging conditions seen through 2009, with (non-Scottish) households’ expenditures on travel and tourism activities
NOVEMBER 2010 PAGE 31

FRASER ECONOMIC COMMENTARY
Figure 5: Forecasts of GVA growth in Production, 2010-2012
0.0%
1.0%
2.0%
3.0%
4.0%
5.0%
6.0%
7.0%
2010 2011 2012
High
Central
Low
anticipated to largely follow general household expenditure growth. In “Central”, tourism spending in aggregate is forecast to increase slightly in 2010, with more significant growth continuing through 2011 and 2012. Investment and stocks As discussed above, 2009 saw reductions in investment demands which were unprecedented in modern times. As we have previously stated, the recovery in investment will be partly driven by the supply of credit, but also the demand for credit from companies, which will be linked with returning business confidence. Recent survey evidence for Construction, responsible for much of the investment activity in the Scottish economy, continues to show weak levels of overall confidence, with declines in order, albeit that the declines have moderated from earlier periods. We revise up our estimate of Investment growth in 2010 from June’s Commentary, and forecast in our “Central” scenario that aggregate investment levels will return from the huge declines seen through 2009, and will show positive growth in 2011 and 2012. The pro-cyclical nature of investment, combined with the decrease through 2009, could indicate that we might see significant rebound in investment levels over the coming quarters. “Low growth” anticipates investment reducing from 2009 levels – such that spending increases in Q2 were not maintained – although the decrease is forecast to be marginal.
Results Gross value added All three scenarios forecast out to 2012, by which time Scottish GVA growth in all scenarios is forecast to be positive. The recovery to positive growth occurs faster in the High growth scenario, and more slowly in the Low growth scenario. As stated above, we forecast that the Central scenario represents the most likely outcome for the Scottish economy given the current economic position and outlook at the start of 2010. Scotland is forecast to return to positive growth in 2010 in both the Central (1.0%) and High growth (+1.3%) scenario and the Low growth scenario sees relatively slower growth (0.5%) in 2010 and only growth of 0.3% in 2011. As noted above, considerable multiple downside risks remain to the strength of the expected economic recovery for Scotland. Further, it is evident that, for many discussed reasons, and under plausible scenarios, this may be particularly experienced in 2011. These scenarios are presented in Figure 4, alongside (for comparison) the forecasts for the UK as a whole in 2010, 2011 and 2012 made by the Office for Budget Responsibility (OBR) (and published alongside the Budget on the 22nd of June 2010). Forecasts for UK economic growth in 2010 and 2011 were collected from city and non-city forecasters by HM Treasury, and published in October 2010. The median
PAGE 32 VOLUME 34 NUMBER 2

FRASER ECONOMIC COMMENTARY
Figure 6: Forecasts of GVA growth in Services, 2010-2012
0.0%
0.2%
0.4%
0.6%
0.8%
1.0%
1.2%
1.4%
1.6%
1.8%
2.0%
2010 2011 2012
High
Central
Low
Figure 7: Forecasts of GVA growth in Construction, 2010-2012
0.0%
0.2%
0.4%
0.6%
0.8%
1.0%
1.2%
1.4%
1.6%
1.8%
2010 2011 2012
High
Central
Low
NOVEMBER 2010 PAGE 33

FRASER ECONOMIC COMMENTARY
recent forecast of UK growth in 2010 and 2011 from this sample is 1.6% and 2.0%. We are forecasting that the Scottish economy will perform better than the OBR’s forecasts for the UK in 2010 (1.2%) under the High growth scenario only, but less well under the most likely Central scenario. We anticipate the most likely outcome is for a slower return to growth in Scotland than the UK as a whole, with our Central scenario forecasting lower growth in Scotland than the OBR forecasts for the UK in each year from 2010 to 2012. While the gap between our (Scottish) and the OBR’s (UK) forecasts for 2010 is relatively small (+1.0% against +1.2%), our forecasts estimate that the size of this gap will be larger in 2011. Under the Central scenario, GVA growth returns to positive annual growth in 2010 (+1.0%) and 2011 (+1.1%). In 2012, Scottish growth is forecast to be 1.9%, around the long-term trend growth for Scotland, and marginally down from our forecast for 2012 in June 2010. Our headline forecast in the “Central” scenario, and the forecast for the broad sectors under this scenario are given in Table 2. Table 3 shows the GVA forecasts under each of the three scenarios. Under the Low growth scenario, smaller (but still positive) growth is seen 2010 and 2011, with 2011 seeing a slower rate of growth than 2010. We present forecasts for GVA change in Scotland at broad industry levels for Production and Services, as well as the Construction sector under each of the three scenarios. Figure 5 shows the GVA change in Manufacturing under
each of these three scenarios, while Figure 6 shows the GVA change in Services. Figure 7 shows the change in forecasted GVA in the Construction sector between 2010 and 2012. Across Production (shown in Figure 5), a recovery from the observed declines in GVA in 2009 occurs in 2010 in the Central and High scenarios. We forecast GVA growth of 2.9% for 2010 under the High growth scenario. The Low growth scenario on the other hand forecasts a growth of only 1.2% this year. In 2011 and 2012, all three scenarios forecast positive GVA growth in the Production sector, with growth ranging from 1.2% to 5.4% in 2011 and 2.3% to 5.8% in 2012. Figure 6 shows that Service upturn GVA growth across the three scenarios is more insulated to the economic downturn than the Production figures seen in Figure 3. Services GVA growth in 2010 ranges from 0.4% to 1.0%, while in 2011 GVA growth is forecast in the range from 0.2% to 1.6%. The High forecast for Services has been revised (very slightly) upwards from that presented in June’s Forecast. As previously noted, the recovery in consumer confidence and household spending (both in Scotland and in major, or new, export markets, particularly the rest of the UK) will drive the speed and duration of the recovery across the Scottish Service sectors. Figure 7 shows that in our forecasts the declines in GVA in the Construction sector seen in 2009 do not continue into 2010. Having fallen 10.8% in 2009, we forecast that
Table 2: Forecasts of the Scottish economy (Central scenario), 2010-2012 2010 2011 2012 Gross Value Added 1.0% 1.1% 1.9% Manufacturing 2.2% 3.1% 4.8% Construction 0.8% 0.8% 1.5% Services 0.7% 0.7% 1.3% Table 3: Forecasts for aggregate GVA growth in the Scottish economy under three scenarios, 2010-2012, % 2010 2011 2012 High growth 1.3% 2.1% 2.4% Central 1.0% 1.1% 1.9% Low growth 0.5% 0.3% 1.0% Construction GVA grows slightly from its current level across all three scenarios. The “Central” scenario sees the sector growing 0.7%, 0.7% and 1.3% over 2010, 2011 and 2012 respectively. Growth in 2010 is driven, in part, by government spending, but this, for the reasons discussed
above, will not continue into 2011 and beyond. Looking forward, large declines in public (capital) spending are anticipated, but we forecast some increasing demand from private business investment.
PAGE 34 VOLUME 34 NUMBER 2

FRASER ECONOMIC COMMENTARY
Table 4: Forecasts of Scottish employee jobs (000s) and net employee jobs change in central scenario, 2010-2012
2010 2011 2012 Total jobs (000s), Dec 2,209 2,230 2,269 Net annual change (jobs) -12,794 21,224 39,124 % change from previous year -0.6% 1.0% 1.8% Agriculture (jobs, 000s) 30 30 32
Annual change 250 691 1,289 Production (jobs, 000s) 239 247 259
Annual change 1,906 7,680 12,474 Services (jobs, 000s) 1,827 1,839 1,863
Annual change -13,928 12,097 23,936 Construction (jobs, 000s) 113 113 115
Annual change -922 757 1,425 Employment Our forecasts for employment for each of the three scenarios are given in Table 4, along with the net aggregate employment change over the year. As in previous forecasts the employment figures relate to jobs, not FTEs, and are calibrated on the end-year (December) figures from the Employers’ Quarterly Survey Series, as given in Table 6.06 of the Economic and Labour Market Review, published by National Statistics. This gave total employee jobs in Scotland at December 2009 as 2,221,500 (down 94,200 from December 2008). We anticipate in our Central scenario that total job numbers in Scotland will fall (-0.6%) in aggregate in 2010, and will grow in 2011 (+1.0%) and 2012 (+1.8%). Notes: Figures are numbers of employee jobs, by industry, and not the numbers in employment, therefore these figures differ slightly from those reported in the labour market section of the Economic Commentary. As of October 2010, the most recent estimate of employee jobs was from June 2010, and was 2,220 thousand.
In “Central”, the number of jobs is forecast to decline by 12,794 in 2010 (down on the number of jobs forecast in June’s Forecast to be lost in 2010). Total employee job numbers, and jobs in all of these broad industrial sectors, are forecast to increase in 2011 and 2012. Total jobs in 2012 are forecast to be around 47,000 lower than the employee jobs total for 2008 (in which historic highs and lows respectively for the employment rate and unemployment rate were seen in Scotland). In all scenarios, total job numbers in Scotland are forecast to continue to show a decline in 2010, following, but not as large as, the decline seen through 2009. Table 5 shows the forecasts for net annual growth in employee jobs in each of the three scenarios. The speed of the decline is however forecast to be much reduced. In the “Central” scenario, the forecast is for around 12,700 jobs to be lost in Scotland in 2010. Our “Low growth” scenario forecasts a fall of 22,700 jobs. The number of jobs in Scotland is forecast to increase across all scenarios in 2011. In our “Central
Table 5: Forecast Scottish net jobs growth in three scenarios, 2010-2012 2010 2011 2012 High growth -7,000 42,300 50,404 Central -12,700 21,200 39,100 Low growth -22,700 4,400 21,100 scenario” we forecast jobs growth of 21,200 in 2011, with an increase of 42,300 in the “High growth” scenario, and an increase of 4,400 in our “Low growth” scenario. Looking at the sectoral breakdown for these employment changes, in all scenarios the Services sector sees the largest decline in job numbers in 2010. Overall, the number of service sector jobs are forecast to fall by almost 14,000 between December 2009 and December 2010. This is about
half the job lost forecast in June’s commentary. In the “Central scenario” the most significant number of jobs are forecast to be lost in 2010 in “Health and Social work” (down 3,571), “Retail and wholesale” (down 2,968) and “Real estate and business services” (down 2,768). The Construction sector, which lost 16,861 jobs in 2009 is forecast to lose over 900 jobs in 2010, and see a slow growth in job numbers through 2011 and 2012.
NOVEMBER 2010 PAGE 35

FRASER ECONOMIC COMMENTARY
Table 6: Forecasts of Scottish unemployment, central scenario 2010-2012 2010 2011 2012 ILO unemployment 245,056 286,821 261,730 Rate1 9.3% 10.7% 9.7% Claimant count 143,214 167,623 152,959 Rate2 5.2% 5.9% 5.4% Notes: 1 = rate calculated as total ILO unemployed divided by total of economically active 16+ population. 2 = rate calculated as claimant count divided by sum of claimant count and total jobs. The latest estimates of the figures forecast in Table 6 were published in October 2010 in the Labour Market Statistics First Release for Scotland. These estimated the ILO unemployment levels and rates for the three months to August 2010 as 231,000 and 8.7% respectively. The same publication gave preliminary estimates of the claimant count and rate for September 2010 as 134,500 and 4.8%. Table 7: ILO unemployment rate and claimant count rate measures of unemployment under each of the three forecast scenarios 2010 2011 2012 ILO unemployment rate High growth 9.1% 9.6% 8.2% Central 9.3% 10.7% 9.7% Low growth 9.8% 11.8% 11.5% Claimant count rate High growth 4.8% 5.1% 4.3% Central
5.2% 5.9% 5.4% Low growth 5.9% 7.2% 7.0% Employee jobs in “Production” jobs fell by 11,000 in 2009. We forecast that the number of Production jobs in 2010 will increase slightly, up by just under 2,000 jobs. The forecasted job changes in the “High growth” and “Low growth” scenarios are 3,545 and -744 jobs respectively. Within the Production sectors in the Central scenario, the largest job growth is forecast in Mining and Quarrying (+478 jobs) and Textiles (+431 jobs), while the sector forecast to see the largest reductions in job numbers are Food and Tobacco (-109 jobs). Unemployment We present our 2010 to 2012 forecasts for unemployment, as measured by the ILO definition, as well as those claiming unemployment benefit in Table 6. The preferred measure of unemployment is the ILO definition, as given by the Labour Force Survey. This measure is preferred as it reveals the extent of labour which is unemployed and available for work, rather than that portion of the available Scottish labour force
which is currently in receipt of unemployment benefit. As such, it is a better measure of the extent to which labour resources are not currently employed in productive activity in Scotland. Of crucial importance to the realised levels of unemployment will be the extent to which people who lose employment switch into the unemployed, or move into labour inactivity, i.e. are unemployed but not available for work. One potentially important feature of the 2008-9 recession has been the extent to which the inactivity rate in Scotland has increased (up 1.5% points in the last year), and it currently stands at 37.0% for 16+, and 22.9% for working age people. Table 7 shows the ILO and claimant count measures of unemployment under each of the three scenarios of our forecasts.
Grant Allan 5th November 2010
PAGE 36 VOLUME 34 NUMBER 2

FRASER ECONOMIC COMMENTARY
Review of Scottish Business Surveys
Overall The publication of better than anticipated figures for UK growth for the third quarter of 2010 suggests that the UK economy appears to be recovering from recession at a faster rate than in previous recessions, although the rate of growth eased between the second and third quarter, and there is widespread concern that the deep cuts in government expenditure will impact on the recovery in 2011. Since the comparable figures of growth in the Scottish economy are published later there is more interest in the results and forecasts of recent surveys covering the Scottish economy. However, there is considerable disagreement as to recent trends and three differing interpretations as to the current state of the economy are evident in recent Scottish business surveys:
1. Two surveys - the Oil & Gas UK and Scottish Engineering’s Quarterly Report - are more optimistic than other surveys and suggest a continuing and strengthening recovery of the Scottish economy. The Oil & Gas UK index for the second quarter noted ‘a sustained positive outlook across the UK oil and gas industry’, although this was slightly less evident amongst exploration and production companies. Scottish Engineering noted in its quarterly review for q2 2010, orders, output volume and employee numbers ‘returning to positive territory for the first time in three years’. In its report for q3 2010 it reported increasing optimism ‘’the latest results from ...show a further improvement on the return to positive territory’, and ‘represent some of the most positive figures we have seen for some time’. Coincidently, engineering had the strongest growth in the latest Government figures;
2. The majority of surveys are more cautious as to
trends in the third quarter, but differ in their views as to the outturn for the fourth quarter. The latest Lloyds TSB survey (June – August 2010) noted the ‘results indicate that although growth may have been restored it remains weak and muted. Both consumer and business confidence remain at low levels’. The Bank of Scotland PMI for September 2010 reported that both output and activity declined for both manufacturing and services following four months of growth although recovery continued with respect to new orders and employment.
The CBI Industrial Trends (q3 2010) likewise noted a dip in manufacturing output following four
quarters of growth – but predicted a stronger rise in orders and activity for the fourth quarter.
The SCBS (q3 2010) is the least confident of this group. It noted confidence weakening amongst its members in the third quarter of 2010, with the positive signs of recovery evident earlier in the year fading and respondents in all sectors revising downwards their expectations for the fourth quarter and for the year ahead. The SCBS captured more concerns that firms were factoring in the forthcoming significant reductions in public sector expenditure and consequent reduced consumer demand are increasingly concerned these will adversely influence turnover, profitability and demand over the next year.
3. The Scottish Construction Monitor and SCBS for
the construction sector are the least optimistic of the range of business surveys over the summer months. Commenting on the results for the q3 2010 survey, the Scottish Building Federation noted ‘confidence in the Scottish construction sector is now worse than it was at the beginning of 2009’ and prompting the Scottish Building Federation’s chief executive to raise fears of a ‘dam of insolvencies fit to burst’ in the Scottish construction sector. Likewise the SCBS in its construction sector noted a sharp deterioration in business confidence.
Oil and gas services The latest available Oil & Gas UK Index (q2 2010) indicated a sustained positive outlook across the UK oil and gas industry, although there were differences between contractors being more confident than exploration and production companies. The report noted ‘While business confidence for the industry as a whole shows signs of caution, some segments of the supply chain community have been experiencing reasonably high levels of activity, which gives some scope for optimism in the industry. It will be important to monitor the Q3 and Q4 results closely, especially in the light of the drop in confidence by exploration and production companies in Q2’. The impact of international events, most notably the Gulf of Mexico incident, may be a factor affecting business confidence amongst exploration and production companies. Production In a reversal of the trends from the previous Lloyds TSB Scotland Business Monitor, the latest survey, covering the three months to end August, reported a slowing down in business performance. The overall net balance for turnover for firms in the production sector was -14% - a fall from the -2% of the previous quarter but much improved from the -24% of the same quarter one year ago. All main trends, except export trends, continued to decline. Nevertheless
NOVEMBER 2010 PAGE 37

FRASER ECONOMIC COMMENTARY
looking forward the Lloyds TSB anticipates a muted improvement in both turnover and export activity. Manufacturing The Scottish Engineering Review reported the most optimistic figures and most positive growth in both the second and third quarters. In the last survey (q3 2010) it noted the total order intake and output volume were the highest recorded for 12 years and across all sectors and company sizes the order intake was positive. In contrast to other surveys of manufacturing it reported rising export orders, capacity used, employment and investment. Looking forward to the fourth quarter it anticipates these rising trends continuing. The CBI Industrial Trends for the third quarter noted a dip in manufacturing output following four quarters of growth. It reported and expects moderately rising domestic orders but more strongly rising export orders for the fourth quarter, although at the same time noted stocks rising faster than expected. It is unclear from the survey the extent to which the rising output noted in earlier quarters reflects more extensive stock rebuilding rather than a sustained increase in demand. Nevertheless, for the first time the survey noted increased investment over the next 12 months. The BoS-PMI noted firms running down their backlogs of work linked in part to a weak flow of new orders as well as evidence of spare capacity. Chamber of Commerce respondents reported being less confident than a year ago and also less optimistic compared to the third quarter of last year whereas firms responding to the Scottish Engineering Quarterly Review Survey (q3 2010) reported positive and rising trends in optimism amongst all size bands. In contrast both the Bank of Scotland PMI and the SCBS reported a weaker than anticipated outturn amongst manufacturing firms in the third quarter. The BoS-PMI noted a decline in activity levels in September. It noted a weakening in actual and expected orders, weakening employment and investment. Amongst SCBS respondents average capacity utilisation declined by almost 5 percentage points, previous positive trends in work in progress and were reversed in quarter three with a net balance of firms reporting a decline (firms in the second quarter survey had expected a weakening in these trends). SCBS respondents anticipate some further weakening in these trends in the fourth quarter, with the net trend in total orders and sales remaining negative. In both the CBI and SCBS surveys rising trends in cost pressures were reported. The CBI survey noted ‘average unit cost grew strongly in the quarter’ and a further, although more modest, increase is forecast for the fourth quarter. Amongst SCBS respondents raw material and to a lesser extent transport costs, continued to cause most concern to firms during quarter three.
For SCBS firms, trends in investment of equipment declined with remaining investment mainly directed towards replacement. Investment for R & D and introducing new products/developing new markets remained low. Declining trends in employment and hours worked were reported by a net balance of SCBS firms, and expenditure on training continued to ease. Conversely Scottish Engineering respondents reported and expect upward trends in total employment levels. Recruitment activity remained subdued among SCBS firms and few recruitment difficulties were reported. Construction The Scottish Building Federation (SBF) responded cautiously to the official output figures for the Scottish construction industry for the second quarter of 2010, noting ‘private commercial activity is down 46% compared to where it was at its peak. Quarterly private house building activity is down 40% on the level of output at the peak of the housing boom. Public sector construction activity was up again this quarter but, with significant budget cuts starting to bite, this trend will not last.’ The Scottish Construction Monitor reported business confidence in the third quarter as being weaker than earlier in the year and weaker than it was at the beginning of 2009. It reported that only one third of construction firms seeking bank finance for their business over the past year had been able to secure it on satisfactory terms with almost a quarter reported their requests for finance being turned down. Three quarters of employers responding to the survey described their finances as ‘secure’ but said that the outlook for their business remains difficult. However, 14% said that without additional bank finance, their business would be forced to restructure or to lay off workers or could even struggle to survive. It concluded the ‘outlook for many Scottish construction firms remains extremely tough’. SCBS respondents reported similar findings, business confidence declined sharply among Chamber of Commerce construction respondents in the three months to the end of September (the lowest net balance since Q1 2009). Demand remained weak among SCBS construction firms with orders from all areas declining further during the third quarter. 83% of firms reported working below optimum levels, but the decline in the level of work in progress eased significantly. Expectations as to contracts over the next three months and turnover, tender margins and profitability over the next twelve months remain weak. There is much to suggest that expectations influenced by continued speculation concerning announcements as to reductions in public sector capital projects expected in the Comprehensive Spending Review. Average capacity rose marginally to 75%, similar to levels one year ago, but remains some 14 percentage points lower than in 2007. Employment levels continued to decline and further declines
PAGE 38 VOLUME 34 NUMBER 2

FRASER ECONOMIC COMMENTARY
are anticipated during quarter four. Recruitment activity and average pay increases remain at historically low levels, few recruitment difficulties are reported. The service sector The Lloyds TSB Scotland Business Monitor reported service businesses noting an improvement in turnover during June – August with the overall net balance on turnover rising to -4% in the latest quarter from -10% in the previous quarter and -7% in the same quarter one year ago. However, more firms responding to the Business Monitor reported a fall in turnover (36%) in the latest three months compared to those reporting an increase of 32%. The latest BoS-PMI noted a decline in activity levels in the service sector, although there were signs of rising new orders. Retail distribution Trends in business confidence in the retail sector reflect both factors within the sector as well as trends in consumer confidence and spending levels. Rising on line sales and sales amongst the major multiple retailers in a period of limited growth in consumer spending implies increased pressures on the smaller and independent store. The SRC-KPMG Scottish Retail Sales Monitor for September noted like-for-like sales in September were 0.4% lower than in September 2009, with non food sales down 2.2%. The overall rise of 2.3% in sales over the year largely reflected growth in floorspace rather than increased demand. Amongst SCBS retail respondents the trend in sales remained weak with more than 60% of SCBS firms reporting and expecting a decline in the total value of sales. Only 12% reported increased sales, and once again continued concerns over consumer confidence are moderating sales expectations for the fourth quarter. Both SCBS and SRC-KPMG retail respondents noted rising costs pressures. Rising suppliers’ prices remain a concern, and as the SRC-KPMG monitor noted the inflationary pressures as cost increases felt in commodities such as wheat and cotton and in Chinese manufacturing work through shop prices. Pressures on margins look set to increase with two-thirds of firms anticipating weakening trends in both turnover and profitability over the next year. Labour market activity remains at low levels with 70% of retailers reporting and almost 90% expecting no change to overall employment levels. Recruitment activity in the third quarter, whilst just as strong as a year ago, remains at historically low levels. Fewer than 10% of SCBS respondents reported increasing pay. Tourism SCBS respondents reported that overall business confidence weakened in the third quarter, whilst occupancy figures remained little changed from previous years, average daily spend eased and demand from abroad remained flat.
SCBS respondents reported average occupancy declining marginally to 70.3% in q3 2010, slightly lower than a year ago, whereas the Scottish hotel occupancy survey (August) showed no change to either room or bed occupancy compared to the same month in 2009. Results from the SCBS survey suggests weakening trends in visitors from all areas with further weakening expected in the fourth quarter. Trends in bar/restaurant trade and most notably in conference/function facilities remained weak. Overall local and business demand accounted for 47% of total demand and tourist demand accounted for 53% of total demand in the third quarter. Average duration of stay rose slightly for seaside/coastal but eased for cities and town based hotels. More than a third of SCBS respondents reported reducing average room rates and the discounting of rates is set to continue for 40% of hotels in the three months to the end of December. More than 80% reported that the lack of tourist demand remained the primary business constraint but once again almost a third felt that their area had suffered due to poor marketing. Fewer than half (compared to two thirds in quarter two) sought to recruit staff. Net declining trends in employment continued and are expected to accelerate in quarter four. Once again, notwithstanding the weak demand for staff difficulties in recruiting suitable chefs were evident. Logistics and wholesale Data from the SCBS for the third quarter of 2010 indicated a rise in business confidence amongst logistics respondents with a net of respondents reporting an increase in activity, especially local deliveries and storage. Over the next year pressures on margins are expected to ease with turnover and profitability set to improve. In contrast, business confidence amongst SCBS wholesale respondents remained weak, with no respondents reporting a rise in business confidence. Overall net sales trends weakened during the three months to September although 19% reported rising and 44% level sales; however almost two thirds anticipated a decline during quarter four. Almost all SCBS wholesale respondents reported pressures to raise prices, as respondents report rising transport costs and supplier prices. Wholesalers have revised their expectations downwards for both turnover and profitability over the coming year; more than half of respondents now expect both to decline. Wholesale respondents reported no change to investment intentions plans, nevertheless there was a net decline. Fewer than 20% sought to recruit staff, compared to more than 50% in the previous quarter. No responding firms increased pay during quarter three. Cost pressures Whilst there are marked differences between the surveys in terms the latest trends in optimism, orders, investment and employment there is much more agreement in terms of rising cost pressures. In the latest SCBS survey manufacturing and service firms reported rising raw material/suppliers prices and transport costs and
NOVEMBER 2010 PAGE 39

FRASER ECONOMIC COMMENTARY
construction firms reported pressures on tender margins and rising costs. In the SCBS survey more than 80% of manufacturing, 94% of wholesale and 78% of retail respondents reported pressures to raise prices due to rising raw material/suppliers’ prices. 94% of wholesale, 42% of manufacturing and 42% of retail respondents reported rising transport costs. The September PMI report and CBI survey likewise noted that higher raw material, wage and wholesale food costs were all reported to have contributed to another monthly rise in average input prices. Despite the increase, the latest figures indicated an easing in cost inflation to a nine-month low. Scottish firms raised their average charges during September in response to higher input prices, as has been the case in seven of the past eight months. Pay and employment Generally over the last 6 months labour market activity has remained subdued, in even the Scottish Engineering’s quarterly review, the most optimistic of surveys, less than a third reported changing employment levels. The CBI likewise reported a modest increase in employment but expects no change in the fourth quarter. Pay increases ranged from 1.5% in construction to 3.2% in manufacturing, and generally wage increases remain at historically low levels. The September PMI reported that despite recording a fall in activity, Scotland’s private sector firms raised employee numbers. Job creation in Scotland was only marginal although it was sharper than the rise recorded at the UK-wide level. According to the PMI rising employment has now been recorded in nine months of the past year. In September, it noted that rising flows of new business had driven the increase in employment, although anecdotal evidence indicated that this may have reflected rising demand for temporary workers. Latest data from the Bank of Scotland Report on Jobs has indicated that conditions in the Scottish labour market remained challenging in August. The number of workers placed in permanent job roles fell for the second successive month, whilst growth of temp billings weakened to the lowest level since September 2009. This was due to weaker trends in demand for workers for both long- and short-term jobs. Outlook The SCBS, Scottish Construction monitor and SRC-KPMG drew attention to the impact of the forthcoming public sector spending cuts as contributing to a decline in business confidence and leading firms to expect a further weakening in demand and activity. They note that the decline in capacity utilisation and trends in work in progress is slight but respondents fear, in the current uncertain climate, a further deterioration in the fourth quarter and in 2011. Activity in construction is set to remain weak, but the expectations for the year ahead are more depressed than in previous quarters. In the service sector consumer
confidence continues to remain weak and retail sales trends remain flat. Activity and occupancy in tourism was only slight down on the averages for the third quarters of previous years, but there are some signs of weakening demand for conference/function as well as bar/restaurant facilities. In construction and in the service sector the trends for the fourth quarter of 2010 and for the next two to three years are seen to be shaped by the reductions in public sector expenditure, employment, rising cost pressures, energy prices and VAT increases. In contrast the CBI and Scottish Engineering see export orders rising and leading a more general growth in manufacturing demand. However, disentangling this growth from an evident period of restocking leads to some uncertainties as does the extent to which there will be sustained growth in international markets. Cliff Lockyer/Eleanor Malloy November 2010 ____________________ Current trends in Scottish Business are regularly reported by a number of business surveys. This report draws on: The Confederation of British Industries Scottish Industrial Trends Survey for the third quarter 2010; Lloyds TSB Business Monitor 51 for the quarter June – August 2010 and expectations to February 2011; Scottish Engineering’s Quarterly Reviews for the second and quarters of 2010; The Bank of Scotland Markit Economics Regional Monthly Purchasing Managers’ Index for July, August and September 2010; The Scottish Retail Consortium’s KPMG Monthly Scottish Retail Sales Monitor for August and September 2010; The Scottish Chambers of Commerce Quarterly Business Survey, reports for the second and third quarters of 2010; Oil & Gas UK quarterly Index quarter 2 2010; Visit Scotland Occupancy Survey July and August 2010; The Scottish Construction Monitor quarters 2 and 3 2010.
PAGE 40 VOLUME 34 NUMBER 2
FRASER ECONOMIC COMMENTARY
NOVEMBER 2010 PAGE 41
Overview of the labour market
Current interest in the Scottish labour market continues to focus on the trends and patterns in the unemployment figures and emerging differences between UK and Scottish figures and the reasons for such divergence, a theme developed in other sections of this edition. Interest in development in public sector employment inevitably remains a central concern given the publication, in September, of the Comprehensive Spending Review of public spending for the next four years and has led to further announcements of planned cuts by public sector organisations and the likely trends in public sector employment in Scotland. Public interest again focuses on public sector pay and we return to this again in this overview. Recent trends and statistics Comparable figures on the labour market1 between Scotland and the United Kingdom in the quarter June - August 2010 are summarised in Table 1. Labour Force Survey (LFS) data show that in the quarter to August 2010 the level of employment in Scotland rose by 10 thousand, to 2,452 thousand. Over the year to August 2010, employment in Scotland fell by 53 thousand. For the same period, UK employment rose by 178 thousand. The Scottish employment rate – those in employment as a percentage of the working age population – was 70.3 per cent, down -1.6 per cent compared to one year earlier. For the same period the UK employment rate was 70.7 per cent, up 0.2 per cent compared to one year earlier. In considering employment, activity and unemployment rates it is important to remember the bases and relationships of these figures. LFS data is provided for: (1) all aged 16 and over and (2) for all aged 59/64. The first measure (all aged 16 and over) leads to higher numbers in employment, in the total economically active and economically inactive – but reduces the economic activity rates and unemployment rates, but at the same time increases the economically inactive rate. Conversely the second measure (all aged 16 to 59/64) leads to lower numbers economically active, in employment and economically inactive – but leads to a higher economically active, employment and unemployment rates but lower economically inactive rates. Figures derived from the Labour Force Survey differ slightly from those derived from the Annual Population Survey. The relationships between employment, unemployment, totally economically active and inactive are important in appreciating changing levels of employment and unemployment, and changes in the employment rates should be seen in conjunction with changes in the activity rates. If people leave employment and become
unemployed (but are still economically active) the unemployment rate increases, but the economically active rate remains unchanged. However, if people leave employment and do not seek employment, as seems to be an emerging pattern, they are categorised as economically inactive, as such the unemployment rate remains unchanged whilst the activity and inactivity rates change. This is clearly shown in table 1. Over the year to August 2010, the numbers employed fell by 53 thousand, but unemployment only rose by 37 thousand – however, the numbers of those aged 16-59/64 who are economically inactive rose by 20 thousand and the numbers economically active fell by 16 thousand. Table 1 shows that for Scotland the preferred International Labour Organisation (ILO) measure of unemployment rose significantly to 231 thousand, between June - August 2010, or by 37 thousand over the year2. The ILO unemployment rate rose in the three months to August 2010 and now stands at 8.6 per cent. This represents a 0.4 per cent rise over the last quarter and a 1.4 per cent rise relative to the same period a year earlier. The comparable ILO unemployment rate for the UK stands at 7.7 per cent, and is down 0.1 per cent over the most recent quarter and down 0.1 per cent over the year. The economically active workforce includes those individuals actively seeking employment and those currently in employment (i.e. self-employed, government employed, unpaid family workers and those on training programmes). Table 1 shows that the level of the economically active rose by 1.1 per cent between June - August 2010. There were 2,683 thousand economically active people in Scotland during June - August 2010. This comprised 2,452 thousand in employment and 231 thousand ILO unemployed. The level for those of working age but economically inactive fell in the last quarter, down 0.5 per cent on the previous quarter to 779 thousand people; this indicates an increase of 0.5 per cent in the number of people of working age economically inactive over the last year. Data on employment by age, derived from the Annual Population Survey, is available up to December 2009. In 2009 employment rates fell for all age groups – except those aged over 65, with the employment rate for those aged 16 – 64 falling by 1.6 percentage points and with the largest percentage point falls being recorded for those aged 16 – 17 and 18 – 24., employment rates for men fell more than those for women. In the year to December 2009 (the latest available data) inactivity rose by 7.2% (to 52,000) for men aged 18-24 but fell by 3.4% (to 25,000) for men aged 25 – 34. The comparable figures for women were -1.8% (69,000) and -0.6% (66,000). The most recent (seasonally adjusted) figure for Jobseekers allowance claimants in Scotland stood at 134.5 thousand in September 2010, up 1.9 thousand or 01.4% over the year.

FRASER ECONOMIC COMMENTARY
Table 1: Headline indicators of Scottish and UK labour market, June - August 2010
June - August 2010 Scotland Change
on quarter Change on year
United Kingdom
Change on quarter
Change on year
Employment*
Level (000s) 2,452 10 -53 29,158 178 241 Rate (%) 70.3 0.2 -1.6 70.7 0.2 0.0
Unemployment** Level (000s) 231 13 37 2,448 -20 -23
Rate (%) 8.6 0.4 1.4 7.7 -0.1 -0.1
Activity* Level (000s) 2,683 23 -16 31,607 158 217
Rate (%) 77.1 0.5 -0.5 76.8 0.2 -0.1
Inactivity*** Level (000s) 779 -18 20 9,280 -66 73
Rate (%) 22.9 -0.5 0.5 23.2 -0.2 0.1 Source: Labour Market Statistics (First Release), Scotland and UK, October 2010 * Levels are for those aged 16+, while rates are for those of working age (16-59/64) ** Levels and rates are for those aged 16+, rates are proportion of economically active. *** Levels and rates for those of working age (16-59/64) The claimant count rate at September 2010 stood at 4.8 per cent. This is down 1 per cent over the year (note these figures are taken from table 7 October 2010 figures and measures the number of claimants on the second Thursday of each month). Unemployment data at the Scottish constituency level for September 2010 is available in a SPICe Briefing, with the next update available 17th November 2010. Statistics from the Annual Population Survey (2009) provide some indications of the impact of the recession at local area levels, by occupation and by sector (the APS combines results from the Labour Force Survey and the Scottish Labour Force Survey boosts. Thus these figures differ slightly from those produce from the Labour Force Survey and the Annual Business Inquiry and from those published in Labour Market Statistics (First Release), Scotland and UK, October 2010). Table 2 indicates significant differences in employment, unemployment and inactivity rates before the onset of the recession, however, between 2008 and 2009 the gap between the areas with the highest and lowest employment rates widened by 5.8 percentage points. In January – September 2009 the increase in unemployment rates ranged from 0.5 percentage points to over 3 percentage points in six local authority areas. Inactivity rates varied considerably with some councils reporting increases, whereas others noted decreases. The most recent figures for the number of workforce jobs by industrial activity are detailed in Table 3. Total workforce job figures are a measure of jobs rather than people. Total seasonally adjusted employee jobs for the quarter ending
June 2010 (the latest available figures) stood at 2,539.3 thousand, up 21 thousand on the quarter but down some 5 thousand over the year. Table 3 provides some indication of the impact of the recession on sectors, with the numbers of total workforce jobs declining significantly in manufacturing, construction, wholesale/retail and financial services. Table 4 provides some limited indications of the experience of unemployment in terms of claimant count by age and duration. The latest figures suggest that 21,100 have been claiming benefit for more than a year, up 400 over the year (up 0.3% on the year), 21,000 have now been claiming benefit over 12 months (up 54.4% over the year). Data from the Annual Population Survey provides some indications of youth unemployment, in 2009 it is ‘estimated that there were 36,000 young people aged 16 to 19 not in education, employment or training (NEET), representing 13.8% of all 16 to 19 year olds’ (Local Labour Markets in Scotland 2010:40). This figure has increased by 5000 between 2008 and 2009 and if this trend increases it poses more strongly issues of social inclusion and raises significant questions for policy makers. Public sector employment in Scotland The increasing recognition of the likelihood of widespread job losses in the public sector prompts a consideration of the trends in public sector employment. As we noted in our last Commentary there has been much evidence to suggest that most Scottish public sector organisations have been planning considerable budget reductions in recent months, given that staff costs account for around 52% or £18.8
PAGE 42 VOLUME 34 NUMBER 2

FRASER ECONOMIC COMMENTARY
Table 2: Employment, unemployment and inactivity rates by Local Authority Area 2007 – 2009
Geography (Residence Based)
Employment rates Unemployment rates 16+* Economic inactivity rates 2007 2008 2009 2007 2008 2009 2007 2008 2009
Scotland
76.0%
75.6%
73.9%
4.7%
4.9%
7.0%
20.1%
20.3%
20.4%
Local Authority Area Aberdeen City 79.1% 79.4% 80.0% 3.7% 3.6% 4.1% 17.3% 17.6% 17.6% Aberdeenshire 82.6% 82.2% 82.5% 2.5% 2.6% 2.9% 15.6% 15.5% 15.2% Angus 79.1% 80.0% 77.0% 4.5% 4.6% 5.5% 16.2% 15.6% 18.1% Argyll & Bute 80.0% 77.6% 75.5% 4.0% 4.3% 5.6% 16.3% 18.4% 19.2% Clackmannanshire 69.4% 70.9% 72.3% 5.5% 5.4% 8.4% 25.3% 25.4% 22.3% Dumfries and Galloway 77.4% 76.2% 77.3% 4.2% 4.5% 5.5% 19.1% 19.5% 18.1% Dundee City 72.1% 71.5% 71.0% 6.6% 6.3% 8.9% 22.4% 23.9% 22.8% East Ayrshire 73.1% 74.6% 69.8% 6.3% 6.1% 9.8% 21.5% 20.4% 21.4% East Dunbartonshire 78.9% 77.6% 77.3% 3.1% 3.9% 6.0% 19.0% 18.7% 17.4% East Lothian 79.2% 77.9% 76.6% 3.5% 3.5% 5.4% 18.0% 19.4% 19.7% East Renfrewshire 77.2% 76.5% 74.5% 3.4% 3.6% 5.6% 19.1% 20.5% 20.9% Edinburgh, City of 77.4% 76.6% 73.8% 4.3% 4.5% 6.2% 19.5% 19.8% 20.9% Eilean Siar 79.4% 78.7% 73.2% 4.2% 4.6% 6.2% 17.7% 16.3% 18.8% Falkirk 78.1% 78.9% 75.0% 4.6% 4.4% 7.3% 18.5% 18.3% 19.5% Fife 75.9% 76.5% 73.0% 5.6% 5.8% 8.0% 18.8% 17.7% 19.3% Glasgow City 66.9% 66.6% 63.3% 6.8% 6.9% 10.3% 28.2% 28.8% 29.3% Highland 82.0% 81.7% 84.3% 3.2% 3.5% 4.3% 16.0% 16.3% 13.3% Inverclyde 68.4% 72.5% 68.5% 7.1% 6.4% 9.4% 24.8% 23.0% 23.9% Midlothian 80.7% 79.9% 77.2% 4.2% 4.2% 6.5% 15.1% 16.2% 15.1% Moray 80.4% 81.8% 80.5% 3.5% 3.8% 4.6% 17.2% 15.0% 15.0% North Ayrshire 71.5% 71.8% 67.0% 6.4% 7.4% 10.6% 23.5% 22.0% 24.1% North Lanarkshire 73.2% 71.0% 74.5% 5.4% 5.9% 8.6% 22.6% 23.8% 18.7% Orkney Islands 86.4% 83.9% 89.0% 2.7% 2.9% 2.4% 11.2% 14.2% * Perth and Kinross 78.1% 78.7% 78.0% 3.5% 3.7% 4.2% 18.8% 17.9% 18.6% Renfrewshire 75.0% 76.0% 73.6% 5.1% 5.5% 7.8% 20.9% 18.9% 19.8% Scottish Borders 81.4% 80.6% 77.3% 3.1% 3.6% 5.1% 16.2% 15.8% 16.4% Shetland Islands 88.1% 88.0% 86.5% 2.6% 2.8% 2.8% 10.4% 10.8% * South Ayrshire 77.2% 75.4% 73.0% 5.0% 5.4% 7.6% 18.9% 20.5% 20.3% South Lanarkshire 78.9% 76.7% 73.8% 4.2% 4.4% 7.4% 18.5% 20.6% 20.6% Stirling 76.8% 75.2% 74.3% 3.9% 4.5% 7.0% 19.2% 20.2% 18.8% West Dunbartonshire 73.9% 71.2% 68.9% 6.3% 6.9% 9.7% 20.8% 23.3% 24.3% West Lothian 77.8% 79.1% 74.8% 4.8% 4.6% 7.3% 17.7% 17.4% 20.1%
Source: Annual Population Survey (Jan to Dec) Notes: * data for Jan – Sept 2009 only Employment levels cover those aged 16 and over. Employment rates cover working age (men aged 16-64 and women aged 16-59). 1. Levels rounded to the nearest hundred. 2. Proportions are calculated on unrounded figures. 3. Totals may not equal the sum of individual parts due to rounding. 4. Note these figures differ from those published in Labour Market Statistics (First Release), Scotland and UK, October 2010
NOVEMBER 2010 PAGE 43

FRASER ECONOMIC COMMENTARY
PAGE 44 VOLUME 34 NUMBER 2
Table 3: Total workforce jobs* by industry, Scotland, June 2010
June 2005
June 2006
June 2007
June 2008
June 2009
June 2010
Industry
A : Agriculture, forestry and fishing 51,200 54,400 60,100 60,000 51,300 61,700 B : Mining and quarrying 24,500 27,900 30,000 30,300 27,700 28,900 C : Manufacturing 233,000 225,500 227,800 211,800 202,300 178,800 D : Electricity, gas, steam and air conditioning supply 10,000 9,500 12,500 12,300 10,800 12,900 E : Water supply; sewerage, waste management etc 15,600 17,500 17,100 18,700 22,200 15,000 F : Construction 181,000 193,700 202,600 198,800 166,000 176,400 G : Wholesale & retail trade; repair of motor vehicles etc 382,100 383,700 379,800 395,900 389,700 354,300 H : Transportation and storage 125,000 117,800 122,900 122,600 105,600 138,300 I : Accommodation and food service activities 188,700 189,800 188,100 190,900 164,700 194,800 J : Information and communication 72,400 72,600 79,300 68,800 72,900 76,900 K : Financial and insurance activities 114,300 107,300 91,300 98,000 92,300 86,400 L : Real estate activities 25,400 29,400 30,000 32,100 34,100 22,100 M : Professional, scientific and technical activities 145,200 154,000 161,000 175,600 174,400 154,100 N : Administrative and support service activities 174,200 179,900 191,600 199,500 184,200 187,300 O : Public administration & defence; social security 180,400 177,000 181,400 176,900 129,100 129,000 P : Education 198,600 199,900 192,200 207,600 219,800 209,500 Q : Human health and social work activities 384,100 399,400 383,300 397,600 386,800 369,900 R : Arts, entertainment and recreation 75,100 80,600 75,400 84,400 64,200 76,300 S : Other service activities 62,900 65,200 63,300 58,400 47,700 66,700 Column Total 2,643,500 2,685,100 2,689,700 2,740,100 2,545,900 2,539,300
Source: Labour Market Statistics (First Release), Scotland, June 2010 * Workforce jobs are a measure of jobs rather than people Table 4: Total claimant count and computerised claims by age and duration (Numbers and percentage change over year to September 2010) All claims All computerised
claims Up to 6 months All computerised
claims Over 6 and up to 12 months
All computerised claims All over 12
months All 16+ numbers 130,000 83,800 24,700 21,100 All 16+ % change over year 0.3 -5.2 -8.2 54.4 All 18 – 24 over year 37,100 29,900 5,300 1,900 All 25- 49 over year 71,700 42,000 15,200 20,100 All 50 and above over year 19,500 10,800 4,000 4,800 billion of Scottish public spending (Audit Scotland). Audit Scotland noted ‘the Scottish public sector is facing the biggest squeeze on budgets since devolution’ (2009:8). Since the last Commentary there have been further announcements as to planned cuts across the public sector as well as proposals for re organisation (merging services
across authorities and services, and the merger of all or a number of police services). However, to date these cuts have still to work though to actual reductions in public sector employment. Public sector employment has declined by 1.3% or 8,100 in the year q2 2009 – q2 2010. In the same period devolved

FRASER ECONOMIC COMMENTARY
Table 5: Total public sector employment in Scotland (headcount) quarter 2 2010
Broad category Area Q1 2010 Q2 2010 Civil Service Scottish Govt Depts. 5700 5700 Crown Office 1900 1800 Scottish Govt Agencies 8300 6800 Non ministerial Depts. 1800 3400 Total Civil Service 17600 Local Government Teachers 62700 61100 Other education 51600 51000 Social work 54700 54000 Police & Related services 24900 24800 Fire & related services 5800 5700 Other 104700 105200 Total Local Government 304300 301900 NHS 163000 162200 Public Corporations 4600 4600 Other public bodies 16100 15400 Total devolved sector 506000 Armed forces 12100 Civil Service Min of Defence 5900 5900 HM Revenue & Customs 10000 9800 DWP 12200 12000 Dept for International Dev. 500 500 Scotland Office 70 70 Other Civil service 3900 3900 Civil service 32600 32100 Public corporations 17600 17400 Public bodies 5800 5900 Public sector financial 36300 36700 Total reserved sector 104300 104300 Total Scottish employment 610,200 606400
Source: Quarterly Public Sector Employment series, Scottish Government. Note: figures may not total due to rounding.
NOVEMBER 2010 PAGE 45

FRASER ECONOMIC COMMENTARY
Table 6: Local Government employment by local authority (headcount) Q1 and Q2 2010 (Not seasonally adjusted)
Q1 2010 Total All Staff
Q2 2010 Total All Staff
Local Authority / Joint Board
Aberdeen City 9,500 9,400 Aberdeenshire 15,000 14,900 Angus 5,700 5,600 Argyll & Bute 5,300 5,200 Clackmannanshire 2,800 2,800 Dumfries & Galloway 8,300 8,300 Dundee City 8,200 8,100 East Ayrshire 6,700 6,600 East Dunbartonshire 5,000 5,000 East Lothian 4,900 4,800 East Renfrewshire 4,700 4,500 Edinburgh, City of 19,100 18,800 Eilean Siar 2,600 2,500 Falkirk 8,000 7,800 Fife 23,200 23,100 Glasgow City 23,500 23,100 Highland 12,900 13,000 Inverclyde 4,700 4,700 Midlothian 4,800 4,800 Moray 5,100 5,100 North Ayrshire 7,200 7,200 North Lanarkshire 17,700 17,500 Orkney Islands 2,800 2,400 Perth & Kinross 6,200 6,100 Renfrewshire 8,600 8,400 Scottish Borders 5,700 5,700 Shetland Islands 4,100 4,100 South Ayrshire 5,500 5,600 South Lanarkshire 15,500 15,800 Stirling 4,500 4,400 West Dunbartonshire 6,700 6,300 West Lothian 8,500 8,500 Total Bridge Joint Boards 100 100 Total Fire Joint Boards 5,800 5,700 Total Police Joint Boards 24,900 24,800 Total Valuation Joint Boards 600 600 Total Regional Transport (SPT) 700
SCOTLAND 304,300 301,900 Source: Joint Staffing Watch Survey, Scottish Government Notes:
1. Figures are rounded to nearest hundred. 2. Totals may not add to the sum of the parts due to rounding. 3. Figures for Fire Service staff exclude volunteer and retained fire-fighters. 4. Police and Fire Service staffs in Dumfries and Galloway and Fife, who are not covered by Joint Boards, are included within the
figures for Joint Boards for consistency.
PAGE 46 VOLUME 34 NUMBER 2
FRASER ECONOMIC COMMENTARY
public sector employment has decreased by 3,200 to 502,200 and employment in the reserved public sector has decreased by 5,000, or 4.6%. The largest decrease occurring in public sector financial institutions, down 2,800 to 36,700. Table 5 indicates the headcount changes in public sector employment over the first two quarters of 2010, and table 6 the changes in headcount by local authority headcount. Table 5, drawing on the latest available data, Q2 2010, indicates 569,000 (23.2% of the headcount numbers employed in Scotland) employed in the Scottish public sector (excluding those employed by RBS and Lloyds who have been reclassified as UK wide public corporations), and table 6 outlines headcount employment at the local authority level. We noted in the last Overview evidence from the Pay Review Body on Senior Salaries, that in the UK over 25,000 people working in the public sector earn more than £100,000 and that data from Incomes Data Services (2009) suggested the distribution of total earnings of lead executives in selected National/Regional public bodies ranged from £72,000 to £262,500 with a median of £157,000. The comparable figures for non ministerial government departments indicated a range from £82,500 to £272,500 with a median of £187,500; and for public corporations a range from £130,000 to £679,800 with a median of £314,800. The focus on public sector pay was heightened by BBC research which suggested that slightly over 3,400 public sector staff in Scotland earned over £100,000 (and slightly more than 60 earned over £200,000). Inevitably comment tended to focus on what were seen as excessively higher rates of public sector pay. Whilst the rate of earnings and the sector distribution of these (health 2591, higher education 416 and Scottish government 229) are interesting, they do not answer more important questions, namely: What has been the relative escalation of these pay rates in recent years and to what extent are they dependent on performance criteria? If these changes are fairly recent what mechanisms used to exist to prevent such a rapid escalation? How do these rates compare with other European countries? Is the rate and level broadly the same across other countries, or are certain occupations and sectors better or lower paid in Scotland compared to other EU countries? How do these rates compare to the private sector? Recent work by Incomes Data Services (August 2010), reviewing pay and earnings for CEOs in companies listed on the Alternative Investment Market, enables some comparisons to be made between the rates for senior public and private sector earnings. The average CEO salary in AIM
listed companies now exceeds £200,000 per annum, which with the addition of bonuses and other incentives lifts total earnings to £288,917. This would suggest that at the higher levels public sector pay is not excessively high. Data from Income Data Services Review of Senior executive pay (November 2010) covering earnings of UK’s 100 largest companies suggests CEO pay is now on average 88 times the pay of typical full-time workers, ten years ago the average pay was 47 times the average wage (in 2008 CEOs earned 94 times the average wage). Outlook In the year to August 2010 total employment fell by 53,000 and unemployment rose by 37,000 to 231,000 and the numbers economically inactive rose by 20,000. The pattern of employment continues to change with rising numbers of part time (up 19,000 in the year to December 2009), temporary employees (up 16,000 over the same period) and workers with a second job (up 3,000 over the same period and declining numbers of full-time workers (down 58,000 in the year to December 2009). Over the same period the numbers of part time workers who could not find a full time job rose by 20,000 (30.4%). As we noted in the last Commentary, unemployment in 1980 totalled 202,000 (with an ILO unemployment rate of 7%). Unemployment rose through the 1980s to 351,000 in 1986 and the unemployment rate (ILO definition) peaked at 13.7% in 1986. By 1988 unemployment fell below 300,000, reaching 212,000 in 1997 but only fell below 200,000 in 1998. Between 1998 and 2008 unemployment fell by 72,000 to 113,000 (an ILO rate of 4.2%). Since April 2008 unemployment has more than doubled to 231,000 and the unemployment rate has increased to 8.6%. Data from the latest Annual Population Survey shows the variation in employment rates across Scotland in the period 2004 – 2009. Employment rates in the most deprived areas have been consistently lower than the national figures, and since 2008 the difference has increased (table 7). In 2004 the employment rate in the 15% most deprived areas was 19.8 percentage points lower than the Scottish figure, in 2008 15.4 percentage points and in 2009 16.4 percentage points. Table 8 illustrates the figures for unemployment, again illustrating the long term trends in deprivation with areas with consistently higher levels of unemployment; again these show the differing effects of the recession. In 2008 unemployment in the 15 most deprived areas was 5.1 percentage points by 2009 this had risen to 8.2 percentage points. Table 9 illustrates the comparable figures for inactivity, again illustrating differences in levels of inactivity between the 15% most deprived areas and the Scottish averages. It is difficult to see why these trends will not worsen as public sector cuts take effect. It will be harder to sustain
NOVEMBER 2010 PAGE 47

FRASER ECONOMIC COMMENTARY
Table 7: Employment rates and levels by deprivation 2007-2009
2007 2008 2009 Employment proportion level proportion level proportion level Scotland 76.0% 2,524,000 75.6% 2,529,900 73.9% 2,490,400 15% most deprived 59.2% 265,400 60.2% 280,600 57.5% 271,500 Rest of Scotland 78.8% 2,232,100 78.2% 2,248,700 76.6% 2,218,900
Table 8: Unemployment rates and levels by deprivation 2007-2009
2007 2008 2009 Unemployment proportion level proportion level proportion level Scotland 4.7% 125,100 4.9% 130,400 7.0% 186,800 15% most deprived 11.3% 35,000 10.0% 31,100 15.2% 48,800 Rest of Scotland 3.9% 90,100 4.2% 99,300 5.9% 138,000
Table 9: Inactivity rates and levels by deprivation 2007–2009
2007 2008 2009 Inactivity proportion level proportion level proportion level Scotland 20.1 644,399 20.3 653,800 20.4 656,100 15% most deprived 33.1 149,700 33.0 149,700 32.0 146,200 Rest of Scotland 18.0 494,600 18.3 504,100 18.4 509,900
policies of social inclusion over the next few years; policies to reduce those on benefits and to encourage a return to work are dependent on work being available. _____________________ References Incomes Data Services ( 2009) IDS Compensation Review 346 Incomes Data Services (2010) Executive Compensation Review 354. Incomes Data Services (2010) Executive Compensation Review November issue Review Body on Senior Salaries (2010). Initial report on Public Sector Senior Remuneration 2010. Report no 74. Cm 7848. Cliff Lockyer November 2010
____________________ Endnotes: 1The Census 2001-consistent population figures at local authority level were released in February 2003. This has allowed the production of interim regional LFS estimates. The population data only cover the periods up to mid-2001. The data presented here are taken mainly from Labour Market Statistics, May 2008 and are consistent with the updated LFS data available on NOMIS from summer 2004. Labour Market Statistics continue to report data for Scotland at the quarterly level, so this will continue to form the basis of our analysis of movements in the labour market between quarters. 2The Labour Force Survey definition of ILO unemployment takes precedence over the claimant count measure. ILO unemployment is much less sensitive to changes in the regulations governing unemployment benefit, and conforms to a widely accepted standard to allow for more meaningful cross-country comparisons.
PAGE 48 VOLUME 34 NUMBER 2

FRASER ECONOMIC COMMENTARY
Economic perspectives
*Financial support from the Economic and Social Research Council under grant: RES-171-25-0032, “The overall impact of higher education institutions on regional economics in the UK” is gratefully acknowledged Opinions expressed in economic perspectives are those of the authors and not necessarily those of the Fraser of Allander Institute
Under employment of Scottish graduates?*
Irene Mosca, Trinity College Dublin Robert E Wright, University of Strathclyde Under-employment of Scottish Graduates? 1. Introduction Over the last 25 years, there has been a large increase in the number of young Scots participating in higher education (HE). This rising trend is illustrated in Figure 1, which shows the “age participation index (API)” for the academic years 1983/84 to 2008/09. This measure is an estimate of the percentage of 17 year olds who will participate in HE for the first time before their 21st birthday. In the academic year 1983/1984, the API was 18.9%. By 2001/02, it had surpassed 50%—the much championed target set by the Labour Government elected in 1997. However, since this peak, the API has declined. Although it increased in 2008/09 to 44.8% (undoubtedly driven by the unfavourable labour market conditions caused by the global recession), this is about the same rate as in the late 1990’s (Scottish Government, 2010a). Nevertheless, participation in HE is higher in Scotland compared to the other countries in the UK, with England, for example, having a considerable way to go meet the 50% target. As Figure 2 suggests, this trend in participation has contributed to a steady long-term increase in the number of HE students studying in Scotland. The other factor contributing to this trend has been a sharp increase (particularly over the past decade) in the number of European Union and overseas students, along with students from other countries of the UK, coming to study in Scotland (see Faggian, Li and Wright, 2009). It is important to note that in Scotland it is possible to study for higher education qualifications at certain colleges as well as the more traditional “higher education institutions” (HEIs), which are mainly the universities.1 About 80% of HE students are attending HEIs, with most studying for degrees. On the other hand, the majority of those attending colleges are studying for qualifications below degree level (Scottish Government, 2010b). This difference is important to remember because the analysis carried out below is restricted to those studying at HEIs. In the period 1994/95 to 2008/09, the number of higher education students studying in Scotland increased from around 208 thousand to 280 thousand - an increase of 35%. It is often argued both by politicians and the media that there is an “over-education” problem in Scotland, with the higher education sector generating too many graduates for the economy to absorb. It is argued further that this over-
NOVEMBER 2010 PAGE 49

FRASER ECONOMIC COMMENTARY
PAGE 50 VOLUME 34 NUMBER 2
Figure 1: Higher education age participation index, Scotland, 1983/94 to 2008/09
15
20
25
30
35
40
45
50
55
1984 1985 1986 1987 1988 1989 1990 1991 1992 1993 1994 1995 1996 1997 1998 1999 2000 2001 2002 2003 2004 2005 2006 2007 2008 2009
Perc
enta
ge
Year
Source: Scottish Government (2010a)

FRASER ECONOMIC COMMENTARY
NOVEMBER 2010 PAGE 51
Figure 2: Number of higher education students, Scotland, 1994/95-2007/08
2009
Higher Education Institutions onlyAll institutions
200820072006200520042003
Year
20022001
Scource: Higher Education Statistical Agency (2010a) /Scottish Government (2010b)
200019991998199719961995
300,000
280,000
260,000
240,000
220,000
200,000
180,000
160,000
140,000
120,000
100,000
Number of students

FRASER ECONOMIC COMMENTARY
education generates the undesirable outcome of “under-employment”. Under-employment is the employment of workers with skills in jobs that do not require those skills to perform the required work (see McGuinness, 2006). A textbook example would be a medical doctor who drives a taxi. This paper examines empirically the extent of under-employment amongst Scottish higher education institutions graduates. More specifically, micro-data data collected by the Higher Education Statistical Agency (HESA) is used to calculate the rates of employment in so-called “non-graduate” jobs. Both undergraduate and postgraduate graduates are considered. Overall, the analysis suggests that under-employment is a serious problem, especially amongst undergraduate graduates and is a problem that does disappear with age and experience. However, that the under-employment of Scottish HEI graduates is similar to that of UK HEI graduates more generally. In this sense, it is not a “Scotland-specific problem”. 2. Data The analysis is based on micro-data collected by HESA. More specifically, information is merged from two data-sets for five graduation cohorts of HEI students, covering the academic years 2002/03 to 2006/07. The first data-set is the Students in Higher Education Institutions.2 This primarily consists of information provided by the HEI at which the individual studied. As is discussed in more detail below, variables include subject of study, level of study, class of qualification, mode of study, age, gender and place of domicile. The second data-set is the Destinations of Leavers from Higher Education Institutions (DLHE).3 This data is collected through a questionnaire administered approximately six months after the student has graduated. Detailed information about employment and further study is collected. However, it is only collected for UK-domiciled graduates and not for EU or overseas graduates even if they stayed in the UK to work after graduation. The DLHE data is also collected for UK-domiciled graduates who have moved abroad (see Mosca and Wright, 2010). There is no agreed definition of what constitutes a “non-graduate job”. The definition that we use is based on research carried out by Elias and Purcell (2004). They examined each of the 353 unit groups of the 2000 Standard Occupational Classification (SOC) and classified each unit into the type of skills needed to do the required work. They arrived at a five-fold classification:
1. Traditional graduate: the established professions, for which, historically, the normal route has been via an undergraduate degree programme (e.g. solicitors and doctors);
2. Modern graduate: the newer professions,
particularly in management, IT and creative vocational areas, which graduates have been
entering since educational expansion in the 1960s (e.g. computer programmers and journalists);
3. New graduate: areas of employment, many in new
or expanding occupations, where the route into the professional area has recently changed such that it is now via an undergraduate degree programme (e.g. physiotherapists and sale managers);
4. Niche graduate: occupations where the majority of
incumbents are not graduates, but within which there are stable or growing specialist niches which require higher education skills and knowledge (e.g. nurses and hotel managers); and
5. Non graduate: occupations for which a graduate
level education is inappropriate (e.g. school secretaries and bar staff).
It is clear that categories (1), (2) and (3) are “graduate jobs”. In these occupations, the skills obtained through higher education are needed for both entry and to carry out the required tasks. It is also clear that (5) are “non-graduate jobs” (e.g. the bartender with the marketing degree). However, it is not at all clear with respect to (4). Essentially these are jobs that traditionally did not need higher education with the skills needed to carry out the tasks of employment gained mainly through on-the-job training. One can also think of these jobs as being those that hire both individuals with and without higher education. In the analysis below, we assume that a graduate is in a non-graduate job only if their occupation is included in (5). If it is the case, that a large share of the occupations in (4) are in reality non-graduate jobs, then the estimates of under-employment presented below are likely to be lower bounds with the actual level being higher. One weakness of using the DHLE data to measure underemployment is that the employment is measured only six months after graduation. One view that it takes much longer for graduates to establish themselves in the labour market. This suggests that more can be learned about under-employment by considering employment circumstances further along the career path. Data of this type has recently been collected as part of HESA’s Destinations of Leavers from Higher Education Longitudinal Survey (HESA, 2007). In this survey the 2002/03 cohort of graduates were interviewed 3½ years later (i.e. in the winter of 2006/07). The descriptive analysis of the this data carried out by National Centre for Social Research suggest there are key differences between what is observed six months after graduation compared to 42 months after graduation. 3. Findings We consider two groups of graduates. The first are “undergraduate graduates”, while the second are “postgraduate graduates”. Research not reported here suggests that these two groups are considerably different and should be treated separately. This is not surprising
PAGE 52 VOLUME 34 NUMBER 2

FRASER ECONOMIC COMMENTARY
Table 1: Labour market activity (%) – 2002/03-2006/07 HEI graduate cohorts Place of Study Scotland UK (a) Undergraduate graduates
Employed 72.1% 72.7% Unemployed 4.9% 5.7% Further study 17.4% 15.1% Not in labour force 5.6% 6.4% Total 100% 100%
(b) Postgraduate graduates Employed 89.3% 87.7% Unemployed 3.0% 3.1% Further study 4.8% 5.1% Not in labour force 2.9% 4.1% Total 100% 100% Table 2: Graduate-jobs rates six months after graduation (%) - 2002/03-2006/07 HEI graduate cohorts Place of Study Scotland UK
(a) Undergraduate graduates 68.2% 65.4% (b) Postgraduate graduates 92.8% 92.2% Notes: As a percentage of those employed. given that postgraduate graduates are older on average, and it is almost always the case that postgraduate graduates have some form of undergraduate qualification. When the data is pooled across the five cohorts, the resulting sample size is over 400,000 individuals. Table 1 reports labour market activity measured six months after graduation. Several points about this table are worth making. With respect to undergraduate graduates, the employment rate of Scottish graduates is 72.1%, which is very similar to the employment rate of UK graduates of 72.7%. However, the unemployment rate of Scottish graduates of 4.9% is slightly lower that the rate of UK graduates of 5.7%. The participation rate in further study is higher for Scottish graduates at 17.4% compared to 15.1% for UK graduates. The percentage of graduates who classify themselves as “not in the labour force” is higher at 6.4% for UK graduates compared to 5.6% for Scottish graduates. This category includes graduates who, for example, are caring for relatives or are too ill to work. As Table 1 shows, the employment rate of postgraduate graduates is much higher than for undergraduate graduates six months after graduation. This is the case for both Scottish graduates and UK graduates. The employment rate is 17.2 percentage points higher for Scottish postgraduate graduates (89.3%) compared to undergraduate graduates
(72.1%). The gap is slightly smaller for UK graduates—the employment rate is 15.0 percentage points higher for UK postgraduate graduates (87.7 percent) compared to undergraduate graduates (72.7%). This higher level of employment is largely accounted for (in an arithmetic sense) by a much lower participation rate in further study and to a lesser extent by a lower unemployment and not in labour force rates. Although there are differences between Scottish and UK postgraduates graduates (e.g. the Scottish employment rate is slightly higher), it is not unreasonable to conclude that differences between the two groups are not massive. Table 2 reports the share of graduates in graduate jobs six months after graduation. It is important to stress that this share is of those who are employed. That is, to be included in the calculation of this “graduate-job rate”, the graduate must be working either full-time or part-time. In this sense, it is not directly comparable to the “employment rate” shown in Table 1. With respect to undergraduate graduates, the graduate-job rate of Scottish graduates of 68.2% is higher than the rate for UK graduates of 65.4%. That is, for both groups of graduates, around one-in-three are in non-graduate jobs six months after graduation. By any account, this is a large
NOVEMBER 2010 PAGE 53

FRASER ECONOMIC COMMENTARY
Table 3: Graduate-jobs’ rates six months after graduation by place of domicile (%) - 2002/03-2006/07 Scottish HEI graduate cohorts Place of Study Scotland Place of Domicile
Scotland
Rest of UK
(a) Undergraduate graduates
67.7%
70.9%
(b) Postgraduate graduates 93.5%
89.5%
Notes: As a percentage of those employed. Table 4: Employment rates and graduate-jobs rates six months and 42 months after graduation (%) 2002/03 HEI Cohort Place of Study
Scotland UK
Employed
Graduate- job rate1
Employed
Graduate- job rate1
(a) Undergraduate graduates 6 months 73.0% 63.3% 73.4% 66.1% 42 months 88.5% 80.0% 88.1% 78.3%
(b) Postgraduate graduates 6 months
87.3%
90.3%
89.3%
93.0%
42 months 92.9% 91.4% 92.7% 92.9% 1Notes: As a percentage of those employed. share. The situation is different for postgraduate graduates. The graduate-job employment rate of Scottish postgraduate graduates is 92.8%, which is marginally lower than the rate for UK graduates of 92.2%. That is, less than one-in-ten are in a non-graduate job six months after graduation. Even though there appear not be huge differences between Scottish and UK graduates, postgraduate graduates have a much higher probability of being in graduate jobs compared to undergraduate graduates. Table 3 show the graduate-job employment rates broken down by place of domicile. As was discussed above, place of domicile for the vast majority of graduates is the country where they completed their secondary schooling. With respect to undergraduate graduates, the graduate-job rate for Scotland-domiciled graduates is 76.7%, which is lower than the rate for “rest of UK domiciled” graduates of 70.9% (i.e. those who completed their secondary schooling in England, Northern Ireland or Wales). However, the opposite is the case for postgraduate graduates—the graduate-job rate for Scotland-domiciled graduates is 93.5%, which is higher than the rate for “rest of UK-domiciled” graduates of 89.5%. For both groups, the graduate-job rate is substantially higher for postgraduate graduates compared to undergraduate graduates.
It is often argued that graduate-job rates calculated six months after graduation are meaningless since it takes individuals much more time to establish themselves in the labour market. We do not prescribe to this view since there is too much systematic variation across observable characteristics such as class of degree, type of institution attended, subject studied and age at graduation, for this to be universally the case. Unfortunately space does not allow us to present statistical findings in support of this conclusion. It is clear however that employment and graduate-job rates both increase as the graduate ages. Evidence in support of this is presented in Table 4. This table shows the employment rates and graduate-job rates measured at six months and 42 months after graduation for the 2002/03 cohort of HEI graduates. For Scottish undergraduate graduates, the employment rate increases from 73.0% at six months to 88.5% at 42 months. Likewise, the graduate-job rate increases from 63.3% at six months to 80.0% at 42 months. In our view, there is considerable underemployment amongst graduates of Scottish HEIs even 3½ years after graduation, with one-in-five being employed in non-graduate jobs. The situation is very similar when the UK is considered as a whole. We believe that an under-employment rate of
PAGE 54 VOLUME 34 NUMBER 2

FRASER ECONOMIC COMMENTARY
around 20% cannot be explained away by life cycle considerations. Table 4 shows the situation is less pronounced for postgraduate graduates. Both employment and graduate-job rates are higher at 42 months compared to six months after graduation. As was found earlier, both rates are higher for postgraduate graduates than for undergraduate graduates. At 42 months after graduation, both employment and graduate-job rates are over 90%. The situation is again similar for Scottish and UK post-graduate graduates. However, even 42 months after graduation, 8.6% of Scottish and 7.1% of UK post-graduate graduates are employed in non-graduate jobs. Although this is considerably less than what was found for undergraduate graduates (c. 20%), it is not an insignificant share, remembering that most postgraduates graduates have at least two higher education qualifications. 4. Concluding comments Are over-education and under-employment problems in Scotland? The estimates presented in this paper suggest that this is true, especially for undergraduate graduates. Around one-third of undergraduate graduates from Scottish HEIs, who are employed six months after graduation, find themselves in jobs that do not require the skills they obtained through their study. The rate of employment in non-graduate jobs does appear to decline over time, as individuals age, gain more work experience, and obtain more information about the way in which labour markets operate. However, even 3½ years after graduation, underemployment amongst Scottish undergraduate graduates is still a problem. Evidence from one cohort of Scottish graduates suggests that around 20% are still employed in non-graduate jobs 3½ years after graduation. It is important to stress that the situation in Scotland is very similar to the UK as a whole. The estimates presented in this paper do not indicate huge nor systematic differences between Scotland and the UK as whole. Some might find this surprising given the differences in the education systems between Scotland, England and Northern Ireland, most notably the higher rates of HEI participation of Scottish young adults. ____________________ References Faggian, A., Q.C. Li and R.E. Wright, (2009),”Graduate Migration Flows in Scotland”, Fraser of Allander Economic Quarterly vol. 33, no. 1, pp. 55-60. Elias, P. and K. Purcell, (2004), SOC (HE): A Classification of Occupations for Studying the Graduate Labour Market, ESRU Research Paper no. 6, University of Warwick HESA, (2007), Destinations of Leavers from Higher Education Institutions Longitudinal Survey of the 2002/03
Cohort: Key Findings Report, Cheltenham/London, Higher Education Statistical Agency/National Centre for Social Research. HESA, (2010a), Students in Higher Education Institutions, Cheltenham, Higher Education Statistical Agency HESA, (2010b), Destinations of Leavers from Higher Education Institutions, Cheltenham, Higher Education Statistical Agency. Mosca, I. and R.E. Wright, (2010), National and International Graduate Migration Flows”, Population Trends, vol. 141, pp. 36-53. McGuinness, S., (2006), “Overeducation in the Labour Market”, Journal of Economic Surveys, vol. 20, no. 3, pp. 387-418. Scottish Government, (2010a), Age Participation Index for Scotland 2008-09, Life Long Learning Series, Edinburgh Scottish Government, (2010b), Students in Higher Education at Scottish Institutions 2008-09, Life Long Learning Series, Edinburgh ____________________ Endnotes 1 The current Scottish HEIs are: University of Aberdeen, University of Abertay Dundee, University of Dundee, Edinburgh College of Art, Edinburgh Napier University, University of Edinburgh, Glasgow Caledonian University, Glasgow School of Art, University of Glasgow, Heriot-Watt University, Queen Margaret University, Robert Gordon University, Royal Scottish Academy of Music and Drama, University of St Andrews, Scottish Agricultural College, University of Stirling, University of Strathclyde, UHI Millennium Institute and University of the West of Scotland. There are currently 35 colleges that award higher education qualifications: Aberdeen College, Adam Smith College, Angus College, Anniesland College, Banff & Buchan College , Barony College, Borders College, Cardonald College, Carnegie College, Central College of Commerce, Clydebank College, Coatbridge College, Cumbernauld College, Dumfries and Galloway College, Edinburgh's Telford College, Elmwood College, Forth Valley College, Glasgow College of Nautical Studies, Glasgow Metropolitan College, James Watt College, Jewel and Esk Valley College, John Wheatley College, Kilmarnock College, Langside College, Motherwell College, Newbattle Abbey College, North Glasgow College, Oatridge Agricultural College, Reid Kerr College, South Lanarkshire College, Stevenson College, Stow College and West Lothian College. 2For background information and descriptive cross-tabulations see the following annual publication: Students in Higher Education Institutions, Cheltenham, and Higher Education Statistical Agency. 3For background information and descriptive cross-tabulations see the following annual publication: Destinations of Leavers from Higher Education Institutions, Cheltenham, Higher Education Statistical Agency.
NOVEMBER 2010 PAGE 55

FRASER ECONOMIC COMMENTARY
PAGE 56 VOLUME 34 NUMBER 2
Wildlife Tourism in Scotland – the
example of grouse shooting
Stewart Dunlop, Fraser of Allander Institute Adam Smith, Game & Wildlife Conservation Trust Scotland Introduction Wildlife tourism in Scotland has seen a recent increase in profile, with two reports providing new figures on the economic value of the activity. The reports, by the Scottish Government and Scottish Natural Heritage (SNH), seem likely to generate policy responses to further develop the sector. For example, the Tourism Minister noted that wildlife tourism is a growing sector in Scotland, and the ministerial statement following the publication of the SNH study concluded that:
"Nature based tourism generates significant benefits for the economy, including thousands of jobs. It's vital that work on the conservation and enhancement of our natural environment continues to ensure we can deliver these benefits for generations to come."
Both reports estimated the economic contribution arising from tourism activities that rely on Scotland’s countryside. The SNH study examined a wide range of activities, including field sports, adventure activities such as mountain biking, surfing and sailing and walking, climbing and mountaineering. Using a very wide definition of wildlife tourism, it argued that spending on nature activities accounted for nearly 40% of all tourism spending. However, the study did not include any assessment of the environmental impact of these activities. The study by Bournemouth University 1 used a much tighter definition of wildlife tourism and provides a more direct assessment of its impact. The major difference from the SNH study is that it considered only the activity created by those for whom the prime purpose of their trip was to view or study wildlife and it assessed that wildlife tourism accounted for 5.2% of domestic and 3.1% of overseas tourist trips. However, while it is a carefully researched study of part of the overall sector, it specifically excluded a number of other important wildlife activities such as hunting or fishing2. Despite their superficial similarities these studies produced dissimilar estimates of contributions to Scotland’s economy
from countryside based tourism activities. In addition, neither considered any inter-relationship between wildlife tourism and the wider management of the environment that they rely on. This paper reports on a study that adds to both aspects of wildlife tourism in Scotland by examining in detail one area of this, grouse shooting on Scottish moors. Background The Game Conservancy Scottish Research Trust (GCSRT) was created in 1984 when Government advised moorland owners to research the practical and economic challenges and public benefits of managing moorland for driven grouse so that rural policy could be improved. The Red Grouse (Lagopus lagopus scoticus L.) was already known an iconic sporting gamebird, but by the mid 1980’s the Scottish population was in decline in response to loss of habitat, predation pressure and emerging disease threats. By 2007 this decline triggered the move of the red grouse to ‘amber’ conservation status. This is of concern not only to those who shoot grouse but to the public at large because research was suggesting that red grouse may be an ‘umbrella species’. A simplistic explanation of this is concept is that the management of habitats, predators and parasites with the principle aim of supporting sustainably harvestable surpluses of red grouse can be shown to deliver a wide range of ecosystem services. Research undertaken by the Game & Wildlife Conservation Trust and its predecessors now show that the biodiversity of moorland managed for red grouse, rather than that grazed primarily by sheep and deer, has enhanced wading bird, invertebrate and bryophyte populations. Research also shows that red grouse focussed management also helps retain heather moorland, an internationally important habitat and can drive reductions in zoonotic parasites such as sheep ticks. These biodiversity services however are only part of a suite of ecosystem services stimulated by grouse shooting. As a part of the research programme the GCSRT has also supported a number of economic studies of Scotland’s grouse moors. A recent study commissioned by the Game & Wildlife Conservation Trust from the Fraser of Allander Institute (FAI)3 is the fourth in this series examining the economics of grouse moors in Scotland, with previous reports published in 1991, 1996 and 20014. This series of reports thus allows an examination of several aspects of long term change in the industry. The key objective of the research was to assess the economic contribution made by upland estates to the Scottish economy, particularly the contribution made by grouse shooting. However, it also involved a wider assessment of the state of the industry, and examined issues such as the proportion of estates actively involved in shooting, the current extent of activity (for example, the number of days shooting on these estates), shooting fees and changes in how shooting was provided. The study also

FRASER ECONOMIC COMMENTARY
Figure 1: Estate size distribution (acres) 2001 and 2009
Figure 2: Location of estates
19.3
27.7
20.5
32.5
0
5
10
15
20
25
30
35
Aberdeenshire Highland Perth & Kinross Other
%
NOVEMBER 2010 PAGE 57

FRASER ECONOMIC COMMENTARY
PAGE 58 VOLUME 34 NUMBER 2
Figure 3: Shooting provision
35.2
57.8
34.9
59.1
0
10
20
30
40
50
60
70
Wholly Owner Other
%
2009
2005-09
Figure 4: Days shooting by estate size, 2009
2.9
7.8 7.9
6.7
0
1
2
3
4
5
6
7
8
9
Under 2,000 2-5,000 5-10,000 Over 10,000
Average number of days
Estate Size

FRASER ECONOMIC COMMENTARY
considered how investment by the estates contributes to the conservation and maintenance of the Scottish countryside. In addition to key economic task of estimating the amount of activity generated by shooting, it also examined other economic measures, including employment, expenditure, the amount of expenditure made locally in Scotland and some analysis of the change in grouse profitability. Methodology Information was collected by a questionnaire survey to moor 267 estates (304 moors) owners, using a database collated by the Game & Wildlife Conservation Trust (GWCT) (Scotland). This database was compiled from a number of different sources using the primary guide that the moor was likely to have shot grouse in the previous five years. The size of the sample frame in the 2010 study was considerably larger than that used in previous exercises – for example, the 2001 sample frame consisted of only 116 estates. The benefit of this much larger sample frame is that the current results almost certainly provide a more accurate estimate of the actual extent of grouse shooting in Scotland. This is also reflected in terms of the numbers returned, with the 2010 survey receiving 92 returns, significantly above the 64 received in 2001. We firstly summarise the data provided by the 92 responding moors, and include an analysis of a range of issues, including moor size, days shooting, the number of birds harvested5, spending by the estates and estate employment. Figures are provided both for all estate activity and specifically for grouse. As 30.3% of estates responded to our questionnaire survey, however, the responses from these estates clearly account for only a sample of the total of activity. We therefore also provide an estimate of total activity across all estates. The structure of shooting in Scotland Estate background
• Moor size The total moor area on the 92 estates equalled 551,064 hectares. We estimate that the sample 92 moors alone thus account for around 7% of Scotland’s total land area6. This area is over one quarter greater (27.6%) than the land area represented by respondents to the 2001 study.
Figure 1 compares the size distribution of responding estates now and in 2001. There is a fair degree of parity between the two time periods, although smaller estates now account for a greater proportion of the sample - this may have been due to some fragmentation of estates in the past 10 years leading to fewer mid-size moors. The proportion of large estates remained largely
unchanged, and we note below that larger estates are not necessarily the ones where we see the majority of grouse activity (see Figure 4).
• Estates by location
Figure 2 details the location of estates. Estates are concentrated in the North of Scotland, with the three major areas (Aberdeenshire, Highland and Perth & Kinross) accounting for two-thirds of estates.
Survey responses indicated that grouse shooting was a common activity on the majority of estates - in 2009, grouse shooting took place on 75 moors or 81.5% of all survey respondents. This is comparable to the position between 2005-09, when shooting took place on 82.6% of estates. Shooting appears to have taken place regularly across the majority of estates and thus appears to make an ongoing contribution to economic activity in the remoter rural areas where estates are located.
However, we also note that there also appears to have been a reduction in the proportion of estates offering shooting since the time of our last study. Our previous (2001) report indicated that shooting took place on 93.8% of the estates. This may reflect a reduced availability of grouse since 2000, a point we examine further below when we examine figures on grouse bags. However, despite a fall in the number of shooting estates, survey results (see below) actually show an increased level of activity on those estates that continue to offer shooting.
• Shooting provision
Figure 3 details how grouse shooting was provided, both in 2009 and between 2005-09, and focuses on whether any shooting that occurred was for the private use of estate owners or whether the estate provided commercial shooting. Figure 3 shows little change in the type of provision over the time period shown. However, an increasing trend towards the commercial letting of grouse shooting (rather than the retention solely for the owner’s use) is evident if we compare the figures in Figure 3 with the 2001 findings. The 2001 study reported that 61.2% of shooting was provided directly for sole use by the owner (equivalent to the “Wholly Owner” category in Figure 3) compared to only 35.2% in 2009. We note below that real fees have increased since 2001 and a consequent increase in commercial profitability (see Figure 6) appears to have persuaded more estate owners to provide commercial shooting.
NOVEMBER 2010 PAGE 59
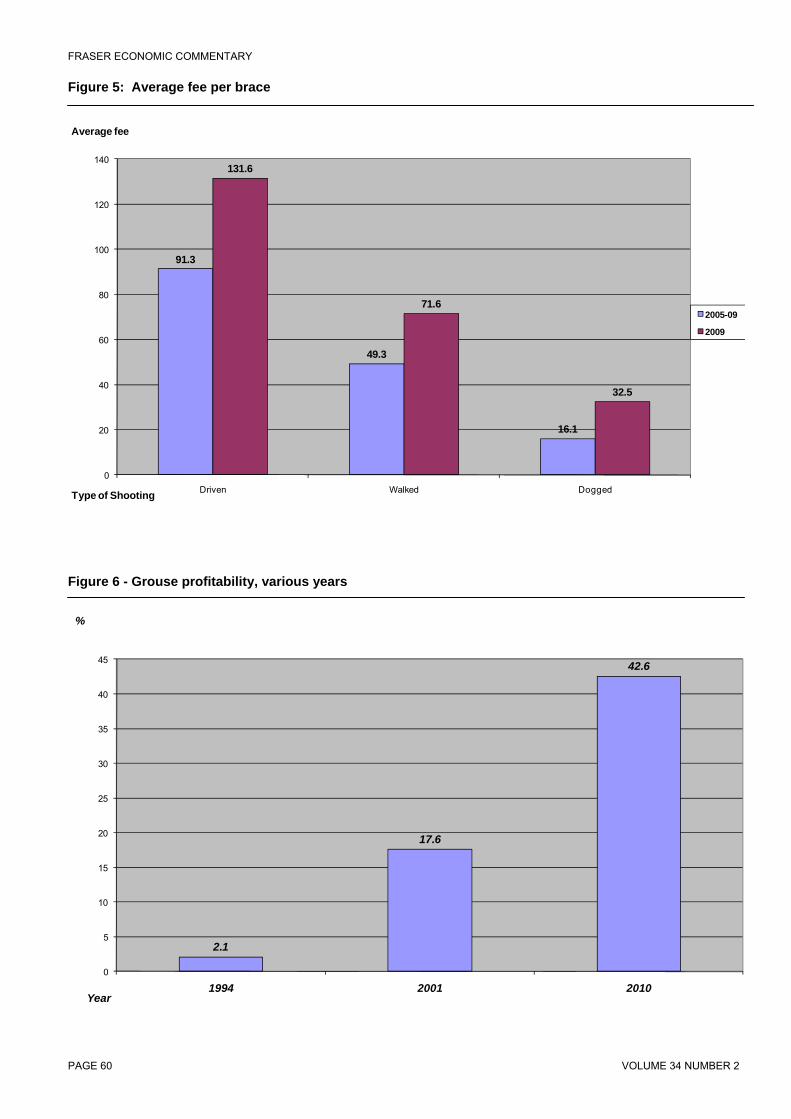
FRASER ECONOMIC COMMENTARY
Figure 5: Average fee per brace
91.3
49.3
16.1
131.6
71.6
32.5
0
20
40
60
80
100
120
140
Driven Walked Dogged
Average fee
Type of Shooting
2005-09
2009
Figure 6 - Grouse profitability, various years
2.1
17.6
42.6
0
5
10
15
20
25
30
35
40
45
1994 2001 2010
%
Year
PAGE 60 VOLUME 34 NUMBER 2

FRASER ECONOMIC COMMENTARY
Measures of estate activity
• Days shooting Table 1 shows the number of days when shooting occurred in 2009 on the 92 estates, and the type of shooting that took place.
The table shows that shooting occurred on a total of 580 days across all estates. The most frequent type of shooting was driven, which accounted for 41% of all days shooting, followed by walked, which accounted for just under 34% of days. Table 1: Grouse days, 2009
Number of days %
Driven 238 41.0 Walked 197 33.9 Dogged 68 11.7 Other 77 13.3 Total 580 100
As noted, the larger estates do not necessarily provide most shooting. In fact, more activity occurred in the two mid-size bands (2-5,000 and 5-10,000 hectares), which together accounted for almost three-quarters (73.9%) of all days shooting. The largest size-band (Over 10,000 hectares) accounts for only 17.2% of all days. Figure 4, which shows average days by estate size, confirms that estates in the two mid-sized bands were more commercially active in 2009. Table 2 shows the average number of days between 2005-09 and a comparison with Table 1 shows that the level of activity increased over this period The total number of days shooting in 2009 (581) compares with the average of 470 days between 2005-09. Table 2: Grouse days (average 2005-09)
Number of days %
Driven 165.15 35.2 Walked 205.4 43.7 Dogged 45.8 9.8 Other 53.3 11.3 Total 469.65 100.0
Smaller moors also saw the largest increase in activity over the period. Indeed, all of the increase in activity (measured by number of days) occurred in the three smaller size bands, while the number
of days shooting actually fell by 4% in the largest size-band.
• Grouse bag
However, while the above analysis indicates an increased level of activity in 2009 compared with recent years (in terms of the number of days shooting), an examination of the figures for grouse bag actually indicates a fall in the overall number of birds harvested, compared to the previous five years. Table 3 shows the total bag in 2009. Of the total of 23,713, the majority (84.9%) of this was driven. Table 3: Grouse bag 2009
Driven Other Total 20,135 3,578 23,713
However, Table 4, which shows the average annual grouse bag between 2005-09, shows the annual average over this period as 26,613, 12% above the 2009 level. Table 4: Grouse bag 2005-09
Driven Other Total
18,931 7,682
26,613
We also note that the figures for both time periods indicate a fall in grouse bag when compared to the results of our previous exercise. The total bag reported in the 2001 study was 45,641, which included data for only 56 estates. Despite a recent increase in the number of days, the present results therefore appear to indicate a fall in grouse bag over this longer period. These data appear to reflect the declining trend in grouse bag per unit area reported in other reviews of grouse moor management in Scotland7. Given the economic contribution of grouse shooting, discussed in more detail below, this long-term decrease in availability is a clear source of concern over the industry’s continuing viability.
• Shooting fees
Figure 5 indicates the average fee per brace, both by year and type of shooting. The figures show a marked increase over time for all types of shooting, with the average fee for both dogged and walked both increasing by over 40%.
NOVEMBER 2010 PAGE 61

FRASER ECONOMIC COMMENTARY
Figure 7: Scottish expenditures
88.0
93.8
80
82
84
86
88
90
92
94
96
98
100
Operating/maintenance Spending All Spending
Figure 8: Operating/maintenance expenditure distribution, 2009
10.213.6
8.76.9
3.5
51.8
5.3
0
10
20
30
40
50
60
Fuel Predation Control Heather & Bracken Control
Tick Control Worm Control Infrastructure Other
PAGE 62 VOLUME 34 NUMBER 2

FRASER ECONOMIC COMMENTARY
The fee per brace in 2009 is also substantially above that seen in our previous report. In 2001 we found that the average driven fee equalled £98 and £54 for walked and dogged shooting respectively. Fees for both driven and walked also show an increase in real terms since 2001 – the driven fee increased by 34.3% between 2001 and 2009, while the walked fee increase by 32.6%. Both increases exceed the 26.1% increase in the Retail Price Index (RIP) over the same period8.
• Profitability
Figure 6 shows the proportion of respondents whose grouse activities made a profit. Our 2001 study noted that only 17.6% of respondents made a profit on their grouse activity. This was itself a very considerable improvement from the position in 1994, where the study revealed that revenue from grouse exceeded expenditure in only 2.1% of the reporting estates. Data from the present study indicates a very substantial increase in 2009, where 42.6% of estates reported that they made a profit from their grouse activities. The real increase in fees noted above is almost certainly the major reason behind this increased profitability. This appears to have made a substantial contribution to an improvement in industry’s overall financial health and, as noted in Figure 3, seems to have persuaded a number of owners to increase the number of moors offering commercial shooting. This very significant increase in the number of moors returning a profit would appear to suggest that increased activity is likely to continue.
• Permanent employment – all estate activities Table 5 provides details on the level of all permanent employment for all activities on the 92 estates which responded to our survey. Total permanent employment was 260, an average of just under three employees per estate. As would be expected, average employment also increases with estate size, with the largest estates employing on average over three times as many as the smallest estates.
• Permanent employment – grouse
shooting Grouse shooting alone accounted for 119 permanent employees, just under half (46%) of permanent employment, confirming the importance of grouse to the total of economic activity on the estates.
Seasonal employment also generated a further 61 full-time equivalent annual jobs in 2009. Total employment across all estate activities in 2009 was therefore equal to 320 full time jobs, and total grouse employment, including seasonal jobs, was estimated at 148 full-time equivalent jobs, just under half (46%) of all employment on the estates.
Table 5: Permanent employment 2009
Total
employment Average
employment Under 2,000 acres 24 1.4 2-5,000 acres 92 2.5 5-10,000 acres 76 4.2 Over 10,000 acres 68 4.5 Total 260 2.9
• Wage and operational spending Table 6 shows the total expenditure, both wages and operating and maintenance expenditure, for all estates activities and for grouse shooting alone. In total, the estates spent close to £11 million (£10.78 million) on wages and operating/maintenance spending, around half (48%) of which was on spending supporting grouse shooting. Table 6: Estate expenditure (£M) 2009
Wage Operating/
maintenance Total All Estate expenditure 5.2
5.6 10.8
Grouse expenditure 2.4
2.8 5.1
Grouse % 45.3
50.0 47.7 We assume that all wage spending takes place in Scotland, which we believe is a reasonable given the location of the estates. However, estates are clearly able to purchase goods and services either inside or outside Scotland, and there are two reasons why it is of interest to examine the amount of local spending on suppliers. Firstly, this indicates the extent to which estates are embedded locally – if most estate expenditures are local, this clearly indicates the extent to which they support local companies and are thus linked closely into the local economy.
NOVEMBER 2010 PAGE 63

FRASER ECONOMIC COMMENTARY
Secondly, we assess below the total economic impact of grouse shooting on the Scottish economy. This total impact consists of the amount of activity that estates create directly and the amount of activity created by spin-off impacts (the additional activity created both by wage spending and by spending at local suppliers). Clearly, the greater the extent to which operating/maintenance spending are made with suppliers in Scotland, the greater will be the impact on the Scottish economy. Figure 7 does indeed show that the majority of operating/maintenance expenditures are placed locally with Scottish suppliers – 88% of all operating and maintenance spending is placed on Scottish suppliers. In total, 93.8% of all estate spending is in Scotland. Figure 2 detailed the location of estates across Scotland, and Figure 7 showed that the majority of operating/maintenance spending is placed locally with Scottish suppliers. Taking these findings together, it appears probable that much of the economic activity provided must fall largely on the neighbouring areas where estates are located. Much of the employment provided by the estates will thus be in more remote rural areas of Scotland, generally seen as places where there are relatively few alternative employment opportunities.
• Expenditure distribution
Figure 8 shows how 2009 total operating and maintenance expenditure was distributed by a more detailed categorisation of expenditure. This shows that much ongoing expenditure is on areas which can be considered as routine countryside management. For example, almost one-third of annual operating and maintenance spending goes on heather management and the control of predators, diseases and bracken. In addition, the questionnaire also sought information on any expenditure, additional to annual operating and maintenance spending, that was made by estates specifically in order to realize environmental benefits. Respondents were also asked to provide information on other expenditures which were specifically intended to benefit the moorland environment, such as increasing non-sporting biodiversity and soil and water management, as well as public access benefits such as improved signage and improved access to footpaths9. Total expenditure on the 92 sample estates was estimated to be £478,949.
• Economic impact estimates
The 2010 study also assessed the overall impact of grouse shooting on the Scottish economy.
Estimates were developed for employment, wages and Gross Value Added (GVA). Table 7 shows, for the 92 sample estates only, that all estate activity directly supports 321 full-time jobs and generates £5.2 million worth of wages. Direct activity on the estates is estimated to create £8.1 million worth of GVA in Scotland. In addition, the estates are estimated to create a further £4.5 million worth of wages and a further 384 jobs in Scotland. In total, therefore, all estate activity supports 705 Scottish jobs and £9.7 million worth of wages in Scotland. Total GVA supported is estimated to be £15.6 million. Table 7: Economic impact (sample estates)
All estate activities
Wages (£M)
Employ-ment (FTE)
Gross value
added (£M)
Direct
5.2
321
8.1
Additional
4.5
384
7.5
Total
9.7
705
15.6 Table 8 details the estimated impact of grouse shooting alone. Grouse shooting on sample estates directly supported a total of 148 full-time equivalent jobs in 2009, and paid £2.4 million worth of wages to local employees. In addition, grouse alone is estimated to support a further £2.0 million worth of wages and a further 177 jobs in Scotland. Table 8: Economic impact (sample estates)
Grouse shooting activities
Wages (£M)
Employ-ment (FTE)
Gross value
added (£M)
Direct
2.4
148
3.7
Additional
2.0
177
3.4
Total
4.4
324
7.0
In total, therefore, the research estimated that the grouse activity on the 92 sample estates supported 324 Scottish jobs and £4.4 million worth of wages in Scotland. Total GVA supported in Scotland is estimated at £7.0 million.
PAGE 64 VOLUME 34 NUMBER 2

FRASER ECONOMIC COMMENTARY
The estimated employment multiplier is 2.20, which implies that every one job in grouse shooting supports a further 1.20 jobs elsewhere in Scotland. Every £1 in direct wages in grouse shooting is estimated to support a further £0.86 worth of wage income elsewhere in Scotland.
Note that the additional jobs reported in Table 9 are created both by the wages paid by the estates, and by their spending at suppliers. Although the procedure used to estimate the number of additional jobs and wage income only produces estimates for Scotland as a whole, it is likely, given that employees will live locally and that much spending is also likely to be local, that many of the additional jobs, and the resultant wage income, will be created in the local area around the estates. Table 9: Economic impact (140 estates)
Grouse shooting activities
Wages (£M)
Employ-ment (FTE)
Gross value
added (£M))
Direct 3.6 225 5.6
Additional
3.1
269
5.1
Total
6.7
493
10.7
• Grossed-up estimates for all grouse activity
i) “Core estates” estimate
As noted above, only 30.3% of estates responded to the survey questionnaire, and it is therefore highly unlikely that the figures above measure the total economic activity supported in Scotland. Our previous report developed an estimate for all activity by grossing up the returns we received then using the results of a study published in 199210, which suggested that 459 estates in Scotland had grouse populations. However, the source data used in our previous study is now clearly out of date. Given this lack of data on the actual number of estates that shot grouse, we derive two estimates of the total amount of activity (wages, employment and GVA) that grouse shooting supports in Scotland. The first uses a GWCT estimate of “core” estates that GWCT believed have a long term involvement in grouse shooting, a total of 140 estates. Table 9 details our estimate of the impact of grouse
shooting based on the assumption of 140 “core” active moors. On this assumption, the total amount of direct activity is estimated to increase to 225 jobs. Total impacts increase to 493 jobs, £6.7 million worth of wage income and £10.7 million worth of GVA (Table 9).
ii) All estates estimate An alternative, but clearly more heroic, method is simply to assume that the responses to our survey questionnaire are a random sample of the 304 estates on the original GWCTS database. If this is correct, it is legitimate to gross the sample estimates up to the total number of estates. Table 10 derives an estimate on the basis of this assumption. We stress that we are of course unable to gauge exactly to what extent this assumption reflects the actual pattern of grouse shooting activity across the 304 estates on the full GWCTS database.
If we employ the assumption that the sample estates do reflect all Scottish grouse activity across all 304 estates, Table 10 shows that grouse shooting in Scotland would support a total of 1,072 full time jobs and £14.5 million worth of wages in 2009. Its total contribution to Scottish GVA is estimated at £23.3 million. Table 10: Economic impact (304 estates)
Grouse shooting activities
Wages (£M)
Employ-ment (FTE)
Gross value
added (£M))
Direct
7.8
488
12.2
Additional
6.7
584
11.1
Total
14.5
1,072
23.3
• Change over time
Drawing a direct comparison with the findings of the 2001 study involves one key difficulty, which is identifying the number of estates that are actively involved in grouse shooting. For example, the grossed up estimate for employment reported in the 2001 study was that grouse shooting supported 940 jobs in total, which compares with the above estimates of 1,072 jobs total jobs. We also note that grouse’s GDP contribution has increased, from £17 million in 2001 to £23.3 million in 2009. However, there is a large difference in the assumed number of estates underlying both estimates (459 in the 2001 study compared to the 304 shown above). It is also important to note that
NOVEMBER 2010 PAGE 65

FRASER ECONOMIC COMMENTARY
both figures are subject to a considerable degree of uncertainty. While the figure of 459 used in the previous study was the only estimate available in 2001, it was based on a source that was almost a decade old at the time, and we simply do not know if this actually did reflect the number of estates active in grouse shooting in 2001. Similarly, the figure of 304 estates used here reflects the number of estates who may have provided grouse shooting in 2009. Given this, there are clear difficulties in making a direct comparison between the two studies.
Conclusion There are a number of interesting conclusions to emerge from this research. The key finding is clearly the sizeable contribution to economic activity – grouse shooting may sustain up to 1,072 jobs and contribute £23.3 million to Scottish GDP. Furthermore, the majority of employment is likely to be created in remoter rural areas of Scotland where there are comparatively few alternative employment opportunities. The research also noted the level of investment in Scotland’s landscape, habitats and iconic species which underpins many of the wildlife tourism activities we noted at the start of the report. This investment in management affects a minimum of 7% of Scotland’s area and helps retain and enhance heather cover and healthy deer, eagle and grouse populations across a wider area than just the nature reserves of Scotland. Also of interest is that the real increase in fees over recent years appears to have significantly strengthened the financial position of moors. Indeed, the improvement in the profitability of shooting appears to go back as far as 1994. A long-term increase in profitability, especially one as sizeable as that recorded in Figure 6, could indicate that investment in moors is likely to increase in future, helping to sustain existing jobs and possibly creating more. However, further substantial fee increases are unlikely to be sustainable and the stress grouse moors are under is reflected in the decline in the size of the number of birds harvested compared to previous studies. Continuing investment may only be achieved if suitable policies are put in place that would encourage investment in the current moors to remain and encourage more Scottish moorland owners to adopt proper grouse moor management activities. Estates spend the majority of their wage and supplier spending locally in Scotland and increased activity on the moors would create further benefits for the surrounding local economies. The Scottish Environment Secretary recently argued that “"Tourism is vital to Scotland's economic recovery. As one of Europe's leading year-round wildlife destinations with a world famous reputation for natural heritage, Scotland has a great deal to offer”11. Grouse has a role to play in the future development of Scottish tourism. As an activity that supports economic activity in remote areas, and as an increasingly profitable one, Scottish policymakers should consider engaging with the industry to work to increase its
contribution, both to the local economies in which they operate and to the management of the Scottish countryside. ____________________ Endnotes 1“The Economic Impact of Wildlife Tourism in Scotland', International Centre for Tourism and Hospitality Research, Bournemouth University, June 2010. The study was sponsored by the Scottish Government. 2The study refers to these as “consumptive” wildlife tourism. 3 “An economic study of Scottish Grouse Moors - an update (2010)”, Fraser of Allander Institute for the Game and Wildlife Conservation Trust Scotland, August 2010. 4 “An Economic Study of Grouse Moors”, published by the Game Conservancy Scottish Research Trust, 2001. We refer to this throughout as the 2001 study. 5 Termed the grouse bag. 6 Estimated at around 7.8 million hectares. See “Agricultural land use in Scotland”, available at http://www.scotland.gov.uk/Topics/Statistics/Browse/Agriculture-Fisheries/agritopics/LandUseAll. 7 Such as Smith A. (2009), Game Conservancy Scottish Research Trust 25th Anniversary Report. Game and Wildlife Conservation Trust. 8 Note, however, that Figure 4 includes responses from only 37 moors. A number of estates reported a figure for grouse bag, indicating that grouse shooting took place on the estate, but did not report a fee. It is likely that most of these estates did not want to provide fee data for reasons of commercial confidentiality. 9 The specific categories were biodiversity, carbon storage and water management, signage, interpretation, and footpath access. 10 “Grouse in Space and Time: the population biology of a managed gamebird”, Game Conservancy Trust, (1992). 11 “True value of wildlife tourism”, Scottish Government news release, Scottish Government website, 16th June, 2010.
PAGE 66 VOLUME 34 NUMBER 2

FRASER ECONOMIC COMMENTARY
The anatomy of high growth firms in
Scotland Ross Brown+ and Colin Mason* + Scottish Enterprise, Glasgow * Hunter Centre for Entrepreneurship, University of Strathclyde, Glasgow 1. Introduction There is a growing volume of scholarly evidence from various countries which points to high growth firms (HGFs) as a key force fuelling economic growth. These businesses are typically highly dynamic enterprises which undertake very rapid growth, generating substantial levels of turnover and employment growth over relatively short periods of time (BERR, 2009; Anyadike-Danes et al, 2009; Mason et al, 2009; Henrekson and Johnannson, 2010). One recent study discovered that these firms account for nearly half of all new employment growth within the UK (Anyadike-Danes et al, 2010). Other research has demonstrated that HGFs have above average levels of productivity, are highly innovative and feature strong levels of internationalisation (Mason et al, 2009). In addition, rapidly growing firms often act as vital ‘growth nodes’ and play an important catalytic role in shaping the overall growth trajectory of different industries through various positive spill-over effects (Stam et al, 2009; Brown, forthcoming). Moreover, by undergoing one or more periods of rapid growth, some firms are able to undertake a ‘quantum leap’ forward towards becoming fully rounded “companies of scale”. For these reasons the promotion of HGFs is now a central policy objective for many national and sub-national governments (Lerner, 2010). Indeed, in view of the evidence on the importance of these enterprise some observers advocate that policy makers should cease to promote start-ups and should instead focus business support on this small subset of businesses with high growth potential (Shane, 2009). Indeed, one of the central aims of the current economic strategy of the Scottish Government is to provide responsive and focused enterprise support to increase the number of highly successful, competitive businesses (Scottish Government, 2007). Hence, for the past decade there have been a number of policy initiatives designed to stimulate high growth entrepreneurship in Scotland. Many of these initiatives have had a strong technology focus and Scottish Enterprise has led on many of these policies. Given the importance HGFs have for a region’s economic growth potential and the policy attention they now receive it
was felt important to develop a deeper understanding of these important generators of wealth creation in the Scottish economy. Consequently, Scottish Enterprise commissioned the first ever comprehensive analysis of HGFs in Scotland (Mason and Brown, 2010a). This paper highlights some of the key findings from this research project. It is structured as follows. First, we define what we mean by HGFs. Second, we outline the research methodology undertaken during this study. Third, we outline the size of the population of these firms in Scotland. Fourth, we examine the key demographic characteristics of HGFs in Scotland. Fifth, we examine some of the qualitative features of HGFs in Scotland. Finally, we provide some conclusions and highlight the policy implications of the research. 2. Defining high growth firms In the past a wide range of definitions have been used to define and measure rapidly growing firms (Coad, 2009), reflecting a lack of international agreement over the definition of what constitutes high growth. However, OECD has recently sought to bring precision to the topic by defining high growth firms as follows1:
‘enterprises with average annualised growth in employees or turnover greater than 20% per annum, over a three year period, and with more than 10 employees in the beginning of the observation period, should be considered as high growth enterprises’
In common with a growing number of recent research studies, our research adopted this definition of HGFs. There were several reasons for selecting this exact definition of high growth. First, by selecting firms with three consecutive years of turnover growth greater than 20%, it should ensure that only firms that have gone through a period of consistent growth meet this challenging threshold. A shorter time period would make the data prone to potential one-off effects such as winning a major new order. Second, the 10 employee cut-off ensures that population of high growth firms is not dominated by micro-businesses that have achieved growth that is significant in percentage terms but relatively modest in absolute terms. Third, the benefit of using the standard OECD definition is that it enables both longitudinal and international comparisons. Therefore, we can assess how the population of HGFs change over time and how Scotland compares to other regional and national economies in terms of high growth entrepreneurship. This research used turnover as the main growth indicator. While recognising that a single metric will not capture all elements of firm growth (Janssen, 2009), turnover was preferred as it is an ‘outcome’ measure whereas employment is an ‘input’ measure. However, it needs to be acknowledged that different indicators, such as employment and turnover, often produce different results when identifying the aggregate number of HGFs (Delmar et al, 2003; Daunfeldt et al, 2010).
NOVEMBER 2010 PAGE 67

FRASER ECONOMIC COMMENTARY
PAGE 68 VOLUME 34 NUMBER 2
3. Research method The research design was based on a multi-method approach with four main elements. First, a quantitative analysis high growth firms was undertaken using the OECD definition based on the business database FAME (Financial Analysis Made Easy). FAME uses data obtained directly from Companies House, the official register for companies in the UK. It therefore contains detailed information on all public and private companies currently registered in the UK. An important advantage of FAME is that individual companies can be identified, making it possible to be used as a sampling frame. This is in contrast to official government data sources, such as the Inter-Departmental Business Register (e.g. Anyadike-Danes et al, 2009), whose records are anonymised. The data used for this research exercise was taken from the FAME database in April 2009. Second, a sample of the population of HGFs that were identified from FAME were examined in greater detail using secondary research resources, notably company databases, press sources and company websites. This element of the research was used both to provide a profile this group of HGFs and also to ascertain their suitability for subsequent interview. In total some 90 firms were examined in this manner. Third, in-depth qualitative evidence was gathered through interviews with the business owners or senior management of 21 indigenous high growth companies2 in order to develop a deeper understanding of the nature of their businesses and growth processes. Finally, Interviews were conducted with the eight account managers within Scottish Enterprise who deal directly with these businesses3. These interviews were specifically designed to corroborate the data obtained directly from the companies. 4. High growth firms in Scotland: aggregate evidence 4.1 How many? HGFs constitute a very small sub-set of the overall population of firms in any given economy, with most studies showing that they constitute less than 10% of the total stock of firms employing more than 10 employees (Henrekson and Johansson, 2010). This is confirmed in Scotland. There are approximately 290,000 private sector firms in Scotland of which 20,400 have more than 10 employees. Of this latter total, just 825 firms met the OECD definition of high growth, having grown in turnover by over 20% for three consecutive years between 2006-2009. HGFs therefore comprise just 4.1% of all registered businesses in Scotland employing more than 10 employees. However, the small size of this cohort of businesses should not detract from the fact that they undoubtedly make a disproportionate contribution to economic development and are critical to the growth of the Scottish economy.
Because other studies have used different definitions and data sources it is difficult to judge how Scotland compares with other countries and UK regional economies. However, a major recent study of HGFs in the UK which used employment growth as the main indicator of high growth found that, during the 2002-2005 time-period, such firms represent 6.3 percent of all UK firms employing ten people or more (Anyadike-Danes et al, 2010). During this time period 830 HGFs were identified in Scotland or 6.3 percent of the all firms employing more than 10 employees in Scotland. However, during a later time period 2005-2008, 1030 firms or 7 percent of the total stock of Scottish companies with 10 or more employees were found to be HGFs in Scotland. Moreover, this figure is actually above the UK average during this second time period (5.8%). The lower figures found during our study are likely to reflect the different measures of growth (turnover vs. employment) and the different time periods covered. Comparison with studies from various Scandinavian countries show that the number of HGFs in Scotland is broadly on a par with other small EU economies. For example, using data from the Finnish Business Register it has been estimated that there were 750 HGFs in Finland, roughly 5% of registered businesses (Deschryvere, 2008). The number of HGFs in Denmark was similar at 721 (Peterson, 2006). However, conclusions from such comparisons must be tentative on account of different data sources and definitional issues. 4.2 Size profile Prior research indicates that the relationship between HGFs and firm size is ambiguous (Henrekson and Johansson, 2010). Small firms are nevertheless overrepresented in the surveys of most studies of HGFs. This is not the case in Scotland. In fact, if anything the reverse is true, with medium and larger-sized enterprises dominating the composition of the Scottish HGF population (see Figure 1). Measured in terms of their employment, HGFs in Scotland can be found across the size spectrum. The largest firm identified had 105,685 employees while the smallest firm had a 11 employees. The largest concentration of HGFs (398) is in the medium-sized category of firms employing between 50 and 299 employees4. There are also a sizeable number of HGFs firms which employ between 300 and 750 employees (200). Whereas previous studies have considered large firms or ‘elephants’ to demonstrate relatively stable employment levels (Acs et al, 2008) this is contradicted by our evidence which shows that large firms, employing over 300 employees, comprise a substantial proportion of the population of HGFs. A similar pattern emerges when the turnover of HGFs is examined. Once again, the majority of HGFs are concentrated in the middle to upper ranges of turnover levels. Smaller firms with a turnover of less than £5 million account for around one in seven of the overall population of HGFs. The largest cohort of HGFs is in the £20-50 million bracket. In fact, more than half of the firms have a turnover in excess of £20 million.

FRASER ECONOMIC COMMENTARY
Figure 1: Size of HGFs in Scotland, 2007-2009
small firms medium sized firms large firms
Source: Mason and Brown (2010a) 4.3 Contribution to employment The HGFs identified in Scotland employed almost half a million people (499,242). This figure represents almost a quarter of all private sector employment in Scotland (1,995,520), illustrating the importance of these firms to the Scottish economy. However, as we note later, by no means all of this employment will actually be located in Scotland. Many HGFs have substantial overseas operations which account for a significant proportion of their employment. First Group is a good example, with 25,000 employed in its UK bus division, 13,000 in its UK rail businesses, 8,000 in Greyhound (north America) and 87,000 in its North American contract services (First Group Annual Report and Accounts 2010). 4.4 Age profile Popular images of HGFs typically associate such firms with youthfulness. This is consistent with much of the research evidence which finds a high correlation between newness and high growth (Henrekson and Johansson, 2010). Acs et al (2008) is an exception, reporting that the average age of ‘high impact firms’ in the USA is 25 years old. Growth through acquisition is much more prevalent for older HGFs. Our analysis finds that Scottish HGFs lie somewhere in-between these extremes. The vast majority (roughly two-thirds) of Scottish HGFs were established between 1985-2004. The two largest age cohorts are those founded between 1995-1999 (146) and those founded between 2000-2004 (146). Over one-third of Scottish HGFs, therefore, are less than 15 years old. Newer companies -
genuine gazelles under five years of age - established from 2004 onwards are much less significant in the population of HGFs (fewer than 25 or less than 3% of the entire high growth population). However, this should not obscure the significant tail of very old, well established companies that have grown rapidly. Quite often these firms are now operating in different markets to those which they were originally established to serve. 4.5 Location of HGFs The vast majority of Scottish HGFs are based around Scotland’s main urban agglomerations of Glasgow, Edinburgh, Dundee and Aberdeen (Figure 2). Given the large number of knowledge-intensive business service firms in the overall population of HGFs, and the concentration of such firms in major urban areas this geographical bias is to be expected. However, existing clusters also play a role in determining the spatial distribution of HGFs. For example, the spatial concentration of HGFs in the north east of Scotland is linked to the role of the energy industry in that region. HGFs are typically under-represented in remote rural areas. In Scotland the HGFs in rural areas are mainly based around the processing of raw materials, such as food and drink and forestry. 4.6 Country of ownership The FAME data only includes businesses with a separate legal status and which are incorporated in the UK. Foreign-owned ‘branch plant’ and ‘branch office’ operations are therefore not included because they are not established as legally separate businesses. However, FAME does include
NOVEMBER 2010 PAGE 69

FRASER ECONOMIC COMMENTARY
Figure 2: The spatial location of Scottish high growth firms
Source: Mason and Brown (2010a)
PAGE 70 VOLUME 34 NUMBER 2

FRASER ECONOMIC COMMENTARY
foreign-owned businesses that are incorporated in the UK. Unfortunately, FAME does not separately identify Scottish from UK companies. Ownership data was only available for around two-thirds of HGFs in Scotland (i.e. 525). However, there is no reason to think that the other third do not reflect the HGF population as a whole. The majority of HGFs (61%) are UK-owned. However, a sizeable minority are foreign-owned (39%), with US-owned businesses accounting for 10% of the total. A number of other Scottish HGFs are owned by companies based in
European countries, notably the larger economies of France and Germany, but also The Netherlands and Norway (Figure 3). The high level of Norwegian-owned HGFs is linked to the role played by Norwegian enterprises in North Sea oil and gas exploration. In addition, a number of Norwegian salmon farming businesses have acquired Scottish producers in recent years (Brown, forthcoming). Although precise figures are unknown, our desk research revealed that a significant proportion of foreign-owned HGFs are acquisitions of formerly Scottish-owned businesses.
Figure 3: High growth firms by country of ownership, 2006-2009
0
50
100
150
200
250
300
350
No o
f com
pani
es
Country of origin
Source: Mason and Brown (2010a)
4.7 Publicly quoted companies There is a fundamental difference between privately-owned and public companies in terms of their governance, external scrutiny and access to resources. Public companies comprise those that are listed on the London Stock Exchange (LSE) and whose shares are traded on either its main list or the Alternative Investment Market (AIM). The vast majority of HGFs – 92% in total - are privately-owned firms. This finding is somewhat unexpected because it might have been anticipated that more HGFs would have sought a public listing either to raise further capital to fund their expansion plans, to enable existing shareholders (e.g. private equity investors) to sell their shares, or to provide existing shareholders with liquidity for their shares (e.g. family firms where ownership is widely dispersed). Nevertheless, Scottish HGFs comprise a sizeable proportion
of all Scottish public firms, with eight HGFs listed on AIM which comprises more than one-quarter of all Scottish companies on this market. 4.8 Industry sector The largest category of HGFs in Scotland is in services which comprise nearly one-third of the total, a finding which is in line with the vast majority of other studies on rapid growth firms (e.g. BERR, 2008; Henrekson and Johansson, 2010) (Figure 5). However, this is a very diverse and wide ranging grouping of activities, including knowledge-intensive business services, consumer services and personal services. Smaller numbers of HGFs are found financial services (37), oil and gas (27) and life sciences (10) - despite these being identified as key sectors in Scotland (Scottish Government, 2007). Indeed, the general lack of HGFs across high technology sectors is noteworthy. For
NOVEMBER 2010 PAGE 71

FRASER ECONOMIC COMMENTARY
Figure 4: Scottish high growth firms by sector
0
50
100
150
200
250
300No
of c
ompa
nies
Sector
Source: Mason and Brown (2010b) example, in life sciences the number of firms meeting the OECD high growth turnover criteria (10) represents 1.6% of all Scotland’s life science enterprises and approximately 1.2% of all Scotland’s HGFs. Other sectors exhibiting significant numbers of HGFs include manufacturing/engin-eering, construction and primary industries such as forestry and agriculture. The key point from this analysis is therefore that HGFs can be found in any sector and not just in high-technology industries as is commonly assumed. 5. The characteristics of Scottish hgfs: qualitative evidence Much of the research on HGFs is quantitative, where the objective is to establish ‘how many’ of these firms exist. Our desk research and interviews with a sample of Scottish-owned HGFs sought to achieve a richer understanding of their characteristics and dynamics. Table 1 summarises the main themes that we explored and the key insights. 5.1 Firm origins and growth trajectories HGFs have varied origins. They are by no means all new start-ups and many have been ‘pre-incubated’ in established organisations. Existing businesses, rather than new start-ups, are therefore an essential source of new HGFs, with several being management buy-outs (MBOs) of businesses that were previously part of larger organisations. Firms started by serial entrepreneurs are also significant. Growth
is often ‘stepped’ or lumpy. HGFs which exhibit a continuous or linear growth trajectory are the rare exception. Corporate re-configurations, such as MBOs and management buy-ins (MBIs), often kick-start rapid periods of growth. Indeed, ownership changes to businesses as a whole seem to be particularly potent growth trigger points. Although the majority of the HGFs interviewed had grown organically, acquisition has been an important mechanism for achieving high growth status amongst the larger businesses in the sample. 5.2 Market orientation Only a minority of HGFs are in high technology sectors. However, classifying HGFs into ‘manufacturing’ and ‘service’ categories is problematic, underlining the inappropriateness of this distinction. Most ‘manufacturing’ firms have a significant service component in their offering, with some describing themselves as total solutions providers. This underlines that the competitiveness of manufacturing firms increasingly depends on the service attributes in which the products are embedded. Most HGFs are selling to other businesses, not to consumers. Over two-thirds of firms that we interviewed engaged in business-to-business (B2B) transactions. Only a minority of Scottish HGFs sell exclusively within the Scottish market with the majority of firms selling into global markets and some, such as the software firm Craneware, were ‘born global’.
PAGE 72 VOLUME 34 NUMBER 2

FRASER ECONOMIC COMMENTARY
Table 1: Key characteristics of Scottish high growth firms Characteristics Scottish HGFs
Founding Circumstances (origins and trajectories)
Many Scottish HGFs are ‘pre-incubated’ in existing businesses. Pre-incubated means that the business had it origins in a pre-existing or established business (e.g. MBOs).
Nature of Management Team (origins and trajectories)
Team based rather than solo entrepreneurs dominate. Prior experience of the management team is critical. Serial entrepreneurship important.
Funding Architecture (origins and trajectories)
Over half of the sample of HGFs interviewed obtained venture capital funding and one-quarter are publicly listed.
Business Strategy (market orientation)
Scottish HGFs are characterised by close relationships with their customers, partnering with customers and other firms and business models that have recurring and multiple income streams.
Markets/End Users (market orientation)
Over two thirds of Scottish HGFs are B2B
Business Sector (market orientation)
Services are the single largest source of HGFs. Manufacturing firms are total systems providers in which their products are embedded within service elements. High tech sectors are weakly represented, especially some of Scottish Enterprise key sectors (e.g. life sciences, energy)
Innovation (competitive advantage)
Most HGFs are highly innovative, although they are not heavily engaged in R&D.
Firm Embeddedness
Scottish footprint is often limited to their HQ. Scottish HGFs have weak links to HE bodies
Links to Government (government support)
20% are account managed by SE. Government has played a significant indirect role as customer, through privatisation and deregulation, and legislation that has created or expanded markets.
Source: Adapted from Mason and Brown (2010b) 5.3 Sources of competitive advantage The success of HGFs in Scotland is based around three key attributes. First, even though a minority of HGFs are in high technology sectors, the majority are knowledge-intensive with innovation at the core of their competitiveness. This is the case irrespective of sector, with HGFs in traditional sectors also exhibiting innovative attributes. Second, a key source of innovation amongst the HGFs that we interviewed is their business models – which we define as “a system of activities that depicts the way in a company ‘does business’ with its customers, partners and vendors” (Amit and Zott, 2010). Many of the firms have business models which are based around building long-term relationships with customers that generate recurring revenue rather than one-off transactions. Their business proposition is as much based around selling knowledge as it is selling tangible products and services. Creating close relationships with their customers is at the core of such business models. This provides HGFs with an in-depth knowledge of the types of products, services and ‘solutions’
required by their customers. Another key outcome of this close end-user engagement is the ability of HGFs ‘co-create’ new knowledge with their customers which can then be used as the basis for product offerings for other customers. Partnering is also at the core of the business model of many of HGFs which can take a variety of different forms. It sometimes involves co-creating new knowledge in the forms of products and services with their customers. It can also involve collaborations with other companies in different parts of the value-chain or with complementary products and services to provide the solutions required by their customers. Third, HGFs consistently identify their workforce as a key source of their competitiveness. This reflects distinctive HRM practices which emphasize hiring the ‘right’ people (attitude being more important than formal qualifications), a high level of investment in training, a culture of openness and information sharing, and profit-sharing.
NOVEMBER 2010 PAGE 73

FRASER ECONOMIC COMMENTARY
5.4 Embeddedness In general HGFs are relatively weakly embedded in the Scottish economy. This has several dimensions. First, with just one exception, these businesses are located in Scotland because this is where the founders were living and working at the time that the company was started. Indeed, most HGFs could be located anywhere. Second, as noted earlier, only a small number derive the majority of their revenue in Scotland. As a result many of the interviewed companies have a physical presence – often a significant one – elsewhere in the UK or in foreign markets. Third, most of the HGFs interviewed are weakly embedded through supply relationships. However, high growth manufacturing firms do have quite extensive local supplier linkages – but they comprise a minority of HGFs. Scottish HGFs also have few links to universities or higher education institutions for research, technology-transfer or graduate recruitment. Two implications arise from these findings. First, the direct Scottish ‘footprint’ of many of these companies is sometimes quite small, often limited to headquarters functions, with the majority of the jobs located elsewhere in the UK and abroad. This reflects a combination of the service-oriented nature of the majority of the businesses which requires a physical presence close to customers and the need for sales and support staff in export markets. Indeed, for such companies there is almost an inevitability that growth – involving penetration of new geographical markets - especially if it is achieved through acquisitions, will reduce the Scottish footprint, at least in relative terms. Second, the Scottish HQ would be vulnerable to downgrading or even closure in the event that the company is acquired. 5.5 Extent and nature of government support The majority of HGFs have received public sector assistance at some point in their development. However, much of this has been on a relatively small scale. This includes grant support from the Scottish Government, internationalization assistance from Scottish Development International (SDI), innovation support, and assistance with manufacturing issues. A quarter of the firms interviewed had received Regional Selective Assistance. Around 20% (approx 160) of the 825 HGFs identified from FAME are account managed by Scottish Enterprise. The interviews highlighted a number of key issues regarding public support. First, in some cases the critical support occurred when the companies were still very young (and not yet identifiable as a HGF) and potentially vulnerable. Second, the most effective forms of support appeared to be schemes which provided international sales and marketing support, followed by training grants. Third, those firms that were account managed by Scottish Enterprise valued the ongoing relationship that this created. Of course, firms valued the access that the account manager provided to various ‘products’ that Scottish Enterprise offered (e.g. RSA, SMART, etc). However, they placed as much, if not more,
value on the strategic relationship that provided guidance and advice. In other words a ‘relational’ rather than a purely ‘transactional’ relationship is viewed extremely positively by HGFs. Government also has had important, often critical, indirect effects on HGFs as a customer, through privatisation and deregulation, and through legislation which has created or expanded markets. A prime example of this is the impact of environmental regulations which has created new markets for re-cycling waste products. 6. Conclusion This has been the first in-depth analysis of high growth entrepreneurship to have been undertaken in Scotland. We take the opportunity in closing to re-iterate four key findings. First, HGFs comprise a small proportion of the overall business stock in Scotland employing more than 10 employees (4.1%), but because of the lack of comparable studies we cannot say exactly how this compares with other parts of the UK or other countries. However, the small number of HGFs should not detract from the fact that they undoubtedly make a disproportionate contribution to economic development and are critical to the growth of the Scottish economy. Broadly speaking, the evidence suggests that Scotland performs on a par with other economies in terms of the aggregate level of HGFs. Second, growth of HGFs is not a linear process. Rather, growth tends to be sporadic and uneven, a finding that is confirmed in other studies of HGFs (Parker et al, 2010). Particularly amongst larger firms this often reflects growth through acquisition. Indeed, many of HGFs identified in this study would no longer have been classified as being high growth if the analysis had been undertaken a year later. The population of HGFs is therefore constantly changing: as some emerge, or re-emerge, others will stop growing, some will be acquired and lose their identity as part of a larger business, and a few will cease to exist. Flux is the norm for this dynamic collection of firms. Third, HGFs are a highly diverse collection of enterprises. One of our central conclusions from this study is the inherent difficulty of pre-judging where HGFs will emerge. HGFs are found in a wide range of industries, with several crossing the manufacturing-services divide. Most are not found in ‘high technology’ sectors. HGFs also vary in terms of their size and age. Of note is the fact that Scottish HGFs tend to be somewhat older and larger than the norm, a finding in common with a recent study in the US of high impact firms (Acs et al, 2008). By no means all HGFs started as ‘classic’ start-up companies. A significant minority have been ‘pre-incubated’ in established businesses, with several emerging after MBOs. Fourth, one of the most notable features of this group of businesses is the way in which they do business. HGFs are mostly knowledge-intensive, with an emphasis on
PAGE 74 VOLUME 34 NUMBER 2

FRASER ECONOMIC COMMENTARY
innovation, very strong customer focus and business models which are characterised by partnerships with customers and other businesses and ‘recurring’ and multiple income streams. The policy implications are discussed in more detail in the full report and in a separate paper (Mason and Brown, 2010b). In our view there is clearly a role for government to nourish and support HGFs. However, policy makers may wish to review the current support mechanisms in light of the evidence presented within. In particular, public policy makers in many economies have in the past tried to pre-judge both the sources of HGFs and the most appropriate method of assisting them. There has been a tendency to focus on high technology businesses with the majority of assistance geared towards support for commercialisation and innovation. The key points to be drawn from this analysis are, first, that HGFs can be found in any sector and not just in high-technology industries, and second, that close relationships with customers, rather than R&D activity, is vital for developing their competitive advantage. Therefore, going forward more nuanced and bespoke forms of assistance may be more effective for aiding the development and growth of HGFs. ____________________ Acknowledgements This research was funded by Scottish Enterprise. We are grateful to Kenny Richmond for his comments on an earlier version of this paper. We would also like to thank the Scottish high growth firms interviewed during this research project. However, the views and interpretations expressed in this paper are those of the authors alone. ____________________ References Acs, Z, Parsons, W and Spencer, T (2008) High Impact Firms: Gazelles Revisited, Office of Advocacy, US Small Business Administrations: Washington DC. Amit, R and Zott, C (2010) Business model innovation: creating value in times of change. IESE Business School Working Paper 870, University of Navarra. Anyadike-Danes, M, Bonner, K, Hart, M, and Mason, C (2009) Measuring Business Growth: High Growth firms and their contribution to employment in the UK, NESTA, London. BERR (2008) High Growth firms in the UK: Lessons from an analysis of comparative UK performance, BERR Economics Paper No.3, Department for Business Enterprise & Regulatory Reform, London. Brown, R (forthcoming) The Determinants of High Growth Entrepreneurship in the Scottish Food and Drink Cluster, in Alsos, G, Carter, S, Ljunggren E, and Welter F (eds.) The
Handbook of Research on Entrepreneurship in Agriculture and Rural Development, Edward Elgar: Cheltenham. Coad, A (2009) The Growth of Firms: A Survey of Theories and Empirical Evidence. Edward Elgar: Cheltenham. Daunfeldt, S-O, Elert, N and Johansson, D (2010) The Economic Contribution of High-Growth Firms: Do Definitions Matter? Stockholm: The Ratio Institute. Delmar, F, Davidsson, P and Gartner, W B (2003) Arriving at the high-growth firm, Journal of Business Venturing, 18, 189-216. Henrekson, M and Johansson, D (2010) Gazelles as job creators: a survey and interpretation of the evidence, Small Business Economics, Vol. 35, 227-244. Janssen, F. 2009. The conceptualisation of growth: are employment and turnover interchangeable criteria? Journal of Entrepreneurship, 18(1), 21-45. Lerner, J (2010) The Future of public efforts to boost entrepreneurship and venture capital, Small Business Economics, 35, pp.255-264. Mason, G., Bishop, K., Robinson, C. (2009) Business Growth and Innovation; The Wider Impact of Rapidly Growing Firms in UK City-Regions. NESTA, London. Mason, C. and Brown, R. (2010a) High Growth Firms in Scotland, Final Report for Scottish Enterprise, Glasgow. Mason, C and Brown, R (2010b) Creating gazelles? A critique of policies for high growth firms, Working Paper, Hunter Centre for Entrepreneurship, University of Strathclyde, in preparation. OECD (2008) Measuring Entrepreneurship: A Digest of Indicators, OECD-Eurostat Entrepreneurship Indicators Program. Parker, S, Storey, D J and van Witteloostuijn, A (2010) What happens to gazelles? The importance of dynamic management strategy. Small Business Economics, Vol 35, pp 203-226. Scottish Government (2007) The Government Economic Strategy, Edinburgh: The Scottish Government. Shane, S (2009) Why encouraging more people to become entrepreneurs is bad public policy, Small Business Economics, 33: 141–149 Stam E, Gerritsen D, Marijs C, (2009) Gazellen in de Delta. Ondernemerschap en de opkomst van internationaal concurrerende bedrijfstakken in Nederland. Utrecht University School of Economics, Utrecht.
NOVEMBER 2010 PAGE 75

FRASER ECONOMIC COMMENTARY
____________________ Endnotes 1‘Gazelles’ (or young high growth firms) are deemed to be a subset of high growth enterprises: ‘they are the high growth enterprises born five years or less before the end of the three year observation period’ (OECD, 2008, pg. 20). The focus of this study was on HGFs as a whole and not just gazelles. 2A substantial amount of information was obtained on a further high growth firm from a presentation by the owner at an Entrepreneurial exchange event. 3 Account managers are people employed by Scottish Enterprise to help support business growth within targeted businesses on an on-going basis (e.g. export assistance, innovation support and so on). 4FAME defines a medium-sized firm as employing between 50-299 employees whereas standard definitions of medium-sized businesses are those employing between 50-249.
PAGE 76 VOLUME 34 NUMBER 2

FRASER ECONOMIC COMMENTARY
NOVEMBER 2010 PAGE 77
The qualifications/jobs mismatch in Scotland
John Sutherland, Centre for Public Policy for Regions (CPPR), University of Glasgow Two important features within the Scottish economy over recent decades have been the investments made in education and training and the subsequent and consequential enhancement of the skills profile of the workforce (Scottish Government, 2007a). However, one unintended outcome has been the extent to which the supply of individuals with relatively high qualifications now exceeds the number of jobs which have similarly high qualifications as entry requirements. Felstead (2007) has estimated that in Scotland there are 240,000 more people with level 4 or 5 qualifications than there are jobs requiring this level of qualification on entry. Whereas the education system in Scotland, in particular its further and higher education sectors, appears to have supplied the labour market with new entrants of high calibre, compatible with the requirements of a ‘knowledge economy’ for example, the increase in demand for these individuals on the part of organisations located in Scotland has proved to be inadequate to provide appropriate employment opportunities for all. This paper reports research which examined two conditions: being ‘over qualified’ (defined as being in a job the entry qualifications for which are below the highest qualification held) and being ‘under qualified’ (defined as being in a job the entry qualifications to which are above the highest qualification held). The research had three objectives: first, to estimate the extent of ‘over qualification’ and ‘under qualification’ prevalent in Scotland; secondly, to identify the determinants of these two conditions; and thirdly, to determine whether the likelihood of an individual resident in Scotland being ‘over qualified’ or ‘under qualified’ differed from that of an equivalent individual resident elsewhere in the United Kingdom (Sutherland, 2009). The data set examined The data source used in the examination was the 2006 Employee Skills Survey (Felstead et al, 2007), a survey which has its origins in the surveys associated with the innovative Social Change and Economic Life Initiative of 1986 (Gallie et al, 1998). The focus was upon two sets of variables in the original data set, those identifying:
• the highest qualification possessed by the respondent, in levels, from possessing no qualifications through to possessing qualifications at levels 4/5 ; and
• the entry qualification required for the job being done by the respondent, again in levels, from no qualifications are required for job entry through to level 4/5 qualifications are required.
When manipulated, these variables form the two conditions being estimated: being ‘over qualified’ (i.e. individuals whose highest qualifications are above the entry requirement for the job being done) and being ‘under qualified’ (i.e. individuals whose highest qualifications are below the entry requirement for the job being done)1. Measuring the extent of ‘over qualification’ and ‘under qualification’ in Scotland Table 1 presents descriptive information on the extent of being ‘over qualified’ and being ‘under qualified’, as defined. In Table 1, the rows identify the distribution of jobs done by respondents by entry requirements, where these are measured in terms of five qualification levels, from ‘no qualifications are required’ through to ‘level 4/5 qualifications are required’. For example, (approximately) 31 percent of employees in employment in Scotland were in jobs requiring no entry qualifications; 11 percent were in jobs requiring level 1 qualifications for entry; 10 percent were in jobs requiring level 2 qualifications for entry; 18 percent were in jobs requiring level 3 qualifications for entry; and 28 percent were in jobs requiring level 4 or 5 qualifications for entry. The columns identify the distribution of the highest qualification held by respondents, where these are again measured in terms of the same five qualification levels. Again for example, (approximately) 13 percent of employees in employment in Scotland had no qualifications; 6 percent had level 1 qualifications as their highest qualification; 14 percent had level 2 qualifications as their highest qualification; 27 percent had level 3 qualifications as their highest qualification; and 36 percent had level 4 or 5 qualifications as their highest qualification. Given the structure of this table, cells along the (top left to bottom right) diagonal indicate what may be described as ‘matches’, i.e. where the entry requirement for the respondent’s job matches his/her highest qualification, where both are measured in levels. The aggregate of the cell proportions for these five cells for Scotland is 0.4857. (In a comparable cross tabulation for the United Kingdom, the corresponding figure was 0.4763, a rate of matching marginally lower than that for Scotland.) Further, cells above the matched diagonal cells represent outcomes which may be described as ‘mis-matches’, where the qualification required for job entry, measured in levels, is below the highest qualification possessed, also measured in levels (ie the condition of being ‘over qualified’). The

FRASER ECONOMIC COMMENTARY
Table 1: The qualification for entry to the job currently held, by the highest qualification possessed, in levels Highest qualification held, in levels No qualifications Level 1 Level 2 Level 3 Level 4/5 Total Qualification required for entry to the job
No qualifications
101.8 .0967 .3038 .7086
170
34.79 .0331 .1039 .4775
54
64.02 .0609 .1912 .4109
110
83.3
.0792
.2487
.2861 132
51.06 .0485 .1525 .1314
80
334.9 .3184
1 .3184
546 Level 1 25.63
.0244 .217
.1785
18.81
38
.0179
.1592
.2581 33
27.14 .0258 .2298 .1742
35
31.96 .0304 .2706 .1097
52
14.57 .0138 .1234 .0375
26
118.1 .1123
1 .1123
184
Level 2 8.663 .0082 .0771 .0603
8.554
17
.0081
.0762
.1174 12
34.9 .0332 .3107 .224
56
41.39 .0393 .3685 .1421
64
18.82 .0179 .1675 .0484
28
112.3 .1068
1 .1068
177
Level 3 5.158 .0049 .0272 .0359
5.432
8
.0052
.0286
.0745 9
22.21 .0211 .1171 .1425
34
101 .096
.5323
.3468 158
55.93 .0532 .2948 .144
81
189.7 .1803
1 .1803
290
Level 4/5 2.395 .0023 .0081 .0167
5.285
5
.005 .0178 .0725
11
7.544 .0072 .0254 .0484
15
33.58 .0319 .1131 .1153
59
248.1 .2359 .8356 .6387
412
296.9 .2823
1 .2863
502
Total 143.6 .1365 .1365
1
72.87
238
.0693
.0693 1
119
155.8 .1481 .1481
1 250
291.2 .2768 .2768
1 465
388.5 .3693 .3693
1 627
1052 1 1 1
1699 Key to Table: Weighted counts Cell proportions Row proportions Column proportions Number of observations Pearson Statistic: Uncorrected chi2 (16) = 3538.3832
Design-based F(12.52, 83768.12) = 30.5818 P = 0.0000 aggregate of the proportions for the 10 cells in question is 0.4021. (The corresponding figure for the United Kingdom was 0.3893.) Conversely, the cells below the matched diagonal cells also represent outcomes which may be described as ‘mis-matches’. However, in this instance, the
qualification level required for job entry is above the highest qualification level possessed (i.e. the condition of being ‘under qualified’). The aggregate of the proportions for the 10 cells in question is 0.1183. (The corresponding figure for the United Kingdom was 0.1345.)
PAGE 78 VOLUME 34 NUMBER 2

FRASER ECONOMIC COMMENTARY
Approximately 40 percent of the population at work in Scotland, therefore, are ‘over qualified’, as defined. However, although usually recognised more in Scotland, the extent of ‘over-qualification’ is not unique to Scotland. Explaining the likelihood of being ‘over qualified’ and ‘under qualified’ The research applied micro econometric analysis to identify the determinants of the conditions of being ‘over qualified’ and ‘under qualified’, both conditions being estimated using qualification levels, as defined. The binomial logit model estimated contained three distinct sets of potential explanatory variables, reflecting the personal characteristics of an individual, such as age and gender; the work related characteristics of an individual, such as his/her employment status, pay, tenure and union membership; and the characteristics of the workplace at which an individual is employed, such as its size and its sector (e.g. ‘private’ or ‘public’). (Very) few variables proved to be statistically significant. There was some evidence that the condition of being ‘over qualified’ was less likely for males than females. There was some evidence that the condition of being ‘under qualified’ was negatively correlated with the presence of dependent children. However, the determinants of being ‘over qualified’ were not necessarily the converse of the determinants of being ‘under qualified’. Furthermore, both being ‘over qualified’ and being ‘under qualified’ were more likely to be associated with the set of variables reflecting personal characteristics than either the set of variables reflecting an individual’s work related characteristics or the set of variables reflecting the characteristics of the workplace at which he/she was employed. To establish whether the likelihood of being ‘over qualified’ or ‘under qualified’ differed between individuals resident in Scotland and those resident elsewhere within the United Kingdom, the estimations were repeated, this time using the full data set and with the inclusion of a set of dummy variables identifying the constituent countries/provinces within the United Kingdom. The results of the two estimations for the United Kingdom proved to be very different from the corresponding estimations for Scotland. In the former neither gender (in the estimation of being ‘over qualified’) nor the presence of dependent children (in the estimation of being ‘under qualified’) were statistically significant in the respective estimations. Further, the set of variables reflecting the characteristics of the workplace at which the individual was employed was now of consequence in explaining both conditions. Perhaps the most notable single result in the analysis of the full UK data set related to Northern Ireland in the estimation of the condition of being ‘over qualified’. An individual located in Northern Ireland was 12 percent less likely to be
over qualified relative to an equivalent individual located in Scotland.2 By contrast, in the estimation of the condition of being ‘under qualified’, none of the coefficients denoting country/provinces was statistically significant (although each was positively signed, with respect to the reference category, Scotland). The appropriate results are reported selectively in Table 2. Table 2: Selected output from the Logit Estimations: marginal effects of the three countries ‘Over qualified’ ‘Under qualified’
England -.015 .022 Wales .000 .012
Northern Ireland -.126 ** .003
Notes to Table 2:
The omitted reference category (country) is Scotland. The figures in the table, therefore, are to be interpreted as percentages relative to Scotland e.g. an individual located in England is .015 percent less likely to be ‘over qualified’ than the equivalent individual in Scotland. ** statistically significant at 0.05.
Some policy observations That four out of ten workers in Scotland were deemed ‘over qualified’ using qualification levels as a measure must be considered to be a ‘problem’. This ‘problem’ has both private and public dimensions. From a private perspective, individuals not in jobs appropriate to their qualifications may not be earning returns commensurate with their human capital investments. Furthermore, these potential losses will only increase the more individuals are required to self finance proportionately more of their investments in further and higher education in the future. From a public perspective, the prevalence of so many potentially under employed individuals may part explain why increases in education and training expenditures in Scotland have not resulted in corresponding increases in labour productivity. As the Scottish Government has observed in this context: the “strong performance on skills and qualifications does not feed through effectively enough to productivity” (Scottish Government, 2007b, p. 14).3
From the perspective of employers’ recruitment and selection strategies, there are two possible explanations of why, ceteris paribus, the condition of being ‘over qualified’ may result and be so prevalent across workplaces. The first explanation is credentialism, by which is meant the use of qualifications by employers to screen for potential
NOVEMBER 2010 PAGE 79

FRASER ECONOMIC COMMENTARY
productivity on the part of job seekers, irrespective of the relationship between these qualifications and the job to be done. The second is that when the number of job seekers exceeds the number of vacancies, a feature of local labour markets throughout many parts of Scotland over a long period of time, employers have the scope to increase their hiring standards. When doing so, they select individuals with relatively high qualifications in preference to those relatively less well qualified, again irrespective of the qualifications required to do the job in question competently. Traditionally, this latter explanation has been viewed in a macro economic context, of aggregate labour supply in local labour markets exceeding aggregate labour demand. However, recent research has added a micro-economic dimension to this possible explanation. Analysing differences in the skills content of jobs between Scotland and the rest of the UK, Dickerson (2009) finds that jobs in Scotland are characterised by relatively lower levels of skills content – notably computing skills content. Some of the condition of ‘over qualification’, therefore, may be attributable to the nature of the job opportunities available in Scotland as well as the number of jobs. One possible, and frequently cited, policy response to address the extent of ‘over qualification’ in Scotland is to increase the demand for those with relatively high qualifications. Encouraging indigenous firms to change radically their product market strategies and to move up their value chain is one such strategy (Ashton, 2007: Sung et al, 2009). How such a policy may be operationalised is problematical, however, as are its potential detrimental consequences, not the least of which would be the possible displacement of low skilled workers into a labour market in which the supply of those with no/low skills already exceeds the demand for the same.4 Encouraging appropriate multinational enterprises to establish themselves in Scotland is another, although the consequences of external control for employment security within Scotland will always remain a contentious issue in this context, a forceful reminder of which being the recent experiences with Diageo. Encouraging and facilitating the mobility of those considered to be in jobs which are less than commensurate with the qualifications they hold would be a possible, complementary supply based policy. That said, the search for outside job offers by individuals is contingent upon appropriate job opportunities becoming available, something which is unlikely given current – and foreseeable future - demand constrained product and labour markets. What the extent of ‘over qualification’ does question, however, both in Scotland and the United Kingdom, is the continued relevance of the policy of ‘universal up-skilling’ associated with the Leitch Review (Leitch Review of Skills, 2006). Although education and training may be important factors in the search for productivity growth and competitiveness (as well as other commendable policy objectives, such as social inclusion), they are not the sole – perhaps not even the primary - factors.
An important feature of recent skills policy in Scotland is an explicit acknowledgement of this, manifest in an emerging policy agenda which envisages skills policy as being an integral part of a more comprehensive policy of economic development (Scottish Government, 2007a: Payne, 2009). One argument made by those advocating devolution was the possibility that it would encourage more diversity, both in terms of policy design and the central instruments of policy. In the longer term, therefore, we may be about to witness yet another example of this materialising, this time in the context of skills and training policy. In the shorter term, however, given the current economic climate with its most probable detrimental consequences for job creation, it is highly probable that the 2010 Employee Skills Survey will report that the extent of over qualification has risen yet further. ____________________ References Ashton, D. (2007) Public Policy, Training and Skill Formation: Challenging Some Current Myths. Glasgow: FutureSkills Scotland. Dickerson, A. (2009) The Skills Content of Jobs in Scotland and the Rest of the UK. Glasgow: FutureSkills Scotland. Felstead, A. (2007) How ‘Smart’ Are Scottish Jobs? Summary Evidence from the Skills Surveys, 1997 -2006. Glasgow: FutureSkills Scotland. Felstead, A., Gallie, D. Green, F. and Zhu, Y. (2007) Skills at Work, 1986 – 2006. Oxford and Cardiff: ESRC Centre on Skills, Knowledge and Organisational Performance (SCOPE). Felstead, A. and Green, F. (2008) Skills at Work in Scotland, 1997 - 2006: Evidence from the Skill Surveys. Glasgow: FutureSkills Scotland. Gallie, D., White, M., Cheng, Y. and Tomlinson, M. (1998) Restructuring the Employment Relationship. Oxford: Clarendon Press. Keep, E., Mayhew, K. and Payne, J. (2006) From Skills Revolution to Productivity Miracle: Not as Easy as it Sounds. Oxford Review of Economic Policy, Vol. 22, No. 4, pp 539 -559. Leitch Review of Skills (2006) Prosperity for All in the Global Economy: World Class Skills. Final Report. London: HM Treasury. Payne, J. (2009) Divergent Skills Policy Trajectories in England and Scotland after Leitch. Policy Studies, Vol. 30, No. 5, pp 473 -494. Scottish Government (2007a) Skills for Scotland: A Lifelong Skills Strategy. Edinburgh: The Scottish Government.
PAGE 80 VOLUME 34 NUMBER 2

FRASER ECONOMIC COMMENTARY
NOVEMBER 2010 PAGE 81
Scottish Government (2007b) The Government Economic Strategy. Edinburgh: The Scottish Government. Sung, J., Ashton, D. and Raddon, A. (2009) Product Market Strategies and Workforce Skills. Glasgow: FutureSkills Scotland. Sutherland, J. (2009) The Qualifications/Jobs Mismatch in Scotland. Glasgow: Centre for Public Policy for Regions Working Paper No. 22. ____________________
Endnotes: 1 The qualification mapping used in the paper is detailed in Felstead and Green (2008), Table 3.1 (p. 31) and follows convention. Broadly, level 4 or above equates with first and post graduate degrees, and their professional and vocational qualifications equivalents; level 3 equates with sub degree (e.g. diploma) academic qualifications and their professional and vocational qualifications equivalents, usually obtained in further education; level 2 equates with ‘higher’ leaving school academic qualifications, usually obtained at the age of 17/18/19, and their professional and vocational qualifications equivalents; and level 1 equates with ‘lower’ school leaving academic qualifications obtained at the age of 16, the formal end of mandatory education in the UK, and their professional and vocational qualifications equivalents.
Scottish Affairs is the definitive forum for
comment and debate on Scottish politics, society
and current affairs. It is published in book form
every quarter and is independent of political
parties and pressure groups. Each year, one of
the issues focuses on a particular theme. These
have included:
Scotland, Quebec and Catalonia
Gender and National Identify
Understanding Constitutional Change (a complete
special issue) 2This particular outcome may be explained, perhaps, in terms of the relatively high rate of out migration of highly qualified individuals from Northern Ireland,
The Northern Ireland Agreement
Social Inclusion 3That said, even the correlation if not the causation, between human capital investment and labour productivity is contentious (Keep et al, 2006).
Annual Subscription (four issues):
£27.50 (individuals), £45 (institutions) 4See Payne (2009) for a discussion of some possible sources of inspiration for the design and implementation of appropriate economic development policies.
Published by and further information (including
how to join our electronic mailing list) from:
Unit for the Study of Government in Scotland
University of Edinburgh
Chisholm House
High School yards
Edinburgh
EH1 1LZ
Tel: 0131 650 2456
Fax: 0131 650 6345
Email: [email protected]