frameworks and tools for emergency response and crisis ... and tools for emergency response and...
TRANSCRIPT

Frameworks and tools for emergency response and crisis management
William B. Samuels, Farhad Dolatshahi, James R. Villanueva & Christopher ZiemniakScience Applications International Corporation, McLean, VA
Abstract
A geographic information system (GIS) based framework has been developed that integrates natural and technological disaster models with critical infrastruc-ture and population databases to assess the consequences of hazard events. The Consequences Assessment Tool Set (CATS) assesses the consequences of techno-logical disasters on population, resources, and infrastructure. Hazards accounted for in CATS range from industrial accidents, terrorism, to acts of war. Developed under the guidance of the U.S. Defense Threat Reduction Agency (DTRA), CATS provides signifi cant assistance in emergency managers’ training, exercises, con-tingency planning, logistical planning, and calculating requirements for humani-tarian aid. CATS emphasizes the calculation and analysis of consequences, not merely the display of hazard distributions. It contains models for converting spa-tial and temporal distributions into probabilities of casualties. These probabilities can be created for diverse exposure scenarios, including time-varying protective measures. CATS also identifi es and locates resources required for an effective, sustained response and recommends the most effective roadblock distribution and routing to prevent unauthorized access to the affected area.
Keywords: Hazard Prediction, Consequence Assessment, Population, Infrastructure.
1 Introduction
The coupling of hazard prediction models with geographic information systems (GISs) is an important component in emergency response and crisis manage-ment. For example, in the aftermath of the September 11, 2001 attack on the World Trade Center, New York City was running a GIS for their emergency management needs. In addition, there were several other GIS operations around the City supporting the rescuers, local, state, and federal governments [1]. Crisis prediction disaster management is a concept that has gained appreciable momentum in recent years. The havoc wreaked by natural disasters such as
ch019.indd 293ch019.indd 293 11/4/2011 5:55:38 PM11/4/2011 5:55:38 PM
doi:10.2495/978-1-84564- - /562 5
www.witpress.com, ISSN 1755-8336 (on-line) WIT Transactions on State of the Art in Science and Engineering, Vol 54, © 201 WIT Press2
19

294 CRITICAL INFRASTRUCTURE SECURITY
earthquakes, hurricanes, and fl oods and the chilling consequences of chemical and biological weapons have starkly illustrated the inadequacy of pre- and post-disaster government planning and action.
In response to the need to predict damage and analyze consequences from natural and technological disasters, the US Defense Threat Reduction Agency (DTRA) and the US Federal Emergency Management Agency (FEMA) have funded the development of a GIS-based modeling and simulation tool known as the Consequences Assessment Tool Set (CATS). CATS employs a suite of haz-ard, casualty, and damage estimation modules to estimate and analyze effects due to natural phenomena, such as hurricanes and earthquakes, technological disasters, such as terrorist incidents, involving weapons of mass destruction, and industrial accidents [2].
2 CATS
The purpose of the CATS software is to provide the necessary tools to the inci-dent and consequence managers and the fi rst responders for analyzing and assess-ing the impact of potential disasters from natural and technological sources. The analysis includes the damage to the environment, the risk to the well-being of the exposed population, and allocation of the necessary resources in real time to mitigate the consequences. CATS is a GIS-based toolset that provides a gen-eralized capability to estimate the extents of technological hazard areas. It also provides assessments of the hazard consequences to the population at risk and enables the incident and consequence managers and fi rst responders to take steps and allocate resources for the mitigation of the hazard-related effects.
A sister program, the Incident Command Tool for Drinking Water (ICWater), has also been developed in conjunction with CATS, which generates down-stream and upstream traces of the release of chemical, biological, and radio-logical (CBR) materials in rivers using the RiverSpill model [3]. ICWater calculates the downstream concentration using the dispersion equation to create the downstream trace and calculates the upstream trace using network navigation. Contaminant runoff is incorporated into the downstream calculation based on deposition from an atmospheric dispersion model or user input.
2.1 CATS architecture
The architectural framework in CATS relies on the Environmental Systems Research Institute (ESRI). GIS and various interface modules have been created to enable the seamless and transparent communication of the software com-ponents with the common GIS map background and with the databases (see Figure 1). The collection of these models, their specialized interfaces, and various assets allocation and report generation software comprise the toolsets in CATS. CATS can operate either as an extension to the ESRI ArcGIS desktop or as a stand-alone code using the ESRI ArcEngine runtime libraries.
ch019.indd 294ch019.indd 294 11/4/2011 5:55:38 PM11/4/2011 5:55:38 PM
www.witpress.com, ISSN 1755-8336 (on-line) WIT Transactions on State of the Art in Science and Engineering, Vol 54, © 201 WIT Press2

FRAMEWORKS AND TOOLS FOR EMERGENCY RESPONSE AND CRISIS MANAGEMENT 295
PersonalSDE
CJMTK
Framework
CATS/ICWater schema
FrameworkProvides the basic geospatialinfrastructure for applications
Spatial DataStores layer registered with or create by
CATS/ICWater
CJMTK (ArcEngine SKD)Provides the basic building blocks used
to create the framework
ICWater CATS
Figure 1: CATS and ICWater high-level architecture.
Using the hazard footprints described previously in conjunction with the population and the infrastructure databases, CATS can perform consequence assessment of population/infrastructure at risk, provide roadblocks to block streets and roads leading to hazard areas to enforce containment, and provide escape routes to avoid hazard areas. CATS uses extensive geodatabases to help visualize the dispersion of these hazards into the environment and predict the effects on the exposed and at-risk population. These databases include such libraries as LandScan population data [4], critical infrastructure datasets con-tained in the Homeland Security Infrastructure Program (HSIP Gold and HSIP Freedom) [5], and US and world base maps (see Figure 2).
The National Geospatial-Intelligence Agency (NGA) Offi ce of Americas Domestic Preparedness Branch provides HSIP Gold, a common operational data-set, and serves the federal community in direct support of the Homeland Defense/Homeland Security (HD/HLS) and Emergency Preparedness, Response & Recovery (EPR&R) missions. HSIP Freedom is a subset of the HSIP Gold dataset that has been identifi ed as license free and distributable to state, local, and tribal HD/HLS and EPR&R mission areas. This dataset allows for nationwide, founda-tion-level infrastructure information access and assists decision-makers with the following: analyze threat (natural or man-made), modeling for emergencies, pro-tection of borders, and expedite the response and recovery missions.
HSIP Gold is a disc that contains a common set of geospatial infrastructure data for use in homeland security missions. Acceptable federal uses of HSIP Gold within these mission areas include the following:
Homeland security and homeland defense analysis, planning, and operationsCritical infrastructure programs (national and defense)
�
�
ch019.indd 295ch019.indd 295 11/4/2011 5:55:38 PM11/4/2011 5:55:38 PM
www.witpress.com, ISSN 1755-8336 (on-line) WIT Transactions on State of the Art in Science and Engineering, Vol 54, © 201 WIT Press2

296 CRITICAL INFRASTRUCTURE SECURITY
Infrastructure mapping, assessments, analysis, and modelingNational response framework emergency support functionsFusion of foreign threat, domestic threat, infrastructure, and informationCrisis, consequence, and disaster managementIntelligence/threat analysisAntiterrorism/force protection (AT/FP)Defense support to civil authorities (DSCA)Man-made and natural hazard modeling and effects analysisGovernment facilities managementEmergency planning, response, and recoveryTraining and exercise support related to the above mission areas
2.2 Model descriptions
Over the years, various versions of CATS have incorporated tools that generate the hazard footprints (see Figure 3) from technical disasters (CBR) to natural events (hurricane, earthquake, and storm surge). In its current form, CATS includes a High Explosive (HE) model [6], the Emergency Response Guidebook (ERG2008) phenomenology to predict keep-out zones from hazard-ous chemical [7], and the ALOHA (Areal Locations of Hazardous Atmospheres) model [8], a program that estimates threat zones associated with hazardous chemical releases. In addition, numerous tools are provided for simulating a
�
�
�
�
�
�
�
�
�
�
�
Geospatial Intelligence
Foundation Infrastructure Data
Operational Geospatial Data
Aeronautical Data
Topographic Data
Hydrographic Data
Geodetic Data
Terrain Elevation Data
Imagery
Figure 2: Example database categories in CATS.
ch019.indd 296ch019.indd 296 11/4/2011 5:55:39 PM11/4/2011 5:55:39 PM
www.witpress.com, ISSN 1755-8336 (on-line) WIT Transactions on State of the Art in Science and Engineering, Vol 54, © 201 WIT Press2

FRAMEWORKS AND TOOLS FOR EMERGENCY RESPONSE AND CRISIS MANAGEMENT 297
disaster area of various geometrical shapes. CATS can also import hazard plume data in the form of shapefi les generated by such DTRA codes [9] as the Hazard Prediction and Analysis Capability (HPAC) and the Joint Effects Model (JEM). These footprints are generally from the release of CBR materials. For natural hazards such as hurricanes, earthquakes, and fl oods, CATS imports hazard foot-prints from FEMA’s Hazards US (HAZUS) model [10].
ERG2008ERG2008 was developed jointly by the US Department of Transportation, Transport Canada, and the Secretariat of Communications and Transportation of Mexico (SCT) for use by fi refi ghters, police, and other emergency services personnel who may be the fi rst to arrive at the scene of a transportation incident involving a hazardous material [7]. It is primarily a guide to aid fi rst responders in (1) quickly identifying the specifi c or generic classifi cation of the material(s) involved in the incident and (2) protecting themselves and the general public during this initial response phase of the incident. The ERG is updated every 3 to 4 years to accommodate new products and technology. The next version is scheduled for 2012.
The ERG2008 model was developed using the Table of Initial Isolation and Protective Action Distances. This table specifi es the containment areas for the initial isolation and protective action distance, and incidents involving fi res. CATS also includes a wind uncertainty circle, which uses the downwind dis-tance as the radius. Plumes produced in the ERG2008 model correspond to 30 minutes after the spill occurs.
HE modelThe HE model computes the distance to a blast overpressure level based on the explosion of a known quantity of material. The explosive material is assumed
Figure 3: CATS in operational use.
ch019.indd 297ch019.indd 297 11/4/2011 5:55:39 PM11/4/2011 5:55:39 PM
www.witpress.com, ISSN 1755-8336 (on-line) WIT Transactions on State of the Art in Science and Engineering, Vol 54, © 201 WIT Press2

298 CRITICAL INFRASTRUCTURE SECURITY
similar in behavior to TNT. The explosive material in the calculation is unshielded, has no casing material, and assumes unhindered propagation across a fl at plane. ANFO and C4 explosives used within the model have a set of TNT equivalency factors. Different sets of overpressure levels exist for the damage to personnel, damage to materials, and personnel safety distances.
Several publications and Web sites were reviewed to arrive at a set of blast effects relevant to the CATS HE [6] model. The fi rst step was to select an estab-lished relationship between the peak overpressure and the distance from a refer-ence base explosion of TNT in the open, that is, no protective shelter or posture. This data is available graphically from early measurements on the subject and have been reproduced in several references. This data is reproduced below for a baseline explosion of 1,000 pounds of TNT depicting pressure in pounds per square inches (psi) as a function of the ground range in feet.
ALOHA plume modelThe plume model estimates threat zones associated with hazardous chemical releases, including toxic gas clouds, fi res, and explosions. A threat zone is an area where a hazard (such as toxicity, fl ammability, thermal radiation, or dam-aging overpressure) has exceeded a user-specifi ed Level of Concern (LOC). Key features include the following:
generates a variety of scenario-specifi c output, including threat zone plots, threat at specifi c locations, and source strength graphs;calculates the rate of release for chemicals escaping from tanks, puddles (on both land and water), and gas pipelines and predicts how that release rate changes over time;models many release scenarios: toxic gas clouds, BLEVEs (Boiling Liquid Expanding Vapor Explosions), jet fi res, vapor cloud explosions, and pool fi res;evaluates different types of hazard (depending on the release scenario): toxicity, fl ammability, thermal radiation, and overpressure.
ALOHA is a modeling application released by the Environmental Protection Agency (EPA), National Oceanographic and Atmospheric Administration (NOAA), and the National Safety Council (NSC). It is designed for use in response to chemical accidents. As such, it can predict rates at which chemical vapors escape into the atmosphere from broken gas pipes, leaking tanks, and evaporating puddles. Finally, it predicts how the resulting hazardous gas cloud may disperse in the atmosphere. The ALOHA database contains information on approximately 900 common hazardous chemicals [8].
2.3 Consequence assessment
Consequence assessment is designed to examine the impact of an area of interest layer (hazard footprint) on an assessment layer (infrastructure or population). The outcome of a consequence analysis on an asset may be the raw numbers,
�
�
�
�
ch019.indd 298ch019.indd 298 11/4/2011 5:55:40 PM11/4/2011 5:55:40 PM
www.witpress.com, ISSN 1755-8336 (on-line) WIT Transactions on State of the Art in Science and Engineering, Vol 54, © 201 WIT Press2
FRAMEWORKS AND TOOLS FOR EMERGENCY RESPONSE AND CRISIS MANAGEMENT 299
at-risk results, or the number affected. The results of such an analysis may be further refi ned by categorizing the results using a grouping layer (i.e., county boundaries, zip codes, etc.). Specifi c examples of consequence analysis may be given as effects of an explosion on buildings, fi res in wooded areas, or chemical agent releases on a population.
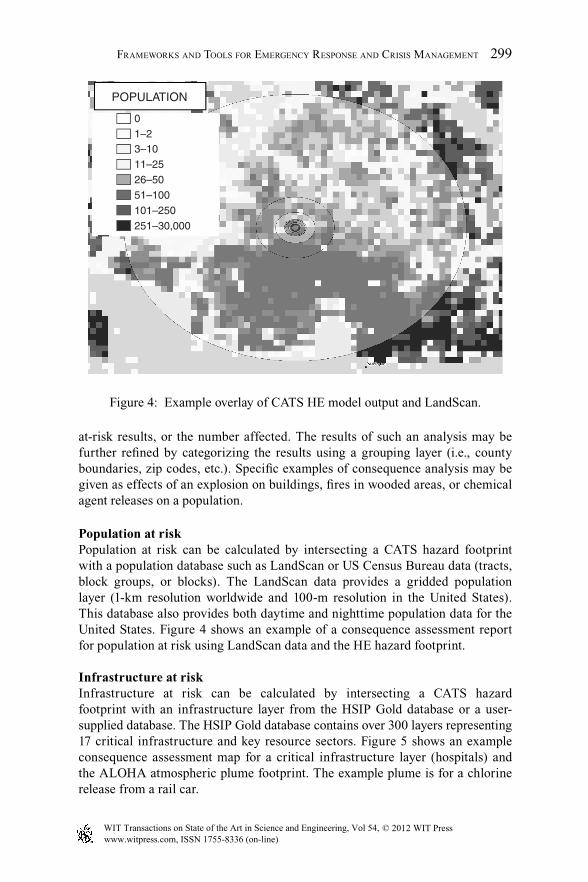
Population at riskPopulation at risk can be calculated by intersecting a CATS hazard footprint with a population database such as LandScan or US Census Bureau data (tracts, block groups, or blocks). The LandScan data provides a gridded population layer (1-km resolution worldwide and 100-m resolution in the United States). This database also provides both daytime and nighttime population data for the United States. Figure 4 shows an example of a consequence assessment report for population at risk using LandScan data and the HE hazard footprint.
Infrastructure at riskInfrastructure at risk can be calculated by intersecting a CATS hazard footprint with an infrastructure layer from the HSIP Gold database or a user-supplied database. The HSIP Gold database contains over 300 layers representing 17 critical infrastructure and key resource sectors. Figure 5 shows an example consequence assessment map for a critical infrastructure layer (hospitals) and the ALOHA atmospheric plume footprint. The example plume is for a chlorine release from a rail car.
0
POPULATION
1–23–10
11–25
26–50
51–100
101–250
251–30,000
Figure 4: Example overlay of CATS HE model output and LandScan.
ch019.indd 299ch019.indd 299 11/4/2011 5:55:40 PM11/4/2011 5:55:40 PM
www.witpress.com, ISSN 1755-8336 (on-line) WIT Transactions on State of the Art in Science and Engineering, Vol 54, © 201 WIT Press2

300 CRITICAL INFRASTRUCTURE SECURITY
Setting up roadblocksThe roadblocks model available from the CATS assessment menu determines all the intersections closest to the perimeter of an Area-of-Interest or Area-of-Interest buffer zone (polyline layers). Where there are no intersections (a single route), the roadblock occurs at the start of the road segment. CATS provides a capability for buffering hazard areas and creating a set of roadblocks to prevent road access to the buffered hazard zone. The roadblocks assignment may not necessarily be the most optimized due to errors in the underlying data, lack of resources to implement all the roadblocks, or perhaps errors in processing. In such cases, the analyst may need to manually intervene and make adjustments to the set of roadblocks to achieve the safety-zone objectives. To facilitate the user intervention and allow for the optimization of roadblocks, a roadblock editor tool was created. Using this tool, the user can generate a set of roadblocks and then add or remove individual roadblocks to accomplish the manual optimi-zation. Figure 6 shows an example of a CATS roadblock report.
Vehicle routingThe CATS route tracing tools rely on underlying road datasets that are in a format suitable for point-to-point analysis. The road segments are defi ned by polylines and their end points and are collectively referred to as “edges” and “vertices.” In the process of creating a CATS Road Network (CRN) data-set, various attributes of each edge and its vertices are collected and made
Figure 5: Example consequence assessment showing hospitals within an atmos-pheric plume footprint (ALOHA model).
ch019.indd 300ch019.indd 300 11/4/2011 5:55:40 PM11/4/2011 5:55:40 PM
www.witpress.com, ISSN 1755-8336 (on-line) WIT Transactions on State of the Art in Science and Engineering, Vol 54, © 201 WIT Press2

FRAMEWORKS AND TOOLS FOR EMERGENCY RESPONSE AND CRISIS MANAGEMENT 301
Intersection Name
CONSTITUTION AVE NW and Unknown and 16TH ST
NW
CONSTITUTION AVE NW and 20TH ST NW
C ST NW and 21ST ST NW
20TH ST NW and CONSTITUTION AVE NW
ELLIPSE RD NW and 16TH ST NW
17TH ST NW and 17TH ST SW
Figure 6: Example roadblock report based on a 100-m buffer around the hazard footprint from ERG2008.
available during the routing exercise. These attributes include such information as the road type, directionality, cost of travel, and so on.
In the example shown in Figure 7, the detailed ESRI StreetMap North America street layer is converted into a CATS CRN fi le. The fi rst step in build-ing a network is determining the “cost” value. The cost parameter refers to the “value” fi eld associated with a polyline feature. For instance, the cost used in this example will be based on the Feature Classifi cation Code (FCC) fi eld of detailed streets. The FCC values are contained in the street metadata as shown in Table 1.
The next task is to determine the directionality of the streets (one way vs. two way). This classifi cation is often made with no value for bidirection, 0 for to-from streets and 1 for from-to streets. In this Streetmap example, bidirec-tional streets have no value while mono-directions use the TF and FT designa-tions to indicate to-from and from-to, respectively. The route solver uses a CATS Network fi le registered with CATS and a start and end point to create a shortest path route. This route can also include a hazard footprint that must be avoided.
3 Summary and conclusions
CATS is a consequence management tool package that integrates hazard predic-tion, hazard containment, consequence assessment, and routing using critical
ch019.indd 301ch019.indd 301 11/4/2011 5:55:41 PM11/4/2011 5:55:41 PM
www.witpress.com, ISSN 1755-8336 (on-line) WIT Transactions on State of the Art in Science and Engineering, Vol 54, © 201 WIT Press2

302 CRITICAL INFRASTRUCTURE SECURITY
population and infrastructure data. CATS has been used operationally to assess damage from disasters such as hurricanes, the Northridge and Kobe earth-quakes, and the Midwest fl oods [11,12]. In addition, CATS was deployed for the 2002 Winter Olympics in Salt Lake City, UT [13]. Using the overlay of the hazard footprint superimposed on the GIS streetmap data, a user can quickly establish areas potentially at risk, assess affected population and infrastructure, facilitate initial resource deployment, and assess needs and locate resources for a sustained response or mitigation strategy. It consists of the following capabili-ties to perform modeling and simulation for emergency management:
Models:
High ExplosiveERG2008—Initial isolation protective action distancesALOHA plume model
�
�
�
Table 1: Street attributes used to determine least cost path.
Code Description Speed (MPH)
A10–A18 Highway/freeway (high speed) 65
A20–A28 Highway with accessing roads 55
A30–A38 Major roads 45
A40–A48 Local roads 35
DESTINATION
ORIGIN
Total Route Distance: 2.28 Miles
Begin driving on L ST NW towards MASSACHUSETTS AVE NW.
Bear right onto MASSACHUSETTS AVE NW.
Merge onto SCOTT CIR NW.
Figure 7: Example routing report avoiding the ERG2008 hazard footprint.
ch019.indd 302ch019.indd 302 11/4/2011 5:55:42 PM11/4/2011 5:55:42 PM
www.witpress.com, ISSN 1755-8336 (on-line) WIT Transactions on State of the Art in Science and Engineering, Vol 54, © 201 WIT Press2
FRAMEWORKS AND TOOLS FOR EMERGENCY RESPONSE AND CRISIS MANAGEMENT 303
Net tools:
Place and address fi ndingBest and regional weather
Assessment tools:
Consequence assessmentRoadblocksRoadblock editingNetwork builderRouting
Interoperability
Joint effects modelHazard prediction and assessment capabilityHazards US multi-hazard
References
[1] Langhelm, R., The role of GIS in response to WTC—supporting the fi rst 30 days. Proceedings, 2002 ESRI Users Conference, San Diego, CA, 2002. proceedings.esri.com/library/userconf/proc02/pap1348/p1348.htm.
[2] Swiatek, J.A. & Kaul, D.C., Crisis prediction disaster management, Science and Technology Trends II, SAIC, McLean, VA, pp. 1–13,1999.
[3] Samuels, W.B., Amstutz, D.E., Bahadur, R., & Pickus, J., RiverSpill: A National Application for Drinking Water Protection, Journal of Hydraulic Engineering, Vol. 132, No. 4, pp. 393–403, 2006.
[4] LandScan, www.ornl.gov/sci/landscan/. [5] HSIP Gold, www.nsgic.org/hottopics/HIFLD_Regional_Concept.ppt. [6] SAIC, High Energy Explosives—The CATS HE Model, SAIC Technical Report –
Defense Threat Reduction Agency Contract No. DTRA01-03-D-0017, Delivery Order # 42, pp. 1–11, March, 2009.
[7] ERG2008, www.phmsa.dot.gov/hazmat/library/erg. [8] ALOHA, www.epa.gov/oem/content/cameo/aloha.htm. [9] HPAC, www.ofcm.gov/atd_dir/pdf/hpac.pdf. [10] HAZUS, www.fema.gov/plan/prevent/hazus/. [11] Kehlet, R., The use of the Consequences Assessment Tool Set, Proceedings, 1997
ESRI Users Conference, San Diego, CA, 1997. proceedings.esri.com/library/userconf/proc97/proc97/to400/pap383/p383.htm.
[12] Kaul, D., Consequences Assessment Tool Set (CATS), Proceedings, 2000 ESRI Users Conference, San Diego, CA, 2000. http://proceedings.esri.com/library/userconf/proc00/professional/papers/pap722/p722.htm.
[13] Davis, D., GIS and the Salt Lake 2002 Winter Olympics, GIS Vision 2002. www.gisvisionmag.com/vision.php?article�200204%2Fspecial.html.
�
�
�
�
�
�
�
�
�
�
ch019.indd 303ch019.indd 303 11/4/2011 5:55:43 PM11/4/2011 5:55:43 PM
www.witpress.com, ISSN 1755-8336 (on-line) WIT Transactions on State of the Art in Science and Engineering, Vol 54, © 201 WIT Press2