fracture properties and brittleness of high-strength concrete
TRANSCRIPT

ACI MATERIALS JOURNAL TECHNICAL PAPER Title no. 87-M66
Fracture Properties and Brittleness of High-Strength Concrete
by Ravindra Gettu, Zden~k P. Balant, and Martha E. Karr
The size-effect method for determining material fracture characteristics, as previously proposed by Bazant and extensively verified for normal strength concrete, is applied to typical high-strength concrete. Geometrically similar three-point bending specimens are tested and the measured peak load values are used to obtain the fracture energy, the fracture toughness, the effective length of the fracture process zone, and the effective critical crack-tip opening displacement. The brittleness of the material is shown to be objectively quantified through the size-effect method. Comparing the material fracture properties obtained with those of normal strength concrete shows that an increase of 160 percent in compressive strength causes: (1) an increase of fracture toughness by only about 25 percent, (2) a decrease of effective fracture proces zone length by about 60 percent, and (3) more than doubling of the brittleness number, which may be an adverse feature that will need to be dealt with in design. The brittleness number, however, is still not high enough to permit the use of linear elastic fracture mechanics. The R-curves are demonstrated to derive according to the size-effect law exclusively from the maximum loads of specimens of various sizes and yield remarkably good predictions of the load-deflection curves.
Keywords: brittleness; cracking (fracturing); crack propagation; energy; fracture properties; high-strength concretes; load-deflection curve; models.
Concretes of strengths exceeding 80 MPa (12,000 psi) are now commonly being used in the construction of high-rise buildings and offshore structures.1.5 The utilization of concrete of such high strength has been spurred on by the superior mechanical properties of the material and its cost-effectiveness.2,6 The high-strength concrete of today is a highly engineered material with several chemical and mineral admixtures. It is possible to obtain workable mixes with very low water contents by using superplasticizers and retarders. Pozzolanic additives such as fly ash and silica fume are employed to alter the hydration reactions beneficially and also to fill the microscopic voids between cement particles. Small, round aggregates are used to achieve better mixing and attain higher surface areas for bonding. Typical highstrength concrete has a very high-strength matrix, is more compact, and possesses well-bonded aggregatemortar interfaces. 7
In the past, research on high-strength concrete has primarily concentrated on increasing its "strength."8 In the last decade, however, considerable effort has been
608
spent in studying its mechanical properties and structural behavior .1-4,6,7,9-12 Nevertheless, many aspects, such as fracture behavior, need much more detailed investigation.
A complicating feature in the fracture analysis of brittle heterogeneous materials such as concrete is nonlinear behavior. This is due to the fact that the fracture process is not concentrated at a point, the crack-tip, but is distributed over a zone whose size is not negligible when compared to the dimensions of the body. The existence of the large fracture process zone is manifested in the size effect exhibited by concrete specimens and structures, which is considerable but not as strong as in linear elastic fracture mechanics (LEFM). The conditions for which LEFM is applicable to concrete are attained only for extremely large test specimens, testing of which would be very costly. However, material fracture properties which are unambiguous and, especially, size- and shape-independent, can be defined only on the basis of a very large specimen or, more precisely, by means of extrapolation to a specimen of infinite size.
The simplest method to obtain size-independent material fracture properties is perhaps provided by extrapolating to infinite size on the basis of the size-effect law proposed in References 13 and 14 (see also Reference 15). This law approximately describes the transition from the strength criterion, for which there is no size effect, to LEFM criterion, for which the size effect is the strongest possible. This law has been shown to agree well with concrete fracture tests in Mode 1,16 as well as Mode 1117 and Mode III. 18,19 A good agreement was also demonstrated for certain ceramics,20 rocks,21,22 and aluminum alloys.23
An important advantage of the size-effect method is its simplicity. The method requires only the maximum load values of geometrically similar specimens that are
ACI Materials Journal, V. 87, No.6, November - December 1990. Received Oct. 31, 1989, and reviewed under Institute publication policies.
Copyright © 1990, American Concrete Institute. All rights reserved, induding the making of copies unless permission is obtained from the copyright proprietors. Pertinent discussion will be published in the September - October 1991 A CI Materials Journal if received by June I, 1991.
ACI Materials Journal I November-December 1990

ACI member Ravindra Gettu is a graduate student of structural engineering at Northwestern University. He has an MS from Marquette University and a BEngng from the University of Madras. He is a member of ACI Committee 446, Fracture Mechanics. His current research interests include the behavior and modeling of structural materials, and fracture mechanics of concrete.
Zdenek P. Bazant, FACI, is a professor of civil engineering at Northwestern University, where he served as founding Director of the Center for Concrete and Geomaterials. He is a registered structural engineer, a consultant to Argonne National Laboratory, and editor-in-chief of ASCE Journal of Engineering Mechanics. He is Chairman of ACI Committee 446, Fracture Mechanics; a member of A CI Committees 209, Creep and Shrinkage of Concrete, and 348, Structural Safety; Chairman of RILEM Committee TC 107 on Creep, of ASCE-EMD Programs Committee, and of SMiRT Division of Concrete and Nonmetallic Materials; and a member of the Board of Directors of the Society of Engineering Science. Currently, Prof. Bazant is in Germany under the Humboldt A ward of U. S. Senior Scientist.
ACI member Martha E. Karr is a senior undergraduate student in civil engineering at Duke University. She worked with Prof. Bazant's group at Northwestern University in the summer of 1989 under support from an NSF program for undergraduate research. She is interested in structural engineering and is planning to pursue graduate study in this field.
sufficiently different in size. Such measurements can be carried out even with the most rudimentary equipment. Neither the post-peak softening response nor the true crack length need to be determined. Another advantage of the size-effect method is that it yields not only the fracture energy (or fracture toughness) of the material, but also the effective length of the fracture process zone, from which one can further obtain the R-curve and the critical effective crack-tip opening displacement. Determination of the fracture process zone size is of particular interest for high-strength concrete because (for a variety of reasons) such concrete is suspected to be more brittle and, therefore, to have a smaller fracture process zone than normal strength concrete.
In view of the aforementioned reasons, the size-effect method has been adopted to present experimental investigation of high-strength concrete. The objectives will be to obtain the fracture energy and the process zone size. The third objective will be to investigate whether the R-curves derived solely from maximum load data yield load-displacement curves that agree sufficiently well with measurements.
REVIEW OF THE SIZE·EFFECT LAW AND ITS IMPLICATIONS
Size effect Structures and test specimens of brittle heterogene
ous materials, such as concrete, rock, and ceramics, exhibit a pronounced size effect on their failure loads. This phenomenon, which is an important consequence of fracture mechanics, has been described by the sizeeffect law proposed by References 13 and 14
Blu ../1+/3'
d /3=-
do (1)
which applies to geometrically similar structures (or specimens) of different sizes: aN = cnPJbd = nominal stress at maximum load Pu (ultimate load), b = thickness of the structure or specimen identical for all sizes
ACI Materials Journal I November·December 1990
(two-dimensional similarity), d = size or characteristic dimension of the structure (or specimen), Cn = coefficient introduced for convenience, B and do = parameters determined experimentally,lu is a measure of material strength, and (3 is called the brittleness number. Eq. (1) also applies to structures that are similar in three dimensions by taking aN = cn PJd2• In this paper, only two-dimensional similarity is considered.
Plastic limit analysis, as well as any analysis with failure criteria in terms of stresses and strains, exhibits no size effect, that is, aN is independent of size if the structures are geometrically similar. According to Eq. (1), this behavior is obtained for very small bodies of concrete, (3 < < 1. The application of fracture mechanics theory, however, results in aN being strongly size dependent. This is easily seen24 from the LEFM relations for energy release rate G, and stress intensity factor K J
G P 1(0'.)
bJd (2)
where P = applied load, 1(0'.) is a geometry-dependent function of relative crack length 0'. = old, a = crack length, g(O'.) = [f(0'.)j2, E' = E for plane stress, E' =
EI(1 - u2) for plane strain, E = Young's modulus of
elasticity, and u = Poisson's ratio. Values of 1(0'.) can be obtained by elastic analysis techniques, such as the finite element method, and for basic specimen geometries, formulas for function 1(0'.) can be found in fracture mechanics handbooks (e.g., Tada, Paris, and Irwin,25 and Murakamj26).
When g' (0'.) > 0 [where g' (0'.) is the derivative of g(O'.) with respect to 0'.), which applies to most situations, LEFM indicates that the maximum load occurs at infinitesimal crack extensions. Therefore, 0'. at maximum load is practically the same for bodies of different sizes. Setting G = Gf (fracture energy) or KJ = KJc (fracture toughness or critical stress intensity factor) along with P = Pu, Eq. (2) according to LEFM yields the dependence of aN on size, which is aN = constant! Jd. As is well known, LEFM criteria govern only the fracture behavior of very large concrete structures.
In common-size concrete structures and specimens, the fracture process zone that forms in front of a propagating crack affects the behavior significantly. With increasing load, this zone grows in size while remaining attached to the notch tip [provided that the specimen geometry is such that g' (0'.) > 0]. The process zone shields the propagating crack tip, and thereby increases the fracture resistance. The nonlinear fracture regime, where the influence of the process zone is dominant, lies between behavior governed by limit analyis and LEFM. As a result, there is a considerable size effect on the failure of normal concrete structures and specimens, but it is not as strong as that of LEFM. This transitional size effect is described by Eq. (1).
The size-effect law [Eq. (1»), giving the approximate relation of aN to (3 (the brittleness number), is plotted in Fig. 1. For large (3, such as (3) 10, Eq. (1) gives (with an error under 5 percent) the approximation aN ex d- y, ,
609

O. 1 -, I , I , .,,,,------.--,---i 0.1 1 10
brittleness number, ,B=d/ do
Fig. 1 - The size-effect law
which is the size effect exhibited by LEFM. For small {3, such as {3<0.1, Eq. (1) yields (again with an error under 5 percent) aN = Bf" = constant, that is, failure loads are proportional to the strength of the material and there is no size effect. For 0.1 < {3 < 10, the size effect is transitional between LEFM and plastic limit analysis. In this range, nonlinear fracture mechanics must be employed. 16.24
Fracture parameters Nonlinear fracture can be characterized by two ma
terial parameters, the fracture energy Gf , and the effective length of the fracture process zone cf . When determined from individual tests, however, these quantities are strongly size-dependent. Unambiguous definitions of Gf and cf as fundamental material properties, independent of specimen size and shape,16,21.22,24 can be given on the basis of size effect: Gf and cf are the energy required for crack growth and the effective (elastically equivalent) length of the fracture process zone, respectively, in an infinitely large specimen.
Mathematically, the definition of fracture energy can be stated as Gf = ~'".oo G m = ~'".oo (K7m/E'), where G m
and KIm are the apparent values of G and KI, respectively, calculated according to LEFM [Eq. (2)] for the measured peak load Pu and initial crack or notch length
ao• Eq. (1) can be used to determine Gf and cf from ex
perimental data using their foregoing definitions. A simple formula for Gf has been derived in Reference 24
(3)
For the effective length of the fracture process zone, the following expression has been derived in Reference 21
(4)
The ratio of cf to the true length of the process zone in
610
concrete depends on the shape of the softening stressdisplacement or stress-strain relations. For concrete, the rati020 seems to be about 2. However, the actual length of the process zone need not be known for the calculations.
Also, for an infinitely large specimen, the fracture toughness K lc can be obtained as
(5)
The practical applicability of Eq. (3) [or Eq. (5)] has been verified in Reference 16 through tests of normal concrete which showed that the three-point bend specimens, the double-notched tension specimens, and the eccentric compression specimens yield about the same value of Gf . In this study we assume the same to be true of high-strength concrete.
Due to the approximate nature of Eq. (1), the infinite size used in the definitions of Gf , cr' and Klc must not be interpreted literally. In practice, the infinite size should be assumed as a size just beyond the upper bound of the range for which the size-effect law has been calibrated by tests or otherwise.24
Using the relationships B = [E' G/g' (ao)cA"'cnlfu and do = Ljg' (ao)/g(ao) in Eq. (1), the size-effect law can be reformulated in terms of the material fracture properties Gf and cf
I E'Gf lY; aN = C
n 19'(aO)cf
+ g(ao)dJ (6)
Alternatively, Eq. (6) can be put in a form convenient for the analysis of specimens which are not geometrically similar21
(7)
where TN = .Jg'(ao) Pjbd;a = dg(ao)/g'(ao); TN = intrinsic (shape-independent) nominal stress at failure; anda = intrinsic (shape-independent) size of the structure.
The brittleness number {3 [see Eq. (l)] proposed by Bazant can also be expressed as21 ,24
(3 = g( ao) d = ~ g' (ao)cj Lj
(8)
This number is capable of characterizing the type of failure (brittle or ductile) regardless of structure geometry.16 It can quantify the proximity of the behavior of a structure to LEFM and therefore is a convenient and effective measure of the brittleness of a structure or specimen. It is also useful for comparing the behavior of specimens of different materials (with different compositions and strengths) such as high-strength and regular concretes. Other brittleness numbers defined for concrete by Hillerborg27 and Carpinteri28
,29 can compare only structures of similar geometry.
ACI Materials Journal/November-December 1990

The size-effect law in the form of Eq. (1), (6), or (7) has the advantage that its parameters B and do, or Gf and cf ' can be determined from the measured peak loads P u by linear regression. IJ ,14 Eq. (1), applicable to geometrically similar specimens of different sizes, can be algebraically transformed to a linear plot
Y = AX + C (9)
in which
X = d, Y = (jjaN ) 2,
B = I/vtcanddo = CIA (10)
The size range of the specimens used in the regression analysis must be sufficiently large in relation to the random scatter of material properties and test measurements. For the typical scatter of concrete, the minimum size range recommended is 1 :4.
The size-effect method can also be used to determine fracture properties other than those already defined. Considering the infinitely large specimen again, material parameters such as the effective (elastically equivalent) crack-tip opening displacement at the peak load, oef' can be related to cf and K lc using LEFM relations22
(11)
The value of oef pertains to the effective opening when the stress at the notch (or initial crack) tip is just reduced to zero, and the fracture process zone is about to detach and advance away from this tip.
The size of the fracture process zone can also be characterized by the length parameter
(12)
first used by Irwin30 for the size of the yielding zone in ductile fracture. For concrete, this length parameter was introduced by Hillerborg, Modeer, and Petersson.31 The parameter Co is a size-independent measure of the intensity of the toughening or crack-tip shielding mechanisms. It can be used to compare the brittleness of one material with another. A material with a rei ati vely low Co would be more brittle than a material with a higher Co.
R-curves Another important consequence of the fracture
process zone is the fracture resistance curve or R-curve. Since the fracture process zone evolves as it propagates, the resistance R(c) to fracture growth, representing energy dissipated per unit length and width of fracture extension, gradually increases. The function R(c), called the R-curve, was initially proposed to be used as a material property,n,33 independent of the shape of the
ACI Materials Journal I November-December 1990
specimen or structure. It was, however, shown34,35 that the R-curves for concrete strongly depend on the specimen geometry. A general derivation of the R-curve equations from the size-effect law as presented in Reference 21 yields the expression
R(c) (13)
in which r is given by
(14)
The foregoing relations [Eq. (13) and (14)] are valid as long as the fracture process zone remains attached to the tip of the initial crack or notch. This ceases to be true after the peak load. 22 Since the fracture process zone in the post-peak regime is detached from the tip (separated from the initial tip by a traction-free crack) and is advancing ahead with approximately constant size, it dissipates roughly the same amount of energy per unit crack extension. Consequently, the critical value of G after the peak load must be kept constant and equal to the values of R reached at the peak load. The effective R-curves given by Eq. (13) and (14) are size-independent until the peak load but deviate afterwards into size-dependent horizontal branches. The size-dependence of R-curves in the post-peak regime has been previously observed for concrete36 and other materials. 22,23,37 These effective R-curves tend to move toward complete coincidence with the actual R-curve as the size increasesY
EXPERIMENTAL INVESTIGATION Test details
High-strength concrete used in the construction industry varies widely in composition and strength. Even the demarcation between high and normal strength concretes is subjective and appears to be continually rising.2,g To study typical high-strength concrete used in the industry, this investigation was conducted on material obtained directly from a batch mixed for the construction of a high-rise building in downtown Chicago.
The concrete mix was designed to exceed a 28-day compressive strength of 83 MPa (12,000 psi). Cement of much higher quality than standard (ASTM C 150) portland cement was selected. Silica fume (micro silica) and fly ash were used as mineral admixtures. The maximum aggregate size da in the mix was 9.5 mm (3/8 in.). The details of the mix composition are given in Table 1. The proportions, by weight, of cement: sand: gravel : water: fly ash: micro silica were 1 : 1.35 : 2.42 : 0.35 : 0.25 : 0.04. The fresh concrete had a unit weight of 2410 kg/ml (15Ilb/ftl) and a slump of 235 mm (9.3 in.) as measured with a standard 305 mm (12 in.) cone.
Along with the fracture specimens, three 152 x 304 mm (6 x 12 in.) cylinders and three 102 x 204 mm (4 x 8 in.) cylinders were cast. These cylinders were capped with a sulfur compound and cured in a fog room.
611
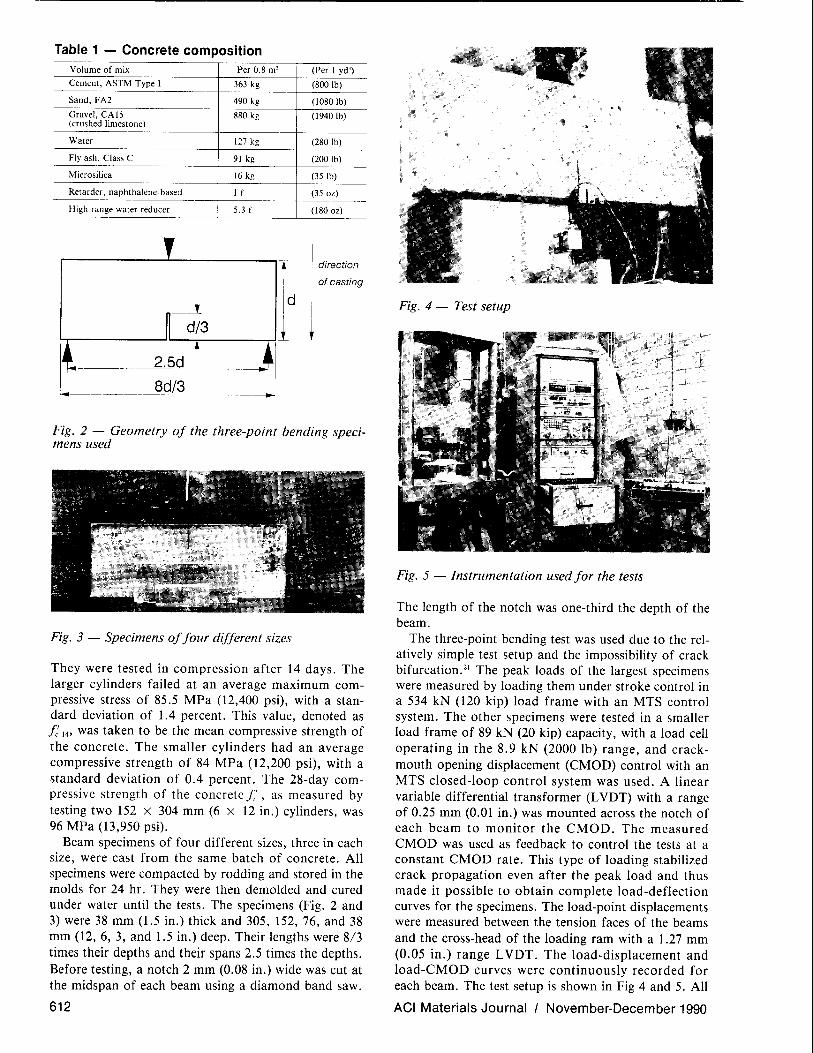
Table 1 - Concrete composition Volume of mix Per 0.8 m'
Cement, ASTM Type I 363 kg
Sand, FA2 490 kg
Gravel, CAI5 880 kg (crushed limestone)
Water 127 kg
Fly ash, Class C 91 kg
Microsilica 16 kg
Retarder, naphthalene-based I e High-range water reducer 5.H
l i
id
d/3 1 It-------~5d_-- -__ I ~---------~-q~------~
(Per I yd')
(800 Ib)
(l080Ib)
(1940Ib)
(280Ib)
(200 Ib)
(35Ib)
(350z)
(l800z)
direction
of casting
Fig. 2 - Geometry of the three-point bending specimens used
Fig, 3 - Specimens of four different sizes
They were tested in compression after 14 days, The larger cylinders failed at an average maximum compressive stress of 85.5 MPa (12,400 psi), with a standard deviation of 1.4 percent. This value, denoted as fi 14' was taken to be the mean compressive strength of the concrete. The smaller cylinders had an average compressive strength of 84 MPa (12,200 psi), with a standard deviation of 0.4 percent. The 28-day compressive strength of the concrete fi , as measured by testing two 152 x 304 mm (6 x 12 in.) cylinders, was 96 MPa (13,950 psi).
Beam specimens of four different sizes, three in each size, were cast from the same batch of concrete. All specimens were compacted by rodding and stored in the molds for 24 hr. They were then demoldedand cured under water until the tests. The specimens (Fig. 2 and 3) were 38 mm (1.5 in.) thick and 305, 152,76, and 38 mm (12, 6, 3, and 1.5 in.) deep. Their lengths were 8/3 times their depths and their spans 2.5 times the depths. Before testing, a notch 2 mm (0.08 in.) wide was cut at the midspan of each beam using a diamond band saw.
612
Fig. 4 - Test setup
Fig. 5 - Instrumentation used for the tests
The length of the notch was one-third the depth of the beam.
The three-point bending test was used due to the relatively simple test setup and the impossibility of crack bifurcation.21 The peak loads of the largest specimens were measured by loading them under stroke control in a 534 kN (120 kip) load frame with an MTS control system. The other specimens were tested in a smaller load frame of 89 kN (20 kip) capacity, with a load cell operating in the 8.9 kN (2000 lb) range, and crackmouth opening displacement (CMOD) control with an MTS closed-loop control system was used. A linear variable differential transformer (L VDT) with a range of 0.25 mm (0.01 in.) was mounted across the notch of each beam to monitor the CMOD. The measured CMOD was used as feedback to control the tests at a constant CMOD rate. This type of loading stabilized crack propagation even after the peak load and thus made it possible to obtain complete load-deflection curves for the specimens. The load-point displacements were measured between the tension faces of the beams and the cross-head of the loading ram with a 1.27 mm (0.05 in.) range L VDT. The load-displacement and load-CMOD curves were continuously recorded for each beam. The test setup is shown in Fig 4 and 5. All
ACI Materials Journal I November-December 1990

4000
3000
z
-02000
o o
1000
------------------
~ //\\
1/ l
d= 152.4 mm
V\ ~76.2 mm
d=38'1~~. ~~ mm ~ ~
+------~-,----------,-------,_ ~ J 0.05 0.10 0.15 0.20
load-line deflection (mm)
Fig. 6 - Typical load-displacement curves for different sizes
the beams were tested 14 days after casting and with CMOD rates such that they reached their peak loads in about 10 min. Typical curves for different specimen sizes are shown in Fig. 6 and 7, and the raw data are given in Table 2.
The test results from the largest beams were, however, excluded from the following analysis because their load values were inconsistent with the trend of the other tests. In retrospect, this inconsistency may be due to the difference in control parameters used for testing and in machine characteristics. Under stroke control, which was used only for the largest beams, it was not possible to obtain a stable response at the peak load. The instability of crack propagation may have caused a high crack propagation rate near the peak load. This might explain why the peak loads of these specimens were higher than expected.
The modulus of rupture of the material was used as the measure of its strength. Four specimens, each with a depth of 51 mm (2 in.) and a span of 152 mm (6 in.), were cut from two of the 152 mm (6 in.) deep fracture specimens that had already been tested. These unnotched beams were tested to failure in three-point bending under stroke control in the 89 kN (20 kip) load frame. From the peak loads the modulus of rupture of each specimen was calculated. The average valuefu was found to be 11.0 MPa (1600 psi), with a standard deviation of 5 percent. Carrasquillo, Nilson, and Slate7
proposed an empirical formula for the modulus of rupture of high-strength concrete: f, = 0.94vJ:'(stresses in MPa). Using the value of f:14 in their relation, f, was obtained as 8.7 MPa (1260 psi). The difference in the values of fu and f, may partly be due to errors in the predictions of the formula (known to be up to 15 percent) but it might also be due to the significant size effect which is known to exist in flexural tests on plain concrete beams. 14,38
As noted previously by several researchers,7,9,10,39 cracks in high-strength concrete were seen to propagate through the coarse aggregates. This is an important difference from normal strength concrete, in which cracks (in the vicinity of gravel particles) propagate
ACI Materials Journal I November-December 1990
4000-:--------- --------
-0 2000 -
o o
1000
o ~-T--,------___r__------,----I-~~ ----,---~--,----------1
0.00 0.02 0.04 0.06 0.08 O. T a crock mouth opening displacement (mm)
Fig. 7 - Typical load-CMOD curves for different sizes
Table 2 - Summary of test results Specimen Peak Deflection Final Peak
dimensions, * load, at peak load, deflection, t CMOD, mm X mm N mm mm mm
38.1 X 101.6 1668 NR NR 0,0127 1490 0,0610 0.1092 0,0114 1735 0.0914 NR 0.0146
76.2 X 203,2 2357 0.0864 0,1727 0.0222 2091 0.0686 0,1626 0.0152 2535 0.0711 0.1422 0,0292
152.4 X 406.4 3825 0.1143 0.2184 0.0381 3736 0.0940 0,3200 0.0437 3825 0,1710 0.2388 0.0356
304.8 X 812.8' 7072 7442 NM NM NM 7695
• All specimens 38, I mm wide, , Deflection when the load drops to 10 percent of peak load. I Stroke-controlled tests, not used in analysis.
Eo. GPa
6.0 7.0 5.5
7,7 8,2 9.0
9.2 6.2
12.7
NM
Eo = Young's modulus from initial load-deflection compliance. W, = area under load-deflection curve. NM = values not measured. NR = values not recorded due to failure of instrumentation.
Wo, N-mm
NR 74
NR
167 143 142
362 418 326
NM
mainly along the aggregate-mortar interfaces. The reduced crack deflection by the aggregates is due to the strong aggregate-mortar bond and the fact that the strength of the matrix approaches that of the aggregates. Obviously, this near-homogeneous behavior decreases the width of the process zone as well as the shielding effect of the aggregates.
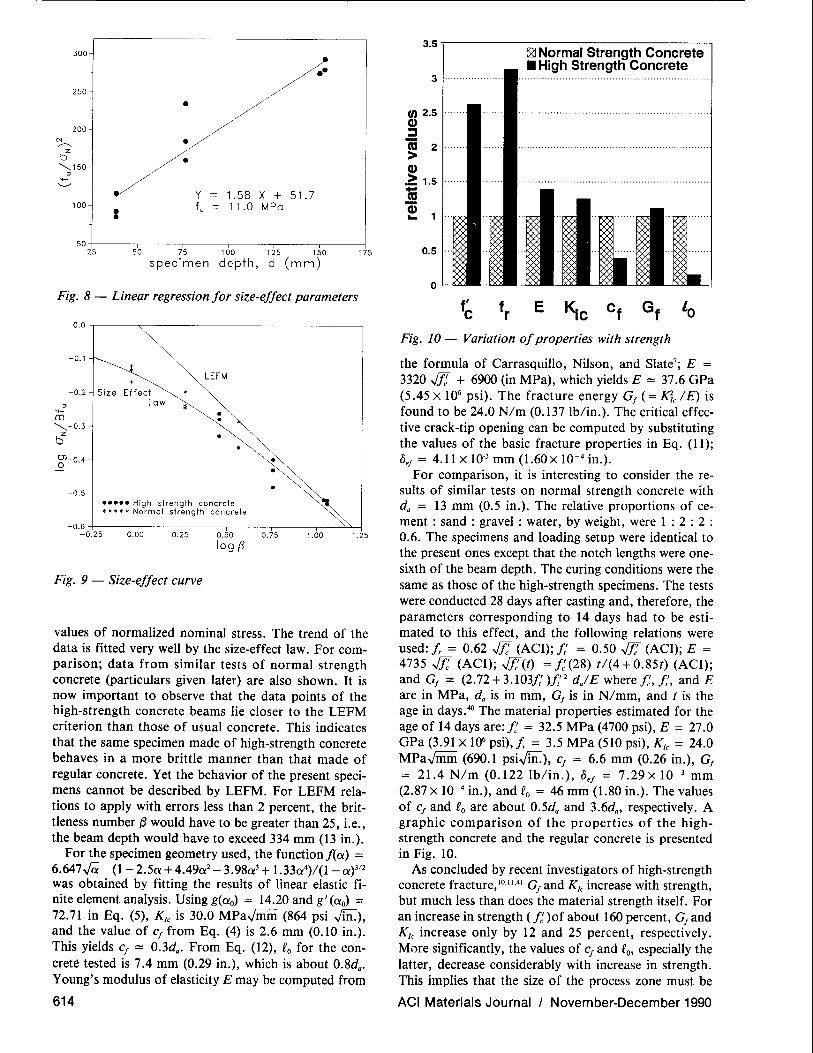
Analysis Linear regression analysis (Fig. 8), using Eq. (9) and
(10), yields coefficients A = 1.58 mm- I (40.1 in.- I) and
C = 51.7. The coefficient of variation of the deviations from the regression line is w = Sy/xlY = 15 percent, where Sy!X is the standard error of the Yestimate and Y is the mean of the experimental Y-values. From Eq. (10), the parameters of Eq. (1) are computed as B = 0.139 and do = 32.8 mm (1.29 in.). Nonlinear regression analysis directly for B and do, using the Marquardt-Levenberg algorithm, results in B = 0.198 and do = 13.3 mm (0.52 in.) with w = 8.4 percent. Since the nonlinear regression provides a better fit, the latter values for the size-effect parameters are used henceforth.
Fig. 9 shows the size-effect curve [Eq. (1)] based on the calculated parameters along with the experimental
613
300
250
200 N ~
z b
"",,150 ~
'+-'-'
100
50
I
25
•
--Y = 1.58 X + 51.7 fu = 11.0 MPa
.-
50 75 100 125 150
specimen depth, d (mm) 175
Fig. 8 - Linear regression for size-effect parameters
0.0 ,---~--------------,
-0.1
-0.2
g'-0.4
-0.5
Size Effect Law
LEFM
• • •
••••• High strength concrete ***** Normal strength concrete
• • •
-0.6 ~--'---'---r---'-------'-~"---j -0.25 0.00 0.25 0.50 0.75 1.00 1.25
log (3
Fig. 9 - Size-effect curve
values of normalized nominal stress. The trend of the data is fitted very well by the size-effect law. For comparison; data from similar tests of normal strength concrete (particulars given later) are also shown. It is now important to observe that the data points of the high-strength concrete beams lie closer to the LEFM criterion than those of usual concrete. This indicates that the same specimen made of high-strength concrete behaves in a more brittle manner than that made of regular concrete. Yet the behavior of the present specimens cannot be described by LEFM. For LEFM relations to apply with errors less than 2 percent, the brittleness number {3 would have to be greater than 25, i.e., the beam depth would have to exceed 334 mm (13 in.).
For the specimen geometry used, the functionj{a) = 6.647 Ja (I - 2.5a + 4.49a2
- 3.98a3 + 1.33(4)/(I- a)312 was obtained by fitting the results of linear elastic finite element analysis. Using g(ao) = 14.20 and g' (ao) = 72.71 in Eq. (5), K/c is 30.0 MPav'min (864 psi v'lfi.), and the value of cf from Eq. (4) is 2.6 mm (0.10 in.). This yields cf ::::: 0.3da• From Eq. (12), fo for the concrete tested is 7.4 mm (0.29 in.), which is about 0.8da•
Young's modulus of elasticity E may be computed from
614
3.5,.-------------------, E2l Normal Strength Concrete • High Strengtti Concrete
3 ................. .
(f) 2.5 C1) :::s co 2 > C1)
.=:: 1.5
10 ~ 1
0.5
o
f' c Fig. 10 - Variation of properties with strength
the formula of Carrasquillo, Nilson, and Slate7; E
3320 .JJ: + 6900 (in MPa), which yields E ::::: 37.6 GPa (5.45 X 10⁶ psi). The fracture energy Gf (= KJc I E) is found to be 24.0 N/m (0.137 lb/in.). The critical effective crack-tip opening can be computed by substituting the values of the basic fracture properties in Eq. (11); oef = 4.11 X 10⁻³ mm (1.60 x 10- 4 in.).
For comparison, it is interesting to consider the results of similar tests on normal strength concrete with da = 13 mm (0.5 in.). The relative proportions of cement : sand: gravel: water, by weight, were 1 : 2 : 2 : 0.6. The specimens and loading setup were identical to the present ones except that the notch lengths were onesixth of the beam depth. The curing conditions were the same as those of the high-strength specimens. The tests were conducted 28 days after casting and, therefore, the parameters corresponding to 14 days had to be estimated to this effect, and the following relations were used: f,. = 0.62 .JJ: (ACI); f: = 0.50 .JJ: (ACI); E =
4735 .JJ: (ACI); .JJ:(t) = f: (28) tl(4 + 0.85t) (ACI); and Gf ::::: (2.72 + 3.1 031t' )It' 2 dalE where f:, It', and E are in MPa, da is in mm, Gf is in N/mm, and t is the age in days.40 The material properties estimated for the age of 14 days are: f: = 32.5 MPa (4700 psi), E = 27.0 GPa (3.91 X 1()6 psi), f,. = 3.5 MPa (510 psi), K/c = 24.0 MPav'mm (690.1 psiv'lfi.) , cf = 6.6 mm (0.26 in.), Gf = 21.4 N/m (0.122 lb/in.), oef = 7.29 X 10- 3 mm (2.87 X 10- 4 in.), and fo = 46 mm (1.80 in.). The values of cf and fo are about 0.5da and 3.6da, respectively. A graphic comparison of the properties of the highstrength concrete and the regular concrete is presented in Fig. 10.
As concluded by recent investigators of high-strength concrete fracture,IO·11.41 Gf and K/c increase with strength, but much less than does the material strength itself. For an increase in strength (f: )of about 160 percent, Gf and K[c increase only by 12 and 25 percent, respectively. More significantly, the values of cf and fo, especially the latter, decrease considerably with increase in strength. This implies that the size of the process zone must be
ACI Materials Journal I November·December 1990

smaller in high-strength concrete than in regular concrete, and the crack-tip shielding by the fracture-process zone must be weaker. Consequently, the same structure made of high-strength concrete is more brittle than that made of regular concrete. The brittleness number of any structure is more than doubled, since it is inversely proportional to the value of cf .
Conventional fracture analysis of the type applied to metals, based only on K lc or Gf , would yield the misleading conclusion that the ductility of concrete increases with strength, e.g., see De Larrard, Boulay, and Rossi. 41 This was also pointed out by John and Shah lO
on the basis of tests on high-strength mortar. According to RILEM recommendations,42 the frac
ture energy, denoted as 0, is defined by the work-offracture method introduced for ceramics by Nakayama43 and Tattersall and Tappin,44 and proposed for concrete by Hilerborg. 27 ,45 In this method, GJ can be determined from the area Wo under the load-deflection curve of a fracture specimen. The total energy dissipated in the test is given by W = Wo + mg uf , where mg = weight of the specimen and uf = deflection when the beam fractures completely. The RILEM fracture energy is assumed to be the average dissipated energy per unit cracked surface area; therefore, G7 = WI (d - ao)b, where d = depth of the beam and ao = initial notch length. For practical reasons, uf was taken to be the deflection when load had dropped to 10 percent of the measured peak load. The corresponding fracture toughness can be obtained as Kw = .J0Eo, where Eo is the Young's modulus corresponding to the initial compliance. The values of KJ K lc for different sizes have been calculated from the present results and plotted in Fig. 11. It is obvious that the fracture toughness obtained by the RILEM method is strongly size-dependent and prone to considerable scattering. It also appears that for very large sizes, the values of Kw tend toward Kin i.e., the fracture toughness from the sizeeffect law. A similar result could be shown in terms of the fracture energy.
PREDICTION OF STRUCTURAL RESPONSE FROM R·CURVES
An effective, simple, and reasonably accurate method of predicting the load-deflection curves is to identify the size-effect law from the maximum load data, determine from it the geometry-dependent Rcurve, and then utilize the R-curve along with LEFM relations. 22 This method is now used to predict the loaddeflection curves of the high-strength concrete beams. The predictions are then compared with the measured load-deflection curves.
The derivation of the equations used in the method is briefly outlined for convenience. Let Uc = load-point displacement of a specimen due to fracture, Uo = displacement calculated as if there were no crack, and U =
Uc + Uo = the total displacment. Wp denotes the total energy that would be released if the fracture occurred at constant load P. Since 0 Wploa = bG = p2g(a)1 E' bd, we have
ACI Materials Journal I November·December 1990
121
1.1
1.0 •
.. •
0.8
0.7 +---,-- i I ~ ,----1 25 50 75 100 125 150 175
specimen depth (mm)
Fig. 11 - Fracture toughness from work-of-fracture method
Wp = b ~ G(a) da = ;'2b t g(a') da' (15)
According to Castigliano's second theorem
= oWp
= 2P fa (a") da' (16) UC OP E' b Jo g
At the same time, for G = R
E'd bJd P = b g(a) R(c) = f(a) KIR (c) (17)
where c = (a-ao)d = effective crack extension, and KIR(C) = .JE'R(c) = effective fracture resistance. Thus, P and Uc can be obtained from Eq. (16) and (17), for different chosen vlaues of a or c, yielding the load-deflection curve of the structure or specimen with a propagating crack. Before the peak load, one uses the Rcurve values derived from the size-effect law [Eq. (14) and (15)], but after the peak load, as mentioned earlier, the R-curve, as well as KIR(C), is constant.
To obtain the total deflections, the elastic deflections Ub and u, due to bending and shear must also be calculated. Assuming plane stress conditions and adopting the bending theory, the load-point displacement Uo of the beam without crack is
PD Uo = Ub + Us> Ub = 4bdJE' (18)
PL US = 0.6(1 + v) bdE
where L is the span of the specimen, and U b and Us are the contributions of bending and shear, respectively. The weight of the beam is approximately taken into account in the calculations by replacing it with a concentrated midspan load which produces an equivalent midspan moment.
Fig. 12(a) through (c) compare the predictions of the foregoing method for the present high-strength concrete beams with the measured load-deflection curves for specimens of three different sizes. The Young's
615

4000
3000
,.----., Z
-U 2000
0 0
1000
o'Og 0 0
00
00000 Experiment Prediction
0
0
0
0 0
0 0
O~--------'---------r---0.00 0.05 0.10 0.15
deflection (mm)
(a)
0.20
2500,---------------------------------------,
2000
-u o 01000
500
o o
00000 Experiment -- Prediction
o
g.400----~--0~.6T-5 -~-~---,- 0.15
deflection (mm)
,.----., Z
-u 0 0
1600
1200
800
400
(b)
00000 Experiment -- Prediction
g400----0.-.0-2 ---0:04 0.06 0.08
deflection (mm)
(c)
0.20
0.: 0 0.12
Fig. 12 - Predicted and experimental load-deflection curves for different sizes: (a) d = 152.4 mm, (b) d = 76.2 mm, (c) d = 38.1 mm
modulus, in each case, was taken as that corresponding to the initial compliance of the specimen, and the Poisson's ratio was assumed to be 0.20. It can be seen that the R-curve method predicts the specimen response quite well. The R-curve derived from the size-effect law is thus shown to be a useful tool for modeling structural behavior with ease and simplicity.
616
CONCLUSIONS 1. The size-effect method provides reliable fracture
properties for high-strength concrete with a very simple experimental setup. These properties, namely, the fracture energy (or fracture toughness) and the effective length of the fracture process zone (as well as the effective critical crack-tip opening displacement derived from them) are size-independent and, therefore, true material properties.
2. As the strength increases, the fracture energy and the fracture toughness of concrete also increase, although much less than the strength. The effective size of the fracture process zone, however, diminishes. This results in decreased crack-tip shielding and, consequently, increase in the brittleness of specimen or structure. Increasing the compressive strength by 160 percent causes the brittleness number to more than double. This property can be disadvantageous and needs to be addressed in design.
3. Despite the aforementioned increase in brittleness, the behavior of contemporary high-strength concrete, in the normal size range, is still governed by nonlinear fracture mechanics rather than linear elastic fracture mechanics.
4. The R-curves derived according to the size-effect law solely from maximum loads can be utilized to provide reasonably accurate predictions of the load-deflection curves of concrete structures, even in the post-peak regime. The procedure requires only: (a) knowledge of the linear elastic fracture mechanics relations for the geometry of the structure and (b) the values of two basic material fracture parameters obtained from maximum loads through the size-effect method.
ACKNOWLEDGM ENTS This work was partially supported by the Center for Advanced Ce
ment-Based Materials at Northwestern University (NSF Grant DMR-8808432). The underlying basic theory was developed under partial support from AFOSR Contract 49620-87-C-0030DEF with Northwestern University. Summer support for M. E. Karr was provided under NSF Grant BCS-8818230. The authors are grateful to Jaime Moreno and Arthur King of Material Services Corporation, Chicago, Ill., for donating the concrete used in the experiments.
a b
i" g(a) g'(a)
Po A B C
NOTATION effective crack length specimen thickness elastically equivalent crack growth effective length of fracture-process zone coefficient for convenience (here, equal to 1) characteristic speciman dimension (here, specimen depth) maximum aggregate size parameter determined experimentally 28-day compressive strength 14-day compressive strength some measure of material strength function dependent on specimen shape derivative of g (a) with respect to a parameter related to the size of the process zone slope of linear regression plot parameter determined experimentally intercept of linear regression plot
ACI Materials Journal I November-December 1990
IX
Young's modulus E for plane stress, E/(1 strain energy release rate fracture energy stress intensity factor fracture toughness maximum or peak load relati ve crack length
V 2) for plane strain
initial relative crack or notch length brittleness number effective critical crack-tip opening Poisson's ratio nominal stress at maximum load
REFERENCES 1. Shah, S. P., Editor, High Strength Concrete (Proceedings,
Workshop in Chicago, 1979), National Science Foundation, Washington, D.C., 226 pp.
2. ACI Committee 363, "State-of-the-Art Report on High-Strength Concrete," (ACI 363R-84), American Concrete Institute, Detroit, 1984,48 pp.
3. High-Strength Concrete, SP-87, American Concrete Institute, Detroit, 1985,288 pp.
4. Utilization of High Strength Concrete (Proceedings, Symposium in Stavanger), TAPIR, Trondheim, 1987,688 pp.
5. Godfrey, K. A., Jr., "Concrete Strength Record Jumps 36070," Civil Engineering-ASCE, V. 57, No. 10, Oct. 1987, pp. 84-88.
6. Ahmad, Shuaib H., and Shah, S. P., "Structural Properties of High Strength Concrete and Its Implications for Precast Prestressed Concrete," Journal, Prestressed Concrete Institute, V. 30, No.6, Nov.-Dec. 1985, pp. 92-119.
7. Carrasquillo, Ramon L.; Nilson, Arthur H.; and Slate, Floyd 0., "Properties of High Strength Concrete Subject to Short-Term Loads," ACI JOURNAL, Proceedings V. 78, No.3, May-June 1981, pp. 171-178.
8. Carrasquillo, R. L.; Nilson, A. H.; and Slate, F. 0., "HighStrength Concrete: An Annotated Bibliography 1930-1979," Cement, Concrete, and Aggregates, V. 2, No. I, Summer 1980, pp. 3-19.
9. Carrasquillo, Ramon L.; Slate, Floyd 0.; and Nilson, Arthur H., "Microcracking and Behavior of High Strength Concrete Subject to Short-Term Loading," ACI JOURNAL, Proceedings V. 78, No. 3, May-June 1981, pp. 179-186.
10. John, R., and Shah, S. P., "Effect of High Strength Concrete and Rate of Loading on Fracture Parameters of Concrete," Preprints, SEM/RILEM International Conference on Fracture of Concrete and Rock (Houston, 1987), Society for Experimental Mechanics, Bethel. Also, "Fracture Mechanics Analysis of High Strength Concrete," Journal of Materials in Civil Engineering, ASCE, V. I, No.4, Nov. 1989, pp. 185-198.
II. Tognon, G., and Cangiano, S., "Fracture Behaviour of HighStrength and Very High Strength Concretes," Proceedings, RILEM International Workshop on Fracture Toughness and Fracture Energy-Test Methods for Concrete and Rock (Sendai, Oct. 1988), A. A. Balkema, Rotterdam.
12. Shah, Surendra P., "Fracture Toughness of Cement-Based Materials," Materials and Structures, Research and Testing (RILEM, Paris), V. 21, No. 122, Mar. 1988, pp. 145-150.
13. Bazant, Z. P., "Fracture in Concrete and Reinforced Concrete," Preprints, IUTAM Prager Symposium on Mechanics of Geomaterials: Rocks, Concretes, Soils, Northwestern University, Evanston, 1983, pp. 281-316. Also, Mechanics of Geomaterials, Rocks, Concrete, Soils, John Wiley & Sons, Chichester, 1985, pp. 259-304.
14. Bazant, Zdenek P., "Size Effect in Blunt Fracture: Concrete, Rock, Metal," Journal of Engineering Mechanics, ASCE, V. 110, No.4, Apr. 1984, pp. 518-535.
15. Bazant, Z. P., "Mechanics of Distributed Cracking," Applied Mechanics Reviews, V. 39, No.5, May 1986, pp. 675-705.
ACI Materials Journal/November-December 1990
16. Bazant, Zdenek P., and Pfeiffer, Phillip A., "Determination of Fracture Energy from Size Effect and Brittleness Number," A CI Materials Journal, V. 84, No.6, Nov.-Dec. 1987, pp. 463-480.
17. Bazant, Z. P., and Pfeiffer, P. A., "Shear Fracture Tests of Concrete," Materials and Structures, Research and Testing (RILEM, Paris), V. 19, No. 110, Mar.-ApT. 1986, pp. 111-121.
18. Bazant, Z. P., and Prat, P. c., "Measurement of Mode III Fracture Energy of Concrete," Nuclear Engineering and Design (Lausanne), V. 106, 1988, pp. 1-8.
19. Bazant, Zdenek P.; Prat, Pere C.; and Tabbara, Mazen R., "Antiplane Shear Fracture Test (Mode III)," ACI Materials Journal, V. 87, No. I, Jan-Feb. 1990, pp. 12-19.
20. Bazant, Z. P., and Kazemi, M. T., "Size Effect in Fracture of Ceramics and Its Use to Determine Fracture Energy and Effective Process Zone Length," Journal, American Ceramics Society, V. 73, No.7, 1990, pp. 1841-1853.
21. Bazant, Z. P., and Kazemi, M. T., "Determination of Fracture Energy, Process Zone Length and Brittleness Number from Size Effect, with Application to Rock and Concrete," International JournalofFracture, V. 44,1990, pp. 111-131.
22. Bazant, Z. P.; Gettu, R.; and Kazemi, \1. T., "Identification of Nonlinear Fracture Properties from Size Effect Tests and Structural Analysis Based on Geometry-Dependent R-Curves," Report No. 89-3/498p, Center for Advanced Cement-Based Materials, Northwestern University, Evanston, 1989. Also, International Journal of Rock Mechanics and Mining Sciences, in press.
23. Bazant, Z. P.; Lee, S.-G.; and Pfeiffer, P. A., "Size Effect Tests and Fracture Characteristics of Aluminum," Engineering Fracture Mechanics, V. 26, No. I, 1987, pp. 45-57.
24. Bazant, Z. P., "Fracture Energy of Heterogeneous Materials and Similitude," Preprints, SEM/RILEM Int ernational Conference on Fracture of Concrete and Rock (Houston, 1987), Society for Experimental Mechanics, Bethel. Also, Fracture of Concrete and Rock, Springer-Verlag, New York, 1989, pp. 229-241.
25. Tada, H.; Paris, P. c.; and Irwin, G. R., Stress Analysis of Cracks Handbook, 2nd Edition, Paris Productions, St. Louis, 1985.
26. Murakami, Y., Editor-in-Chief, Stress intensity Factors Handbook, Pergamon Press, New York, 1987.
27. Hillerborg, A., "Theoretical Basis of a Method to Determine the Fracture Energy GF of Concrete," Materials and Structures, Research and Testing (RILEM, Paris), V. 18, No. 106, July-Aug. 1985, pp. 291-296.
28. Carpinteri, A., "Notch Sensitivity in Fracture Testing of Aggregative Materials," Engineering Fracture Mechanics, V. 16, No.4, 1982, pp. 467-481.
29. Carpinteri, A., "Size Effect on Strength, Toughness, and Ductility," Journal of Engineering Mechanics, ASCE, V. 115, No.7, July 1989, pp. 1375-1392.
30. Irwin, G. R., Structural Mechanics, Pergamon Press, London, 1960. Also, Irwin, G. R., and Wells, A. A., "Continuum-Mechanics View of Crack Propagation," Metallurgical Review, V. 10, No. 38, 1965, pp. 223-270.
31. Hillerborg, A.; Modeer, M.; and Petersson, P.-E., "Analysis of Crack Formation and Crack Growth in Concrete by Means of Fracture Mechanics and Finite Elements," Cement and Concrete Research, V. 6, No.5, Sept. 1976, pp. 773-781.
32. Krafft, J. M.; Sullivan, A. M.; and Boyle, R. W., "Effect of Dimensions on Fast Fracture Instability of Notched Sheets," Proceedings, Crack Propagation Symposium, College of Aeronautics, Cranfield, 1961, pp. 8-26.
33. Heyer, R. H., "Crack Growth Resistance Curves (R-Curves)Literature Review," Fracture Toughness Evaluation of R Curve Methods, STP-527, ASTM, Philadelphia, 197 3, pp. 3-16.
34. Wecharatana, Methi, and Shah, Surendra P., "Predictions of Nonlinear Fracture Process Zone in Concrete," Journal of Engineering Mechanics, ASCE, V. 109, No.5, Oct. 1983, pp. 1231-1246.
35. Bazant, Zdenek P.; Kim, Jin-Keun; and Pfeiffer, Phillip A., "Nonlinear Fracture Properties from Size Effect Tests," Journal of Structural Engineering, ASCE, V. 112, No.2, Feb. 1986, pp. 289-307.
617

36. Jenq, Y. S., and Shah, S. P., "Fracture Toughness Criterion for Concrete," Engineering Fracture Mechanics, V. 21, No.5, 1985, pp. 1055-1069.
37. Sakai, M.; Yoshimura, J.-I.; Goto, Y.; and Inagaki, M., "RCurve Behavior of a Polycrystalline Graphite: Microcracking and Grain Bridging in the Wake Region," Journal, American Ceramic Society, V. 71, No.8, Aug. 1988, pp. 609-616.
38. Jenq, Y. S., and Shah, Surendra P., "Two Parameter Fracture Model for Concrete," Journal of Engineering Mechanics, ASCE, V. III, No. 10, Oct. 1985, pp. 1227-1241.
39. Bazant, Z. P., "Material Behavior under Various Types of Loading," Discussion, High Strength Concrete (Proceedings, Workshop in Chicago, 1979), National Science Foundation, Washington, D.C., pp. 79-92.
40. Bazant, Zdenek P., and Oh, B. H., "Crack Band Theory for Fracture of Concrete," Materials and Structures, Research and Testing (RILEM, Paris), V. 16, No. 93, May-June 1983, pp. 155-177.
41. De Larrard, Francois; Boulay, Claude; and Rossi, Pierre,
618
"Fracture Toughness of High-Strength Concretes," Utilization of High Strength Concrete (Proceedings, Symposium in Stavanger), TAPIR, Trondheim, 1987, pp. 215-223.
42. RILEM Committee 50-FMC, "Determination of the Fracture Energy of Mortar and Concrete by Means of Three-Point Bend Tests on Notched Beams," Materials and Structures, Research and Testing (RILEM, Paris), V. 18, No. 106, July-Aug. 1985, pp. 285-290.
43. Nakayama, J., "Direct Measurement of Fracture Energies of Brittle Heterogeneous Materials," Journal, American Ceramic Society, V. 48, No. II, Nov. 1965, pp. 583-587.
44. Tattersall, H. G., and Tappin, G., "Work of Fracture and Its Measurement in Metals, Ceramics and Other Materials," Journal of Materials Science (London), V. I, 1966, pp. 296-301.
45. Hillerborg, A., "Existing Methods to Determine and Evaluate Fracture Toughness of Aggregative Materials-RILEM Recommendation on Concrete," Proceedings, International Workshop on Fracture Toughness and Fracture Energy-Test Methods for Concrete and Rock (Sendai, Oct. 1988), A. A. Balkema, Rotterdam.
ACI Materials Journal I November-December 1990