fpso full ship analysis - an overview
TRANSCRIPT
Fan (Joe) Zhang, Sesam BD Manager, DNV Software
October 15, 2012
FPSO Full Ship Analysis
Integrated Strength and Hydrodynamic Analysis using Sesam
© Det Norske Veritas AS. All rights reserved.
FPSO Full Ship Analysis
October 15, 2012
Topics
Strength assessment of FPSOs and related software from DNV
Global modelling
Hydrodynamic analysis
Ultimate strength analysis
Submodelling
Fatigue analysis
2
© Det Norske Veritas AS. All rights reserved.
FPSO Full Ship Analysis
October 15, 2012
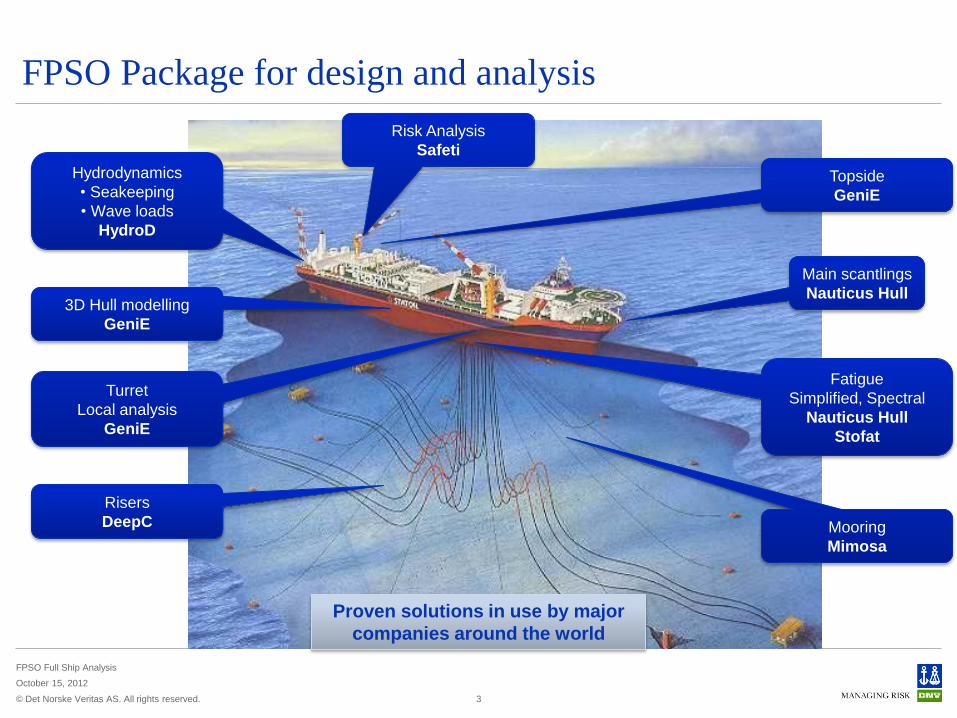
FPSO Package for design and analysis
3
Proven solutions in use by major
companies around the world
Topside
GeniE
Main scantlings
Nauticus Hull
Risers
DeepC
Turret
Local analysis
GeniE
Hydrodynamics
• Seakeeping
• Wave loads
HydroD
Fatigue
Simplified, Spectral
Nauticus Hull
Stofat
Mooring
Mimosa
3D Hull modelling
GeniE
Risk Analysis
Safeti
© Det Norske Veritas AS. All rights reserved.
FPSO Full Ship Analysis
October 15, 2012
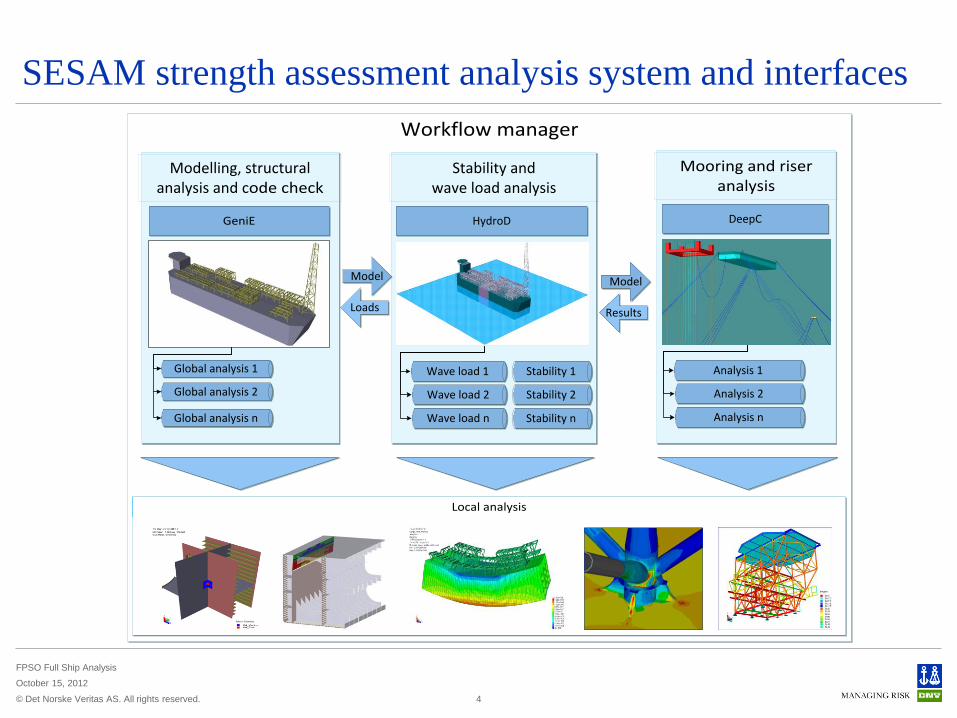
SESAM strength assessment analysis system and interfaces
4
Workflow manager
Modelling, structural analysis and code check
Stability andwave load analysis
Mooring and riser analysis
Local analysis
GeniE HydroD DeepC
Global analysis 1
Global analysis 2
Wave load 1
Wave load 2
Wave load nGlobal analysis n
Analysis 1
Analysis 2
Analysis n
Stability 1
Stability 2
Stability n
Model
Loads
Model
Results

© Det Norske Veritas AS. All rights reserved.
FPSO Full Ship Analysis
October 15, 2012
Sesam – a fully integrated analysis system
5
FE analysis
4. Global stress and deflection
& fatigue screening
1. Stability and wave load analysis
Wave scatter diagram
2. Pressure loads and accelerations
Lo
ad
tran
sfe
r
3. Structural model loads (internal + external pressure)
Local FE analysis
5. Local stress and deflection
& fatigue
© Det Norske Veritas AS. All rights reserved.
FPSO Full Ship Analysis
October 15, 2012
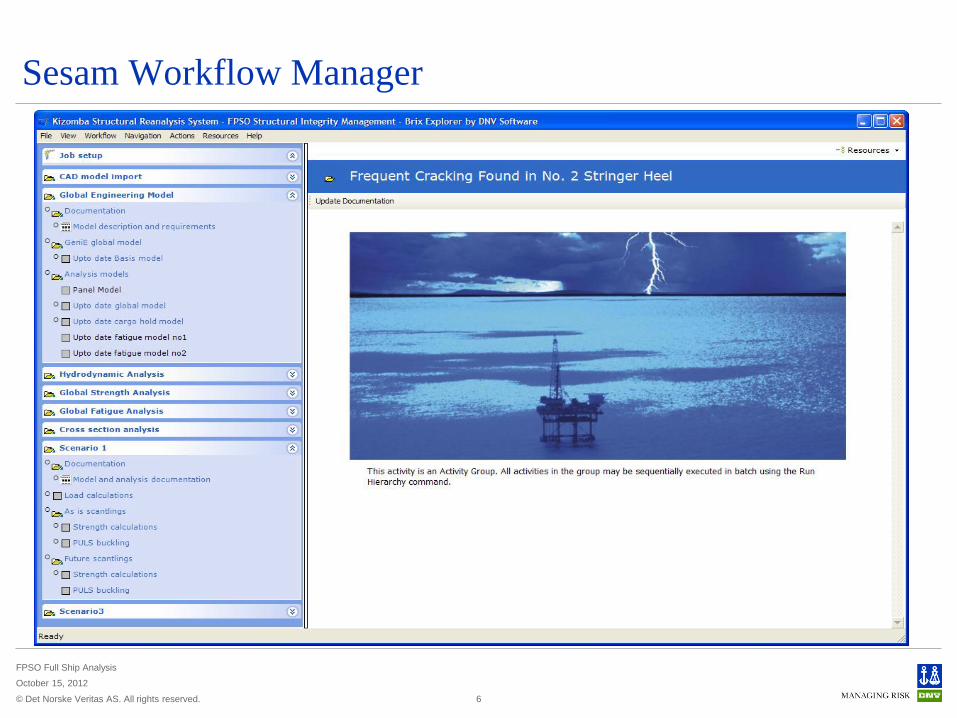
Sesam Workflow Manager
Key features
- Model and file management
Benefits
- Automatic re-run of analysis hierarchy to re-produce
analysis after model updates
- Facilitate alternate engineers to re-run analysis
- Documentation/description of models and analysis
can be linked into the explorer
- Supports best engineering practice and workflow
6
© Det Norske Veritas AS. All rights reserved.
FPSO Full Ship Analysis
October 15, 2012
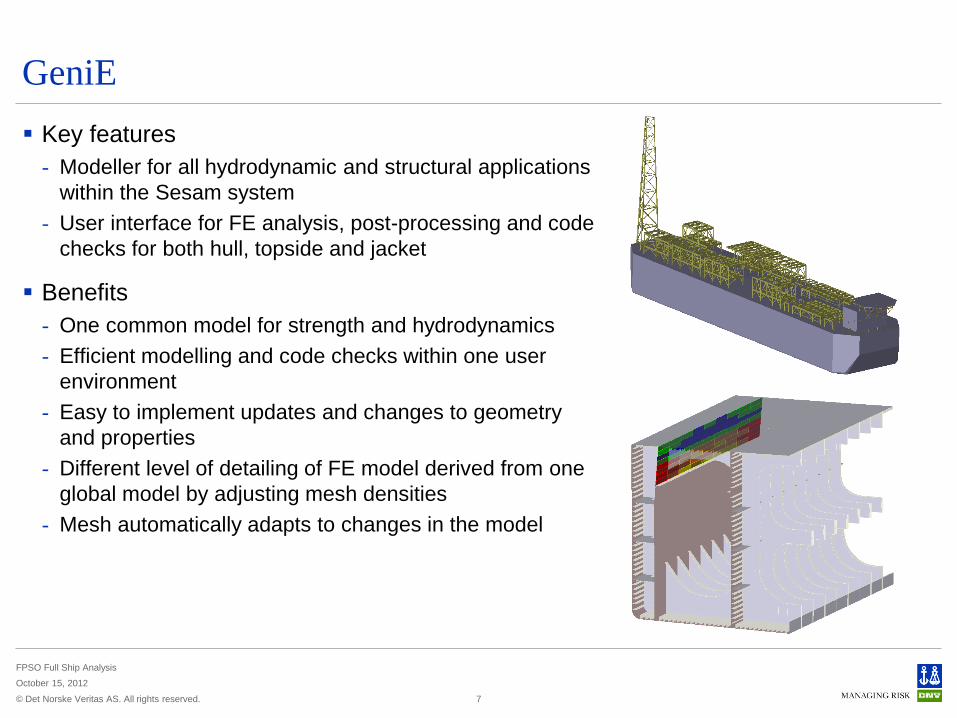
GeniE
Key features
- Modeller for all hydrodynamic and structural applications
within the Sesam system
- User interface for FE analysis, post-processing and code
checks for both hull, topside and jacket
Benefits
- One common model for strength and hydrodynamics
- Efficient modelling and code checks within one user
environment
- Easy to implement updates and changes to geometry
and properties
- Different level of detailing of FE model derived from one
global model by adjusting mesh densities
- Mesh automatically adapts to changes in the model
7

© Det Norske Veritas AS. All rights reserved.
FPSO Full Ship Analysis
October 15, 2012
HydroD
Key features
- Hydrostatics and stability calculations
- Linear and non linear hydrodynamics
Benefits
- Handling of multiple loading conditions and models through one user interface and
database
- Sharing models with structural analysis
- Direct transfer of static and dynamic loads to structural model
8

© Det Norske Veritas AS. All rights reserved.
FPSO Full Ship Analysis
October 15, 2012
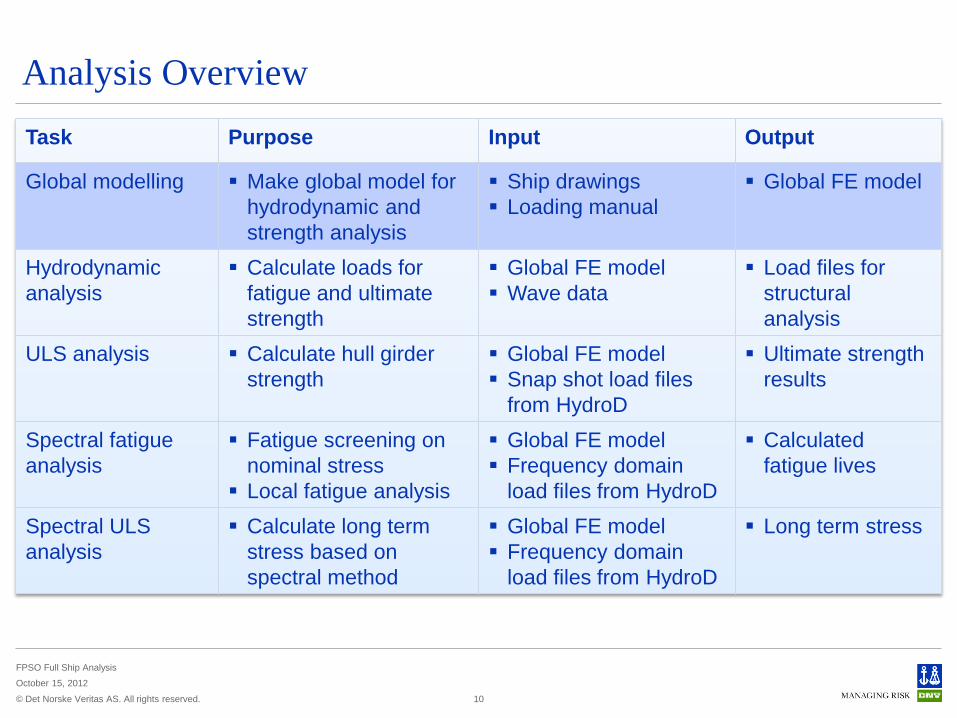
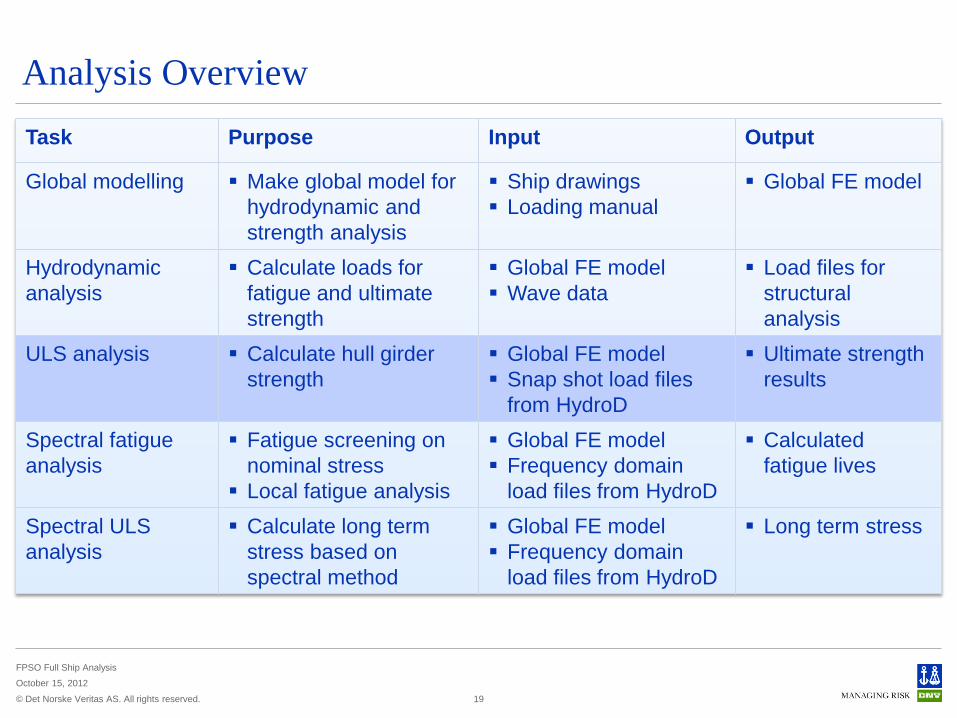
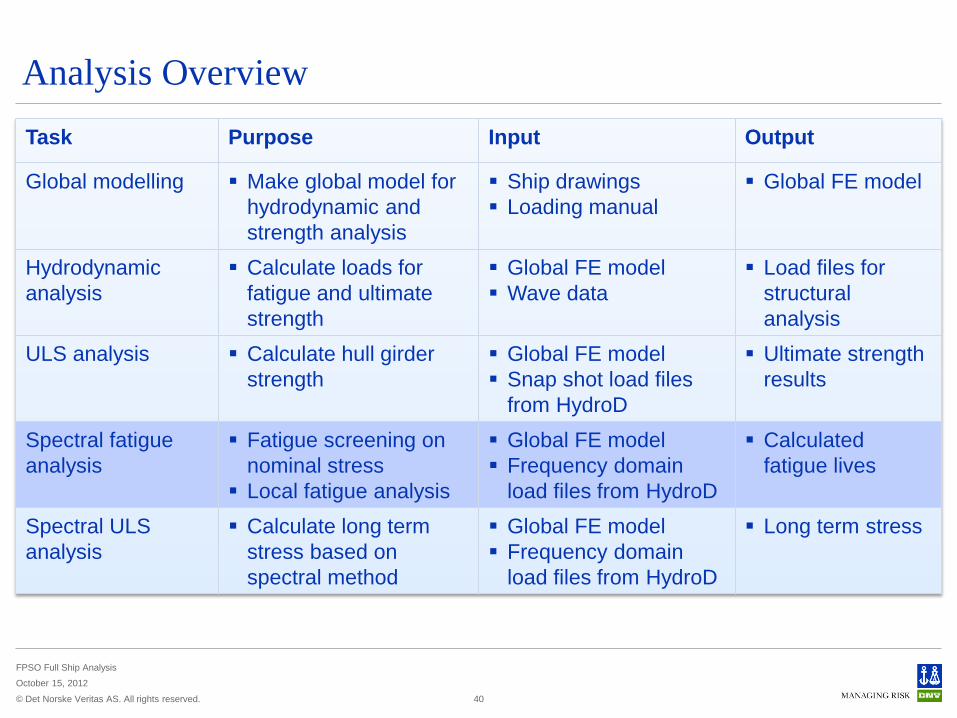
Analysis Overview
Task Purpose Input Output
Global modelling Make global model for
hydrodynamic and
strength analysis
Ship drawings
Loading manual
Global FE model
Hydrodynamic
analysis
Calculate loads for
fatigue and ultimate
strength
Global FE model
Wave data
Load files for
structural
analysis
ULS analysis Calculate hull girder
strength
Global FE model
Snap shot load files
from HydroD
Ultimate strength
results
Spectral fatigue
analysis
Fatigue screening on
nominal stress
Local fatigue analysis
Global FE model
Frequency domain
load files from HydroD
Calculated
fatigue lives
Spectral ULS
analysis
Calculate long term
stress based on
spectral method
Global FE model
Frequency domain
load files from HydroD
Long term stress
9
© Det Norske Veritas AS. All rights reserved.
FPSO Full Ship Analysis
October 15, 2012
Analysis Overview
Task Purpose Input Output
Global modelling Make global model for
hydrodynamic and
strength analysis
Ship drawings
Loading manual
Global FE model
Hydrodynamic
analysis
Calculate loads for
fatigue and ultimate
strength
Global FE model
Wave data
Load files for
structural
analysis
ULS analysis Calculate hull girder
strength
Global FE model
Snap shot load files
from HydroD
Ultimate strength
results
Spectral fatigue
analysis
Fatigue screening on
nominal stress
Local fatigue analysis
Global FE model
Frequency domain
load files from HydroD
Calculated
fatigue lives
Spectral ULS
analysis
Calculate long term
stress based on
spectral method
Global FE model
Frequency domain
load files from HydroD
Long term stress
10
© Det Norske Veritas AS. All rights reserved.
FPSO Full Ship Analysis
October 15, 2012
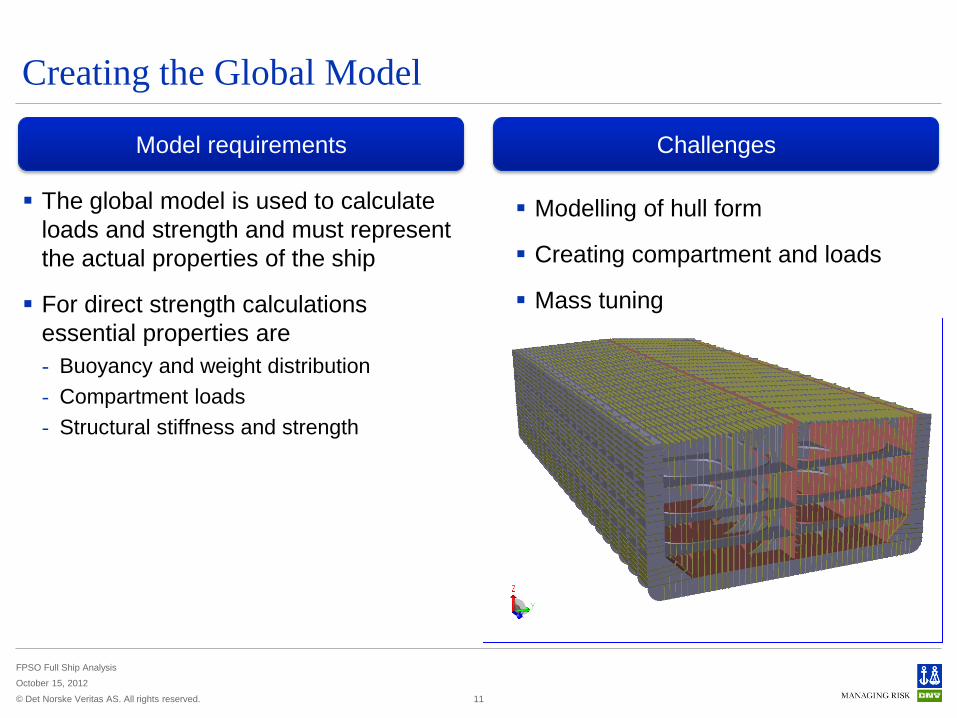
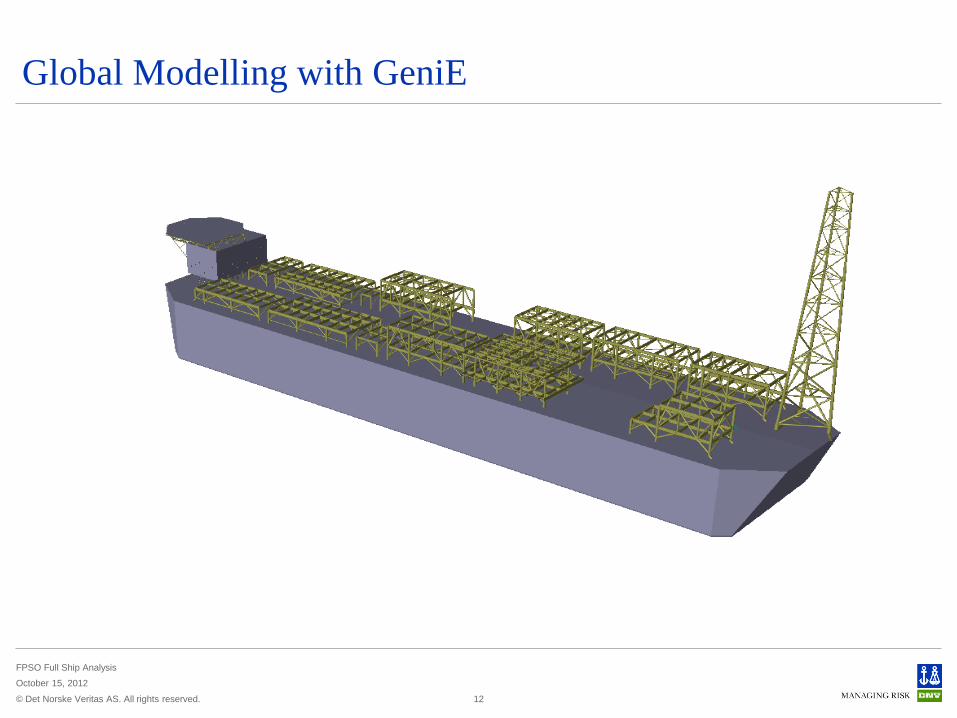
Creating the Global Model
The global model is used to calculate
loads and strength and must represent
the actual properties of the ship
For direct strength calculations
essential properties are
- Buoyancy and weight distribution
- Compartment loads
- Structural stiffness and strength
Modelling of hull form
Creating compartment and loads
Mass tuning
11
Challenges Model requirements
© Det Norske Veritas AS. All rights reserved.
FPSO Full Ship Analysis
October 15, 2012
Global Modelling with GeniE
12
© Det Norske Veritas AS. All rights reserved.
FPSO Full Ship Analysis
October 15, 2012
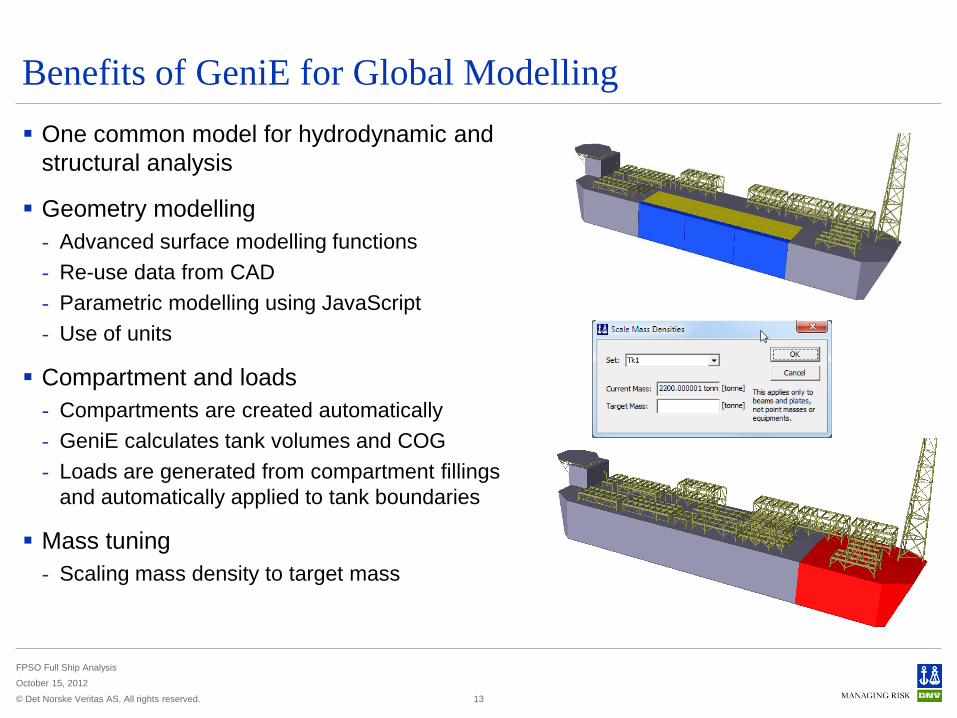
Benefits of GeniE for Global Modelling
One common model for hydrodynamic and
structural analysis
Geometry modelling
- Advanced surface modelling functions
- Re-use data from CAD
- Parametric modelling using JavaScript
- Use of units
Compartment and loads
- Compartments are created automatically
- GeniE calculates tank volumes and COG
- Loads are generated from compartment fillings
and automatically applied to tank boundaries
Mass tuning
- Scaling mass density to target mass
13

© Det Norske Veritas AS. All rights reserved.
FPSO Full Ship Analysis
October 15, 2012
Analysis Overview
Task Purpose Input Output
Global modelling Make global model for
hydrodynamic and
strength analysis
Ship drawings
Loading manual
Global FE model
Hydrodynamic
analysis
Calculate loads for
fatigue and ultimate
strength
Global FE model
Wave data
Load files for
structural
analysis
ULS analysis Calculate hull girder
strength
Global FE model
Snap shot load files
from HydroD
Ultimate strength
results
Spectral fatigue
analysis
Fatigue screening on
nominal stress
Local fatigue analysis
Global FE model
Frequency domain
load files from HydroD
Calculated
fatigue lives
Spectral ULS
analysis
Calculate long term
stress based on
spectral method
Global FE model
Frequency domain
load files from HydroD
Long term stress
14
© Det Norske Veritas AS. All rights reserved.
FPSO Full Ship Analysis
October 15, 2012
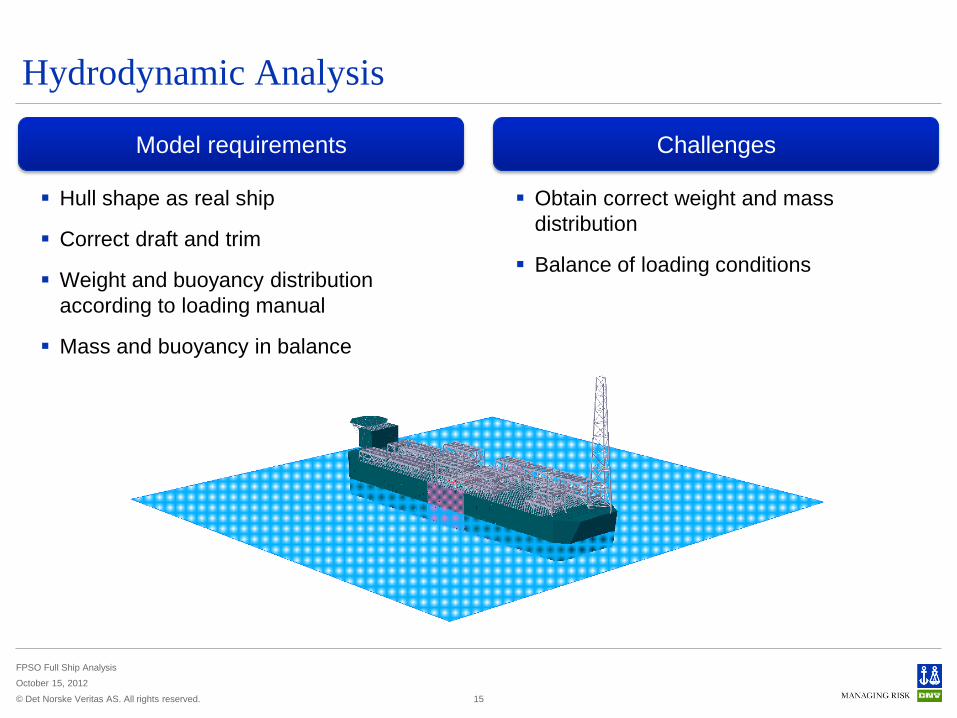
Hydrodynamic Analysis
Hull shape as real ship
Correct draft and trim
Weight and buoyancy distribution
according to loading manual
Mass and buoyancy in balance
Obtain correct weight and mass
distribution
Balance of loading conditions
15
Challenges Model requirements
© Det Norske Veritas AS. All rights reserved.
FPSO Full Ship Analysis
October 15, 2012
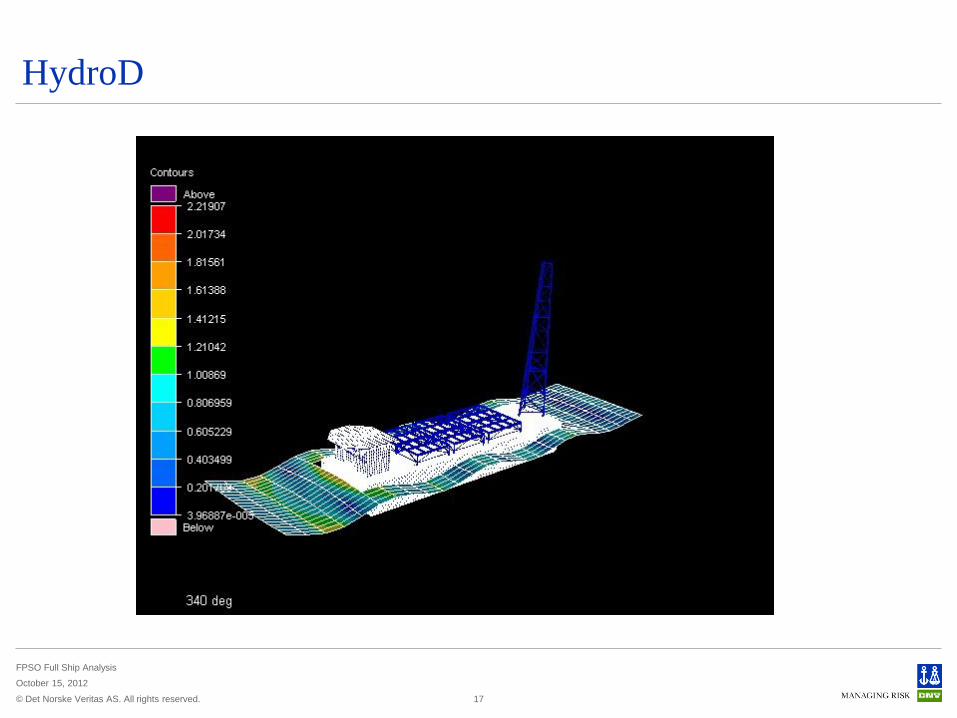
HydroD
17
© Det Norske Veritas AS. All rights reserved.
FPSO Full Ship Analysis
October 15, 2012
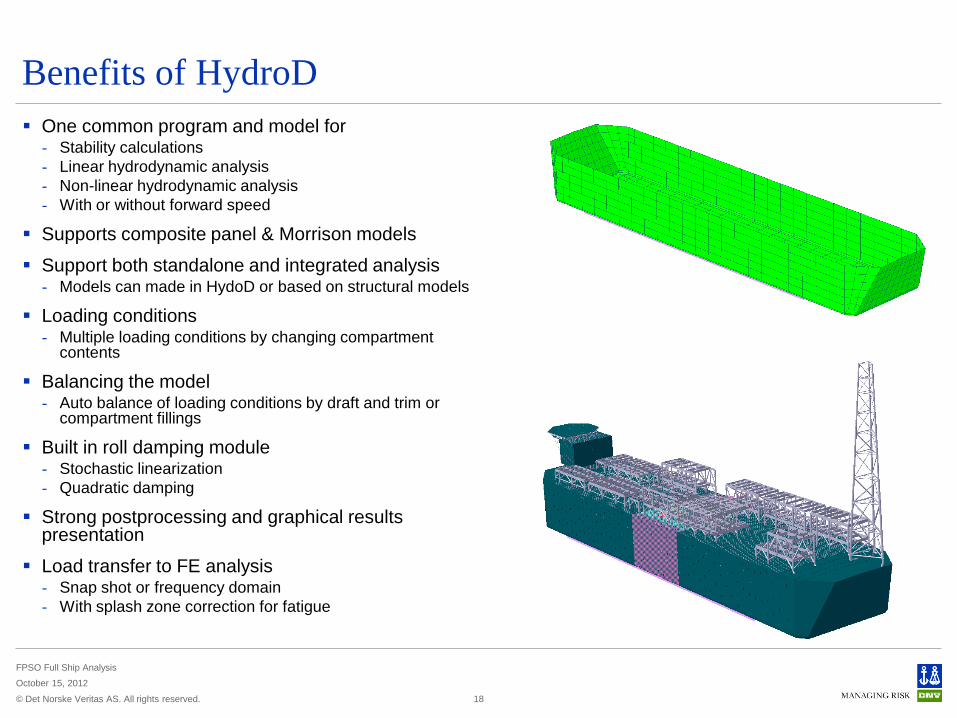
Benefits of HydroD
One common program and model for - Stability calculations
- Linear hydrodynamic analysis
- Non-linear hydrodynamic analysis
- With or without forward speed
Supports composite panel & Morrison models
Support both standalone and integrated analysis - Models can made in HydoD or based on structural models
Loading conditions - Multiple loading conditions by changing compartment
contents
Balancing the model - Auto balance of loading conditions by draft and trim or
compartment fillings
Built in roll damping module - Stochastic linearization
- Quadratic damping
Strong postprocessing and graphical results presentation
Load transfer to FE analysis - Snap shot or frequency domain
- With splash zone correction for fatigue
18
© Det Norske Veritas AS. All rights reserved.
FPSO Full Ship Analysis
October 15, 2012
Analysis Overview
Task Purpose Input Output
Global modelling Make global model for
hydrodynamic and
strength analysis
Ship drawings
Loading manual
Global FE model
Hydrodynamic
analysis
Calculate loads for
fatigue and ultimate
strength
Global FE model
Wave data
Load files for
structural
analysis
ULS analysis Calculate hull girder
strength
Global FE model
Snap shot load files
from HydroD
Ultimate strength
results
Spectral fatigue
analysis
Fatigue screening on
nominal stress
Local fatigue analysis
Global FE model
Frequency domain
load files from HydroD
Calculated
fatigue lives
Spectral ULS
analysis
Calculate long term
stress based on
spectral method
Global FE model
Frequency domain
load files from HydroD
Long term stress
19
© Det Norske Veritas AS. All rights reserved.
FPSO Full Ship Analysis
October 15, 2012
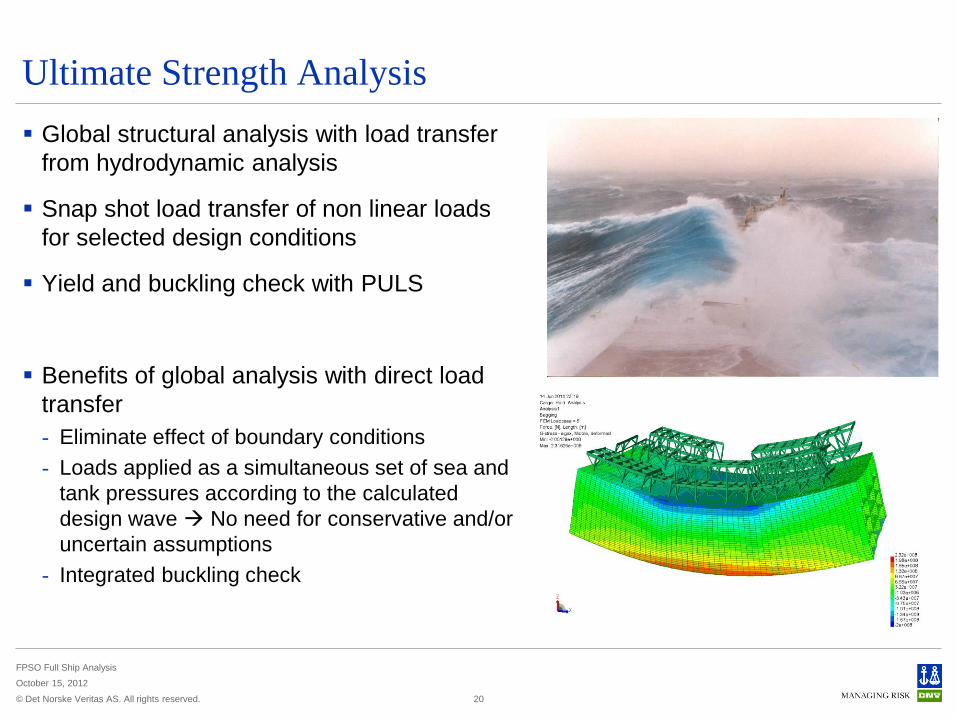
Ultimate Strength Analysis
Global structural analysis with load transfer
from hydrodynamic analysis
Snap shot load transfer of non linear loads
for selected design conditions
Yield and buckling check with PULS
Benefits of global analysis with direct load
transfer
- Eliminate effect of boundary conditions
- Loads applied as a simultaneous set of sea and
tank pressures according to the calculated
design wave No need for conservative and/or
uncertain assumptions
- Integrated buckling check
20
© Det Norske Veritas AS. All rights reserved.
FPSO Full Ship Analysis
October 15, 2012
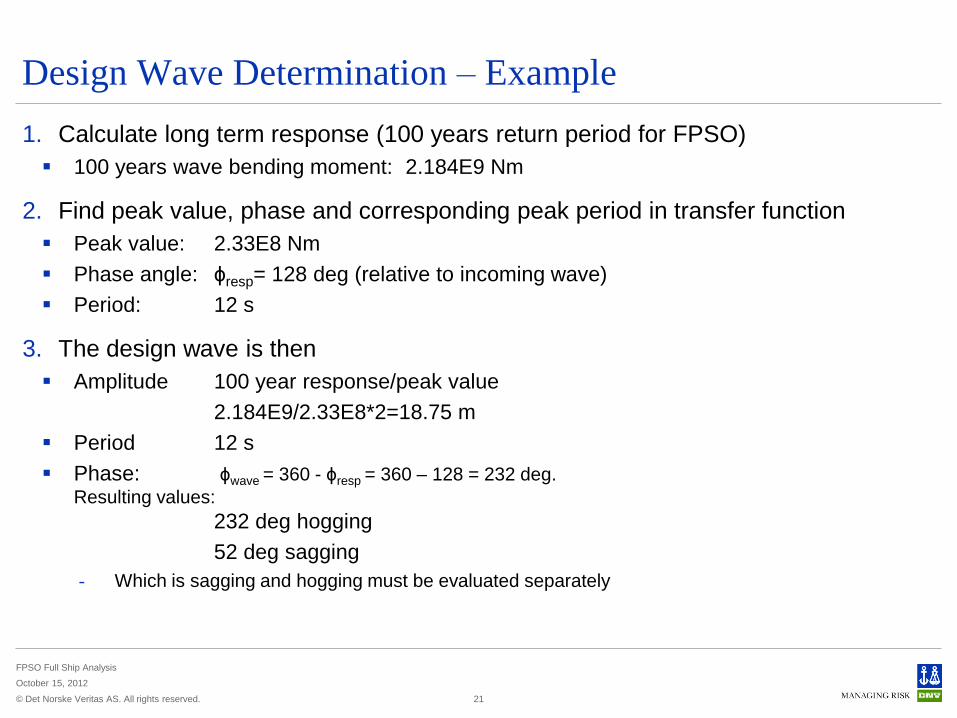
Design Wave Determination – Example
1. Calculate long term response (100 years return period for FPSO)
100 years wave bending moment: 2.184E9 Nm
2. Find peak value, phase and corresponding peak period in transfer function
Peak value: 2.33E8 Nm
Phase angle: ϕresp= 128 deg (relative to incoming wave)
Period: 12 s
3. The design wave is then
Amplitude 100 year response/peak value
2.184E9/2.33E8*2=18.75 m
Period 12 s
Phase: ϕwave = 360 - ϕresp = 360 – 128 = 232 deg.
Resulting values:
232 deg hogging
52 deg sagging
- Which is sagging and hogging must be evaluated separately
21
© Det Norske Veritas AS. All rights reserved.
FPSO Full Ship Analysis
October 15, 2012
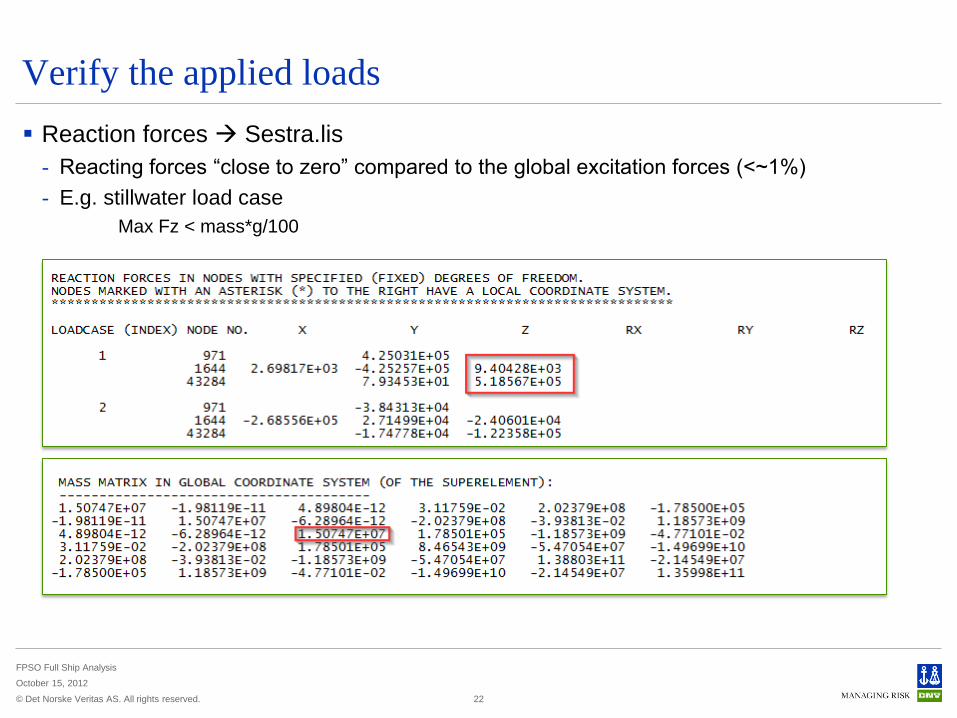
Verify the applied loads
Reaction forces Sestra.lis
- Reacting forces “close to zero” compared to the global excitation forces (<~1%)
- E.g. stillwater load case
Max Fz < mass*g/100
22
© Det Norske Veritas AS. All rights reserved.
FPSO Full Ship Analysis
October 15, 2012
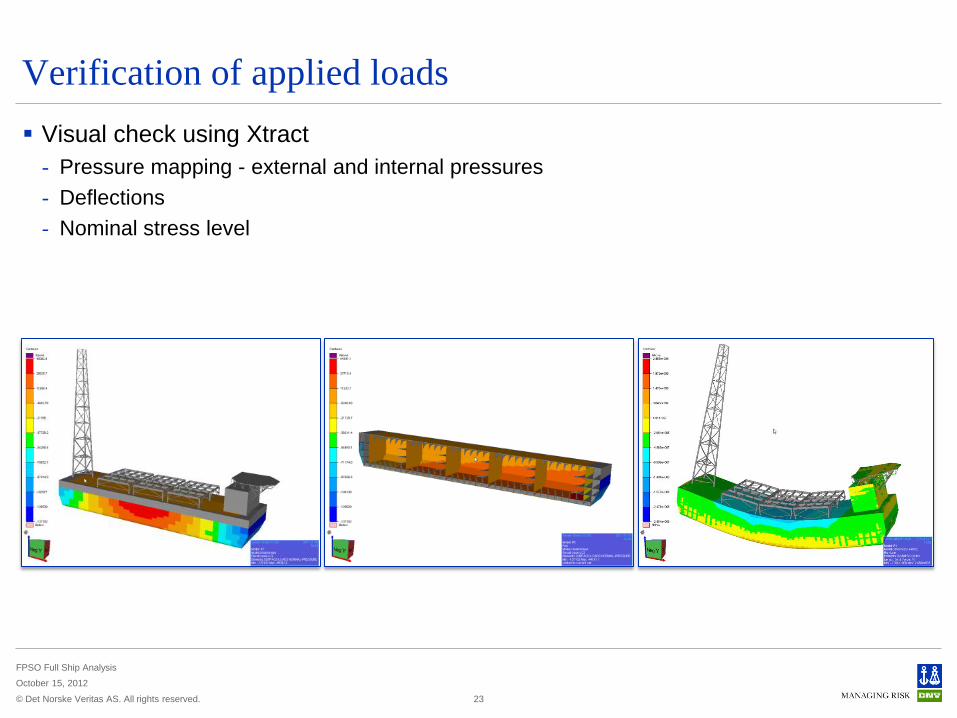
Verification of applied loads
Visual check using Xtract
- Pressure mapping - external and internal pressures
- Deflections
- Nominal stress level
23

© Det Norske Veritas AS. All rights reserved.
FPSO Full Ship Analysis
October 15, 2012
Verification of applied loads
Global sectional loads Cutres
- Cutres calculates and integrates the force distribution of cross sections and is ideal to
evaluate the hull girder shear forces and bending moments
- Large deviations Improper load balance
- Small deviations will occur since HydroD only consider vertical loads (mass) from internal tank
pressures
- NB! Check position of neutral axis in HydroD sections and Cutres results
24
0 50 100 150 200 250 300 350
Distance from AP
Vert
ica
l sh
ea
r fo
rce
WASIM
CUTRES
Vertical shear force distribution
0 50 100 150 200 250 300 350
Distance from AP
Vert
ical
be
nd
ing
mo
men
t
WASIM
CUTRES
Vertical bending moment distribution
© Det Norske Veritas AS. All rights reserved.
FPSO Full Ship Analysis
October 15, 2012
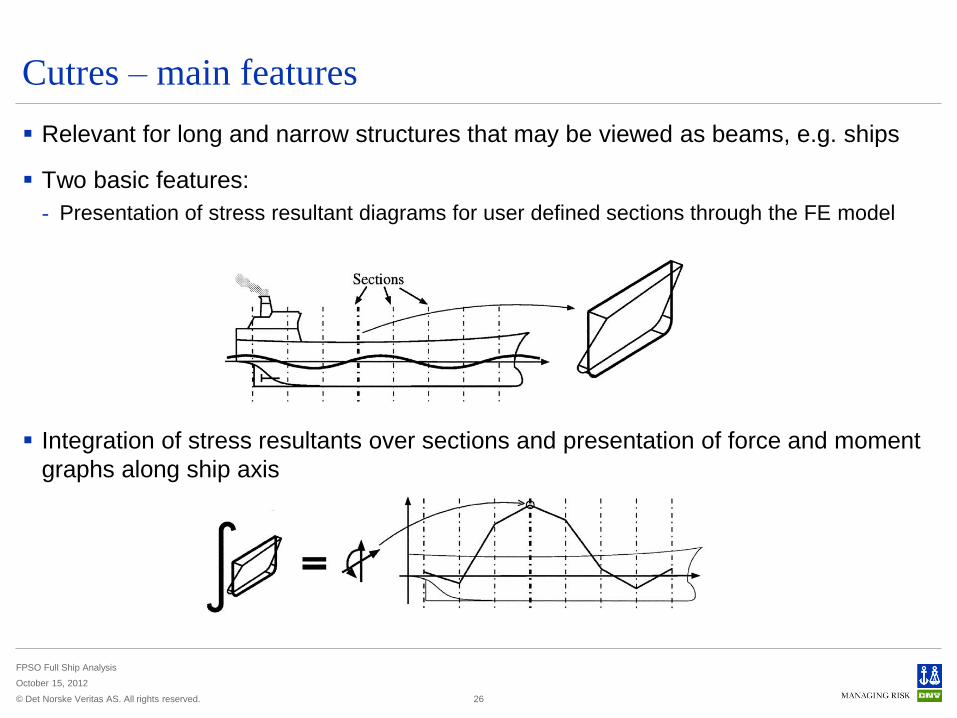
Cutres – main features
Relevant for long and narrow structures that may be viewed as beams, e.g. ships
Two basic features:
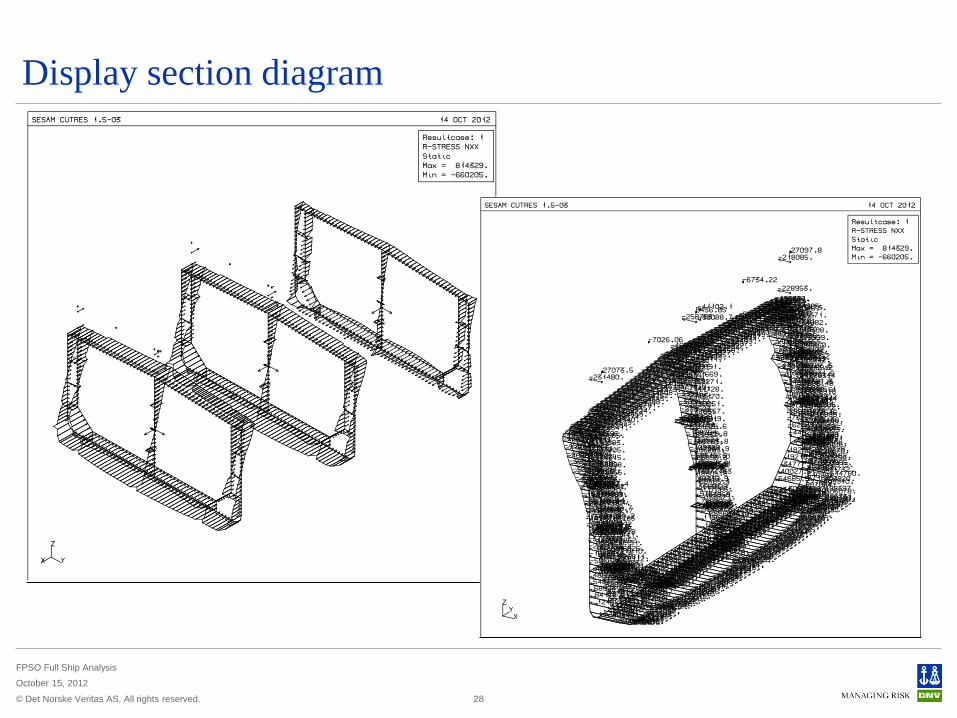
- Presentation of stress resultant diagrams for user defined sections through the FE model
Integration of stress resultants over sections and presentation of force and moment
graphs along ship axis
26
© Det Norske Veritas AS. All rights reserved.
FPSO Full Ship Analysis
October 15, 2012
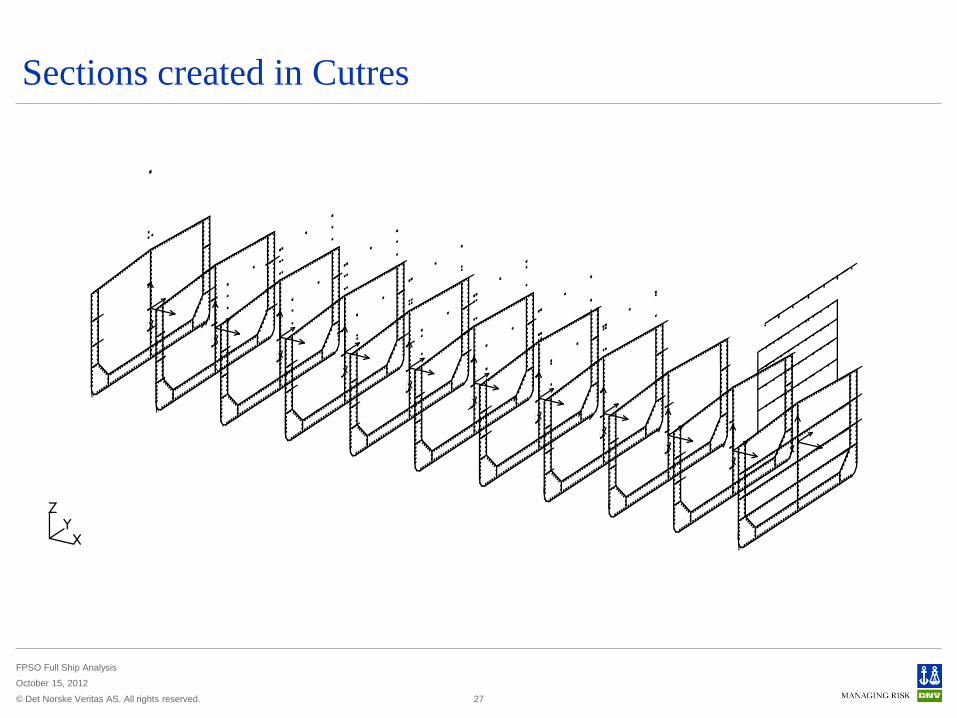
Sections created in Cutres
27
© Det Norske Veritas AS. All rights reserved.
FPSO Full Ship Analysis
October 15, 2012
Display section diagram
28
© Det Norske Veritas AS. All rights reserved.
FPSO Full Ship Analysis
October 15, 2012
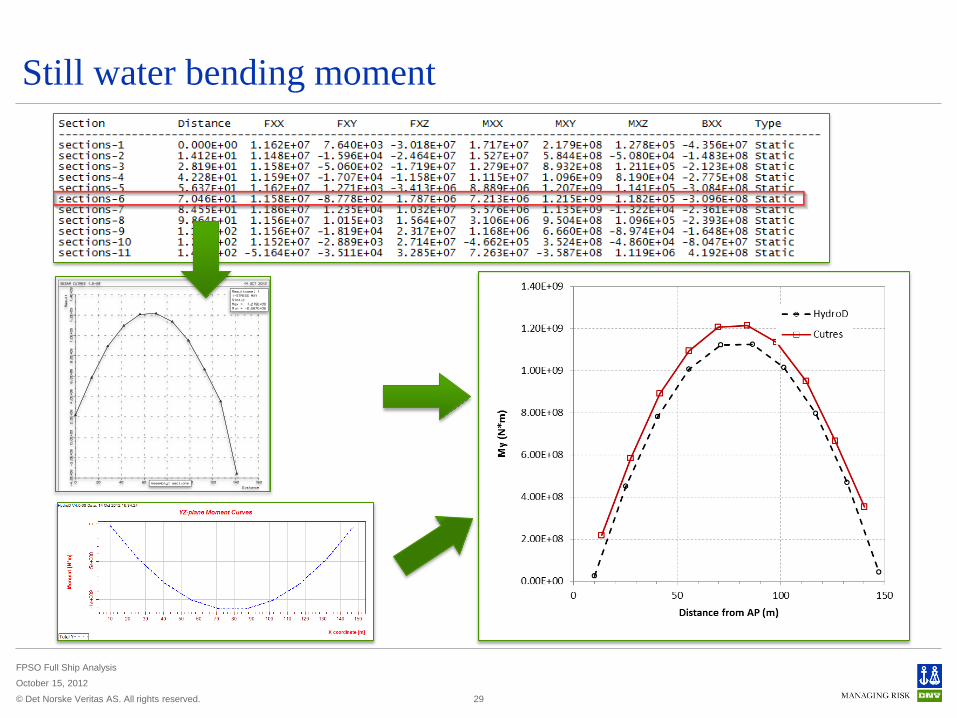
Still water bending moment
29

© Det Norske Veritas AS. All rights reserved.
FPSO Full Ship Analysis
October 15, 2012
Vertical shear force and bending moment
30
Postresp: 2.33E8 * 9.375 = 2.18E9
Cutres: 2.207E9
© Det Norske Veritas AS. All rights reserved.
FPSO Full Ship Analysis
October 15, 2012
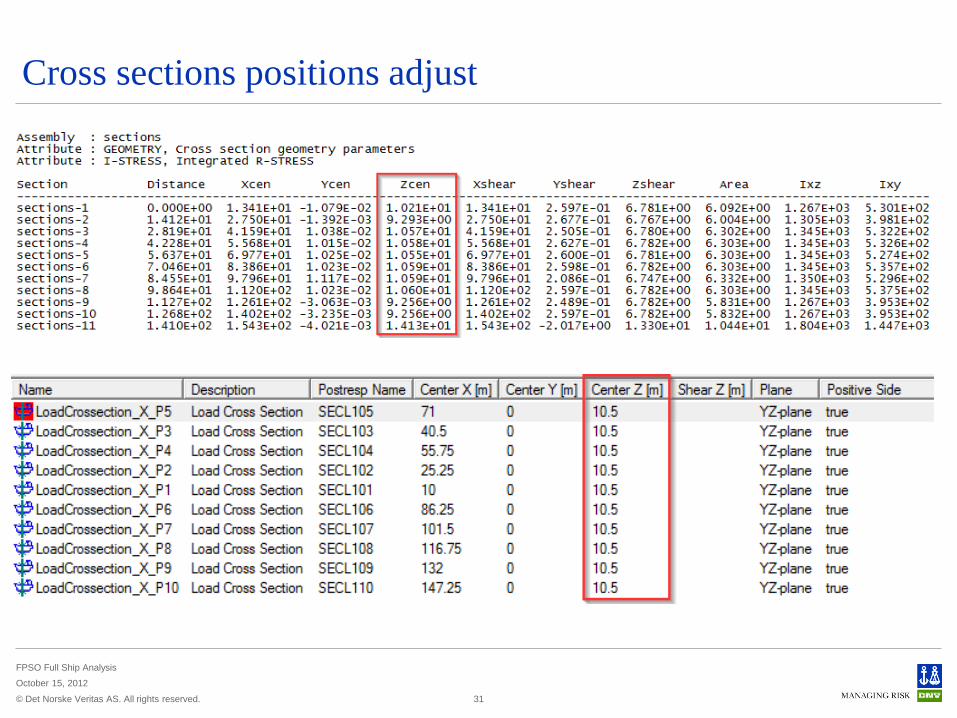
Cross sections positions adjust
31

© Det Norske Veritas AS. All rights reserved.
FPSO Full Ship Analysis
October 15, 2012
PULS – Advanced Buckling & Panel Ultimate Limit State
32
PULS is a code for buckling
and ULS assessments
of stiffened and unstiffened
panels
© Det Norske Veritas AS. All rights reserved.
FPSO Full Ship Analysis
October 15, 2012
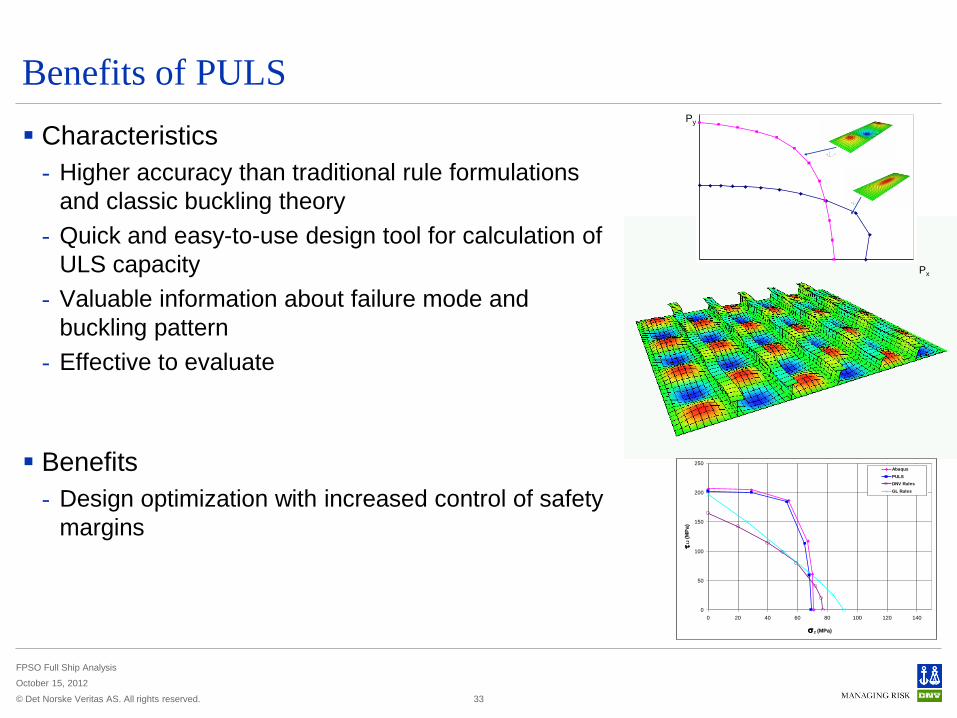
Benefits of PULS
Characteristics
- Higher accuracy than traditional rule formulations
and classic buckling theory
- Quick and easy-to-use design tool for calculation of
ULS capacity
- Valuable information about failure mode and
buckling pattern
- Effective to evaluate
Benefits
- Design optimization with increased control of safety
margins
33
0
50
100
150
200
250
0 20 40 60 80 100 120 140
s2 (MPa)
t12 (
MP
a)
Abaqus
PULS
DNV Rules
GL Rules
Py
Px
© Det Norske Veritas AS. All rights reserved.
FPSO Full Ship Analysis
October 15, 2012
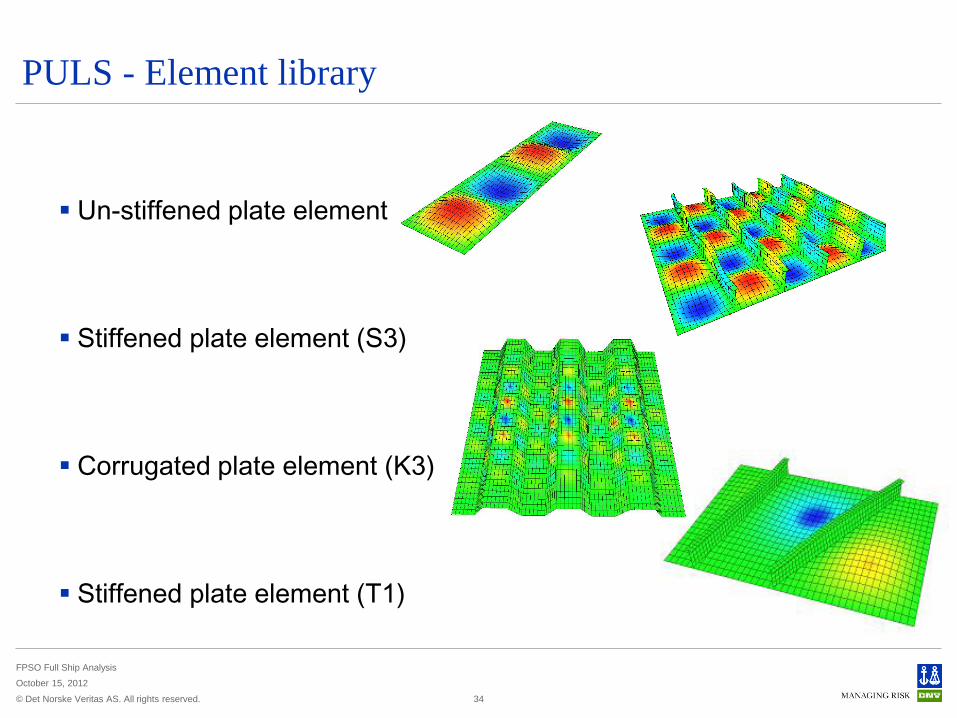
PULS - Element library
34
Un-stiffened plate element
Stiffened plate element (S3)
Corrugated plate element (K3)
Stiffened plate element (T1)
© Det Norske Veritas AS. All rights reserved.
FPSO Full Ship Analysis
October 15, 2012
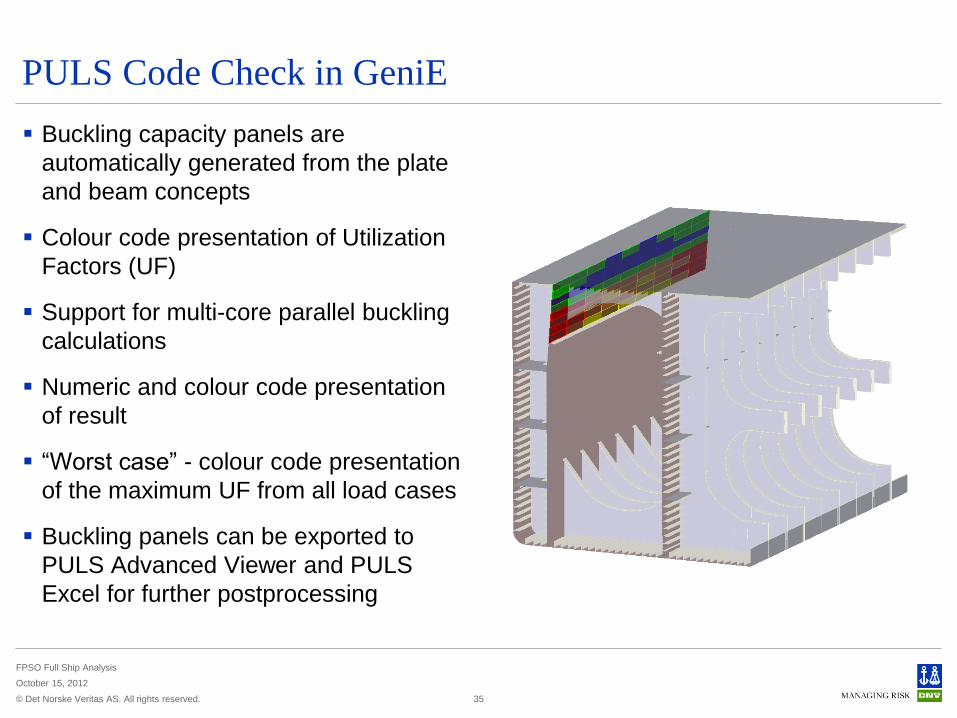
PULS Code Check in GeniE
Buckling capacity panels are
automatically generated from the plate
and beam concepts
Colour code presentation of Utilization
Factors (UF)
Support for multi-core parallel buckling
calculations
Numeric and colour code presentation
of result
“Worst case” - colour code presentation
of the maximum UF from all load cases
Buckling panels can be exported to
PULS Advanced Viewer and PULS
Excel for further postprocessing
35
© Det Norske Veritas AS. All rights reserved.
FPSO Full Ship Analysis
October 15, 2012
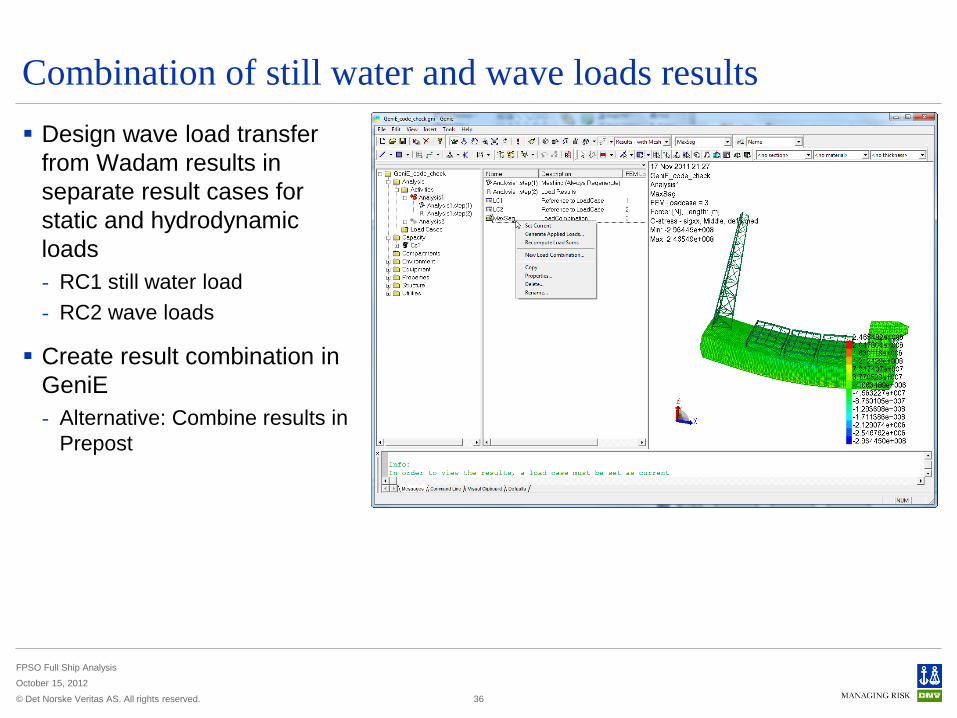
Combination of still water and wave loads results
Design wave load transfer
from Wadam results in
separate result cases for
static and hydrodynamic
loads
- RC1 still water load
- RC2 wave loads
Create result combination in
GeniE
- Alternative: Combine results in
Prepost
36
© Det Norske Veritas AS. All rights reserved.
FPSO Full Ship Analysis
October 15, 2012
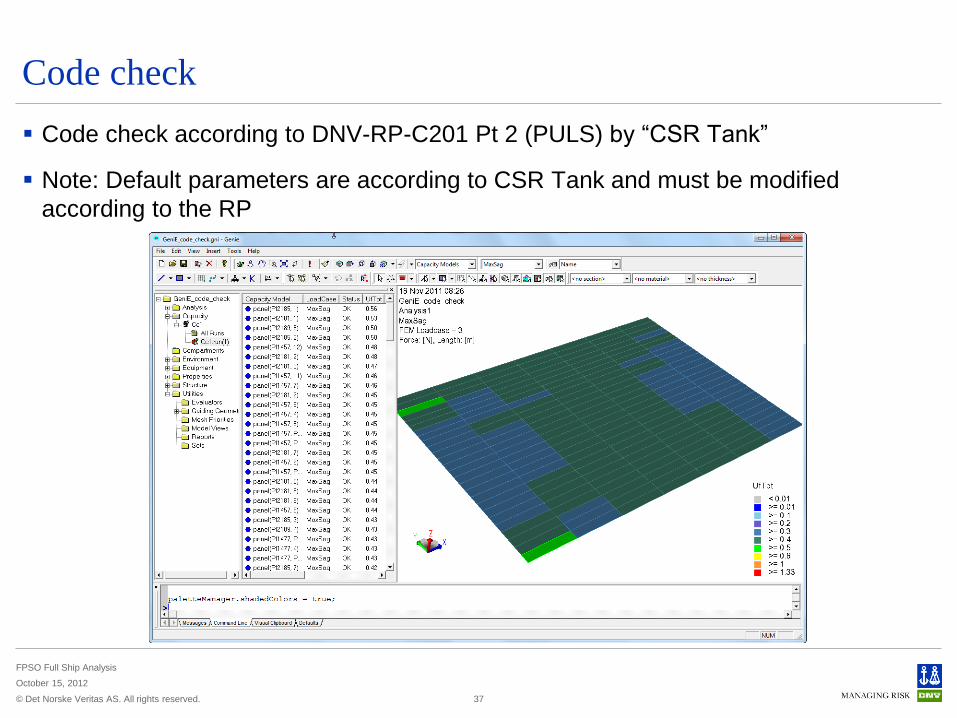
Code check
Code check according to DNV-RP-C201 Pt 2 (PULS) by “CSR Tank”
Note: Default parameters are according to CSR Tank and must be modified
according to the RP
37

© Det Norske Veritas AS. All rights reserved.
FPSO Full Ship Analysis
October 15, 2012
Modified CSR Tank PULS code check
FPSO ULS 3 hold or global model
- Design wave approach with direct load transfer from HydroD
or
Maximum hogging and Maximum sagging condition (according to DNV-RP-C102, App D).
- Check only longitudinal structure
- Method 1 (Ultimate Capacity), according to DNV-RP-C201 Pt 2 (PULS)
- Stiffened panel type
- Allowable usage factor = 0.8 (loadcase design condition must be harbour or seagoing)
- Meshing rules: Gross scantlings, (don’t use co-centric stiffeners).
38

© Det Norske Veritas AS. All rights reserved.
FPSO Full Ship Analysis
October 15, 2012
Code check result
39
© Det Norske Veritas AS. All rights reserved.
FPSO Full Ship Analysis
October 15, 2012
Analysis Overview
Task Purpose Input Output
Global modelling Make global model for
hydrodynamic and
strength analysis
Ship drawings
Loading manual
Global FE model
Hydrodynamic
analysis
Calculate loads for
fatigue and ultimate
strength
Global FE model
Wave data
Load files for
structural
analysis
ULS analysis Calculate hull girder
strength
Global FE model
Snap shot load files
from HydroD
Ultimate strength
results
Spectral fatigue
analysis
Fatigue screening on
nominal stress
Local fatigue analysis
Global FE model
Frequency domain
load files from HydroD
Calculated
fatigue lives
Spectral ULS
analysis
Calculate long term
stress based on
spectral method
Global FE model
Frequency domain
load files from HydroD
Long term stress
40
© Det Norske Veritas AS. All rights reserved.
FPSO Full Ship Analysis
October 15, 2012
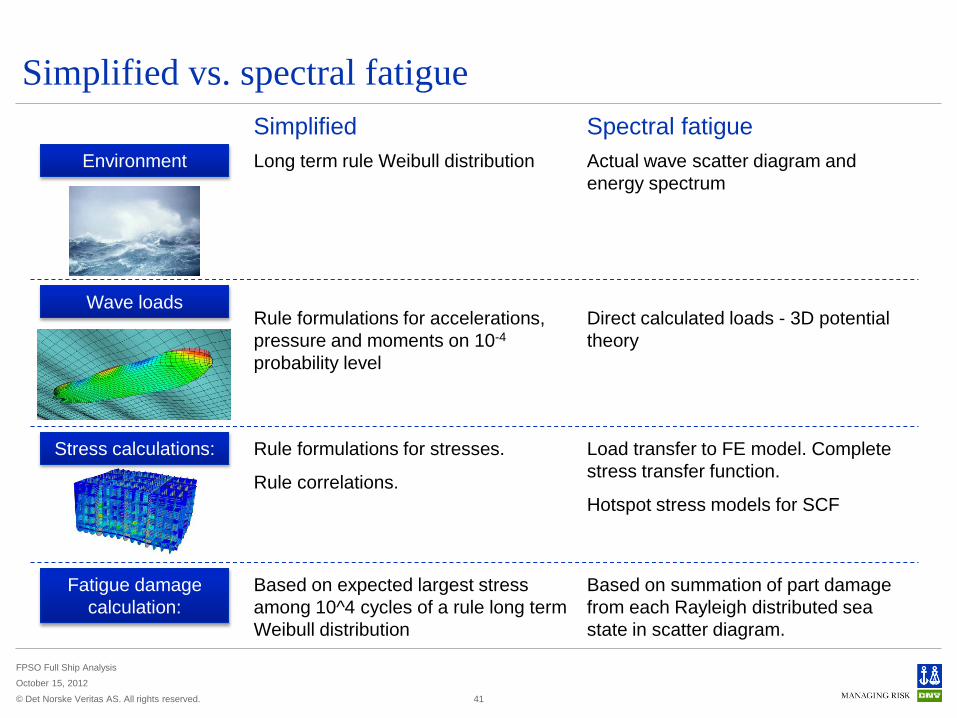
Simplified vs. spectral fatigue
41
Wave loads
Stress calculations:
Environment Long term rule Weibull distribution
Direct calculated loads - 3D potential
theory
Fatigue damage
calculation:
Actual wave scatter diagram and
energy spectrum
Rule formulations for accelerations,
pressure and moments on 10-4
probability level
Load transfer to FE model. Complete
stress transfer function.
Hotspot stress models for SCF
Rule formulations for stresses.
Rule correlations.
Based on expected largest stress
among 10^4 cycles of a rule long term
Weibull distribution
Based on summation of part damage
from each Rayleigh distributed sea
state in scatter diagram.
Simplified Spectral fatigue
© Det Norske Veritas AS. All rights reserved.
FPSO Full Ship Analysis
October 15, 2012
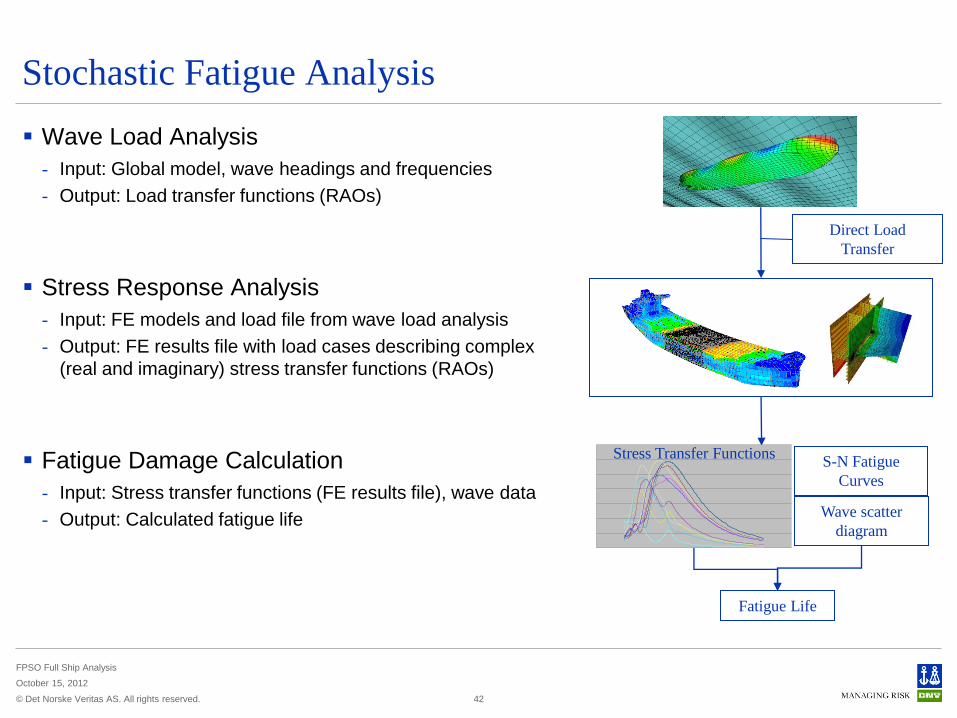
Stochastic Fatigue Analysis
Wave Load Analysis - Input: Global model, wave headings and frequencies
- Output: Load transfer functions (RAOs)
Stress Response Analysis - Input: FE models and load file from wave load analysis
- Output: FE results file with load cases describing complex
(real and imaginary) stress transfer functions (RAOs)
Fatigue Damage Calculation - Input: Stress transfer functions (FE results file), wave data
- Output: Calculated fatigue life
42
Fatigue Life
Direct Load
Transfer
S-N Fatigue
Curves
Wave scatter
diagram
Stress Transfer Functions
© Det Norske Veritas AS. All rights reserved.
FPSO Full Ship Analysis
October 15, 2012
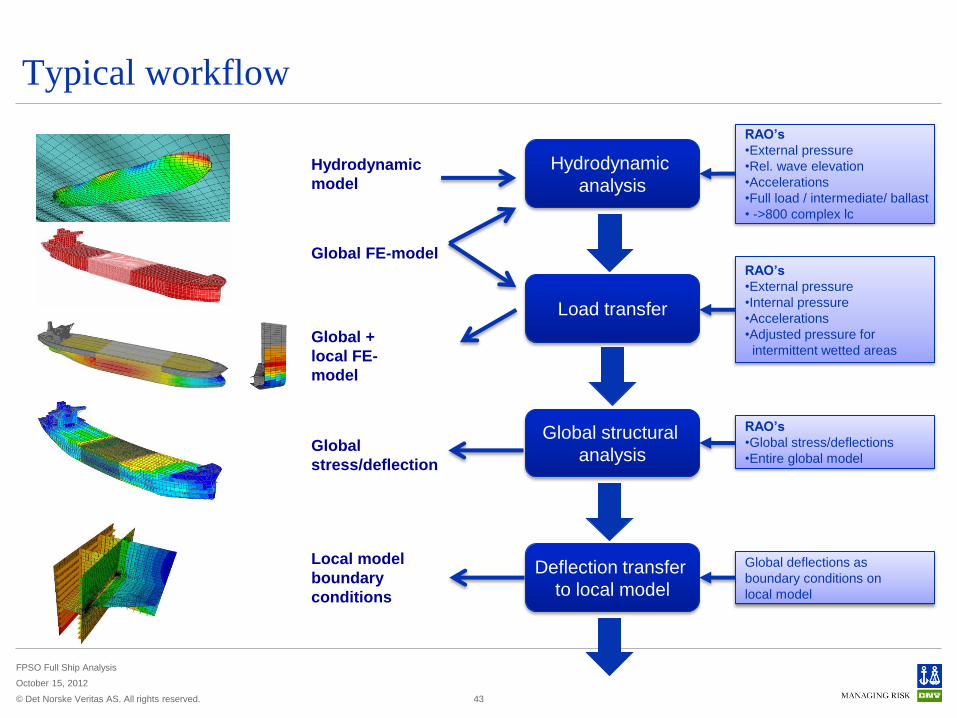
Typical workflow
43
Hydrodynamic
analysis
Load transfer
RAO’s
•External pressure
•Rel. wave elevation
•Accelerations
•Full load / intermediate/ ballast
• ->800 complex lc
Global FE-model
Hydrodynamic
model
Local model
boundary
conditions
Global +
local FE-
model
RAO’s
•External pressure
•Internal pressure
•Accelerations
•Adjusted pressure for
intermittent wetted areas
Global structural
analysis Global
stress/deflection
RAO’s
•Global stress/deflections
•Entire global model
Deflection transfer
to local model
Global deflections as
boundary conditions on
local model
© Det Norske Veritas AS. All rights reserved.
FPSO Full Ship Analysis
October 15, 2012
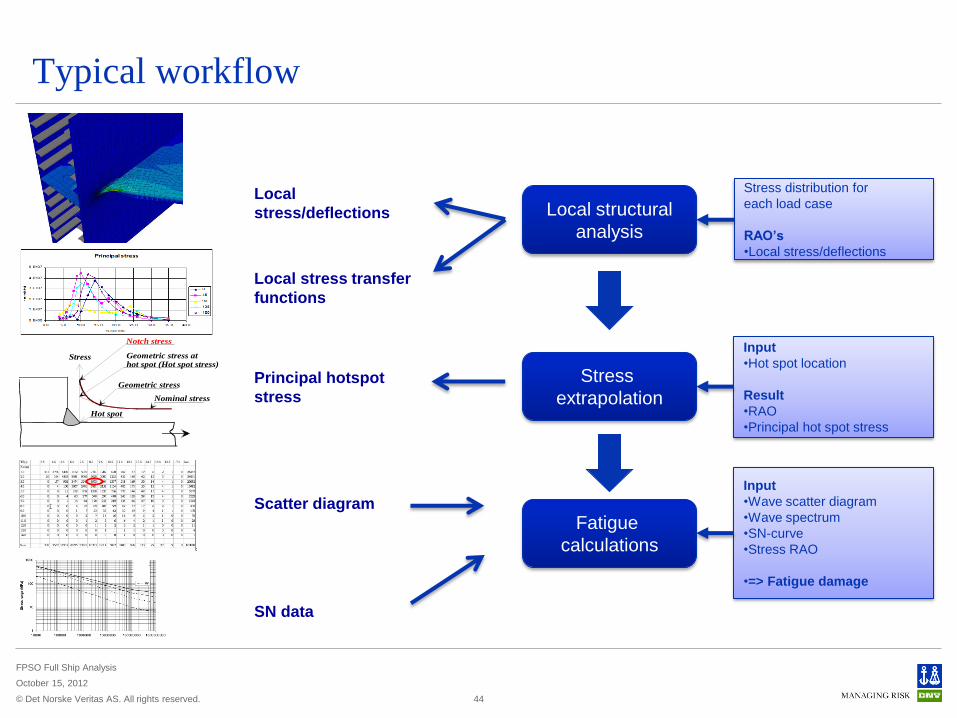
Typical workflow
44
Local structural
analysis
Stress
extrapolation
Stress distribution for
each load case
RAO’s
•Local stress/deflections
Local
stress/deflections
Input
•Hot spot location
Result
•RAO
•Principal hot spot stress
Principal hotspot
stress
Local stress transfer
functions
Fatigue
calculations
Input
•Wave scatter diagram
•Wave spectrum
•SN-curve
•Stress RAO
•=> Fatigue damage
Stress
Hot spot
Geometric stress
Geometric stress athot spot (Hot spot stress)
Notch stress
Nominal stress
Scatter diagram
SN data
© Det Norske Veritas AS. All rights reserved.
FPSO Full Ship Analysis
October 15, 2012
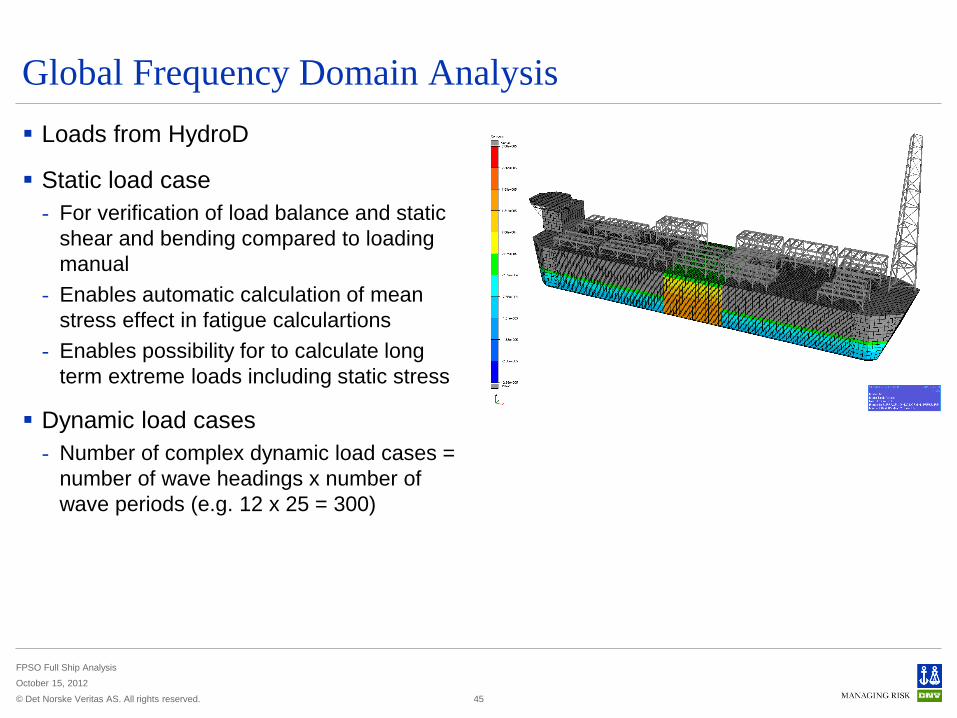
Global Frequency Domain Analysis
Loads from HydroD
Static load case
- For verification of load balance and static
shear and bending compared to loading
manual
- Enables automatic calculation of mean
stress effect in fatigue calculartions
- Enables possibility for to calculate long
term extreme loads including static stress
Dynamic load cases
- Number of complex dynamic load cases =
number of wave headings x number of
wave periods (e.g. 12 x 25 = 300)
45
© Det Norske Veritas AS. All rights reserved.
FPSO Full Ship Analysis
October 15, 2012
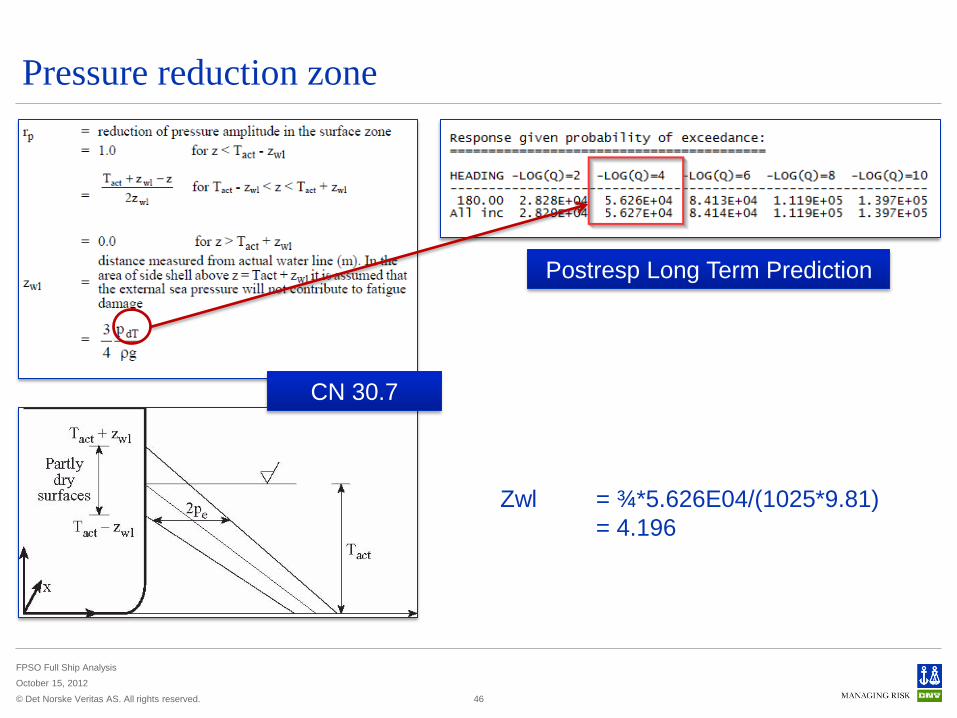
Pressure reduction zone
46
CN 30.7
Zwl = ¾*5.626E04/(1025*9.81)
= 4.196
Postresp Long Term Prediction
© Det Norske Veritas AS. All rights reserved.
FPSO Full Ship Analysis
October 15, 2012
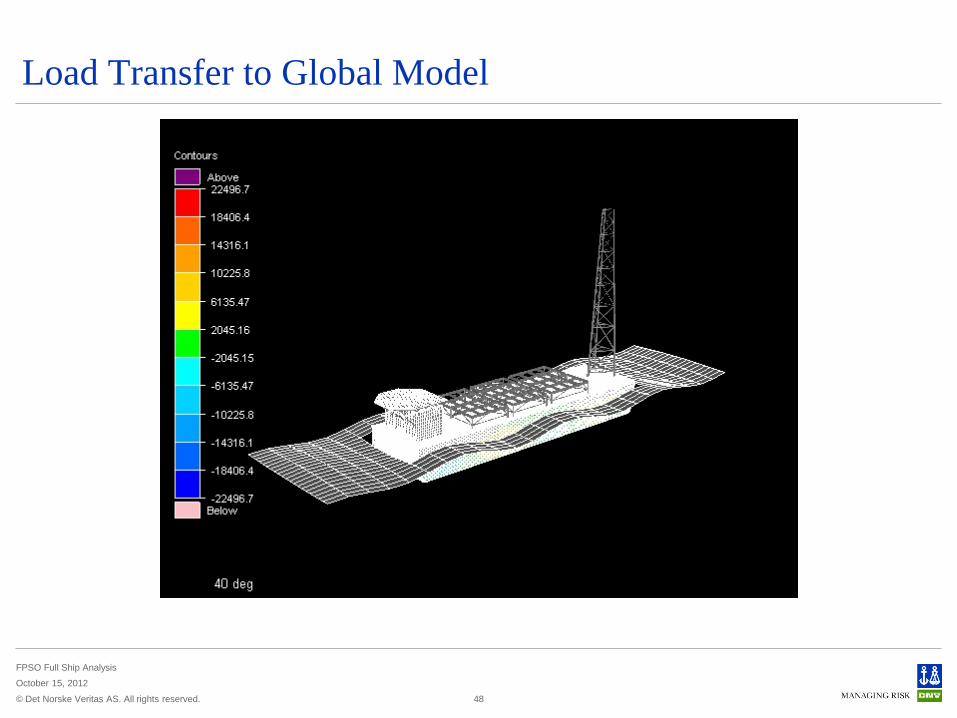
Load Transfer to Global Model
48
© Det Norske Veritas AS. All rights reserved.
FPSO Full Ship Analysis
October 15, 2012
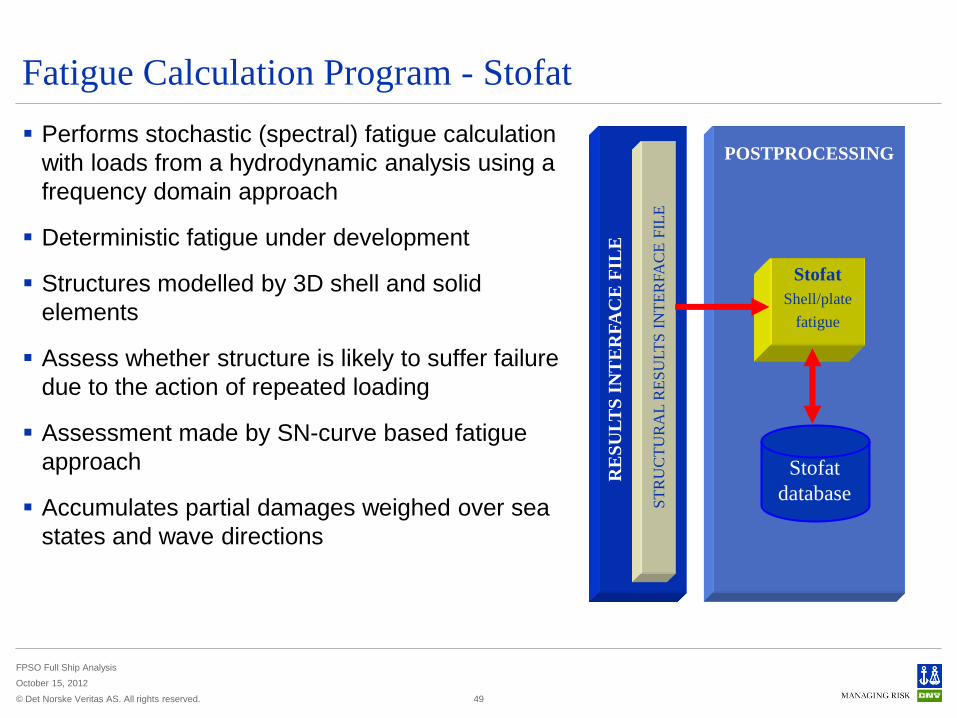
Fatigue Calculation Program - Stofat
Performs stochastic (spectral) fatigue calculation
with loads from a hydrodynamic analysis using a
frequency domain approach
Deterministic fatigue under development
Structures modelled by 3D shell and solid
elements
Assess whether structure is likely to suffer failure
due to the action of repeated loading
Assessment made by SN-curve based fatigue
approach
Accumulates partial damages weighed over sea
states and wave directions
49
POSTPROCESSING
RE
SU
LT
S I
NT
ER
FA
CE
FIL
E
ST
RU
CT
UR
AL
RE
SU
LT
S I
NT
ER
FA
CE
FIL
E
Stofat
Shell/plate
fatigue
Stofat
database

© Det Norske Veritas AS. All rights reserved.
FPSO Full Ship Analysis
October 15, 2012
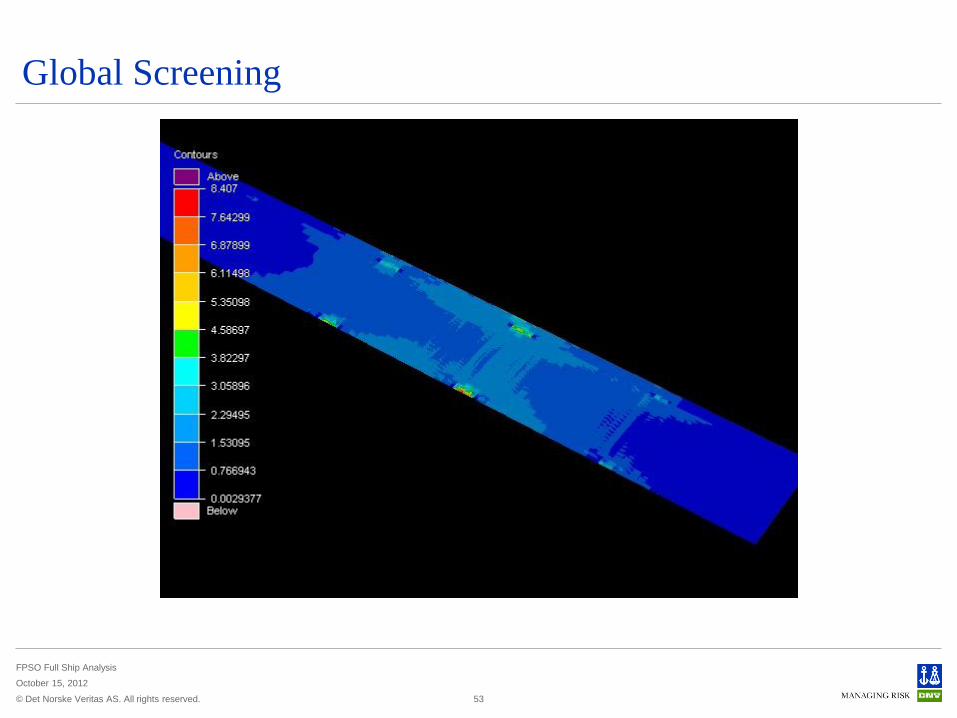
Global Screening Analysis
Fatigue calculations based on nominal
stress from global analysis and stress
concentration factors
Typical use
- Identify fatigue sensitive areas
- Determine critical stress concentration
factors for deck attachment and topside
supports
- Determine location of local models and fine
mesh areas
- Decide extent of reinforcements based on
SCF from local analysis
51
© Det Norske Veritas AS. All rights reserved.
FPSO Full Ship Analysis
October 15, 2012
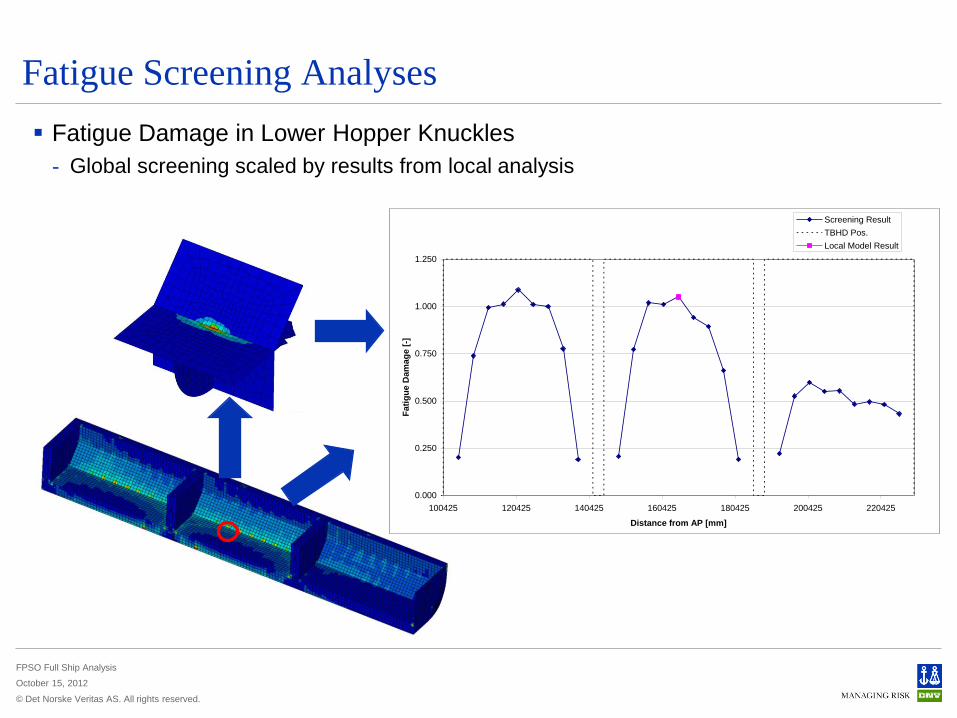
Fatigue Screening Analyses
Fatigue Damage in Lower Hopper Knuckles
- Global screening scaled by results from local analysis
Lower Hopper Knuckle
0.000
0.250
0.500
0.750
1.000
1.250
100425 120425 140425 160425 180425 200425 220425
Distance from AP [mm]
Fati
gu
e D
am
ag
e [
-]
Screening Result
TBHD Pos.
Local Model Result
© Det Norske Veritas AS. All rights reserved.
FPSO Full Ship Analysis
October 15, 2012
Global Screening
53
© Det Norske Veritas AS. All rights reserved.
FPSO Full Ship Analysis
October 15, 2012
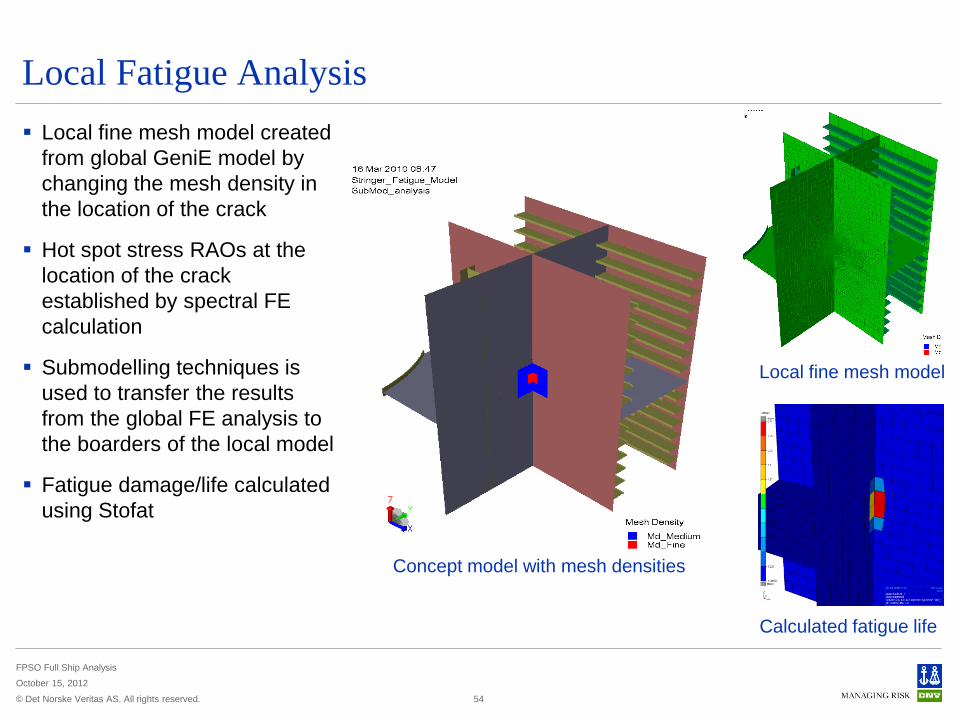
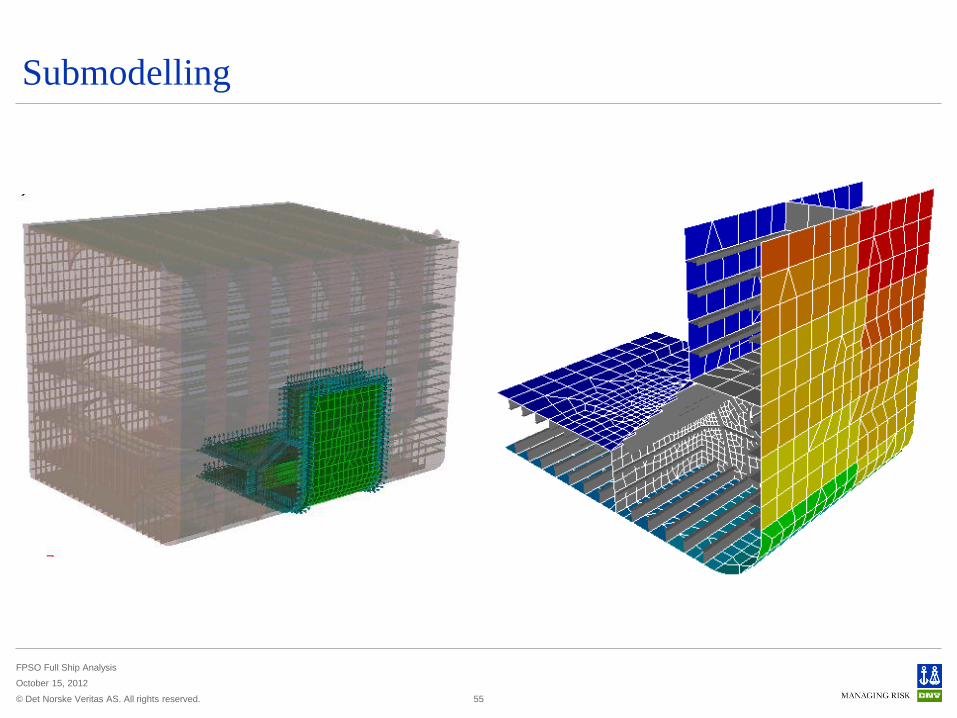
Local Fatigue Analysis
Local fine mesh model created
from global GeniE model by
changing the mesh density in
the location of the crack
Hot spot stress RAOs at the
location of the crack
established by spectral FE
calculation
Submodelling techniques is
used to transfer the results
from the global FE analysis to
the boarders of the local model
Fatigue damage/life calculated
using Stofat
54
Concept model with mesh densities
Local fine mesh model
Calculated fatigue life
© Det Norske Veritas AS. All rights reserved.
FPSO Full Ship Analysis
October 15, 2012
Submodelling
55
© Det Norske Veritas AS. All rights reserved.
FPSO Full Ship Analysis
October 15, 2012
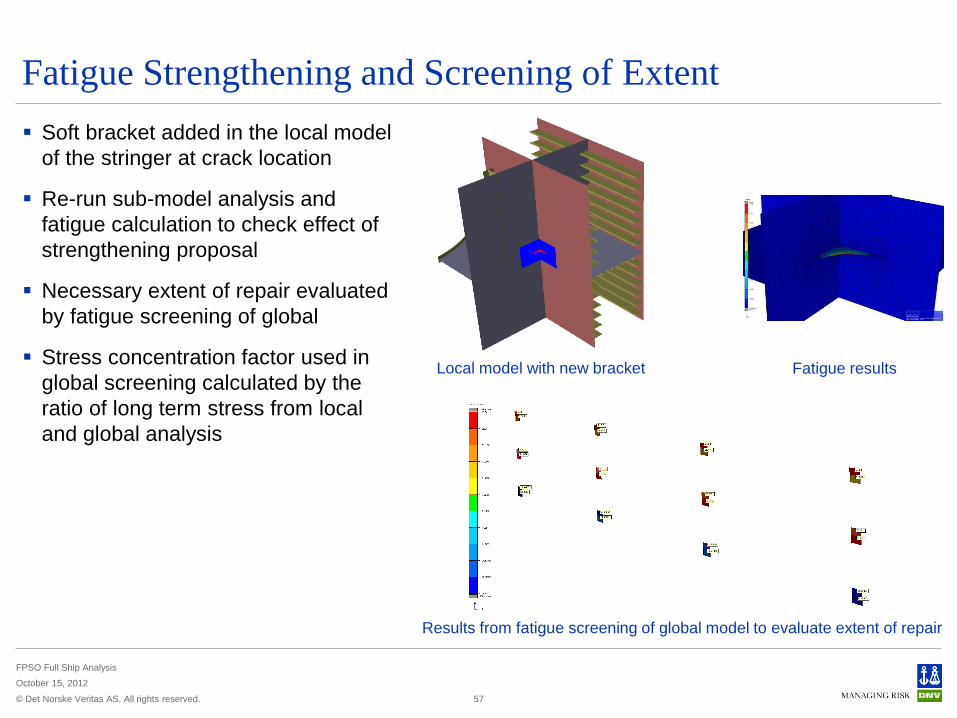
Fatigue Strengthening and Screening of Extent
Soft bracket added in the local model
of the stringer at crack location
Re-run sub-model analysis and
fatigue calculation to check effect of
strengthening proposal
Necessary extent of repair evaluated
by fatigue screening of global
Stress concentration factor used in
global screening calculated by the
ratio of long term stress from local
and global analysis
57
Local model with new bracket
Results from fatigue screening of global model to evaluate extent of repair
Fatigue results

© Det Norske Veritas AS. All rights reserved.
FPSO Full Ship Analysis
October 15, 2012
Analysis Overview
Task Purpose Input Output
Global modelling Make global model for
hydrodynamic and
strength analysis
Ship drawings
Loading manual
Global FE model
Hydrodynamic
analysis
Calculate loads for
fatigue and ultimate
strength
Global FE model
Wave data
Load files for
structural
analysis
ULS analysis Calculate hull girder
strength
Global FE model
Snap shot load files
from HydroD
Ultimate strength
results
Spectral fatigue
analysis
Fatigue screening on
nominal stress
Local fatigue analysis
Global FE model
Frequency domain
load files from HydroD
Calculated
fatigue lives
Spectral ULS
analysis
Calculate long term
stress based on
spectral method
Global FE model
Frequency domain
load files from HydroD
Long term stress
58
© Det Norske Veritas AS. All rights reserved.
FPSO Full Ship Analysis
October 15, 2012
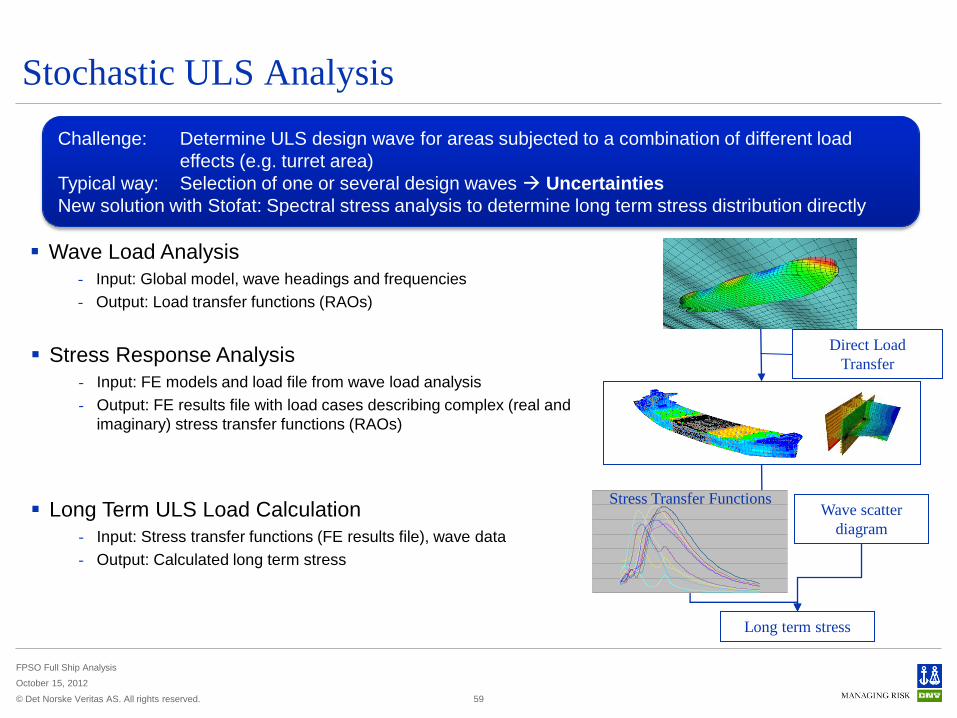
Stochastic ULS Analysis
59
Long term stress
Wave Load Analysis
- Input: Global model, wave headings and frequencies
- Output: Load transfer functions (RAOs)
Stress Response Analysis
- Input: FE models and load file from wave load analysis
- Output: FE results file with load cases describing complex (real and
imaginary) stress transfer functions (RAOs)
Direct Load
Transfer
Wave scatter
diagram
Stress Transfer Functions Long Term ULS Load Calculation
- Input: Stress transfer functions (FE results file), wave data
- Output: Calculated long term stress
Challenge: Determine ULS design wave for areas subjected to a combination of different load
effects (e.g. turret area)
Typical way: Selection of one or several design waves Uncertainties
New solution with Stofat: Spectral stress analysis to determine long term stress distribution directly
© Det Norske Veritas AS. All rights reserved.
FPSO Full Ship Analysis
October 15, 2012
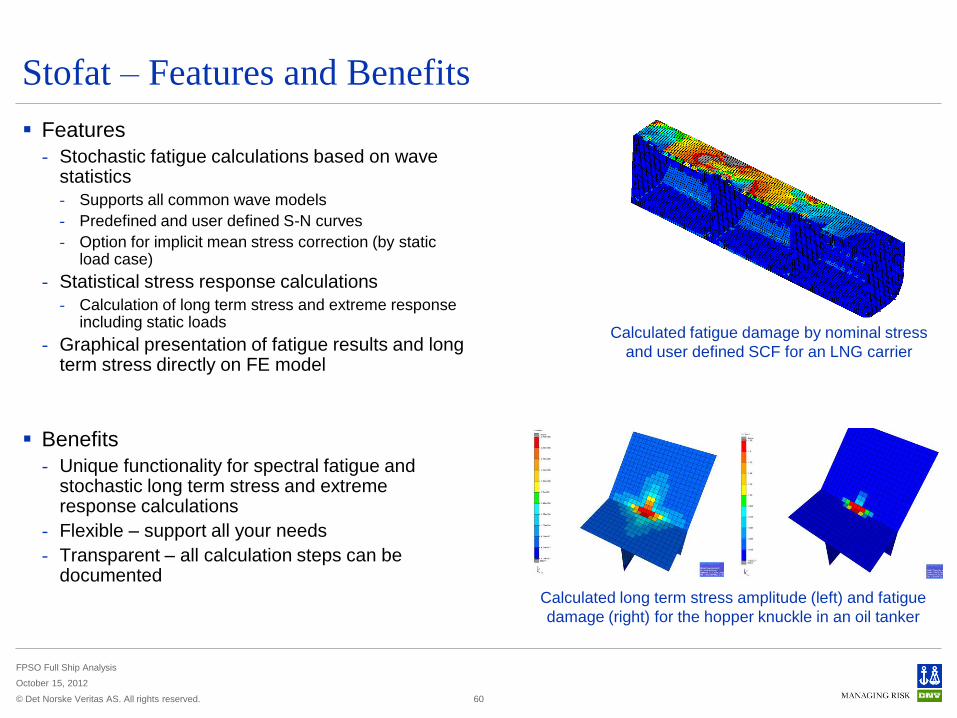
Stofat – Features and Benefits
Features
- Stochastic fatigue calculations based on wave statistics
- Supports all common wave models
- Predefined and user defined S-N curves
- Option for implicit mean stress correction (by static load case)
- Statistical stress response calculations
- Calculation of long term stress and extreme response including static loads
- Graphical presentation of fatigue results and long term stress directly on FE model
Benefits
- Unique functionality for spectral fatigue and stochastic long term stress and extreme response calculations
- Flexible – support all your needs
- Transparent – all calculation steps can be documented
60
Calculated fatigue damage by nominal stress
and user defined SCF for an LNG carrier
Calculated long term stress amplitude (left) and fatigue
damage (right) for the hopper knuckle in an oil tanker
© Det Norske Veritas AS. All rights reserved.
FPSO Full Ship Analysis
October 15, 2012
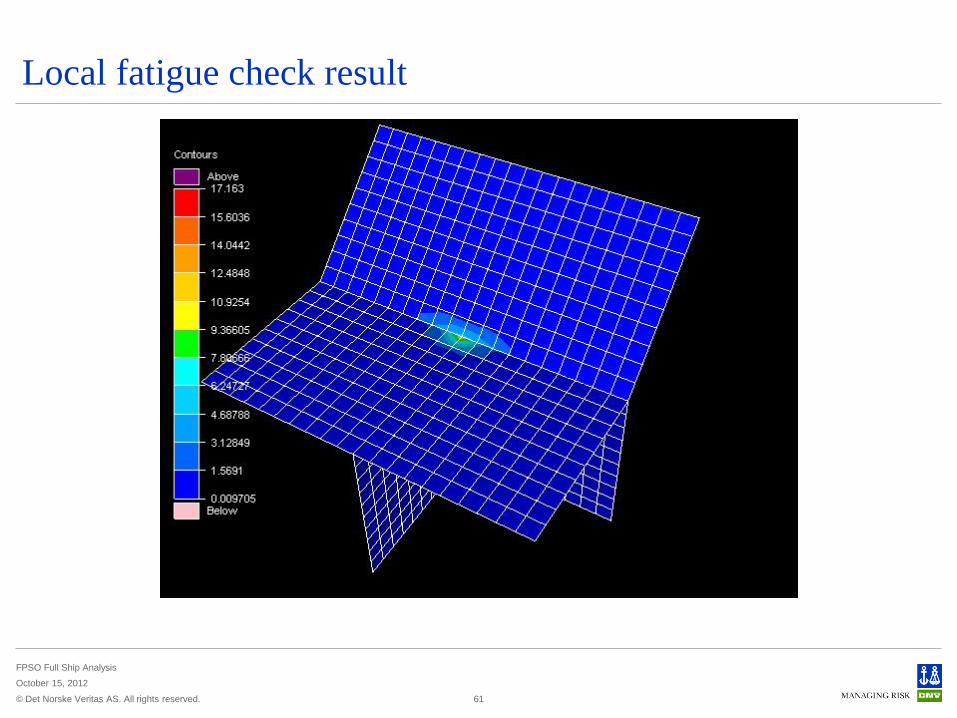
Local fatigue check result
61
© Det Norske Veritas AS. All rights reserved.
FPSO Full Ship Analysis
October 15, 2012
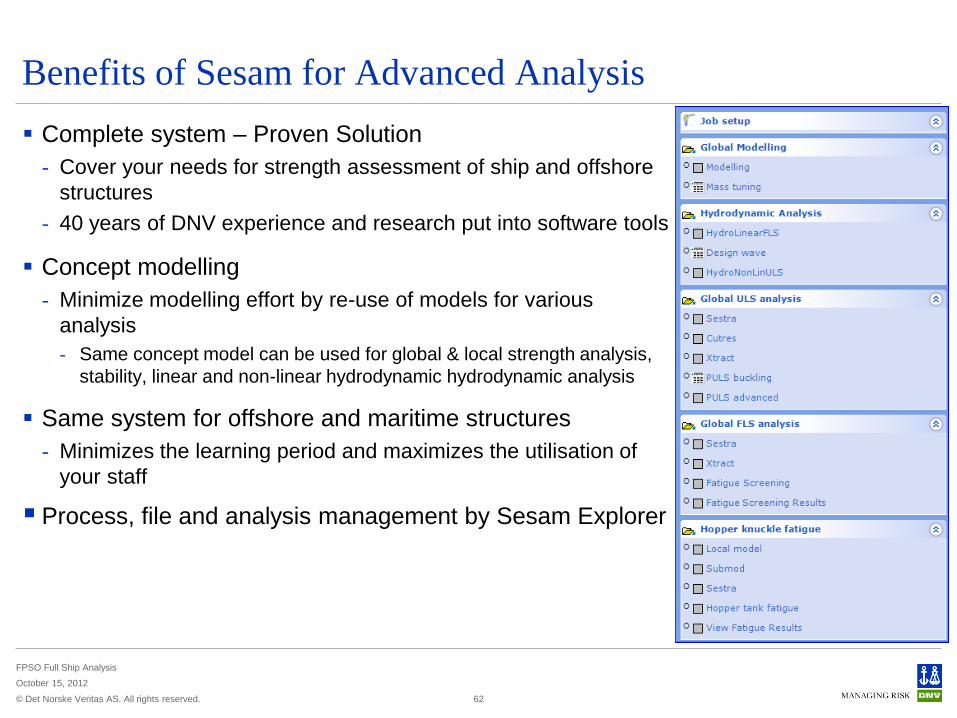
Benefits of Sesam for Advanced Analysis
Complete system – Proven Solution
- Cover your needs for strength assessment of ship and offshore
structures
- 40 years of DNV experience and research put into software tools
Concept modelling
- Minimize modelling effort by re-use of models for various
analysis
- Same concept model can be used for global & local strength analysis,
stability, linear and non-linear hydrodynamic hydrodynamic analysis
Same system for offshore and maritime structures
- Minimizes the learning period and maximizes the utilisation of
your staff
Process, file and analysis management by Sesam Explorer
62

© Det Norske Veritas AS. All rights reserved.
FPSO Full Ship Analysis
October 15, 2012
63
Safeguarding life, property
and the environment
www.dnv.com