fpso forum 2013-powerpoint
DESCRIPTION
FPSO OutlookTRANSCRIPT

FUTURE FPSO PROJECTS IN THE DECISION-MAKING PROCESS
Presentation by Jim McCaul at the Emerging FPSO Forum 25 September 2013

OUTLINE OF PRESENTATION
The Pros and Cons of FPSOs
Profile of FPSO use worldwide
FPSO Projects in the Planning Stage
Our Forecast of FPSO Orders
Issues Impacting Outlook
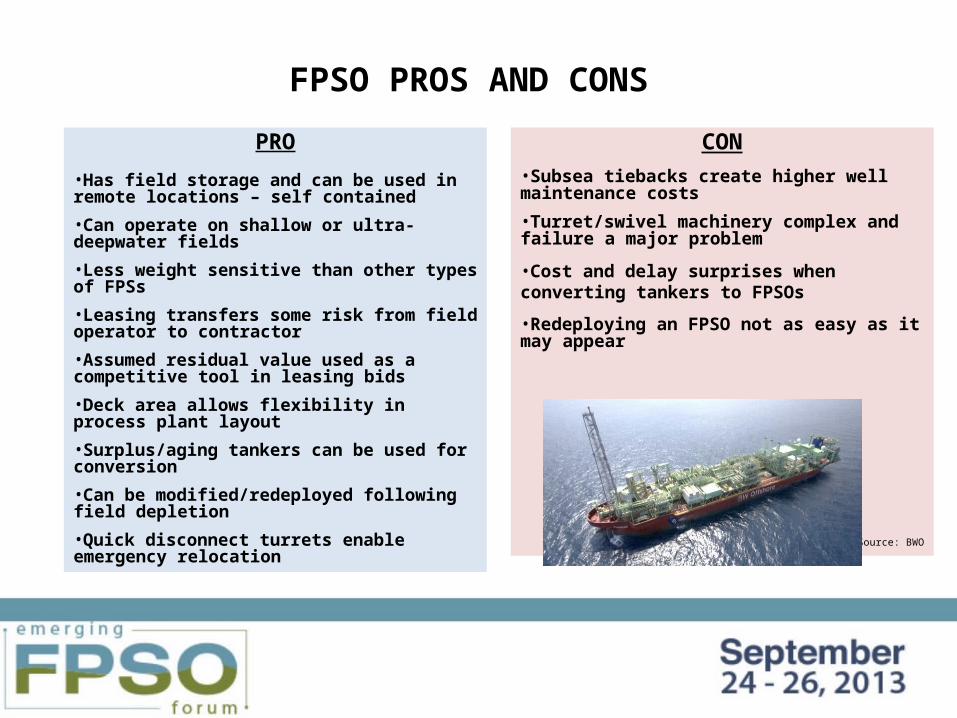
FPSO PROS AND CONS
PRO
•Has field storage and can be used in remote locations – self contained
•Can operate on shallow or ultra-deepwater fields
•Less weight sensitive than other types of FPSs
•Leasing transfers some risk from field operator to contractor
•Assumed residual value used as a competitive tool in leasing bids
•Deck area allows flexibility in process plant layout
•Surplus/aging tankers can be used for conversion
•Can be modified/redeployed following field depletion
•Quick disconnect turrets enable emergency relocation
CON•Subsea tiebacks create higher well maintenance costs
•Turret/swivel machinery complex and failure a major problem
•Cost and delay surprises when converting tankers to FPSOs
•Redeploying an FPSO not as easy as it may appear
Source: BWO

204 FPSOs ARE IN SERVICE, AVAILABLE OR ON ORDER
(number of units as of September 2013)
27% of FPSOs are offshore Brazil
21% are located offshore Africa 14% are off Northern Europe 12% are in Southeast Asia 7% are off China 7% are off Australia/NZ 5% are in other locations 7% are without field assignment
* * * * 13 FPSOs are currently off field
and looking for work 1 FPSO being built has no field
assignmentNote: Data exclude 4 small FPSOs used for well test in the GOM and 2 FPSOs built
for emergency spill recovery
3 2
56
42
2825
14 14
3 3
14
Available
On Order
ExistingOn Order

84% MORE FPSOs IN SERVICE THAN 10 YEARS AGO – WITH 123% MORE OIL PROCESSING CAPACITY
Number of FPSOs in Service
Total Oil Processing Capacity on FPSOs
(000s b/d)
Avg. FPSO Oil Processing Capacity
(000s b/d)
Avg. Water Depth of FPSO Installations
(meters)
2003 2013 % Chg. 2003 2013 % Chg. 2003 2013 % Chg. 2003 2013 % Chg.
Africa 18 38 111% 1396 4390 214% 78 116 49% 208 678 226%
Australia/NZ 9 12 33% 657 979 49% 73 82 12% 152 290 91%
Brazil 9 37 311% 845 3937 366% 94 106 13% 826 1075 30%
Canada 1 2 100% 150 250 67% 150 125 -17% 90 105 17%
China 11 13 18% 734 902 23% 67 69 4% 105 77 -27%
Gulf of Mexico 0 2 n.a. 280 n.a. 140 n.a. 1339 n.a.
India 0 2 n.a. 120 n.a. 60 n.a. 643 n.a.
Mediterranean 5 3 -40% 174 77 -56% 35 26 -26% 228 321 41%
N. Europe 19 22 16% 1783 1884 6% 94 86 -9% 167 159 -5%
SE Asia 11 22 100% 401 877 119% 36 40 9% 67 137 104%
Global Total 83 153 84% 6140 13696 123% 74 90 21% 227 534 135%
Note: Data exclude 13 FPSOs currently without field contract, a spill recovery FPSO and 4 small FPSOs used for well test on the Mexico side of GOM.

44% OF FPSOs IN SERVICE OR ON ORDER ARE LEASED
Total FPSOs
Owned Units
Leased Units % Leased
Africa 42 23 19 45%
Australia/NZ 14 9 5 36%
Brazil 56 31 25 45%
Canada 2 2 0 0%
China 14 14 0 0%
Gulf of Mexico 3 0 3 100%
India 3 0 3 100%
Mediterranean 3 2 1 33%
N. Europe 28 16 12 43%
SE Asia 25 10 15 60%
Global Total 190 107 83 44%Note: Data exclude 14 existing and on order FPSOs without field contract, 2 spill recovery FPSOs and 4 small FPSOs used for well test on the Mexico side of GOM.

MORE THAN 120 FPSO PROJECTS ARE IN THE VISIBLE PLANNING STAGE

WHERE FPSO PROJECTS ARE BEING PLANNED
• Brazil is clearly the major location for future FPSO projects – 51 projects in planning stage
• Africa is next in line – with 13 projects in Angola, 11 Nigeria and 9 elsewhere
• SE Asia is in 3rd place with 11 projects
• No. Europe is in 4th place with 8 projects
• In 5th place is the GOM – 6 projects, all on the Mexican side
Brazil41%
Africa27%
GOM5%
N. Europe7%
SE Asia9%
Other11%
51
33
6 811
14

EXAMPLES OF FPSO PROJECTS IN THE PLANNING STAGE
Discovery Country Field OperatorWater Depth
Estimated Production Start
Africa (meters)
Blk 32 -- Kaombo GG Angola Total 1600 2016/17
Bonga Southwest Nigeria Shell 1200 2017/19
Nsiko Nigeria Chevron 1768 2018/20
Elephant Congo CNOOC 550 2020/25
Bobo Nigeria Shell 2480 2020/25
Brazil
Oliva/Atlanta BS-4 Brazil Queiroz Galvao 1560 2017/19
Carioca BM-S-9 Brazil Petrobras 2150 2016
Carcara BM-S-8 Brazil Petrobras 2027 2018
Espadarte Module III Brazil Petrobras 750 2020
Libra Complex Brazil Petrobras/ANP 2200 2020/25
Franco Leste Brazil Petrobras 1800 2019
Other Regions
Ayatsil/Tekel Mexico Pemex 115 2016/18
El Perdido Mexico Pemex 2500-3000 2018/22
Kraken 9/2b UK EnQuest 100 2016/17
Gohta Norway Lundin 342 2020/25
Sea Lion Falklands Premier 450 2018/20
Belud Malaysia Hess 155 2015/16
Bunga Dahlia/Teratai Malaysia Petronas 65-70 2016/18
Ubah Malaysia Shell 1430 2018/20
D-56 India BP/Reliance 1743 2019-22

LOCATION AND TIMING OF VISIBLE FPSO PROJECTS
Visible Projects
Likely Production Start
Number FPSOs Required
2014/20 2020+ 2014/20 2020+
Africa 33 17 16 17 16
Australia/NZ 1 1 0 1 0
Brazil 51 29 22 29 36
Canada 2 0 2 0 2
China 1 1 0 1 0
Gulf of Mexico 6 4 2 4 2
Mediterranean 3 3 0 3 0
N. Europe 8 7 1 7 1Other So. Amer 3 3 0 3 0
SE Asia 11 11 0 11 0
SW Asia 4 3 1 3 1
Global Total 123 79 44 79 58

PROCESSING PLANT CAPACITY IN VISIBLE FUTURE FPSO PROJECTS
(b/d in 000’s)
• 58% require topside plants with 100,000 to 200,000 b/d oil processing capability
• 21% require topside plants with 50,000 to 100,000 b/d capacity
• 10% involve small FPSOs with less than 50,000 b/d plants
• 3% are mega- FPSOs with more than 200,000 b/d processing capacity
• 7% are primarily gas FPSOs
<50 b/d50-100 b/d
100-150 b/d 150-200 b/d
200+ b/d
Gas1429
44 36
410

BREAKDOWN OF PROCESSING CAPACITY REQUIRED FOR VISIBLE FUTURE FPSO PROJECTS
(b/d in 000’s)
FPSOs Required Between 2014-2020 FPSOs Required 2020+
<50 b/d50 to
100 b/d100 to
150 b/d150 to
200 b/d 200+ b/d Gas <50 b/d50 to
100 b/d100 to
150 b/d150 to
200 b/d 200+ b/d Gas
Africa 5 7 2 2 1 5 5 4 1 1
Australia/NZ 1
Brazil 2 15 9 3 3 12 21
Canada 2
China 1
Gulf of Mexico 2 1 1 1 1
Mediterranean 2 1
N. Europe 2 5 1
Other So. Amer 3
SE Asia 6 2 1 2
SW Asia 2 1 1
Global Total 14 19 24 11 3 8 0 10 20 25 1 2

WHAT WILL DRIVE THE PACE OF FUTURE FPSO ORDERS?
Underlying market conditions
Smaller FPSOs for marginal fields are influenced by near term oil price expectations and availability of financing
Large FPSOs intended for major developments tend to be less sensitive to oil price and financing
Passing the FID hurdle
But even the biggest oil company has to make choices -- there are budget constraints and limits on available personnel to manage project implementation
Whether an FPSO project gets into the CAPEX plan depends on its ranking in terms of expected return on investment
This will be determined by the project economics – and the economics of other investment possibilities

MARCH 2013 FORECAST OF FPSO ORDERS OVER THE NEXT 5 YEARS
7690
110130
No. Orders2008/12
LowForecast
Most Likely
HighForecast
No. Orders 2013/17
Forecastnext 5 years
Actual past 5 years
Most Likely Forecast Assumptions
Global economic growth averages 3 to 4 percent annually over next few yearsOil demand growth remains around 1 percent per yearMideast tensions continue, but no major oil supply interruptionOil price expectations hover in $90 to $110 range Some cost growth and delivery bottlenecks in the FPSO supply base, but not enough to slow major project starts or erode contractor profitsNo major environmental incident involving an FPSONo major impact from shale oil on deepwater investment

ASSUMPTIONS UNDERLYING THE HIGH AND LOW FORECASTS
Low Forecast Assumptions
China and/or India economies falter, Europe/U.S. economies continue to stagnate over next few years
World GDP growth turns downward
Global oil demand growth falls as economic activity and world output slows
Tight oil, shale oil finds grow internationally, technology advances lower cost
Oil price expectations fall to $70 to $90 range, negating commercial viability of many visible marginal floating production projects
Contractors experience supply constraints, raising costs, creating delivery delays
High Forecast AssumptionsGlobal economic rebound accelerates quickly from 2013 onward, rises to 4 %+ per year
Oil demand growth tracks upward with economic growth
Mideast tensions grow, oil supply interrupted
Shale oil and/or tight oil projects meet worldwide opposition, delaying project starts
Many unconventional onshore fuel projects encounter continuing logistics constraints
Oil prices spike to $150+ and expectations remain above $120, making most visible marginal floating production projects commercially viable
Little cost growth, few delivery constraints in the floater supply chain

THE LOW END OF THE MARCH FORECAST IS NOW LOOKING MORE LIKELY
• Portfolio of potential FPSO projects has been growing
• But new project starts have slowed – 9 FPSOs have been ordered thus far in 2013, an average of 1 order/month
• Cost growth, access to financing, market barriers, other issues seem to be creating barriers
• We now see the low end of the forecast range – i.e., ~90 FPSOs – as the most likely forecast of FPSO orders

ISSUES Local content requirements are
Creating market entry barriers and limiting competition
Raising costs – e.g., Egina FPSO $3.1 billion! Clogging the supply chain
Shale oil/tight oil growth is a threat to deepwater Added supply could result in lower oil prices Shale oil projects could draw investment resources
from deepwater Deepwater costs are increasing – shale oil/tight oil
cost are falling

Thank You
If you would like to discuss any aspect of this presentation or get further details on the FPSO market, please contact
Jim McCaul [email protected] or
1 202 333 8501
Our website has further information that you may find useful. Please give us a visit.
www.imastudies.com