fourth quarter and full year 2017 … · fourth quarter and full year 2017 published 1 march 2018...
TRANSCRIPT

FOURTH QUARTER AND FULL YEAR 2017
Published 1 March 2018
FINANCIAL STATEMENTS
Vard Holdings LimitedIncorporated in Singapore | Company Registration No. 201012504K
Unaudited results for the fourth quarter and full year ended 31 December 2017

VARD HOLDINGS LIMITEDIncorporated in SingaporeCompany Registration No. 201012504K
Fourth Quarter and Full Year 2017 Financial StatementsUNAUDITED RESULTS FOR THE FOURTH QUARTER AND FULL YEAR ENDED 31 DECEMBER 2017(All amounts in NOK millions unless otherwise stated)
TABLE OF CONTENTS
Paragraph Description Page
1 UNAUDITED FINANCIAL STATEMENTS 3(a)(i) Statement of Comprehensive Income (Group) 3(a)(ii) Notes to the Statement of Comprehensive Income 4(b)(i) Statement of Financial Position 5(b)(ii) Aggregate amount of Group’s Borrowings and Debt Securities 6(c) Statement of Cash Flows (Group) 7(d)(i) Statements of Changes in Equity 8(d)(ii) Share Capital 9(d)(iii) Number of Issued Shares excluding Treasury Shares 9(d)(iv) Sales, Transfers, Cancellations and/or use of Treasury Shares 9(d)(v) Sales, Transfers, Cancellations and/or use of Subsidiary Holdings 92 AUDIT 93 AUDITORS' REPORT 94 ACCOUNTING POLICIES 95 CHANGES IN ACCOUNTING POLICIES 96 EARNINGS PER ORDINARY SHARE 107 NET ASSETS VALUE PER ORDINARY SHARE 108 REVIEW OF GROUP PERFORMANCE 119 VARIANCE FROM FORECAST STATEMENT 1310 PROSPECTS 1311 DIVIDEND 1312 SEGMENT ANALYSIS AND GEOGRAPHICAL INFORMATION 1413 REVIEW OF SEGMENT PERFORMANCE 1414 SALES BREAKDOWN 1415 BREAKDOWN OF TOTAL ANNUAL DIVIDEND 1416 INTERESTED PERSON TRANSACTIONS 1517 RULE 704(13) 1518 CONFIRMATION THAT THE ISSUER HAS PROCURED UNDERTAKINGS UNDER RULE 720(1) OF THE LISTING MANUAL 15
Page 2 of 15

VARD HOLDINGS LIMITEDIncorporated in SingaporeCompany Registration No. 201012504K
Fourth Quarter and Full Year 2017 Financial StatementsUNAUDITED RESULTS FOR THE FOURTH QUARTER AND FULL YEAR ENDED 31 DECEMBER 2017(All amounts in NOK millions unless otherwise stated)
1 UNAUDITED FINANCIAL STATEMENTS
(a)(i) Statement of Comprehensive Income (Group)
4Q-2017 4Q-2016 Change Full year Full year Changeended ended % ended ended %
31/12/17 31/12/16 31/12/17 31/12/16
Revenue 2,693 2,150 25% 8,603 7,894 9%Materials, subcontract costs and others (1,907) (1,416) 35% (5,601) (5,049) 11%Salaries and related costs (630) (566) 11% (2,298) (2,162) 6%Other operating expenses (148) (101) 47% (541) (515) 5%EBITDA before restructuring cost 8 67 -88% 163 168 -3%Restructuring cost (12) (29) -59% (33) (105) -69%Depreciation, impairment and amortization (55) (52) 6% (221) (205) 8%Operating profit/(loss) (59) (14) 321% (91) (142) -36%
Financial income 154 39 295% 304 323 -6%Financial costs (223) (42) 431% (410) (282) 45%Net financial items (69) (3) n/m (106) 41 n/m
Share of results of associates (14) (40) -65% (47) (58) -19%Profit (loss) before tax (142) (57) 149% (244) (159) 53%
Income tax expense 9 (12) n/m 6 (38) n/mProfit (loss) for the period (133) (69) 93% (238) (197) 21%
Profit (loss) for the period attributable to:Equity holders of the Company (131) (67) 96% (233) (163) 43%Non-controlling interest (2) (2) n/m (5) (34) -85%Profit (loss) for the period (133) (69) 93% (238) (197) 21%
Other comprehensive income:
Items that may be reclassified subsequently to profit or loss:Exchange differences on translation of foreign operations (11) (18) -39% (22) (404) -95%Net fair value change in cash flow hedge (31) (73) -58% 56 (49) n/mIncome tax on other comprehensive income 7 18 -61% 4 93 -96%
Items that may not be reclassified subsequently to profit or loss:Share of other comprehensive income in associated companies - (71) n/m (2) (102) -98%
Other comprehensive income for the period, net of income tax (35) (144) -76% 36 (462) n/mTotal comprehensive income for the period (168) (213) -21% (202) (659) -69%
Total comprehensive income attributable to:Equity holders of the Company (165) (211) -22% (197) (444) -56%Non-controlling interest (3) (2) n/m (5) (215) -98%Total comprehensive income for the period (168) (213) -21% (202) (659) -69%
Notes:(*) N/M - Not meaningful. (**) As a result of rounding differences, numbers or percentages may not add up to the total.
GroupGroup
Page 3 of 15

VARD HOLDINGS LIMITEDIncorporated in SingaporeCompany Registration No. 201012504K
Fourth Quarter and Full Year 2017 Financial StatementsUNAUDITED RESULTS FOR THE FOURTH QUARTER AND FULL YEAR ENDED 31 DECEMBER 2017(All amounts in NOK millions unless otherwise stated)
1 UNAUDITED FINANCIAL STATEMENTS (cont.)
(a)(ii) Notes to the Statement of Comprehensive Income
4Q-2017 4Q-2016 Change Full year Full year Changeended ended % ended ended %
31/12/17 31/12/16 31/12/17 31/12/16
Interest income 8 9 -11% 34 36 -6%Foreign exchange gain 142 28 407% 265 281 -6%Other financial income 4 2 100% 5 6 n/mFinancial income 154 39 295% 304 323 -6%
Interest expense (25) (17) 47% (82) (78) 5%Foreign exchange loss (151) (10) n/m (240) (133) 80%Other financial expenses (47) (15) 213% (88) (71) 24%Financial expenses (223) (42) 431% (410) (282) 45%
Net financial items (69) (3) n/m (106) 41 n/m
Depreciation of property, plant and equipment (50) (47) 6% (200) (193) 4%Amortization of intangibles (5) (5) 0% (18) (12) 50%Impairment charges - - n/m (3) - n/mDepreciation, impairment charges and amortization (55) (52) 6% (221) (205) 8%
Provisions for doubtful debts - - n/m - - n/m- - n/m - - n/m
Group
Allowance for doubtful debts and bad debts written off
Group
Page 4 of 15

VARD HOLDINGS LIMITEDIncorporated in SingaporeCompany Registration No. 201012504K
Fourth Quarter and Full Year 2017 Financial StatementsUNAUDITED RESULTS FOR THE FOURTH QUARTER AND FULL YEAR ENDED 31 DECEMBER 2017(All amounts in NOK millions unless otherwise stated)
1 UNAUDITED FINANCIAL STATEMENTS (cont.)
(b)(i) Statement of Financial Position
As at As at Change As at As at Change31/12/17 31/12/16 % 31/12/17 31/12/16 %
Property, plant and equipment 2,629 2,555 3% - - n/mIntangible assets 477 475 0% - - n/mInvestment in subsidiary - - n/m 3,518 2,983 18%Investment in associates 192 222 -14% - - n/mOther investments 12 19 -37% - - n/mInterest-bearing receivables, non-current 581 473 23% - - n/mNon-current derivatives - 28 n/m - - n/mOther non-current assets 158 38 316% - - n/mDeferred tax assets 126 82 54% - - n/mTOTAL NON-CURRENT ASSETS 4,175 3,892 7% 3,518 2,983 18%
Inventories 2,100 1,949 8% - - n/mConstruction WIP in excess of prepayments 6,537 5,594 17% - - n/mTrade and other receivables 834 801 4% 92 112 -18%Current derivatives 84 53 58% - - n/mOther current assets 62 161 -61% - - n/mInterest-bearing receivables, current 322 289 11% - 7 n/mCash and cash equivalents 810 722 12% 1 3 n/mAssets classified as held for sale - 57 n/m - - n/mTOTAL CURRENT ASSETS 10,749 9,626 12% 93 122 -24%
TOTAL ASSETS 14,924 13,518 10% 3,611 3,105 16%
Paid up capital 4,138 4,138 0% 4,138 4,138 0%Restructuring reserve (3,190) (3,190) 0% (1,411) (1,411) 0%Other reserves (841) (877) 4% - - n/mRetained earnings 1,961 2,194 -11% 450 375 20%Total equity attributable to equity holders of the Comp. 2,068 2,265 -9% 3,177 3,102 2%Non-controlling interest 25 30 -17% - n/mTOTAL EQUITY 2,093 2,295 -9% 3,177 3,102 2%
Loans and borrowings, non-current 1,045 1,049 0% - - n/mDeferred tax liabilities 89 109 -18% - - n/mNon-current derivatives 168 32 425% - - n/mOther non-current liabilities 831 582 43% - - n/mProvisions, non-current 87 96 -9% - - n/mTOTAL NON-CURRENT LIABILITIES 2,220 1,868 19% - - n/m
Loans and borrowings, current 872 443 97% 431 - n/mConstruction loans 5,652 5,248 8% - - n/mPrepayments in excess of construction WIP 715 763 -6% - - n/mTrade and other payables 2,051 1,636 25% 1 2 n/mCurrent derivatives 363 591 -39% - - n/mIncome tax payable 51 85 -40% - - n/mProvisions, current 98 141 -30% - - n/mOther current liabilities 809 404 100% 2 1 n/mLiabilities directly associated with assets classified as held for sale - 44 n/m - - n/mTOTAL CURRENT LIABILITIES 10,611 9,355 13% 434 3 n/m
TOTAL LIABILITIES 12,831 11,223 14% 434 3 n/m
TOTAL EQUITY AND LIABILITIES 14,924 13,518 10% 3,611 3,105 16%- - - -
Group Company
Page 5 of 15

VARD HOLDINGS LIMITEDIncorporated in SingaporeCompany Registration No. 201012504K
Fourth Quarter and Full Year 2017 Financial StatementsUNAUDITED RESULTS FOR THE FOURTH QUARTER AND FULL YEAR ENDED 31 DECEMBER 2017(All amounts in NOK millions unless otherwise stated)
1 UNAUDITED FINANCIAL STATEMENTS (cont.)
(b)(ii) Aggregate amount of Group’s Borrowings and Debt Securities
Secured Unsecured Secured Unsecured
Loans and borrowings, current 325 547 200 243 Construction loans * 5,652 - 5,248 - Total Amount repayable in one year or less, or on demand 5,977 547 5,448 243
Loans and borrowings, non-current 1,045 - 1,049 - Total Amount repayable after one year 1,045 - 1,049 -
Total 7,022 547 6,497 243
Details of debt secured by collaterals
Currency
Drawn amount in
currency
Drawn amount in
NOK
Current portion in
NOK
Non-current portion in
NOK
NOK 178 178 18 160 USD 104 854 84 770 EUR 34 338 223 115 Total 1,370 325 1,045
The following assets have been plegded as security for the loans:- Property plant and equipment in Vard Group AS- Property plant and equipment in Vard Promar SA- Property plant and equipment in Vard Tulcea SA- Shares in Vard Vung Tau Ltd.- Shares in Vard Promar SA
As at 31.12.17 As at 31.12.16
* Construction loans are in general treated as short term maturing on vessel delivery, and are secured by the vessels under construction
Page 6 of 15

VARD HOLDINGS LIMITEDIncorporated in SingaporeCompany Registration No. 201012504K
Fourth Quarter and Full Year 2017 Financial StatementsUNAUDITED RESULTS FOR THE FOURTH QUARTER AND FULL YEAR ENDED 31 DECEMBER 2017(All amounts in NOK millions unless otherwise stated)
1 UNAUDITED FINANCIAL STATEMENTS (cont.)
(c) Statement of Cash Flows (Group)
4Q-2017 4Q-2016 Full year Full yearended ended ended ended
31/12/17 31/12/16 31/12/17 31/12/16OPERATING ACTIVITIESProfit (loss) before tax (142) (57) (244) (159) Adjustments for:Net interest expense 17 8 48 42 (Gain)/loss on disposal of property, plant and equipment, net - 2 3 - Unrealised foreign exchange gain/loss (12) (8) (102) (193) Depreciation, impairment and amortization 55 52 221 205 Change in pension assets and liabilities - - 1 - Other non-cash items in the statement of comprehensive income 75 (12) 90 17 Share of results of associates 14 40 47 58 Operating cash flows before movements in working capital 7 25 64 (30) Inventories (16) (74) (205) (129) Construction work in progress (175) 1,835 (844) 5,921 Proceeds from construction loans 464 529 1,410 3,296 Repayment of construction loans (760) (2,639) (1,089) (7,414) Other working capital assets (259) 3,067 (207) 975 Other working capital liabilities 847 (2,133) 991 (1,814) Provisions (13) 29 (52) 25 Cash generated from / (used in) operations 95 639 68 830 Interest received 8 9 34 36 Interest paid (19) (18) (60) (77) Income tax paid (57) (13) (73) (25) Cash flows from/ (used in) operating activities 27 617 (31) 764
INVESTING ACTIVITIESProceeds from disposal of property, plant and equipment - 8 2 19 Proceeds from disposal of subsidiary - - 7 - Purchase of property, plant and equipment (75) (91) (317) (245) Purchase of intangible assets (6) (25) (25) (45) Issuance of new non-current interest bearing receivables 4 (3) 4 (3) Proceeds from repayment of non-current interest bearing receivables - 6 - 6 Acquisition of equity interest in associates - (11) - (11) Proceeds from repayment of short-term interest-bearing receivables - - 5 - Acquisition of subsidiary, net of cash acquired - (35) (1) (32) Increase in ownership interest in subsidiaries - - (14) - Cash flows used in investing activities (77) (151) (339) (311)
FINANCING ACTIVITIESProceeds from loans and borrowings 22 - 825 44 Repayment of loans and borrowings (50) (288) (358) (615) Transactions with non-controlling interests - - - (16) Cash flows from/ (used in) financing activities (28) (288) 467 (587)
NET INCREASE/ (DECREASE) IN CASH AND CASH EQUIVALENTS (78) 178 97 (134) Effects of currency translation difference on cash and cash equivalents 6 19 (7) 32 Cash and cash equivalents excl. restricted cash at beginning of financial period 780 421 618 720
Cash and cash equivalents excl. restricted cash at end of financial period 708 618 708 618 Restricted cash at end of financial period 102 104 102 104 Cash and cash equivalents at end of financial period 810 722 810 722
- -
GroupGroup
Page 7 of 15

VARD HOLDINGS LIMITEDIncorporated in SingaporeCompany Registration No. 201012504K
Fourth Quarter and Full Year 2017 Financial StatementsUNAUDITED RESULTS FOR THE FOURTH QUARTER AND FULL YEAR ENDED 31 DECEMBER 2017(All amounts in NOK millions unless otherwise stated)
1 UNAUDITED FINANCIAL STATEMENTS (cont.)
(d)(i)Paid up Capital
Restructuring Reserve
Currency Translation
Reserve
Fair Value
ReserveOther
reservesRetained Earnings
Non-controlling Interest
Total Equity
At 1 January 2017 4,138 (3,190) 163 (38) (1,002) 2,194 2,265 30 2,295
Comprehensive income
- - - - - (233) (233) (5) (238) Other comprehensive income - - (4) 40 - - 36 - 36 Total comprehensive income - - (4) 40 - (233) (197) (5) (202)
At 31 December 2017 4,138 (3,190) 159 2 (1,002) 1,961 2,068 25 2,093 - -
At 1 January 2016 4,138 (3,190) 392 139 - 2,319 3,798 (837) 2,961
Comprehensive income
- - - - - (163) (163) (34) (197) Other comprehensive income - - (142) (177) - 38 (281) (181) (462) Total comprehensive income - - (142) (177) - (125) (444) (215) (659)
Transactions with owners
- - - - - 22 22 - - (87) - (1,002) (1,089) 1,060 (29)
Total transaction with owners - - (87) - (1,002) - (1,089) 1,082 (7)
At 31 December 2016 4,138 (3,190) 163 (38) (1,002) 2,194 2,265 30 2,295 - - - - - - - - -
Paid up CapitalRestructuring
ReserveRetained Earnings
Total Equity
At 1 January 2017 4,138 (1,411) 375 3,102
Comprehensive income
- - 75 75 Total comprehensive income for the period - - 75 75
At 31 December 2017 4,138 (1,411) 450 3,177
At 1 January 2016 4,138 (1,411) 280 3,007
Comprehensive income
- - 95 95 Total comprehensive income for the period - - 95 95
At 31 December 2016 4,138 (1,411) 375 3,102
Other reservesTotal Equity
Attributable To Equity Holders
of the Company
Statements of Changes in Equity
Profit (loss) for the period
Equity subscribed by non-controlling shareholders
Transactions with non-controlling interests
Profit (loss) for the period
Profit (loss) for the period
Company
Profit (loss) for the period
Page 8 of 15

VARD HOLDINGS LIMITEDIncorporated in SingaporeCompany Registration No. 201012504K
Fourth Quarter and Full Year 2017 Financial StatementsUNAUDITED RESULTS FOR THE FOURTH QUARTER AND FULL YEAR ENDED 31 DECEMBER 2017(All amounts in NOK millions unless otherwise stated)
1 UNAUDITED FINANCIAL STATEMENTS (cont.)
(d)(ii) Share Capital
Share Options
(d)(iii) Number of Issued Shares excluding Treasury Shares
(d)(iv) Sales, Transfers, Cancellations and/or use of Treasury Shares
(d)(v) Sales, Transfers, Cancellations and/or use of Subsidiary Holdings
Not applicable. The Company has no Subsidiary Holdings.
2 AUDIT
3 AUDITORS' REPORT
4 ACCOUNTING POLICIES
5 CHANGES IN ACCOUNTING POLICIES
There were no outstanding options to subscribe for shares as at 31 December 2017 (31 December 2016: 0).
The number of issued shares (excluding treasury shares) as at 31 December 2017 is 1,180,000,000 ordinary shares (31 December 2016:1,180,000,000 ordinary shares).
The Group has applied the same accounting policies and methods of computation in the financial statements for the current financial periodcompared with those of the audited financial statements for the year ended 31 December 2016.
The Group has not implemented any new or revised financial reporting standards in 2017.
The figures have not been audited nor reviewed by the auditors.
Not applicable. The Company has no treasury shares.
Not applicable.
There were no ordinary shares issued in 4Q 2017. There are no treasury shares, nor subsidiary holdings, as at 31 December 2017 and as at 31December 2016.
Page 9 of 15

VARD HOLDINGS LIMITEDIncorporated in SingaporeCompany Registration No. 201012504K
Fourth Quarter and Full Year 2017 Financial StatementsUNAUDITED RESULTS FOR THE FOURTH QUARTER AND FULL YEAR ENDED 31 DECEMBER 2017(All amounts in NOK millions unless otherwise stated)
6 EARNINGS PER ORDINARY SHARE
4Q-2017 4Q-2016 Full year Full yearended ended Change ended ended Change
31/12/17 31/12/16 % 31/12/17 31/12/16 %
(i) Earnings for the period (in NOK millions) (131) (67) 96% (233) (163) 43%Earnings for the period (in SGD millions) (21) (11) 91% (38) (27) 41%
1,180 1,180 0% 1,180 1,180 0%
(ii) Earnings per share (NOK) (0.11) (0.06) 83% (0.20) (0.14) 43%Earnings per share (SGD cents) (1.78) (0.93) 91% (3.22) (2.29) 41%
(iii) Diluted earnings per share (NOK) (0.11) (0.06) 83% (0.20) (0.14) 43%Diluted earnings per share (SGD cents) (1.78) (0.93) 91% (3.22) (2.29) 41%
1,180 1,180 0% 1,180 1,180 0%
Exchange rates: 31/12/17 31/12/16 31/12/17 31/12/16SGD/NOK 6.141 5.965 3% 6.141 5.965 3%
7 NET ASSETS VALUE PER ORDINARY SHARE
As at As at Change As at As at Change31/12/17 31/12/16 % 31/12/17 31/12/16 %
Net assets value at the end of the period (NOK millions) 2,068 2,265 -9% 3,177 3,102 2%Net assets value at the end of the period (SGD millions) 337 380 -11% 517 520 -1%
Number of shares (millions) 1,180 1,180 0% 1,180 1,180 0%
Net assets value per ordinary share (NOK) 1.75 1.92 -9% 2.69 2.63 2%Net assets value per ordinary share (SGD) 0.29 0.32 -9% 0.44 0.44 0%
Exchange rates: 31/12/17 31/12/16 31/12/17 31/12/16SGD/NOK 6.141 5.965 3% 6.141 5.965 3%
The SGD amounts are translated from NOK based on the exchange rates prevailing at the reporting date as shown above.
Weighted average number of shares (in millions)
Adjusted weighted average number of shares (in millions)
The SGD amounts are translated from NOK based on the exchange rates prevailing at the reporting date as shown above.
Net assets value (for the Issuer and Group) per ordinary share based on issued share capital of the issuer at the end of the current financial periodreported on and immediately preceeding financial year:
Group Company
Group
Earnings per ordinary share (attributable to Equity holders of the Company) for the current financial period reported on and the correspondingperiod of the immediately preceeding financial year:
Group
Page 10 of 15

VARD HOLDINGS LIMITEDIncorporated in SingaporeCompany Registration No. 201012504K
Fourth Quarter and Full Year 2017 Financial StatementsUNAUDITED RESULTS FOR THE FOURTH QUARTER AND FULL YEAR ENDED 31 DECEMBER 2017(All amounts in NOK millions unless otherwise stated)
8 REVIEW OF GROUP PERFORMANCE
(a) Statement of comprehensive income:Revenues for 4Q 2017 were NOK 2.69 billion, up 25% from NOK 2.15 billion in 4Q 2016. Continuing the trend of the third quarter, 4Q 2017 has beencharacterized by high activity level at the yards located in Romania and Vietnam, compared to the corresponding period of 2016, due to rapidprogress on Module Carrier Vessels (MCV) projects for Topaz Energy and Marine and Kazmortransflot, and the ongoing construction on all sixexpedition cruise vessels contracted in 2016.
Revenues for FY2017 were NOK 8.60 billion, up 9% compared to the corresponding period of 2016. The reduced activity, especially at the Norwegianyards, as well as the cessation of operations in Vard Niterói during the third quarter of 2016, was more than compensated by the above-mentionedhigh activity level in Romania and Vietnam during the second half of 2017.
EBITDA, before restructuring cost, for the quarter was NOK 8 million for 4Q 2017 and NOK 163 million for FY2017, down from NOK 67 million for 4Q2016 and NOK 168 million for FY2016. The decrease is largely due to a reassessment of the net realisable value (NRV) of vessels held in inventory. Ifexcluding the effects of the reassessment of NRV, EBITDA before restructuring costs would have been NOK 62 million for 4Q 2017 and NOK 217million for FY2017 in line with the 4Q 2016 and up 29% compared to FY2016.
The EBITDA margin decreased from 3.1% in 4Q 2016 to 0.3% in 4Q 2017, and from 2.1% in FY2016 to 1.9% in FY2017. Excluding the impact of theabove mentioned reassessment, the EBITDA margin would have been 2.3% in 4Q 2017 and 2.5% in FY2017.
For the Group’s shipyards in Norway, while workload in engineering and procurement remains high, yard utilization will gradually increase whenhulls from Romania arrive in 1Q and 2Q 2018. During the quarter, Vard Group has secured a contract for the design and construction of one luxurypolar expedition cruise vessel for French cruise company PONANT to be delivered from Vard Søviknes. The same yard successfully delivered oneoffshore diving support and construction vessel to Kreuz Subsea during the quarter. Newbuilding activity is being supplemented by conversion,repair and maintenance work on a broad range of vessels, including coast guard, fisheries and offshore vessels. At Vard Langsten, the previouslyannounced maintenance program for the Norwegian Coast Guard is ongoing. Vard Brattvaag and Vard Electro have mounted and delivered oneupgrade to “Battery Power” notations of offshore vessels.
Romanian yards continue to record a very high workload, and is improving the load situation by increasing in headcount and adapting theorganization. After delivery of the hull for the first PONANT vessel to Vard Søviknes, Vard Tulcea is progressing with the construction of the otherfive expedition cruise vessels contracted during 2016. During the quarter, Vard Tulcea successfully launched and delivered a 9,500 tons hull sectionto Fincantieri and is progressing with the additional three hull sections under construction. Of the series of MCV’s, the first two vessels weredelivered from Vard Braila to Kazmortransflot during the third quarter, while the last of the series was delivered in January 2018. Vard Tulceadelivered its first two MCVs to Topaz Energy and Marine during the fourth quarter and the third was delivered during January 2018. Also Vard Brailahas since end-2017 delivered one MCV to the same client.
Rapid progress on the MCV projects was also seen in Vietnam where operations remained stable. Two MCVs were delivered to Topaz Energy andMarine from Vard Vung Tau during 4Q 2017, while one more was delivered in February 2018. The remaining two vessels in the series, to bedelivered from Vietnam, are under construction. Just after the end of the year, Vard Vung Tau has started the construction of the expedition cruisevessel for Coral Expeditions of Australia, contracted during the third quarter.
Vard Promar in Brazil delivered the fifth Liquefied Petroleum Gas (LPG) Carrier for Transpetro during the fourth quarter. Good progress was alsorecorded on the Pipelay Support Vessels (PLSV) under construction for Dofcon Navegação (DOF and TechnipFMC) and on the sixth LPG Carrier forTranspetro. The first PLSV is currently undergoing sea trial and is nearing completion. Rightsizing of the organization continued during the quarter,reflective of the lack of work in early stages of vessel under construction.
The strengthened positioning in the aquaculture market, yielded significant results in 4Q 2017 through a number of contract awards. In November,one service vessel for Midt-Norsk Havbruk with delivery in 2Q 2018, as well as two offshore fish farming operation platforms of own design forCermaq, scheduled for delivery from Vard Aukra in Q2 and Q3 2018 were secured. In early December, the yard secured the design and constructionof seven stern trawlers for four Icelandic shipowners, Bergur-Huginn, Utgerdarfelag Akureyringa, Gjögur and Skinney-Thinganes, scheduled fordelivery from Vard Aukra in 2019. In December, Vard Aukra also announced contracts for two freight-and-service vessels for FSV Group, to bedelivered in 3Q 2018 and 1Q 2019 respectively. These achievements are testament of the market recognition and appreciation for VARD’sinnovative approach to these market segments.
Page 11 of 15

VARD HOLDINGS LIMITEDIncorporated in SingaporeCompany Registration No. 201012504K
Fourth Quarter and Full Year 2017 Financial StatementsUNAUDITED RESULTS FOR THE FOURTH QUARTER AND FULL YEAR ENDED 31 DECEMBER 2017(All amounts in NOK millions unless otherwise stated)
(a) Statement of comprehensive income (cont.)
(b) Statement of financial position:
(c) Statement of cash flows:
Cash flows from operating activities were NOK 27 million positive in 4Q 2017, compared to NOK 617 million positive in 4Q 2016. For FY2017, cashflows from operating activities were NOK 31 million negative, compared to NOK 764 million positive in the corresponding period of 2016. Cash flowsfrom operating activities can fluctuate significantly from period to period due to changes in working capital.
Cash flows used in investing activities amounted to NOK 77 million in 4Q 2017, compared to NOK 151 million in 4Q 2016. Cash flows used ininvesting activities were NOK 339 million in FY2017, compared to NOK 311 million in the corresponding period of 2016. Investments in property,plant and equipment during 2017 were mainly related to the expansion of facilities at Vard Tulcea.
Cash flows from financing activities were NOK 28 million negative in 4Q 2017, compared to NOK 288 million negative in 4Q 2016. For the year ended31 December 2017, the Group had positive cash flows from financing activities of NOK 467 million, compared to NOK 587 million negative in thecorresponding period of 2016. The Group has not obtained any new non-current loans during the quarter. Out of NOK 358 million in repayments ofloans and borrowings during the full year 2017, NOK 208 million relate to instalments paid on non-current loans.
Because of the aforementioned reasons, the cash and cash equivalents at the end of the financial period were equal to NOK 810 million for theperiod ended 31 December 2017 (31 December 2016: NOK 722 million).
Total assets were NOK 14.92 billion as of 31 December 2017, up from NOK 13.52 billion as of 31 December 2016.
Total non-current assets increased marginally from NOK 3.89 billion as of 31 December 2016 to NOK 4.18 billion as of 31 December 2017.
Total current assets were NOK 10.75 billion as of 31 December 2017, up from NOK 9.63 billion as of 31 December 2016, as a result of increase ininventories and construction WIP in excess of prepayments partially offset by decrease in other current assets.
Total non-current liabilities have increased by 19% from NOK 1.87 billion as of 31 December 2016 to NOK 2.22 billion as of 31 December 2017primarily due to (i) the extension of the slot reservation fee received from FINCANTIERI related to the multi-year program started in 2016, and (ii)the increase of the negative fair value of the non-current derivatives.
Total current liabilities have increased from NOK 9.36 billion end of 31 December 2016 to NOK 10.61 billion end of 31 December 2017. The increaseis mainly driven by the utilization of construction loans and current loans and borrowings, partially offset by the decrease in current derivatives. Thegroup is expecting construction loans to continue to increase as activity levels are picking up. During the fourth quarter, the group obtained four newconstruction loans, and additional construction loans are being negotiated in the normal course of business.
Restructuring costs of NOK 12 million in the quarter and NOK 33 million for the year ended 31 December 2017 are related to termination benefitsand statutory payments for temporary redundancies, mainly in Norway and Brazil.
Depreciation and amortization costs for the quarter and for the full year 2017 are increasing, compared with the corresponding periods of last year,consequent of the gradual completion of the ongoing investments.
As a consequence of the items discussed above, the operating loss is equal to NOK 59 million in 4Q 2017 and NOK 91 million in FY2017, increasingfrom a loss of NOK 14 million in 4Q 2016 and recovering from a loss of NOK 142 million in FY2016.
The net financial items went from NOK 3 million negative in 4Q 2016 to NOK 69 million negative in 4Q 2017, and from NOK 41 million positive for fullyear 2016 to NOK 106 million negative for the year ended 31 December 2017. The change is primarily related to foreign exchange gains and losses.For the year ended 31 December 2017, there is a net foreign exchange gain of NOK 25 million, which includes NOK 11 million loss related to the yardconstruction loan in Vard Promar denominated in USD (2016: NOK 191 million gain). In the corresponding period of last year, the group had a netforeign exchange gain of NOK 25 million.
Share of results of associates were NOK 47 million negative in FY2017, due to the losses in associated ship-owning entities, and reflecting theprolonged down-turn in the offshore market.
Because of the aforementioned reasons, the loss for the period was NOK 133 million in 4Q 2017 and NOK 238 million for the year ended 31December 2017, compared to a loss of NOK 69 million in 4Q 2016 and NOK 197 million for the year ended 31 December 2016.
Page 12 of 15

VARD HOLDINGS LIMITEDIncorporated in SingaporeCompany Registration No. 201012504K
Fourth Quarter and Full Year 2017 Financial StatementsUNAUDITED RESULTS FOR THE FOURTH QUARTER AND FULL YEAR ENDED 31 DECEMBER 2017(All amounts in NOK millions unless otherwise stated)
9 VARIANCE FROM FORECAST STATEMENT
10 PROSPECTS
11 DIVIDEND
(a) Current financial period reported on:
Any dividend declared for the current financial period reported on?
(b) Corresponding period of preceding financial year:
(c) Date payable
(d) Book closure date
The Company has not disclosed any forecast to the market.
No
Any dividend declared for the corresponding period of the immediately preceding financial year?
Not applicable
Not applicable
At the end of 2017, the order book value amounted to NOK 13.23 billion, up from NOK 12.65 billion at the end of 2016. Aggregate order value at theend of the quarter was NOK 24.68 billion, and the order book comprised 48 vessels, of which 37 will be of VARD’s own design. Order intake in thefull year ended 31 December 2017 was NOK 8.28 billion whereof NOK 3.79 billion in 4Q 2017.
VARD is well positioned in the growing expedition cruise vessel market. In fisheries and aquaculture, the Group is strengthening its market positionthrough valuable cooperation with clients.
The offshore market is still considered challenging, but there are positive signs of recovery in the medium to long term in the broader oil & gasindustry. However, risks are still inherent in the Group’s existing offshore project portfolio. The Group postponed delivery of some projects amidongoing financial restructurings of clients in the offshore segment.
The difficult political and economic context and complex regulatory environment in Brazil, still represents a challenge to the Brazilian operation. With its SeaQTM Energy Storage System, Vard Electro is establishing a solid position within hybrid battery solutions.
Negotiations are continuing with the Norwegian Government for three Coast Guard vessels.
No
Page 13 of 15

VARD HOLDINGS LIMITEDIncorporated in SingaporeCompany Registration No. 201012504K
Fourth Quarter and Full Year 2017 Financial StatementsUNAUDITED RESULTS FOR THE FOURTH QUARTER AND FULL YEAR ENDED 31 DECEMBER 2017(All amounts in NOK millions unless otherwise stated)
12 SEGMENT ANALYSIS AND GEOGRAPHICAL INFORMATION
Revenues from external customers FY 2017 FY 2016Norway 6,713 5,267 Romania 578 528 Singapore* 53 384 Vietnam* - - Brazil 988 1,484 Canada 175 138 Italy 40 66 USA 35 19 Other countries 21 8 Total 8,603 7,894
- -
13 REVIEW OF SEGMENT PERFORMANCE
14 SALES BREAKDOWNChange
%
Sales reported first half year 3,905 4,241 -8%Operating profit first half year before deducting non-controlling interests (23) (83) -72%Sales reported second half year 4,698 3,653 29%Operating profit second half before deducting non-controlling interests (68) (59) 15%
15 BREAKDOWN OF TOTAL ANNUAL DIVIDEND
FY 2017 FY 2016SGD million SGD million
Interim special dividend - - Final ordinary dividend - - Total - -
The Group has activity in 14 countries (2016: 14). Segmental revenue is based on the geographical location of companies within the Group.
Group
* Revenues from Singapore and Vietnam must be considered in total, as Vietnam operates principally as a subcontractor of the Singapore company.
Please refer to paragraph 8 above.
Group
FY 2017 FY2016
A breakdown of the total annual dividend (in dollar value) for the issuer's latest full year and its previous full year:
The Group has only one reportable segment, segment information for business segments is therefore not applicable.
Page 14 of 15
VARD HOLDINGS LIMITEDIncorporated in SingaporeCompany Registration No. 201012504K
Fourth Quarter and Full Year 2017 Financial StatementsUNAUDITED RESULTS FOR THE FOURTH QUARTER AND FULL YEAR ENDED 31 DECEMBER 2017(All amounts in NOK millions unless otherwise stated)
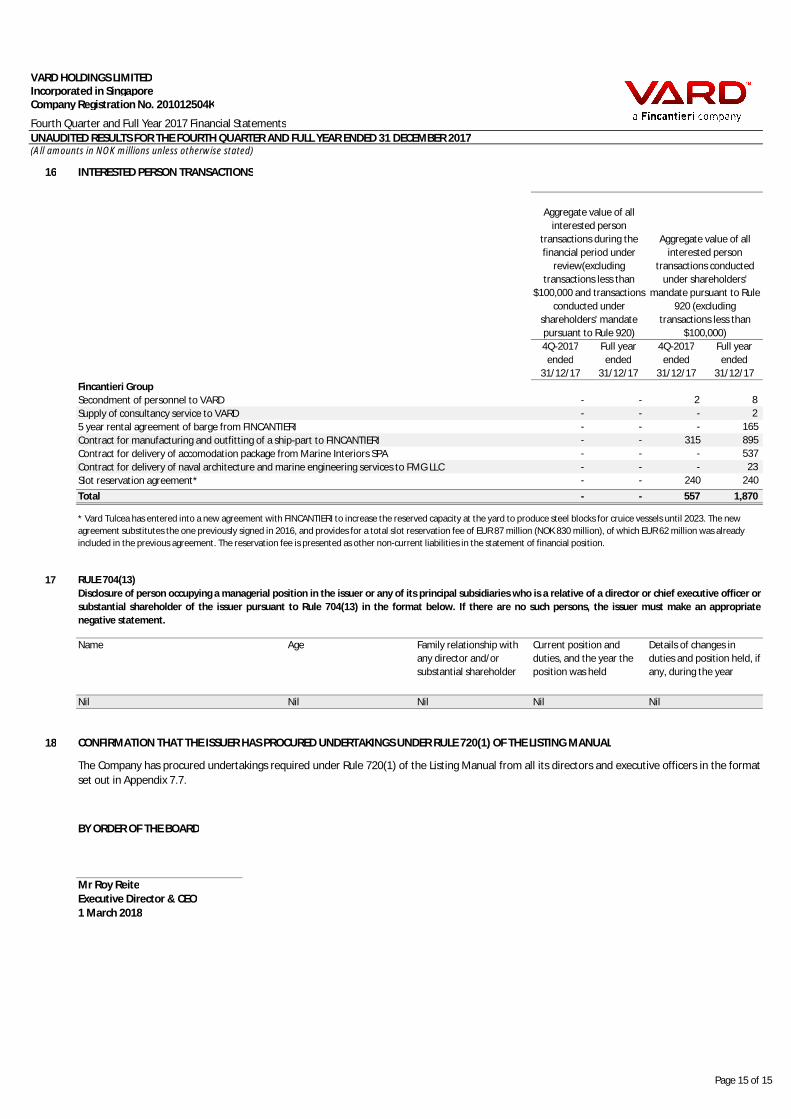
16 INTERESTED PERSON TRANSACTIONS
4Q-2017 Full year 4Q-2017 Full yearended ended ended ended
31/12/17 31/12/17 31/12/17 31/12/17Fincantieri GroupSecondment of personnel to VARD - - 2 8 Supply of consultancy service to VARD - - - 2 5 year rental agreement of barge from FINCANTIERI - - - 165 Contract for manufacturing and outfitting of a ship-part to FINCANTIERI - - 315 895 Contract for delivery of accomodation package from Marine Interiors SPA - - - 537 Contract for delivery of naval architecture and marine engineering services to FMG LLC - - - 23 Slot reservation agreement* - - 240 240 Total - - 557 1,870
17 RULE 704(13)
Name Age
Nil Nil Nil Nil Nil
18
BY ORDER OF THE BOARD
Mr Roy ReiteExecutive Director & CEO1 March 2018
Aggregate value of all interested person
transactions during the financial period under
review(excluding transactions less than
$100,000 and transactions conducted under
shareholders' mandate pursuant to Rule 920)
Aggregate value of all interested person
transactions conducted under shareholders'
mandate pursuant to Rule 920 (excluding
transactions less than $100,000)
CONFIRMATION THAT THE ISSUER HAS PROCURED UNDERTAKINGS UNDER RULE 720(1) OF THE LISTING MANUAL
Disclosure of person occupying a managerial position in the issuer or any of its principal subsidiaries who is a relative of a director or chief executive officer orsubstantial shareholder of the issuer pursuant to Rule 704(13) in the format below. If there are no such persons, the issuer must make an appropriatenegative statement.
Family relationship with any director and/or substantial shareholder
Current position and duties, and the year the position was held
Details of changes in duties and position held, if any, during the year
* Vard Tulcea has entered into a new agreement with FINCANTIERI to increase the reserved capacity at the yard to produce steel blocks for cruice vessels until 2023. The new agreement substitutes the one previously signed in 2016, and provides for a total slot reservation fee of EUR 87 million (NOK 830 million), of which EUR 62 million was already included in the previous agreement. The reservation fee is presented as other non-current liabilities in the statement of financial position.
The Company has procured undertakings required under Rule 720(1) of the Listing Manual from all its directors and executive officers in the formatset out in Appendix 7.7.
Page 15 of 15