fourth quarter & full-year 2019 financial results
TRANSCRIPT

Fourth Quarter & Full-Year 2019 Financial Results Mark Costa, Board Chair & CEOCurt Espeland, EVP & CFOWillie McLain, VP, Finance January 31, 2020
During this presentation, we make certain forward-looking statements concerning plans and expectations for Eastman Chemical
Company. We caution you that actual events or results may differ materially from our plans and expectations. See these slides and the
remarks in the conference call and webcast, the fourth quarter and full year 2019 financial results 8-K and news release, and our Form
10-K for 2018 and Form 10-Q filed for third quarter 2019 and the Form 10-K to be filed for full-year 2019 for risks and uncertainties
which could cause actual results to differ materially from current plans and expectations.
Earnings referenced in this presentation exclude certain non-core and unusual items. In addition, fourth quarter and full-year 2019
and fourth quarter and full-year 2018 earnings per share are calculated with an adjusted tax rate that excludes the provision for
income taxes for non-core and unusual items. “Free Cash Flow” is cash provided by operating activities minus net capital
expenditures (typically cash used for additions to properties and equipment). Reconciliations to the most directly comparable GAAP
financial measures and other associated disclosures, including a description of the excluded and adjusted items, are available in our
fourth quarter 2019 financial results news release available in the “Investors” section of our website and in the “Management’s
Discussion and Analysis of Financial Condition and Results of Operations” sections of the Forms 10-K and 10-Q filed with the SEC
for the periods for which non-GAAP financial measures are presented. Projections of future earnings exclude any non-core, unusual,
or non-recurring items.
Forward-looking statements
GAAP and Non-GAAP financial measures
2

3
Full-year 2019 highlights
Celebrating Eastman’s 100th Year
Solid earnings growth in Advanced Materials, demonstrating resilience of our specialty products
Completed two bolt-on acquisitions, Marlotherm and INACSA
$1.08 billion in free cash flow
Accelerated cost management offset inflation and improved results
Returned $668 million to stockholders and repaid $370 million of debt
Increased dividend for tenth consecutive year
New Business Revenue from Innovation approximately $400 million
4
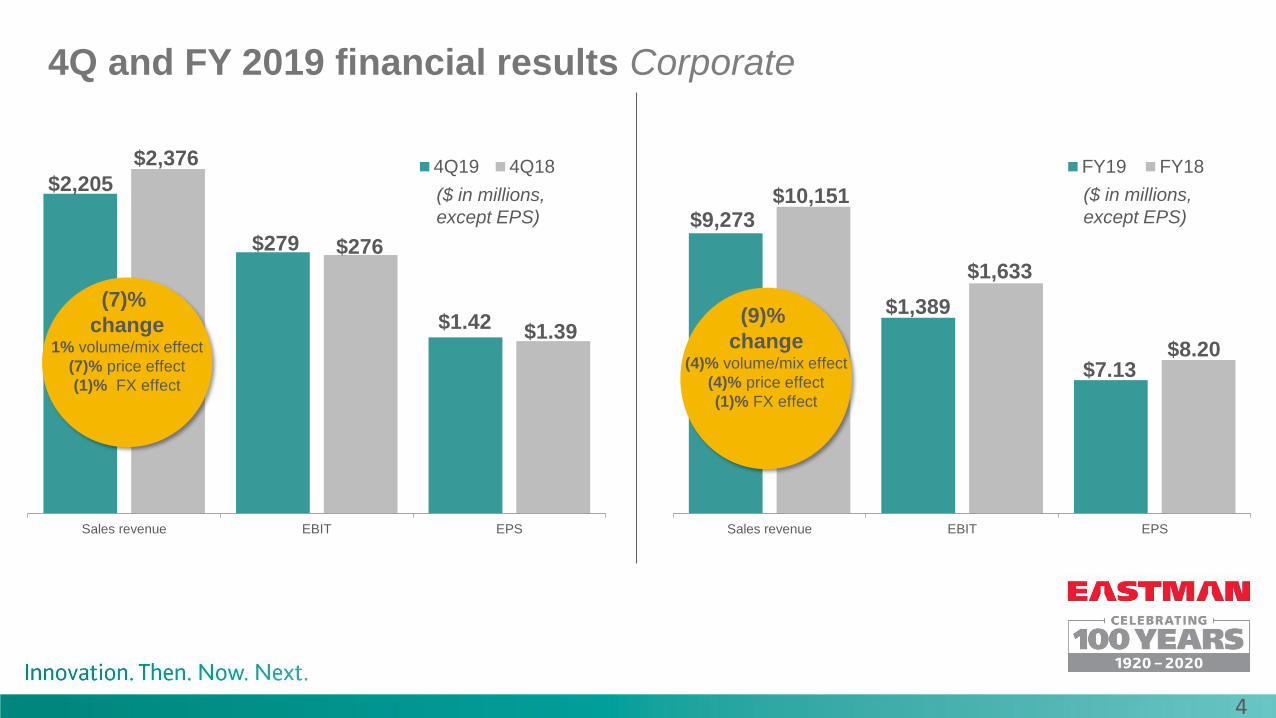
Sales revenue EBIT EPS
4Q19 4Q18
$279
$1.42
($ in millions,
except EPS)
$2,376
$276
$1.39
(7)%
change1% volume/mix effect
(7)% price effect
(1)% FX effect
4Q and FY 2019 financial results Corporate
Sales revenue EBIT EPS
FY19 FY18
$9,273
$1,389
$7.13
$10,151
$1,633
$8.20
(9)%
change(4)% volume/mix effect
(4)% price effect
(1)% FX effect
($ in millions,
except EPS)
$2,205

5
Sales revenue EBIT
FY19 FY18$2,688
$518
$2,755
$501
FY 2019 financial results Advanced Materials
($ in millions)
(2)%
change(1)% volume/mix effect
(1)% FX effect
▪ Revenue decreased due to slightly lower
sales volume and an unfavorable shift in
foreign currency exchange rates
▪ EBIT increased primarily due to lower raw
material costs and favorable product mix
due to increased sales of premium products
partially offset by an unfavorable shift in
foreign currency exchange rates

6
Sales revenue EBIT
FY19 FY18
$3,273
$550
$3,647
$671
FY 2019 financial results Additives & Functional Products
($ in millions)
(10)%
change(5)% volume/mix effect
(3)% price effect
(2)% FX effect
▪ Revenue decreased primarily due to lower
sales volume, lower selling prices, and an
unfavorable shift in foreign currency
exchange rates
▪ EBIT decreased primarily due to lower sales
volume, less favorable product mix, and an
unfavorable shift in foreign currency
exchange rates

7
Sales revenue EBIT
FY19 FY18
$2,443
$192
$2,831
$278
FY 2019 financial results Chemical Intermediates
($ in millions)
(14)%
change(4)% volume/mix effect
(9)% price effect
(1)% FX effect
▪ Sales revenue decreased primarily due to
lower selling prices across the segment
attributed to lower raw material prices and
increased competitive activity. Sales
revenue was also negatively impacted by
increased competitive pressure in some
intermediates and wet weather in North
America impacting agriculture end markets
▪ EBIT decreased primarily due to lower
spreads and lower sales volume, partially
offset by the benefits from the recent
refinery-grade propylene investment

8
Sales revenue EBIT
FY19 FY18
$869
$194
$918
$219
FY 2019 financial results Fibers
($ in millions)
(5)%
change(4)% volume/mix effect
(1)% price effect
▪ Sales revenue decreased primarily due to
lower acetate tow sales volume attributed to
weakened market demand resulting from
general market decline and customer buying
patterns
▪ EBIT decreased primarily due to lower
acetate tow sales volume

9
Returned
$668 million
to stockholders:
$343 million dividend,
$325 million
share repurchases
2019 cash flow and other financial highlights
$1.5billion
cash from operations
$1.08billion
Free cash flow
Repaid
$370 million
of debt
FY19 effective tax rate of
~15.5%

10
Growth drivers
▪ Sales volume growth driven by:
▪ Strong growth in new business
revenue
▪ Less customer inventory destocking
in 2020 compared with 2019
▪ Stable growth in some end markets
▪ Actions to reduce costs by
$20-$40 million
▪ Lower pension costs
▪ Lower depreciation
Near-term headwinds
▪ Lower product spreads in
Chemical Intermediates and
1/3rd of AFP identified for
improvement actions
▪ Higher variable compensation
and benefit costs
▪ Stronger U.S. dollar
Projected 2020 free cash flow $1.0 billion to $1.1 billion
Projected full-year 2020 adjusted EPS $7.20 to $7.60
2020 outlook

• Approximately $400 million new business revenue from innovation in 2019
• On track to approach $500 million in 2020
• Led by products like Tritan™ copolyester, SAFLEX™ acoustic interlayers, LLUMAR™ paint protection film in Advanced Materials, and NAIA™ cellulosic yarn in Fibers
• Additives & Functional Products making encouraging progress
• Creating a new vector of growth for the company with investments in Circular Economy
11
New Business Revenue
from innovation

12
Building a more capable and efficient organization
Source: company filings, Bloomberg
Peers: Albemarle, Ashland, Celanese, DuPont, FMC, WR Grace
Peer A Eastman Peer B Peer C Peer D Peer E Peer F
(SGA + RD)/REVENUE relative to peers (2018)• Building our commercial capability
• Implemented new business operating model
• CRM investment
• Application development investments accelerating commercialization of innovation programs
• Reducing cost structure by >$100 million over next 3 years ($20 - $40 million in 2020)
• Site optimization
• Singapore facility
• Other sites under consideration in 1/3rd of AFP identified for improvement actions
• Digital and other productivity investments
• Supply chain optimization
13
Actions we are taking to improve multi-year performance
▪ Leveraging our sites – expected to contribute $30 - $60 million to
EBIT over next 3 years
▪ Texas City, TX
▪ St. Gabriel, LA
▪ Additional projects in pipeline
▪ Licensing – expect $25 - $50 million of revenue over next 3 years
▪ Rich portfolio of innovative technologies
▪ Strong history of licensing
▪ Portfolio optimization
▪ 1/3rd of AFP – more detail to come

14
World-Class
Technology
Platforms
Relentlessly
Engage
the Market
Differentiated
Application
Development
Significant integration and scale enable innovation, reliability and cost advantage
Advantaged growth and execution capability and culture
Aggressive and disciplined portfolio management
Unique innovation-driven growth model delivers consistent, sustainable value

Appendix

16
Key underlying assumptions and guidance for FY2020
▪ Interest expense of approximately $215 million
▪ Income tax rate, as adjusted, similar to 2019
▪ Depreciation and amortization of approximately $560 million
▪ Capital expenditures between $450 and $475 million
▪ Free Cash Flow between $1.0 and $1.1 billion
▪ Debt reduced >$400 million
▪ Similar economic growth in 2020 compared to 2019
▪ Brent crude oil prices similar to current levels
▪ Euro to USD ~$1.10
Key assumptions:
Modeling items:

Q120 Q220 Q320 Q420 FY2020
Fibers - - - - -
Advanced Materials - (5) - (5) (10)
Chemical Intermediates - (15) 5 15 5
Additives & Functional Products - 5 (5) 5 5
Total - (15) - 15 -
2020 vs 2019 favorable/(unfavorable) approximate change in manufacturing maintenance
shutdown period expense, in millions ($)
17
Quarterly forecasted change in manufacturing maintenance shutdown cost by segment