fourth quarter 2015 earnings presentationir.cboe.com/...ir-v2/press...earnings-slides-final.pdf ·...
TRANSCRIPT

Fourth Quarter 2015
Earnings Presentation
February 3, 2016

2CBOE HOLDINGS
Agenda
Strategic Review Edward TillyChief Executive Officer
Financial Review Alan DeanExecutive Vice President,
CFO and Treasurer
Questions and Answers Edward Tilly
Alan Dean
Edward Provost
President and Chief Operating Officer
John Deters
Chief Strategy Officer and
Head of Corporate Initiatives

3CBOE HOLDINGS
Forward-Looking Statements
This presentation may contain forward-looking statements, within the meaning of the Private Securities
Litigation Reform Act of 1995. Forward-looking statements are those statements that reflect our
expectations, assumptions or projections about the future and involve a number of risks and uncertainties.
These statements are only predictions based on our current expectations and projections about future
events. We undertake no obligation to update or revise any forward-looking statements, whether as a result
of new information, future events or otherwise. There are important factors that could cause actual results,
level of activity, performance or achievements to differ materially from that expressed or implied by the
forward-looking statements, including: the loss of our right to exclusively list and trade certain index options
and futures products; increasing price competition in our industry; compliance with legal and regulatory
obligations and obligations under agreements with regulatory agencies; decreases in trading volumes or a
shift in the mix of products traded on our exchanges; our ability to accommodate trading volume and
transaction traffic, including significant increases, without failure or degradation of performance of our
systems; our ability to meet our compliance obligations, including managing potential conflicts between our
regulatory responsibilities and our for-profit status; the accuracy of our estimates and expectations;
legislative or regulatory changes; increasing competition by foreign and domestic entities; our index
providers’ ability to perform under our agreements; our ability to operate our business without violating the
intellectual property rights of others and the costs associated with protecting our intellectual property rights;
our ability to maintain access fee revenues; our ability to protect our systems and communication networks
from security risks, including cyber-attacks; economic, political and market conditions; our ability to attract
and retain skilled management and other personnel; our ability to manage our growth effectively; our
dependence on third party service providers; and the ability of our compliance and risk management
methods to effectively monitor and manage our risks.
More detailed information about factors that may affect our performance may be found in our filings with the
U.S. Securities and Exchange Commission, including in our Annual Report on Form 10-K for the year ended
December 31, 2014 and other filings made from time to time with the SEC.

Strategic Review
Edward Tilly
CEO
5CBOE HOLDINGS
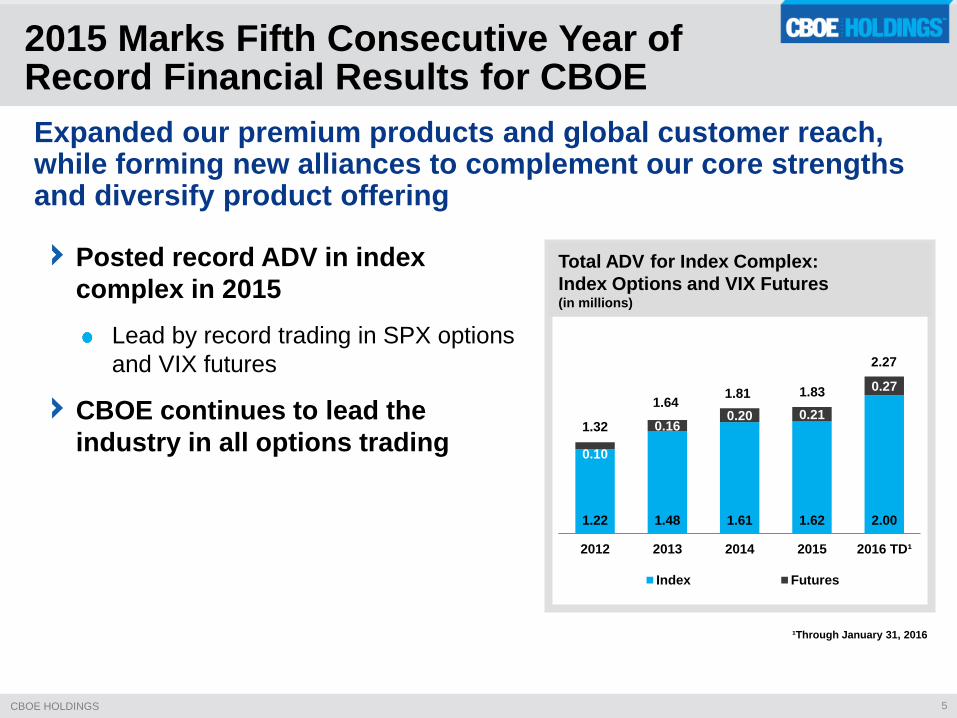
Expanded our premium products and global customer reach, while forming new alliances to complement our core strengths and diversify product offering
Posted record ADV in index
complex in 2015
Lead by record trading in SPX options
and VIX futures
CBOE continues to lead the
industry in all options trading
2015 Marks Fifth Consecutive Year ofRecord Financial Results for CBOE
1.22 1.48 1.61 1.62 2.00
0.10
0.160.20 0.21
0.27
2012 2013 2014 2015 2016 TD¹
Index Futures
1.641.81
1.32
1.83
2.27
¹Through January 31, 2016
Total ADV for Index Complex:
Index Options and VIX Futures(in millions)

6CBOE HOLDINGS
• Develop unique products
• Expand our customer base globally
• Form alliances that leverage and complement our core business
• Define and lead the options and volatility space globally
Strategic Initiatives
Translating our Mission and
Strategic Initiatives into Value
Our mission is to be the market leader in providing
innovative products that facilitate and enhance
trading in a global marketplace

7CBOE HOLDINGS
Further Developing Current Products toGrow Index Product Line
S&P 500 Index (SPX) options, the most
actively traded U.S. index option
SPX ADV up 6% year over year in 2015
January ADV up 19% over January 2015
SPX Weeklys ADV up 24% year over year
Attracted retail investors to largely
institutional SPX marketplace
Plan to introduce SPX Weeklys with
Wednesday Expirations
“Wednesday Weeklys” will increase
opportunities to trade SPX
784698
823888 939
1,163
2011 2012 2013 2014 2015 2016 TD¹
SPX ADV* by Year (in thousands)
*Includes SPX Weeklys
¹Through January 31, 2016
8CBOE HOLDINGS
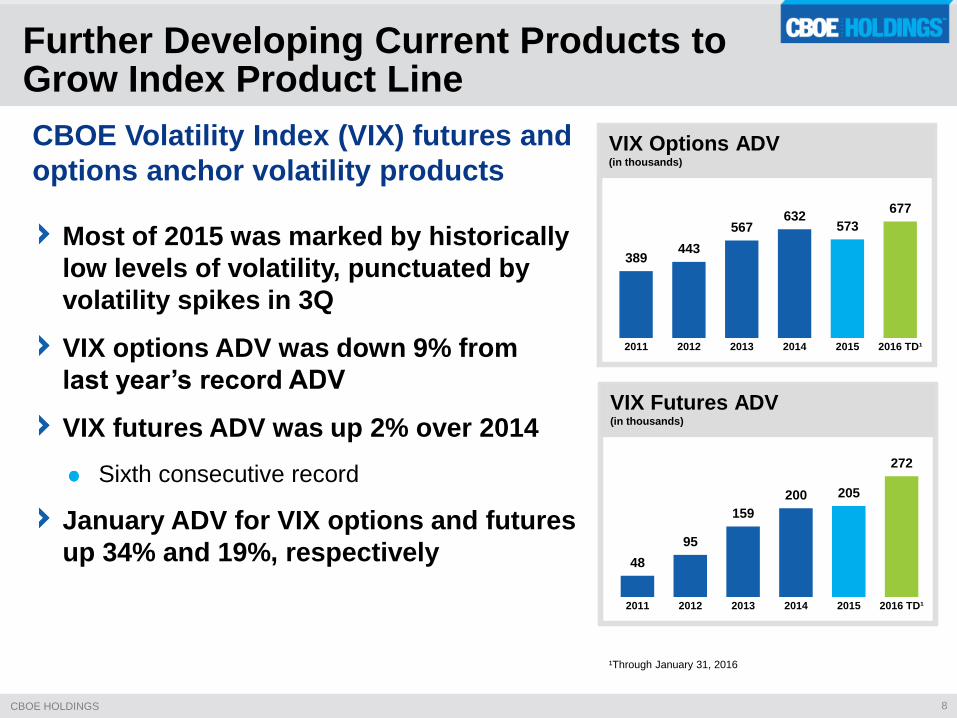
Further Developing Current Products toGrow Index Product Line
CBOE Volatility Index (VIX) futures and
options anchor volatility products
Most of 2015 was marked by historically
low levels of volatility, punctuated by
volatility spikes in 3Q
VIX options ADV was down 9% from
last year’s record ADV
VIX futures ADV was up 2% over 2014
Sixth consecutive record
January ADV for VIX options and futures
up 34% and 19%, respectively 48
95
159
200 205
272
2011 2012 2013 2014 2015 2016 TD¹
Chart TitleVIX Futures ADV(in thousands)
¹Through January 31, 2016
389443
567632
573
677
2011 2012 2013 2014 2015 2016 TD¹
Chart TitleVIX Options ADV(in thousands)

9CBOE HOLDINGS
VIX Weeklys expand array of trading strategies and opportunities to trade volatility
Launched VIX Weeklys futures in July, options in October
VIX Weeklys options averaged nearly 35,000 contracts per
day in 2015
Plan to begin overnight dissemination of “spot” VIX Index
Allows overseas investors to reference VIX during their regular
trading hours
Leveraging VIX Methodology to CreateNew Products and Grow Index Product Line

10CBOE HOLDINGS
Sole U. S. provider of major FTSE Russell Products, beginning
with Russell 2000 Index (RUT) on April 1
Focused on further developing RUT
marketplace
Launched Russell 1000 Growth and
Value indexes in October
FTSE 100 and FTSE China 50
indexes to launch next month
Leveraging Partnerships With Index Providers to Grow Index Product Line
Source: OCC and CBOE
68
83 86 91
114
88
71 7175
106
Jan'15
Feb Mar Apr May Jun Jul Aug Sept Oct Nov Dec Jan'16
CBOE and C2 RUT ADV Other RUT ADV
RUT Options ADV Industrywide(in thousands)
80 8185

11CBOE HOLDINGS
Teamed with London Stock Exchange Group (LSEG) and major dealer
banks to form CurveGlobal, a new interest rate derivatives platform
Products will trade on the LSE Derivatives Market and clear
through LCH.Clearnet
Expected to provide more product choices, increased trading
efficiencies and reduced transition costs
CBOE plans to develop products suited for this venue and
introduce the platform to our U.S. customer base
Planned to launch in 2Q16
Forming Alliances that Leverage our Strengths

12CBOE HOLDINGS
Teamed with Environmental Financial Products (EFP) to launch American Financial Exchange (AFX), an interbank lending exchange
Forming Alliances to Develop New Products and Markets
AFX is an electronic marketplace for small and mid-sized banks to
lend and borrow short-term funds
CBOE hosts and operates the AFX trading platform and also
supports surveillance and membership services
Total value of $326 million transacted in January, the first full
month of trading
In 2016, AFX plans to launch a 30-day unsecured loan product and
a new transaction-based interest rate benchmark, Ameribor

13CBOE HOLDINGS
Launched the first extension of CBOE’s Options Institute with
Singapore Exchange (SGX) in December
In 2015, expanded CBOE Risk Management Conference (RMC) to
include Asia
First RMC Asia held in Hong Kong in December
In 2016, CBOE plans to establish its first international business
development outpost with the opening of an office in London
Expanding Our Global Customer Base
Expanding outreach and investor education around the world

14CBOE HOLDINGS
CBOE made a majority equity investment in Vest Financial (VEST),
an investment advisor that provides options-centric products
Vest through its subsidiaries provides:
Options-based investment advisory services through packaged products
Develops technology solutions for options-based investments
Vest allows for enhanced integration of CBOE’s proprietary products,
strategy indexes and options expertise with Vest’s platform
Substantially reduces the complexity of options trading
Provides investors with targeted protection, enhanced returns, and a level of
predictability unattainable with most other investments
Expanding Options and Volatility Trading

15CBOE HOLDINGS
Focused on Advancing our
Strategic Growth Initiatives
Excited About Opportunities for 2016 and Beyond
• Develop unique products
• Expand our customer base globally
• Form alliances that leverage and complement our core business
• Define and lead the options and volatility space globally
Strategic Initiatives

Financial Review
Alan Dean
EVP, CFO and Treasurer

17CBOE HOLDINGS
4Q15 Financial Overview
Adjusted Basis¹(in millions, except EPS and RPC)
4Q15 4Q14 $ Change % Change
Adjusted Operating Revenues $154.0 $166.5 $(12.5) -8%
Adjusted Operating Expenses 80.1 77.7 2.4 3%
Adjusted Operating Income $ 73.9 $ 88.8 $(14.9) -17%
Adjusted Operating Margin % 48.0% 53.4% -540 bps
Adjusted Net Income Allocated to
Common Stockholders $ 48.9 $ 53.6 $ (4.7) -9%
Adjusted Diluted EPS $ 0.59 $ 0.64 $(0.05) -8%
Total ADV 4.25 5.64 -25%
Revenue per Contract $0.408 $0.340 $0.068 20%
¹Adjusted to reflect the impact of certain items. See Appendix for “Non-GAAP Information.”
18CBOE HOLDINGS
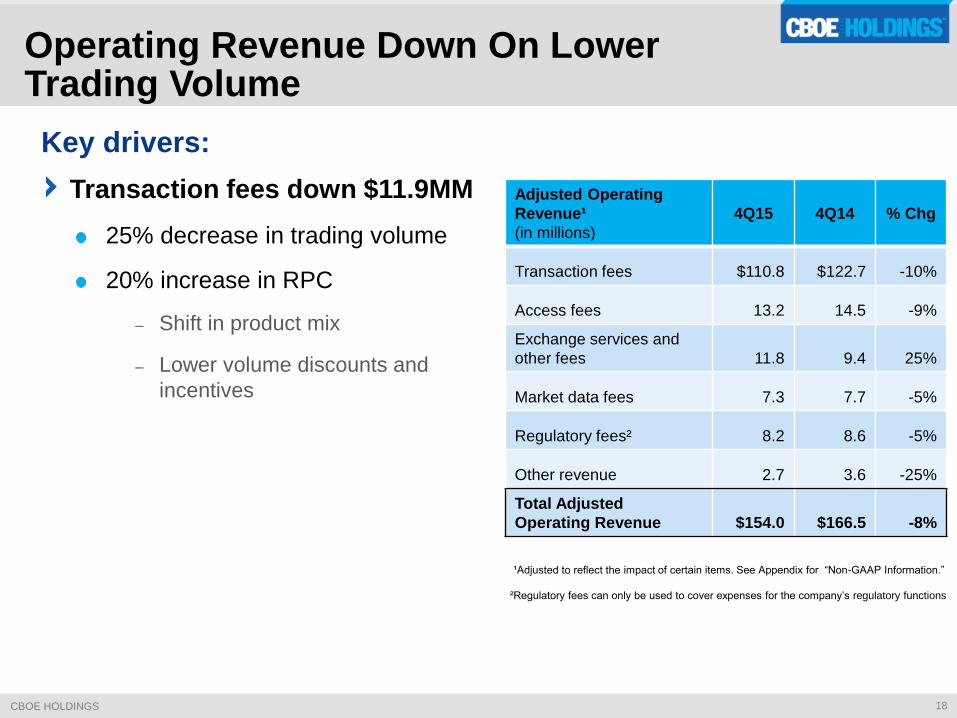
Operating Revenue Down On LowerTrading Volume
Transaction fees down $11.9MM
25% decrease in trading volume
20% increase in RPC
– Shift in product mix
– Lower volume discounts and
incentives
Adjusted Operating
Revenue¹
(in millions)
4Q15 4Q14 % Chg
Transaction fees $110.8 $122.7 -10%
Access fees 13.2 14.5 -9%
Exchange services and
other fees 11.8 9.4 25%
Market data fees 7.3 7.7 -5%
Regulatory fees² 8.2 8.6 -5%
Other revenue 2.7 3.6 -25%
Total Adjusted
Operating Revenue $154.0 $166.5 -8%
¹Adjusted to reflect the impact of certain items. See Appendix for “Non-GAAP Information.”
²Regulatory fees can only be used to cover expenses for the company’s regulatory functions
Key drivers:

19CBOE HOLDINGS
RPC Increase Primarily Reflects Mix Shiftand Lower Volume Discounts
Trading volume mix and RPC 4Q14 versus 4Q15
Equity33.8%
ETPs25.3%
Index36.5%
Futures4.4%
Equity34.4%
ETPs30.3%
Index31.1%
Futures 4.2%
4Q14

20CBOE HOLDINGS
Proprietary Products Account for Growing
Percentage of Transaction Fee Revenue
Index options and futures contracts accounted for 83.1%
of transaction fees in 4Q15 and 82.9% for full-year 2015

21CBOE HOLDINGS
Other Revenue Drivers
Access fees down $1.3MM
Decrease in trading permits
Exchange services up $2.4MM
Higher revenue from systems
services and Livevol
Adjusted Operating
Revenue¹
(in millions)
4Q15 4Q14%
Chg
Transaction fees $110.8 $122.7 -10%
Access fees 13.2 14.5 -9%
Exchange services and
other fees 11.8 9.4 25%
Market data fees 7.3 7.7 -5%
Regulatory fees 8.2 8.6 -5%
Other revenue 2.7 3.6 -25%
Total Adjusted
Operating Revenue $154.0 $166.5 -8%
¹Adjusted to reflect the impact of certain items. See Appendix for “Non-GAAP Information.”

22CBOE HOLDINGS
Ongoing Focus on Expense Management
Key drivers:
Professional fees and outside
services up $4.4MM
Depreciation and amortization up
$1.1MM
Royalty fees down $1.5MM
Compensation and benefits down
$0.7MM
Adjusted Operating
Expenses¹(in millions)
4Q15 4Q14 % Chg
Compensation and
benefits $26.8 $27.5 -2%
Depreciation and
amortization 12.2 11.1 10%
Technology support
services 5.2 4.9 6%
Professional fees and
outside services 12.9 8.5 52%
Royalty fees 17.8 19.3 -8%
Order routing 0.3 0.9 -66%
Travel and promotional 2.5 2.7 -7%
Facilities costs 1.4 1.4 --
Other expenses 0.9 1.4 -36%
Total Adjusted
Operating Expenses $80.1 $77.7 3%
¹Adjusted to reflect the impact of certain items. See appendix for “Non-GAAP Information.”
May not foot due to rounding.
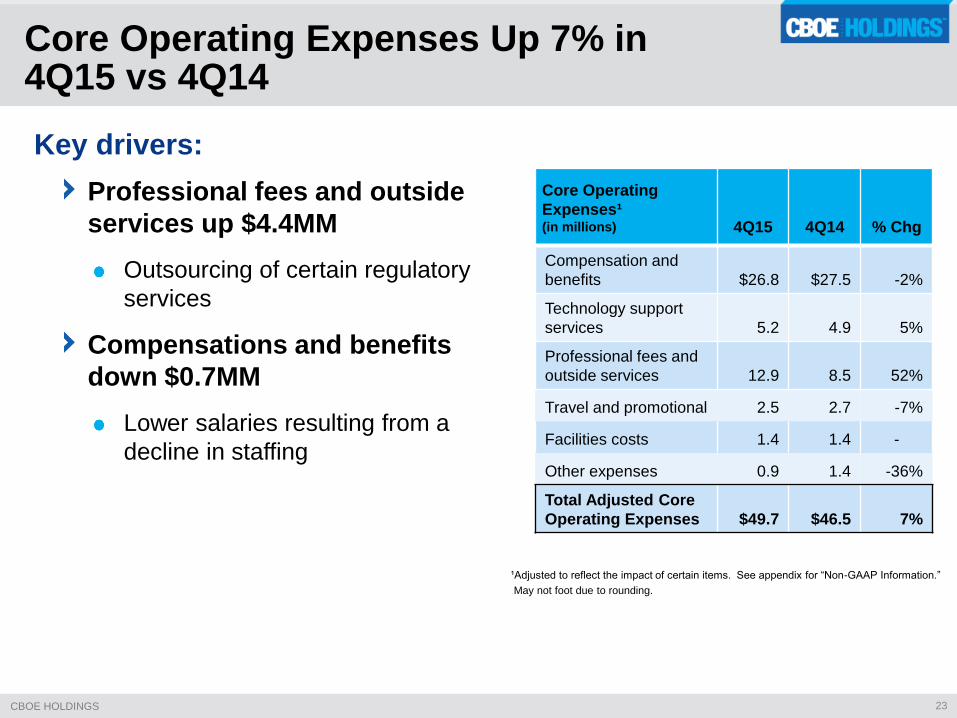
23CBOE HOLDINGS
Key drivers:
Core Operating
Expenses¹(in millions) 4Q15 4Q14 % Chg
Compensation and
benefits $26.8 $27.5 -2%
Technology support
services 5.2 4.9 5%
Professional fees and
outside services 12.9 8.5 52%
Travel and promotional 2.5 2.7 -7%
Facilities costs 1.4 1.4 -
Other expenses 0.9 1.4 -36%
Total Adjusted Core
Operating Expenses $49.7 $46.5 7%
Professional fees and outside
services up $4.4MM
Outsourcing of certain regulatory
services
Compensations and benefits
down $0.7MM
Lower salaries resulting from a
decline in staffing
Core Operating Expenses Up 7% in 4Q15 vs 4Q14
¹Adjusted to reflect the impact of certain items. See appendix for “Non-GAAP Information.”
May not foot due to rounding.

24CBOE HOLDINGS
Volume-Based Expenses
Royalty fees down $1.5MM
Lower trading volume in licensed
products in 4Q15 versus 4Q14
– Index options volume down 12%
– VIX futures volume down 20%
Order routing down $0.6MM
Lower trading volume in multiply-listed
options
– Equities and exchange-traded products
volume down 31%
Volume-Based
Expenses(in millions)
4Q15 4Q14 % Chg
Royalty fees $ 17.8 $ 19.3 -8%
Order routing 0.3 0.9 -66%
Total $ 18.1 $ 20.2 -10%

25CBOE HOLDINGS
Effective tax rate 4Q15 4Q14Year
2015
Year
2014
GAAP 36.7% 41.2% 36.7% 38.7%
Adjusted¹ 36.7% 39.4% 38.0% 38.2%
4Q15 GAAP and adjusted effective tax rate
Decrease in effective tax rate for 2015 primarily resulted from the
preferential tax treatment of dividend income recognized in the fourth
quarter of 2015
4Q14’s adjusted effective tax rate excluded benefit from the change in
assessments of uncertain tax positions related to prior periods
Fourth Quarter and Full-Year Effective Tax Rate
¹Adjusted to reflect the impact of certain items. See Appendix for “Non-GAAP Information.”

26CBOE HOLDINGS
Enhancing Shareholder Value
Strong cash flow generation and disciplined approach
to managing cash
Generated $245MM in operating cash
flow
Capital outlays for 2015 include:
$73 million to pay dividends
$135 million to repurchase shares¹
$39 million in capital expenditures
$102MM of cash at Dec. 31, 2015
$57MM remaining on share repurchase
authorizations at Dec. 31, 2015¹Includes stock purchased under repurchase plan and from employees

27CBOE HOLDINGS
Capital allocation philosophy
Reinvest in our business to fund growth
Sustainable dividends and steady growth
Opportunistic share repurchases
Committed to Returning Capital to Shareholders
$0.20
$0.44
$0.54
$0.66
$0.78
$0.88
2010³ 2011 2012 2013 2014 2015
Annual Dividend Rate Per Share¹,²
¹Excludes special dividends
²Starting in 2016, dividend declarations may not align with quarterly earnings announcements due to the timing of Board actions
³Dividends paid for last two quarters of the year, post IPO

28CBOE HOLDINGS
2016 Full-Year Guidance
As of February 3, 2016($ in millions)
2016 Full-Year
Guidance 2015 Actual
Core operating expenses $211 to $215 $195
Continuing stock-based compensation¹ $13.5 $12
Depreciation and amortization $46 to $48 $46
Capital expenditures $47 to $49 $39
Effective tax rate 38.5% to 39.5% 38.0%²
1Stock-based compensation expense is included in employee costs
²Presented on a non-GAAP basis for comparison purposes
29CBOE HOLDINGS
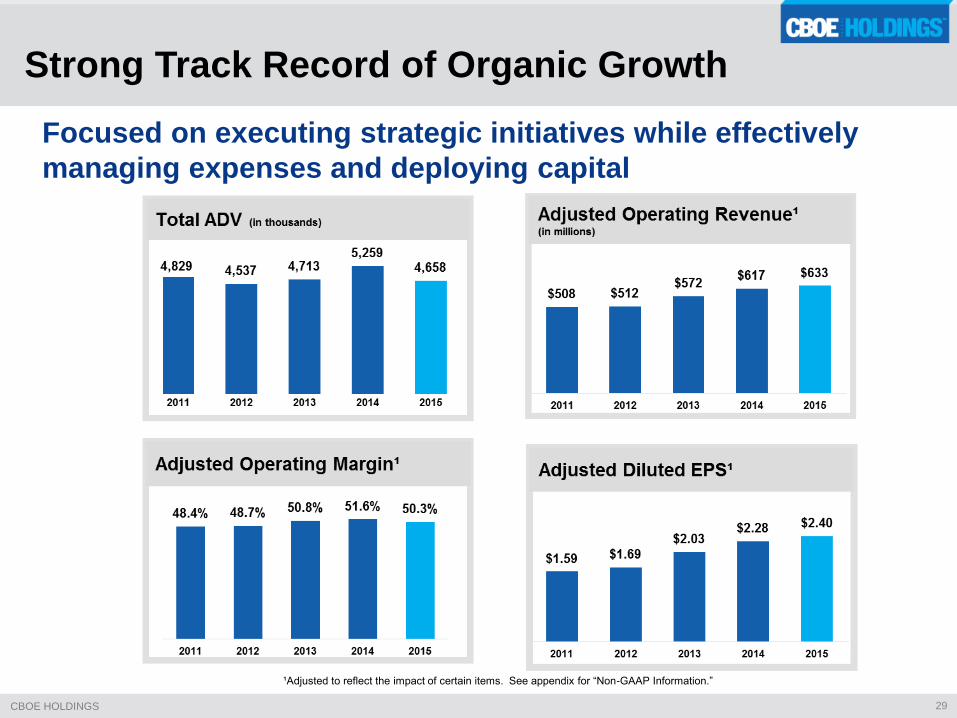
Focused on executing strategic initiatives while effectively
managing expenses and deploying capital
Strong Track Record of Organic Growth
¹Adjusted to reflect the impact of certain items. See appendix for “Non-GAAP Information.”

Questions & Answers

Appendix Materials
32CBOE HOLDINGS
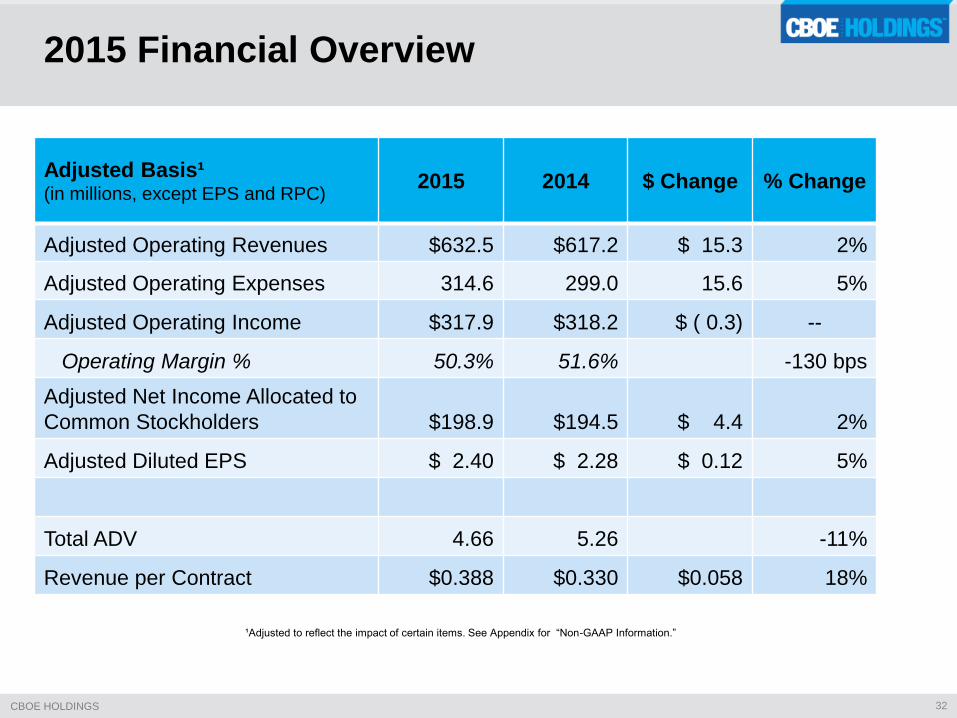
2015 Financial Overview
Adjusted Basis¹(in millions, except EPS and RPC)
2015 2014 $ Change % Change
Adjusted Operating Revenues $632.5 $617.2 $ 15.3 2%
Adjusted Operating Expenses 314.6 299.0 15.6 5%
Adjusted Operating Income $317.9 $318.2 $ ( 0.3) --
Operating Margin % 50.3% 51.6% -130 bps
Adjusted Net Income Allocated to
Common Stockholders $198.9 $194.5 $ 4.4 2%
Adjusted Diluted EPS $ 2.40 $ 2.28 $ 0.12 5%
Total ADV 4.66 5.26 -11%
Revenue per Contract $0.388 $0.330 $0.058 18%
¹Adjusted to reflect the impact of certain items. See Appendix for “Non-GAAP Information.”

33CBOE HOLDINGS
¹Adjusted to reflect the impact of certain items. See Appendix for “Non-GAAP Information.”
Optimistic About Long-Term Growth Prospects
$0.20
$0.25
$0.30
$0.35
$0.40
$0.45
$0.50
$0.55
$0.60
$0.65
$0.70
$0.75
$0.80
$0
$20
$40
$60
$80
$100
$120
$140
$160
$180
1Q112Q113Q114Q111Q122Q123Q124Q121Q132Q133Q134Q131Q142Q143Q144Q141Q152Q153Q154Q15
Adjusted Operating Revenue and Adjusted Diluted EPS¹($ in millions, except EPS)
Adjusted Operating Revenue Adjusted Diluted EPS
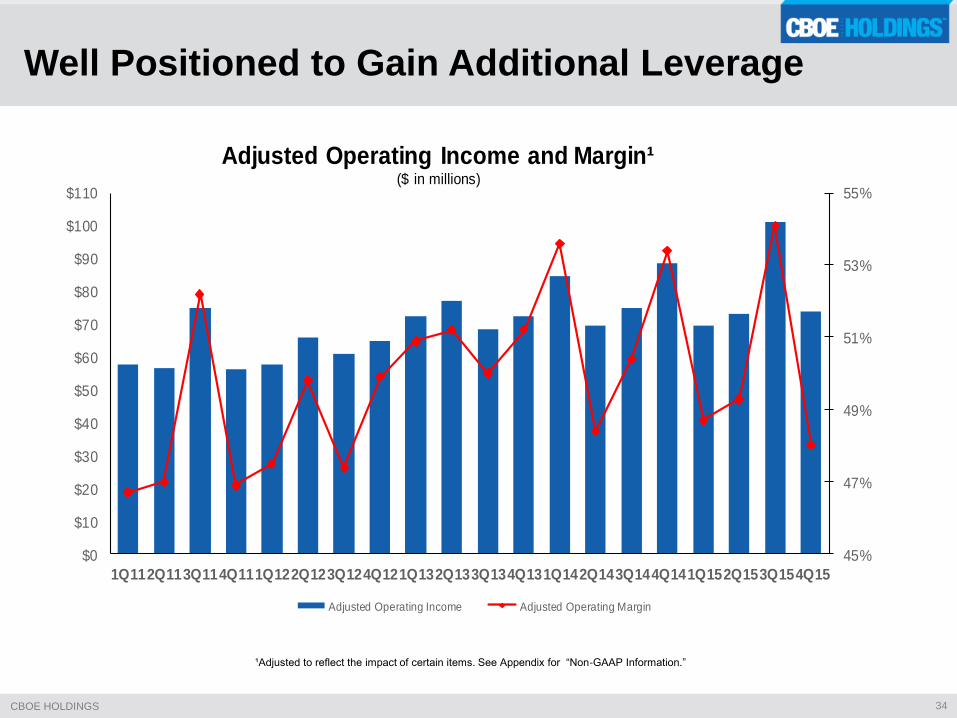
34CBOE HOLDINGS
¹Adjusted to reflect the impact of certain items. See Appendix for “Non-GAAP Information.”
Well Positioned to Gain Additional Leverage
45%
47%
49%
51%
53%
55%
$0
$10
$20
$30
$40
$50
$60
$70
$80
$90
$100
$110
1Q112Q113Q114Q111Q122Q123Q124Q121Q132Q133Q134Q131Q142Q143Q144Q141Q152Q153Q154Q15
Adjusted Operating Income and Margin¹($ in millions)
Adjusted Operating Income Adjusted Operating Margin

35CBOE HOLDINGS
Proprietary Products Account for Growing
Percentage of Transaction Fee Revenue
2.3% 4.6%10.5% 15.9% 18.8% 19.2%
48.3%52.9%
57.2%
62.9%63.0% 63.7%
19.0%
19.9%
15.6%
11.0% 9.7% 9.1%30.4%22.6%
16.7%10.2% 8.5% 8.0%
2010 2011 2012 2013 2014 2015
Annual Mix of Transaction Fee Revenue
Futures Index ETPs Equity
Index options and futures contracts account for 82.9% of
transaction fees in 2015, up from 50.6% in 2010

36CBOE HOLDINGS
Proprietary Products Account for Growing
Percentage of Transaction Fee Revenue
19.9% 19.7% 20.0% 19.0% 18.3%
63.8% 61.6% 62.4% 65.0% 64.8%
9.4% 10.0% 8.8% 9.0% 8.9%
6.9% 8.7% 8.8% 7.0% 8.0%
4Q14 1Q15 2Q15 3Q15 4Q15
Quarterly Mix of Transaction Fee Revenue
Futures Index ETPs Equity
Index options and futures contracts accounted for 82.1% of
transaction fees in 4Q15 versus 83.7% in 4Q14

37CBOE HOLDINGS
Increase in Rate Per Contract (RPC) PrimarilyReflects Favorable Shift in Mix of Products Traded
Equity34.4%
ETPs30.3%
Futures4.2%
S&P Indexes18.9%
VIX10.7%
Other1.5%
Index31.1%
4Q14 Trading Volume Mix
$1.616
$0.284
$0.696
$0.105
$0.068
4Q14 RPC $0.340
$1.686
$0.349
$0.726
$0.143
$0.097
4Q15 RPC $0.408
Equity33.8%
ETPs25.3%
Futures4.4%
S&P Indexes21.7%
VIX12.9%
Other1.9%
Index36.5%
4Q15 Trading Volume Mix

38CBOE HOLDINGS
1.60 1.601.77
1.91
2.17
1.81 1.85 1.941.81
1.53 1.48 1.431.63
1Q
13
2Q
13
3Q
13
4Q
13
1Q
14
2Q
14
3Q
14
4Q
14
1Q
15
2Q
15
3Q
15
4Q
15
1Q
16 T
D¹
Equity Options
1.11
1.64
1.321.331.50
1.391.42
1.71
1.371.22
1.43
1.08
1.52
1Q
13
2Q
13
3Q
13
4Q
13
1Q
14
2Q
14
3Q
14
4Q
14
1Q
15
2Q
15
3Q
15
4Q
15
1Q
16 T
D¹
Options on ETPs
1.50 1.541.38
1.49
1.75
1.47 1.48
1.76
1.40 1.45
2.07
1.55
2.00
1Q
13
2Q
13
3Q
13
4Q
13
1Q
14
2Q
14
3Q
14
4Q
14
1Q
15
2Q
15
3Q
15
4Q
15
1Q
16 T
D¹
Index Options
CBOE and C2 Quarterly Options ADV (in millions)
4.21
4.78
4.474.73
5.42
4.67 4.75
5.41
4.584.20
4.98
4.06
5.15
1Q
13
2Q
13
3Q
13
4Q
13
1Q
14
2Q
14
3Q
14
4Q
14
1Q
15
2Q
15
3Q
15
4Q
15
1Q
16 T
D¹
Quarterly Options ADV
¹Through January 31, 2016

39CBOE HOLDINGS
CBOE Holdings Rolling 3-Month RPC
2015 Jan Feb Mar Apr May Jun Jul Aug Sep Oct Nov Dec
Equities $0.069 $0.070 $0.077 $0.077 $0.087 $0.093 $0.098 $0.104 $0.106 $0.105 $0.098 $0.097
Indexes 0.702 0.704 0.712 0.707 0.701 0.697 0.702 0.703 0.709 0.706 0.718 0.726
Exchange-traded products 0.111 0.115 0.118 0.115 0.114 0.117 0.123 0.133 0.143 0.146 0.144 0.143
Total options RPC 0.279 0.283 0.284 0.280 0.290 0.308 0.328 0.352 0.368 0.370 0.357 0.349
Futures 1.647 1.649 1.705 1.762 1.775 1.758 1.712 1.661 1.647 1.662 1.686 1.686
Total RPC $0.333 $0.340 $0.340 $0.336 $0.348 $0.368 $0.391 $0.416 $0.431 $0.432 $0.417 $0.408
2014 Jan Feb Mar Apr May Jun Jul Aug Sep Oct Nov Dec
Equities $0.079 $0.079 $0.081 $0.082 $0.081 $0.079 $0.074 $0.076 $0.077 $0.078 $0.074 $0.068
Indexes 0.664 0.667 0.669 0.674 0.674 0.670 0.671 0.677 0.680 0.690 0.692 0.696
Exchange-traded products 0.124 0.119 0.117 0.113 0.113 0.111 0.112 0.114 0.115 0.112 0.107 0.105
Total options RPC 0.273 0.281 0.281 0.277 0.275 0.275 0.275 0.281 0.275 0.288 0.279 0.284
Futures 1.602 1.614 1.617 1.610 1.616 1.639 1.651 1.631 1.625 1.598 1.628 1.616
Total RPC $0.317 $0.329 $0.329 $0.325 $0.321 $0.322 $0.324 $0.336 $0.329 $0.344 $0.331 $0.340
2013 Jan Feb Mar Apr May Jun Jul Aug Sep Oct Nov Dec
Equities $0.149 $0.153 $0.140 $0.114 $0.094 $0.090 $0.082 $0.081 $0.077 $0.076 $0.076 $0.075
Indexes 0.665 0.670 0.671 0.679 0.674 0.675 0.670 0.671 0.669 0.666 0.666 0.666
Exchange-traded products 0.194 0.181 0.155 0.127 0.119 0.119 0.121 0.122 0.123 0.124 0.126 0.125
Total options RPC 0.340 0.341 0.333 0.308 0.295 0.289 0.282 0.278 0.273 0.278 0.275 0.275
Futures 1.484 1.560 1.618 1.598 1.594 1.544 1.544 1.533 1.559 1.548 1.556 1.565
Total RPC $0.376 $0.382 $0.378 $0.357 $0.341 $0.334 $0.324 $0.321 $0.315 $0.320 $0.315 $0.316
2012 Jan Feb Mar Apr May Jun Jul Aug Sep Oct Nov Dec
Equities $0.151 $0.128 $0.110 $0.112 $0.117 $0.123 $0.124 $0.122 $0.118 $0.121 $0.124 $0.134
Indexes 0.640 0.651 0.658 0.667 0.673 0.677 0.680 0.684 0.682 0.675 0.670 0.670
Exchange-traded products 0.206 0.188 0.171 0.172 0.176 0.180 0.177 0.177 0.177 0.180 0.183 0.186
Total options RPC 0.297 0.275 0.261 0.267 0.279 0.288 0.289 0.286 0.287 0.294 0.309 0.322
Futures 1.474 1.610 1.697 1.655 1.650 1.607 1.598 1.626 1.606 1.573 1.473 1.442
Total RPC $0.308 $0.289 $0.280 $0.290 $0.304 $0.314 $0.316 $0.315 $0.317 $0.326 $0.342 $0.355

40CBOE HOLDINGS
Quarterly Core Operating Expenses¹
4Q 2015 % rev 3Q 2015 % rev 2Q 2015 % rev 1Q 2015 % rev 4Q 2014 % rev
Total Operating Expenses $80,052 52% $85,925 43% $75,355 51% $73,286 51% $79,525 48%
Less:
Depreciation and amortization 12,202 8% 12,394 7% 11,275 8% 10,402 7% 11,053 7%
Severance expense - - - - - - - - 1,863 1%
Volume-based expenses:
Royalty fees 17,830 12% 21,840 10% 16,755 11% 14,150 10% 19,266 12%
Order routing 299 0% 581 - 627 0% 787 1% 874 1%
Core Operating Expenses (non-GAAP)¹: $49,721 32% $51,110 27% $46,698 31% $47,947 34% $46,469 28%
Less: Continuing stock-based compensation 3,194 2% 3,185 2% 3,147 2% 2,655 2% 2,098 1%
Core Operating Expenses excluding continuing stock-
based compensation (non-GAAP)¹: $46,527 30% $47,925 25% $43,551 29% $45,292 32% $44,371 27%
Core Operating Expense Detail:
Compensation and benefits $26,768 17% $29,583 14% $24,136 16% $25,439 18% $27,493 17%
Technology support services 5,182 3% 5,342 3% 4,813 3% 5,325 4% 4,915 3%
Profession fees and outside services 12,897 8% 12,619 7% 12,594 8% 11,950 8% 8,539 5%
Travel and promotional expenses 2,548 2% 1,407 1% 2,526 2% 2,501 2% 2,727 2%
Facilities costs 1,446 1% 874 - 1,293 1% 1,384 1% 1,445 1%
Other expenses 880 1% 1,285 0% 1,336 1% 1,348 1% 1,350 1%
Total $49,721 32% $51,110 27% $46,698 31% $47,947 34% $46,469 28%
Number of full-time employees at quarter end 564 553 532 528 520
May not foot due to rounding
¹Please see our disclaimer regarding non-GAAP financial measures.
($ in thousands)

41CBOE HOLDINGS
2015 % rev 2014 % rev 2013 % rev 2012 % rev 2011 % rev
Total Operating Expenses $314,617 50% $303,424 51% $286,236 50% $268,241 52% $266,512 52%
Less:
Depreciation and amortization 46,274 7% 39,913 7% 34,488 6% 31,485 6% 34,094 7%
Accelerated stock-based compensation - - 2,530 - 3,996 1% 343 - 453 -
Severance - - 1,863 - - - - - 3,709 1%
Estimated liability/expense related to SEC investigation - - - - 1,000 - 5,000 1% - -
Volume-based expenses:
Royalty fees 70,574 11% 66,110 11% 56,576 10% 46,135 9% 47,822 9%
Order routing 2,293 0% 4,080 0% 4,355 1% 6,275 1% 14,239 3%
Core Operating Expenses (non-GAAP)¹: $195,476 31% $188,928 32% $185,821 32% $179,003 35% $166,195 33%
Less: Continuing stock-based compensation 12,181 2% 13,047 2% 16,828 3% 12,005 2% 12,166 2%
Core Operating Expenses excluding continuing stock-
based compensation (non-GAAP)¹: $183,295 29% $175,881 30% $168,993 30% $166,998 33% $154,029 30%
Core Operating Expense Detail:
Compensation and benefits $105,925 17% $117,341 17% $114,087 20% $103,853 20% $100,292 20%
Technology support services 20,662 3% 19,189 3% 17,898 3% 19,603 4% 17,933 4%
Professional fees and outside services 50,060 8% 31,976 8% 34,473 6% 36,300 7% 27,310 5%
Travel and promotion expenses 8,982 1% 9,046 1% 9,806 2% 10,006 2% 9,812 2%
Facilities costs 4,998 1% 5,721 1% 5,053 1% 5,066 1% 5,400 1%
Other expenses 4,849 1% 5,655 1% 4,504 1% 4,175 1% 5,448 1%
Total $195,476 31% $188,928 32% $185,821 32% $179,003 35% $166,195 33%
Number of Full Time Employees at year end 564 520 650 605 596
May not foot due to rounding
¹Please see our disclaimer regarding non-GAAP financial measures.
($ in thousands)
Annual Core Operating Expenses¹

42CBOE HOLDINGS
May not foot due to rounding and/or change in shares outstanding
GAAP to Non-GAAP Reconciliation
For 2010 and 2011GAAP to Non-GAAP Reconciliation
(in thousands, except per share amounts)
3Q10 4Q10 1Q11 2Q11 3Q11 4Q11 FY2010 FY2011
Reconciliation of GAAP Net Income Allocated to Common Stockholder to Non-GAAP
GAAP net income allocated to common stockholders 20,020$ 30,687$ 32,089$ 32,609$ 40,597$ 31,287$ 98,166$ 136,582$
Less: Recognition of prior-period revenue (4,406) (4,406)
Add: Accelerated stock-based compensation 10,965 2,004 340 113 12,968 453
Add: Severance expense pursuant to an executive employment agreement 3,709 3,709
Add: Impairment change 1,620 460 1,620 460
Income tax benefit/(expense) related to the items above (4,461) 291 (337) (46) (1,478) (4,034) (1,861)
Add: Income tax provision adjustment 4,223 (322) 3,901
Net income allocated to participating securities - effect on reconciling items (144) 11 (11) (2) (75) (32) (76) (109)
Adjusted net income allocated to common stockholders 26,380$ 30,207$ 32,540$ 32,674$ 44,745$ 33,164$ 104,238$ 143,134$
Reconciliation of GAAP Diluted EPS to Non-GAAP
GAAP diluted earnings per common share 0.20$ 0.31$ 0.36$ 0.36$ 0.45$ 0.35$ 1.03$ 1.52$
Per share impact of items above 0.06 0.05 0.02 0.06 0.07
Non-GAAP diluted earnings per common share 0.26$ 0.31$ 0.36$ 0.36$ 0.50$ 0.37$ 1.09$ 1.59$
GAAP operating revenue 106,015$ 117,391$ 124,042$ 120,290$ 143,604$ 120,208$ 437,104$ 508,144$
Non-GAAP adjustments noted above (4,406) (4,406)
Adjusted operating revenue 106,015$ 112,985$ 124,042$ 120,290$ 143,604$ 120,208$ 432,698$ 508,144$
GAAP operating income 34,933$ 51,854$ 57,535$ 56,452$ 74,966$ 52,679$ 167,341$ 241,632$
Non-GAAP adjustments noted above 10,965 (2,402) 340 113 - 3,709 8,562 4,162
Adjusted operating income 45,898$ 49,452$ 57,875$ 56,565$ 74,966$ 56,388$ 175,903$ 245,794$
Adjusted operating margin 43.3% 43.8% 46.7% 47.0% 52.2% 46.9% 40.7% 48.4%
For further information go to cboe.com/Investor Relations
Reconciliation of GAAP Operating Margin to Non-GAAP

43CBOE HOLDINGS
GAAP to Non-GAAP Reconciliation
For 2012 and 2013
GAAP to Non-GAAP Reconciliation
(in thousands, except per share amounts)
1Q12 2Q12 3Q12 4Q12 FY2012 1Q13 2Q13 3Q13 4Q13 FY2013
Reconciliation of GAAP Net Income Allocated to Common Stockholder to Non-GAAP
GAAP net income allocated to common stockholders 32,863$ 37,903$ 45,243$ 39,246$ 155,254$ 41,789$ 45,477$ 40,955$ 45,649$ 173,863$
Add: Accelerated stock-based compensation 194 149 343 3,180 816 3,996
Add: Estimated liability related to SEC investigation 5,000 5,000 1,000 1,000
Add: Impairment charge 245 245
Income tax benefit/(expense) related to the items above (80) (63) (139) (1,311) (313) (1,611)
Add: Income tax provision adjustment (7,654) (5,415) (13,054)
Net income allocated to participating securities - effect on reconciling
items (2) 86 4 106 (29) (22) (46)
Adjusted net income allocated to common stockholders 32,975$ 37,903$ 37,675$ 38,921$ 147,510$ 43,874$ 46,958$ 40,955$ 45,649$ 177,447$
Reconciliation of GAAP Diluted EPS to Non-GAAP
GAAP diluted earnings per common share 0.37$ 0.44$ 0.52$ 0.45$ 1.78$ 0.48$ 0.52$ 0.47$ 0.52$ 1.99$
Per share impact of items above (0.09) (0.09) 0.02 0.02 0.04
Non-GAAP diluted earnings per common share 0.37$ 0.44$ 0.43$ 0.45$ 1.69$ 0.50$ 0.54$ 0.47$ 0.52$ 2.03$
Reconciliation of GAAP Operating Margin to Non-GAAP
GAAP operating revenue 121,392$ 132,549$ 128,319$ 130,077$ 512,338$ 142,705$ 150,772$ 136,743$ 141,830$ 572,050$
Non-GAAP adjustments noted above
Adjusted operating revenue 121,392$ 132,549$ 128,319$ 130,077$ 512,338$ 142,705$ 150,772$ 136,743$ 141,830$ 572,050$
GAAP operating income 57,415$ 66,069$ 60,861$ 59,752$ 244,097$ 69,430$ 75,358$ 68,427$ 72,599$ 285,814$
Non-GAAP adjustments noted above 194 5,149 5,343 3,180 1,816 4,996$
Adjusted operating income 57,609$ 66,069$ 60,861$ 64,901$ 249,440$ 72,610$ 77,174$ 68,427$ 72,599$ 290,810$
Adjusted operating margin 47.5% 49.8% 47.4% 49.9% 48.7% 50.9% 51.2% 50.0% 51.2% 50.8%
For further information go to cboe.com/Investor Relations
May not foot due to rounding and/or change in shares outstanding

44CBOE HOLDINGS
GAAP to Non-GAAP Reconciliation
For 2014 and 2015
GAAP to Non-GAAP Reconciliation
(in thousands, except per share amounts)
1Q14 2Q14 3Q14 4Q14 FY2014 1Q15 2Q15 3Q15 4Q15 FY2015
Reconciliation of GAAP Net Income Allocated to Common Stockholder to Non-GAAP
GAAP net income allocated to common stockholders 48,528$ 42,598$ 48,146$ 49,119$ 188,392$ 42,079$ 44,646$ 67,219$ 50,180$ 204,125
Less: Revenue recognized from prior years (1,995)$ (1,995)
Add: Accelerated stock-based compensation 2,530 2,530 -
Add: Sevance expense related to outsourcing certain regulatory services 1,863 1,863 -
Add: Impairment charge 3,000 3,000 364 364
Add: Tax adjustment related to prior year 1,600 1,600 (4,286) (4,286)
Income tax benefit/(expense) related to the items above (1,009) (2,005) (2,861) (142) 732 620
Net income allocated to participating securities - effect on reconciling
items (15) (20) (43) (3) 19 6 26
Adjusted net income allocated to common stockholders 50,034$ 42,598$ 48,146$ 53,557$ 194,481$ 42,299$ 44,646$ 62,952$ 48,923$ 198,854$
Reconciliation of GAAP Diluted EPS to Non-GAAP
GAAP diluted earnings per common share 0.56$ 0.50$ 0.57$ 0.58$ 2.21$ 0.50$ 0.54$ 0.81$ 0.61$ 2.46$
Per share impact of items above 0.02 0.06 0.07 (0.05) (0.02) (0.06)
Non-GAAP diluted earnings per common share 0.58$ 0.50$ 0.57$ 0.64$ 2.28$ 0.50$ 0.54$ 0.76$ 0.59$ 2.40$
Reconciliation of GAAP Operating Margin to Non-GAAP
GAAP operating revenue 157,885$ 143,942$ 148,910$ 166,487$ 617,225$ 142,839$ 148,725$ 187,035$ 155,946$ 634,545$
Non-GAAP adjustments noted above (1,995) (1,995)
Adjusted operating revenue 157,885$ 143,942$ 148,910$ 166,487$ 617,225$ 142,839$ 148,725$ 187,035$ 153,951$ 632,550$
GAAP operating income 82,038$ 69,716$ 75,084$ 86,962$ 313,801$ 69,553$ 73,370$ 101,110$ 75,894$ 319,928$
Non-GAAP adjustments noted above 2,530 1,863 4,393 (1,995) (1,995)
Adjusted operating income 84,568$ 69,716$ 75,084$ 88,825$ 318,194$ 69,553$ 73,370$ 101,110$ 73,899$ 317,933$
Adjusted operating margin 53.6% 48.4% 50.4% 53.4% 51.6% 48.7% 49.3% 54.1% 48.0% 50.3%
Free Cash Flow Reconciliation
Net cash flows provided by operating activities 245,278$
Capital expenditures (39,340)
Free Cash Flow 205,938$
For further information go to cboe.com/Investor Relations
May not foot due to rounding and/or change in shares outstanding

45CBOE HOLDINGS
In addition to disclosing results determined in accordance with GAAP, CBOE Holdings has disclosed certain non-GAAP measures of operating performance. These measures are not in accordance with, or a substitute for, GAAP, and may be different from or inconsistent with non-GAAP financial measures used by other companies. The non-GAAP measures provided in this presentation include core operating expenses, adjusted operating revenue, adjusted operating expenses, adjusted operating income, adjusted operating margin, adjusted effective tax rate, adjusted net income, adjusted net income allocated to common stockholders, adjusted diluted earnings per share and free cash flow.
Management believes that the non-GAAP financial measures in this presentation, including adjusted net income and core operating expenses, provide useful and comparative information to assess trends in our core operations and a means to evaluate period-to-period comparisons. Non-GAAP financial measures disclosed by management, including adjusted diluted EPS, are provided as additional information to investors in order to provide them with an alternative method for assessing our financial condition and operating results.
Core operating expenses is the company’s operating expenses after excluding (i) volume-based expenses, (ii) depreciation and amortization expense, (iii) accelerated stock-based compensation expense and (iv) other unusual or one-time expenses.
Non-GAAP Information
CBOE
400 South LaSalle Street
Chicago, Illinois 60605
www.cboe.com