earnings release fourth quarter 2012
DESCRIPTION
Earnings release fourth quarter 2012TRANSCRIPT

1
2
CONTENTS
1. 4Q 12 Highlights
2. Key facts and recent events
3. Retail Business Indicators
4. Credit Business Indicators
5. EBITDA
6. Consolidated Income Statements
7. Financial Statements La Polar S.A. - IFRS
a) Balance Sheets
b) Income Statements
c) Cash Flow
Notes: The Securities and Insurance Supervisor (SVS in Spanish) authorized the Company to file
consolidated financial statements not comparable, starting on December 31, 2011 until the financial statements as of March 31, 2013.
Quarters are named as: 1Q, 2Q, 3Q, 4Q accordingly.
Currency symbols: CLP Chilean Pesos, US$ U.S. dollars, M millions, B billions.
3
1. 4Q 2012 HIGHLIGHTS Same Store Sales in Chile increased by 15% During the fourth quarter, Same Store Sales (SSS) grew by 15% over the same period last year. At the same time, revenue from the retail business grew by 13%, to a total amount of US$202 million. This growth in sales shows the first outcome of the new commercial strategy implemented by this management, where one of the main goals has been to enhance the role of private labels, creating major changes in the product mix.
Recovering Retail Gross Margin The Chilean retail operation had a gross margin of 24% during the fourth quarter 2012, higher than the 21% in 4Q11, reaching a contribution of US$ 48.4 million. This progress was partly driven by the increase in the sales of private labels and improvements in our buying process.
Financial Risk Stabilized at 11.6% At December 31, 2012, our operation in Chile shows a strong decline in the provision levels, reaching 11.6%, a drop of more than 10 percentage points compared to December 2011 and 20 percentage points less than the initial levels where current management received the company. This shows that the implementation of
correct risk, credit and collection policies has been successful. An Outstanding Capital Increase The company executed a capital increase of approximately US$ 277 million, exceeding the original target of US$ 250 million. During the process all of the 750 million common shares available were subscribed. As a result of the capital increase, the Preventive Judicial Settlement (¨Chapter 11¨) is completed and, as of November 2012 the Aconcagua Plan has started.
We did it; La Polar has a positive equity As we said during the follow-on offering process in September 2012 we successfully turned around the negative equity inherited from the previous management, reaching a positive equity of US$ 190 million. This was achieved through the above mentioned capital increase and the reduction of financial debt related to
the new liability structure.
4
2. KEY FACTS
CAPITAL INCREASE During the fourth quarter the company raised capital for a total amount of $132,750 million, issuing 750 million common shares and exceeding the initial goal of $120,000 million. The funds obtained will be used to finance CAPEX in Chile and Colombia as well as to finance the compensation plan for customers agreed with SERNAC.
NUEVAPOLAR As part of the capital increase, the company was able to increase its investor base. International investors acquired approximately 20% of the NUEVAPOLAR. At the same time, major shareholders subscribed 100% of their rights. The total number of fully paid shares as of December 31, 2012 reached 998,617,522.
INVESTOR RELATIONS To strengthen transparency and to provide management and financial information to investors and shareholders, the company launched the Investor Relations Department during December, a natural step after the capital increase.
NEW STORE IN COLOMBIA On November 2012, La Polar opened its fifth store in Colombia. This store has 5,000 square meters of selling space and it is located in the new shopping center Cacique in the City of Bucaramanga. This is the first store launched by the new management and it is a perfect example of our store layout proposal.
LA POLAR CREDIT CARD (TLP) On December 17, the Supervisor of Banks and Financial Institutions (SBIF) released all the restrictions on our credit card. From that day onwards, the company is allowed to offer to its new credit card holders, more benefits and better conditions such as associated stores, cash advances, among others. This event, plus the funds from the capital increase, made the TLP to become again a competitive card in the market and it is a key milestone for the implementation of our Aconcagua Plan.
RECENT DEVELOPMENTS COURT APPROVAL OF THE AGREEMENT WITH SERNAC On December 10, 2012, the Santiago First Civil Court approved the agreement that La Polar had promoted with SERNAC. Therefore, on January 14, 2013 the company began the implementation of the settlement in accordance with the terms and conditions provided by the parties. The settlement agreement, signed on May 22, 2012, will compensate all those customers affected by the unilateral renegotiations incurred by the previous management.
“NUEVAPOLAR” PART OF THE IPSA (CHILEAN STOCK EXCHANGE INDEX) The Chilean stock exchange announced the re-entry in 2013 of NUEVAPOLAR to the IPSA, the Chilean Stock Exchange Index, which includes the 40 most traded companies in the stock market.
STORE REMODELING During March, we began remodeling two stores in Santiago. This is just the beginning of the remodeling plan of 100,000 square meters of our stores in Chile committed the follow-on offering process and a crucial pillar in the starting of the Aconcagua Plan. During 2013 a total of 9 stores will be remodeled.
5
3. RETAIL BUSINESS INDICATORS
The Securities and Insurance Supervisor authorized the Company to file consolidated financial statements as of December 31, 2011, with comparative statement of financial position at 31 July 2011, only five months, considering that the new Board and Management of the Company could only present the reasonableness of the results and cash flows arising after they took office.
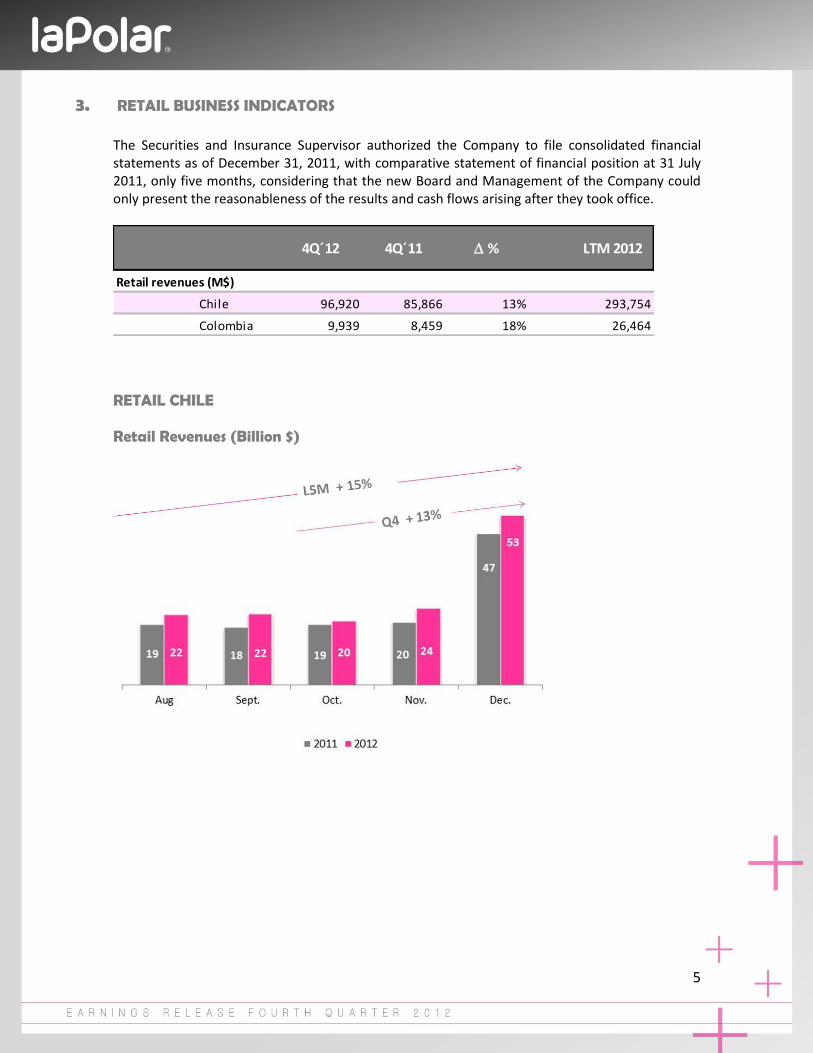
RETAIL CHILE Retail Revenues (Billion $)
4Q´12 4Q´11 D % LTM 2012
Retail revenues (M$)
Chile 96,920 85,866 13% 293,754
Colombia 9,939 8,459 18% 26,464
6
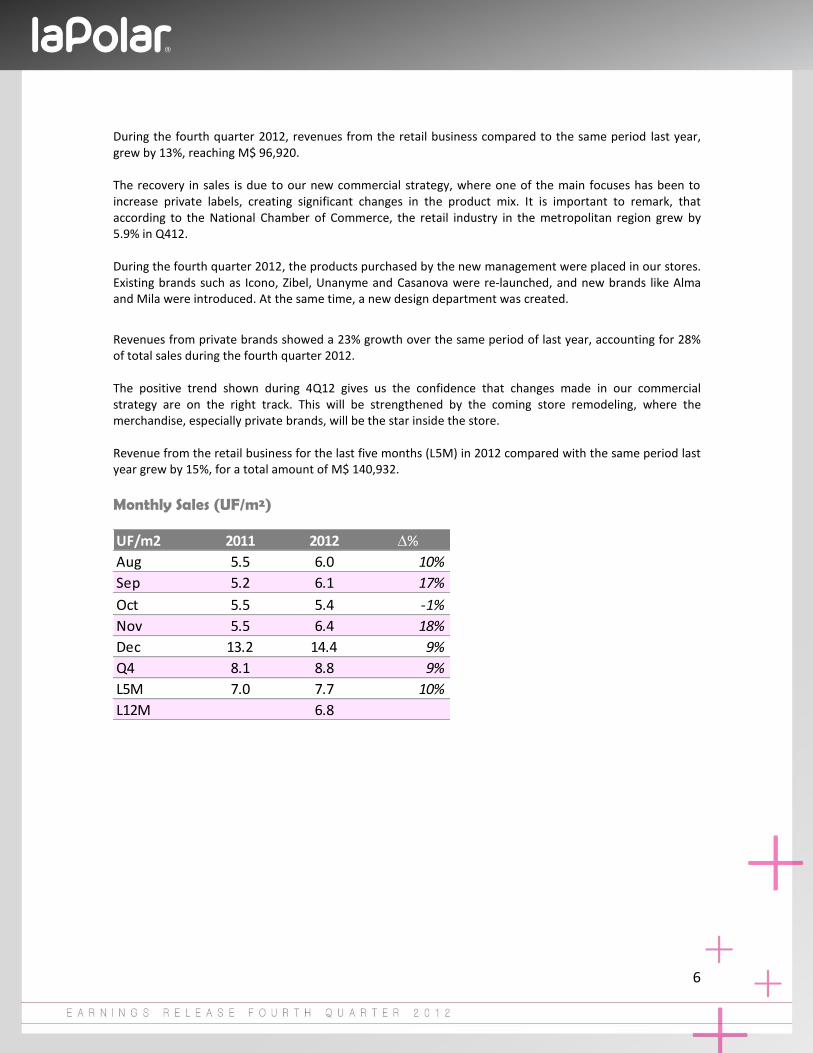
During the fourth quarter 2012, revenues from the retail business compared to the same period last year, grew by 13%, reaching M$ 96,920. The recovery in sales is due to our new commercial strategy, where one of the main focuses has been to increase private labels, creating significant changes in the product mix. It is important to remark, that according to the National Chamber of Commerce, the retail industry in the metropolitan region grew by 5.9% in Q412. During the fourth quarter 2012, the products purchased by the new management were placed in our stores. Existing brands such as Icono, Zibel, Unanyme and Casanova were re-launched, and new brands like Alma and Mila were introduced. At the same time, a new design department was created.
Revenues from private brands showed a 23% growth over the same period of last year, accounting for 28% of total sales during the fourth quarter 2012. The positive trend shown during 4Q12 gives us the confidence that changes made in our commercial strategy are on the right track. This will be strengthened by the coming store remodeling, where the merchandise, especially private brands, will be the star inside the store. Revenue from the retail business for the last five months (L5M) in 2012 compared with the same period last year grew by 15%, for a total amount of M$ 140,932.
Monthly Sales (UF/m²)
UF/m2 2011 2012 D%
Aug 5.5 6.0 10%
Sep 5.2 6.1 17%
Oct 5.5 5.4 -1%
Nov 5.5 6.4 18%
Dec 13.2 14.4 9%
Q4 8.1 8.8 9%
L5M 7.0 7.7 10%
L12M 6.8
7
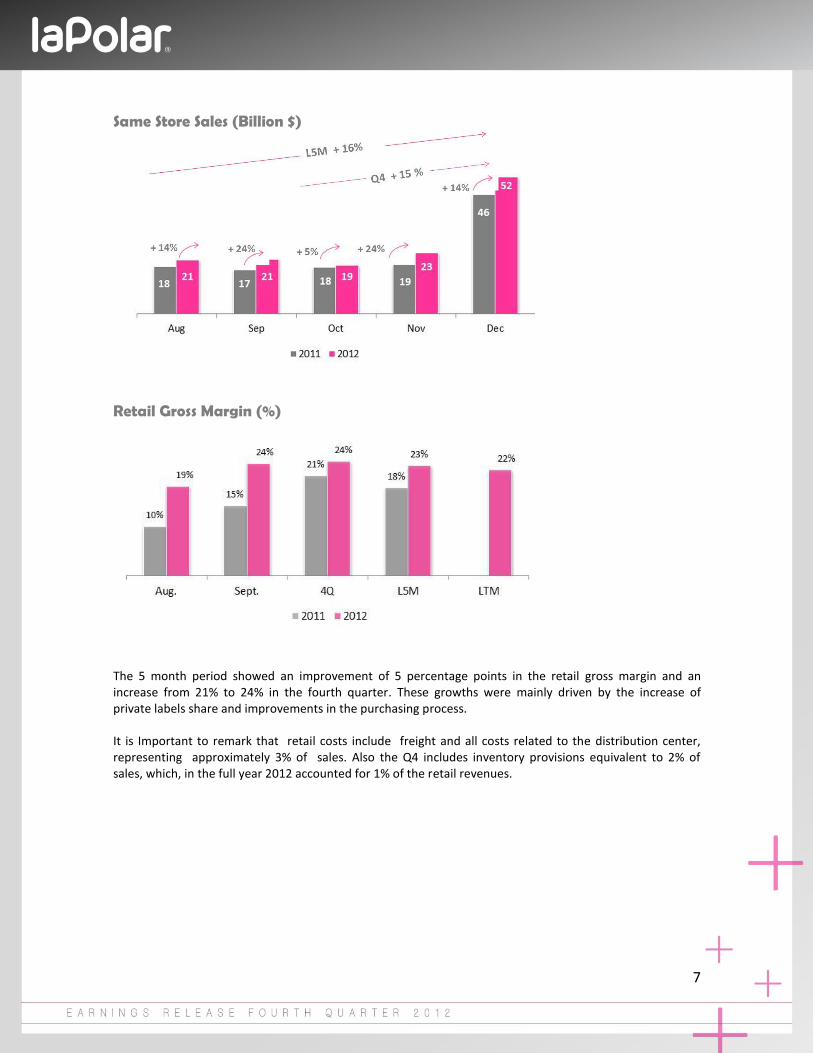
Same Store Sales (Billion $)
Retail Gross Margin (%)
The 5 month period showed an improvement of 5 percentage points in the retail gross margin and an increase from 21% to 24% in the fourth quarter. These growths were mainly driven by the increase of private labels share and improvements in the purchasing process. It is Important to remark that retail costs include freight and all costs related to the distribution center, representing approximately 3% of sales. Also the Q4 includes inventory provisions equivalent to 2% of sales, which, in the full year 2012 accounted for 1% of the retail revenues.
8
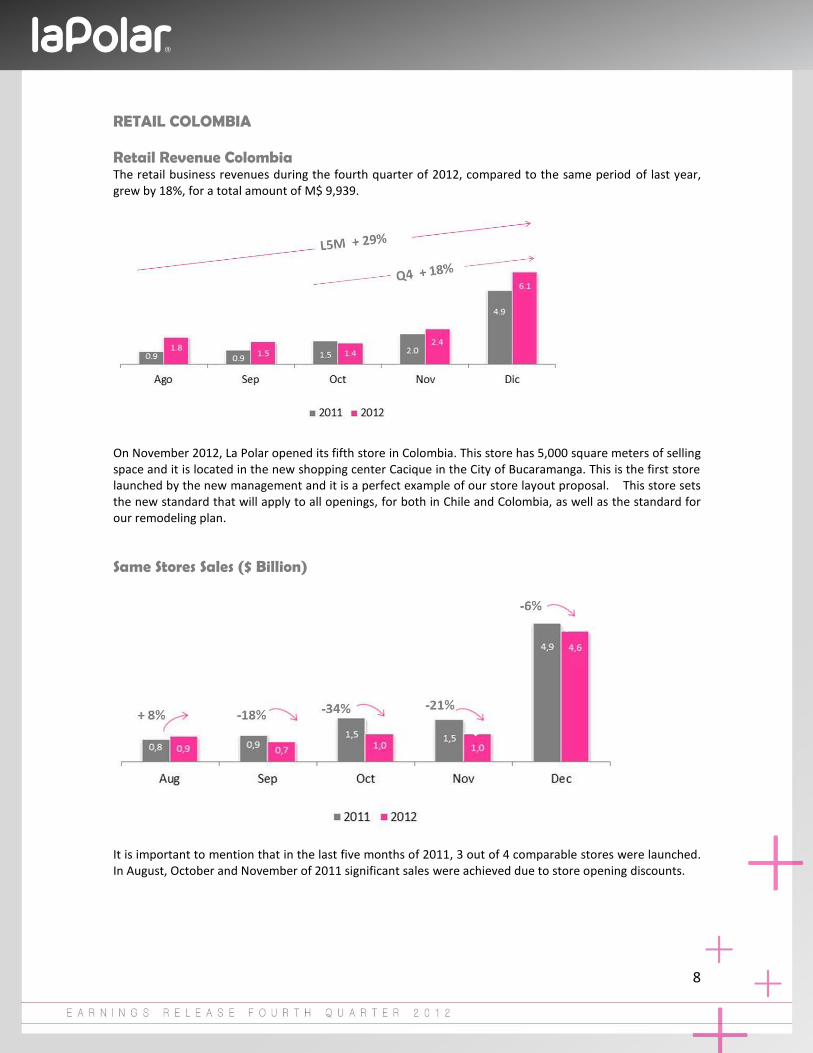
RETAIL COLOMBIA Retail Revenue Colombia The retail business revenues during the fourth quarter of 2012, compared to the same period of last year, grew by 18%, for a total amount of M$ 9,939.
On November 2012, La Polar opened its fifth store in Colombia. This store has 5,000 square meters of selling space and it is located in the new shopping center Cacique in the City of Bucaramanga. This is the first store launched by the new management and it is a perfect example of our store layout proposal. This store sets the new standard that will apply to all openings, for both in Chile and Colombia, as well as the standard for our remodeling plan.
Same Stores Sales ($ Billion)
It is important to mention that in the last five months of 2011, 3 out of 4 comparable stores were launched. In August, October and November of 2011 significant sales were achieved due to store opening discounts.
9
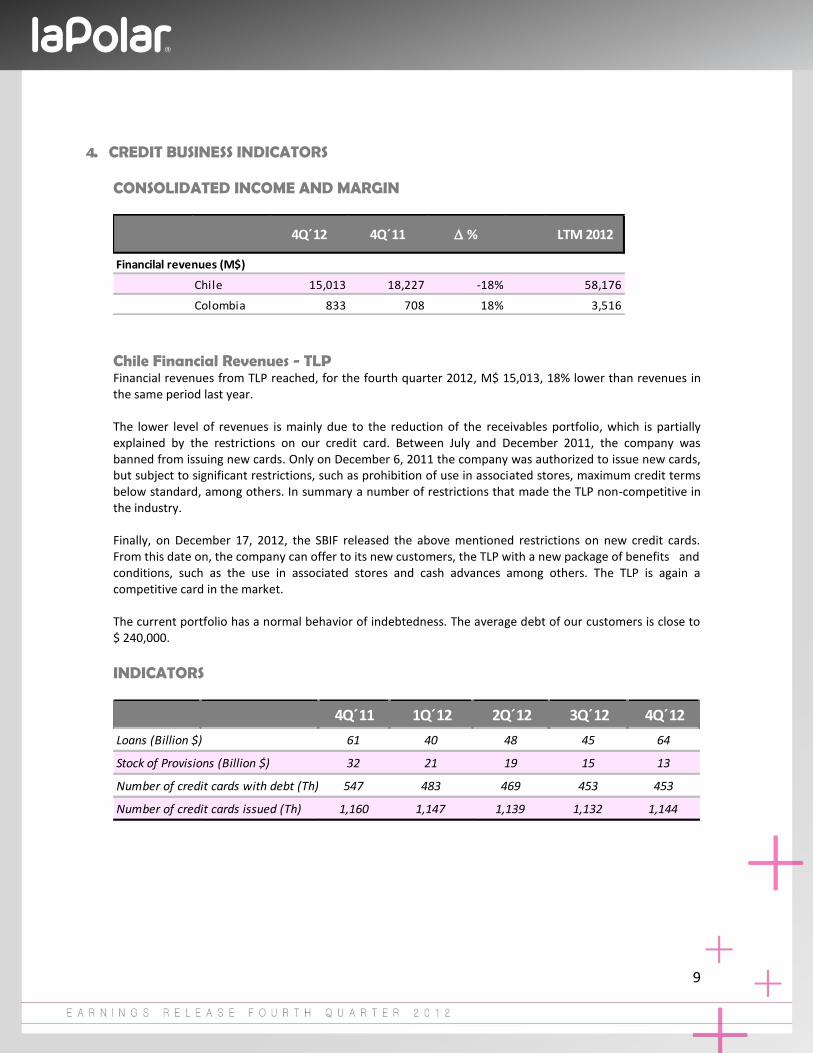
4. CREDIT BUSINESS INDICATORS CONSOLIDATED INCOME AND MARGIN
Chile Financial Revenues - TLP Financial revenues from TLP reached, for the fourth quarter 2012, M$ 15,013, 18% lower than revenues in the same period last year. The lower level of revenues is mainly due to the reduction of the receivables portfolio, which is partially explained by the restrictions on our credit card. Between July and December 2011, the company was banned from issuing new cards. Only on December 6, 2011 the company was authorized to issue new cards, but subject to significant restrictions, such as prohibition of use in associated stores, maximum credit terms below standard, among others. In summary a number of restrictions that made the TLP non-competitive in the industry. Finally, on December 17, 2012, the SBIF released the above mentioned restrictions on new credit cards. From this date on, the company can offer to its new customers, the TLP with a new package of benefits and conditions, such as the use in associated stores and cash advances among others. The TLP is again a competitive card in the market. The current portfolio has a normal behavior of indebtedness. The average debt of our customers is close to $ 240,000.
INDICATORS
4Q´12 4Q´11 D % LTM 2012
Financilal revenues (M$)
Chile 15,013 18,227 -18% 58,176
Colombia 833 708 18% 3,516
4Q´11 1Q´12 2Q´12 3Q´12 4Q´12
Loans (Billion $) 61 40 48 45 64
Stock of Provisions (Billion $) 32 21 19 15 13
Number of credit cards with debt (Th) 547 483 469 453 453
Number of credit cards issued (Th) 1,160 1,147 1,139 1,132 1,144
10
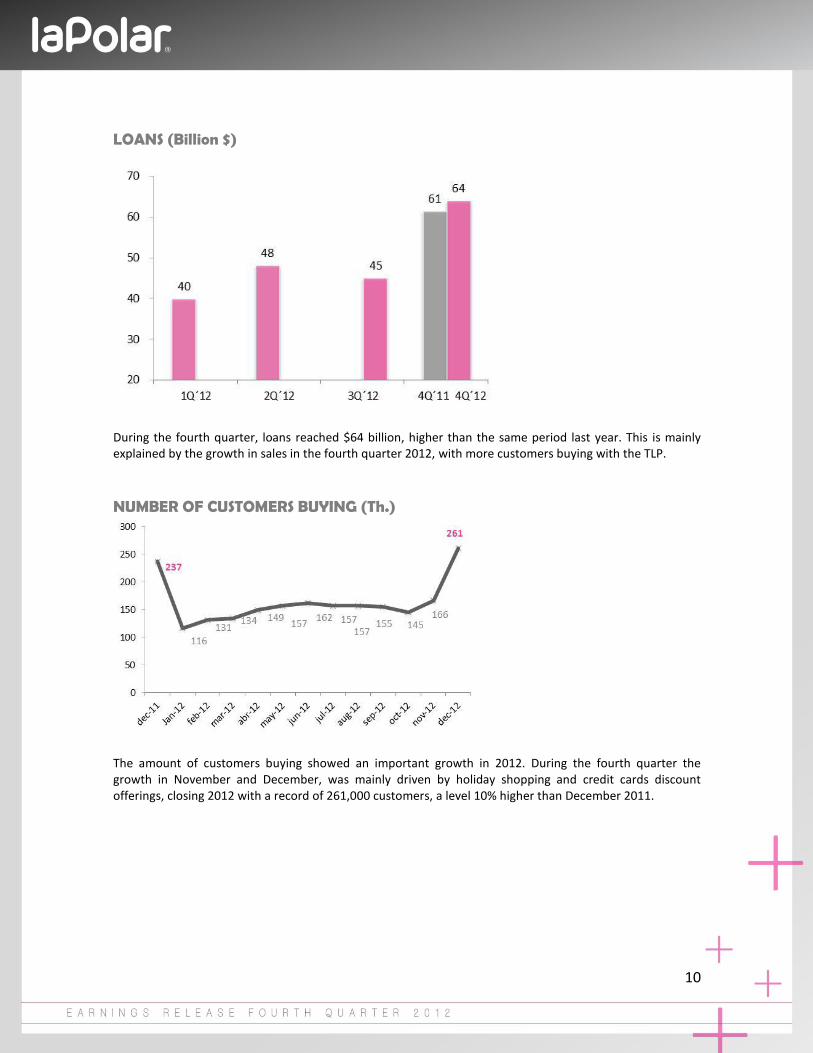
LOANS (Billion $)
During the fourth quarter, loans reached $64 billion, higher than the same period last year. This is mainly explained by the growth in sales in the fourth quarter 2012, with more customers buying with the TLP.
NUMBER OF CUSTOMERS BUYING (Th.)
The amount of customers buying showed an important growth in 2012. During the fourth quarter the growth in November and December, was mainly driven by holiday shopping and credit cards discount offerings, closing 2012 with a record of 261,000 customers, a level 10% higher than December 2011.
11
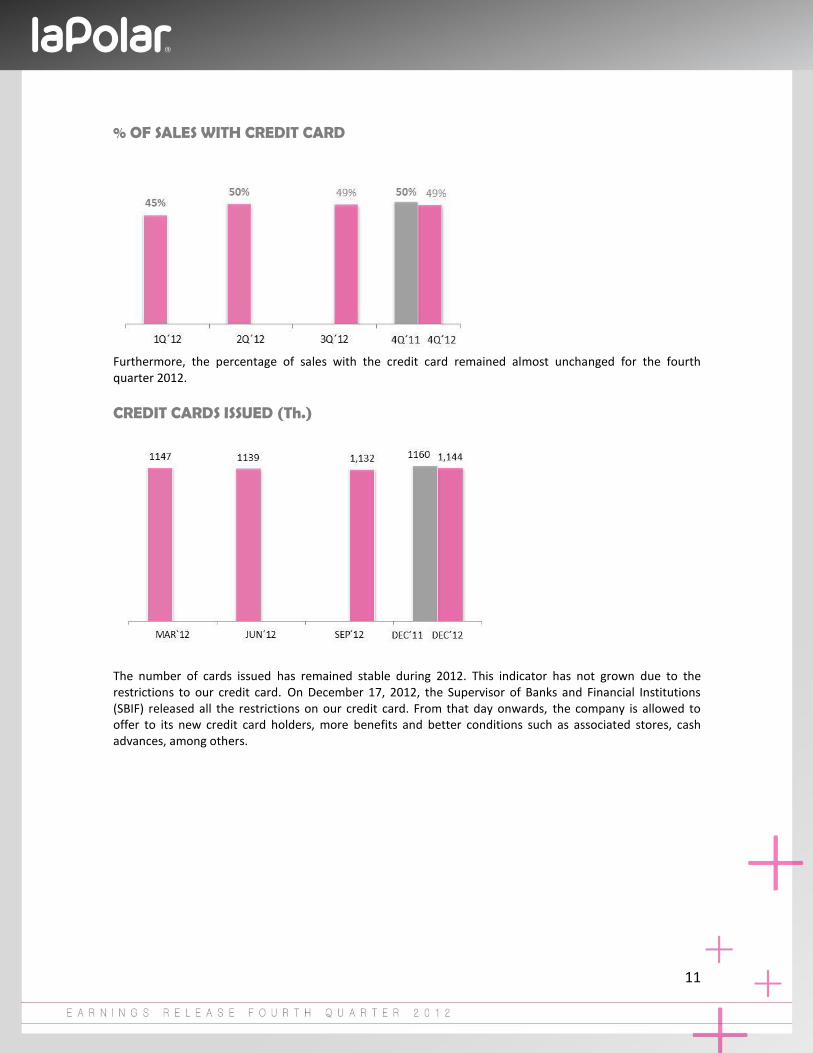
% OF SALES WITH CREDIT CARD
Furthermore, the percentage of sales with the credit card remained almost unchanged for the fourth quarter 2012.
CREDIT CARDS ISSUED (Th.)
The number of cards issued has remained stable during 2012. This indicator has not grown due to the restrictions to our credit card. On December 17, 2012, the Supervisor of Banks and Financial Institutions (SBIF) released all the restrictions on our credit card. From that day onwards, the company is allowed to offer to its new credit card holders, more benefits and better conditions such as associated stores, cash advances, among others.

12
CREDIT CARDS WITH BALANCE (Th.)
The number of credit cards in the fourth quarter 2012 reached 453 Th., a decline of 30 Th. compared with the same period last year. This was mainly due to higher amount of write-offs during the year. The write-offs were not compensated enough by additions of new credit cards.
LOAN PORTFOLIO INDICATORS Gross loans (%)
13
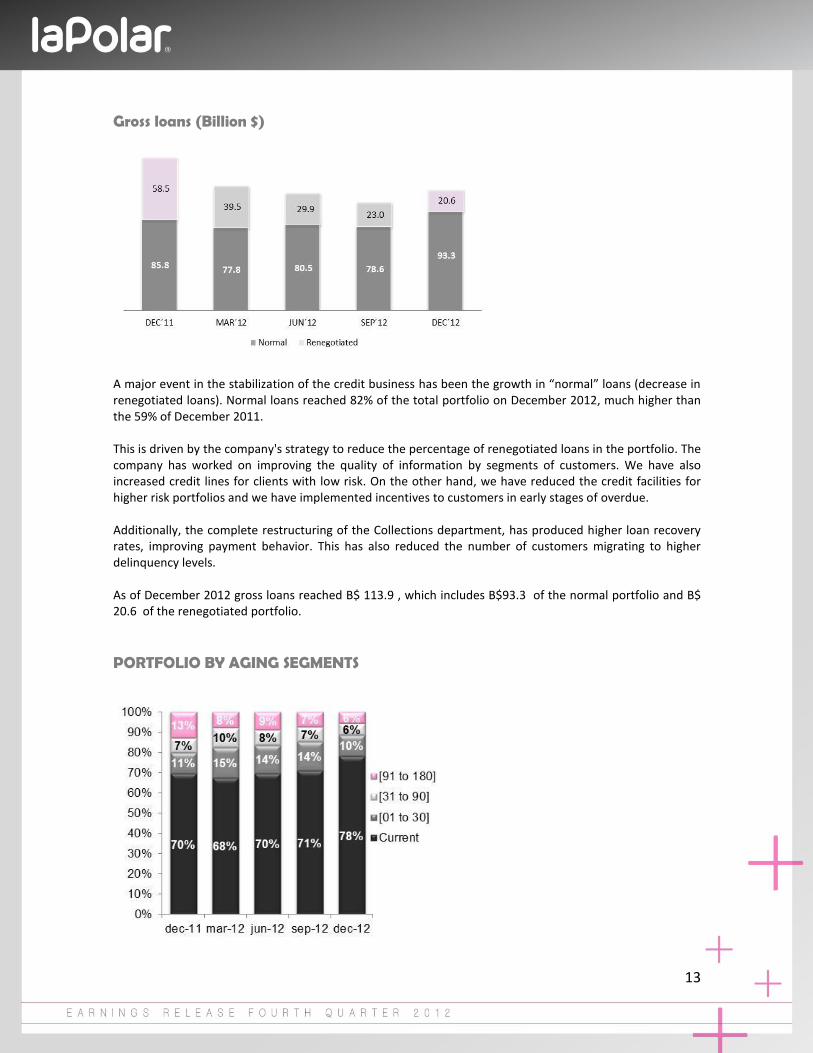
Gross loans (Billion $)
A major event in the stabilization of the credit business has been the growth in “normal” loans (decrease in renegotiated loans). Normal loans reached 82% of the total portfolio on December 2012, much higher than the 59% of December 2011. This is driven by the company's strategy to reduce the percentage of renegotiated loans in the portfolio. The company has worked on improving the quality of information by segments of customers. We have also increased credit lines for clients with low risk. On the other hand, we have reduced the credit facilities for higher risk portfolios and we have implemented incentives to customers in early stages of overdue. Additionally, the complete restructuring of the Collections department, has produced higher loan recovery rates, improving payment behavior. This has also reduced the number of customers migrating to higher delinquency levels. As of December 2012 gross loans reached B$ 113.9 , which includes B$93.3 of the normal portfolio and B$ 20.6 of the renegotiated portfolio.
PORTFOLIO BY AGING SEGMENTS
14
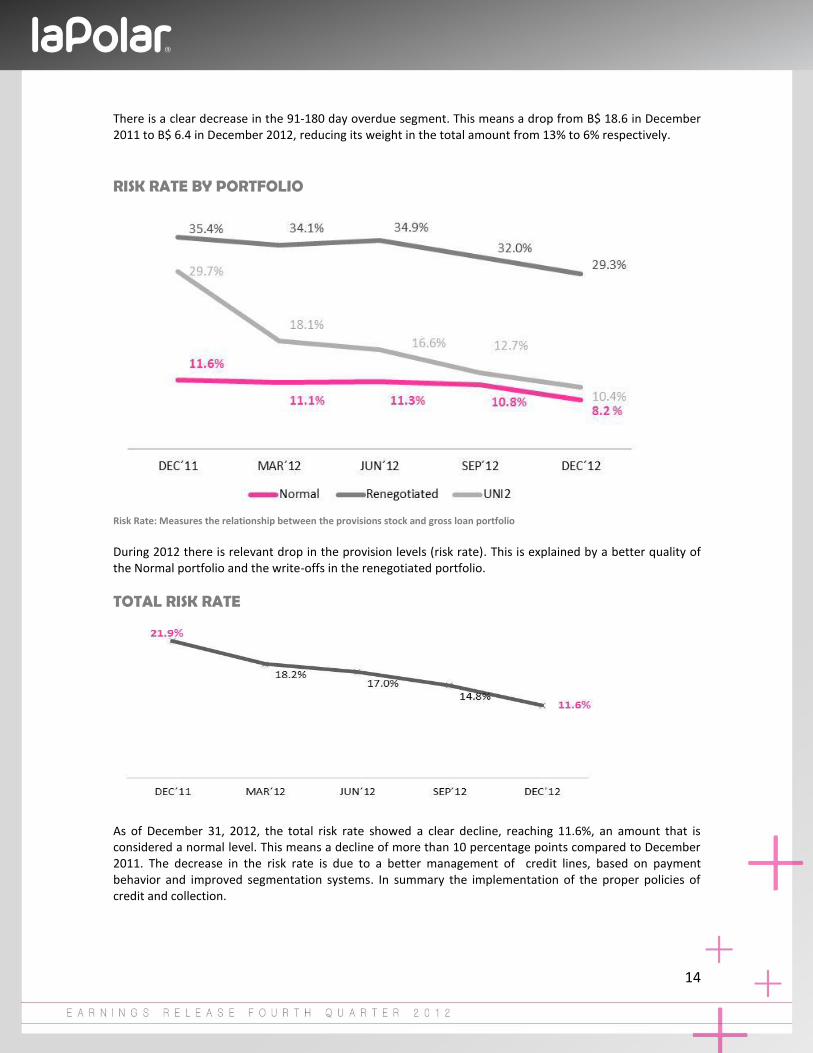
There is a clear decrease in the 91-180 day overdue segment. This means a drop from B$ 18.6 in December 2011 to B$ 6.4 in December 2012, reducing its weight in the total amount from 13% to 6% respectively.
RISK RATE BY PORTFOLIO
Risk Rate: Measures the relationship between the provisions stock and gross loan portfolio During 2012 there is relevant drop in the provision levels (risk rate). This is explained by a better quality of the Normal portfolio and the write-offs in the renegotiated portfolio.
TOTAL RISK RATE
As of December 31, 2012, the total risk rate showed a clear decline, reaching 11.6%, an amount that is considered a normal level. This means a decline of more than 10 percentage points compared to December 2011. The decrease in the risk rate is due to a better management of credit lines, based on payment behavior and improved segmentation systems. In summary the implementation of the proper policies of credit and collection.
15
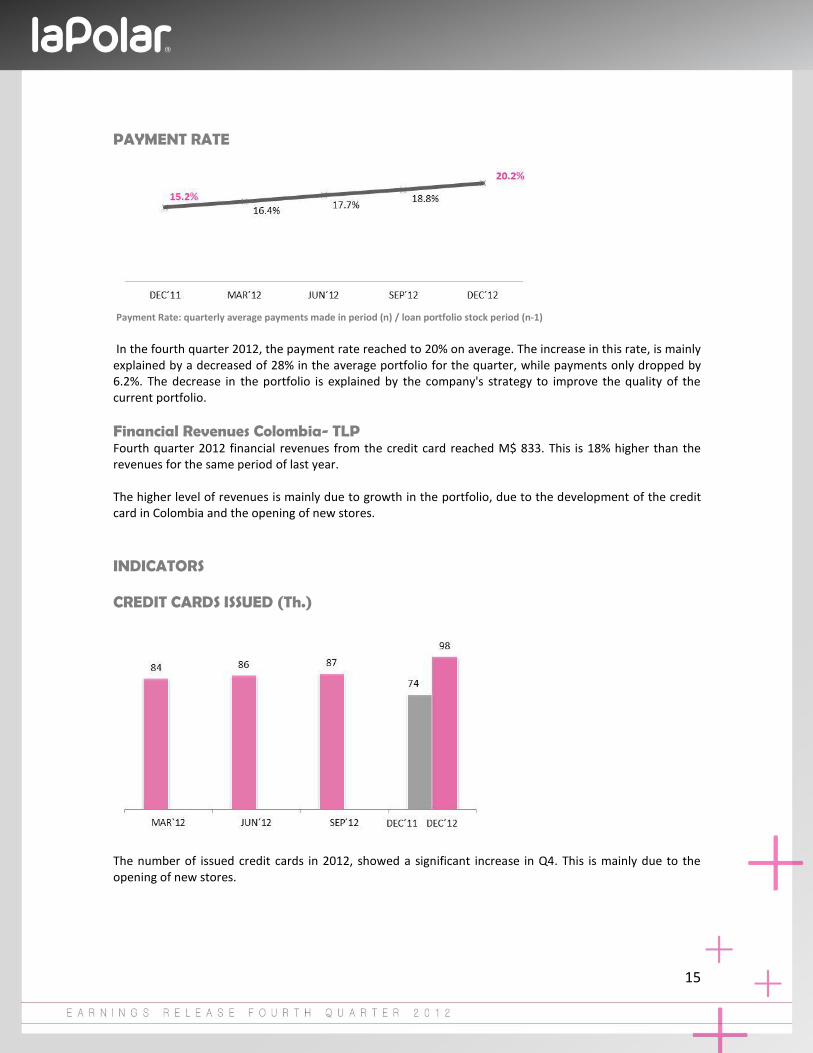
PAYMENT RATE
Payment Rate: quarterly average payments made in period (n) / loan portfolio stock period (n-1)
In the fourth quarter 2012, the payment rate reached to 20% on average. The increase in this rate, is mainly explained by a decreased of 28% in the average portfolio for the quarter, while payments only dropped by 6.2%. The decrease in the portfolio is explained by the company's strategy to improve the quality of the current portfolio.
Financial Revenues Colombia- TLP Fourth quarter 2012 financial revenues from the credit card reached M$ 833. This is 18% higher than the revenues for the same period of last year. The higher level of revenues is mainly due to growth in the portfolio, due to the development of the credit card in Colombia and the opening of new stores.
INDICATORS CREDIT CARDS ISSUED (Th.)
The number of issued credit cards in 2012, showed a significant increase in Q4. This is mainly due to the opening of new stores.
16
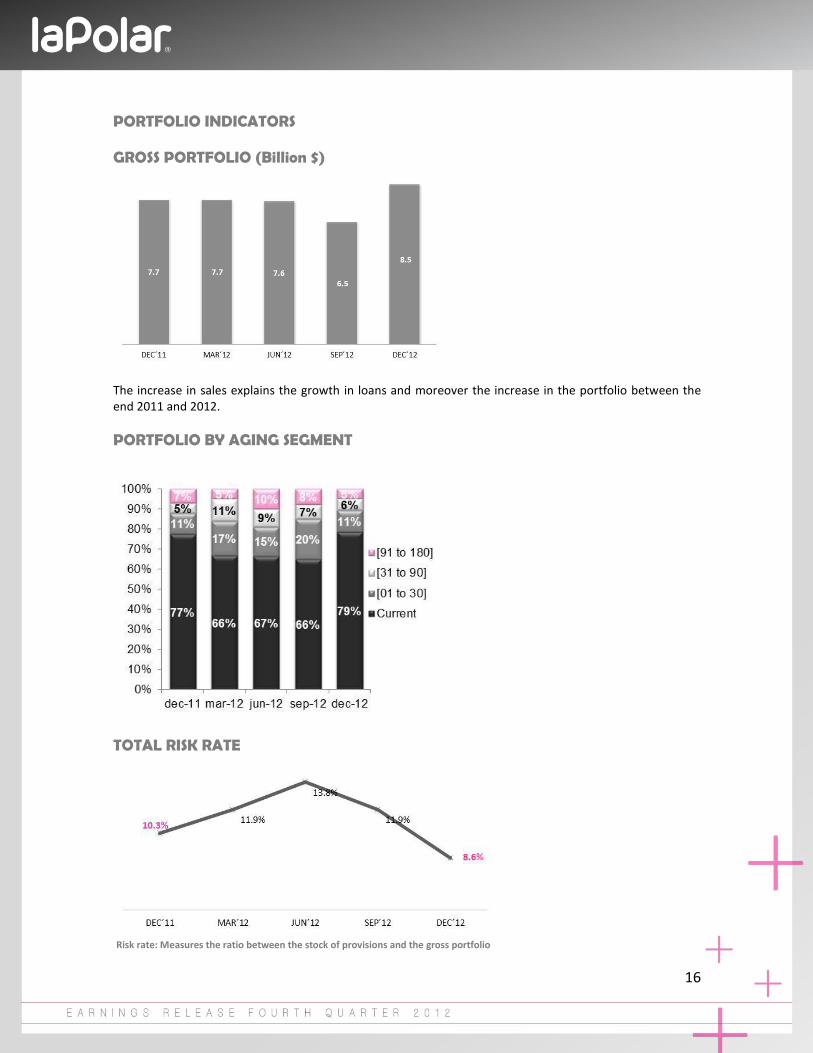
PORTFOLIO INDICATORS GROSS PORTFOLIO (Billion $)
The increase in sales explains the growth in loans and moreover the increase in the portfolio between the end 2011 and 2012.
PORTFOLIO BY AGING SEGMENT
TOTAL RISK RATE
Risk rate: Measures the ratio between the stock of provisions and the gross portfolio
17
5. EBITDA
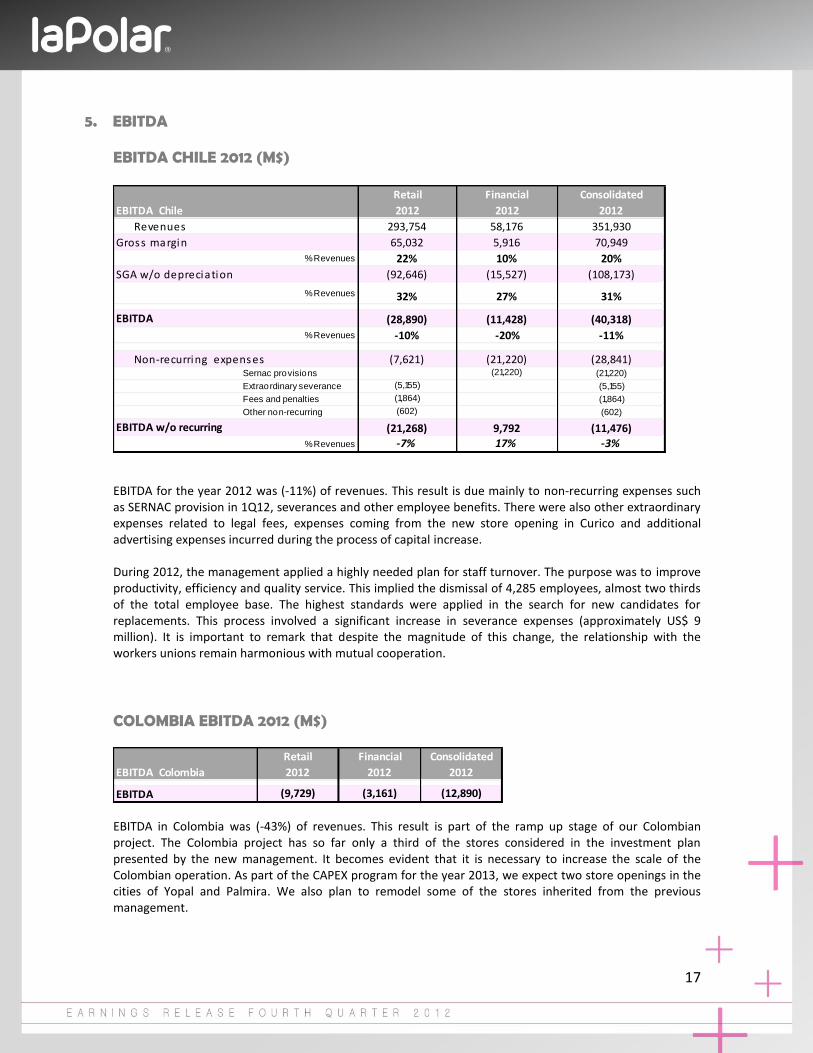
EBITDA CHILE 2012 (M$)
EBITDA for the year 2012 was (-11%) of revenues. This result is due mainly to non-recurring expenses such as SERNAC provision in 1Q12, severances and other employee benefits. There were also other extraordinary expenses related to legal fees, expenses coming from the new store opening in Curico and additional advertising expenses incurred during the process of capital increase. During 2012, the management applied a highly needed plan for staff turnover. The purpose was to improve productivity, efficiency and quality service. This implied the dismissal of 4,285 employees, almost two thirds of the total employee base. The highest standards were applied in the search for new candidates for replacements. This process involved a significant increase in severance expenses (approximately US$ 9 million). It is important to remark that despite the magnitude of this change, the relationship with the workers unions remain harmonious with mutual cooperation.
COLOMBIA EBITDA 2012 (M$)
EBITDA in Colombia was (-43%) of revenues. This result is part of the ramp up stage of our Colombian project. The Colombia project has so far only a third of the stores considered in the investment plan presented by the new management. It becomes evident that it is necessary to increase the scale of the Colombian operation. As part of the CAPEX program for the year 2013, we expect two store openings in the cities of Yopal and Palmira. We also plan to remodel some of the stores inherited from the previous management.
Retail Financial Consolidated
EBITDA Chile 2012 2012 2012
Revenues 293,754 58,176 351,930
Gross margin 65,032 5,916 70,949% Revenues 22% 10% 20%
SGA w/o depreciation (92,646) (15,527) (108,173)
% Revenues 32% 27% 31%
EBITDA (28,890) (11,428) (40,318)
% Revenues -10% -20% -11%
Non-recurring expenses (7,621) (21,220) (28,841)Sernac provisions (21,220) (21,220)
Extraordinary severance (5,155) (5,155)
Fees and penalties (1,864) (1,864)
Other non-recurring (602) (602)
EBITDA w/o recurring (21,268) 9,792 (11,476)
% Revenues -7% 17% -3%
Retail Financial Consolidated
EBITDA Colombia 2012 2012 2012
EBITDA (9,729) (3,161) (12,890)
18
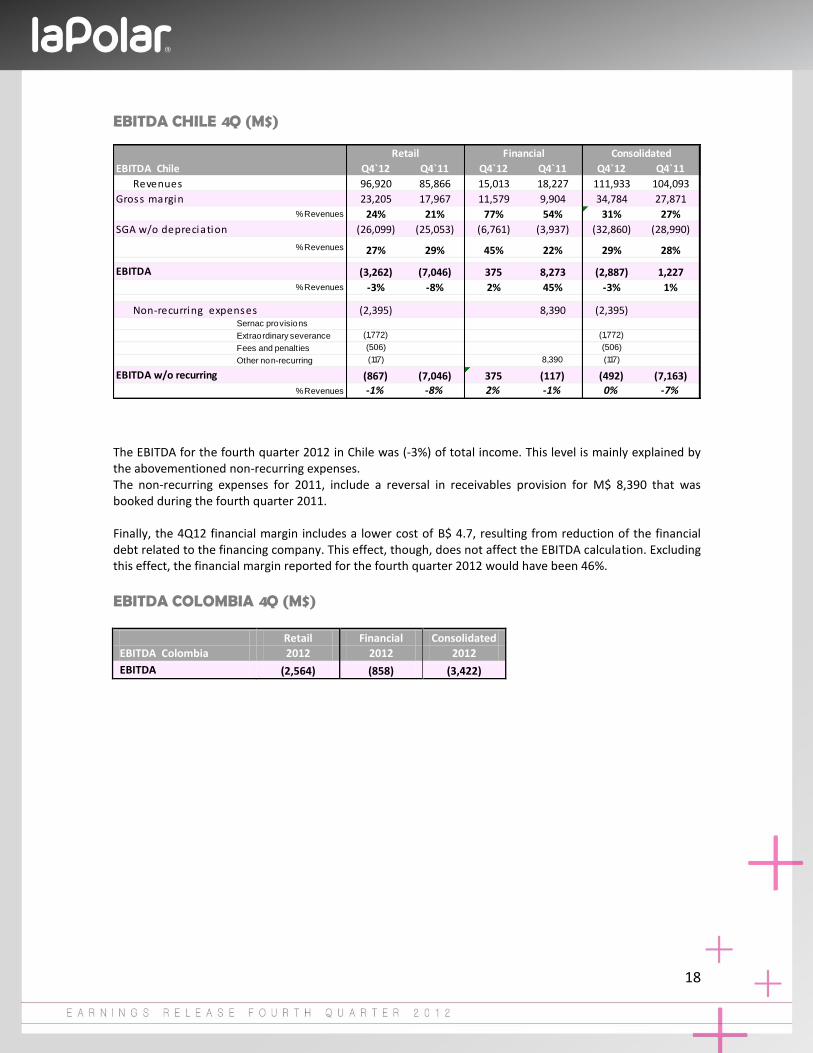
EBITDA CHILE 4Q (M$)
The EBITDA for the fourth quarter 2012 in Chile was (-3%) of total income. This level is mainly explained by the abovementioned non-recurring expenses. The non-recurring expenses for 2011, include a reversal in receivables provision for M$ 8,390 that was booked during the fourth quarter 2011.
Finally, the 4Q12 financial margin includes a lower cost of B$ 4.7, resulting from reduction of the financial debt related to the financing company. This effect, though, does not affect the EBITDA calculation. Excluding this effect, the financial margin reported for the fourth quarter 2012 would have been 46%.
EBITDA COLOMBIA 4Q (M$)
Retail Financial Consolidated
EBITDA Colombia 2012 2012 2012
EBITDA (2,564) (858) (3,422)
EBITDA Chile Q4`12 Q4`11 Q4`12 Q4`11 Q4`12 Q4`11
Revenues 96,920 85,866 15,013 18,227 111,933 104,093
Gross margin 23,205 17,967 11,579 9,904 34,784 27,871% Revenues 24% 21% 77% 54% 31% 27%
SGA w/o depreciation (26,099) (25,053) (6,761) (3,937) (32,860) (28,990)
% Revenues 27% 29% 45% 22% 29% 28%
EBITDA (3,262) (7,046) 375 8,273 (2,887) 1,227
% Revenues -3% -8% 2% 45% -3% 1%
Non-recurring expenses (2,395) 8,390 (2,395)Sernac provisions
Extraordinary severance (1,772) (1,772)
Fees and penalties (506) (506)
Other non-recurring (117) 8,390 (117)
EBITDA w/o recurring (867) (7,046) 375 (117) (492) (7,163)
% Revenues -1% -8% 2% -1% 0% -7%
Retail Financial Consolidated
19
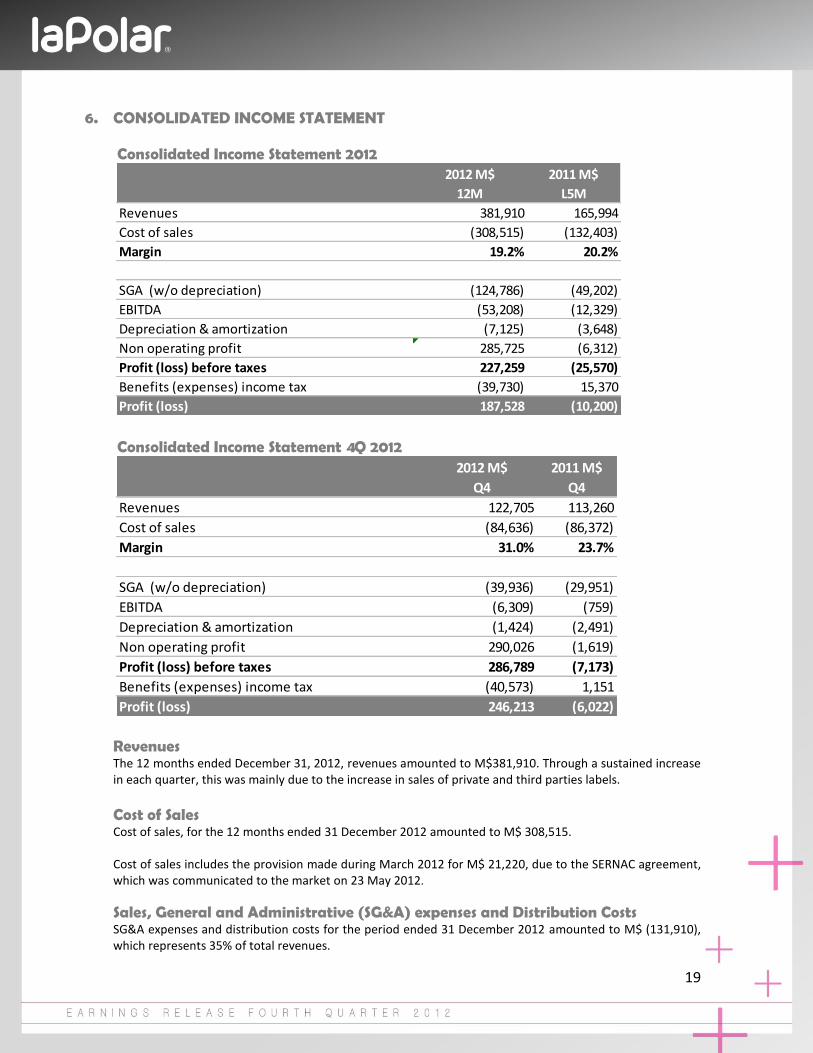
6. CONSOLIDATED INCOME STATEMENT Consolidated Income Statement 2012
Consolidated Income Statement 4Q 2012
Revenues The 12 months ended December 31, 2012, revenues amounted to M$381,910. Through a sustained increase in each quarter, this was mainly due to the increase in sales of private and third parties labels.
Cost of Sales Cost of sales, for the 12 months ended 31 December 2012 amounted to M$ 308,515. Cost of sales includes the provision made during March 2012 for M$ 21,220, due to the SERNAC agreement, which was communicated to the market on 23 May 2012.
Sales, General and Administrative (SG&A) expenses and Distribution Costs SG&A expenses and distribution costs for the period ended 31 December 2012 amounted to M$ (131,910), which represents 35% of total revenues.
2012 M$ 2011 M$
12M L5M
Revenues 381,910 165,994
Cost of sales (308,515) (132,403)
Margin 19.2% 20.2%
SGA (w/o depreciation) (124,786) (49,202)
EBITDA (53,208) (12,329)
Depreciation & amortization (7,125) (3,648)
Non operating profit 285,725 (6,312)
Profit (loss) before taxes 227,259 (25,570)
Benefits (expenses) income tax (39,730) 15,370
Profit (loss) 187,528 (10,200)
2012 M$ 2011 M$
Q4 Q4
Revenues 122,705 113,260
Cost of sales (84,636) (86,372)
Margin 31.0% 23.7%
SGA (w/o depreciation) (39,936) (29,951)
EBITDA (6,309) (759)
Depreciation & amortization (1,424) (2,491)
Non operating profit 290,026 (1,619)
Profit (loss) before taxes 286,789 (7,173)
Benefits (expenses) income tax (40,573) 1,151
Profit (loss) 246,213 (6,022)
20
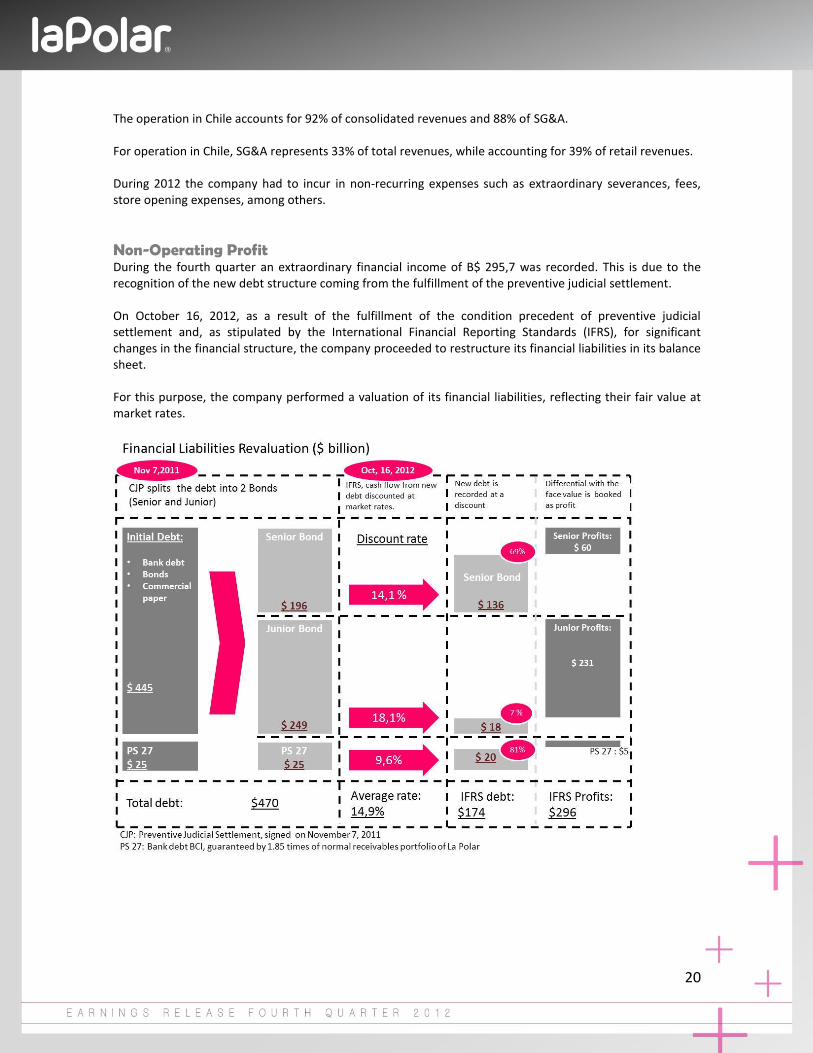
The operation in Chile accounts for 92% of consolidated revenues and 88% of SG&A. For operation in Chile, SG&A represents 33% of total revenues, while accounting for 39% of retail revenues. During 2012 the company had to incur in non-recurring expenses such as extraordinary severances, fees, store opening expenses, among others. Non-Operating Profit During the fourth quarter an extraordinary financial income of B$ 295,7 was recorded. This is due to the recognition of the new debt structure coming from the fulfillment of the preventive judicial settlement. On October 16, 2012, as a result of the fulfillment of the condition precedent of preventive judicial settlement and, as stipulated by the International Financial Reporting Standards (IFRS), for significant changes in the financial structure, the company proceeded to restructure its financial liabilities in its balance sheet. For this purpose, the company performed a valuation of its financial liabilities, reflecting their fair value at market rates.
21
For each of the new financial liabilities of the Company (senior debt, junior debt and Tranche C), 3 discount rates were defined. These rates were obtained based on comparable instruments by:
i) Credit rating, ii) Terms of the debt structure and iii) Guarantees associated to each instrument. Given the "C" rating given by Humphreys and ICR, La Polar rating agencies, and the lack of liquidity and depth in the Chilean market for bonds with this rating, the company had to search for similar instruments in the U.S. market. Hence, we took a sample of 525 C-rated corporate bonds trading in the U.S. market. We adjusted its spread by maturity and differentiated those with guarantees issued. This way we determined an average spread over the reference rate (yield) of treasury bonds issued by the U.S. government. A differentiated spread was determined for each of the 2 bonds, Senior and Junior, as follows: Senior Bond Spread: 8.5% Junior Bond Spread: 12.5% These spreads were then added to the BCP (Bond in Chilean Pesos issued by the Central Bank of Chile). The 10-year BCP yields a rate of 5.6%. Therefore the estimated discount rates for the Senior and Junior bonds are the following: Senior Bond discount rate: 14.1% Junior Bond discount rate: 18.1% For Tranche C (PS 27) rate calculation, it was considered the fact that this particular debt has better guarantees (1.85 times the normal receivables portfolio - see Note 12 of the financial statements for more detail on the guarantee). It was also contemplated the historical rates for securitized bonds and the new terms of this debt. This way a spread of 400 basis points over the benchmark 10-year BCP was defined, obtaining a discount rate of 9.6%. Following the application of the methodology outlined in the previous paragraphs, the average discount rate for the entire debt was 14.94%. Finally we applied the estimated discount rates to the cash flows of the restructured debt, obtaining a fair value of B$174. This amount compared to the nominal value produces a financial profit of B$ 295,7. Furthermore, the Company requested to KPMG LLP an assessment to determine the discount rates. The outcome of this work, which determined the spread based on papers by Professor Aswath Damodaran
1, was
similar to one made by the Company, delivering a difference of only 0.5% in the fair value. Finally, on March 14, 2013, the brokerage house, Larrain Vial S.A., offered to sell through a Dutch auction, bonds of Empresas La Polar. They offered UF 127,500 of 'BLAPO-D' and UF 202,000 of 'BLAPO-E'. Both series of bonds were offered at a minimum of 29.23% (i.e. a discount on face value of 70.77%).
1 Default spreads based upon ratings, January 2012. (www.damodaran.com)
Aswath Damodaran ) , professor at Stern School of Business (NYU
22
The auction final outcome was a value of 31.10% (discount of 68.9%). It is important to remark that Empresas La Polar, nor any of its subsidiaries, was not part of the transaction. The final value (31.10%) is equivalent to use a combined discount rate of approximately 17%, which is 150 basis points higher than the average rate used by the Company. Finally, if we use the spread of 400 basis points, estimated by the Company, to differentiate bonds Senior and Junior, the value obtained in the auction would mean a discount rate of 15.5% for the Senior Notes and 19.5% for the Junior. This means a discount on the face value of 64.2% and 5.1% respectively.
23
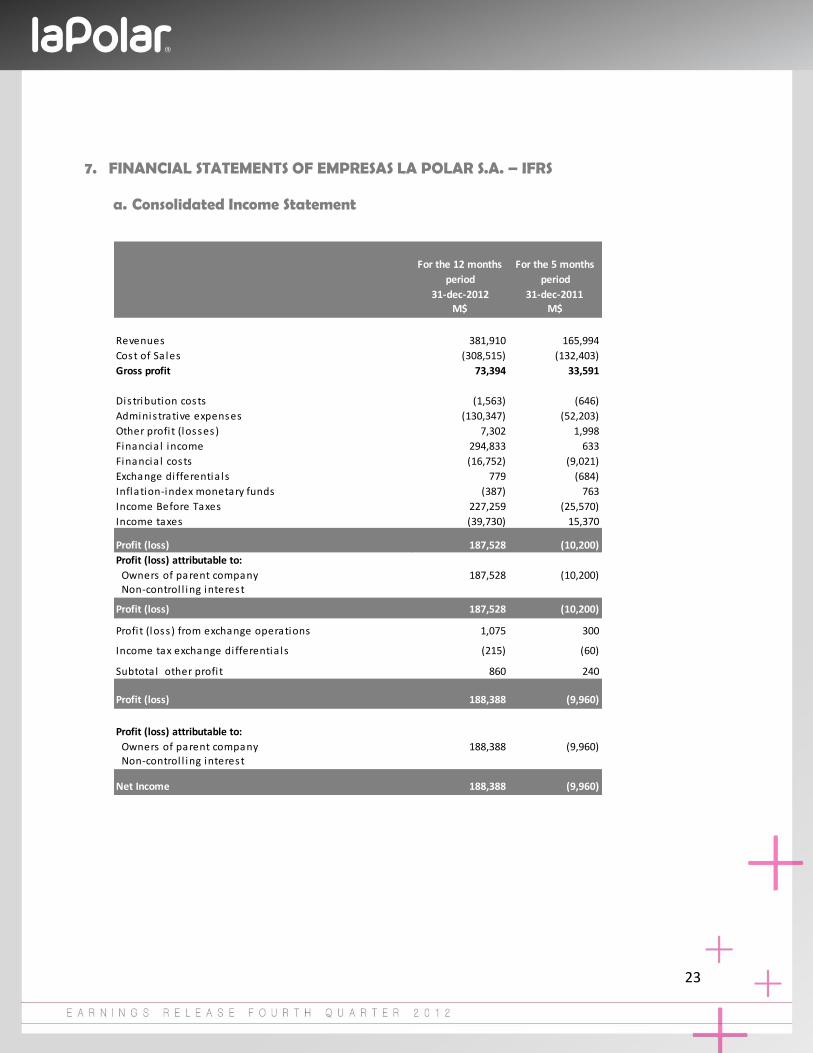
7. FINANCIAL STATEMENTS OF EMPRESAS LA POLAR S.A. – IFRS a. Consolidated Income Statement
For the 12 months
period
For the 5 months
period
31-dec-2012 31-dec-2011M$ M$
Revenues 381,910 165,994
Cost of Sa les (308,515) (132,403)
Gross profit 73,394 33,591
Distribution costs (1,563) (646)
Adminis trative expenses (130,347) (52,203)
Other profi t (losses) 7,302 1,998
Financia l income 294,833 633
Financia l costs (16,752) (9,021)
Exchange di fferentia ls 779 (684)
Inflation-index monetary funds (387) 763
Income Before Taxes 227,259 (25,570)
Income taxes (39,730) 15,370
Profit (loss) 187,528 (10,200)
Profit (loss) attributable to:
Owners of parent company 187,528 (10,200) Non-control l ing interest
Profit (loss) 187,528 (10,200)
Profi t (loss ) from exchange operations 1,075 300
Income tax exchange di fferentia ls (215) (60)
Subtotal other profi t 860 240
Profit (loss) 188,388 (9,960)
Profit (loss) attributable to:
Owners of parent company 188,388 (9,960) Non-control l ing interest
Net Income 188,388 (9,960)
24
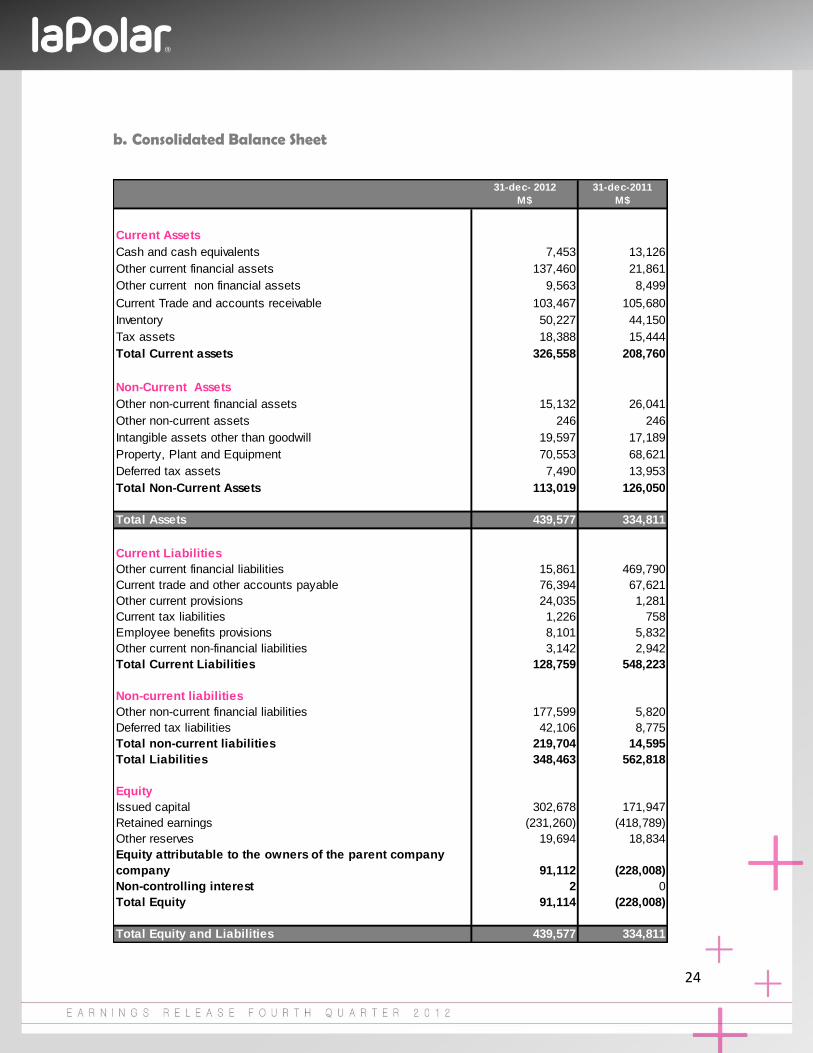
b. Consolidated Balance Sheet
31-dec- 2012 31-dec-2011
M$ M$
Current Assets
Cash and cash equivalents 7,453 13,126
Other current financial assets 137,460 21,861
Other current non financial assets 9,563 8,499
Current Trade and accounts receivable 103,467 105,680
Inventory 50,227 44,150
Tax assets 18,388 15,444
Total Current assets 326,558 208,760
Non-Current Assets
Other non-current financial assets 15,132 26,041
Other non-current assets 246 246
Intangible assets other than goodwill 19,597 17,189
Property, Plant and Equipment 70,553 68,621
Deferred tax assets 7,490 13,953
Total Non-Current Assets 113,019 126,050
Total Assets 439,577 334,811
Current Liabilities
Other current financial liabilities 15,861 469,790
Current trade and other accounts payable 76,394 67,621
Other current provisions 24,035 1,281
Current tax liabilities 1,226 758
Employee benefits provisions 8,101 5,832
Other current non-financial liabilities 3,142 2,942
Total Current Liabilities 128,759 548,223
Non-current liabilities
Other non-current financial liabilities 177,599 5,820
Deferred tax liabilities 42,106 8,775
Total non-current liabilities 219,704 14,595
Total Liabilities 348,463 562,818
Equity
Issued capital 302,678 171,947
Retained earnings (231,260) (418,789)
Other reserves 19,694 18,834
Equity attributable to the owners of the parent company
company 91,112 (228,008)
Non-controlling interest 2 0
Total Equity 91,114 (228,008)
Total Equity and Liabilities 439,577 334,811
25
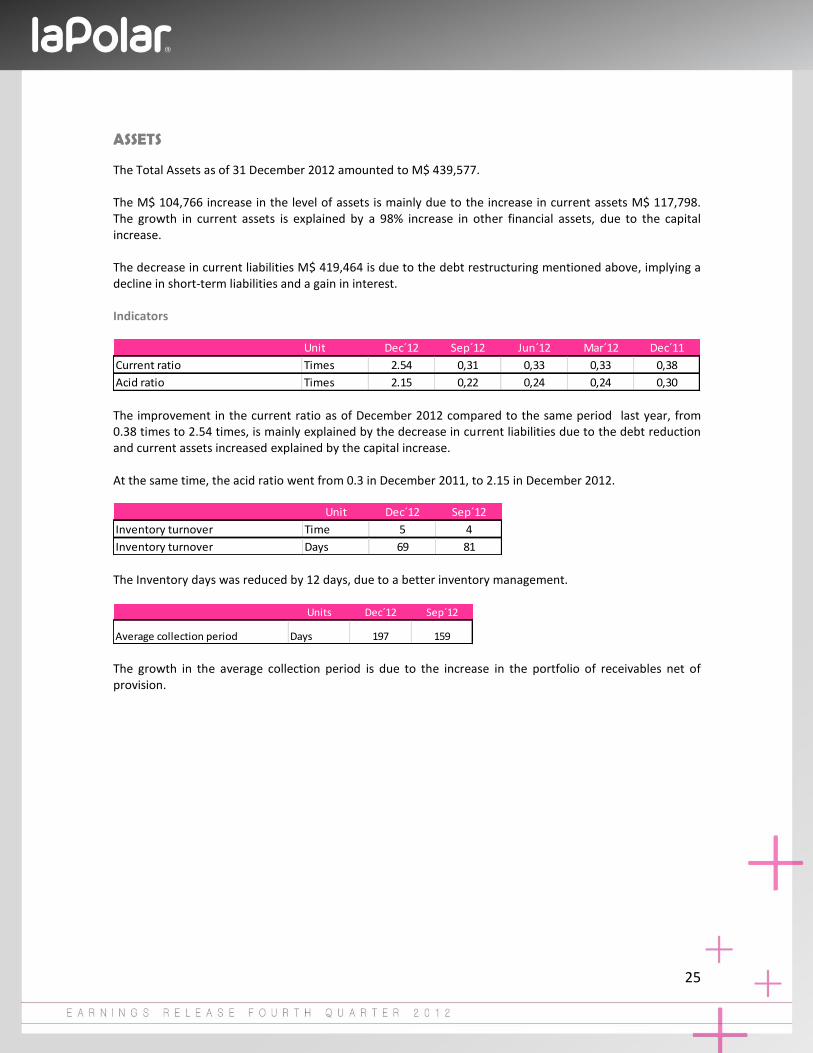
ASSETS The Total Assets as of 31 December 2012 amounted to M$ 439,577. The M$ 104,766 increase in the level of assets is mainly due to the increase in current assets M$ 117,798. The growth in current assets is explained by a 98% increase in other financial assets, due to the capital increase. The decrease in current liabilities M$ 419,464 is due to the debt restructuring mentioned above, implying a decline in short-term liabilities and a gain in interest. Indicators
The improvement in the current ratio as of December 2012 compared to the same period last year, from 0.38 times to 2.54 times, is mainly explained by the decrease in current liabilities due to the debt reduction and current assets increased explained by the capital increase. At the same time, the acid ratio went from 0.3 in December 2011, to 2.15 in December 2012.
The Inventory days was reduced by 12 days, due to a better inventory management.
The growth in the average collection period is due to the increase in the portfolio of receivables net of provision.
Unit Dec´12 Sep´12 Jun´12 Mar´12 Dec´11
Current ratio Times 2.54 0,31 0,33 0,33 0,38
Acid ratio Times 2.15 0,22 0,24 0,24 0,30
Unit Dec´12 Sep´12
Inventory turnover Time 5 4
Inventory turnover Days 69 81
Units Dec´12 Sep´12
Average collection period Days 197 159
26
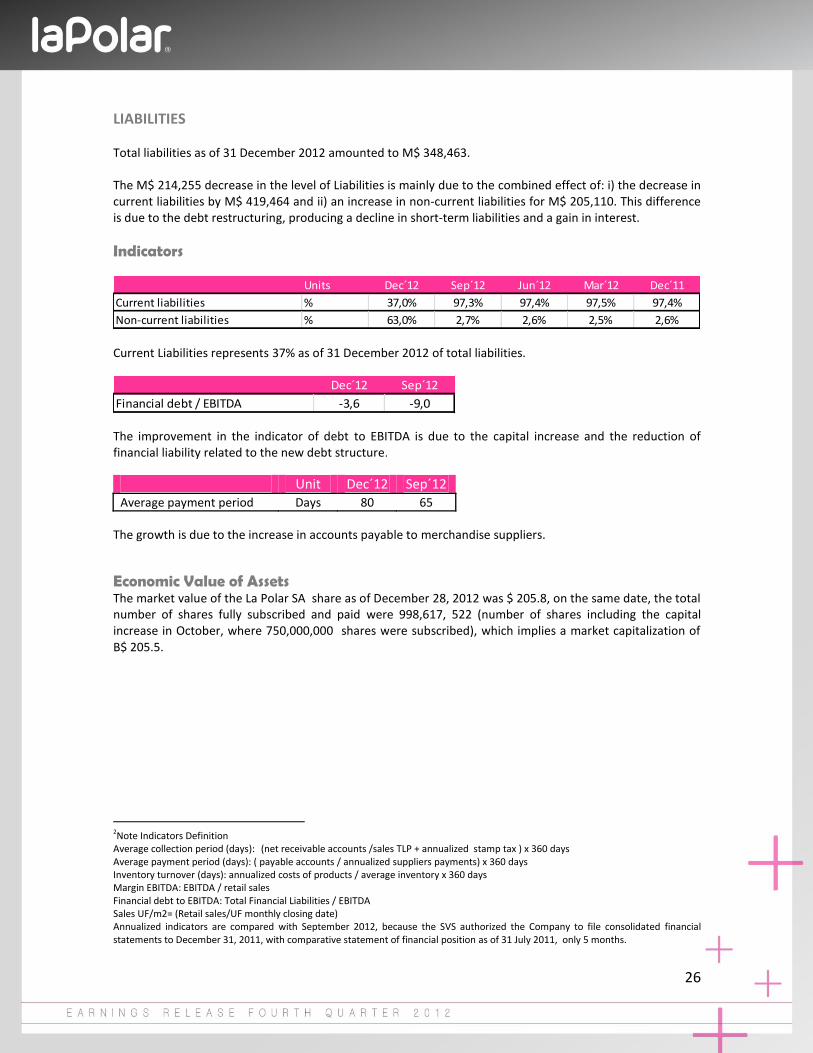
LIABILITIES Total liabilities as of 31 December 2012 amounted to M$ 348,463. The M$ 214,255 decrease in the level of Liabilities is mainly due to the combined effect of: i) the decrease in current liabilities by M$ 419,464 and ii) an increase in non-current liabilities for M$ 205,110. This difference is due to the debt restructuring, producing a decline in short-term liabilities and a gain in interest.
Indicators
Current Liabilities represents 37% as of 31 December 2012 of total liabilities.
The improvement in the indicator of debt to EBITDA is due to the capital increase and the reduction of financial liability related to the new debt structure.
Unit Dec´12 Sep´12 Average payment period Days 80 65
The growth is due to the increase in accounts payable to merchandise suppliers. Economic Value of Assets The market value of the La Polar SA share as of December 28, 2012 was $ 205.8, on the same date, the total number of shares fully subscribed and paid were 998,617, 522 (number of shares including the capital increase in October, where 750,000,000 shares were subscribed), which implies a market capitalization of B$ 205.5.
2
2Note Indicators Definition Average collection period (days): (net receivable accounts /sales TLP + annualized stamp tax ) x 360 days Average payment period (days): ( payable accounts / annualized suppliers payments) x 360 days Inventory turnover (days): annualized costs of products / average inventory x 360 days Margin EBITDA: EBITDA / retail sales Financial debt to EBITDA: Total Financial Liabilities / EBITDA Sales UF/m2= (Retail sales/UF monthly closing date) Annualized indicators are compared with September 2012, because the SVS authorized the Company to file consolidated financial statements to December 31, 2011, with comparative statement of financial position as of 31 July 2011, only 5 months.
Units Dec´12 Sep´12 Jun´12 Mar´12 Dec´11
Current liabilities % 37,0% 97,3% 97,4% 97,5% 97,4%
Non-current liabilities % 63,0% 2,7% 2,6% 2,5% 2,6%
Dec´12 Sep´12
Financial debt / EBITDA -3,6 -9,0
27
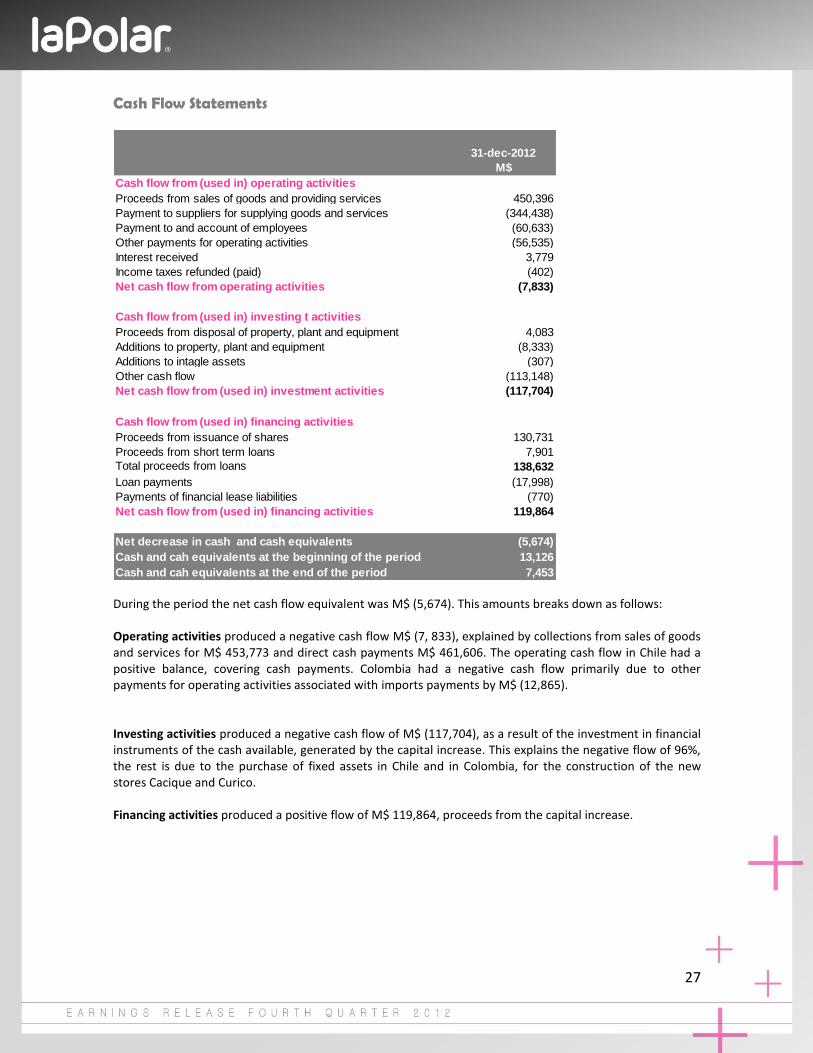
Cash Flow Statements
During the period the net cash flow equivalent was M$ (5,674). This amounts breaks down as follows: Operating activities produced a negative cash flow M$ (7, 833), explained by collections from sales of goods and services for M$ 453,773 and direct cash payments M$ 461,606. The operating cash flow in Chile had a positive balance, covering cash payments. Colombia had a negative cash flow primarily due to other payments for operating activities associated with imports payments by M$ (12,865). Investing activities produced a negative cash flow of M$ (117,704), as a result of the investment in financial instruments of the cash available, generated by the capital increase. This explains the negative flow of 96%, the rest is due to the purchase of fixed assets in Chile and in Colombia, for the construction of the new stores Cacique and Curico. Financing activities produced a positive flow of M$ 119,864, proceeds from the capital increase.
31-dec-2012
M$
Cash flow from (used in) operating activities
Proceeds from sales of goods and providing services 450,396
Payment to suppliers for supplying goods and services (344,438)
Payment to and account of employees (60,633)
Other payments for operating activities (56,535)
Interest received 3,779
Income taxes refunded (paid) (402)
Net cash flow from operating activities (7,833)
Cash flow from (used in) investing t activities
Proceeds from disposal of property, plant and equipment 4,083
Additions to property, plant and equipment (8,333)
Additions to intagle assets (307)
Other cash flow (113,148)
Net cash flow from (used in) investment activities (117,704)
Cash flow from (used in) financing activities
Proceeds from issuance of shares 130,731
Proceeds from short term loans 7,901
Total proceeds from loans 138,632
Loan payments (17,998)
Payments of financial lease liabilities (770)
Net cash flow from (used in) financing activities 119,864
Net decrease in cash and cash equivalents (5,674)
Cash and cah equivalents at the beginning of the period 13,126
Cash and cah equivalents at the end of the period 7,453
28
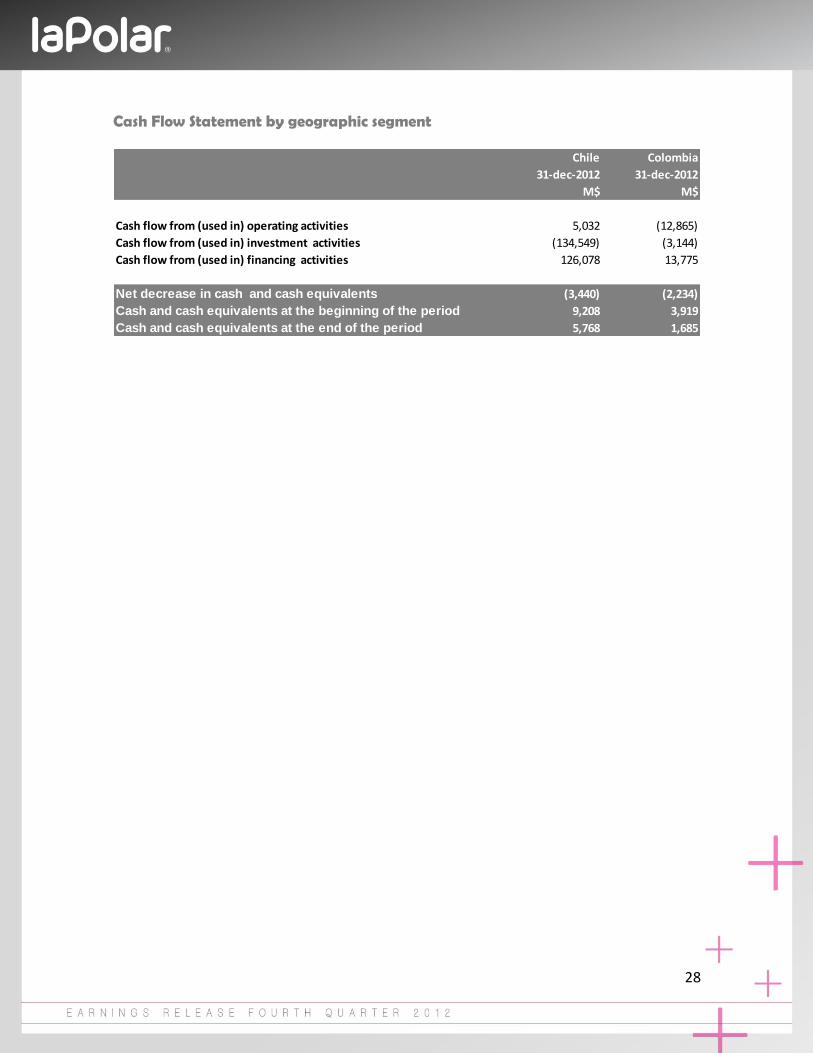
Cash Flow Statement by geographic segment
Chile Colombia
31-dec-2012 31-dec-2012
M$ M$
Cash flow from (used in) operating activities 5,032 (12,865)
Cash flow from (used in) investment activities (134,549) (3,144)
Cash flow from (used in) financing activities 126,078 13,775
Net decrease in cash and cash equivalents (3,440) (2,234)
Cash and cash equivalents at the beginning of the period 9,208 3,919
Cash and cash equivalents at the end of the period 5,768 1,685