fourth quarter 2014 conference call
TRANSCRIPT

1
1
March 2015
L AK E S H O R E G O L D C O R P.
Full-Year & Fourth Quarter 2014
March 26, 2015

2
Information included in this presentation relating to the Company's expected production levels, production growth, costs, cash flows, economic returns, exploration
activities, potential for increasing resources, project expenditures and business plans are "forward-looking statements" or "forward-looking information" within the meaning
of certain securities laws, including under the provisions of Canadian provincial securities laws and under the United States Private Securities Litigation Reform Act of
1995 and are referred to herein as "forward-looking statements." The Company does not intend, and does not assume any obligation, to update these forward-looking
statements. These forward-looking statements represent management's best judgment based on current facts and assumptions that management considers reasonable,
including that operating and capital plans will not be disrupted by issues such as mechanical failure, unavailability of parts, labour disturbances, interruption in
transportation or utilities, or adverse weather conditions, that there are no material unanticipated variations in budgeted costs, that contractors will complete projects
according to schedule, and that actual mineralization on properties will be consistent with models and will not be less than identified mineral reserves. The Company
makes no representation that reasonable business people in possession of the same information would reach the same conclusions. Forward-looking statements involve
known and unknown risks, uncertainties and other factors which may cause the actual results, performance or achievements of the Company to be materially different
from any future results, performance or achievements expressed or implied by the forward-looking statements. In particular, delays in development or mining and
fluctuations in the price of gold or in currency markets could prevent the Company from achieving its targets. Readers should not place undue reliance on forward-looking
statements. More information about risks and uncertainties affecting the Company and its business is available in the Company's most recent Annual Information Form
and other regulatory filings with the Canadian Securities Administrators, which are posted on sedar at www.sedar.com, or the Company’s most recent Annual Report on
Form 40-F and other regulatory filings with the Securities and Exchange Commission.
QUALITY CONTROL
Lake Shore Gold has a quality control program to ensure best practices in the sampling and analysis of drill core. A total of three Quality Control samples consisting of 1
blank, 1 certified standard and 1 reject duplicate are inserted into groups of 20 drill core samples. The blanks and the certified standards are checked to be within
acceptable limits prior to being accepted into the GEMS SQL database. Routine assays have been completed using a standard fire assay with a 30-gram aliquot. For
samples that return a value greater than three grams per tonne gold on exploration projects and greater than 10 gpt at the Timmins mine and Thunder Creek underground
project, the remaining pulp is taken and fire assayed with a gravimetric finish. Select zones with visible gold are typically tested by pulp metallic analysis on some projects.
NQ size drill core is saw cut and half the drill core is sampled in standard intervals. The remaining half of the core is stored in a secure location. The drill core is
transported in security-sealed bags for preparation at ALS Chemex Prep Lab located in Timmins, Ontario, and the pulps shipped to ALS Chemex Assay Laboratory in
Vancouver, B.C. ALS Chemex is an ISO 9001-2000 registered laboratory preparing for ISO 17025 certification.
QUALIFIED PERSON
Scientific and technical information related to mine production and reserves contained in this presentation has been reviewed and approved by Natasha Vaz, P.Eng., Vice-
President, Technical Services, who is an employee of Lake Shore Gold Corp., and a “qualified person” as defined by National Instrument 43-101 – Standards of
Disclosure for Mineral Projects (“NI 43-101”).
Scientific and technical information related to resources, drilling and all matters involving mine production geology, as well as exploration drilling, contained in this
presentation, or source material for this presentation, was reviewed and approved by Eric Kallio, P.Geo., Senior Vice-President, Exploration. Mr. Kallio is an employee of
Lake Shore Gold Corp., and is a “qualified person” as defined by NI 43-101.

3
(1) Example of non-GAAP measure, see Slide 15 for more information
(2) All-in sustaining costs
Record production 185,600 oz
2014 target: 160,000 to 180,000 oz
Cash Operating Costs(1) US$592/oz sold
2014 target: US$675 to US$775
AISC(1)(2) US$872/oz sold
2014 target: US$950 to US$1,050
Debt repayments $44.7M
2014 target: US$20.0 to US$25.0M
Increased ore reserves 29%
2014 target: replace reserves mined in 2014
4
Increased cash and bullion $27.5M (from $34.0M to $61.5M)
• Current cash and bullion @ $75M
Net earnings $23.6M ($0.06 per share)
• Adjusted net earnings(1) $28.6M ($0.07 per share)
Major new discovery to drive future resource growth (144 Gap
Zone)
(1) Example of non-GAAP measure, see Slide 15 for more information

5
Produced 43,200 oz
Cash Operating Costs US$597/oz
AISC US$915/oz
Repaid $23.7M of debt (includes final $20.0M owing on standby
line)
Adjusted net earnings of $2.5M or $0.01/share
Net loss of $1.5M ($0.00)/share included $3.6M expense related
to early debt repayment

6
Reserves Increased 29% to 773,300 Ounces
As at December 31, 2014 Contained Metal
Tonnes Grade Ounces
Timmins Deposit Probable Reserve 1,517,000 4.4 214,300
Thunder Creek Probable Reserve 2,174,000 4.2 295,400
Total Timmins West Mine
Total Probable Reserve 3,691,000 4.3 509,700
As at December 31, 2014 Tonnes Grade Ounces
Bell Creek Mine
Proven Reserve 172,000 4.5 24,900
Probable Reserve 1,620,000 4.6 238,700
Total 1,792,000 4.6 263,600
Tonnes Grade Ounces
Total Proven and Probable Reserves 5,483,000 4.4 773,300

7
As at December 31, 2014 Before Depletion After Depletion
Deposit
Change in Reserves 2014 Depletion Change in Reserves
Tonnes Ounces Au Tonnes Ounces Au Tonnes Ounces Au
('000) ('000 oz) ('000) ('000 oz) ('000) ('000 oz)
Timmins West Mine 1,331,200 164,100 (971,200) (146,600) 360,000 17,500
Bell Creek 1,360,000 202,500 (274,700) (45,500) 1,085,400 157,000
TOTAL 2,691,200 366,600 (1,245,900) (192,100) 1,445,400 174,500
366,600 Ounces Added to Reserves, 174,500 Ounces After
Depletion
8
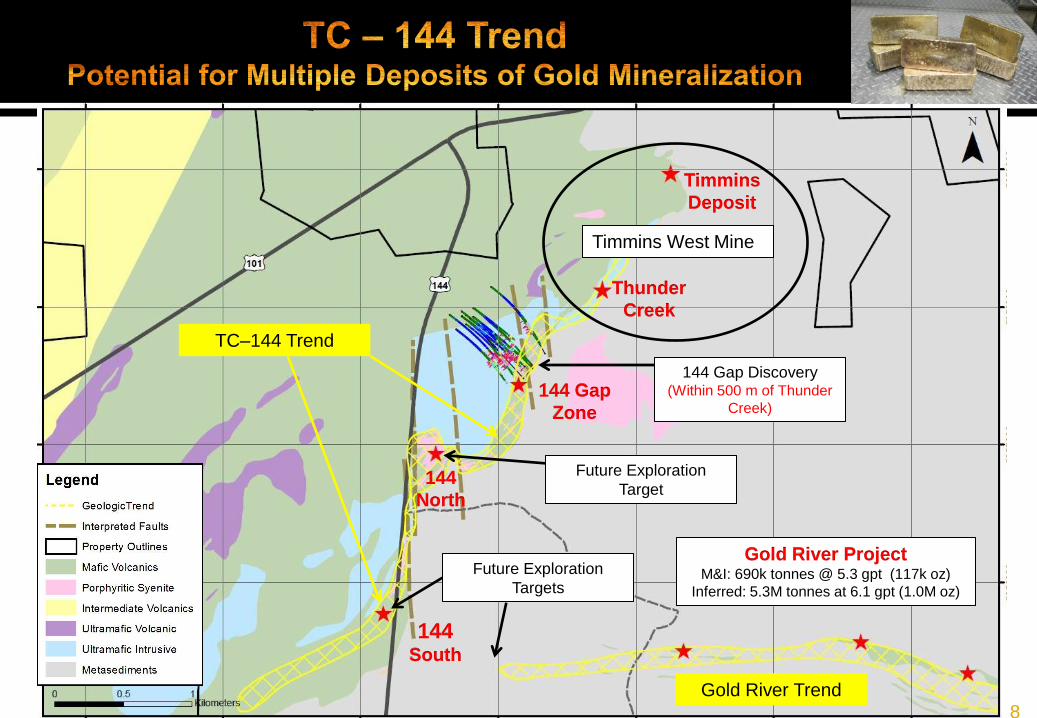
Timmins West Mine
144 Gap Discovery (Within 500 m of Thunder
Creek)
Future Exploration
Target
Future Exploration
Targets
Gold River Trend
TC–144 Trend
Gold River Project M&I: 690k tonnes @ 5.3 gpt (117k oz)
Inferred: 5.3M tonnes at 6.1 gpt (1.0M oz)
Timmins
Deposit
Thunder
Creek
144 Gap
Zone
144
North
144 South

9
$18.0M exploration
program in 2015
@ 120,000 metres
exploration drilling
planned in 2015
@ 90,000 m surface
@ 30,000 m U/G
U/G exploration drift
advanced >200 metres,
to be completed in
Q3/15
Exploration Drift
1,200 m development
30,000 m U/G drilling

10
Shaft
Planned drift
Existing infrastructure
OPEN OPEN
OPEN
350m
350m

11
HWY-14-48(1)
5.37gpt/46.00m
4.06gpt/5.10m
5.76gpt/1.20m
(Oct. 2014)
Planned drift
Existing infrastructure
Thunder Creek
Deposit
(1) First hole reported from new drill program launched in H2/14
14-63
14-70
15-79
14-59
15-76
15-80
15-75
15-84
15-74
15-71
15-78
14-65
15-74W1
15-83

12
On track for solid quarter
• Production and grades tracking positively
• Costs beating targets
Generating solid free cash flow
Cash and bullion increased to @ $75M (from $61.5M at Dec.
31/14)
Senior secured debt reduced to @ $3.5M

13
(1) Assuming LSG’s year-to-date average C$ selling price for full year and current business plan
Production 170,000 to 180,000 ounces
Cash Operating Costs US$650/oz to US$700/oz
AISC US$950/oz to US$1,000/oz
On track for +$100M of cash and bullion by year end(1)
Eliminate senior secured debt by end of May
Replace reserves mined
First resource at 144 Gap Zone (to be release in early 2016)

14
14
March 2015
L AK E S H O R E G O L D C O R P.
Full-Year & Fourth Quarter 2014
March 26, 2015

15
Cash Operating Costs per Ounce
Cash operating cost per ounce is a Non-GAAP measure. In the gold mining industry, cash operating cost per ounce is a common performance measure but does not
have any standardized meaning. Cash operating costs per ounce are based on ounces sold and are derived from amounts included in the Consolidated Statements of
Comprehensive Loss (Income) and include mine site operating costs such as mining, processing and administration, but exclude depreciation, depletion and share-based
payment expenses and reclamation costs. The Company discloses cash cost per ounce as it believes this measure provides valuable assistance to investors and
analysts in evaluating the Company’s performance and ability to generate cash flow. This measure should not be considered in isolation or as a substitute for measures
prepared in accordance with GAAP such as total production costs. A reconciliation of cash operating costs and cash operating cost per ounce to total production costs for
the years ended December 31, 2014 and 2013 is set out on page 19 of the Company’s 2014 and fourth quarter of 2014 MD&A.
All-In Sustaining Costs per Ounce
Effective the second quarter 2013, the Company has adopted a total all-in sustaining cost (“AISC”) performance measure. AISC is a Non-GAAP measure. The measure
is intended to assist readers in evaluating the total costs of producing gold from current operations. While there is no standardized meaning across the industry for this
measure, the Company’s definition conforms to the AISC definition as set out by the World Gold Council in its guidance note dated June 27, 2013. The Company defines
all-in sustaining cost as the sum of cash costs from mine operations, sustaining capital (capital required to maintain current operations at existing levels), corporate
general and administrative expenses, in-mine exploration expenses and reclamation cost accretion related to current operations. All-in sustaining cost excludes growth
capital, reclamation cost accretion not related to current operations and interest and other financing costs. A reconciliation of all-in sustaining costs and all-in sustaining
cost per ounce to total production costs for the years ended December 31, 2014 and 2013 is set out on page 20 of the Company’s 2014 and fourth quarter 2014 MD&A.
Cash Earnings from Mine Operations
Cash earnings from mine operations is a Non-GAAP measure and does not have any standardized meaning. The Company discloses cash earnings from mine
operations as it believes this measure provides valuable assistance to investors and analysts in evaluating the Company’s ability to finance its ongoing business and
capital activities. The most directly comparable measure prepared in accordance with GAAP is earnings from mine operations. Cash earnings from mine operations
represent the earnings from mine operations prior to deducting non-cash expenses, and is calculated by adding depletion, depreciation and share-based payments in
production costs to earnings from mine operations. A reconciliation of cash earnings from mine operations to earnings from mine operations for the years ended
December 31, 2014 and 2013 is set out on page 20 of this MD&A.
Adjusted Net Earnings
Adjusted net earnings (loss) excludes impairment charges, other income/losses (which includes gains/losses and other costs incurred for acquisition and disposal of
mining interests, unrealized and non–cash realized gains/losses on financial instruments) as well as significant non-cash non-recurring items. The Company also
excludes the net (earnings) losses from the Company’s investments in associates as well as write down/off of investments in associates. The Company excludes these
items from net earnings (losses) to provide a measure which allows the Company and investors to evaluate the operating results of the core operations of the Company
and its ability to generate operating cash flows to fund working capital requirements, future capital expenditures and service outstanding debt. A reconciliation of adjusted
net earnings (loss) to net earnings (loss) for the years ended December 31, 2014 and 2013 is set out on page 21 of the Company’s 2014 and fourth quarter of 2013
MD&A.
(1) More information about cash operating costs and all-in sustaining costs and other Non-GAAP measures, including reconciliations of these measures to the most directly
comparable GAAP measures, is provided on pages 23 – 25 of the Company’s full-year and fourth quarter 2014 Management’s Discussion & Analysis, which is posted at
www.sedar.com and on the Company’s website at www.lsgold.com.