fourth quarter fiscal year 2020 conference call
TRANSCRIPT

PUBLIC
Fourth QuarterFiscal Year 2020 Conference Call
November 10, 2020
1

PUBLIC| Copyright ©2020 Rockwell Automation, Inc. |
THIS PRESENTATION INCLUDES GUIDANCE AND OTHERSTATEMENTS RELATED TO THE EXPECTED FUTURE RESULTS OFTHE COMPANY AND ARE THEREFORE FORWARD-LOOKINGSTATEMENTS. ACTUAL RESULTS MAY DIFFER MATERIALLY FROMTHOSE PROJECTIONS DUE TO A WIDE RANGE OF RISKS ANDUNCERTAINTIES, MANY OF WHICH ARE BEYOND OUR CONTROL,INCLUDING THE SEVERITY AND DURATION OF THE IMPACTS OFTHE COVID-19 PANDEMIC AND EFFORTS TO MANAGE IT ON THEGLOBAL ECONOMY, LIQUIDITY AND FINANCIAL MARKETS,DEMAND FOR OUR HARDWARE AND SOFTWARE PRODUCTS,SOLUTIONS AND SERVICES, OUR SUPPLY CHAIN, OUR WORKFORCE, OUR LIQUIDITY AND THE VALUE OF THE ASSETS WEOWN, AS WELL AS THOSE RISKS AND UNCERTAINTIES THAT ARELISTED IN OUR SEC FILINGS.
THIS PRESENTATION ALSO CONTAINS NON-GAAP FINANCIALINFORMATION AND RECONCILIATIONS TO GAAP ARE INCLUDEDIN THE APPENDIX. ALL INFORMATION SHOULD BE READ INCONJUNCTION WITH OUR HISTORICAL FINANCIAL STATEMENTS.
Safe Harbor Statement
2

PUBLIC| Copyright ©2020 Rockwell Automation, Inc. |
▪ Organic sales down (12)% YOY; up 10% sequentially– Logix down at about the company average, led by Oil & Gas– Drives and Motion outperformance in sales and orders
– Exceptional order intake for Independent Cart Technology
▪ Information Solutions & Connected Services (IS/CS) saw strong double-digit orders growth YOY
▪ Recent acquisitions performing well– Kalypso had the strongest order quarter ever– ASEM sales better than expected
▪ Segment operating margin flat YOY at 20.2%, despite lower sales
▪ Adjusted EPS of $1.87; down (7)% YOY
3
Q4 FY20 Results Highlights
Continued Sequential Improvement

PUBLIC| Copyright ©2020 Rockwell Automation, Inc. |
Q4 FY20 Organic Industry Segment Performance
4
% of Q4 FY20 Sales
Q4 FY20vs. Q4 FY19 Q4 FY20 vs. Q4 FY19
~ 25% Down ~10% Automotive down ~20% Semiconductor up high single digits
~ 45% Down ~5% Food & Beverage down low single digits Life Sciences down low single digits Tire down double digits
Note: Organic sales growth rates depicted above exclude the impact of acquisitions and currency
Discrete
~ 30% Down ~20% O&G down ~35% Mining/Aggregate/Cement down double digits Chemicals down double digits
Hybrid
Process

PUBLIC| Copyright ©2020 Rockwell Automation, Inc. |
Q4 Highlights *
• North America decline led by Oil & Gas, Metals, and Automotive
• EMEA performance impacted by weak process industries and Tire
• Asia Pacific down due to Automotive and Mass Transit
• Latin America decline primarily due to Mining and Oil & Gas
• Emerging markets in-line with Company average
* All growth comments refer to organic growth
Q4 and Full Year FY20 Organic Sales GrowthNorth America Q4: (11.8)% FY: (8.5)%
Latin AmericaQ4: (17.9)% FY: (9.5)%
EMEAQ4: (12.3)% FY: (6.5)%
Asia PacificQ4: (9.4)% FY: (5.3)%
5

PUBLIC| Copyright ©2020 Rockwell Automation, Inc. |
Full Year FY20 Highlights
6
▪ Reported sales down (5.5)% YOY; inorganic investments contributed +3.5%
▪ Organic sales down (7.8)% YOY
– Logix down (6)%
– IS/CS ended the year with ~$400M in organic sales and double-digit orders growth
▪ Adjusted EPS of $7.68; down (11)% YOY
▪ Free Cash Flow of $1B; 112% conversion
– Includes a $50M pre-tax discretionary contribution to the U.S. pension trust
▪ Increased organic investments in software
▪ Deployed ~$550M on strategic inorganic investments and ~$735M on dividends and share repurchases
Prioritizing employee and customer safetySuccessfully managing through COVID and protecting key investments
PUBLIC| Copyright ©2020 Rockwell Automation, Inc. |
Full Year FY21 Outlook Highlights
7
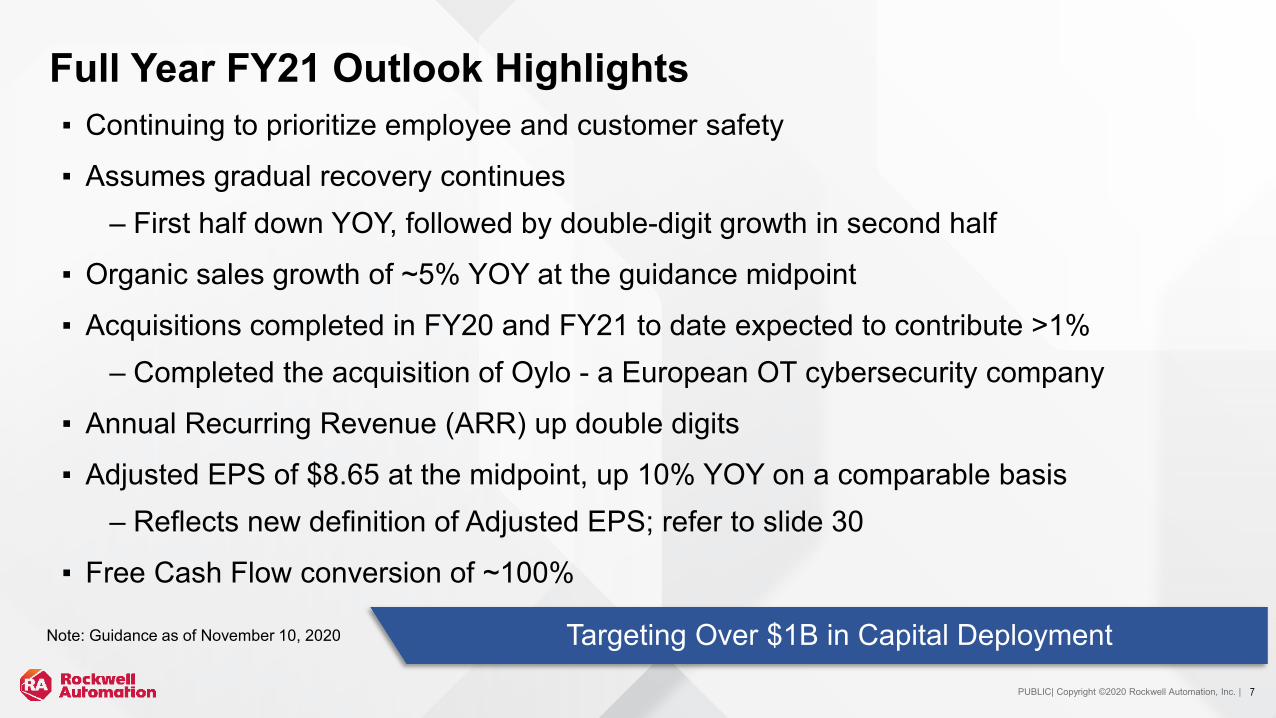
▪ Continuing to prioritize employee and customer safety
▪ Assumes gradual recovery continues– First half down YOY, followed by double-digit growth in second half
▪ Organic sales growth of ~5% YOY at the guidance midpoint
▪ Acquisitions completed in FY20 and FY21 to date expected to contribute >1%– Completed the acquisition of Oylo - a European OT cybersecurity company
▪ Annual Recurring Revenue (ARR) up double digits
▪ Adjusted EPS of $8.65 at the midpoint, up 10% YOY on a comparable basis– Reflects new definition of Adjusted EPS; refer to slide 30
▪ Free Cash Flow conversion of ~100%
Targeting Over $1B in Capital Deployment Note: Guidance as of November 10, 2020

PUBLIC| Copyright ©2020 Rockwell Automation, Inc. |
FY21 Organic Industry Segment Outlook
8
% of FY20 Sales
FY21Vs FY20 Assumptions at Guidance Mid-Point
~ 25%Up mid
single digits Automotive up ~10% Semiconductor up mid single digits
~ 40%Up mid
single digits
Food & Beverage up mid single digits Life Sciences up ~10% Tire up mid single digits
Discrete
~ 35%Up low
single digits
Oil & Gas flat Mining/Aggregate/Cement up high single digits Chemicals up mid single digits
Hybrid
Process
Note: Organic sales growth rates depicted above exclude the impact of acquisitions and currency
Note: Guidance as of November 10, 2020

PUBLIC| Copyright ©2020 Rockwell Automation, Inc. |
Q4 FY20 Key Financial Information($ in millions, except per share amounts)
SALES
GENERAL CORPORATE - NET
ADJUSTED EPS
ADJUSTED EFFECTIVE TAX RATE
FREE CASH FLOW
SEGMENT OPERATING MARGIN
$1,570
20.2%
$22
$1.87
15.0%
$304
$1,730
20.2%
$36
$2.01
17.0%
$451
0 bps
$14
(7)%
200 bps
$(147)
Q4 2020 Q4 2019 YOY B/(W)
Organic Growth (12.1)%Inorganic Growth +3.1%Currency Translation (0.3)%
Reported Growth (9.3)%
9

PUBLIC| Copyright ©2020 Rockwell Automation, Inc. |
Q4 FY20 Segment Results
$702.8 ARCHITECTURE
& SOFTWARE
• Organic sales up ~10% sequentially• Segment operating margin up YOY despite impact
of lower sales
CONTROL PRODUCTS & SOLUTIONS
27.2%+100 bps YOY
+340 bps seq
• Organic sales up ~10% sequentially• Products down (11)% and Solutions & Services
down (14)% organically YOY• Segment operating margin down YOY primarily due
to lower sales
(in millions)
$867.2 14.6% (60) bps YOY
+400 bps seq
SALES($ in millions)
SEGMENT OPERATINGMARGIN HIGHLIGHTS
Organic (11.3)%Inorganic +1.3%Currency —%
Reported (10.0)%
Organic (12.7)%Inorganic +4.6%Currency (0.5)%
Reported (8.6)%
10

PUBLIC| Copyright ©2020 Rockwell Automation, Inc. |
$2.01 $1.87
~$(0.15)
~$(0.05) ~$0.00 ~$0.00
~$0.05
FY19 Q4 Core FX Tax Rate Interest & Shares Acquisitions (excl. Interest)
FY20 Q4
Q4 FY19 to Q4 FY20 Adjusted EPS Walk
11
1 Sensia within acquisitions consists of the incremental operating earnings, intangible amortization, transaction fees, setup costs, and non-controlling interest adjustments related to Schlumberger’s ownership in Sensia.
1

PUBLIC| Copyright ©2020 Rockwell Automation, Inc. |
Full Year FY20 Key Financial Information(in millions, except per share amounts)
SALES
GENERAL CORPORATE - NET
ADJUSTED EPS
ADJUSTED EFFECTIVE TAX RATE
FREE CASH FLOW1
SEGMENT OPERATING MARGIN
2020 2019 YOY B/(W)
ROIC
$6,330
19.9%
$99
$7.68
12.0%
$1,007
35.7%
$6,695
22.0%
$109
$8.67
17.9%
$1,049
27.0%
(210) bps
$10
(11)%
(590) bps
$(42)
870 bps
12
Organic Growth (7.8)%Inorganic Growth +3.5%Currency Translation (1.2)%
Reported Growth (5.5)%
1Fiscal 2020 includes a discretionary pre-tax contribution of $50.0 million to the Company's U.S. pension trust.

PUBLIC| Copyright ©2020 Rockwell Automation, Inc. | 13
Q2-Q4 FY20 Global Daily Average Product Order Trends
January February March April May June July August September
$
Impact of large Independent Cart Technology order booked in September

PUBLIC| Copyright ©2020 Rockwell Automation, Inc. |
Fiscal 2021 guidanceFull year outlook
Sales Midpoint ~ $6.8B
Organic Growth Range 3.5% - 6.5%
Inorganic Growth 1.0% - 1.5%
Currency Translation ~ 1%
Segment Operating Margin 20.0% - 20.5%
Adjusted Effective Tax Rate ~ 14%
Adjusted EPS (new definition) 1, 2 $8.45 - $8.85
Free Cash Flow as a % of Adjusted Income ~ 100%
Note: As of November 10, 20201 Based on Adjusted Income attributable to Rockwell, which includes an adjustment for Schlumberger's non-controlling interest in Sensia. 2 This compares to fiscal 2020 Adjusted EPS of $7.87 under the new definition. A reconciliation of fiscal 2020 diluted EPS to Adjusted EPS in the new definition is included on page 30.
14

PUBLIC| Copyright ©2020 Rockwell Automation, Inc. |
$7.68 $7.87
$8.65
$0.19
~$1.90
~$(1.15)
~$0.10 ~$(0.15) ~$0.10
FY20 Actual -Old Definition
PurchaseAccounting
FY20 Actual -New Definition
Core IncentiveCompensation/
Temporary Actions
FX Tax Rate Acquisitions (excl. Interest)
FY21 GuidanceMidpoint
Fiscal 2020 to Fiscal 2021 Midpoint Adjusted EPS Walk
15

PUBLIC| Copyright ©2020 Rockwell Automation, Inc. | 16
Capital Deployment Framework

PUBLIC| Copyright ©2020 Rockwell Automation, Inc. |
New Operating Segments to Simplify and Accelerate Profitable Growth
17
2020 Total Fiscal Year Sales and Product Available Market (PAM)
CONTROL PRODUCTS & SOLUTIONS
ARCHITECTURE & SOFTWARE
$2.8B
$3.5B
INTELLIGENT DEVICES
$2.9B
SOFTWARE & CONTROL
$1.7B
LIFECYCLESERVICES
$1.7B
~$25B PAM
~$35B PAM ~$35B PAM
SOLUTIONS(24%)
PRODUCTS(66%)
SERVICES(10%)

AppendixSupplemental Financial Information and Reconcilations to Non-GAAP Measures
18

PUBLIC| Copyright ©2020 Rockwell Automation, Inc. |
New Operating Segments Composition
19
Former A&S businessFormer CP&S business
Intelligent Devices
▪Drives▪Motion▪Safety ▪Sensing▪ Industrial components▪Configured-to-order products
Software & Control Lifecycle Services
▪Control software & hardware▪Visualization software & hardware▪Digital twin & simulation software▪ Information Solutions software
MES software Data analytics IoT visualization Augmented reality Device & enterprise connectivity
▪Network & security infrastructure
▪Consulting▪Professional services
Solutions▪Connected Services
Remote monitoring Network & security Safety services Infrastructure-as-a-service
▪Maintenance services Asset management Field services Workforce training Other support services
▪Sensia business

PUBLIC| Copyright ©2020 Rockwell Automation, Inc. | 20
% of FY20 Sales
FY20vs. FY19 FY20 vs. FY19
~ 25% Down ~5% Automotive down mid single digits Semiconductor up mid single digits
~ 40% Down ~5% Food & Beverage down low single digits Life Sciences down low single digits Tire down double digits
Note: Organic sales growth rates depicted above exclude the impact of acquisitions and currency
Discrete
~ 35% Down ~15% O&G down ~20% Mining/Aggregate/Cement down high single digits Chemicals down double digits
Hybrid
Process
FY20 Organic Industry Segment Performance
PUBLIC| Copyright ©2020 Rockwell Automation, Inc. |
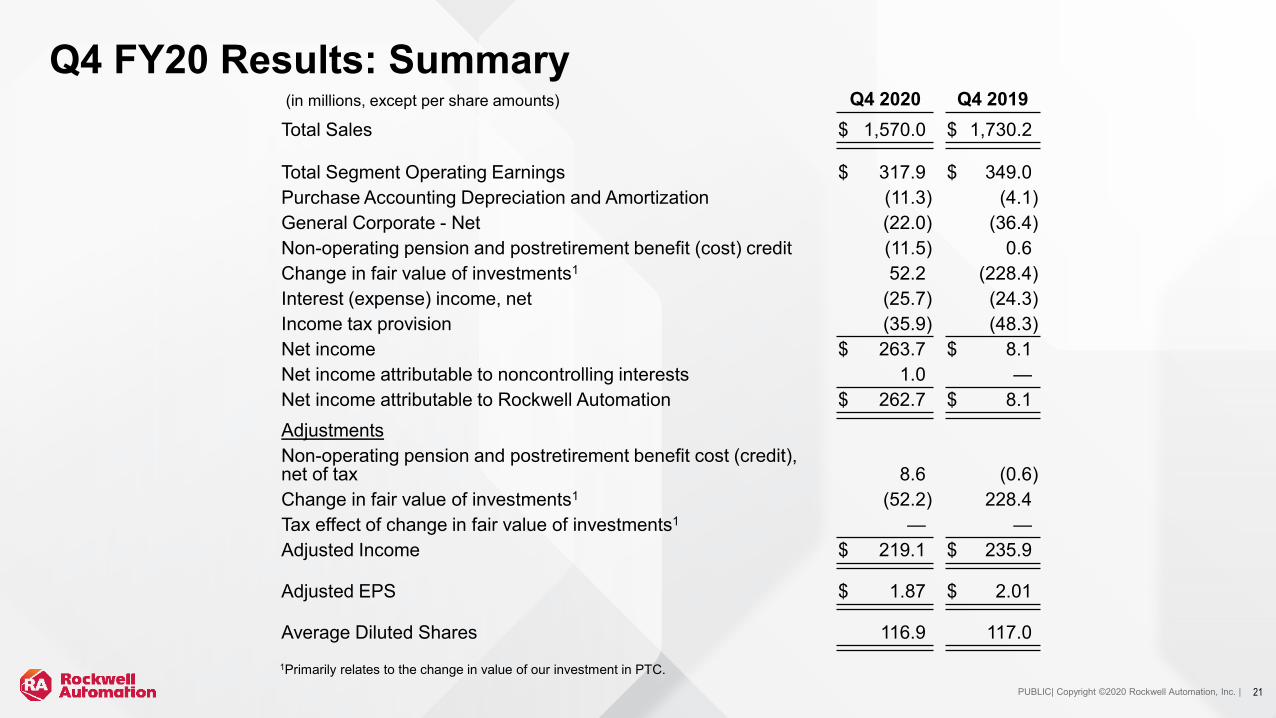
Q4 FY20 Results: Summary(in millions, except per share amounts) Q4 2020 Q4 2019Total Sales $ 1,570.0 $ 1,730.2
Total Segment Operating Earnings $ 317.9 $ 349.0Purchase Accounting Depreciation and Amortization (11.3) (4.1)General Corporate - Net (22.0) (36.4)Non-operating pension and postretirement benefit (cost) credit (11.5) 0.6Change in fair value of investments1 52.2 (228.4)Interest (expense) income, net (25.7) (24.3)Income tax provision (35.9) (48.3)Net income $ 263.7 $ 8.1Net income attributable to noncontrolling interests 1.0 —Net income attributable to Rockwell Automation $ 262.7 $ 8.1AdjustmentsNon-operating pension and postretirement benefit cost (credit), net of tax 8.6 (0.6)Change in fair value of investments1 (52.2) 228.4Tax effect of change in fair value of investments1 — —Adjusted Income $ 219.1 $ 235.9
Adjusted EPS $ 1.87 $ 2.01
Average Diluted Shares 116.9 117.01Primarily relates to the change in value of our investment in PTC.
21

PUBLIC| Copyright ©2020 Rockwell Automation, Inc. |
Free Cash Flow(in millions) Q4 2020 FY 2020Net Income $ 264 $ 1,023Depreciation/Amortization 45 173Retirement Benefits Expense 35 130Receivables/Inventory/Payables 78 16Compensation and Benefits 8 (45)Pension Contributions (59) (84)Income Taxes 4 (78)Change in fair value of investments1 (52) (154)Other 3 140Cash Flow From Operations 326 1,121Capital Expenditures (22) (114)Free Cash Flow $ 304 $ 1,007
Adjusted Income $ 218 $ 897Free Cash Flow as a % of Adjusted Income 139% 112%
1Primarily relates to the change in value of our investment in PTC.
22

PUBLIC| Copyright ©2020 Rockwell Automation, Inc. | 23
Industry Segmentation% of FY20 Sales
Discrete Hybrid Process
Total Discrete Industries ~25% of sales Total Hybrid Industries ~40% of sales Total Process Industries ~35% of sales
~10% Automotive~5% Semiconductor~5% General Industries
• Warehousing & E-commerce • Printing & Publishing• Marine• Glass• Fiber & Textiles• Airports• Aerospace
~5% Other Discrete
~20% Food & Beverage~5% Life Sciences~5% Household & Personal Care~5% Tire~5% Eco Industrial
• Water / Wastewater• Waste Management• Mass Transit• Renewable Energy
~10% Oil & Gas~5% Mining, Aggregates & Cement~5% Metals~5% Chemicals~5% Pulp & Paper~5% Other Process
• Traditional Power• Other Process

PUBLIC| Copyright ©2020 Rockwell Automation, Inc. |
Reconciliation to Non-GAAP MeasuresOrganic Sales(in millions, except percentages)
Three Months Ended September 30,2020 2019
Sales(a)Effect of
Acquisitions(e)1
Effect ofChanges inCurrency(d)
OrganicSales(b) Sales(c)
Reported Sales
Growth (Decline)
(a)/(c)
Acquisition Growth(e)/(c)
Currency Growth
(Decline) (d)/(c)
Organic Growth
(Decline)(b)/(c)
North America $ 905.2 $ (6.1) $ 0.9 $ 900.0 $ 1,020.4 (11.3)% 0.6% (0.1)% (11.8)%EMEA 325.2 (37.9) (9.8) 277.5 316.4 2.8% 12.0% 3.1% (12.3)%Asia Pacific 231.4 (5.2) (2.5) 223.7 246.8 (6.2)% 2.1% 1.1% (9.4)%Latin America 108.2 (4.2) 16.4 120.4 146.6 (26.2)% 2.9% (11.2)% (17.9)%
Total $ 1,570.0 $ (53.4) $ 5.0 $ 1,521.6 $ 1,730.2 (9.3)% 3.1% (0.3)% (12.1)%
Twelve Months Ended September 30,2020 2019
Sales(a)Effect of
Acquisitions(e)1
Effect ofChanges inCurrency(d)
OrganicSales(b) Sales(c)
Reported Sales
Growth (Decline)
(a)/(c)
Acquisition Growth(e)/(c)
Currency Growth
(Decline) (d)/(c)
Organic Growth
(Decline)(b)/(c)
North America $ 3,760.2 $ (91.5) $ 4.0 $ 3,672.7 $ 4,014.3 (6.3)% 2.3% (0.1)% (8.5)%EMEA 1,249.3 (97.0) 16.7 1,169.0 1,249.8 —% 7.8% (1.3)% (6.5)%Asia Pacific 868.7 (22.3) 13.7 860.1 908.6 (4.4)% 2.5% (1.6)% (5.3)%Latin America 451.6 (23.1) 43.8 472.3 522.1 (13.5)% 4.4% (8.4)% (9.5)%
Total $ 6,329.8 $ (233.9) $ 78.2 $ 6,174.1 $ 6,694.8 (5.5)% 3.5% (1.2)% (7.8)%
1Includes incremental sales resulting from the formation of the Sensia joint venture and sales from other acquired businesses in fiscal year 2020.
24

PUBLIC| Copyright ©2020 Rockwell Automation, Inc. |
Reconciliation to Non-GAAP MeasuresOrganic Sales(in millions, except percentages)
Three Months Ended September 30,2020 2019
Sales(a)Effect of
Acquisitions(e)1
Effect ofChanges inCurrency(d)
OrganicSales(b) Sales(c)
Sales Growth
(Decline) (a)/(c)
Acquisition Growth(e)/(c)
Currency Growth
(Decline) (d)/(c)
Organic Growth
(Decline) (b)/(c)
Architecture & Software $ 702.8 $ (9.9) $ 0.4 $ 693.3 $ 781.2 (10.0)% 1.3% —% (11.3)%Control Products & Solutions 867.2 (43.5) 4.6 828.3 949.0 (8.6)% 4.6% (0.5)% (12.7)%
Total $ 1,570.0 $ (53.4) $ 5.0 $ 1,521.6 $ 1,730.2 (9.3)% 3.1% (0.3)% (12.1)%
Twelve Months Ended September 30,2020 2019
Sales(a)Effect of
Acquisitions(e)1
Effect ofChanges inCurrency(d)
OrganicSales(b) Sales(c)
Sales Growth
(Decline) (a)/(c)
Acquisition Growth(e)/(c)
Currency Growth
(Decline) (d)/(c)
Organic Growth
(Decline) (b)/(c)
Architecture & Software $ 2,832.9 $ (17.1) $ 34.5 $ 2,850.3 $ 3,021.9 (6.3)% 0.6% (1.2)% (5.7)%Control Products & Solutions 3,496.9 (216.8) 43.7 3,323.8 3,672.9 (4.8)% 5.9% (1.2)% (9.5)%
Total $ 6,329.8 $ (233.9) $ 78.2 $ 6,174.1 $ 6,694.8 (5.5)% 3.5% (1.2)% (7.8)%
1Includes incremental sales resulting from the formation of the Sensia joint venture and sales from the other acquired businesses in fiscal year 2020.
25

PUBLIC| Copyright ©2020 Rockwell Automation, Inc. |
Reconciliation to Non-GAAP MeasuresSegment Operating Margin(in millions, except percentages) Three Months Ended Twelve Months Ended
September 30, 2020 September 30, 2019 September 30, 2020 September 30, 2019Sales
Architecture & Software (a) $ 702.8 $ 781.2 $ 2,832.9 $ 3,021.9Control Products & Solutions (b) 867.2 949.0 3,496.9 3,672.9
Total sales (c) $ 1,570.0 $ 1,730.2 $ 6,329.8 $ 6,694.8
Segment operating earningsArchitecture & Software (d) $ 190.9 $ 205.0 $ 795.2 $ 874.8Control Products & Solutions (e) 127.0 144.0 462.7 598.8
Total segment operating earnings1 (f) 317.9 349.0 1,257.9 1,473.6
Purchase accounting depreciation and amortization (11.3) (4.1) (41.4) (16.6)General corporate - net (22.0) (36.4) (98.9) (108.8)Non-operating pension and postretirement benefit (cost) credit (11.5) 0.6 (37.4) 8.4Change in fair value of investments 52.2 (228.4) 153.9 (368.5)Interest (expense) income, net (25.7) (24.3) (98.0) (87.1)Income before income taxes (g) $ 299.6 $ 56.4 $ 1,136.1 $ 901.0
Segment operating margin:Architecture & Software (d/a) 27.2% 26.2% 28.1% 28.9%Control Products & Solutions (e/b) 14.6% 15.2% 13.2% 16.3%
Total segment operating margin (f/c) 20.2% 20.2% 19.9% 22.0%
Pretax margin (g/c) 19.1% 3.3% 17.9% 13.5%
(1) Total segment operating earnings and total segment operating margin are non-GAAP financial measures. We exclude purchase accounting depreciation andamortization, general corporate – net, non-operating pension and postretirement benefit (cost) credit, gains and losses on investments, valuation adjustments related tothe registration of PTC Shares, gains and losses from the disposition of businesses, interest (expense) income, net and income tax provision because we do notconsider these costs to be directly related to the operating performance of our segments. We believe total segment operating earnings and total segment operatingmargin are useful to investors as measures of operating performance. We use these measures to monitor and evaluate the profitability of our operating segments. Ourmeasures of total segment operating earnings and total segment operating margin may be different from measures used by other companies.
26

PUBLIC| Copyright ©2020 Rockwell Automation, Inc. |
Reconciliation to Non-GAAP MeasuresAdjusted Income, Adjusted EPS, and Adjusted Effective Tax Rate(in millions, except per share amounts) Three Months Ended Twelve Months Ended
September 30, 2020 September 30, 2019 September 30, 2020 September 30, 2019Net Income attributable to Rockwell Automation $ 262.7 $ 8.1 $ 1,023.4 $ 695.8
Non-operating pension and postretirement benefit cost (credit) 11.5 (0.6) 37.4 (8.4)Tax effect of non-operating pension and postretirement benefit cost (credit) (2.9) — (10.1) 1.0Change in fair value of investments (52.2) 228.4 (153.9) 368.5Tax effect of change in fair value of investments — — — (21.7)
Adjusted Income $ 219.1 $ 235.9 $ 896.8 $ 1,035.2
Diluted EPS $ 2.25 $ 0.07 $ 8.77 $ 5.83Non-operating pension and postretirement benefit cost (credit) 0.09 (0.01) 0.32 (0.07)Tax effect of non-operating pension and postretirement benefit cost (credit) (0.02) — (0.09) 0.01Change in fair value of investments (0.45) 1.95 (1.32) 3.08Tax effect of change in fair value of investments — — — (0.18)
Adjusted EPS $ 1.87 $ 2.01 $ 7.68 $ 8.67
Effective Tax Rate 12.0% 85.6% 9.9% 22.8%Tax effect of non-operating pension and postretirement benefit cost (credit) 0.5% 0.9% 0.6% 0.1%Tax effect of change in fair value of investments 2.5% (69.5)% 1.5% (5.0)%
Adjusted Effective Tax Rate 15.0% 17.0% 12.0% 17.9%
Non-operating pension and postretirement benefit cost (credit)(in millions) Three Months Ended Twelve Months Ended
September 30, 2020 September 30, 2019 September 30, 2020 September 30, 2019Interest cost $ 34.5 $ 40.0 $ 138.0 $ 160.6Expected return on plan assets (61.5) (61.1) (244.8) (244.7)Amortization of prior service credit (1.1) (1.0) (4.5) (4.2)Amortization of net actuarial loss 37.3 19.7 148.7 78.7Settlements 2.3 1.8 — 1.2Non-operating pension and postretirement benefit cost (credit) $ 11.5 $ (0.6) $ 37.4 $ (8.4)
27
PUBLIC| Copyright ©2020 Rockwell Automation, Inc. |
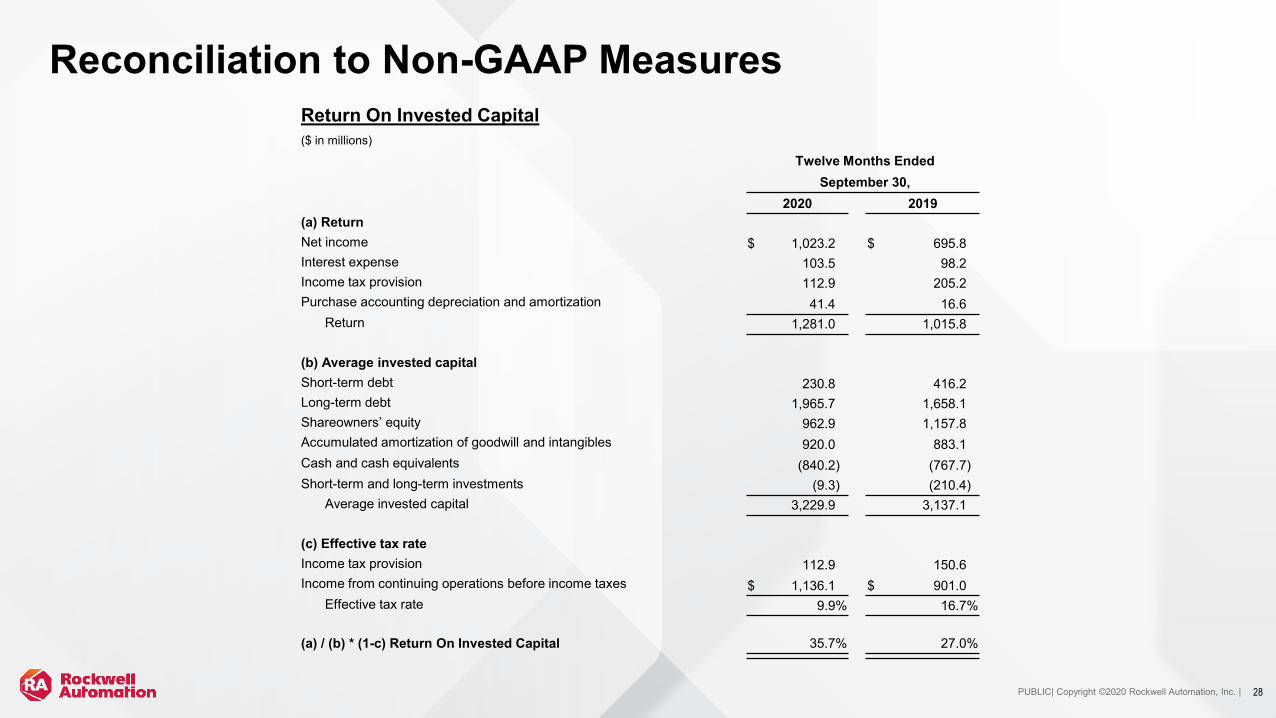
Reconciliation to Non-GAAP MeasuresReturn On Invested Capital($ in millions)
Twelve Months EndedSeptember 30,
2020 2019(a) ReturnNet income $ 1,023.2 $ 695.8Interest expense 103.5 98.2Income tax provision 112.9 205.2Purchase accounting depreciation and amortization 41.4 16.6
Return 1,281.0 1,015.8
(b) Average invested capitalShort-term debt 230.8 416.2Long-term debt 1,965.7 1,658.1Shareowners’ equity 962.9 1,157.8Accumulated amortization of goodwill and intangibles 920.0 883.1Cash and cash equivalents (840.2) (767.7)Short-term and long-term investments (9.3) (210.4)
Average invested capital 3,229.9 3,137.1
(c) Effective tax rateIncome tax provision 112.9 150.6Income from continuing operations before income taxes $ 1,136.1 $ 901.0
Effective tax rate 9.9% 16.7%
(a) / (b) * (1-c) Return On Invested Capital 35.7% 27.0%
28

PUBLIC| Copyright ©2020 Rockwell Automation, Inc. |
Reconciliation to Non-GAAP MeasuresLogix Sales Growth
Three Months Ended Twelve Months EndedSeptember 30, 2020 September 30, 2020
LogixLogix reported growth (12.6) % (7.3) %
Effect of currency translation — % 1.2 %Logix organic growth (12.6) % (6.1) %
Control Products & Solutions Sales Growth
Three Months Ended Twelve Months EndedSeptember 30, 2020 September 30, 2020
Control ProductsControl products reported growth (11.1) % (9.8) %
Effect of currency translation 0.3 % 0.9 %Effect of inorganic investments — % — %
Control products organic growth (10.8) % (8.9) %
Solutions & ServicesSolutions reported growth (6.9) % (1.4) %
Effect of currency translation 0.4 % 1.3 %Effect of inorganic investments (7.5) % (9.8) %
Solutions organic growth (14.0) % (9.9) %
29

PUBLIC| Copyright ©2020 Rockwell Automation, Inc. |
New Definition of Adjusted Income and Adjusted EPS
30
▪ Beginning in fiscal 2021, Rockwell is changing its definition of Adjusted Income and Adjusted EPS
▪ New definition will also exclude the impact of purchase accounting depreciation and amortization expense attributable to Rockwell Automation and the related tax effects of such exclusion
▪ The definition of Adjusted Effective Tax Rate is also changing to correspond to the purchase accounting items now being excluded from Adjusted Income
Fiscal 2020 Results
Fiscal 2021 Guidance
Diluted EPS $8.77 $8.07 - $8.47Purchase accounting depreciation and amortization expense attributable to Rockwell Automation
0.25 0.28
Tax effect of purchase accounting depreciation and amortization expense attributable to Rockwell Automation
(0.06) (0.07)
Non-operating pension and postretirement cost 0.32 0.24Tax effect of non-operating pension and postretirement cost (0.09) (0.07)Change in fair value of investments1 (1.32) —Tax effect of change in fair value of investments1 — —
Adjusted EPS2 $7.87 $8.45 - $8.85
Effective tax rate 9.9% ~ 13.3%Tax effect of purchase accounting depreciation and amortization expense attributable to Rockwell Automation
0.4% ~ 0.4%
Tax effect of non-operating pension and postretirement cost 0.6% ~ 0.3%Tax effect of change in fair value of investments1 1.5% ~ —%
Adjusted Effective Tax Rate3 12.4% ~ 14.0%1The year ended September 30, 2020 included a gain on investment of $153.9 million due to the change in value of our investmentin PTC. Fiscal 2021 guidance excludes estimates of these adjustments on a forward-looking basis due to variability, complexity, andlimited visibility of these items.2Fiscal 2021 guidance based on Adjusted Income attributable to Rockwell, which includes an adjustment for Schlumberger's non-controlling interest in Sensia.

PUBLIC| Copyright ©2020 Rockwell Automation, Inc. |
Reconciliation to Non-GAAP MeasuresFiscal 2021 Guidance(in billions, per share amounts)
Organic Sales Fiscal 2021 GuidanceOrganic sales growth 3.5% - 6.5%Inorganic sales growth 1.0% - 1.5%Foreign currency impact ~ 1%Reported sales growth 6% - 9%
Segment Operating MarginTotal sales (a) $ ~ 6.8
Total segment operating earnings (b) ~ 1.4
Costs not allocated to segments ~ 0.2Income before income taxes (c) $ ~ 1.2
Total segment operating margin (b/a) 20.0% - 20.5%
Pretax margin (c/a) ~ 17.6 %
Adjusted Effective Tax RateEffective tax rate ~ 13.3 %Tax effect of purchase accounting and depreciation attributable to Rockwell Automation ~ 0.4 %Tax effect of non-operating pension and postretirement benefit cost ~ 0.3 %Tax effect of change in fair value of investments3 ~ — %Adjusted Effective Tax Rate ~ 14.0 %
Adjusted EPS(1)
Diluted EPS $8.07 - $8.47Purchase accounting depreciation and amortization expense attributable to Rockwell Automation 0.28Tax effect of purchase accounting and amortization expense attributable to Rockwell Automation (0.07)Non-operating pension and postretirement benefit cost 0.24Tax effect of non-operating pension and postretirement benefit cost (0.07)Adjusted EPS $8.45 - $8.85
(1) Based on Adjusted Income attributable to Rockwell, which includes an adjustment for Schlumberger's non-controlling interest in Sensia. This compares to fiscal 2020 Adjusted EPS of $7.87 under the new definition.
31

www.rockwellautomation.com
Thank you
32