four-year myth - mississippi public universities - …€¦ · · 2014-12-02yield two, three, and...
TRANSCRIPT

Make college more affordable.Restore the promise of
graduating on time.
Four-Year MYTH
Embargoed until December 1, 2014, 8 a.m., EST

The vast majority of American college students do not graduate on time … but many more can — saving themselves and their families precious time and money.
Copyright ©2014 Complete College America. All rights reserved.
Embargoed until December 1, 2014, 8 a.m., EST

CONTENTSComplete College America Alliance of States 2
Restoring the Promise of On-Time Graduation 4
Where We Stand 6
Where We Need To Be 7
The Causes 8
The Costs 10
The Paradox of Choice and College Success 12
The Solution 14
Using Structure To Boost College Completion 20
Additional Considerations 22
The Essential Elements of GPS 23
Endnotes 24
Methodology & Acknowledgments 24
State Profiles 25
Related Resources 82
Four-Year Myth: Make College More Affordable. Restore the Promise of Graduating on Time. n 1
Embargoed until December 1, 2014, 8 a.m., EST

At our founding, Complete College America called on states to take a hard look at the data, recognize the challenges facing our students, and make clear commitments about how we move forward. We sought to organize a network of leaders who would help carry this mantle and pursue reforms that would significantly increase college completion and close attainment gaps for underrepresented populations.
The response was overwhelming. A tremendous number of governors stepped forward, and the Complete College America Alliance of States was born. Now at 35 members, the Alliance is leading the country by enacting powerful reforms to increase college completion and close attainment gaps. This group is ensuring that the conversation around higher education equally values access and student success.
With the release of the Game Changers, Complete College America and the Alliance of States focused our efforts on proven strategies to boost completion — strategies that yield two, three, and four times the results of traditional programs. And the momentum around these big ideas is building:
• Twenty-six states have implemented or are working toward implementation of performance funding.
• Seven states have committed to scaling corequisite remediation by 2015, allowing significantly more students to start college-level work with just-in-time academic support. Twenty-two states and the District of Columbia have committed to transforming remediation to dramatically increase the percentage of students who complete college-level gateway courses in math and English within one academic year.
• Twenty states have either statewide or campus-based 15 to Finish initiatives to encourage more students to take at least 15 credits per semester or 30 credits per year and graduate on time.
• Seven states have programs within them that use structured schedules.
• Three states are working to take Guided Pathways to Success (GPS) to scale, and five states are implementing GPS in science, technology, engineering, and math (STEM) initiatives.
The work is far from over, but the Alliance is pushing forward, securing a more prosperous future for our states and country. These states recognize that time is the enemy of college completion, and they are not wasting a moment in their efforts to ensure that more Americans than ever before are able to earn a degree or credential of value.
Sincerely,
Stan JonesPresident
COMPLETE COLLEGE AMERICA ALLIANCE OF STATES
2 n Complete College America
Embargoed until December 1, 2014,
8 a.m., EST

n Governor Mike Beebe (Arkansas)
n Governor John Hickenlooper (Colorado)
n Governor Eloy Inos (Commonwealth of the Northern Mariana Islands)
n Governor Dan Malloy (Connecticut)
n Governor Rick Scott (Florida)
n Governor Nathan Deal (Georgia)
n Governor Neil Abercrombie (Hawaii)
n Governor Butch Otter (Idaho)
n Governor Pat Quinn (Illinois)
n Governor Mike Pence (Indiana)
n Governor Steve Beshear (Kentucky)
n Governor Bobby Jindal (Louisiana)
n Governor Paul LePage (Maine)
n Governor Martin O’Malley (Maryland)
n Governor Deval Patrick (Massachusetts)
n Governor Mark Dayton (Minnesota)
n Governor Phil Bryant (Mississippi)
n Governor Jay Nixon (Missouri)
n Governor Steve Bullock (Montana)
n Governor Brian Sandoval (Nevada)
n Governor Susana Martinez (New Mexico)
n Governor John Kasich (Ohio)
n Governor Mary Fallin (Oklahoma)
n Governor John Kitzhaber (Oregon)
n Governor Tom Corbett (Pennsylvania)
n Governor Lincoln Chafee (Rhode Island)
n Governor Dennis Daugaard (South Dakota)
n Governor Bill Haslam (Tennessee)
n Governor Rick Perry (Texas)
n Governor Gary Herbert (Utah)
n Governor Peter Shumlin (Vermont)
n Governor Earl Ray Tomblin (West Virginia)
n Governor Scott Walker (Wisconsin)
n Governor Matt Mead (Wyoming)
COMPLETE COLLEGE AMERICA ALLIANCE OF STATES
MEMBERS OF THE ALLIANCEThe governors below represent
the members of Complete College
America’s Alliance of States. They, or
their predecessors, have committed to
establishing statewide completion goals,
measuring and publishing their progress,
and assembling teams to tackle these
challenges through the use of Game
Changer strategies. They, along with the
state higher education leaders who do
much of the heavy lifting, are our partners
in this important work.
Four-Year Myth: Make College More Affordable. Restore the Promise of Graduating on Time. n 3
Embargoed until December 1, 2014, 8 a.m., EST

RESTORING THE PROMISE OF ON-TIME GRADUATION
Metrics like these are unacceptable, especially when we consider that students and their families are trying desperately to control the skyrocketing costs of higher education. As lifetime savings are depleted and financial aid packages run out, the extra time on campus means even more debt, and for far too many students, additional semesters do not result in a degree or credential.
Students and parents know that time is money. Student loan debt has now blown past the trillion-dollar mark, exceeding Americans’ combined credit card and auto loan debts. And that number doesn’t even include the large sums of money that parents are borrowing to help their kids pay for tuition, books, room, and board. We’ve passed the point when it’s reasonable to ask if this escalating financial burden is sustainable.
We recognize that not every student can or will graduate on time. And there are understandable reasons. However, something is clearly wrong when the overwhelming majority of public colleges graduate less than 50 percent of their full-time students in four years.
Current on-time graduation rates suggest that the “four-year degree” and the “two-year degree” have become little more than modern myths for far too many of our students. The reality is that our system of higher education costs too much, takes too long, and graduates too few.
ON-TIME GRADUATION RATES ARE FAR TOO LOW
1- TO 2-YEAR CERTIFICATE
15.9%ON TIME
4-YEAR BACHELOR’S (NON-FLAGSHIP)
19%ON TIME
4-YEAR BACHELOR’S (FLAGSHIP/VERY HIGH RESEARCH)
36%ON TIME
2-YEAR ASSOCIATE
5%ON TIME
FULL-TIME STUDENTS
In American higher education, it has become the accepted standard to measure graduation rates at four-year colleges on a six-year time frame. And evaluations of two-year
community colleges are now based on three-year graduation rates.
4 n Complete College America
Embargoed until December 1, 2014,
8 a.m., EST

Establishing graduation benchmarks of three and six years for associate and bachelor’s degrees respectively signals an acceptance of the status quo and alleviates the pressure to change. Using these metrics may improve the numbers, but it is costing students and their parents billions of extra dollars — $15,933 more in cost of attendance for every extra year of a public two-year college and $22,826 for every extra year at a public four-year college.
Four years in college is a lot less expensive than five or six. An associate degree is much cheaper in two years than three or four. Hands down, our best strategy to make college more affordable and a sure way to boost graduation rates overall is to ensure that many more students graduate on time.
First, let’s focus on the right numbers: on-time graduation rates. We can measure graduation rates at “150 percent of time,” but we should no longer accept this metric as the standard for performance. This report reveals how states are doing at graduating students on time — and the news is sobering.
Second, we must realize that students need a direct route to graduation. We can move new policies and strategies that tackle head-on the institutional practices that are the great drag on student progress: credits lost in transfer, unavailable critical courses, uninformed choices of majors, low credit accumulation each semester, broken remediation sequences, and excessive credit requirements. Addressing all this is possible through the implementation of a comprehensive, integrated restructuring of higher education delivery — something we call Guided Pathways to Success (GPS).
Every major should be organized into a prescribed pathway of sequenced courses that lead to an on-time arrival on graduation day. And all students should be scheduled to maintain steady progress on their chosen path. Random acts of enrollment should be replaced with deliberate and directed advancement toward degrees.
Think of it as a mutual responsibility agreement: Students will pledge to stick to a structured schedule of courses and elective offerings that represent the shortest distance to completion, eliminating the semester-by-semester uncertainty and huge expenses that often accompany a college career. In return, institutions will provide clear degree maps, closely monitor student progress, and guarantee that the necessary courses will be available when they are needed.
GPS takes the guesswork out of charting a path to on-time graduation, empowering students with informed choice and making college more affordable.
KNOW THIS: Only 50 of the more than 580 public four-year institutions in America have on-time graduation rates at or above 50 percent for their full-time students. Some that fall below the 50 percent mark include:
48% Michigan State University
44% University of Iowa
41% North Carolina State University
36% Auburn University
34% University of Arizona
WE CAN RESTORE THE PROMISE OF GRADUATING ON TIME — AND WE MUST.
Source: IPEDS (2013)
Four-Year Myth: Make College More Affordable. Restore the Promise of Graduating on Time. n 5
Embargoed until December 1, 2014, 8 a.m., EST

Many graduates earn excess credits.
And graduates take far too long to finish, costing missed opportunities and money.
120 Credits Standard
120 Credits Standard
1 Year Standard
2 Years Standard
4 Years Standard
4 Years Standard
YEARS 1 2 3 4 5 6
Most full-time students don’t graduate on time.
(F
LAGS
HIP/
VERY
HI
GH R
ESEA
RCH)
2-YE
AR A
SSOC
IATE
1- TO
2-Y
EAR
CERT
IFIC
ATE
(N
ON-F
LAGS
HIP)
ON TIME
ON TIME
ON TIME
ON TIME60 Credits Standard
4-YE
AR B
ACHE
LOR’
S
133.5
134.6
80.9
64.9
15.9%
19%
36%
5%
2.7
3.6
4.9
4.4
WHERE WE STAND The National Picture
Data for students who began college going full-time. *Includes tuition and fees, room and board, books and supplies, transportation, and other expenses.
For source information, see state profiles.
COST OF EACH ADDITIONAL YEAR
COST OF EACH ADDITIONAL YEAR
$15,933 +$35,000
$50,933
$22,826 +$45,327
$68,153
in cost of attendance*
in cost of attendance
total for each student seeking associate degree
total for each student seeking bachelor’s degree
in lost wages
in lost wages
KNOW THIS:
The best strategy for reducing the cost of college is to ensure that more students graduate on time.
30 Credits Standard
6 n Complete College America
Embargoed until December 1, 2014, 8 a.m., EST

Detailed GPS on pages 14–15.
WHERE WE NEED TO BE Guided Pathways to Success (GPS) at a Glance
INFORMED CHOICE AND “META MAJORS” “Undeclared” students enter college and select among a set of initial broad clusters of majors. As students progress, these meta majors narrow into more specific areas of study.
INTRUSIVE ACADEMIC ADVISING Innovations in technology allow supports to be targeted and customized to meet the needs of individual students. Early warning systems make it possible for institutions to track performance in required courses and target interventions when and where they are most needed.
DEFAULT PATHWAYS Students do not “discover” the right path; after choosing a major, the academic map is their default schedule. Exploration outside one’s major is still allowed and enabled as intentional investigation, replacing aimless wandering.
CRITICAL PATH COURSES From beginning to end, academic pathways contain critical courses that must be completed in sequence each semester to certify that students are on track. These courses give students early signals about their prospects for success in a given field of study.
ACADEMIC MAPS Students choose coherent programs, not random, individual courses. After students make the “big choices” of meta majors and academic majors, all the other choices of necessary credits and course sequences are laid out for them.
MATH ALIGNED TO MAJORS College algebra has only one purpose: preparation for calculus, which most non-STEM majors don’t need. Students are far more likely to succeed when mathematics are relevant and aligned to their majors. For many programs of study, rigorous statistics and quantitative reasoning courses are more appropriate.
Most American college students do not graduate on time. Using GPS, students make choices of “packaged deal” majors, not random courses. Then they are required to proceed on highly structured degree maps, geared for on-time completion. GPS leads to more graduates overall and makes college more affordable.
Four-Year Myth: Make College More Affordable. Restore the Promise of Graduating on Time. n 7
Embargoed until December 1, 2014,
8 a.m., EST

THE CAUSESWhy are students taking so long to graduate?
70% of community college students referred to
remedial math had not even attempted a college-level math class within two years.2
1.7 students each year begin
college in remediation, including more than 50 percent of two-year students.3
Most full-time students do not take the credits necessary to graduate on schedule (15 credits per semester or 30 credits per year), opting instead for lighter course loads that put them on five- and six-year plans.
29% of students at two-year institutions are taking enough credits to graduate on time.
50% of students at four-year institutions are taking enough credits to graduate on time.4
Many institutions
have excessive degree requirements: more than 120 credits for a bachelor’s degree, more than 60 credits for an associate degree, and more than 30 credits for a certificate.
$1.5 billion a year is the cost to Americans when bachelor’s degree students go just three credits above what is needed for their degrees.5
Over the last 20 years, more than 31 million students have gone off to college but never earned a degree.1 Far too many college students get lost in the process, slowed down by unclear expectations, numerous obstacles, and having no clear pathway to graduation day.
million1 in 10 remedial students graduate.
is available for every 400 studentson average. With dozens of majors to choose from
and no clear direction, overwhelmed students make avoidable mistakes based on
uninformed choices.
adviser1
MINIMUMSPEED
15
8 n Complete College America
Embargoed until December 1, 2014, 8 a.m., EST

THE CAUSESWhy are students taking so long to graduate?
75% of students juggle school, family, and work.
Unpredictable class schedules mean college takes longer than it should.
60% of bachelor’s degree recipients change colleges — and nearly half of them lose some or all of their credits
because of broken transfer policies.
$600 million is lost each year if just two courses per transfer student fail to transfer.7
Too many students wander the course catalog, wasting too much time and money. On average, graduates accumulate:
When needed courses aren’t available, students take any courses they can to maintain financial aid eligibility.
20% of community college students say they were unable to get into a class needed for their degree.
33% say they had not gotten into a class they wanted to take.6
Associate degrees:
81 credits instead of the customary 60.
Bachelor’s degrees:
134 credits, when 120 is almost always sufficient.
Four-Year Myth: Make College More Affordable. Restore the Promise of Graduating on Time. n 9
Embargoed until December 1, 2014, 8 a.m., EST

The cost of higher education has drastically outpaced increases in median family income. As a result, obtaining the education necessary for success has become far more difficult and costly, and students have been forced to pile on even more debt in the process.
Do the math. As the price tag on higher education has risen, the financial burden of an extra year on campus has skyrocketed, more than doubling at four-year institutions.
THE COSTS Graduating late costs students and families billions of dollars.
THEN AND NOW: Cost of tuition vs. median family income
Source: National Center for Education Statistics (2012), Table 349;
U.S. Census Bureau (2010)
$3,264 in tuition and fees
— 4-year public school— 2-year public school— Median family income
COST FOR EACH YEAR:
Perc
enta
ge In
crea
se O
ver B
asel
ine
Year
Every extra year of tuition and fees adds up, and borrowers who do not graduate on time take on far more debt in years 5 and 6. On average, an additional year now costs more than $3,000 extra at a two-year institution and nearly $9,000 extra in tuition at a four-year institution. Most colleges and universities raise tuition and fees each year, while financial aid stays nearly constant. As scholarships and savings run out, students and their families are left to borrow more of the costs of attending school.
-50%
0%
50%
100%
150%
200%
250%
1971 1975 1979 1983 1987 1991 1995 1999 2003 2007 2012
$8,893 in tuition and fees
Sources: http://fly.temple.edu and http://www.utexas.edu/
enrollment-management/ messages/ut-strives-improve-four-
year-graduation-rates University of Texas–AustinOn time In 6 years
$32,000
$19,000
Temple University
$20,000
On time In 6 years
$35,000
At Temple University and University of Texas–Austin, higher education leaders are committed to increasing on-time completion, and they have the data to show why it’s so important. Two extra years at their campuses increase debt by nearly 70 percent among students who borrow.
CUMULATIVE DEBT UPON GRADUATION
POINT OF INTEREST
10 n Complete College America
Embargoed until December 1, 2014, 8 a.m., EST

THE COSTS Graduating late costs students and families billions of dollars.
Worse, none of these numbers includes the staggering cost of remedial education: an estimated $3 billion-plus a year for courses that don’t count toward a degree. Or the billions of dollars more spent educating students who drop out and never graduate at all.
In a large-scale analysis of student transcripts, one U.S. Department of Education study found that the average bachelor’s graduate had accumulated 138.4 credits from all the colleges attended up to graduation.8 Add another 20.3 credits, on average, for courses that students fail, repeat, or withdraw from late in the semester, and each four-year bachelor’s degree represents 158.7 semester credits earned or attempted instead of the 120-credit standard. At an estimated cost of $361 per credit hour, these numbers add up fast.9
STICKER SHOCK: Cost of excess credits
Total: $19.2 billion a year
$11.5 billion public investment
$7.7 billion in tuition
Note: These costs include two-year and four-year public institutions.
Graduating late also means delaying careers and losing out on wages. In addition to extra tuition and fees, students also miss out on the wages they would have earned had they graduated on time. According to the National Association of Colleges and Employers, the average starting salary for a bachelor’s degree recipient in the class of 2013 was more than $45,000. The American Institutes for Research found that associate degree earners could expect to earn a starting salary of about $35,000.
Add it all up and everyone loses. The public invests in college studies that do not lead anywhere. Students defer earning an income, and they and their families take on massive amounts of debt to earn degrees that could be much less time consuming and costly.
TIME IS MONEY.
Four-Year Myth: Make College More Affordable. Restore the Promise of Graduating on Time. n 11
Embargoed until December 1, 2014, 8 a.m., EST

THE PARADOX OF CHOICE AND COLLEGE SUCCESS
These assumptions make good logical sense. But research over the last 15 years or so has demonstrated that they aren’t true. Though choice is good, there can be too much of a good thing. And when there is, it leads to paralysis, to bad decisions, to a loss of self-control, and to dissatisfaction with even good decisions. Though none of this research has been done specifically in connection with the academic experiences of college students, it is easy to see how current low college completion rates are exacerbated by the amount of freedom of choice that college students have.
There is no question that options for college students have exploded in recent years. Core requirements have diminished, the number of possible majors has increased, and the variety of paths through those majors has increased as well. What can we expect all this “liberation” to produce?
First, paralysis. When employees are offered many options for 401(k) investment, they are less likely to sign up (and get matching money from their employer) than when there are only a few. And when students are offered many topics for an extra-credit essay, they are less likely to write one than when they are offered only a few.
Second, bad decisions. Senior citizens choosing Medicare Part D prescription drug plans are more likely to make sub-optimal choices when there are many plans to choose from than when there are only a few. And those college students writing extra-credit essays write worse essays when they have many topics to choose from than when they have only a few.
Third, a loss of self-control. People who make a series of merely hypothetical choices regarding trivial things (e.g., a red decorative candle versus a green one, or a hoodie sweatshirt versus a crew neck) give up more quickly on a challenging subsequent problem than do people who have merely rated the attractiveness of the same set of trivial items rather than choosing among them.
Finally, large choice sets reduce satisfaction, with even good decisions. When the choice set is large, people regret the choices they make, pine over missed opportunities offered by rejected alternatives, develop such high expectations about how good the chosen option will be that the actual results simply can’t live up to those expectations, and then blame themselves when the choice turns out to disappoint.
By Barry Schwartz
There is a set of assumptions that most Americans make that is so deeply ingrained in us that we aren’t aware of them. Freedom is good, we believe, the more the better. But we can’t have freedom without choice. The more choice we have, the more freedom we have. And since the more freedom we have, the better off we are, the more choice we have, the better off we are.
12 n Complete College America
Embargoed until December 1, 2014, 8 a.m., EST

THE PARADOX OF CHOICE AND COLLEGE SUCCESS
So now imagine an 18-year-old faced with an enormous cafeteria of possibilities in the college curriculum. Paralysis. Bad decisions. Loss of self-control (self-discipline). Dissatisfaction with the results of past decisions.
Freedom and choice are surely good, but there can be too much of a good thing. The last thing we want to do if our aim is to increase college completion rates is to offer students a set of possibilities that will paralyze them, weaken their self-discipline, and undermine the satisfaction they get from the work they have already done. Smart institutions aiming to increase completion will offer students choice, to be sure. But the choice will be within well-defined limits, or constraints, so that the path to success is clearly marked. Paradoxically, the more opportunities we give students to do exactly what they want, the less likely they are to do anything at all.
Dr. Barry Schwartz is the author of The Paradox of Choice: Why More is Less, a book in which he discusses the “culture of abundance” and its negative impact on consumer satisfaction. In addition to being an accomplished researcher and sought-after presenter, Schwartz is the Dorwin Cartwright Professor of Social Theory and Social Action at Swarthmore College in Pennsylvania.
OVERWHELMED BY CHOICE2 401(k) Plans Offered 59 401(k) Plans Offered
75% Participation
60% Participation
Smart institutions aiming to increase completion will offer students choice, to be sure. But the choice will be within well-defined limits, or constraints, so that the path to success is clearly marked.
Four-Year Myth: Make College More Affordable. Restore the Promise of Graduating on Time. n 13
Embargoed until December 1, 2014, 8 a.m., EST

THE SOLUTIONGuided Pathways to Success (GPS)
BUSINESS
HUMANITIES
ARTS
HEALTH SERVICES
EDUCATION
SOCIAL SCIENCES
STEM
TRANSPORTATION, DISTRIBUTION, & LOGISTICS
EDUCATION
CULINARY ARTS & HOSPITATLITY
BUSINESS & PROFESSIONAL
SERVICES
PUBLIC SAFETY
HEALTH CARE
Introduction to College Writing
Intermediate Algebra
Intellectual Foundations
Literature and Humanities
Visual and Performing Arts
TERM 1
General Education Math
Working in the Warehousing Environment
Introduction to Business Logistics
Purchasing
Career Development and Decisionmaking
TERM 1
Introduction to College Writing and Research
Structure of Arithmetic for Teachers
Natural, Physical, and Applied Sciences w/lab
Introduction to Psychology
Teaching and Learning Digital Age
TERM 2
English I—Composition
Introduction to Microcomputers
Introduction to Transportation Administration
Applied Logistics Practicum
TERM 2
SAMPLE GPS
Math aligned
to majorsCivic and Ethical Foundations
Geometry and Probability
Foundations of Education
Child and Educational Psychology
Content Area Endorsement
TERM 3
Academic maps
TOTAL CREDITS: 16
TOTAL CREDITS: 15–16
TOTAL CREDITS: 15
General Psychology
Selling
Intro to Financial Accounting
Applied Logistics Practicum
Business Communications
TERM 3
TOTAL CREDITS: 15
TOTAL CREDITS: 17
TOTAL CREDITS: 16
For decades, American higher education has worked to expand choices for students: hundreds, if not thousands, of course offerings at our institutions; classes at all hours of the day and on weekends; majors in every possible discipline. The goal behind these efforts was to give students options. But this process of unguided exploration and discovery too often means that students wander the curriculum and rarely graduate on time.
Behavioral economics tells us that too much choice — especially uninformed choice — leads to indecision or poor decisions. We also know that a substantial number of people accept — even welcome — a default choice designed by informed professionals.
Default pathways
Informed choice and
“meta majors”
Mathematics, Secondary Education
Special Education
Art EducationEarly Childhood
Studies
ELEMENTARY EDUCATION
MAJOR CHOSEN
4-YEAR
2-YEAR
14 n Complete College America
Embargoed until December 1, 2014, 8 a.m., EST

THE SOLUTIONGuided Pathways to Success (GPS)
Idaho Comprehensive Literacy
Exceptionality in the Schools
Natural, Physical, and Applied Sciences w/lab
Cultural Diversity in Schools
Content Area Endorsement
TERM 4
Principles of Economics
Fundamentals of Speech
Sociology—Institutional Racism
Applied Logistics Practicum
TERM 4
Critical path courses
TOTAL CREDITS: 15
TOTAL CREDITS: 17
Content Area Language Arts
Assessment in Teaching and Learning
Elementary Math C & I
Health and PE Methods
Content Area Endorsement
Content Area Endorsement
TERM 5
TOTAL CREDITS: 18
Elementary Science
Writing Process and Assessment
Guidance and Counseling in Schools
Content Area Endorsement
Content Area Endorsement
TERM 6
TOTAL CREDITS: 15–16
Professional Year I Internship
Elementary Social Studies C & I
Classroom Learning Environments
Content Area Endorsement
TERM 7
TOTAL CREDITS: 14
Constructing a Professional Portfolio
Professional Year II: Student Teaching
Professional Year III: Student Teaching
TERM 8
TOTAL CREDITS: 13
So it should be with higher education. Students should be given a structure designed to empower their decisions and guide their academic trajectory — a clear path to how they successfully complete their degree.
That’s what GPS provides, and a number of states and institutions are already pursuing these innovations.
Intrusive academic advising
ASSOCIATE DEGREE: Logistics
BACHELOR’S DEGREE: Elementary Education
Adapted from academic maps at Boise State University and the City Colleges of Chicago. Sample course order and designation of critical path courses may vary from original maps.
Critical Path Courses
Four-Year Myth: Make College More Affordable. Restore the Promise of Graduating on Time. n 15
Embargoed until December 1, 2014, 8 a.m., EST

THE SOLUTIONGuided Pathways to Success (GPS)
The City Colleges of Chicago’s Reinvention initiative has led to a near doubling of the graduation rate and the awarding of the highest number of degrees in City Colleges’ history. Through its College to
Careers initiative, City Colleges is better aligning its occupational programs in high-demand fields with the needs of employers and four-year colleges. City Colleges is working to ensure that each and every student has a clear, semester-by-semester map to graduation and postcompletion success. Academic maps are organized into 10 focus areas (meta majors), and each map is personalized with the help of an adviser to meet a student’s precise transfer/job interests, readiness levels, and expected course loads.
LEARN MORE: http://tinyurl.com/citycollege-cca
Informed choice and “meta majors.” Undeclared students enter college and select among a set of initial broad clusters of majors such as science, technology, engineering, and math (STEM); social sciences; business; education; or liberal arts. As students progress, these meta majors narrow into more specific areas of study such as chemistry, accounting, psychology, or nursing. Simply put, no student would be considered “unclassified,” left to wander aimlessly through the curriculum.
Implementation of GPS involves significant structural changes designed to boost on-time graduation and make college more affordable. However, these strategies are not meant to be taken as a set of individual suggestions. States and institutions must use a fully integrated, holistic approach to GPS to achieve dramatic results.
Math aligned to majors. College algebra has only one purpose: preparation for calculus, which most non-STEM majors do not need. Mathematics that are not relevant to programs of study and career goals present a serious obstacle to college success. Instead, institutions should provide statistics and quantitative literacy, which better align with most non-STEM programs. Because the student in the sample academic maps on pages 14–15 is majoring in elementary education, she will take mathematics designed specifically for her career path.
Graduation rates
doubled.
POINT OF INTEREST
The New Math Pathways Project, a joint initiative of the Charles A. Dana Center at the University of Texas–Austin and the Texas Association of Community Colleges, is a
statewide approach to reforming college mathematics in Texas. The initiative, which involves 50 community colleges, includes the development and implementation of multiple math pathways with relevant and challenging content aligned to specific fields of study. Additionally, built-in support systems help students more quickly earn college-level credits in rigorous corequisite mathematics than they would in traditional remedial approaches.
LEARN MORE: http://tinyurl.com/newmath-cca
• Participating community colleges
POINT OF INTEREST
16 n Complete College America
Embargoed until December 1, 2014, 8 a.m., EST

In July 2013, the University System of Georgia Mathematics Task Force released a set of recommended steps the system should take to dramatically improve success rates in gateway
mathematics courses. The recommendations included “align gateway mathematics courses sequences with academic programs of study. In particular, College Algebra should not be the default class for non-STEM majors.”
LEARN MORE: http://tinyurl.com/usg-cca
THE SOLUTIONGuided Pathways to Success (GPS)
Academic maps built with 15 to Finish. Students choose coherent programs, not random, individual courses. After students make the “big choices” of academic majors, all other choices, including the course sequence, are laid out for them. In this way, a clear map to on-time completion is prepared, showing their path from day 1 to on-time graduation. Terms should be designed to include 15 credits per semester or 30 credits per year. Sequences that use summer coursework — in which students would take 12 credits in the fall, 12 in the spring, and six in the summer — are also acceptable. See the sample academic maps on pages 14–15.
POINT OF INTEREST
College Algebra
Calculus
At Florida State University (FSU), degree maps combine with other strategies to increase graduation rates and close attainment gaps. Since starting degree maps in 2004, FSU
has cut the number of students graduating with excess credits in half. And in 10 years, FSU’s on-time graduation rate for all students has increased 17 percentage points, rising to 61 percent. More significant, African American, Hispanic, and first-generation Pell students graduate from FSU at significantly higher rates than the national average. Seventy-three percent of African American FSU students graduated within six years in 2013, almost double the national average for this group. The six-year graduation rate for Hispanic students in 2013 (76 percent) was more than 50 percent higher than the national average.
LEARN MORE: http://tinyurl.com/fsu-cca
After analyzing the data on student retention and academic performance, administrators and advisers at Indiana University-Purdue University Indianapolis (IUPUI) launched an initiative to encourage students to take 15 credits per semester or 30 credits per year. Through mailers to students, banners, posters, and digital ads, IUPUI increased by 23 percentage points the number of first-time, full-time students taking 15 or more credits per semester.
LEARN MORE: http://tinyurl.com/iupui-cca
61%44%
2004 2013
ON-TIME GRADUATION RATEPOINT OF
INTEREST
51%
28%
2012 2013
FIRST-TIME, FULL-TIME STUDENTS TAKING 15
CREDITS PER SMESTER
Four-Year Myth: Make College More Affordable. Restore the Promise of Graduating on Time. n 17
Embargoed until December 1, 2014, 8 a.m., EST

THE SOLUTIONGuided Pathways to Success (GPS)
The University of Hawai’i’s STAR system allows students to track progress toward their degree program and ensure that they stay on track for on-time completion. The system provides students with information regarding program and
credit requirements, as well as course availability. In addition, students can map out future semesters and assess how course selections will impact their time to degree. The system also helps students recalculate their pathways when changes are needed or issues arise.
LEARN MORE: http://tinyurl.com/hawaii-cca
Technical and vocational training at the 27 Tennessee Colleges of Applied Technology have an average completion rate of 75 percent, with some centers graduating all of their students. Job placement rates also are high. Unlike with traditional approaches, students enroll in whole academic programs, not individual courses, streamlining the path to completion by removing the burdens of individual course selection and availability. Programs are offered Monday to Friday from 8 a.m. to 3 p.m., and attendance is taken. Finally, the complete program costs and the time it will take to graduate are clearly presented up front, allowing students to plan ahead and know with certainty when they will graduate. Many of the Colleges of Applied Technology’s more successful program elements were included in a new state law that created a unified community college system, which is now adding structured scheduling.
LEARN MORE: http://tinyurl.com/tn-cca
At Boise State University, the Degree Tracker planning tool combines academic maps with a student’s academic record and preferred timeline to create an individualized path to graduation. The online tool provides a user-friendly interface that allows students and advisers to easily partner in the mission to graduate. The data extracted from Degree Tracker indicate course demand, advising interventions, and whether students are failing to meet the necessary benchmarks to follow their academic plan.
LEARN MORE: http://tinyurl.com/boise-cca
Default pathways. Students remain on their chosen path unless given approval to change by an adviser. Exploration outside one’s major is still allowed and enabled as intentional investigation, replacing aimless wandering. It is impossible for students to choose courses that don’t count toward a degree because course options generally are limited to those within their chosen program of study. Students no longer are allowed to choose courses “cafeteria style” with no consideration for whether they lead to a credential. Students stay on track for graduation — and fully understand the time and money consequences of making a change.
Just like GPS in your car, default pathways allow students to know their location along their chosen program of study in real time. They can see the progress made to date and a clear path of courses before them that lead to on-time graduation. No longer must students worry whether required courses will be available: The pathway guarantees that courses within their program will be there when they need them.
COMPLETION RATE
75%
POINT OF INTEREST
18 n Complete College America
Embargoed until December 1, 2014, 8 a.m., EST

THE SOLUTIONGuided Pathways to Success (GPS)
Critical path courses. Academic pathways contain critical courses that must be completed each semester to certify that students are on track. These milestone courses provide realistic assessments of student progress and give students early signals about their prospects for success in a given field of study. This information eliminates the problem of students putting off challenging courses until the consequences of changing majors becomes too damaging and costly. The sample academic maps on pages 14–15 show at least one milestone course in every term.
Intrusive academic advising. Innovations in technology allow supports to be targeted to meet the needs of individual students. Early warning systems make it easy for institutions to track student performance in required courses and target interventions when and where they are most needed. For example, systems can automatically place a student on administrative hold and require a meeting with an adviser if a critical path course in the student’s major is not completed on time. This targeted approach allows academic advisers to focus their attention almost exclusively on students most in need of services instead of spreading themselves too thin.
Georgia State University’s use of intrusive advising has increased its graduation rates by more than 20 percentage points in the last 10 years. Pell students graduate at a rate
of 53 percent. African American students (57 percent) and Hispanic students (66 percent) now graduate at higher rates than the overall student body. In addition, Georgia State confers more bachelor’s degrees to African Americans than does any other U.S. university.
LEARN MORE: http://tinyurl.com/ga-cca
2003 2013
GRADUATION RATE
53.4%
31.5%
The Lumina Foundation, in partnership with Complete College America, has awarded Georgia, Indiana, and Tennessee $1 million grants for the statewide
implementation of GPS strategies. Through the use of default pathways, critical path courses, and other strategies, these states are working toward reform at scale that will place the majority of students in the majority of programs on highly structured pathways to completion.
LEARN MORE: http://tinyurl.com/lumina-cca
In October 2013, the District of Columbia, Idaho, Illinois, Massachusetts, and Ohio were selected to participate in Complete College America’s Guided Pathways to Success in STEM Careers Initiative supported by the Leona M. and Harry B. Helmsley Charitable Trust. Through the implementation of GPS strategies like academic maps, default pathways, and intrusive advising, these states are developing and executing plans to dramatically increase the number of students with high-demand STEM degrees.
LEARN MORE: http://tinyurl.com/helmsley-cca
POINT OF INTEREST
POINT OF INTEREST
Four-Year Myth: Make College More Affordable. Restore the Promise of Graduating on Time. n 19
Embargoed until December 1, 2014, 8 a.m., EST

USING STRUCTURE TO BOOST COLLEGE COMPLETION
There are two sectors of two-year colleges: private and public (community colleges). Private colleges enroll similar students to public two-year colleges, but they have much higher degree completion rates. To explore this further, we studied seven public two-year colleges and two private two-year colleges that employ innovative structured procedures that may explain their success. Below we discuss some of these procedures, which seek to improve completion or labor market outcomes, and consider whether they might benefit other colleges.
n Package-Deal Programs: Rather than allowing students to make uninformed and poor choices that cost time and money, private two-year colleges design a structured curriculum aligned to high-demand jobs. Like package-deal vacations, students choose an occupation, and the program provides a structured academic map for the entire program. These structures add predictability to students’ lives, reduce course-selection mistakes and scheduling conflicts, prevent information overload, and lead to dependable progress.
n Motivational Procedures: Private two-year colleges recognize that time is the enemy, providing time schedules that improve student confidence and motivation. While many colleges assume students are motivated to persevere through six to eight years for bachelor of arts degrees, private two-year colleges build in frequent milestones. For example, shorter terms reduce the costs if family crises interrupt schooling. Degree-ladder structures award interim credentials (certificates in nine months and associate degrees in 18 months), which have job payoffs, so students who do not reach their bachelor’s degree goal still get value from their time in college.
n Frequent Mandatory Counseling: Private two-year colleges integrate frequent, mandatory group advising into their procedures every term, often in program-specific peer cohorts. Software monitors student progress and alerts counselors if students are off track.
n Focus on Soft Skills: Private two-year colleges structure college rules to resemble workplaces and give students confidence that they are becoming prepared for jobs. They teach career-relevant soft skills, both simple (attendance, dress code) and complex (time management, teamwork, communication, and problem-solving).
n Job Placement: Private two-year colleges go beyond standard job boards and resume help, often facilitating job search, job fit, and self-presentation and structuring students’ job searches by telling them which skills to emphasize, how to present them, and which jobs will value their skills.
Many institutions around the country are leveraging the power of structure to boost completion and close attainment gaps. This look at nine public and private institutions shows some of the strategies being used and highlights the fact that where there is structure, there are significant results.
By James Rosenbaum
20 n Complete College America
Embargoed until December 1, 2014,
8 a.m., EST

USING STRUCTURE TO BOOST COLLEGE COMPLETION
While community college occupational programs sometimes create similar structures, these structures are less clear than in private colleges, and they have smaller benefits. Recent research indicates further possible benefits from more structured procedures in private two-year colleges, showing that community college students report significantly lower confidence that college will meet their expectations for dependable progress, career-relevant courses, and job contacts.10 This confidence, in turn, explains program differences in college satisfaction, shown to predict persistence.
STRUCTURE = SIGNIFICANT RESULTSIn Ivy Tech’s Ivy Institute of Technology Program, structure has made all the difference. By providing structured career certificate programs, the school dramatically increased its completion rates.
≤ 10% completionWithout structured programs
85% completionWith structured programs
Public colleges may draw some valuable lessons. In some occupational programs, structures could be strengthened, and similar structures could be added to academic programs. Valencia Community College has done this for bachelor’s degree transfer programs.11 Community colleges could begin by providing a few structured programs for students who want a more focused curriculum, timely completion, and visible career relevance. They can also emphasize counseling and monitoring students’ progress and offer students opportunities to learn professional soft skills and how to demonstrate them to employers. Although our research focused on two-year colleges, these findings may also have lessons for four-year colleges, which could adopt similar procedures for their programs.
Over the past 50 years, society has asked colleges to increase college access, and they have done an impressive job. However, the current labor market requires degree completion. Public colleges can address that new goal by borrowing lessons from private colleges, and policymakers can and should support these efforts.
James Rosenbaum is a professor of sociology, education, and social policy at Northwestern University and the chair of the Institute for Policy Research’s program on poverty, race, and inequality. Rosenbaum’s current research concerns the college-for-all movement; college attendance and coaches; high-school-to-work transitions; and linkages among students, schools, and employers. He is the author of Community College: The Unfinished Revolution.
Co-authors included Caitlin Ahearn, researcher, and Kelly Becker, Ph.D. candidate, at Northwestern University.
Four-Year Myth: Make College More Affordable. Restore the Promise of Graduating on Time. n 21
Embargoed until December 1, 2014, 8 a.m., EST

ADDITIONAL CONSIDERATIONS
GPS strategies put students on track to graduate on time and save money. Combined with other Game Changer strategies, states and institutions can see two, three and four times the results compared to other initiatives.
Corequisite RemediationDefault many more students into college-level gateway courses with mandatory, just-in-time instructional support. Combine reading and writing instruction. Align mathematics to programs of study, matching the curriculum to real-world career needs. For many more unprepared students, provide remedial help parallel to highly structured coursework.
15 to FinishIncentivize students to attend full-time and ensure that full-time means 15 credits per semester or 30 credits per year. Use flat tuition so 15 credits per semester costs students no more than 12 credits. Cap degree credit requirements (120 for bachelor’s and 60 for associate) to ensure that degrees can be completed on time. Ensure that college credits can be transferred.
CURRENT MODEL: Enrolls Most Students into Remediation
Perc
enta
ge o
f stu
dent
s
Student placement data
70%
30%
Remediation Gateway
THE POWER OF 15 CREDITS: More students graduate when they complete 30+ credits in their first year.
Associate degree
0–11.9 credits 10%
27%
43%
62%
12–23.9 credits
24–29.9 credits
30+ credits
Bachelor’s degree
21%
37%
69%
79%
0–11.9 credits
12–23.9 credits
24–29.9 credits
30+ credits
NEW MODEL: Enrolls Most Students in College
Perc
enta
ge o
f stu
dent
s
Student academic performance
10%30%Te
st p
rep
or
tech
nica
l cer
tifica
te Gateway course with corequisite support
Gateway
60%
22 n Complete College America
Embargoed until December 1, 2014, 8 a.m., EST

THE ESSENTIAL ELEMENTS OF GPS
DO THIS:
Use meta majors and give students the opportunity to make informed choices. Undeclared students enter college and select among a set of initial broad clusters of majors such as STEM, social sciences, business, education, or liberal arts. As students progress, these meta majors narrow into more specific areas of study such as chemistry, accounting, psychology, or nursing. No student is considered “unclassified,” left to wander aimlessly through the curriculum.
Align mathematics to programs of study. Mathematics that are not relevant to programs of study and career goals present a serious obstacle to college success. Instead, institutions should provide statistics and quantitative literacy, which better align with most non-STEM programs.
Provide academic maps for students. Students choose coherent programs, not random individual courses. After making the “big choice” of academic majors, all other choices, including the course sequence, are laid out for them. In this way, a clear map to on-time completion is prepared, showing each student’s path from day 1 to on-time graduation.
Default students onto academic pathways. Students remain on their chosen path unless given approval to change by an adviser. Exploration outside one’s major is allowed and enabled as intentional investigation, replacing aimless wandering. Students are able to chart their path to on-time graduation and can see their progress along the way, staying on track and fully understanding the time and money consequences of making a change.
Use critical path courses that must be completed each semester to certify that students are on track. These milestone courses provide realistic assessments of student progress and give students early signals about their prospects for success in their field of study. This information eliminates the problem of students putting off challenging courses until the consequences of changing majors become too costly.
Support students through intrusive academic advising. Innovations in technology allow supports to be targeted to meet the needs of individual students. Early warning systems make it easy for institutions to track performance in required courses and target interventions when and where they are needed most. Academic advisers can focus their attention almost exclusively on students most in need of services instead of spreading themselves too thin.
Four-Year Myth: Make College More Affordable. Restore the Promise of Graduating on Time. n 23
Embargoed until December 1, 2014, 8 a.m., EST
ENDNOTES
Methodology & Acknowledgments
1 http://nscresearchcenter.org/signaturereport7.
2 http://ccrc.tc.columbia.edu/media/k2/attachments/developmental-education-community-colleges.pdf.
3 National Center for Education Statistics (2010). Digest of Education Statistics. Table 241.
4 Complete College America and Postsecondary Analytics (2013). How Full-Time are “Full-Time” Students?
5 Complete College America (2012). Causes, Costs and Consequences of Excess Credits and Time to Degree.
6 Ibid.
7 Ibid.
8 Pearson Foundation. Pearson Community College Student Survey, 2011. www.pearsonfoundation.org/pr/ 20111117-new-survey-community-college-students-shut-out-of-classes.html.
9 U.S. Department of Education. Principal Indicators of Student Academic Histories in Postsecondary Education, 1972-2000. www2.ed.gov/rschstat/research/pubs/prinindicat/prinindicat.pdf.
10 Becker, Kelly, James Rosenbaum, and Kennan Cepa (2013). “Do Colleges Fail to Meet Students’ Institutional Expectations?” Midwest Sociological Society, Chicago, March 27.
11 Shugart, S., and J. Romano (2008). “Focus on the front door of the college.” In P. Schuetz, and J. Barr (Eds.), New Directions for Community Colleges, 144, 29–40.
The data presented in this report, unless noted, were provided by the Alliance states through the submission of Complete College America/National Governors Association common college completion metrics data. The data were submitted by the states during the 2013 data collection period.
OUR PHILANTHROPIC PARTNERSBill & Melinda Gates Foundation, Carnegie Corporation of New York, The Kresge Foundation, The Leona M. and Harry B. Helmsley Charitable Trust, Lumina Foundation, and USA Funds
OUR STAFFStan Jones (president), Tom Sugar (senior vice president), Julie Johnson (vice president of strategy), Bruce Vandal (vice president), Blake Johnson (director of communications and project lead), Molly Barrick (associate director of special projects and meeting planner), and Rachelle Merkel (associate director of Alliance engagement and executive scheduler)
AND OUR PRODUCTION PARTNERS: KSA-Plus Communications provided editorial assistance and graphic design.
24 n Complete College America
Embargoed until December 1, 2014, 8 a.m., EST

StateProfiles
Four-Year Myth: Make College More Affordable. Restore the Promise of Graduating on Time. n 25
Embargoed until December 1, 2014, 8 a.m., EST

26 n Complete College America
Data for students who began college going full-time. NP = The state did not provide data for this metric. DS = Fewer than 10 students, so data were suppressed.
Many graduates earn excess credits.
And graduates take far too long to finish, costing missed opportunities and money.
1 Year Standard
2 Years Standard
4 Years Standard
4 Years Standard
YEARS 1 2 3 4 5 6
Most full-time students don’t graduate on time.
(F
LAGS
HIP/
VERY
HI
GH R
ESEA
RCH)
2-YE
AR A
SSOC
IATE
1- TO
2-Y
EAR
CERT
IFIC
ATE
(N
ON-F
LAGS
HIP)
ON TIME
ON TIME
ON TIME
ON TIME
4-YE
AR B
ACHE
LOR’
S
KNOW THIS:
The best strategy for reducing the cost of college is to ensure that more students graduate on time.
COST OF EACH ADDITIONAL YEAR
COST OF EACH ADDITIONAL YEAR
120 Credits Standard
120 Credits Standard
Data Incomplete
19%
16%
34%
7%
2.9
4.5
5.6
4.9
60 Credits Standard
78.2
55.7
30 Credits Standard
ARKANSAS
$15,629 +$35,000
$50,629
in cost of attendance
total for each student seeking associate degree
in lost wages
$21,171 +$45,327
$66,498
in cost of attendance
total for each student seeking bachelor’s degree
in lost wages
Data Incomplete
Embargoed until December 1, 2014, 8 a.m., EST

Four-Year Myth: Make College More Affordable. Restore the Promise of Graduating on Time. n 27
Notes: Cost of attendance is calculated using the state-specific cost of one additional year of tuition and fees from the College Board’s Trends in Student Pricing 2013 Report. Additional expenses include national average estimates for room and board, books and supplies, transportation, and other expenses from the College Board’s Annual Survey of Colleges for 2013–2014. Lost wages are national average salaries for new graduates and do not account for earnings while in college. The median starting salary of 2011 associate degree graduates of community colleges comes from the American Institutes for Research’s What’s the Value of an Associate’s Degree? The average starting salary of 2013 bachelor’s degree graduates comes from the National Association of Colleges and Employers 2013 Salary Survey. Credits to degree includes remedial courses. Time to degree includes time spent in remedial courses only if that was required. Students who drop out for five or more consecutive years are excluded.
Time to Degree (Years)
FULL-TIME1- TO 2-YEAR CERTIFICATE
2-YEAR ASSOCIATE
4-YEAR BACHELOR’SNON-FLAGSHIP FLAGSHIP/VERY HIGH RESEARCH
All Students 2.9 4.5 5.6 4.9
African American Students 2.8 4.4 5.5 4.9
Asian Students 2.2 7.2 5.0 4.4
Hispanic Students 2.0 3.4 4.1 4.2
White Students 2.6 4.2 4.8 4.6
Pell Grant Recipients (at any time) 2.7 4.5 5.0 4.9
Remedial Students (at any time) 3.0 4.1 5.2 4.9
Credits to Degree (Semester Credits) Includes remedial credits starting in 2013 data collection
FULL-TIME1- TO 2-YEAR CERTIFICATE
(30 CREDITS STANDARD)
2-YEAR ASSOCIATE
(60 CREDITS STANDARD)
4-YEAR BACHELOR’S (120 CREDITS STANDARD)
NON-FLAGSHIP FLAGSHIP/VERY HIGH RESEARCH
All Students 55.7 78.2 113.8 116.7
African American Students 57.9 80.9 116.1 118.8
Asian Students 51.8 84.9 123.3 122.7
Hispanic Students 51.7 74.1 113.5 110.5
White Students 55.4 77.8 113.9 117.3
Pell Grant Recipients (at any time) 59.6 78.2 113.2 115.2
Remedial Students (at any time) 59.8 77.7 115.4 112.1
Graduation Rate
FULL-TIME1- TO 2-YEAR CERTIFICATE
2-YEAR ASSOCIATE
4-YEAR BACHELOR’SNON-FLAGSHIP FLAGSHIP/VERY HIGH RESEARCH
ON TIME IN 2 YEARS ON TIME IN 3 YEARS ON TIME IN 6 YEARS ON TIME IN 6 YEARS
All Students 19% 23% 7% 14% 16% 34% 34% 58%
African American Students 11% 12% 2% 5% 6% 20% 20% 44%
Asian Students DS DS DS 16% 24% 50% 33% 53%
Hispanic Students DS DS 6% 14% 11% 33% 27% 53%
White Students 22% 26% 8% 16% 21% 38% 34% 58%
Pell Grant Recipients (at any time) 15% 18% NP NP NP NP NP NP
Remedial Students (at any time) 16% 18% 4% 10% 5% 20% 14% 39%
PART-TIME NON-FLAGSHIP FLAGSHIP/VERY HIGH RESEARCHON TIME IN 2 YEARS ON TIME IN 3 YEARS ON TIME IN 6 YEARS ON TIME IN 6 YEARS
All Students 9% 10% DS 3% DS 9% DS 22%
African American Students 15% 15% NP DS NP DS DS DS
Asian Students DS DS NP DS DS DS NP NP
Hispanic Students DS DS NP DS NP DS DS DS
White Students DS 6% DS 4% DS 6% DS 21%
Pell Grant Recipients (at any time) DS DS NP NP NP NP NP NP
Remedial Students (at any time) DS DS DS 3% DS 8% DS DS
ARKANSASEmbargoed until December 1, 2014, 8 a.m., EST

28 n Complete College America
Data for students who began college going full-time. NP = The state did not provide data for this metric. DS = Fewer than 10 students, so data were suppressed.
Many graduates earn excess credits.
And graduates take far too long to finish, costing missed opportunities and money.
1 Year Standard
2 Years Standard
4 Years Standard
4 Years Standard
YEARS 1 2 3 4 5 6
Most full-time students don’t graduate on time.
(F
LAGS
HIP/
VERY
HI
GH R
ESEA
RCH)
2-YE
AR A
SSOC
IATE
1- TO
2-Y
EAR
CERT
IFIC
ATE
(N
ON-F
LAGS
HIP)
ON TIME
ON TIME
ON TIME
ON TIME
4-YE
AR B
ACHE
LOR’
S
KNOW THIS:
The best strategy for reducing the cost of college is to ensure that more students graduate on time.
COST OF EACH ADDITIONAL YEAR
COST OF EACH ADDITIONAL YEAR
120 Credits Standard
134.2
64.9
37%
12%
32%
6%
2.3
2.9
4.5
4.0
60 Credits Standard
78.8
120 Credits Standard
134.6
COLORADO
$16,443 +$35,000
$51,443
in cost of attendance
total for each student seeking associate degree
in lost wages
$23,029 +$45,327
$68,356
in cost of attendance
total for each student seeking bachelor’s degree
in lost wages
30 Credits Standard
Embargoed until December 1, 2014, 8 a.m., EST

Four-Year Myth: Make College More Affordable. Restore the Promise of Graduating on Time. n 29
Notes: Cost of attendance is calculated using the state-specific cost of one additional year of tuition and fees from the College Board’s Trends in Student Pricing 2013 Report. Additional expenses include national average estimates for room and board, books and supplies, transportation, and other expenses from the College Board’s Annual Survey of Colleges for 2013–2014. Lost wages are national average salaries for new graduates and do not account for earnings while in college. The median starting salary of 2011 associate degree graduates of community colleges comes from the American Institutes for Research’s What’s the Value of an Associate’s Degree? The average starting salary of 2013 bachelor’s degree graduates comes from the National Association of Colleges and Employers 2013 Salary Survey. Credits to degree includes remedial courses. Time to degree includes time spent in remedial courses only if that was required. Students who drop out for five or more consecutive years are excluded.
Four-Year Myth: Make College More Affordable. Restore the Promise of Graduating on Time. n 29
Time to Degree (Years)
FULL-TIME1- TO 2-YEAR CERTIFICATE
2-YEAR ASSOCIATE
4-YEAR BACHELOR’SNON-FLAGSHIP FLAGSHIP/VERY HIGH RESEARCH
All Students 2.3 2.9 4.5 4.0
African American Students 3.6 2.4 4.6 4.1
Asian Students 2.8 3.2 3.8 4.0
Hispanic Students 3.0 3.3 4.8 4.1
White Students 2.1 3.0 4.5 4.0
Pell Grant Recipients (at any time) NP NP NP NP
Remedial Students (at any time) NP NP NP NP
Credits to Degree (Semester Credits) Includes remedial credits starting in 2013 data collection
FULL-TIME1- TO 2-YEAR CERTIFICATE
(30 CREDITS STANDARD)
2-YEAR ASSOCIATE
(60 CREDITS STANDARD)
4-YEAR BACHELOR’S (120 CREDITS STANDARD)
NON-FLAGSHIP FLAGSHIP/VERY HIGH RESEARCH
All Students 64.9 78.8 134.6 134.2
African American Students 72.7 68.1 138.2 131.5
Asian Students 82.2 76.3 136.6 139.4
Hispanic Students 63.5 79.6 134.9 132.7
White Students 66.7 80.3 134.1 134.0
Pell Grant Recipients (at any time) NP NP NP NP
Remedial Students (at any time) NP NP NP NP
Graduation Rate
FULL-TIME1- TO 2-YEAR CERTIFICATE
2-YEAR ASSOCIATE
4-YEAR BACHELOR’SNON-FLAGSHIP FLAGSHIP/VERY HIGH RESEARCH
ON TIME IN 2 YEARS ON TIME IN 3 YEARS ON TIME IN 6 YEARS ON TIME IN 6 YEARS
All Students 37% 39% 6% 12% 12% 26% 32% 59%
African American Students NP NP 3% 4% 7% 22% 17% 42%
Asian Students DS DS 4% 9% 10% 25% 26% 57%
Hispanic Students 39% 40% 4% 9% 9% 21% 25% 50%
White Students 41% 44% 7% 14% 12% 27% 34% 61%
Pell Grant Recipients (at any time) 33% 35% 5% 11% 10% 26% 25% 52%
Remedial Students (at any time) 10% 13% 2% 7% 6% 21% 11% 29%
PART-TIME NON-FLAGSHIP FLAGSHIP/VERY HIGH RESEARCHON TIME IN 2 YEARS ON TIME IN 3 YEARS ON TIME IN 6 YEARS ON TIME IN 6 YEARS
All Students 5% 6% 1% 3% DS DS NP NP
African American Students DS DS DS 1% NP NP NP NP
Asian Students DS DS DS DS NP NP NP NP
Hispanic Students DS DS 1% 2% NP NP NP NP
White Students 6% 7% 1% 3% DS DS NP NP
Pell Grant Recipients (at any time) DS 7% 1% 3% NP NP NP NP
Remedial Students (at any time) DS DS 0% 2% DS DS NP NP
COLORADOEmbargoed until December 1, 2014, 8 a.m., EST

30 n Complete College America
Data for students who began college going full-time. NP = The state did not provide data for this metric. DS = Fewer than 10 students, so data were suppressed.
Many graduates earn excess credits.
And graduates take far too long to finish, costing missed opportunities and money.
1 Year Standard
2 Years Standard
4 Years Standard
4 Years Standard
YEARS 1 2 3 4 5 6
Most full-time students don’t graduate on time.
(F
LAGS
HIP/
VERY
HI
GH R
ESEA
RCH)
2-YE
AR A
SSOC
IATE
1- TO
2-Y
EAR
CERT
IFIC
ATE
(N
ON-F
LAGS
HIP)
ON TIME
ON TIME
ON TIME
ON TIME
4-YE
AR B
ACHE
LOR’
S
KNOW THIS:
The best strategy for reducing the cost of college is to ensure that more students graduate on time.
COST OF EACH ADDITIONAL YEAR
COST OF EACH ADDITIONAL YEARON TIME
120 Credits Standard
120 Credits Standard
60 Credits Standard
125.1
125.3
84.5
76.8
DS
18%
58%
3%
3.4
4.3
4.5
4.2
CONNECTICUT
$16,455 +$35,000
$51,455
in cost of attendance
total for each student seeking associate degree
in lost wages
$24,139 +$45,327
$69,466
in cost of attendance
total for each student seeking bachelor’s degree
in lost wages
ON TIME
30 Credits Standard
Embargoed until December 1, 2014, 8 a.m., EST

Four-Year Myth: Make College More Affordable. Restore the Promise of Graduating on Time. n 31
Notes: Cost of attendance is calculated using the state-specific cost of one additional year of tuition and fees from the College Board’s Trends in Student Pricing 2013 Report. Additional expenses include national average estimates for room and board, books and supplies, transportation, and other expenses from the College Board’s Annual Survey of Colleges for 2013–2014. Lost wages are national average salaries for new graduates and do not account for earnings while in college. The median starting salary of 2011 associate degree graduates of community colleges comes from the American Institutes for Research’s What’s the Value of an Associate’s Degree? The average starting salary of 2013 bachelor’s degree graduates comes from the National Association of Colleges and Employers 2013 Salary Survey. Credits to degree includes remedial courses. Time to degree includes time spent in remedial courses only if that was required. Students who drop out for five or more consecutive years are excluded.
Time to Degree (Years)
FULL-TIME1- TO 2-YEAR CERTIFICATE
2-YEAR ASSOCIATE
4-YEAR BACHELOR’SNON-FLAGSHIP FLAGSHIP/VERY HIGH RESEARCH
All Students 3.4 4.3 4.5 4.2
African American Students 4.5 4.6 4.8 4.7
Asian Students 2.3 4.1 4.4 4.1
Hispanic Students 4.8 4.5 4.5 4.3
White Students 3.1 4.2 4.5 4.2
Pell Grant Recipients (at any time) 3.6 4.4 4.6 4.4
Remedial Students (at any time) 4.5 4.6 4.7 NP
Credits to Degree (Semester Credits) Includes remedial credits starting in 2013 data collection
FULL-TIME1- TO 2-YEAR CERTIFICATE
(30 CREDITS STANDARD)
2-YEAR ASSOCIATE
(60 CREDITS STANDARD)
4-YEAR BACHELOR’S (120 CREDITS STANDARD)
NON-FLAGSHIP FLAGSHIP/VERY HIGH RESEARCH
All Students 76.8 84.5 125.1 125.3
African American Students 89.3 82.4 124.6 123.7
Asian Students 52.8 87.7 124.8 129.6
Hispanic Students 84.9 87.1 123.4 123.5
White Students 74.7 83.6 125.3 124.6
Pell Grant Recipients (at any time) 79.1 84.4 125.2 125.6
Remedial Students (at any time) 90.4 86.1 127.5 NP
Graduation Rate
FULL-TIME1- TO 2-YEAR CERTIFICATE
2-YEAR ASSOCIATE
4-YEAR BACHELOR’SNON-FLAGSHIP FLAGSHIP/VERY HIGH RESEARCH
ON TIME IN 2 YEARS ON TIME IN 3 YEARS ON TIME IN 6 YEARS ON TIME IN 6 YEARS
All Students DS DS 3% 10% 18% 43% 58% 75%
African American Students DS DS DS 5% 14% 33% 33% 57%
Asian Students DS DS DS 12% 21% 43% 54% 76%
Hispanic Students DS DS 1% 7% 14% 35% 40% 61%
White Students DS DS 3% 12% 19% 45% 63% 79%
Pell Grant Recipients (at any time) DS DS 2% 9% 14% 39% 44% 69%
Remedial Students (at any time) DS DS 1% 8% 12% 37% NP NP
PART-TIME NON-FLAGSHIP FLAGSHIP/VERY HIGH RESEARCHON TIME IN 2 YEARS ON TIME IN 3 YEARS ON TIME IN 6 YEARS ON TIME IN 6 YEARS
All Students DS DS 1% 4% 7% 20% NP NP
African American Students DS DS DS DS NP DS NP NP
Asian Students DS DS DS DS DS DS NP NP
Hispanic Students DS DS DS 3% NP DS NP NP
White Students DS DS 1% 5% 9% 24% NP NP
Pell Grant Recipients (at any time) DS DS DS 3% DS DS NP NP
Remedial Students (at any time) DS DS DS 2% DS 24% NP NP
CONNECTICUTEmbargoed until December 1, 2014, 8 a.m., EST

32 n Complete College America
Data for students who began college going full-time. NP = The state did not provide data for this metric. DS = Fewer than 10 students, so data were suppressed.
Many graduates earn excess credits.
And graduates take far too long to finish, costing missed opportunities and money.
1 Year Standard
2 Years Standard
4 Years Standard
4 Years Standard
YEARS 1 2 3 4 5 6
Most full-time students don’t graduate on time.
(F
LAGS
HIP/
VERY
HI
GH R
ESEA
RCH)
2-YE
AR A
SSOC
IATE
1- TO
2-Y
EAR
CERT
IFIC
ATE
(N
ON-F
LAGS
HIP)
ON TIME
ON TIME
ON TIME
ON TIME
4-YE
AR B
ACHE
LOR’
S
KNOW THIS:
The best strategy for reducing the cost of college is to ensure that more students graduate on time.
COST OF EACH ADDITIONAL YEAR
COST OF EACH ADDITIONAL YEAR
60 Credits Standard
120 Credits Standard
NP
66.9
30 Credits Standard
NP
NP
11%
NP
NP
NP
3.4
4.7
NP
DISTRICT OF COLUMBIA
$NP +$35,000
NP
in cost of attendance
total for each student seeking associate degree
in lost wages
$NP +$45,327
NP
in cost of attendance
total for each student seeking bachelor’s degree
in lost wages
120 Credits Standard
Data Incomplete
Embargoed until December 1, 2014, 8 a.m., EST

Four-Year Myth: Make College More Affordable. Restore the Promise of Graduating on Time. n 33
Notes: Cost of attendance is calculated using the state-specific cost of one additional year of tuition and fees from the College Board’s Trends in Student Pricing 2013 Report. Additional expenses include national average estimates for room and board, books and supplies, transportation, and other expenses from the College Board’s Annual Survey of Colleges for 2013–2014. Lost wages are national average salaries for new graduates and do not account for earnings while in college. The median starting salary of 2011 associate degree graduates of community colleges comes from the American Institutes for Research’s What’s the Value of an Associate’s Degree? The average starting salary of 2013 bachelor’s degree graduates comes from the National Association of Colleges and Employers 2013 Salary Survey. Credits to degree includes remedial courses. Time to degree includes time spent in remedial courses only if that was required. Students who drop out for five or more consecutive years are excluded.
Four-Year Myth: Make College More Affordable. Restore the Promise of Graduating on Time. n 33
Time to Degree (Years)
FULL-TIME1- TO 2-YEAR CERTIFICATE
2-YEAR ASSOCIATE
4-YEAR BACHELOR’SNON-FLAGSHIP FLAGSHIP/VERY HIGH RESEARCH
All Students NP 3.4 4.7 NP
African American Students NP 4.4 5.1 NP
Asian Students NP 2.4 4.0 NP
Hispanic Students NP 3.0 4.6 NP
White Students NP 3.0 4.1 NP
Pell Grant Recipients (at any time) NP NP NP NP
Remedial Students (at any time) NP 4.5 5.8 NP
Credits to Degree (Semester Credits) Includes remedial credits starting in 2013 data collection
FULL-TIME1- TO 2-YEAR CERTIFICATE
(30 CREDITS STANDARD)
2-YEAR ASSOCIATE
(60 CREDITS STANDARD)
4-YEAR BACHELOR’S (120 CREDITS STANDARD)
NON-FLAGSHIP FLAGSHIP/VERY HIGH RESEARCH
All Students NP 66.9 101.1 NP
African American Students NP 75.2 101.6 NP
Asian Students NP 68.1 96.7 NP
Hispanic Students NP 70.7 99.0 NP
White Students NP 53.0 94.4 NP
Pell Grant Recipients (at any time) NP NP NP NP
Remedial Students (at any time) NP 76.9 108.1 NP
Graduation Rate
FULL-TIME1- TO 2-YEAR CERTIFICATE
2-YEAR ASSOCIATE
4-YEAR BACHELOR’SNON-FLAGSHIP FLAGSHIP/VERY HIGH RESEARCH
ON TIME IN 2 YEARS ON TIME IN 3 YEARS ON TIME IN 6 YEARS ON TIME IN 6 YEARS
All Students NP NP NP DS 11% 23% NP NP
African American Students NP NP NP DS 11% 23% NP NP
Asian Students NP NP DS DS DS DS NP NP
Hispanic Students NP NP DS DS DS DS NP NP
White Students NP NP DS DS DS DS NP NP
Pell Grant Recipients (at any time) NP NP NP NP NP NP NP NP
Remedial Students (at any time) NP NP NP DS DS 15% NP NP
PART-TIME NON-FLAGSHIP FLAGSHIP/VERY HIGH RESEARCHON TIME IN 2 YEARS ON TIME IN 3 YEARS ON TIME IN 6 YEARS ON TIME IN 6 YEARS
All Students NP NP DS DS 4% 7% NP NP
African American Students NP NP DS DS DS 7% NP NP
Asian Students NP NP DS DS DS DS NP NP
Hispanic Students NP NP DS DS DS DS NP NP
White Students NP NP DS DS DS DS NP NP
Pell Grant Recipients (at any time) NP NP NP NP NP NP NP NP
Remedial Students (at any time) NP NP NP DS DS DS NP NP
DISTRICT OF COLUMBIA
Embargoed until December 1, 2014, 8 a.m., EST

34 n Complete College America
Data for students who began college going full-time. NP = The state did not provide data for this metric. DS = Fewer than 10 students, so data were suppressed.
Many graduates earn excess credits.
And graduates take far too long to finish, costing missed opportunities and money.
1 Year Standard
2 Years Standard
4 Years Standard
4 Years Standard
YEARS 1 2 3 4 5 6
Most full-time students don’t graduate on time.
(F
LAGS
HIP/
VERY
HI
GH R
ESEA
RCH)
2-YE
AR A
SSOC
IATE
1- TO
2-Y
EAR
CERT
IFIC
ATE
(N
ON-F
LAGS
HIP)
ON TIME
ON TIME
ON TIME
ON TIME
4-YE
AR B
ACHE
LOR’
S
KNOW THIS:
The best strategy for reducing the cost of college is to ensure that more students graduate on time.
COST OF EACH ADDITIONAL YEAR
COST OF EACH ADDITIONAL YEAR
60 Credits Standard
28%
NP
NP
13%
NP
FLORIDA
NP
NP
NP
NP $15,809 +$35,000
$50,809
in cost of attendance
total for each student seeking associate degree
in lost wages
$20,269 +$45,327
$65,596
in cost of attendance
total for each student seeking bachelor’s degree
in lost wages
30 Credits Standard
NP
120 Credits Standard
NP
120 Credits Standard
NP
ON TIME
Embargoed until December 1, 2014, 8 a.m., EST

Four-Year Myth: Make College More Affordable. Restore the Promise of Graduating on Time. n 35
Notes: Cost of attendance is calculated using the state-specific cost of one additional year of tuition and fees from the College Board’s Trends in Student Pricing 2013 Report. Additional expenses include national average estimates for room and board, books and supplies, transportation, and other expenses from the College Board’s Annual Survey of Colleges for 2013–2014. Lost wages are national average salaries for new graduates and do not account for earnings while in college. The median starting salary of 2011 associate degree graduates of community colleges comes from the American Institutes for Research’s What’s the Value of an Associate’s Degree? The average starting salary of 2013 bachelor’s degree graduates comes from the National Association of Colleges and Employers 2013 Salary Survey. Credits to degree includes remedial courses. Time to degree includes time spent in remedial courses only if that was required. Students who drop out for five or more consecutive years are excluded.
Time to Degree (Years)
FULL-TIME1- TO 2-YEAR CERTIFICATE
2-YEAR ASSOCIATE
4-YEAR BACHELOR’SNON-FLAGSHIP FLAGSHIP/VERY HIGH RESEARCH
All Students NP NP NP NP
African American Students NP NP NP NP
Asian Students NP NP NP NP
Hispanic Students NP NP NP NP
White Students NP NP NP NP
Pell Grant Recipients (at any time) NP NP NP NP
Remedial Students (at any time) NP NP NP NP
Credits to Degree (Semester Credits) Includes remedial credits starting in 2013 data collection
FULL-TIME1- TO 2-YEAR CERTIFICATE
(30 CREDITS STANDARD)
2-YEAR ASSOCIATE
(60 CREDITS STANDARD)
4-YEAR BACHELOR’S (120 CREDITS STANDARD)
NON-FLAGSHIP FLAGSHIP/VERY HIGH RESEARCH
All Students NP NP NP NP
African American Students NP NP NP NP
Asian Students NP NP NP NP
Hispanic Students NP NP NP NP
White Students NP NP NP NP
Pell Grant Recipients (at any time) NP NP NP NP
Remedial Students (at any time) NP NP NP NP
Graduation Rate
FULL-TIME1- TO 2-YEAR CERTIFICATE
2-YEAR ASSOCIATE
4-YEAR BACHELOR’SNON-FLAGSHIP FLAGSHIP/VERY HIGH RESEARCH
ON TIME IN 2 YEARS ON TIME IN 3 YEARS ON TIME IN 6 YEARS ON TIME IN 6 YEARS
All Students 28% 34% 13% 30% NP NP NP NP
African American Students 21% 26% 7% 20% NP NP NP NP
Asian Students 18% 36% 16% 37% NP NP NP NP
Hispanic Students 12% 17% 12% 29% NP NP NP NP
White Students 39% 46% 16% 34% NP NP NP NP
Pell Grant Recipients (at any time) 22% 31% 10% 25% NP NP NP NP
Remedial Students (at any time) 4% 12% 5% 18% NP NP NP NP
PART-TIME NON-FLAGSHIP FLAGSHIP/VERY HIGH RESEARCHON TIME IN 2 YEARS ON TIME IN 3 YEARS ON TIME IN 6 YEARS ON TIME IN 6 YEARS
All Students 23% 30% 2% 8% NP NP NP NP
African American Students 19% 25% 1% 5% NP NP NP NP
Asian Students 26% 33% 2% 13% NP NP NP NP
Hispanic Students 12% 17% 2% 8% NP NP NP NP
White Students 29% 36% 2% 9% NP NP NP NP
Pell Grant Recipients (at any time) 14% 23% 1% 8% NP NP NP NP
Remedial Students (at any time) 2% 9% 1% 6% NP NP NP NP
FLORIDAEmbargoed until December 1, 2014, 8 a.m., EST
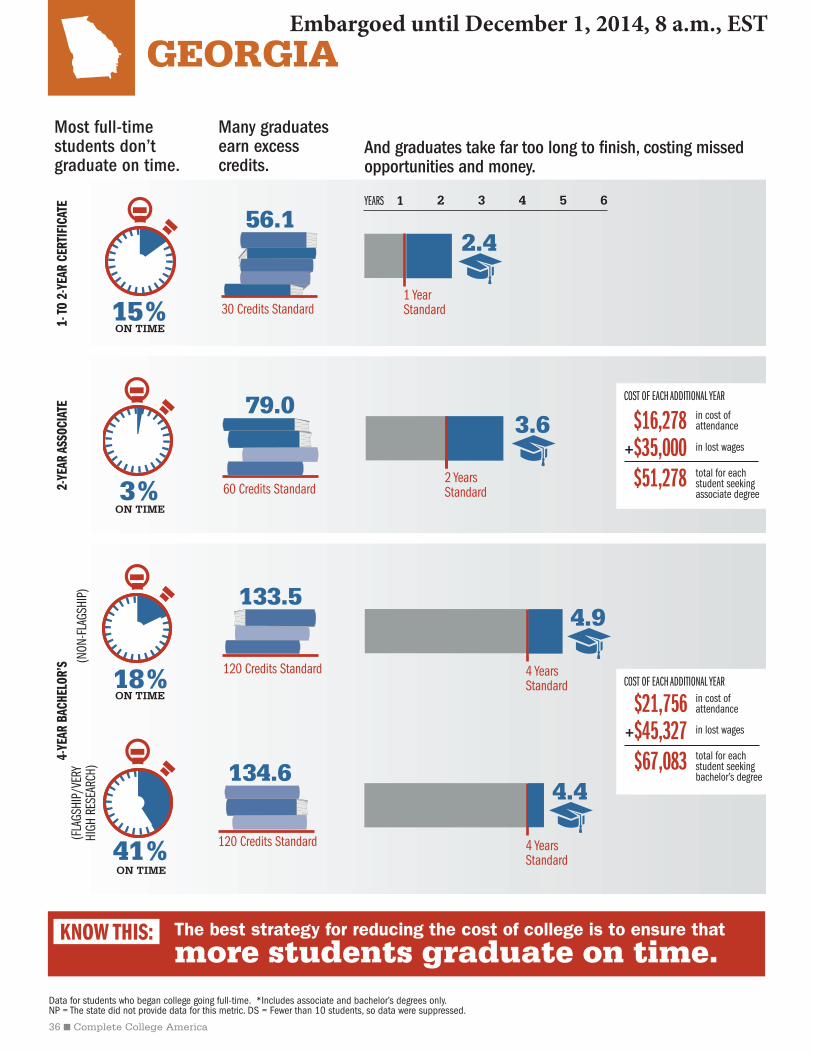
36 n Complete College America
Many graduates earn excess credits.
And graduates take far too long to finish, costing missed opportunities and money.
1 Year Standard
2 Years Standard
4 Years Standard
4 Years Standard
YEARS 1 2 3 4 5 6
Most full-time students don’t graduate on time.
(F
LAGS
HIP/
VERY
HI
GH R
ESEA
RCH)
2-YE
AR A
SSOC
IATE
1- TO
2-Y
EAR
CERT
IFIC
ATE
(N
ON-F
LAGS
HIP)
ON TIME
ON TIME
ON TIME
ON TIME
4-YE
AR B
ACHE
LOR’
S
KNOW THIS:
The best strategy for reducing the cost of college is to ensure that more students graduate on time.
COST OF EACH ADDITIONAL YEAR
COST OF EACH ADDITIONAL YEAR
120 Credits Standard
120 Credits Standard
60 Credits Standard
30 Credits Standard
133.5
134.6
79.0
56.1
GEORGIA
15%
18%
41%
3%
2.4
3.6
4.9
4.4
Data for students who began college going full-time. *Includes associate and bachelor’s degrees only. NP = The state did not provide data for this metric. DS = Fewer than 10 students, so data were suppressed.
$16,278 +$35,000
$51,278
in cost of attendance
total for each student seeking associate degree
in lost wages
$21,756 +$45,327
$67,083
in cost of attendance
total for each student seeking bachelor’s degree
in lost wages
Embargoed until December 1, 2014, 8 a.m., EST

Four-Year Myth: Make College More Affordable. Restore the Promise of Graduating on Time. n 37
Notes: Cost of attendance is calculated using the state-specific cost of one additional year of tuition and fees from the College Board’s Trends in Student Pricing 2013 Report. Additional expenses include national average estimates for room and board, books and supplies, transportation, and other expenses from the College Board’s Annual Survey of Colleges for 2013–2014. Lost wages are national average salaries for new graduates and do not account for earnings while in college. The median starting salary of 2011 associate degree graduates of community colleges comes from the American Institutes for Research’s What’s the Value of an Associate’s Degree? The average starting salary of 2013 bachelor’s degree graduates comes from the National Association of Colleges and Employers 2013 Salary Survey. Credits to degree includes remedial courses. Time to degree includes time spent in remedial courses only if that was required. Students who drop out for five or more consecutive years are excluded.
Four-Year Myth: Make College More Affordable. Restore the Promise of Graduating on Time. n 37
Time to Degree (Years)
FULL-TIME1- TO 2-YEAR CERTIFICATE
2-YEAR ASSOCIATE
4-YEAR BACHELOR’SNON-FLAGSHIP FLAGSHIP/VERY HIGH RESEARCH
All Students 2.4 3.6 4.9 4.4
African American Students 2.6 3.8 5.0 4.8
Asian Students 2.5 3.7 5.0 4.3
Hispanic Students 2.0 3.7 4.9 4.5
White Students 2.3 3.5 4.8 4.3
Pell Grant Recipients (at any time) 2.5 3.8 5.2 4.7
Remedial Students (at any time) 2.8 4.0 6.0 5.8
Credits to Degree (Semester Credits) Includes remedial credits starting in 2013 data collection
FULL-TIME1- TO 2-YEAR CERTIFICATE
(30 CREDITS STANDARD)
2-YEAR ASSOCIATE
(60 CREDITS STANDARD)
4-YEAR BACHELOR’S (120 CREDITS STANDARD)
NON-FLAGSHIP FLAGSHIP/VERY HIGH RESEARCH
All Students 56.1 79.0 133.5 134.6
African American Students 57.6 78.3 134.9 138.6
Asian Students 53.8 76.3 135.7 137.8
Hispanic Students 52.5 81.1 134.7 136.5
White Students 55.2 79.4 132.9 132.9
Pell Grant Recipients (at any time) 57.5 80.2 135.2 136.2
Remedial Students (at any time) 59.6 78.8 136.7 135.3
Graduation Rate
FULL-TIME1- TO 2-YEAR CERTIFICATE
2-YEAR ASSOCIATE
4-YEAR BACHELOR’SNON-FLAGSHIP FLAGSHIP/VERY HIGH RESEARCH
ON TIME IN 2 YEARS ON TIME IN 3 YEARS ON TIME IN 6 YEARS ON TIME IN 6 YEARS
All Students 15% 19% 3% 11% 18% 49% 41% 77%
African American Students 16% 20% 1% 6% 13% 43% 27% 64%
Asian Students DS DS 4% 12% 17% 60% 41% 78%
Hispanic Students 11% 14% 3% 10% 14% 42% 31% 69%
White Students 16% 20% 5% 14% 20% 53% 44% 80%
Pell Grant Recipients (at any time) 17% 21% 3% 9% 13% 41% 31% 67%
Remedial Students (at any time) 7% 10% 1% 6% 4% 24% DS 40%
PART-TIME NON-FLAGSHIP FLAGSHIP/VERY HIGH RESEARCHON TIME IN 2 YEARS ON TIME IN 3 YEARS ON TIME IN 6 YEARS ON TIME IN 6 YEARS
All Students 9% 13% 1% 4% 2% 13% 9% 30%
African American Students 10% 15% DS 2% DS 7% NP DS
Asian Students DS 25% DS DS DS DS DS DS
Hispanic Students DS 14% DS DS DS DS DS DS
White Students 8% 12% 2% 6% 2% 16% DS 37%
Pell Grant Recipients (at any time) 9% 15% DS 4% DS 5% DS DS
Remedial Students (at any time) 4% 7% DS 3% DS 9% DS DS
GEORGIAEmbargoed until December 1, 2014, 8 a.m., EST

38 n Complete College America
Data for students who began college going full-time. NP = The state did not provide data for this metric. DS = Fewer than 10 students, so data were suppressed.
Many graduates earn excess credits.
And graduates take far too long to finish, costing missed opportunities and money.
1 Year Standard
2 Years Standard
4 Years Standard
4 Years Standard
YEARS 1 2 3 4 5 6
Most full-time students don’t graduate on time.
(F
LAGS
HIP/
VERY
HI
GH R
ESEA
RCH)
2-YE
AR A
SSOC
IATE
1- TO
2-Y
EAR
CERT
IFIC
ATE
(N
ON-F
LAGS
HIP)
ON TIME
ON TIME
ON TIME
ON TIME
4-YE
AR B
ACHE
LOR’
S
KNOW THIS:
The best strategy for reducing the cost of college is to ensure that more students graduate on time.
COST OF EACH ADDITIONAL YEAR
COST OF EACH ADDITIONAL YEAR
60 Credits Standard
30 Credits Standard
78.2
67.6
NP
13%
19%
3%
3.1
3.6
4.9
4.8
120 Credits Standard
131.9
HAWAII
120 Credits Standard
140.0
$15,923 +$35,000
$50,923
in cost of attendance
total for each student seeking associate degree
in lost wages
$23,030 +$45,327
$68,357
in cost of attendance
total for each student seeking bachelor’s degree
in lost wages
Embargoed until December 1, 2014, 8 a.m., EST

Four-Year Myth: Make College More Affordable. Restore the Promise of Graduating on Time. n 39
Notes: Cost of attendance is calculated using the state-specific cost of one additional year of tuition and fees from the College Board’s Trends in Student Pricing 2013 Report. Additional expenses include national average estimates for room and board, books and supplies, transportation, and other expenses from the College Board’s Annual Survey of Colleges for 2013–2014. Lost wages are national average salaries for new graduates and do not account for earnings while in college. The median starting salary of 2011 associate degree graduates of community colleges comes from the American Institutes for Research’s What’s the Value of an Associate’s Degree? The average starting salary of 2013 bachelor’s degree graduates comes from the National Association of Colleges and Employers 2013 Salary Survey. Credits to degree includes remedial courses. Time to degree includes time spent in remedial courses only if that was required. Students who drop out for five or more consecutive years are excluded.
Time to Degree (Years)
FULL-TIME1- TO 2-YEAR CERTIFICATE
2-YEAR ASSOCIATE
4-YEAR BACHELOR’SNON-FLAGSHIP FLAGSHIP/VERY HIGH RESEARCH
All Students 3.1 3.6 4.8 4.9
African American Students NP 3.5 4.8 5.6
Asian Students 3.3 3.8 4.9 4.9
Native Hawaiian/Pacific Islander Students 3.4 3.7 5.0 5.0
White Students 2.2 3.1 4.9 4.7
Pell Grant Recipients (at any time) 3.2 3.6 5.2 5.0
Remedial Students (at any time) 3.5 3.7 5.7 5.4
Credits to Degree (Semester Credits) Includes remedial credits starting in 2013 data collection
FULL-TIME1- TO 2-YEAR CERTIFICATE
(30 CREDITS STANDARD)
2-YEAR ASSOCIATE
(60 CREDITS STANDARD)
4-YEAR BACHELOR’S (120 CREDITS STANDARD)
NON-FLAGSHIP FLAGSHIP/VERY HIGH RESEARCH
All Students 67.6 78.2 140.0 131.9
African American Students NP 73.0 142.0 138.3
Asian Students 70.0 80.9 143.6 131.8
Native Hawaiian/Pacific Islander Students 70.2 76.8 142.0 134.4
White Students 58.5 71.9 125.9 131.1
Pell Grant Recipients (at any time) 67.8 80.1 132.8 143.4
Remedial Students (at any time) 73.2 80.7 136.1 142.7
Graduation Rate
FULL-TIME1- TO 2-YEAR CERTIFICATE
2-YEAR ASSOCIATE
4-YEAR BACHELOR’SNON-FLAGSHIP FLAGSHIP/VERY HIGH RESEARCH
ON TIME IN 2 YEARS ON TIME IN 3 YEARS ON TIME IN 6 YEARS ON TIME IN 6 YEARS
All Students NP DS 3% 14% 13% 42% 19% 56%
African American Students NP NP DS DS DS DS DS 48%
Asian Students NP NP 3% 14% 20% 56% 20% 64%
Native Hawaiian/Pacific Islander Students DS DS DS 10% DS 38% 13% 54%
White Students DS DS 6% 13% 14% 38% 17% 40%
Pell Grant Recipients (at any time) NP NP 2% 12% 11% 42% 18% 57%
Remedial Students (at any time) DS DS 2% 11% DS DS DS DS
PART-TIME NON-FLAGSHIP FLAGSHIP/VERY HIGH RESEARCHON TIME IN 2 YEARS ON TIME IN 3 YEARS ON TIME IN 6 YEARS ON TIME IN 6 YEARS
All Students DS DS DS 3% NP DS DS DS
African American Students NP NP NP NP NP NP NP NP
Asian Students NP NP NP 5% NP NP NP NP
Native Hawaiian/Pacific Islander Students DS DS DS DS DS DS DS DS
White Students DS DS NP DS DS DS DS DS
Pell Grant Recipients (at any time) DS DS NP DS DS DS DS DS
Remedial Students (at any time) DS DS NP 3% DS DS NP NP
HAWAIIEmbargoed until December 1, 2014, 8 a.m., EST

40 n Complete College America
Data for students who began college going full-time. NP = The state did not provide data for this metric. DS = Fewer than 10 students, so data were suppressed.
Many graduates earn excess credits.
And graduates take far too long to finish, costing missed opportunities and money.
1 Year Standard
2 Years Standard
4 Years Standard
4 Years Standard
YEARS 1 2 3 4 5 6
Most full-time students don’t graduate on time.
(F
LAGS
HIP/
VERY
HI
GH R
ESEA
RCH)
2-YE
AR A
SSOC
IATE
1- TO
2-Y
EAR
CERT
IFIC
ATE
(N
ON-F
LAGS
HIP)
ON TIME
ON TIME
ON TIME
ON TIME
4-YE
AR B
ACHE
LOR’
S
KNOW THIS:
The best strategy for reducing the cost of college is to ensure that more students graduate on time.
COST OF EACH ADDITIONAL YEAR
COST OF EACH ADDITIONAL YEAR
30 Credits Standard
120 Credits Standard
120 Credits Standard
60 Credits Standard
140.8
NP
89.5
63.6
19%
14%
NP
10%
2.4
3.8
5.6
NP
IDAHO
$16,355 +$35,000
$51,355
in cost of attendance
total for each student seeking associate degree
in lost wages
$20,258 +$45,327
$65,585
in cost of attendance
total for each student seeking bachelor’s degree
in lost wages
Embargoed until December 1, 2014, 8 a.m., EST
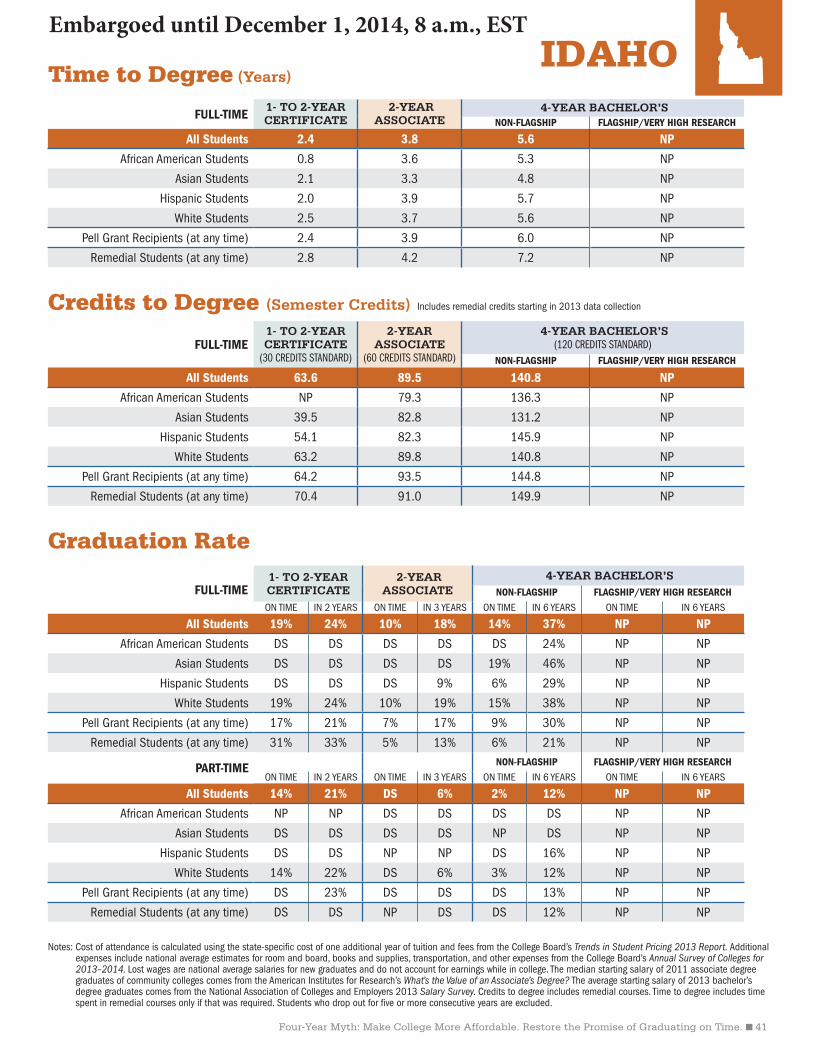
Four-Year Myth: Make College More Affordable. Restore the Promise of Graduating on Time. n 41
Notes: Cost of attendance is calculated using the state-specific cost of one additional year of tuition and fees from the College Board’s Trends in Student Pricing 2013 Report. Additional expenses include national average estimates for room and board, books and supplies, transportation, and other expenses from the College Board’s Annual Survey of Colleges for 2013–2014. Lost wages are national average salaries for new graduates and do not account for earnings while in college. The median starting salary of 2011 associate degree graduates of community colleges comes from the American Institutes for Research’s What’s the Value of an Associate’s Degree? The average starting salary of 2013 bachelor’s degree graduates comes from the National Association of Colleges and Employers 2013 Salary Survey. Credits to degree includes remedial courses. Time to degree includes time spent in remedial courses only if that was required. Students who drop out for five or more consecutive years are excluded.
Time to Degree (Years)
FULL-TIME1- TO 2-YEAR CERTIFICATE
2-YEAR ASSOCIATE
4-YEAR BACHELOR’SNON-FLAGSHIP FLAGSHIP/VERY HIGH RESEARCH
All Students 2.4 3.8 5.6 NP
African American Students 0.8 3.6 5.3 NP
Asian Students 2.1 3.3 4.8 NP
Hispanic Students 2.0 3.9 5.7 NP
White Students 2.5 3.7 5.6 NP
Pell Grant Recipients (at any time) 2.4 3.9 6.0 NP
Remedial Students (at any time) 2.8 4.2 7.2 NP
Credits to Degree (Semester Credits) Includes remedial credits starting in 2013 data collection
FULL-TIME1- TO 2-YEAR CERTIFICATE
(30 CREDITS STANDARD)
2-YEAR ASSOCIATE
(60 CREDITS STANDARD)
4-YEAR BACHELOR’S (120 CREDITS STANDARD)
NON-FLAGSHIP FLAGSHIP/VERY HIGH RESEARCH
All Students 63.6 89.5 140.8 NP
African American Students NP 79.3 136.3 NP
Asian Students 39.5 82.8 131.2 NP
Hispanic Students 54.1 82.3 145.9 NP
White Students 63.2 89.8 140.8 NP
Pell Grant Recipients (at any time) 64.2 93.5 144.8 NP
Remedial Students (at any time) 70.4 91.0 149.9 NP
Graduation Rate
FULL-TIME1- TO 2-YEAR CERTIFICATE
2-YEAR ASSOCIATE
4-YEAR BACHELOR’SNON-FLAGSHIP FLAGSHIP/VERY HIGH RESEARCH
ON TIME IN 2 YEARS ON TIME IN 3 YEARS ON TIME IN 6 YEARS ON TIME IN 6 YEARS
All Students 19% 24% 10% 18% 14% 37% NP NP
African American Students DS DS DS DS DS 24% NP NP
Asian Students DS DS DS DS 19% 46% NP NP
Hispanic Students DS DS DS 9% 6% 29% NP NP
White Students 19% 24% 10% 19% 15% 38% NP NP
Pell Grant Recipients (at any time) 17% 21% 7% 17% 9% 30% NP NP
Remedial Students (at any time) 31% 33% 5% 13% 6% 21% NP NP
PART-TIME NON-FLAGSHIP FLAGSHIP/VERY HIGH RESEARCHON TIME IN 2 YEARS ON TIME IN 3 YEARS ON TIME IN 6 YEARS ON TIME IN 6 YEARS
All Students 14% 21% DS 6% 2% 12% NP NP
African American Students NP NP DS DS DS DS NP NP
Asian Students DS DS DS DS NP DS NP NP
Hispanic Students DS DS NP NP DS 16% NP NP
White Students 14% 22% DS 6% 3% 12% NP NP
Pell Grant Recipients (at any time) DS 23% DS DS DS 13% NP NP
Remedial Students (at any time) DS DS NP DS DS 12% NP NP
IDAHOEmbargoed until December 1, 2014, 8 a.m., EST

42 n Complete College America
Data for students who began college going full-time. NP = The state did not provide data for this metric. DS = Fewer than 10 students, so data were suppressed.
Many graduates earn excess credits.
And graduates take far too long to finish, costing missed opportunities and money.
1 Year Standard
2 Years Standard
4 Years Standard
4 Years Standard
YEARS 1 2 3 4 5 6
Most full-time students don’t graduate on time.
(F
LAGS
HIP/
VERY
HI
GH R
ESEA
RCH)
2-YE
AR A
SSOC
IATE
1- TO
2-Y
EAR
CERT
IFIC
ATE
(N
ON-F
LAGS
HIP)
ON TIME
ON TIME
ON TIME
ON TIME
4-YE
AR B
ACHE
LOR’
S
KNOW THIS:
The best strategy for reducing the cost of college is to ensure that more students graduate on time.
COST OF EACH ADDITIONAL YEAR
COST OF EACH ADDITIONAL YEAR
60 Credits Standard
30 Credits Standard
70.0
57.2
6%
26%
59%
10%
2.4
3.0
4.5
3.9
120 Credits Standard
130.8
120 Credits Standard
126.4
ILLINOIS
$16,047 +$35,000
$51,047
in cost of attendance
total for each student seeking associate degree
in lost wages
$26,483 +$45,327
$71,810
in cost of attendance
total for each student seeking bachelor’s degree
in lost wages
Embargoed until December 1, 2014, 8 a.m., EST

Four-Year Myth: Make College More Affordable. Restore the Promise of Graduating on Time. n 43
Notes: Cost of attendance is calculated using the state-specific cost of one additional year of tuition and fees from the College Board’s Trends in Student Pricing 2013 Report. Additional expenses include national average estimates for room and board, books and supplies, transportation, and other expenses from the College Board’s Annual Survey of Colleges for 2013–2014. Lost wages are national average salaries for new graduates and do not account for earnings while in college. The median starting salary of 2011 associate degree graduates of community colleges comes from the American Institutes for Research’s What’s the Value of an Associate’s Degree? The average starting salary of 2013 bachelor’s degree graduates comes from the National Association of Colleges and Employers 2013 Salary Survey. Credits to degree includes remedial courses. Time to degree includes time spent in remedial courses only if that was required. Students who drop out for five or more consecutive years are excluded.
Time to Degree (Years)
FULL-TIME1- TO 2-YEAR CERTIFICATE
2-YEAR ASSOCIATE
4-YEAR BACHELOR’SNON-FLAGSHIP FLAGSHIP/VERY HIGH RESEARCH
All Students 2.4 3.0 4.5 3.9
African American Students 2.3 3.0 4.8 4.0
Asian Students 2.6 3.2 4.4 4.0
Hispanic Students 2.3 3.2 4.4 4.2
White Students 2.5 3.0 4.4 3.9
Pell Grant Recipients (at any time) 2.5 3.1 4.7 NP
Remedial Students (at any time) 3.4 3.5 4.6 NP
Credits to Degree (Semester Credits) Includes remedial credits starting in 2013 data collection
FULL-TIME1- TO 2-YEAR CERTIFICATE
(30 CREDITS STANDARD)
2-YEAR ASSOCIATE
(60 CREDITS STANDARD)
4-YEAR BACHELOR’S (120 CREDITS STANDARD)
NON-FLAGSHIP FLAGSHIP/VERY HIGH RESEARCH
All Students 57.2 70.0 130.8 126.4
African American Students 53.0 70.6 130.1 130.8
Asian Students 65.1 72.9 130.5 119.8
Hispanic Students 51.8 69.3 130.7 122.2
White Students 59.1 70.2 131.4 127.2
Pell Grant Recipients (at any time) 59.1 71.5 131.4 NP
Remedial Students (at any time) 68.9 72.2 129.7 NP
Graduation Rate
FULL-TIME1- TO 2-YEAR CERTIFICATE
2-YEAR ASSOCIATE
4-YEAR BACHELOR’SNON-FLAGSHIP FLAGSHIP/VERY HIGH RESEARCH
ON TIME IN 2 YEARS ON TIME IN 3 YEARS ON TIME IN 6 YEARS ON TIME IN 6 YEARS
All Students 6% 16% 10% 20% 26% 51% 59% 72%
African American Students 7% 13% 3% 6% 7% 30% 42% 54%
Asian Students DS DS 7% 15% 14% 50% 54% 75%
Hispanic Students 6% 14% 4% 13% 9% 33% 36% 58%
White Students 7% 18% 14% 25% 32% 57% 65% 77%
Pell Grant Recipients (at any time) 8% 21% 7% 15% 14% 38% 56% 68%
Remedial Students (at any time) DS 5% 5% 14% 11% 31% 35% 55%
PART-TIME NON-FLAGSHIP FLAGSHIP/VERY HIGH RESEARCHON TIME IN 2 YEARS ON TIME IN 3 YEARS ON TIME IN 6 YEARS ON TIME IN 6 YEARS
All Students 4% 10% 2% 5% DS DS 55% 60%
African American Students 9% 14% 1% 2% DS DS 46% 53%
Asian Students DS DS DS 7% DS DS 54% 64%
Hispanic Students 4% 13% 1% 4% DS DS 59% 59%
White Students 2% 7% 2% 7% DS DS 56% 60%
Pell Grant Recipients (at any time) DS 5% 1% 4% DS DS 59% 64%
Remedial Students (at any time) DS 4% 1% 4% DS DS 55% 59%
ILLINOISEmbargoed until December 1, 2014, 8 a.m., EST

44 n Complete College America
Data for students who began college going full-time. NP = The state did not provide data for this metric. DS = Fewer than 10 students, so data were suppressed.
Many graduates earn excess credits.
And graduates take far too long to finish, costing missed opportunities and money.
1 Year Standard
2 Years Standard
4 Years Standard
4 Years Standard
YEARS 1 2 3 4 5 6
Most full-time students don’t graduate on time.
(F
LAGS
HIP/
VERY
HI
GH R
ESEA
RCH)
2-YE
AR A
SSOC
IATE
1- TO
2-Y
EAR
CERT
IFIC
ATE
(N
ON-F
LAGS
HIP)
ON TIME
ON TIME
ON TIME
ON TIME
4-YE
AR B
ACHE
LOR’
S
KNOW THIS:
The best strategy for reducing the cost of college is to ensure that more students graduate on time.
COST OF EACH ADDITIONAL YEAR
COST OF EACH ADDITIONAL YEAR
120 Credits Standard
120 Credits Standard
60 Credits Standard
30 Credits Standard
COST OF EACH ADDITIONAL YEAR
COST OF EACH ADDITIONAL YEAR
KNOW THIS:
134.0
93.0
77.0
$16,478 +$35,000
$51,478
$22,849 +$45,327
$68,176
The best strategy for reducing the cost of college is to ensure that more students graduate on time.
17%
17%
42%
6%
3.2
4.0
5.0
4.4
INDIANA
143.0
in cost of attendance
in cost of attendance
total for each student seeking associate degree
total for each student seeking bachelor’s degree
in lost wages
in lost wages
Embargoed until December 1, 2014, 8 a.m., EST

Four-Year Myth: Make College More Affordable. Restore the Promise of Graduating on Time. n 45
Notes: Cost of attendance is calculated using the state-specific cost of one additional year of tuition and fees from the College Board’s Trends in Student Pricing 2013 Report. Additional expenses include national average estimates for room and board, books and supplies, transportation, and other expenses from the College Board’s Annual Survey of Colleges for 2013–2014. Lost wages are national average salaries for new graduates and do not account for earnings while in college. The median starting salary of 2011 associate degree graduates of community colleges comes from the American Institutes for Research’s What’s the Value of an Associate’s Degree? The average starting salary of 2013 bachelor’s degree graduates comes from the National Association of Colleges and Employers 2013 Salary Survey. Credits to degree includes remedial courses. Time to degree includes time spent in remedial courses only if that was required. Students who drop out for five or more consecutive years are excluded.
Notes: Cost of attendance is calculated using the state-specific cost of one additional year of tuition and fees from the College Board’s Trends in Student Pricing 2013 Report. Additional expenses include national average estimates for room and board, books and supplies, transportation, and other expenses from the College Board’s Annual Survey of Colleges for 2013–2014. Lost wages are national average salaries for new graduates and do not account for earnings while in college. The median starting salary of 2011 associate degree graduates of community colleges comes from the American Institutes for Research’s What’s the Value of an Associate’s Degree? The average starting salary of 2013 bachelor’s degree graduates comes from the National Association of Colleges and Employers 2013 Salary Survey. Credits to degree includes remedial courses. Time to degree includes time spent in remedial courses only if that was required. Students who drop out for five or more consecutive years are excluded.
Time to Degree (Years)
FULL-TIME1- TO 2-YEAR CERTIFICATE
2-YEAR ASSOCIATE
4-YEAR BACHELOR’SNON-FLAGSHIP FLAGSHIP/VERY HIGH RESEARCH
All Students 3.2 4.0 5.0 4.4
African American Students 3.1 3.8 5.2 4.6
Asian Students NP 4.7 5.1 4.5
Hispanic Students 3.1 4.0 5.2 4.5
White Students 3.2 4.0 4.9 4.4
Pell Grant Recipients (at any time) 3.2 4.2 5.3 4.7
Remedial Students (at any time) 3.1 4.1 5.6 4.9
Credits to Degree (Semester Credits) Includes remedial credits starting in 2013 data collection
FULL-TIME1- TO 2-YEAR CERTIFICATE
(30 CREDITS STANDARD)
2-YEAR ASSOCIATE
(60 CREDITS STANDARD)
4-YEAR BACHELOR’S (120 CREDITS STANDARD)
NON-FLAGSHIP FLAGSHIP/VERY HIGH RESEARCH
All Students 77.0 93.0 143.0 134.0
African American Students 73.0 88.0 147.0 140.0
Asian Students NP 119.0 148.0 138.0
Hispanic Students 71.0 95.0 145.0 137.0
White Students 77.0 94.0 143.0 134.0
Pell Grant Recipients (at any time) 76.0 98.0 148.0 139.0
Remedial Students (at any time) 73.0 94.0 152.0 141.0
Graduation Rate
FULL-TIME1- TO 2-YEAR CERTIFICATE
2-YEAR ASSOCIATE
4-YEAR BACHELOR’SNON-FLAGSHIP FLAGSHIP/VERY HIGH RESEARCH
ON TIME IN 2 YEARS ON TIME IN 3 YEARS ON TIME IN 6 YEARS ON TIME IN 6 YEARS
All Students 17% 24% 6% 14% 17% 39% 42% 69%
African American Students DS DS 6% 9% 6% 21% 19% 46%
Asian Students DS DS DS DS 15% 38% 37% 62%
Hispanic Students DS DS 6% 10% 10% 30% 32% 65%
White Students 17% 26% 7% 15% 18% 41% 46% 73%
Pell Grant Recipients (at any time) 13% 20% 3% 10% 9% 29% 32% 59%
Remedial Students (at any time) 10% 19% 2% 9% 3% 19% 31% 55%
PART-TIME NON-FLAGSHIP FLAGSHIP/VERY HIGH RESEARCHON TIME IN 2 YEARS ON TIME IN 3 YEARS ON TIME IN 6 YEARS ON TIME IN 6 YEARS
All Students DS DS 1% 4% 1% 9% DS 46%
African American Students DS DS DS 2% DS DS DS DS
Asian Students NP NP DS DS DS DS DS DS
Hispanic Students DS DS DS 4% DS DS DS DS
White Students DS DS 2% 5% DS 10% DS DS
Pell Grant Recipients (at any time) DS DS 1% 4% DS 8% DS DS
Remedial Students (at any time) DS DS 0% 2% DS 6% DS DS
INDIANAEmbargoed until December 1, 2014, 8 a.m., EST

46 n Complete College America
Data for students who began college going full-time. NP = The state did not provide data for this metric. DS = Fewer than 10 students, so data were suppressed.
Many graduates earn excess credits.
And graduates take far too long to finish, costing missed opportunities and money.
1 Year Standard
2 Years Standard
4 Years Standard
4 Years Standard
YEARS 1 2 3 4 5 6
Most full-time students don’t graduate on time.
(F
LAGS
HIP/
VERY
HI
GH R
ESEA
RCH)
2-YE
AR A
SSOC
IATE
1- TO
2-Y
EAR
CERT
IFIC
ATE
(N
ON-F
LAGS
HIP)
ON TIME
ON TIME
ON TIME
ON TIME
4-YE
AR B
ACHE
LOR’
S
KNOW THIS:
The best strategy for reducing the cost of college is to ensure that more students graduate on time.
COST OF EACH ADDITIONAL YEAR
COST OF EACH ADDITIONAL YEAR
120 Credits Standard
120 Credits Standard
60 Credits Standard
30 Credits Standard
124.6
137.7
90.1
71.5
3.9
4.9
5.5
5.0
KENTUCKY
$16,990 +$35,000
$51,990
in cost of attendance
total for each student seeking associate degree
in lost wages
$22,625 +$45,327
$67,952
in cost of attendance
total for each student seeking bachelor’s degree
in lost wages
28%
19%
29%
3%
Embargoed until December 1, 2014, 8 a.m., EST

Four-Year Myth: Make College More Affordable. Restore the Promise of Graduating on Time. n 47
Notes: Cost of attendance is calculated using the state-specific cost of one additional year of tuition and fees from the College Board’s Trends in Student Pricing 2013 Report. Additional expenses include national average estimates for room and board, books and supplies, transportation, and other expenses from the College Board’s Annual Survey of Colleges for 2013–2014. Lost wages are national average salaries for new graduates and do not account for earnings while in college. The median starting salary of 2011 associate degree graduates of community colleges comes from the American Institutes for Research’s What’s the Value of an Associate’s Degree? The average starting salary of 2013 bachelor’s degree graduates comes from the National Association of Colleges and Employers 2013 Salary Survey. Credits to degree includes remedial courses. Time to degree includes time spent in remedial courses only if that was required. Students who drop out for five or more consecutive years are excluded.
Time to Degree (Years)
FULL-TIME1- TO 2-YEAR CERTIFICATE
2-YEAR ASSOCIATE
4-YEAR BACHELOR’SNON-FLAGSHIP FLAGSHIP/VERY HIGH RESEARCH
All Students 3.9 4.9 5.5 5.0
African American Students 4.6 5.6 5.8 5.4
Asian Students 3.6 4.2 5.1 5.1
Hispanic Students 3.9 5.1 5.4 5.2
White Students 3.9 4.9 5.5 5.0
Pell Grant Recipients (at any time) 4.0 5.1 6.1 5.7
Remedial Students (at any time) 4.5 5.4 6.2 5.6
Credits to Degree (Semester Credits) Includes remedial credits starting in 2013 data collection
FULL-TIME1- TO 2-YEAR CERTIFICATE
(30 CREDITS STANDARD)
2-YEAR ASSOCIATE
(60 CREDITS STANDARD)
4-YEAR BACHELOR’S (120 CREDITS STANDARD)
NON-FLAGSHIP FLAGSHIP/VERY HIGH RESEARCH
All Students 71.5 90.1 124.6 137.7
African American Students 70.6 90.6 132.6 139.6
Asian Students 73.3 93.9 123.8 140.7
Hispanic Students 81.9 87.9 131.6 136.4
White Students 71.4 90.2 123.8 137.5
Pell Grant Recipients (at any time) 69.1 89.9 126.7 139.2
Remedial Students (at any time) 71.8 90.0 126.7 134.9
Graduation Rate
FULL-TIME1- TO 2-YEAR CERTIFICATE
2-YEAR ASSOCIATE
4-YEAR BACHELOR’SNON-FLAGSHIP FLAGSHIP/VERY HIGH RESEARCH
ON TIME IN 2 YEARS ON TIME IN 3 YEARS ON TIME IN 6 YEARS ON TIME IN 6 YEARS
All Students 28% 34% 3% 9% 19% 45% 29% 55%
African American Students DS DS NP DS 10% 33% 16% 40%
Asian Students NP NP DS DS 24% 47% 29% 56%
Hispanic Students DS DS DS DS 18% 37% DS 46%
White Students 33% 37% 3% 11% 19% 46% 30% 57%
Pell Grant Recipients (at any time) NP NP NP NP NP NP NP NP
Remedial Students (at any time) DS DS 1% 5% 8% 32% 11% 35%
PART-TIME NON-FLAGSHIP FLAGSHIP/VERY HIGH RESEARCHON TIME IN 2 YEARS ON TIME IN 3 YEARS ON TIME IN 6 YEARS ON TIME IN 6 YEARS
All Students 29% 31% DS 3% DS 8% DS 16%
African American Students DS DS NP DS DS DS DS DS
Asian Students DS DS NP NP DS DS NP NP
Hispanic Students DS DS NP NP DS DS DS DS
White Students 34% 36% DS 3% DS DS DS DS
Pell Grant Recipients (at any time) NP NP NP NP NP NP NP NP
Remedial Students (at any time) DS DS DS DS NP DS NP DS
KENTUCKYEmbargoed until December 1, 2014, 8 a.m., EST

48 n Complete College America
Data for students who began college going full-time. NP = The state did not provide data for this metric. DS = Fewer than 10 students, so data were suppressed.
Many graduates earn excess credits.
And graduates take far too long to finish, costing missed opportunities and money.
1 Year Standard
2 Years Standard
4 Years Standard
4 Years Standard
YEARS 1 2 3 4 5 6
Most full-time students don’t graduate on time.
(F
LAGS
HIP/
VERY
HI
GH R
ESEA
RCH)
2-YE
AR A
SSOC
IATE
1- TO
2-Y
EAR
CERT
IFIC
ATE
(N
ON-F
LAGS
HIP)
ON TIME
ON TIME
ON TIME
ON TIME
4-YE
AR B
ACHE
LOR’
S
KNOW THIS:
The best strategy for reducing the cost of college is to ensure that more students graduate on time.
COST OF EACH ADDITIONAL YEAR
COST OF EACH ADDITIONAL YEAR
2.2
5.5
5.5
4.5
LOUISIANA
$15,976 +$35,000
$50,976
in cost of attendance
total for each student seeking associate degree
in lost wages
$20,479 +$45,327
$65,806
in cost of attendance
total for each student seeking bachelor’s degree
in lost wages
60 Credits Standard
NP
30 Credits Standard
NP
120 Credits Standard
NP
120 Credits Standard
NP
0%
14%
30%
2%
Embargoed until December 1, 2014, 8 a.m., EST

Four-Year Myth: Make College More Affordable. Restore the Promise of Graduating on Time. n 49
Notes: Cost of attendance is calculated using the state-specific cost of one additional year of tuition and fees from the College Board’s Trends in Student Pricing 2013 Report. Additional expenses include national average estimates for room and board, books and supplies, transportation, and other expenses from the College Board’s Annual Survey of Colleges for 2013–2014. Lost wages are national average salaries for new graduates and do not account for earnings while in college. The median starting salary of 2011 associate degree graduates of community colleges comes from the American Institutes for Research’s What’s the Value of an Associate’s Degree? The average starting salary of 2013 bachelor’s degree graduates comes from the National Association of Colleges and Employers 2013 Salary Survey. Credits to degree includes remedial courses. Time to degree includes time spent in remedial courses only if that was required. Students who drop out for five or more consecutive years are excluded.
Time to Degree (Years)
FULL-TIME1- TO 2-YEAR CERTIFICATE
2-YEAR ASSOCIATE
4-YEAR BACHELOR’SNON-FLAGSHIP FLAGSHIP/VERY HIGH RESEARCH
All Students 2.2 5.5 5.5 4.5
African American Students 2.4 6.1 5.9 4.9
Asian Students 1.8 4.9 5.3 4.4
Hispanic Students 2.6 5.7 5.5 4.5
White Students 2.2 5.3 5.4 4.5
Pell Grant Recipients (at any time) 2.5 5.3 5.9 5.1
Remedial Students (at any time) 3.2 4.6 5.6 5.0
Credits to Degree (Semester Credits) Includes remedial credits starting in 2013 data collection
FULL-TIME1- TO 2-YEAR CERTIFICATE
(30 CREDITS STANDARD)
2-YEAR ASSOCIATE
(60 CREDITS STANDARD)
4-YEAR BACHELOR’S (120 CREDITS STANDARD)
NON-FLAGSHIP FLAGSHIP/VERY HIGH RESEARCH
All Students NP NP NP NP
African American Students NP NP NP NP
Asian Students NP NP NP NP
Hispanic Students NP NP NP NP
White Students NP NP NP NP
Pell Grant Recipients (at any time) NP NP NP NP
Remedial Students (at any time) NP NP NP NP
Graduation Rate
FULL-TIME1- TO 2-YEAR CERTIFICATE
2-YEAR ASSOCIATE
4-YEAR BACHELOR’SNON-FLAGSHIP FLAGSHIP/VERY HIGH RESEARCH
ON TIME IN 2 YEARS ON TIME IN 3 YEARS ON TIME IN 6 YEARS ON TIME IN 6 YEARS
All Students 0% 4% 2% 7% 14% 39% 30% 65%
African American Students DS 2% 2% 4% 8% 29% 21% 56%
Asian Students NP DS DS DS 13% 49% 31% 67%
Hispanic Students NP DS DS DS 13% 39% 25% 57%
White Students DS 5% 3% 8% 18% 45% 31% 67%
Pell Grant Recipients (at any time) DS 4% 2% 5% NP NP NP NP
Remedial Students (at any time) NP 1% 1% 4% 4% 22% NP NP
PART-TIME NON-FLAGSHIP FLAGSHIP/VERY HIGH RESEARCHON TIME IN 2 YEARS ON TIME IN 3 YEARS ON TIME IN 6 YEARS ON TIME IN 6 YEARS
All Students DS 1% 1% 2% 1% 9% DS DS
African American Students DS DS DS 2% DS 8% NP NP
Asian Students NP NP NP NP NP NP NP NP
Hispanic Students NP DS NP NP NP NP NP NP
White Students NP DS DS 3% DS 10% DS DS
Pell Grant Recipients (at any time) DS 2% DS 3% NP NP NP NP
Remedial Students (at any time) DS DS DS 2% DS 9% NP NP
LOUISIANAEmbargoed until December 1, 2014, 8 a.m., EST

50 n Complete College America
Data for students who began college going full-time. NP = The state did not provide data for this metric. DS = Fewer than 10 students, so data were suppressed.
Many graduates earn excess credits.
And graduates take far too long to finish, costing missed opportunities and money.
1 Year Standard
2 Years Standard
4 Years Standard
4 Years Standard
YEARS 1 2 3 4 5 6
Most full-time students don’t graduate on time.
(F
LAGS
HIP/
VERY
HI
GH R
ESEA
RCH)
2-YE
AR A
SSOC
IATE
1- TO
2-Y
EAR
CERT
IFIC
ATE
(N
ON-F
LAGS
HIP)
ON TIME
ON TIME
ON TIME
ON TIME
4-YE
AR B
ACHE
LOR’
S
KNOW THIS:
The best strategy for reducing the cost of college is to ensure that more students graduate on time.
COST OF EACH ADDITIONAL YEAR
COST OF EACH ADDITIONAL YEAR
120 Credits Standard
127.3
120 Credits Standard
122.0
NP
NP
4.4
3.9
MARYLAND
$16,657
+$35,000$51,657
in cost of attendance
total for each student seeking associate degree
in lost wages
$22,408
+$45,327 $67,735
in cost of attendance
total for each student seeking bachelor’s degree
in lost wages
1%
38%
67%
4%
30 Credits Standard
60 Credits Standard
67.3
76.8
Embargoed until December 1, 2014, 8 a.m., EST
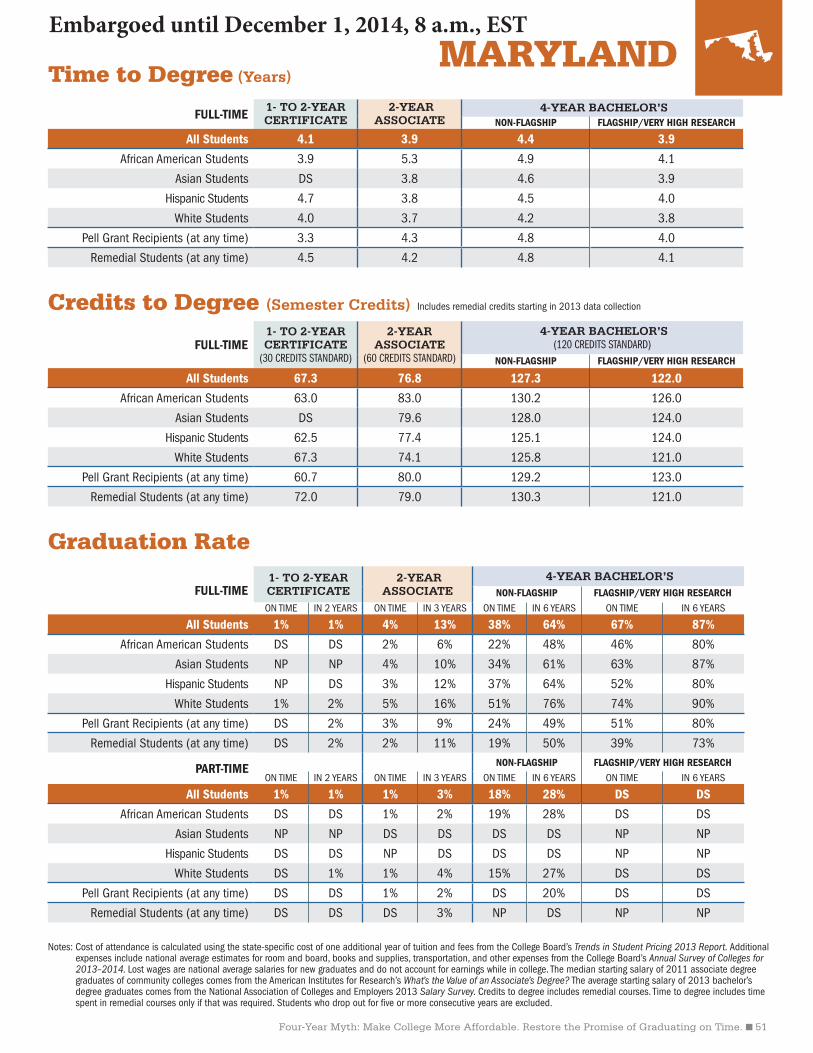
Four-Year Myth: Make College More Affordable. Restore the Promise of Graduating on Time. n 51
Notes: Cost of attendance is calculated using the state-specific cost of one additional year of tuition and fees from the College Board’s Trends in Student Pricing 2013 Report. Additional expenses include national average estimates for room and board, books and supplies, transportation, and other expenses from the College Board’s Annual Survey of Colleges for 2013–2014. Lost wages are national average salaries for new graduates and do not account for earnings while in college. The median starting salary of 2011 associate degree graduates of community colleges comes from the American Institutes for Research’s What’s the Value of an Associate’s Degree? The average starting salary of 2013 bachelor’s degree graduates comes from the National Association of Colleges and Employers 2013 Salary Survey. Credits to degree includes remedial courses. Time to degree includes time spent in remedial courses only if that was required. Students who drop out for five or more consecutive years are excluded.
Time to Degree (Years)
FULL-TIME1- TO 2-YEAR CERTIFICATE
2-YEAR ASSOCIATE
4-YEAR BACHELOR’SNON-FLAGSHIP FLAGSHIP/VERY HIGH RESEARCH
All Students 4.1 3.9 4.4 3.9
African American Students 3.9 5.3 4.9 4.1
Asian Students DS 3.8 4.6 3.9
Hispanic Students 4.7 3.8 4.5 4.0
White Students 4.0 3.7 4.2 3.8
Pell Grant Recipients (at any time) 3.3 4.3 4.8 4.0
Remedial Students (at any time) 4.5 4.2 4.8 4.1
Credits to Degree (Semester Credits) Includes remedial credits starting in 2013 data collection
FULL-TIME1- TO 2-YEAR CERTIFICATE
(30 CREDITS STANDARD)
2-YEAR ASSOCIATE
(60 CREDITS STANDARD)
4-YEAR BACHELOR’S (120 CREDITS STANDARD)
NON-FLAGSHIP FLAGSHIP/VERY HIGH RESEARCH
All Students 67.3 76.8 127.3 122.0
African American Students 63.0 83.0 130.2 126.0
Asian Students DS 79.6 128.0 124.0
Hispanic Students 62.5 77.4 125.1 124.0
White Students 67.3 74.1 125.8 121.0
Pell Grant Recipients (at any time) 60.7 80.0 129.2 123.0
Remedial Students (at any time) 72.0 79.0 130.3 121.0
Graduation Rate
FULL-TIME1- TO 2-YEAR CERTIFICATE
2-YEAR ASSOCIATE
4-YEAR BACHELOR’SNON-FLAGSHIP FLAGSHIP/VERY HIGH RESEARCH
ON TIME IN 2 YEARS ON TIME IN 3 YEARS ON TIME IN 6 YEARS ON TIME IN 6 YEARS
All Students 1% 1% 4% 13% 38% 64% 67% 87%
African American Students DS DS 2% 6% 22% 48% 46% 80%
Asian Students NP NP 4% 10% 34% 61% 63% 87%
Hispanic Students NP DS 3% 12% 37% 64% 52% 80%
White Students 1% 2% 5% 16% 51% 76% 74% 90%
Pell Grant Recipients (at any time) DS 2% 3% 9% 24% 49% 51% 80%
Remedial Students (at any time) DS 2% 2% 11% 19% 50% 39% 73%
PART-TIME NON-FLAGSHIP FLAGSHIP/VERY HIGH RESEARCHON TIME IN 2 YEARS ON TIME IN 3 YEARS ON TIME IN 6 YEARS ON TIME IN 6 YEARS
All Students 1% 1% 1% 3% 18% 28% DS DS
African American Students DS DS 1% 2% 19% 28% DS DS
Asian Students NP NP DS DS DS DS NP NP
Hispanic Students DS DS NP DS DS DS NP NP
White Students DS 1% 1% 4% 15% 27% DS DS
Pell Grant Recipients (at any time) DS DS 1% 2% DS 20% DS DS
Remedial Students (at any time) DS DS DS 3% NP DS NP NP
MARYLANDEmbargoed until December 1, 2014, 8 a.m., EST

52 n Complete College America
Data for students who began college going full-time. NP = The state did not provide data for this metric. DS = Fewer than 10 students, so data were suppressed.
Many graduates earn excess credits.
And graduates take far too long to finish, costing missed opportunities and money.
1 Year Standard
2 Years Standard
4 Years Standard
4 Years Standard
YEARS 1 2 3 4 5 6
Most full-time students don’t graduate on time.
(F
LAGS
HIP/
VERY
HI
GH R
ESEA
RCH)
2-YE
AR A
SSOC
IATE
1- TO
2-Y
EAR
CERT
IFIC
ATE
(N
ON-F
LAGS
HIP)
ON TIME
ON TIME
ON TIME
ON TIME
4-YE
AR B
ACHE
LOR’
S
KNOW THIS:
The best strategy for reducing the cost of college is to ensure that more students graduate on time.
COST OF EACH ADDITIONAL YEAR
COST OF EACH ADDITIONAL YEAR
120 Credits Standard
120 Credits Standard
30 Credits Standard
128.4
129.4
68.6
MASSACHUSETTS
$17,813
+$35,000$52,813
in cost of attendance
total for each student seeking associate degree
in lost wages
$24,725 +$45,327
$70,052
in cost of attendance
total for each student seeking bachelor’s degree
in lost wages
(F
LAGS
HIP/
VERY
HI
GH R
ESEA
RCH)
(N
ON-F
LAGS
HIP)
26%
29%
49%
4%
3.0
1.6
4.3
4.1
60 Credits Standard
72.1
Embargoed until December 1, 2014, 8 a.m., EST
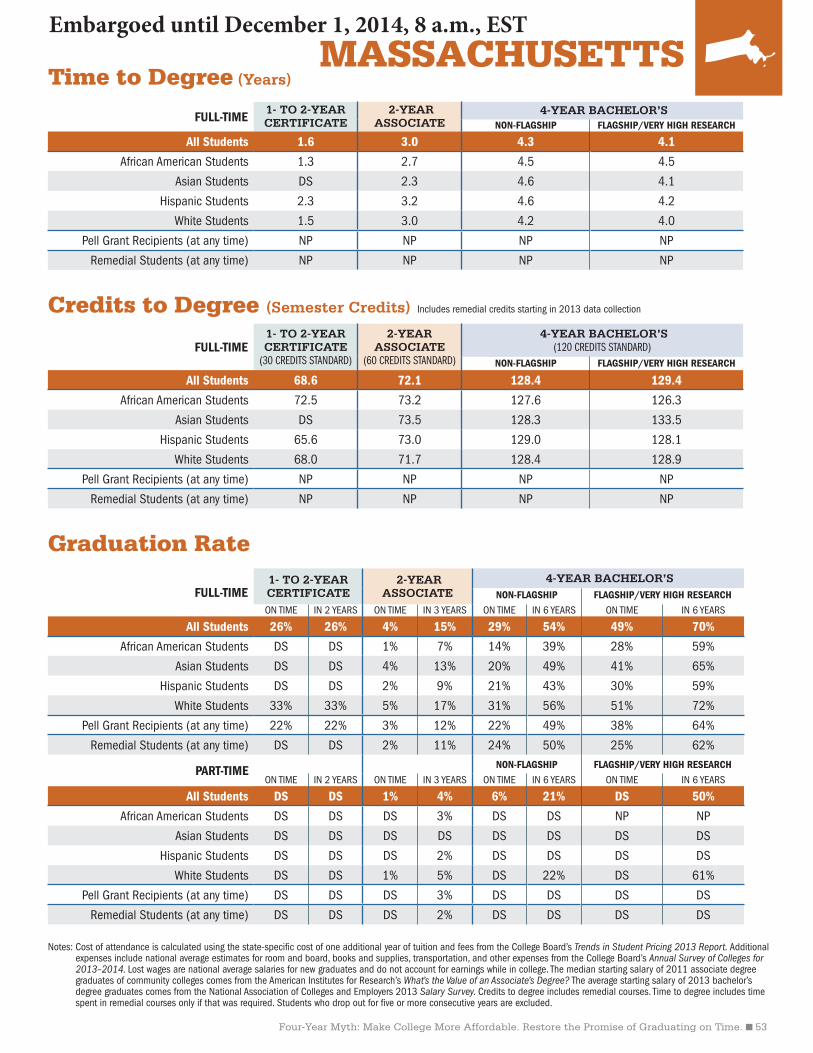
Four-Year Myth: Make College More Affordable. Restore the Promise of Graduating on Time. n 53
Notes: Cost of attendance is calculated using the state-specific cost of one additional year of tuition and fees from the College Board’s Trends in Student Pricing 2013 Report. Additional expenses include national average estimates for room and board, books and supplies, transportation, and other expenses from the College Board’s Annual Survey of Colleges for 2013–2014. Lost wages are national average salaries for new graduates and do not account for earnings while in college. The median starting salary of 2011 associate degree graduates of community colleges comes from the American Institutes for Research’s What’s the Value of an Associate’s Degree? The average starting salary of 2013 bachelor’s degree graduates comes from the National Association of Colleges and Employers 2013 Salary Survey. Credits to degree includes remedial courses. Time to degree includes time spent in remedial courses only if that was required. Students who drop out for five or more consecutive years are excluded.
Time to Degree (Years)
FULL-TIME1- TO 2-YEAR CERTIFICATE
2-YEAR ASSOCIATE
4-YEAR BACHELOR’SNON-FLAGSHIP FLAGSHIP/VERY HIGH RESEARCH
All Students 1.6 3.0 4.3 4.1
African American Students 1.3 2.7 4.5 4.5
Asian Students DS 2.3 4.6 4.1
Hispanic Students 2.3 3.2 4.6 4.2
White Students 1.5 3.0 4.2 4.0
Pell Grant Recipients (at any time) NP NP NP NP
Remedial Students (at any time) NP NP NP NP
Credits to Degree (Semester Credits) Includes remedial credits starting in 2013 data collection
FULL-TIME1- TO 2-YEAR CERTIFICATE
(30 CREDITS STANDARD)
2-YEAR ASSOCIATE
(60 CREDITS STANDARD)
4-YEAR BACHELOR’S (120 CREDITS STANDARD)
NON-FLAGSHIP FLAGSHIP/VERY HIGH RESEARCH
All Students 68.6 72.1 128.4 129.4
African American Students 72.5 73.2 127.6 126.3
Asian Students DS 73.5 128.3 133.5
Hispanic Students 65.6 73.0 129.0 128.1
White Students 68.0 71.7 128.4 128.9
Pell Grant Recipients (at any time) NP NP NP NP
Remedial Students (at any time) NP NP NP NP
Graduation Rate
FULL-TIME1- TO 2-YEAR CERTIFICATE
2-YEAR ASSOCIATE
4-YEAR BACHELOR’SNON-FLAGSHIP FLAGSHIP/VERY HIGH RESEARCH
ON TIME IN 2 YEARS ON TIME IN 3 YEARS ON TIME IN 6 YEARS ON TIME IN 6 YEARS
All Students 26% 26% 4% 15% 29% 54% 49% 70%
African American Students DS DS 1% 7% 14% 39% 28% 59%
Asian Students DS DS 4% 13% 20% 49% 41% 65%
Hispanic Students DS DS 2% 9% 21% 43% 30% 59%
White Students 33% 33% 5% 17% 31% 56% 51% 72%
Pell Grant Recipients (at any time) 22% 22% 3% 12% 22% 49% 38% 64%
Remedial Students (at any time) DS DS 2% 11% 24% 50% 25% 62%
PART-TIME NON-FLAGSHIP FLAGSHIP/VERY HIGH RESEARCHON TIME IN 2 YEARS ON TIME IN 3 YEARS ON TIME IN 6 YEARS ON TIME IN 6 YEARS
All Students DS DS 1% 4% 6% 21% DS 50%
African American Students DS DS DS 3% DS DS NP NP
Asian Students DS DS DS DS DS DS DS DS
Hispanic Students DS DS DS 2% DS DS DS DS
White Students DS DS 1% 5% DS 22% DS 61%
Pell Grant Recipients (at any time) DS DS DS 3% DS DS DS DS
Remedial Students (at any time) DS DS DS 2% DS DS DS DS
MASSACHUSETTSEmbargoed until December 1, 2014, 8 a.m., EST

54 n Complete College America
Data for students who began college going full-time. NP = The state did not provide data for this metric. DS = Fewer than 10 students, so data were suppressed.
Many graduates earn excess credits.
And graduates take far too long to finish, costing missed opportunities and money.
1 Year Standard
2 Years Standard
4 Years Standard
4 Years Standard
YEARS 1 2 3 4 5 6
Most full-time students don’t graduate on time.
(F
LAGS
HIP/
VERY
HI
GH R
ESEA
RCH)
2-YE
AR A
SSOC
IATE
1- TO
2-Y
EAR
CERT
IFIC
ATE
(N
ON-F
LAGS
HIP)
ON TIME
ON TIME
ON TIME
ON TIME
4-YE
AR B
ACHE
LOR’
S
KNOW THIS:
The best strategy for reducing the cost of college is to ensure that more students graduate on time.
COST OF EACH ADDITIONAL YEAR
COST OF EACH ADDITIONAL YEAR
120 Credits Standard
120 Credits Standard
60 Credits Standard
30 Credits Standard
136.0
131.1
71.7
53.91.8
2.6
4.9
4.8
MISSISSIPPI
$15,055 +$35,000
$50,055
in cost of attendance
total for each student seeking associate degree
in lost wages
$20,491
+$45,327 $65,818
in cost of attendance
total for each student seeking bachelor’s degree
in lost wages
(F
LAGS
HIP/
VERY
HI
GH R
ESEA
RCH)
(N
ON-F
LAGS
HIP)
48%
17%
23%
14%
Embargoed until December 1, 2014, 8 a.m., EST

Four-Year Myth: Make College More Affordable. Restore the Promise of Graduating on Time. n 55
Notes: Cost of attendance is calculated using the state-specific cost of one additional year of tuition and fees from the College Board’s Trends in Student Pricing 2013 Report. Additional expenses include national average estimates for room and board, books and supplies, transportation, and other expenses from the College Board’s Annual Survey of Colleges for 2013–2014. Lost wages are national average salaries for new graduates and do not account for earnings while in college. The median starting salary of 2011 associate degree graduates of community colleges comes from the American Institutes for Research’s What’s the Value of an Associate’s Degree? The average starting salary of 2013 bachelor’s degree graduates comes from the National Association of Colleges and Employers 2013 Salary Survey. Credits to degree includes remedial courses. Time to degree includes time spent in remedial courses only if that was required. Students who drop out for five or more consecutive years are excluded.
Time to Degree (Years)
FULL-TIME1- TO 2-YEAR CERTIFICATE
2-YEAR ASSOCIATE
4-YEAR BACHELOR’SNON-FLAGSHIP FLAGSHIP/VERY HIGH RESEARCH
All Students 1.8 2.6 4.9 4.8
African American Students 1.7 2.6 5.1 5.2
Asian Students NP 2.5 5.0 4.7
Hispanic Students NP 2.5 4.0 4.4
White Students 1.8 2.6 4.6 4.7
Pell Grant Recipients (at any time) 1.8 2.6 5.2 5.3
Remedial Students (at any time) 2.2 2.7 4.9 5.1
Credits to Degree (Semester Credits) Includes remedial credits starting in 2013 data collection
FULL-TIME1- TO 2-YEAR CERTIFICATE
(30 CREDITS STANDARD)
2-YEAR ASSOCIATE
(60 CREDITS STANDARD)
4-YEAR BACHELOR’S (120 CREDITS STANDARD)
NON-FLAGSHIP FLAGSHIP/VERY HIGH RESEARCH
All Students 53.9 71.7 136.0 131.1
African American Students 53.1 70.8 136.8 132.5
Asian Students NP 71.6 137.7 132.9
Hispanic Students NP 67.8 131.0 128.9
White Students 55.0 72.2 134.6 130.8
Pell Grant Recipients (at any time) 55.1 72.4 136.1 130.9
Remedial Students (at any time) 62.2 75.6 136.4 133.3
Graduation Rate
FULL-TIME1- TO 2-YEAR CERTIFICATE
2-YEAR ASSOCIATE
4-YEAR BACHELOR’SNON-FLAGSHIP FLAGSHIP/VERY HIGH RESEARCH
ON TIME IN 2 YEARS ON TIME IN 3 YEARS ON TIME IN 6 YEARS ON TIME IN 6 YEARS
All Students 48% 51% 14% 23% 17% 31% 23% 51%
African American Students 43% 46% 11% 19% 14% 28% 13% 35%
Asian Students DS DS 27% 36% DS DS 25% 61%
Hispanic Students DS DS DS 19% DS DS DS 46%
White Students 55% 58% 16% 25% 23% 38% 28% 59%
Pell Grant Recipients (at any time) 46% 48% 13% 21% 12% 27% 14% 38%
Remedial Students (at any time) 36% 41% 7% 16% 11% 25% 8% 33%
PART-TIME NON-FLAGSHIP FLAGSHIP/VERY HIGH RESEARCHON TIME IN 2 YEARS ON TIME IN 3 YEARS ON TIME IN 6 YEARS ON TIME IN 6 YEARS
All Students 14% 16% 4% 8% NP DS DS 17%
African American Students 13% 16% 3% 5% NP DS NP DS
Asian Students DS DS DS DS NP NP DS DS
Hispanic Students DS DS DS DS NP NP DS DS
White Students 15% 16% 4% 9% NP NP DS DS
Pell Grant Recipients (at any time) DS DS 5% 9% NP DS NP DS
Remedial Students (at any time) DS DS 2% 5% DS DS NP DS
MISSISSIPPIEmbargoed until December 1, 2014, 8 a.m., EST

56 n Complete College America
Data for students who began college going full-time. NP = The state did not provide data for this metric. DS = Fewer than 10 students, so data were suppressed.
Many graduates earn excess credits.
And graduates take far too long to finish, costing missed opportunities and money.
1 Year Standard
2 Years Standard
4 Years Standard
4 Years Standard
YEARS 1 2 3 4 5 6
Most full-time students don’t graduate on time.
(F
LAGS
HIP/
VERY
HI
GH R
ESEA
RCH)
2-YE
AR A
SSOC
IATE
1- TO
2-Y
EAR
CERT
IFIC
ATE
(N
ON-F
LAGS
HIP)
ON TIME
ON TIME
ON TIME
ON TIME
4-YE
AR B
ACHE
LOR’
S
KNOW THIS:
The best strategy for reducing the cost of college is to ensure that more students graduate on time.
COST OF EACH ADDITIONAL YEAR
COST OF EACH ADDITIONAL YEAR
120 Credits Standard
120 Credits Standard
60 Credits Standard
30 Credits Standard
125.6
136.5
76.6
59.7
2.7
3.4
4.5
4.3
MISSOURI
$15,652 +$35,000
$50,652
in cost of attendance
total for each student seeking associate degree
in lost wages
$22,026 +$45,327
$67,353
in cost of attendance
total for each student seeking bachelor’s degree
in lost wages
(F
LAGS
HIP/
VERY
HI
GH R
ESEA
RCH)
(N
ON-F
LAGS
HIP)
25%
23%
35%
9%
Embargoed until December 1, 2014, 8 a.m., EST

Four-Year Myth: Make College More Affordable. Restore the Promise of Graduating on Time. n 57
Notes: Cost of attendance is calculated using the state-specific cost of one additional year of tuition and fees from the College Board’s Trends in Student Pricing 2013 Report. Additional expenses include national average estimates for room and board, books and supplies, transportation, and other expenses from the College Board’s Annual Survey of Colleges for 2013–2014. Lost wages are national average salaries for new graduates and do not account for earnings while in college. The median starting salary of 2011 associate degree graduates of community colleges comes from the American Institutes for Research’s What’s the Value of an Associate’s Degree? The average starting salary of 2013 bachelor’s degree graduates comes from the National Association of Colleges and Employers 2013 Salary Survey. Credits to degree includes remedial courses. Time to degree includes time spent in remedial courses only if that was required. Students who drop out for five or more consecutive years are excluded.
Time to Degree (Years)
FULL-TIME1- TO 2-YEAR CERTIFICATE
2-YEAR ASSOCIATE
4-YEAR BACHELOR’SNON-FLAGSHIP FLAGSHIP/VERY HIGH RESEARCH
All Students 2.7 3.4 4.5 4.3
African American Students 3.5 5.1 5.1 4.8
Asian Students 6.0 3.1 4.4 4.6
Hispanic Students 2.6 3.3 4.6 4.3
White Students 2.6 3.4 4.5 4.2
Pell Grant Recipients (at any time) NP NP NP NP
Remedial Students (at any time) NP NP NP NP
Credits to Degree (Semester Credits) Includes remedial credits starting in 2013 data collection
FULL-TIME1- TO 2-YEAR CERTIFICATE
(30 CREDITS STANDARD)
2-YEAR ASSOCIATE
(60 CREDITS STANDARD)
4-YEAR BACHELOR’S (120 CREDITS STANDARD)
NON-FLAGSHIP FLAGSHIP/VERY HIGH RESEARCH
All Students 59.7 76.6 125.6 136.5
African American Students 60.2 86.1 129.0 133.1
Asian Students 40.5 74.2 128.6 140.7
Hispanic Students 53.3 71.3 129.3 138.0
White Students 59.6 76.1 125.6 136.6
Pell Grant Recipients (at any time) NP NP NP NP
Remedial Students (at any time) NP NP NP NP
Graduation Rate
FULL-TIME1- TO 2-YEAR CERTIFICATE
2-YEAR ASSOCIATE
4-YEAR BACHELOR’SNON-FLAGSHIP FLAGSHIP/VERY HIGH RESEARCH
ON TIME IN 2 YEARS ON TIME IN 3 YEARS ON TIME IN 6 YEARS ON TIME IN 6 YEARS
All Students 25% 29% 9% 17% 23% 42% 35% 60%
African American Students DS DS 3% 6% 6% 19% 21% 44%
Asian Students DS DS 8% 17% 24% 46% 26% 45%
Hispanic Students DS DS 5% 14% 22% 38% 22% 49%
White Students 27% 31% 11% 21% 25% 46% 39% 64%
Pell Grant Recipients (at any time) 60% 62% 6% 11% 20% 35% 19% 41%
Remedial Students (at any time) DS DS 5% 12% 6% 21% DS DS
PART-TIME NON-FLAGSHIP FLAGSHIP/VERY HIGH RESEARCHON TIME IN 2 YEARS ON TIME IN 3 YEARS ON TIME IN 6 YEARS ON TIME IN 6 YEARS
All Students DS DS 1% 3% DS 8% DS 15%
African American Students DS DS DS DS DS DS DS DS
Asian Students DS DS DS DS DS DS DS DS
Hispanic Students DS DS DS DS DS DS DS DS
White Students DS DS 2% 5% DS 10% DS 19%
Pell Grant Recipients (at any time) DS DS DS 4% DS DS DS DS
Remedial Students (at any time) DS DS DS 2% DS 5% DS DS
MISSOURIEmbargoed until December 1, 2014, 8 a.m., EST

58 n Complete College America
Data for students who began college going full-time. NP = The state did not provide data for this metric. DS = Fewer than 10 students, so data were suppressed.
Many graduates earn excess credits.
And graduates take far too long to finish, costing missed opportunities and money.
1 Year Standard
2 Years Standard
4 Years Standard
4 Years Standard
YEARS 1 2 3 4 5 6
Most full-time students don’t graduate on time.
(F
LAGS
HIP/
VERY
HI
GH R
ESEA
RCH)
2-YE
AR A
SSOC
IATE
1- TO
2-Y
EAR
CERT
IFIC
ATE
(N
ON-F
LAGS
HIP)
ON TIME
ON TIME
ON TIME
ON TIME
4-YE
AR B
ACHE
LOR’
S
KNOW THIS:
The best strategy for reducing the cost of college is to ensure that more students graduate on time.
COST OF EACH ADDITIONAL YEAR
COST OF EACH ADDITIONAL YEAR
120 Credits Standard
120 Credits Standard
60 Credits Standard
30 Credits Standard
NEVADA
NP
NP
NP
NP
NP
NP
NP
NP
$15,369 +$35,000
$50,369
in cost of attendance
total for each student seeking associate degree
in lost wages
$20,320 +$45,327
$65,647
in cost of attendance
total for each student seeking bachelor’s degree
in lost wages
NP
14%
16%
2%
Embargoed until December 1, 2014, 8 a.m., EST

Four-Year Myth: Make College More Affordable. Restore the Promise of Graduating on Time. n 59
Notes: Cost of attendance is calculated using the state-specific cost of one additional year of tuition and fees from the College Board’s Trends in Student Pricing 2013 Report. Additional expenses include national average estimates for room and board, books and supplies, transportation, and other expenses from the College Board’s Annual Survey of Colleges for 2013–2014. Lost wages are national average salaries for new graduates and do not account for earnings while in college. The median starting salary of 2011 associate degree graduates of community colleges comes from the American Institutes for Research’s What’s the Value of an Associate’s Degree? The average starting salary of 2013 bachelor’s degree graduates comes from the National Association of Colleges and Employers 2013 Salary Survey. Credits to degree includes remedial courses. Time to degree includes time spent in remedial courses only if that was required. Students who drop out for five or more consecutive years are excluded.
Time to Degree (Years)
FULL-TIME1- TO 2-YEAR CERTIFICATE
2-YEAR ASSOCIATE
4-YEAR BACHELOR’SNON-FLAGSHIP FLAGSHIP/VERY HIGH RESEARCH
All Students NP NP NP NP
African American Students NP NP NP NP
Asian Students NP NP NP NP
Hispanic Students NP NP NP NP
White Students NP NP NP NP
Pell Grant Recipients (at any time) NP NP NP NP
Remedial Students (at any time) NP NP NP NP
Credits to Degree (Semester Credits) Includes remedial credits starting in 2013 data collection
FULL-TIME1- TO 2-YEAR CERTIFICATE
(30 CREDITS STANDARD)
2-YEAR ASSOCIATE
(60 CREDITS STANDARD)
4-YEAR BACHELOR’S (120 CREDITS STANDARD)
NON-FLAGSHIP FLAGSHIP/VERY HIGH RESEARCH
All Students NP NP NP NP
African American Students NP NP NP NP
Asian Students NP NP NP NP
Hispanic Students NP NP NP NP
White Students NP NP NP NP
Pell Grant Recipients (at any time) NP NP NP NP
Remedial Students (at any time) NP NP NP NP
Graduation Rate
FULL-TIME1- TO 2-YEAR CERTIFICATE
2-YEAR ASSOCIATE
4-YEAR BACHELOR’SNON-FLAGSHIP FLAGSHIP/VERY HIGH RESEARCH
ON TIME IN 2 YEARS ON TIME IN 3 YEARS ON TIME IN 6 YEARS ON TIME IN 6 YEARS
All Students NP NP 2% 9% 14% 39% 16% 53%
African American Students NP NP DS DS 11% 32% 17% 52%
Asian Students NP NP DS 9% 14% 40% 19% 58%
Hispanic Students NP NP DS 9% 10% 37% 10% 50%
White Students NP NP 2% 10% 13% 40% 17% 53%
Pell Grant Recipients (at any time) NP NP NP NP 12% 35% 15% 46%
Remedial Students (at any time) NP NP 1% 8% 9% 33% 4% 24%
PART-TIME NON-FLAGSHIP FLAGSHIP/VERY HIGH RESEARCHON TIME IN 2 YEARS ON TIME IN 3 YEARS ON TIME IN 6 YEARS ON TIME IN 6 YEARS
All Students NP NP 0% 1% DS 12% DS 24%
African American Students NP NP DS DS NP DS DS DS
Asian Students NP NP DS DS DS DS DS DS
Hispanic Students NP NP DS 1% NP DS DS DS
White Students NP NP DS 2% DS DS DS DS
Pell Grant Recipients (at any time) NP NP NP NP DS DS DS DS
Remedial Students (at any time) NP NP DS 3% DS DS NP DS
NEVADAEmbargoed until December 1, 2014, 8 a.m., EST

60 n Complete College America
Data for students who began college going full-time. NP = The state did not provide data for this metric. DS = Fewer than 10 students, so data were suppressed.
Many graduates earn excess credits.
And graduates take far too long to finish, costing missed opportunities and money.
1 Year Standard
2 Years Standard
4 Years Standard
4 Years Standard
YEARS 1 2 3 4 5 6
Most full-time students don’t graduate on time.
(F
LAGS
HIP/
VERY
HI
GH R
ESEA
RCH)
2-YE
AR A
SSOC
IATE
1- TO
2-Y
EAR
CERT
IFIC
ATE
(N
ON-F
LAGS
HIP)
ON TIME
ON TIME
ON TIME
ON TIME
4-YE
AR B
ACHE
LOR’
S
KNOW THIS:
The best strategy for reducing the cost of college is to ensure that more students graduate on time.
COST OF EACH ADDITIONAL YEAR
COST OF EACH ADDITIONAL YEAR
120 Credits Standard
120 Credits Standard
60 Credits Standard
30 Credits Standard
155.0
99.2
63.5
NEW MEXICO
NP
NP
NP
NP
146.0
$14,365 +$35,000
$49,365
in cost of attendance
total for each student seeking associate degree
in lost wages
$19,920 +$45,327
$65,247
in cost of attendance
total for each student seeking bachelor’s degree
in lost wages
(F
LAGS
HIP/
VERY
HI
GH R
ESEA
RCH)
(N
ON-F
LAGS
HIP)
NP
19%
41%
NP
Embargoed until December 1, 2014, 8 a.m., EST
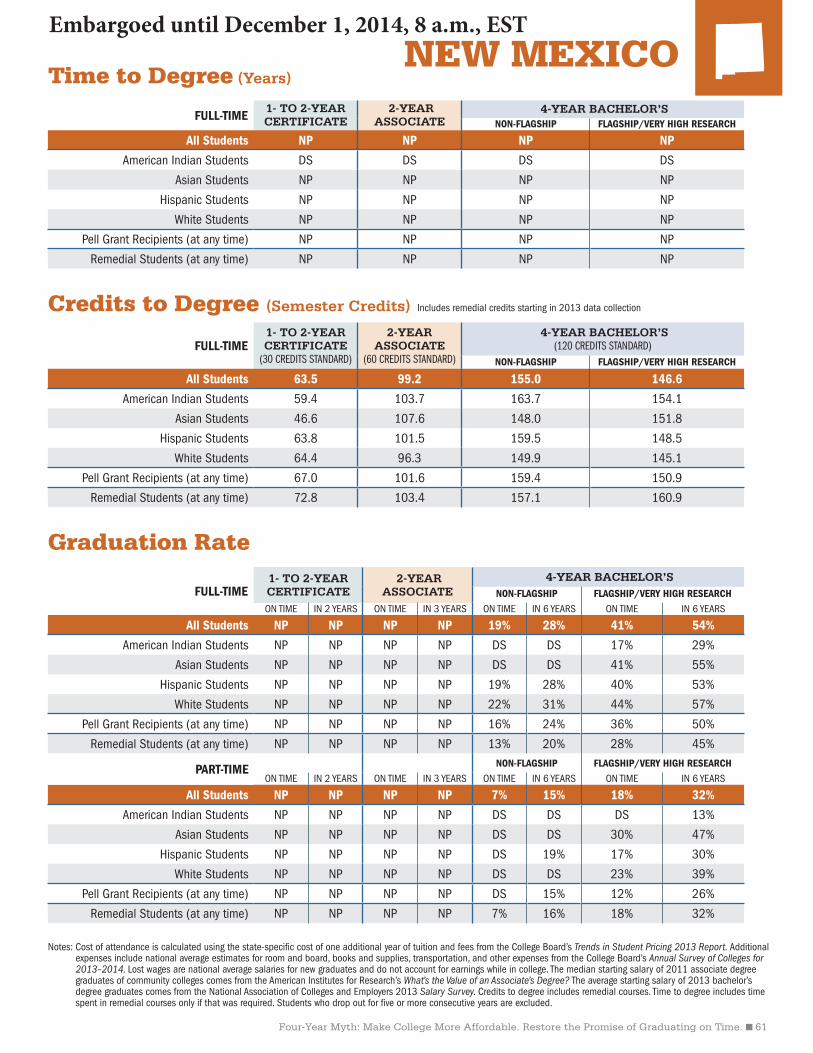
Four-Year Myth: Make College More Affordable. Restore the Promise of Graduating on Time. n 61
Notes: Cost of attendance is calculated using the state-specific cost of one additional year of tuition and fees from the College Board’s Trends in Student Pricing 2013 Report. Additional expenses include national average estimates for room and board, books and supplies, transportation, and other expenses from the College Board’s Annual Survey of Colleges for 2013–2014. Lost wages are national average salaries for new graduates and do not account for earnings while in college. The median starting salary of 2011 associate degree graduates of community colleges comes from the American Institutes for Research’s What’s the Value of an Associate’s Degree? The average starting salary of 2013 bachelor’s degree graduates comes from the National Association of Colleges and Employers 2013 Salary Survey. Credits to degree includes remedial courses. Time to degree includes time spent in remedial courses only if that was required. Students who drop out for five or more consecutive years are excluded.
Time to Degree (Years)
FULL-TIME1- TO 2-YEAR CERTIFICATE
2-YEAR ASSOCIATE
4-YEAR BACHELOR’SNON-FLAGSHIP FLAGSHIP/VERY HIGH RESEARCH
All Students NP NP NP NP
American Indian Students DS DS DS DS
Asian Students NP NP NP NP
Hispanic Students NP NP NP NP
White Students NP NP NP NP
Pell Grant Recipients (at any time) NP NP NP NP
Remedial Students (at any time) NP NP NP NP
Credits to Degree (Semester Credits) Includes remedial credits starting in 2013 data collection
FULL-TIME1- TO 2-YEAR CERTIFICATE
(30 CREDITS STANDARD)
2-YEAR ASSOCIATE
(60 CREDITS STANDARD)
4-YEAR BACHELOR’S (120 CREDITS STANDARD)
NON-FLAGSHIP FLAGSHIP/VERY HIGH RESEARCH
All Students 63.5 99.2 155.0 146.6
American Indian Students 59.4 103.7 163.7 154.1
Asian Students 46.6 107.6 148.0 151.8
Hispanic Students 63.8 101.5 159.5 148.5
White Students 64.4 96.3 149.9 145.1
Pell Grant Recipients (at any time) 67.0 101.6 159.4 150.9
Remedial Students (at any time) 72.8 103.4 157.1 160.9
Graduation Rate
FULL-TIME1- TO 2-YEAR CERTIFICATE
2-YEAR ASSOCIATE
4-YEAR BACHELOR’SNON-FLAGSHIP FLAGSHIP/VERY HIGH RESEARCH
ON TIME IN 2 YEARS ON TIME IN 3 YEARS ON TIME IN 6 YEARS ON TIME IN 6 YEARS
All Students NP NP NP NP 19% 28% 41% 54%
American Indian Students NP NP NP NP DS DS 17% 29%
Asian Students NP NP NP NP DS DS 41% 55%
Hispanic Students NP NP NP NP 19% 28% 40% 53%
White Students NP NP NP NP 22% 31% 44% 57%
Pell Grant Recipients (at any time) NP NP NP NP 16% 24% 36% 50%
Remedial Students (at any time) NP NP NP NP 13% 20% 28% 45%
PART-TIME NON-FLAGSHIP FLAGSHIP/VERY HIGH RESEARCHON TIME IN 2 YEARS ON TIME IN 3 YEARS ON TIME IN 6 YEARS ON TIME IN 6 YEARS
All Students NP NP NP NP 7% 15% 18% 32%
American Indian Students NP NP NP NP DS DS DS 13%
Asian Students NP NP NP NP DS DS 30% 47%
Hispanic Students NP NP NP NP DS 19% 17% 30%
White Students NP NP NP NP DS DS 23% 39%
Pell Grant Recipients (at any time) NP NP NP NP DS 15% 12% 26%
Remedial Students (at any time) NP NP NP NP 7% 16% 18% 32%
NEW MEXICOEmbargoed until December 1, 2014, 8 a.m., EST

62 n Complete College America
Data for students who began college going full-time. NP = The state did not provide data for this metric. DS = Fewer than 10 students, so data were suppressed.
Many graduates earn excess credits.
And graduates take far too long to finish, costing missed opportunities and money.
1 Year Standard
2 Years Standard
4 Years Standard
4 Years Standard
YEARS 1 2 3 4 5 6
Most full-time students don’t graduate on time.
(F
LAGS
HIP/
VERY
HI
GH R
ESEA
RCH)
2-YE
AR A
SSOC
IATE
1- TO
2-Y
EAR
CERT
IFIC
ATE
(N
ON-F
LAGS
HIP)
ON TIME
ON TIME
ON TIME
ON TIME
4-YE
AR B
ACHE
LOR’
S
KNOW THIS:
The best strategy for reducing the cost of college is to ensure that more students graduate on time.
COST OF EACH ADDITIONAL YEAR
COST OF EACH ADDITIONAL YEAR
120 Credits Standard
120 Credits Standard
60 Credits Standard
30 Credits Standard
134.0
135.0
86.0
75.0
3.9
4.1
4.5
4.4
OHIO
$17,031 +$35,000
$52,031
in cost of attendance
total for each student seeking associate degree
in lost wages
$23,839 +$45,327
$69,166
in cost of attendance
total for each student seeking bachelor’s degree
in lost wages
7%
29%
38%
3%
Embargoed until December 1, 2014, 8 a.m., EST

Four-Year Myth: Make College More Affordable. Restore the Promise of Graduating on Time. n 63
Notes: Cost of attendance is calculated using the state-specific cost of one additional year of tuition and fees from the College Board’s Trends in Student Pricing 2013 Report. Additional expenses include national average estimates for room and board, books and supplies, transportation, and other expenses from the College Board’s Annual Survey of Colleges for 2013–2014. Lost wages are national average salaries for new graduates and do not account for earnings while in college. The median starting salary of 2011 associate degree graduates of community colleges comes from the American Institutes for Research’s What’s the Value of an Associate’s Degree? The average starting salary of 2013 bachelor’s degree graduates comes from the National Association of Colleges and Employers 2013 Salary Survey. Credits to degree includes remedial courses. Time to degree includes time spent in remedial courses only if that was required. Students who drop out for five or more consecutive years are excluded.
Time to Degree (Years)
FULL-TIME1- TO 2-YEAR CERTIFICATE
2-YEAR ASSOCIATE
4-YEAR BACHELOR’SNON-FLAGSHIP FLAGSHIP/VERY HIGH RESEARCH
All Students 3.9 4.1 4.5 4.4
African American Students 4.4 5.0 5.0 4.7
Asian Students 3.6 3.9 4.2 4.4
Hispanic Students 3.5 4.5 4.4 4.3
White Students 3.9 4.1 4.5 4.4
Pell Grant Recipients (at any time) 4.2 4.5 5.1 4.9
Remedial Students (at any time) 4.3 4.5 5.2 5.3
Credits to Degree (Semester Credits) Includes remedial credits starting in 2013 data collection
FULL-TIME1- TO 2-YEAR CERTIFICATE
(30 CREDITS STANDARD)
2-YEAR ASSOCIATE
(60 CREDITS STANDARD)
4-YEAR BACHELOR’S (120 CREDITS STANDARD)
NON-FLAGSHIP FLAGSHIP/VERY HIGH RESEARCH
All Students 75.0 86.0 134.0 135.0
African American Students 75.0 89.0 134.0 138.0
Asian Students 83.0 85.0 132.0 139.0
Hispanic Students 63.0 83.0 133.0 136.0
White Students 76.0 86.0 134.0 134.0
Pell Grant Recipients (at any time) 73.0 88.0 136.0 137.0
Remedial Students (at any time) 73.0 88.0 136.0 137.0
Graduation Rate
FULL-TIME1- TO 2-YEAR CERTIFICATE
2-YEAR ASSOCIATE
4-YEAR BACHELOR’SNON-FLAGSHIP FLAGSHIP/VERY HIGH RESEARCH
ON TIME IN 2 YEARS ON TIME IN 3 YEARS ON TIME IN 6 YEARS ON TIME IN 6 YEARS
All Students 7% 12% 3% 10% 29% 57% 38% 74%
African American Students DS 6% 1% 3% 9% 28% 26% 58%
Asian Students DS DS DS 8% 34% 63% 45% 79%
Hispanic Students DS DS DS 5% 21% 48% 40% 76%
White Students 8% 14% 3% 11% 32% 61% 39% 76%
Pell Grant Recipients (at any time) 2% 6% 2% 8% 14% 37% 30% 63%
Remedial Students (at any time) 3% 7% 2% 7% 9% 34% 23% 53%
PART-TIME NON-FLAGSHIP FLAGSHIP/VERY HIGH RESEARCHON TIME IN 2 YEARS ON TIME IN 3 YEARS ON TIME IN 6 YEARS ON TIME IN 6 YEARS
All Students 4% 7% 0% 3% 3% 11% DS 23%
African American Students DS DS DS DS DS 7% NP DS
Asian Students DS DS NP DS DS DS DS DS
Hispanic Students DS DS NP DS NP DS DS DS
White Students 5% 7% 0% 3% 3% 11% DS 28%
Pell Grant Recipients (at any time) DS 5% DS 2% DS 6% NP DS
Remedial Students (at any time) DS 4% DS 2% DS 5% NP DS
OHIOEmbargoed until December 1, 2014, 8 a.m., EST

64 n Complete College America
Data for students who began college going full-time. NP = The state did not provide data for this metric. DS = Fewer than 10 students, so data were suppressed.
Many graduates earn excess credits.
And graduates take far too long to finish, costing missed opportunities and money.
1 Year Standard
2 Years Standard
4 Years Standard
4 Years Standard
YEARS 1 2 3 4 5 6
Most full-time students don’t graduate on time.
(F
LAGS
HIP/
VERY
HI
GH R
ESEA
RCH)
2-YE
AR A
SSOC
IATE
1- TO
2-Y
EAR
CERT
IFIC
ATE
(N
ON-F
LAGS
HIP)
ON TIME
ON TIME
ON TIME
ON TIME
4-YE
AR B
ACHE
LOR’
S
KNOW THIS:
The best strategy for reducing the cost of college is to ensure that more students graduate on time.
COST OF EACH ADDITIONAL YEAR
COST OF EACH ADDITIONAL YEAR
120 Credits Standard
60 Credits Standard
30 Credits Standard
139.0
86.0
50.02.3
3.4
5.0
4.7
OKLAHOMA
$15,959 +$35,000
$50,959
in cost of attendance
total for each student seeking associate degree
in lost wages
$20,516 +$45,327
$65,843
in cost of attendance
total for each student seeking bachelor’s degree
in lost wages
DS
11%
32%
7%
120 Credits Standard
Data Incomplete
Embargoed until December 1, 2014, 8 a.m., EST

Four-Year Myth: Make College More Affordable. Restore the Promise of Graduating on Time. n 65
Notes: Cost of attendance is calculated using the state-specific cost of one additional year of tuition and fees from the College Board’s Trends in Student Pricing 2013 Report. Additional expenses include national average estimates for room and board, books and supplies, transportation, and other expenses from the College Board’s Annual Survey of Colleges for 2013–2014. Lost wages are national average salaries for new graduates and do not account for earnings while in college. The median starting salary of 2011 associate degree graduates of community colleges comes from the American Institutes for Research’s What’s the Value of an Associate’s Degree? The average starting salary of 2013 bachelor’s degree graduates comes from the National Association of Colleges and Employers 2013 Salary Survey. Credits to degree includes remedial courses. Time to degree includes time spent in remedial courses only if that was required. Students who drop out for five or more consecutive years are excluded.
Time to Degree (Years)
FULL-TIME1- TO 2-YEAR CERTIFICATE
2-YEAR ASSOCIATE
4-YEAR BACHELOR’SNON-FLAGSHIP FLAGSHIP/VERY HIGH RESEARCH
All Students 2.3 3.4 5.0 4.7
African American Students NP 3.6 5.2 5.0
Asian Students NP 3.6 5.1 4.9
Hispanic Students NP 3.4 5.0 4.8
White Students 0.8 3.4 5.0 4.6
Pell Grant Recipients (at any time) 6.0 3.6 5.3 5.0
Remedial Students (at any time) 6.0 3.7 5.4 5.3
Credits to Degree (Semester Credits) Includes remedial credits starting in 2013 data collection
FULL-TIME1- TO 2-YEAR CERTIFICATE
(30 CREDITS STANDARD)
2-YEAR ASSOCIATE
(60 CREDITS STANDARD)
4-YEAR BACHELOR’S (120 CREDITS STANDARD)
NON-FLAGSHIP FLAGSHIP/VERY HIGH RESEARCH
All Students 50.0 86.0 118.0 139.0
African American Students NP 88.0 129.0 139.0
Asian Students NP 90.0 125.0 149.0
Hispanic Students NP 84.0 124.0 143.0
White Students 23.0 86.0 121.0 139.0
Pell Grant Recipients (at any time) 98.0 86.0 110.0 139.0
Remedial Students (at any time) 98.0 87.0 106.0 134.0
Graduation Rate
FULL-TIME1- TO 2-YEAR CERTIFICATE
2-YEAR ASSOCIATE
4-YEAR BACHELOR’SNON-FLAGSHIP FLAGSHIP/VERY HIGH RESEARCH
ON TIME IN 2 YEARS ON TIME IN 3 YEARS ON TIME IN 6 YEARS ON TIME IN 6 YEARS
All Students DS DS 7% 11% 11% 34% 32% 68%
African American Students DS DS 3% 5% 6% 24% 20% 55%
Asian Students DS DS DS 16% 12% 53% 38% 74%
Hispanic Students DS DS 4% 10% 5% 25% 18% 52%
White Students DS DS 7% 12% 12% 37% 33% 70%
Pell Grant Recipients (at any time) DS DS 5% 9% 7% 27% 21% 58%
Remedial Students (at any time) NP NP 3% 8% 4% 21% 11% 48%
PART-TIME NON-FLAGSHIP FLAGSHIP/VERY HIGH RESEARCHON TIME IN 2 YEARS ON TIME IN 3 YEARS ON TIME IN 6 YEARS ON TIME IN 6 YEARS
All Students DS DS 1% 4% 2% 9% 8% 34%
African American Students DS DS NP DS DS 15% NP NP
Asian Students NP NP DS DS DS DS DS DS
Hispanic Students DS DS NP DS NP DS DS DS
White Students DS DS 1% 4% 2% 7% DS 41%
Pell Grant Recipients (at any time) NP NP DS 5% DS 11% DS 28%
Remedial Students (at any time) DS DS DS 3% DS 15% DS 38%
OKLAHOMAEmbargoed until December 1, 2014, 8 a.m., EST

66 n Complete College America
Data for students who began college going full-time. NP = The state did not provide data for this metric. DS = Fewer than 10 students, so data were suppressed.
Many graduates earn excess credits.
And graduates take far too long to finish, costing missed opportunities and money.
1 Year Standard
2 Years Standard
4 Years Standard
4 Years Standard
YEARS 1 2 3 4 5 6
Most full-time students don’t graduate on time.
(F
LAGS
HIP/
VERY
HI
GH R
ESEA
RCH)
2-YE
AR A
SSOC
IATE
1- TO
2-Y
EAR
CERT
IFIC
ATE
(N
ON-F
LAGS
HIP)
ON TIME
ON TIME
ON TIME
ON TIME
4-YE
AR B
ACHE
LOR’
S
KNOW THIS:
The best strategy for reducing the cost of college is to ensure that more students graduate on time.
COST OF EACH ADDITIONAL YEAR
COST OF EACH ADDITIONAL YEAR
120 Credits Standard
120 Credits Standard
60 Credits Standard
30 Credits Standard
135.0
136.0
75.6
54.63.3
3.8
4.9
4.3
OREGON
$17,110 +$35,000
$52,110
in cost of attendance
total for each student seeking associate degree
in lost wages
$22,538 +$45,327
$67,865
in cost of attendance
total for each student seeking bachelor’s degree
in lost wages
16%
19%
36%
6%
Embargoed until December 1, 2014, 8 a.m., EST

Four-Year Myth: Make College More Affordable. Restore the Promise of Graduating on Time. n 67
Notes: Cost of attendance is calculated using the state-specific cost of one additional year of tuition and fees from the College Board’s Trends in Student Pricing 2013 Report. Additional expenses include national average estimates for room and board, books and supplies, transportation, and other expenses from the College Board’s Annual Survey of Colleges for 2013–2014. Lost wages are national average salaries for new graduates and do not account for earnings while in college. The median starting salary of 2011 associate degree graduates of community colleges comes from the American Institutes for Research’s What’s the Value of an Associate’s Degree? The average starting salary of 2013 bachelor’s degree graduates comes from the National Association of Colleges and Employers 2013 Salary Survey. Credits to degree includes remedial courses. Time to degree includes time spent in remedial courses only if that was required. Students who drop out for five or more consecutive years are excluded.
Time to Degree (Years)
FULL-TIME1- TO 2-YEAR CERTIFICATE
2-YEAR ASSOCIATE
4-YEAR BACHELOR’SNON-FLAGSHIP FLAGSHIP/VERY HIGH RESEARCH
All Students 3.3 3.8 4.9 4.3
African American Students NP NP 6.6 4.8
Asian Students 4.4 3.6 5.0 4.3
Hispanic Students 3.0 3.8 4.8 4.4
White Students 3.3 3.8 5.0 4.2
Pell Grant Recipients (at any time) 3.5 4.0 5.4 4.7
Remedial Students (at any time) NP NP 5.1 4.5
Credits to Degree (Semester Credits) Includes remedial credits starting in 2013 data collection
FULL-TIME1- TO 2-YEAR CERTIFICATE
(30 CREDITS STANDARD)
2-YEAR ASSOCIATE
(60 CREDITS STANDARD)
4-YEAR BACHELOR’S (120 CREDITS STANDARD)
NON-FLAGSHIP FLAGSHIP/VERY HIGH RESEARCH
All Students 54.6 75.6 135.0 136.0
African American Students NP NP 139.0 133.0
Asian Students 71.5 79.8 137.0 138.0
Hispanic Students 54.8 77.9 133.0 137.0
White Students 62.9 77.6 135.0 136.0
Pell Grant Recipients (at any time) 64.9 79.6 137.0 138.0
Remedial Students (at any time) NP NP 135.0 131.0
Graduation Rate
FULL-TIME1- TO 2-YEAR CERTIFICATE
2-YEAR ASSOCIATE
4-YEAR BACHELOR’SNON-FLAGSHIP FLAGSHIP/VERY HIGH RESEARCH
ON TIME IN 2 YEARS ON TIME IN 3 YEARS ON TIME IN 6 YEARS ON TIME IN 6 YEARS
All Students 16% 26% 6% 17% 19% 45% 36% 68%
African American Students DS DS DS 6% DS 21% 18% 52%
Asian Students DS DS 6% 16% 14% 42% 34% 70%
Hispanic Students DS 37% 3% 12% 13% 39% 32% 64%
White Students 16% 25% 7% 18% 20% 47% 38% 69%
Pell Grant Recipients (at any time) 13% 24% 5% 16% 15% 41% 28% 61%
Remedial Students (at any time) DS 23% 3% 13% 13% 37% 28% 61%
PART-TIME NON-FLAGSHIP FLAGSHIP/VERY HIGH RESEARCHON TIME IN 2 YEARS ON TIME IN 3 YEARS ON TIME IN 6 YEARS ON TIME IN 6 YEARS
All Students 4% 11% 1% 4% 10% 29% 12% 33%
African American Students NP DS NP DS DS DS DS DS
Asian Students NP NP NP DS DS DS DS DS
Hispanic Students DS DS DS 3% DS DS DS DS
White Students 5% 12% 1% 4% DS 25% 13% 36%
Pell Grant Recipients (at any time) 11% 20% DS 3% DS 26% DS DS
Remedial Students (at any time) DS 11% DS 3% DS DS DS DS
OREGONEmbargoed until December 1, 2014, 8 a.m., EST
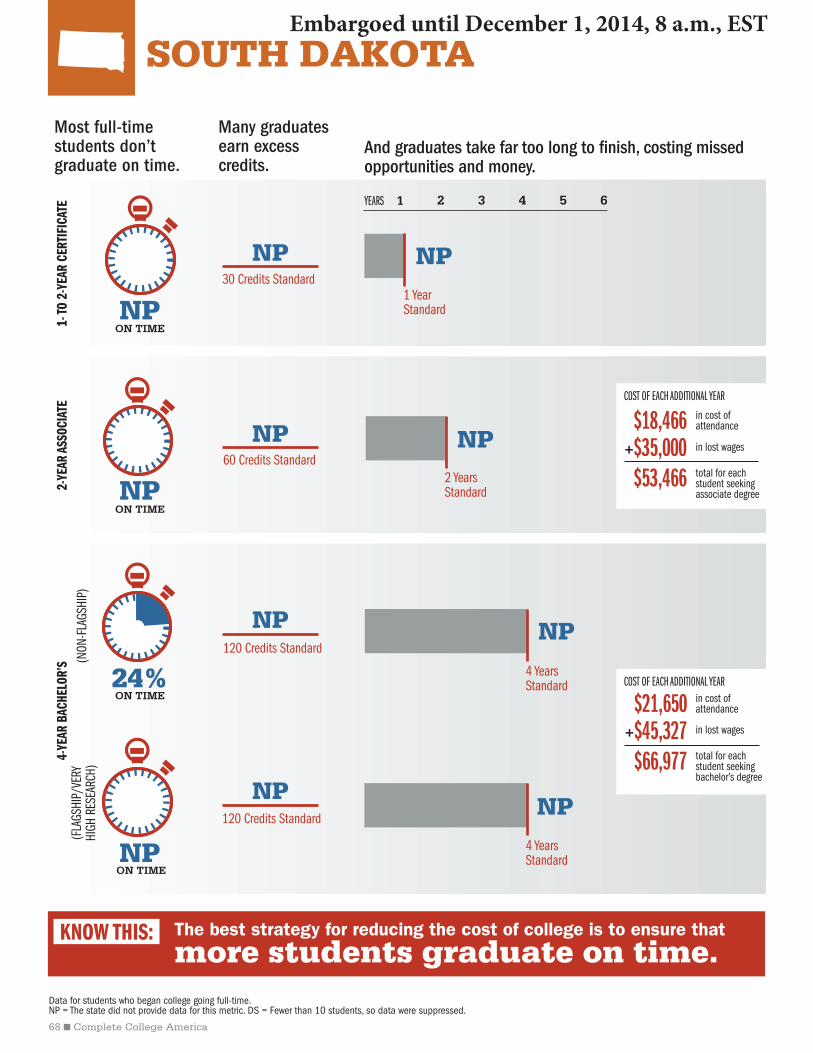
68 n Complete College America
Data for students who began college going full-time. NP = The state did not provide data for this metric. DS = Fewer than 10 students, so data were suppressed.
Many graduates earn excess credits.
And graduates take far too long to finish, costing missed opportunities and money.
1 Year Standard
2 Years Standard
4 Years Standard
4 Years Standard
YEARS 1 2 3 4 5 6
Most full-time students don’t graduate on time.
(F
LAGS
HIP/
VERY
HI
GH R
ESEA
RCH)
2-YE
AR A
SSOC
IATE
1- TO
2-Y
EAR
CERT
IFIC
ATE
(N
ON-F
LAGS
HIP)
ON TIME
ON TIME
ON TIME
ON TIME
4-YE
AR B
ACHE
LOR’
S
KNOW THIS:
The best strategy for reducing the cost of college is to ensure that more students graduate on time.
COST OF EACH ADDITIONAL YEAR
COST OF EACH ADDITIONAL YEAR
120 Credits Standard
120 Credits Standard
60 Credits Standard
30 Credits Standard
SOUTH DAKOTA
NP NP
NP
NP
NP
NP
NP
NP
$18,466 +$35,000
$53,466
in cost of attendance
total for each student seeking associate degree
in lost wages
$21,650 +$45,327
$66,977
in cost of attendance
total for each student seeking bachelor’s degree
in lost wages
NP
24%
NP
NP
Embargoed until December 1, 2014, 8 a.m., EST

Four-Year Myth: Make College More Affordable. Restore the Promise of Graduating on Time. n 69
Notes: Cost of attendance is calculated using the state-specific cost of one additional year of tuition and fees from the College Board’s Trends in Student Pricing 2013 Report. Additional expenses include national average estimates for room and board, books and supplies, transportation, and other expenses from the College Board’s Annual Survey of Colleges for 2013–2014. Lost wages are national average salaries for new graduates and do not account for earnings while in college. The median starting salary of 2011 associate degree graduates of community colleges comes from the American Institutes for Research’s What’s the Value of an Associate’s Degree? The average starting salary of 2013 bachelor’s degree graduates comes from the National Association of Colleges and Employers 2013 Salary Survey. Credits to degree includes remedial courses. Time to degree includes time spent in remedial courses only if that was required. Students who drop out for five or more consecutive years are excluded.
Time to Degree (Years)
FULL-TIME1- TO 2-YEAR CERTIFICATE
2-YEAR ASSOCIATE
4-YEAR BACHELOR’SNON-FLAGSHIP FLAGSHIP/VERY HIGH RESEARCH
All Students NP NP NP NP
American Indian Students NP NP 5.9 NP
Asian Students NP 5.0 4.6 NP
Hispanic Students NP NP NP NP
White Students NP NP NP NP
Pell Grant Recipients (at any time) 5.0 NP NP NP
Remedial Students (at any time) NP NP NP NP
Credits to Degree (Semester Credits) Includes remedial credits starting in 2013 data collection
FULL-TIME1- TO 2-YEAR CERTIFICATE
(30 CREDITS STANDARD)
2-YEAR ASSOCIATE
(60 CREDITS STANDARD)
4-YEAR BACHELOR’S (120 CREDITS STANDARD)
NON-FLAGSHIP FLAGSHIP/VERY HIGH RESEARCH
All Students NP NP NP NP
American Indian Students NP NP DS NP
Asian Students NP 89.5 141.5 NP
Hispanic Students NP NP NP NP
White Students NP NP NP NP
Pell Grant Recipients (at any time) 139.0 NP NP NP
Remedial Students (at any time) 158.0 NP NP NP
Graduation Rate
FULL-TIME1- TO 2-YEAR CERTIFICATE
2-YEAR ASSOCIATE
4-YEAR BACHELOR’SNON-FLAGSHIP FLAGSHIP/VERY HIGH RESEARCH
ON TIME IN 2 YEARS ON TIME IN 3 YEARS ON TIME IN 6 YEARS ON TIME IN 6 YEARS
All Students NP NP DS 8% 24% 53% NP NP
American Indian Students DS DS DS DS 24% 24% DS DS
Asian Students NP NP DS DS DS DS NP NP
Hispanic Students NP NP DS DS DS 39% NP NP
White Students NP NP DS 8% 25% 54% NP NP
Pell Grant Recipients (at any time) NP NP DS DS 19% 47% NP NP
Remedial Students (at any time) NP NP NP DS 9% 34% NP NP
PART-TIME NON-FLAGSHIP FLAGSHIP/VERY HIGH RESEARCHON TIME IN 2 YEARS ON TIME IN 3 YEARS ON TIME IN 6 YEARS ON TIME IN 6 YEARS
All Students NP NP NP DS DS 9% NP NP
American Indian Students DS DS DS DS DS DS DS DS
Asian Students NP NP NP NP DS DS NP NP
Hispanic Students NP NP NP NP DS DS NP NP
White Students NP NP NP DS DS DS NP NP
Pell Grant Recipients (at any time) NP NP NP DS NP DS NP NP
Remedial Students (at any time) NP NP NP DS NP DS NP NP
SOUTH DAKOTAEmbargoed until December 1, 2014, 8 a.m., EST

70 n Complete College America
Data for students who began college going full-time. NP = The state did not provide data for this metric. DS = Fewer than 10 students, so data were suppressed.
Many graduates earn excess credits.
And graduates take far too long to finish, costing missed opportunities and money.
1 Year Standard
2 Years Standard
4 Years Standard
4 Years Standard
YEARS 1 2 3 4 5 6
Most full-time students don’t graduate on time.
(F
LAGS
HIP/
VERY
HI
GH R
ESEA
RCH)
2-YE
AR A
SSOC
IATE
1- TO
2-Y
EAR
CERT
IFIC
ATE
(N
ON-F
LAGS
HIP)
ON TIME
ON TIME
ON TIME
ON TIME
4-YE
AR B
ACHE
LOR’
S
KNOW THIS:
The best strategy for reducing the cost of college is to ensure that more students graduate on time.
COST OF EACH ADDITIONAL YEAR
COST OF EACH ADDITIONAL YEAR
ON TIME120 Credits Standard
120 Credits Standard
60 Credits Standard
134.5
147.6
89.3
1.2
3.6
4.7
4.4
TENNESSEE
$16,431 +$35,000
$51,431
in cost of attendance
total for each student seeking associate degree
in lost wages
$21,969 +$45,327
$67,296
in cost of attendance
total for each student seeking bachelor’s degree
in lost wages
76%
19%
35%
4%
30 Credits Standard
Data Incomplete
Embargoed until December 1, 2014, 8 a.m., EST

Four-Year Myth: Make College More Affordable. Restore the Promise of Graduating on Time. n 71
Notes: Cost of attendance is calculated using the state-specific cost of one additional year of tuition and fees from the College Board’s Trends in Student Pricing 2013 Report. Additional expenses include national average estimates for room and board, books and supplies, transportation, and other expenses from the College Board’s Annual Survey of Colleges for 2013–2014. Lost wages are national average salaries for new graduates and do not account for earnings while in college. The median starting salary of 2011 associate degree graduates of community colleges comes from the American Institutes for Research’s What’s the Value of an Associate’s Degree? The average starting salary of 2013 bachelor’s degree graduates comes from the National Association of Colleges and Employers 2013 Salary Survey. Credits to degree includes remedial courses. Time to degree includes time spent in remedial courses only if that was required. Students who drop out for five or more consecutive years are excluded.
Time to Degree (Years)
FULL-TIME1- TO 2-YEAR CERTIFICATE
2-YEAR ASSOCIATE
4-YEAR BACHELOR’SNON-FLAGSHIP FLAGSHIP/VERY HIGH RESEARCH
All Students 1.2 3.6 4.7 4.4
African American Students 1.2 4.4 5.0 4.6
Asian Students 1.1 3.5 4.8 4.4
Hispanic Students NP NP NP NP
White Students 1.3 3.6 4.6 4.3
Pell Grant Recipients (at any time) 1.2 NP NP NP
Remedial Students (at any time) 1.3 NP NP NP
Credits to Degree (Semester Credits) Includes remedial credits starting in 2013 data collection
FULL-TIME1- TO 2-YEAR CERTIFICATE
(30 CREDITS STANDARD)
2-YEAR ASSOCIATE
(60 CREDITS STANDARD)
4-YEAR BACHELOR’S (120 CREDITS STANDARD)
NON-FLAGSHIP FLAGSHIP/VERY HIGH RESEARCH
All Students 26.2 89.3 134.5 147.6
African American Students 26.7 93.2 138.8 144.4
Asian Students 28.4 89.2 141.6 150.6
Hispanic Students NP NP NP NP
White Students 25.8 89.0 132.8 147.7
Pell Grant Recipients (at any time) 25.0 NP NP NP
Remedial Students (at any time) 23.4 NP NP NP
Graduation Rate
FULL-TIME1- TO 2-YEAR CERTIFICATE
2-YEAR ASSOCIATE
4-YEAR BACHELOR’SNON-FLAGSHIP FLAGSHIP/VERY HIGH RESEARCH
ON TIME IN 2 YEARS ON TIME IN 3 YEARS ON TIME IN 6 YEARS ON TIME IN 6 YEARS
All Students 76% 77% 4% 12% 19% 47% 35% 68%
African American Students 72% 74% 1% 4% 12% 38% 28% 60%
Asian Students 63% 70% DS 9% 24% 50% 41% 70%
Hispanic Students 79% 79% DS 10% 13% 41% 26% 57%
White Students 76% 78% 5% 14% 22% 50% 36% 69%
Pell Grant Recipients (at any time) 75% 77% 4% 11% 11% 35% 20% 54%
Remedial Students (at any time) 81% 81% NP NP 8% 34% DS 42%
PART-TIME NON-FLAGSHIP FLAGSHIP/VERY HIGH RESEARCHON TIME IN 2 YEARS ON TIME IN 3 YEARS ON TIME IN 6 YEARS ON TIME IN 6 YEARS
All Students 17% 20% 1% 4% 2% 10% DS DS
African American Students 15% 16% DS DS DS DS DS DS
Asian Students DS DS NP DS DS DS DS DS
Hispanic Students 11% 13% NP DS NP DS DS DS
White Students 18% 21% 1% 4% DS 11% NP DS
Pell Grant Recipients (at any time) 28% 33% 1% 4% DS 9% DS DS
Remedial Students (at any time) 26% 26% NP NP DS 7% DS DS
TENNESSEEEmbargoed until December 1, 2014, 8 a.m., EST

72 n Complete College America
Data for students who began college going full-time. NP = The state did not provide data for this metric. DS = Fewer than 10 students, so data were suppressed.
Many graduates earn excess credits.
And graduates take far too long to finish, costing missed opportunities and money.
1 Year Standard
2 Years Standard
4 Years Standard
4 Years Standard
YEARS 1 2 3 4 5 6
Most full-time students don’t graduate on time.
(F
LAGS
HIP/
VERY
HI
GH R
ESEA
RCH)
2-YE
AR A
SSOC
IATE
1- TO
2-Y
EAR
CERT
IFIC
ATE
(N
ON-F
LAGS
HIP)
ON TIME
ON TIME
ON TIME
ON TIME
4-YE
AR B
ACHE
LOR’
S
KNOW THIS:
The best strategy for reducing the cost of college is to ensure that more students graduate on time.
COST OF EACH ADDITIONAL YEAR
COST OF EACH ADDITIONAL YEAR120 Credits Standard
60 Credits Standard
30 Credits Standard
144.8
96.8
65.9
3.4
4.7
5.6
4.7
TEXAS
$14,891 +$35,000
$49,891
in cost of attendance
total for each student seeking associate degree
in lost wages
$22,455
+$45,327 $67,782
in cost of attendance
total for each student seeking bachelor’s degree
in lost wages
0%
21%
45%
4%
120 Credits Standard
132.6
Embargoed until December 1, 2014, 8 a.m., EST

Four-Year Myth: Make College More Affordable. Restore the Promise of Graduating on Time. n 73
Notes: Cost of attendance is calculated using the state-specific cost of one additional year of tuition and fees from the College Board’s Trends in Student Pricing 2013 Report. Additional expenses include national average estimates for room and board, books and supplies, transportation, and other expenses from the College Board’s Annual Survey of Colleges for 2013–2014. Lost wages are national average salaries for new graduates and do not account for earnings while in college. The median starting salary of 2011 associate degree graduates of community colleges comes from the American Institutes for Research’s What’s the Value of an Associate’s Degree? The average starting salary of 2013 bachelor’s degree graduates comes from the National Association of Colleges and Employers 2013 Salary Survey. Credits to degree includes remedial courses. Time to degree includes time spent in remedial courses only if that was required. Students who drop out for five or more consecutive years are excluded.
Four-Year Myth: Make College More Affordable. Restore the Promise of Graduating on Time. n 73
Time to Degree (Years)
FULL-TIME1- TO 2-YEAR CERTIFICATE
2-YEAR ASSOCIATE
4-YEAR BACHELOR’SNON-FLAGSHIP FLAGSHIP/VERY HIGH RESEARCH
All Students 3.4 4.7 5.6 4.7
African American Students 3.8 4.9 5.6 5.1
Asian Students 4.3 4.5 5.4 4.6
Hispanic Students 3.3 4.7 5.9 5.0
White Students 3.3 4.6 5.4 4.6
Pell Grant Recipients (at any time) 3.5 5.0 6.0 5.2
Remedial Students (at any time) 4.4 4.9 6.0 5.9
Credits to Degree (Semester Credits) Includes remedial credits starting in 2013 data collection
FULL-TIME1- TO 2-YEAR CERTIFICATE
(30 CREDITS STANDARD)
2-YEAR ASSOCIATE
(60 CREDITS STANDARD)
4-YEAR BACHELOR’S (120 CREDITS STANDARD)
NON-FLAGSHIP FLAGSHIP/VERY HIGH RESEARCH
All Students 65.9 96.8 144.8 132.6
African American Students 71.1 102.4 150.2 141.9
Asian Students 83.2 103.2 147.1 134.4
Hispanic Students 66.0 98.7 147.8 135.7
White Students 62.9 77.6 135.0 136.0
Pell Grant Recipients (at any time) 67.1 100.3 149.9 140.3
Remedial Students (at any time) 79.3 100.1 151.6 151.4
Graduation Rate
FULL-TIME1- TO 2-YEAR CERTIFICATE
2-YEAR ASSOCIATE
4-YEAR BACHELOR’SNON-FLAGSHIP FLAGSHIP/VERY HIGH RESEARCH
ON TIME IN 2 YEARS ON TIME IN 3 YEARS ON TIME IN 6 YEARS ON TIME IN 6 YEARS
All Students 0% 0% 4% 9% 21% 50% 45% 78%
African American Students DS 0% 3% 6% 10% 33% 22% 55%
Asian Students DS DS 3% 10% 27% 60% 43% 79%
Hispanic Students 0% 0% 3% 9% 17% 44% 34% 70%
White Students 0% 0% 4% 10% 28% 59% 52% 84%
Pell Grant Recipients (at any time) 0% 0% 3% 9% 14% 39% 32% 67%
Remedial Students (at any time) 0% 0% 2% 7% 9% 34% 10% 43%
PART-TIME NON-FLAGSHIP FLAGSHIP/VERY HIGH RESEARCHON TIME IN 2 YEARS ON TIME IN 3 YEARS ON TIME IN 6 YEARS ON TIME IN 6 YEARS
All Students 4% 11% 1% 4% 10% 29% 12% 33%
African American Students 0% 0% 1% 2% DS 7% DS 40%
Asian Students DS DS 1% 5% DS DS DS 53%
Hispanic Students 0% 0% 1% 3% 7% 19% DS 31%
White Students 0% 0% 1% 3% 7% 28% 30% 69%
Pell Grant Recipients (at any time) 0% 1% 1% 4% 5% 16% DS 38%
Remedial Students (at any time) 0% 0% 0% 3% 2% 14% DS 45%
TEXASEmbargoed until December 1, 2014, 8 a.m., EST

74 n Complete College America
Data for students who began college going full-time. NP = The state did not provide data for this metric. DS = Fewer than 10 students, so data were suppressed.
Many graduates earn excess credits.
And graduates take far too long to finish, costing missed opportunities and money.
1 Year Standard
2 Years Standard
4 Years Standard
4 Years Standard
YEARS 1 2 3 4 5 6
Most full-time students don’t graduate on time.
(F
LAGS
HIP/
VERY
HI
GH R
ESEA
RCH)
2-YE
AR A
SSOC
IATE
1- TO
2-Y
EAR
CERT
IFIC
ATE
(N
ON-F
LAGS
HIP)
ON TIME
ON TIME
ON TIME
ON TIME
4-YE
AR B
ACHE
LOR’
S
KNOW THIS:
The best strategy for reducing the cost of college is to ensure that more students graduate on time.
COST OF EACH ADDITIONAL YEAR
COST OF EACH ADDITIONAL YEAR
120 Credits Standard
120 Credits Standard
60 Credits Standard
30 Credits Standard
139.6
144.1
81.1
80.3
2.4
3.1
4.7
4.6
UTAH
$15,980 +$35,000
$50,980
in cost of attendance
total for each student seeking associate degree
in lost wages
$19,839 +$45,327
$65,166
in cost of attendance
total for each student seeking bachelor’s degree
in lost wages
10%
26%
34%
21%
Embargoed until December 1, 2014, 8 a.m., EST

Four-Year Myth: Make College More Affordable. Restore the Promise of Graduating on Time. n 75
Notes: Cost of attendance is calculated using the state-specific cost of one additional year of tuition and fees from the College Board’s Trends in Student Pricing 2013 Report. Additional expenses include national average estimates for room and board, books and supplies, transportation, and other expenses from the College Board’s Annual Survey of Colleges for 2013–2014. Lost wages are national average salaries for new graduates and do not account for earnings while in college. The median starting salary of 2011 associate degree graduates of community colleges comes from the American Institutes for Research’s What’s the Value of an Associate’s Degree? The average starting salary of 2013 bachelor’s degree graduates comes from the National Association of Colleges and Employers 2013 Salary Survey. Credits to degree includes remedial courses. Time to degree includes time spent in remedial courses only if that was required. Students who drop out for five or more consecutive years are excluded.
Time to Degree (Years)
FULL-TIME1- TO 2-YEAR CERTIFICATE
2-YEAR ASSOCIATE
4-YEAR BACHELOR’SNON-FLAGSHIP FLAGSHIP/VERY HIGH RESEARCH
All Students 2.4 3.1 4.7 4.6
African American Students 1.0 3.6 4.7 4.7
Asian Students 4.3 2.6 3.8 4.5
Hispanic Students 3.3 3.1 4.1 4.6
White Students 2.3 3.2 4.7 4.7
Pell Grant Recipients (at any time) NP NP NP NP
Remedial Students (at any time) 3.1 4.0 6.0 NP
Credits to Degree (Semester Credits) Includes remedial credits starting in 2013 data collection
FULL-TIME1- TO 2-YEAR CERTIFICATE
(30 CREDITS STANDARD)
2-YEAR ASSOCIATE
(60 CREDITS STANDARD)
4-YEAR BACHELOR’S (120 CREDITS STANDARD)
NON-FLAGSHIP FLAGSHIP/VERY HIGH RESEARCH
All Students 80.3 81.1 139.6 144.1
African American Students 119.4 78.7 142.1 143.3
Asian Students 86.4 84.1 132.8 151.9
Hispanic Students 82.0 78.9 140.0 140.8
White Students 82.2 80.7 140.5 143.9
Pell Grant Recipients (at any time) NP NP NP NP
Remedial Students (at any time) 91.0 80.1 136.1 NP
Graduation Rate
FULL-TIME1- TO 2-YEAR CERTIFICATE
2-YEAR ASSOCIATE
4-YEAR BACHELOR’SNON-FLAGSHIP FLAGSHIP/VERY HIGH RESEARCH
ON TIME IN 2 YEARS ON TIME IN 3 YEARS ON TIME IN 6 YEARS ON TIME IN 6 YEARS
All Students 10% 10% 21% 27% 26% 43% 34% 54%
African American Students DS DS DS 14% DS 24% DS DS
Asian Students DS DS 14% 19% 31% 46% 37% 55%
Hispanic Students DS DS 15% 18% 16% 33% 29% 44%
White Students 13% 13% 23% 30% 28% 45% 35% 56%
Pell Grant Recipients (at any time) NP NP NP NP NP NP NP NP
Remedial Students (at any time) NP NP 10% 16% 12% 26% NP NP
PART-TIME NON-FLAGSHIP FLAGSHIP/VERY HIGH RESEARCHON TIME IN 2 YEARS ON TIME IN 3 YEARS ON TIME IN 6 YEARS ON TIME IN 6 YEARS
All Students DS DS 4% 7% 7% 15% 14% 27%
African American Students DS DS NP DS DS DS DS DS
Asian Students DS DS NP DS DS DS DS DS
Hispanic Students NP NP DS 5% DS DS DS DS
White Students DS DS 4% 8% 7% 16% 15% 28%
Pell Grant Recipients (at any time) NP NP NP NP NP NP NP NP
Remedial Students (at any time) DS DS 1% 6% 4% 11% NP NP
UTAHEmbargoed until December 1, 2014, 8 a.m., EST

76 n Complete College America
Data for students who began college going full-time. NP = The state did not provide data for this metric. DS = Fewer than 10 students, so data were suppressed.
Many graduates earn excess credits.
And graduates take far too long to finish, costing missed opportunities and money.
1 Year Standard
2 Years Standard
4 Years Standard
4 Years Standard
YEARS 1 2 3 4 5 6
Most full-time students don’t graduate on time.
(F
LAGS
HIP/
VERY
HI
GH R
ESEA
RCH)
2-YE
AR A
SSOC
IATE
1- TO
2-Y
EAR
CERT
IFIC
ATE
(N
ON-F
LAGS
HIP)
ON TIME
ON TIME
ON TIME
ON TIME
4-YE
AR B
ACHE
LOR’
S
KNOW THIS:
The best strategy for reducing the cost of college is to ensure that more students graduate on time.
COST OF EACH ADDITIONAL YEAR
COST OF EACH ADDITIONAL YEAR
120 Credits Standard
120 Credits Standard
60 Credits Standard
30 Credits Standard
140.0
NP
96.1
66.0
4.0
4.8
4.9
NP
WEST VIRGINIA
$15,765 +$35,000
$50,765
in cost of attendance
total for each student seeking associate degree
in lost wages
$20,184 +$45,327
$65,511
in cost of attendance
total for each student seeking bachelor’s degree
in lost wages
8%
25%
NP
4%
Embargoed until December 1, 2014, 8 a.m., EST

Four-Year Myth: Make College More Affordable. Restore the Promise of Graduating on Time. n 77
Notes: Cost of attendance is calculated using the state-specific cost of one additional year of tuition and fees from the College Board’s Trends in Student Pricing 2013 Report. Additional expenses include national average estimates for room and board, books and supplies, transportation, and other expenses from the College Board’s Annual Survey of Colleges for 2013–2014. Lost wages are national average salaries for new graduates and do not account for earnings while in college. The median starting salary of 2011 associate degree graduates of community colleges comes from the American Institutes for Research’s What’s the Value of an Associate’s Degree? The average starting salary of 2013 bachelor’s degree graduates comes from the National Association of Colleges and Employers 2013 Salary Survey. Credits to degree includes remedial courses. Time to degree includes time spent in remedial courses only if that was required. Students who drop out for five or more consecutive years are excluded.
Time to Degree (Years)
FULL-TIME1- TO 2-YEAR CERTIFICATE
2-YEAR ASSOCIATE
4-YEAR BACHELOR’SNON-FLAGSHIP FLAGSHIP/VERY HIGH RESEARCH
All Students 4.0 4.8 4.9 NP
African American Students 4.9 5.6 5.6 NP
Asian Students NP 4.8 4.4 NP
Hispanic Students NP 4.8 4.5 NP
White Students 3.9 4.8 4.9 NP
Pell Grant Recipients (at any time) 4.2 5.1 5.5 NP
Remedial Students (at any time) 4.2 4.8 6.0 NP
Credits to Degree (Semester Credits) Includes remedial credits starting in 2013 data collection
FULL-TIME1- TO 2-YEAR CERTIFICATE
(30 CREDITS STANDARD)
2-YEAR ASSOCIATE
(60 CREDITS STANDARD)
4-YEAR BACHELOR’S (120 CREDITS STANDARD)
NON-FLAGSHIP FLAGSHIP/VERY HIGH RESEARCH
All Students 66.0 96.1 140.0 NP
African American Students 85.7 100.4 143.8 NP
Asian Students NP 77.2 141.1 NP
Hispanic Students NP 83.8 139.3 NP
White Students 65.4 96.2 139.9 NP
Pell Grant Recipients (at any time) 66.7 96.4 143.5 NP
Remedial Students (at any time) 67.5 95.0 143.8 NP
Graduation Rate
FULL-TIME1- TO 2-YEAR CERTIFICATE
2-YEAR ASSOCIATE
4-YEAR BACHELOR’SNON-FLAGSHIP FLAGSHIP/VERY HIGH RESEARCH
ON TIME IN 2 YEARS ON TIME IN 3 YEARS ON TIME IN 6 YEARS ON TIME IN 6 YEARS
All Students 8% 11% 4% 10% 25% 49% NP NP
African American Students DS DS DS 4% 9% 27% NP NP
Asian Students NP NP DS DS 31% 48% NP NP
Hispanic Students DS DS NP DS 16% 38% NP NP
White Students 8% 11% 4% 11% 26% 51% NP NP
Pell Grant Recipients (at any time) DS DS 3% 9% 18% 43% NP NP
Remedial Students (at any time) 7% 9% 1% 7% 7% 27% NP NP
PART-TIME NON-FLAGSHIP FLAGSHIP/VERY HIGH RESEARCHON TIME IN 2 YEARS ON TIME IN 3 YEARS ON TIME IN 6 YEARS ON TIME IN 6 YEARS
All Students NP NP DS 5% DS DS NP NP
African American Students DS DS NP NP DS DS NP NP
Asian Students NP NP DS DS DS DS NP NP
Hispanic Students DS DS DS DS DS DS NP NP
White Students NP NP DS 6% DS DS NP NP
Pell Grant Recipients (at any time) NP NP NP 5% NP DS NP NP
Remedial Students (at any time) NP NP NP 4% DS DS NP NP
WEST VIRGINIAEmbargoed until December 1, 2014, 8 a.m., EST
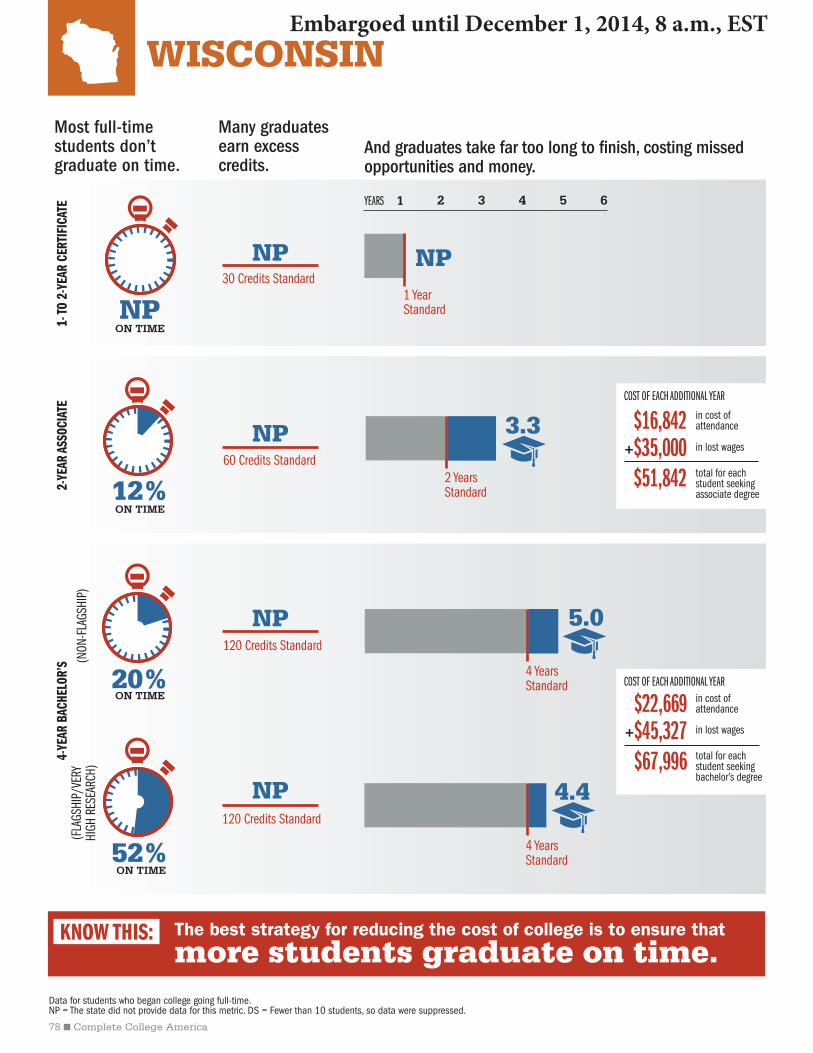
78 n Complete College America
Data for students who began college going full-time. NP = The state did not provide data for this metric. DS = Fewer than 10 students, so data were suppressed.
Many graduates earn excess credits.
And graduates take far too long to finish, costing missed opportunities and money.
1 Year Standard
2 Years Standard
4 Years Standard
4 Years Standard
YEARS 1 2 3 4 5 6
Most full-time students don’t graduate on time.
(F
LAGS
HIP/
VERY
HI
GH R
ESEA
RCH)
2-YE
AR A
SSOC
IATE
1- TO
2-Y
EAR
CERT
IFIC
ATE
(N
ON-F
LAGS
HIP)
ON TIME
ON TIME
ON TIME
ON TIME
4-YE
AR B
ACHE
LOR’
S
KNOW THIS:
The best strategy for reducing the cost of college is to ensure that more students graduate on time.
COST OF EACH ADDITIONAL YEAR
COST OF EACH ADDITIONAL YEAR
120 Credits Standard
120 Credits Standard
60 Credits Standard
30 Credits StandardNP
3.3
5.0
4.4
WISCONSIN
NP
NP
NP
NP
$16,842 +$35,000
$51,842
in cost of attendance
total for each student seeking associate degree
in lost wages
$22,669 +$45,327
$67,996
in cost of attendance
total for each student seeking bachelor’s degree
in lost wages
NP
20%
52%
12%
Embargoed until December 1, 2014, 8 a.m., EST

Four-Year Myth: Make College More Affordable. Restore the Promise of Graduating on Time. n 79
Notes: Cost of attendance is calculated using the state-specific cost of one additional year of tuition and fees from the College Board’s Trends in Student Pricing 2013 Report. Additional expenses include national average estimates for room and board, books and supplies, transportation, and other expenses from the College Board’s Annual Survey of Colleges for 2013–2014. Lost wages are national average salaries for new graduates and do not account for earnings while in college. The median starting salary of 2011 associate degree graduates of community colleges comes from the American Institutes for Research’s What’s the Value of an Associate’s Degree? The average starting salary of 2013 bachelor’s degree graduates comes from the National Association of Colleges and Employers 2013 Salary Survey. Credits to degree includes remedial courses. Time to degree includes time spent in remedial courses only if that was required. Students who drop out for five or more consecutive years are excluded.
Time to Degree (Years)
FULL-TIME1- TO 2-YEAR CERTIFICATE
2-YEAR ASSOCIATE
4-YEAR BACHELOR’SNON-FLAGSHIP FLAGSHIP/VERY HIGH RESEARCH
All Students NP 3.3 5.0 4.4
African American Students NP NP 5.9 5.3
Asian Students NP 4.0 5.0 4.4
Hispanic Students NP 2.6 5.4 4.5
White Students NP 3.3 5.0 4.4
Pell Grant Recipients (at any time) NP 3.5 5.6 5.0
Remedial Students (at any time) NP 3.1 5.2 5.0
Credits to Degree (Semester Credits) Includes remedial credits starting in 2013 data collection
FULL-TIME1- TO 2-YEAR CERTIFICATE
(30 CREDITS STANDARD)
2-YEAR ASSOCIATE
(60 CREDITS STANDARD)
4-YEAR BACHELOR’S (120 CREDITS STANDARD)
NON-FLAGSHIP FLAGSHIP/VERY HIGH RESEARCH
All Students NP NP NP NP
African American Students NP NP NP NP
Asian Students NP NP NP NP
Hispanic Students NP NP NP NP
White Students NP NP NP NP
Pell Grant Recipients (at any time) NP NP NP NP
Remedial Students (at any time) NP NP NP NP
Graduation Rate
FULL-TIME1- TO 2-YEAR CERTIFICATE
2-YEAR ASSOCIATE
4-YEAR BACHELOR’SNON-FLAGSHIP FLAGSHIP/VERY HIGH RESEARCH
ON TIME IN 2 YEARS ON TIME IN 3 YEARS ON TIME IN 6 YEARS ON TIME IN 6 YEARS
All Students NP NP 12% 20% 20% 52% 52% 82%
African American Students NP NP DS DS 4% 23% 25% 62%
Asian Students NP NP DS 19% 16% 41% 48% 81%
Hispanic Students NP NP DS 15% 11% 36% 33% 73%
White Students NP NP 13% 20% 21% 54% 55% 84%
Pell Grant Recipients (at any time) NP NP 12% 21% 13% 42% 33% 70%
Remedial Students (at any time) NP NP 7% 14% 11% 38% DS 57%
PART-TIME NON-FLAGSHIP FLAGSHIP/VERY HIGH RESEARCHON TIME IN 2 YEARS ON TIME IN 3 YEARS ON TIME IN 6 YEARS ON TIME IN 6 YEARS
All Students NP NP DS 5% 3% 13% DS 57%
African American Students NP NP DS DS DS DS DS DS
Asian Students NP NP DS DS DS DS DS DS
Hispanic Students NP NP DS DS DS DS NP NP
White Students NP NP DS 6% DS 15% DS 65%
Pell Grant Recipients (at any time) NP NP DS DS DS 14% DS DS
Remedial Students (at any time) NP NP DS 4% DS 12% NP NP
WISCONSINEmbargoed until December 1, 2014, 8 a.m., EST

80 n Complete College America
Data for students who began college going full-time. NP = The state did not provide data for this metric. DS = Fewer than 10 students, so data were suppressed.
Many graduates earn excess credits.
And graduates take far too long to finish, costing missed opportunities and money.
1 Year Standard
2 Years Standard
4 Years Standard
4 Years Standard
YEARS 1 2 3 4 5 6
Most full-time students don’t graduate on time.
(F
LAGS
HIP/
VERY
HI
GH R
ESEA
RCH)
2-YE
AR A
SSOC
IATE
1- TO
2-Y
EAR
CERT
IFIC
ATE
(N
ON-F
LAGS
HIP)
ON TIME
ON TIME
ON TIME
ON TIME
4-YE
AR B
ACHE
LOR’
S
KNOW THIS:
The best strategy for reducing the cost of college is to ensure that more students graduate on time.
COST OF EACH ADDITIONAL YEAR
COST OF EACH ADDITIONAL YEAR
120 Credits Standard
120 Credits Standard
30 Credits Standard
60 Credits Standard
128.9
NP
80.9
65.9
2.6
3.2
4.5
NP
WYOMING
$15,273 +$35,000
$50,273
in cost of attendance
total for each student seeking associate degree
in lost wages
$18,337 +$45,327
$63,664
in cost of attendance
total for each student seeking bachelor’s degree
in lost wages
7%
23%
NP
14%
Embargoed until December 1, 2014, 8 a.m., EST

Four-Year Myth: Make College More Affordable. Restore the Promise of Graduating on Time. n 81
Notes: Cost of attendance is calculated using the state-specific cost of one additional year of tuition and fees from the College Board’s Trends in Student Pricing 2013 Report. Additional expenses include national average estimates for room and board, books and supplies, transportation, and other expenses from the College Board’s Annual Survey of Colleges for 2013–2014. Lost wages are national average salaries for new graduates and do not account for earnings while in college. The median starting salary of 2011 associate degree graduates of community colleges comes from the American Institutes for Research’s What’s the Value of an Associate’s Degree? The average starting salary of 2013 bachelor’s degree graduates comes from the National Association of Colleges and Employers 2013 Salary Survey. Credits to degree includes remedial courses. Time to degree includes time spent in remedial courses only if that was required. Students who drop out for five or more consecutive years are excluded.
Time to Degree (Years)
FULL-TIME1- TO 2-YEAR CERTIFICATE
2-YEAR ASSOCIATE
4-YEAR BACHELOR’SNON-FLAGSHIP FLAGSHIP/VERY HIGH RESEARCH
All Students 2.6 3.2 4.5 NP
African American Students NP 2.3 4.3 NP
Asian Students 0.7 1.7 4.6 NP
Hispanic Students 2.7 3.0 4.7 NP
White Students 2.5 3.1 4.5 NP
Pell Grant Recipients (at any time) 3.2 3.6 5.0 NP
Remedial Students (at any time) 3.2 3.6 NP NP
Credits to Degree (Semester Credits) Includes remedial credits starting in 2013 data collection
FULL-TIME1- TO 2-YEAR CERTIFICATE
(30 CREDITS STANDARD)
2-YEAR ASSOCIATE
(60 CREDITS STANDARD)
4-YEAR BACHELOR’S (120 CREDITS STANDARD)
NON-FLAGSHIP FLAGSHIP/VERY HIGH RESEARCH
All Students 65.9 80.9 128.9 NP
African American Students NP 66.6 110.0 NP
Asian Students 38.0 63.4 125.0 NP
Hispanic Students 59.3 68.5 125.1 NP
White Students 66.0 81.0 129.0 NP
Pell Grant Recipients (at any time) 70.6 83.2 131.4 NP
Remedial Students (at any time) 74.7 85.2 NP NP
Graduation Rate
FULL-TIME1- TO 2-YEAR CERTIFICATE
2-YEAR ASSOCIATE
4-YEAR BACHELOR’SNON-FLAGSHIP FLAGSHIP/VERY HIGH RESEARCH
ON TIME IN 2 YEARS ON TIME IN 3 YEARS ON TIME IN 6 YEARS ON TIME IN 6 YEARS
All Students 7% 9% 14% 24% 23% 53% NP NP
African American Students DS DS DS DS DS DS NP NP
Asian Students DS DS DS DS DS DS NP NP
Hispanic Students DS DS DS 13% 22% 51% NP NP
White Students 7% 9% 15% 25% 23% 53% NP NP
Pell Grant Recipients (at any time) 6% 8% 8% 17% 16% 47% NP NP
Remedial Students (at any time) 6% 8% 8% 17% NP NP NP NP
PART-TIME NON-FLAGSHIP FLAGSHIP/VERY HIGH RESEARCHON TIME IN 2 YEARS ON TIME IN 3 YEARS ON TIME IN 6 YEARS ON TIME IN 6 YEARS
All Students DS DS DS 3% DS DS NP NP
African American Students NP NP DS DS NP NP NP NP
Asian Students DS DS DS DS NP NP NP NP
Hispanic Students NP NP NP NP NP NP NP NP
White Students DS DS DS 4% DS DS NP NP
Pell Grant Recipients (at any time) DS DS NP DS DS DS NP NP
Remedial Students (at any time) DS DS DS DS NP NP NP NP
WYOMINGEmbargoed until December 1, 2014, 8 a.m., EST

RELATED RESOURCES
Following are additional resources from Complete College America. For a complete collection of reports, briefs, and presentations, visit completecollege.org/resources.
In this groundbreaking report, Complete College America provides an in-depth look into the data surrounding why students are not graduating and what must be done to address this issue. By highlighting the need to count every student, assessing information about time and credit intensity, and outlining strategies for success, this report provides a clear discussion on why we must shorten time to degree to boost college completion.
Time Is the Enemy n 1
The surprising truth about why today’s college students aren’t graduating ... and whaT needs To change
ENEMYTIME is
theAre states implementing
the best reforms to get more college graduates?
ChangersThe
Game
Remediation is a broken system. There’s a better way — start many more students
in college courses with just-in-time support.
remediationHigher Education’s Bridge to Nowhere
In The Game Changers, Complete College America lays out five college completion strategies designed to get two, three, and four times the results of traditional approaches.
Approximately 1.7 million students begin college in remediation each year. Of those students, only one in 10 reaches graduation day. Bridge to Nowhere makes the case that traditional remediation is a broken system and that many more students could succeed if placed into college courses with just-in-time academic support.
82 n Complete College America
Embargoed until December 1, 2014, 8 a.m., EST

Embargoed until December 1, 2014, 8 a.m., EST

ABOUT COMPLETE COLLEGE AMERICA
It’s really about the states ... we’re just here to help.
Established in 2009, Complete College America is a national nonprofit with a single mission: to work with states to significantly increase the number of Americans with quality career certificates or college degrees and to close attainment gaps for traditionally under-represented populations.
The need for this work is compelling. Between 1970 and 2009, undergraduate enrollment in the United States more than doubled, while the completion rate has been virtually unchanged. We’ve made progress in giving students from all backgrounds access to college — but we haven’t finished the all-important job of helping them achieve a degree. Counting the success of all students is an essential first step. And then we must move with urgency to reinvent American higher education to meet the needs of the new majority of students on our campuses, delicately balancing the jobs they need with the education they desire.
Complete College America believes there is great reason for optimism ... and a clear path forward. With a little more support — and a lot of common sense — we can ensure that many more get the high-quality college education that will help them live productive and fulfilling lives. All Americans will share in the benefits of their success.
429 E. Vermont St. Suite 300Indianapolis, IN 46202
completecollege.org
Embargoed until December 1, 2014, 8 a.m., EST