foundations of algebra/algebra/math i curriculum map 2014-2015
TRANSCRIPT

Foundations of Algebra/Algebra/Math I Curriculum Map 2014-2015
*Standards N-Q.1, N-Q.2, N-Q.3 are not listed. These standards represent number sense and should be integrated throughout the units. *For each specific unit, learning targets are coded as F for Foundations or M for Math 1
6 Weeks Unit Unit Focus Common Core Math Standards
1 1 Units 1 and 2 can be interchanged or taught simultaneously.
Polynomials N-RN.1 Explain how the definition of the meaning of rational exponents follows from extending the properties of integer exponents to those values, allowing for a notation for radicals in terms of rational exponents. For example, we define 51/3 to be the cube root of 5 because we want (51/3)3 = 5(1/3)3 to hold, so (51/3)3 must equal 5. N-RN.2 Rewrite expressions involving radicals and rational exponents using the properties of exponents. Note: At this level, focus on fractional exponents with a numerator of 1. A-SSE.2 Use the structure of an expression to identify ways to rewrite it. For example, see x4 – y4 as (x2)2 – (y2)2, thus recognizing it as a difference of squares that can be factored as (x2 – y2)(x2 + y2). Perform arithmetic operations on polynomials. A-APR.1 Understand that polynomials form a system analogous to the integers, namely, they are closed under the operations of addition, subtraction, and multiplication; add, subtract, and multiply polynomials. Note: At this level, limit to addition and subtraction of quadratics and multiplication of linear expressions. G-GMD.1 Give an informal argument for the formulas for the circumference of a circle, area of a circle, volume of a cylinder, pyramid, and cone. Use dissection arguments, Cavalieri’s principle, and informal limit arguments. Note: Informal limit arguments are not the intent at this level
1 2 Solving Equations A-CED.1 Create equations and inequalities in one variable and use them to

Foundations of Algebra/Algebra/Math I Curriculum Map 2014-2015
in one variables Solving Linear Inequalities in one variables Solving Literal Equations
solve problems. Include equations arising from linear and quadratic functions, and simple rational and exponential functions. Note: At this level, focus on linear and exponential functions A-CED.2 Create equations in two or more variables to represent relationships between quantities; graph equations on coordinate axes with labels and scales. Note: At this level, focus on linear, exponential and quadratic. Limit to situations that involve evaluating exponential functions for integer inputs. A-CED.4 Rearrange formulas to highlight a quantity of interest, using the same reasoning as in solving equations. For example, rearrange Ohm’s law V = IR to highlight resistance R. Note: At this level, limit to formulas that are linear in the variable of interest, or to formulas involving squared or cubed variables. A-REI.1 Explain each step in solving a simple equation as following from the equality of numbers asserted at the previous step, starting from the assumption that the original equation has a solution. Construct a viable argument to justify a solution method. Solve equations and inequalities in one variable. A-REI.3 Solve linear equations and inequalities in one variable, including equations with coefficients represented by letters. G-GMD.3 Use volume formulas for cylinders, pyramids, cones, and spheres to solve problems.* Note: At this level, formulas for pyramids, cones and spheres will be given.
1 3 Data Analysis: Measures of Central Tendency Data Displays Data Dispersion
S-ID.1 Represent data with plots on the real number line (dot plots, histograms, and box plots). S-ID.2 Use statistics appropriate to the shape of the data distribution to compare center (median, mean) and spread (interquartile range, standard deviation) of two or more different data sets.

Foundations of Algebra/Algebra/Math I Curriculum Map 2014-2015
S-ID.3 Interpret differences in shape, center, and spread in the context of the data sets, accounting for possible effects of extreme data points (outliers). Summarize, represent, and interpret data on two categorical and quantitative variables. S-ID.5 Summarize categorical data for two categories in two-way frequency tables. Interpret relative frequencies in the context of the data (including joint, marginal, and conditional relative frequencies). Recognize possible associations and trends in the data.
1 4 Midpoint Distance Slope
G-CO.1 Know precise definitions of angle, circle, perpendicular line, parallel line, and line segment, based on the undefined notions of point, line, distance along a line G-GPE.4 Use coordinates to prove simple geometric theorems algebraically. For example, prove or disprove that a figure defined by four given points in the coordinate plane is a rectangle; prove or disprove that the point (1, √3) lies on the circle centered at the origin and containing the point (0, 2). G-GPE.5 Prove the slope criteria for parallel and perpendicular lines and use them to solve geometric problems (e.g., find the equation of a line parallel or perpendicular to a given line that passes through a given point). G-GPE.6 Find the point on a directed line segment between two given points that partitions the segment in a given ratio. Note: At this level, focus on finding the midpoint of a segment. G-GPE.7 Use coordinates to compute perimeters of polygons and areas of triangles and rectangles, e.g., using the distance formula.
2 5 Functions (Overview)
F-IF.1 Understand that a function from one set (called the domain) to another set (called the range) assigns to each element of the domain exactly one element of the range. If f is a function and x is an element of its domain, then

Foundations of Algebra/Algebra/Math I Curriculum Map 2014-2015
f(x) denotes the output of f corresponding to the input x. The graph of f is the graph of the equation y = f(x). F-IF.2 Use function notation, evaluate functions for inputs in their domains, and interpret statements that use function notation in terms of a context. Note: At this level, the focus is linear and exponential functions. F-IF.4 For a function that models a relationship between two quantities, interpret key features of graphs and tables in terms of the quantities, and sketch graphs showing key features given a verbal description of the relationship. Key features include: intercepts; intervals where the function is increasing, decreasing, positive, or negative; relative maximums and minimums; symmetries; F-IF.5 Relate the domain of a function to its graph and, where applicable, to the quantitative relationship it describes. For example, if the function h(n) gives the number of person-hours it takes to assemble n engines in a factory, then the positive integers would be an appropriate domain for the function. Note: At this level, focus on linear and exponential functions. F-IF.6 Calculate and interpret the average rate of change of a function (presented symbolically or as a table) over a specified interval. Estimate the rate of change from a graph. Note: At this level, focus on linear functions and exponential functions whose domain is a subset of the integers. A-REI.10 Understand that the graph of an equation in two variables is the set of all its solutions plotted in the coordinate plane, often forming a curve (which could be a line). Note: At this level, focus on linear and exponential equations.
2 6A Linear Functions A-REI.10 Understand that the graph of an equation in two variables is the set of all its solutions plotted in the coordinate plane, often forming a curve (which could be a line). Note: At this level, focus on linear and exponential equations. A-REI.12 Graph the solutions to a linear inequality in two variables as a half- plane (excluding the boundary in the case of a strict ine

Foundations of Algebra/Algebra/Math I Curriculum Map 2014-2015
quality), and graph the solution set to a system of linear inequalities in two variables as the intersection of the corresponding half-planes. F-IF.4 For a function that models a relationship between two quantities, interpret key features of graphs and tables in terms of the quantities, and sketch graphs showing key features given a verbal description of the relationship. Key features include: intercepts; intervals where the function is increasing, decreasing, positive, or negative; relative maximums and minimums; symmetries; F-IF.5 Relate the domain of a function to its graph and, where applicable, to the quantitative relationship it describes. For example, if the function h(n) gives the number of person-hours it takes to assemble n engines in a factory, then the positive integers would be an appropriate domain for the function. Note: At this level, focus on linear and exponential functions. F-IF.6 Calculate and interpret the average rate of change of a function (presented symbolically or as a table) over a specified interval. Estimate the rate of change from a graph. Note: At this level, focus on linear functions and exponential functions whose domain is a subset of the integers. F-IF.7 Graph functions expressed symbolically and show key features of the graph, by hand in simple cases and using technology for more complicated cases. a. Graph linear and quadratic functions and show intercepts, maxima, and minima. e. Graph exponential and logarithmic functions, showing intercepts and end behavior, and trigonometric functions, showing period, midline, and amplitude. Note: At this level, for part e, focus on exponential functions only. F-IF.8 Write a function defined by an expression in different but equivalent forms to reveal and explain different properties of the function. a. Use the process of factoring and completing the square in a quadratic

Foundations of Algebra/Algebra/Math I Curriculum Map 2014-2015
function to show zeros, extreme values, and symmetry of the graph, and interpret these in terms of a context. Note: At this level, only factoring expressions of the form ax2 + bx +c, is expected. Completing the square is not addressed at this level. b. Use the properties of exponents to interpret expressions for exponential functions. For example, identify percent rate of change in functions such as y = (1.02)t, y = (0.97)t , y = (1.01)12t, y = (1.2)t/10, and classify them as representing exponential growth or decay. F-IF.9 Compare properties of two functions each represented in a different way (algebraically, graphically, numerically in tables, or by verbal descriptions). For example, given a graph of one quadratic function and an algebraic expression for another, say which has the larger maximum. Note: At this level, focus on linear, exponential, and quadratic functions. F-LE.5 Interpret the parameters in a linear or exponential function in terms of a context F-LE.1 Distinguish between situations that can be modeled with linear functions and with exponential functions a. Prove that linear functions grow by equal differences over equal intervals, and that exponential functions grow by equal factors over equal intervals. b. Recognize situations in which one quantity changes at a constant rate per unit interval relative to another. c. Recognize situations in which a quantity grows or decays by a constant percent rate per unit interval relative to another. F-BF.3 Identify the effect on the graph of replacing f(x) by f(x) + k, k f(x), f(kx), and f(x + k) for specific values of k (both positive and negative); find the value of k given the graphs. Experiment with cases and illustrate an explanation of the effects on the graph using technology. Include recognizing even and odd

Foundations of Algebra/Algebra/Math I Curriculum Map 2014-2015
functions from their graphs and algebraic expressions for them. Note: At this level, limit to vertical and horizontal translations of linear and exponential functions. Even and odd functions are not addressed. S-ID.6 Represent data on two quantitative variables on a scatter plot, and describe how the variables are related.
1. Fit a function to the data; use functions fitted to data to solve problems in the context of the data. Use given functions or choose a function suggested by the context. Emphasize linear and exponential models.
2. Informally assess the fit of a function by plotting and analyzing residuals.
1. Fiit a linear function for a scatter plot that suggests a linear association. S-ID.7 Interpret the slope (rate of change) and the intercept (constant term) of a linear model in the context of the data. S-ID.8 Compute (using technology) and interpret the correlation coefficient of a linear fit. S-ID 9 Distinguish between correlation and causation.
2 6B Exponential Functions
A-REI.10 Understand that the graph of an equation in two variables is the set of all its solutions plotted in the coordinate plane, often forming a curve (which could be a line). Note: At this level, focus on linear and exponential equations. F-IF.4 For a function that models a relationship between two quantities, interpret key features of graphs and tables in terms of the quantities, and sketch graphs showing key features given a verbal description of the relationship. Key features include: intercepts; intervals where the function is increasing, decreasing, positive, or negative; relative maximums and minimums; symmetries; end behavior; and periodicity. Note: At this level, focus on linear, exponential and quadratic functions; no end behavior or periodicity. F-IF.5 Relate the domain of a function to its graph and, where applicable, to the quantitative relationship it describes. For example, if the function h(n) gives the

Foundations of Algebra/Algebra/Math I Curriculum Map 2014-2015
number of person-hours it takes to assemble n engines in a factory, then the positive integers would be an appropriate domain for the function. Note: At this level, focus on linear and exponential functions. F-IF.6 Calculate and interpret the average rate of change of a function (presented symbolically or as a table) over a specified interval. Estimate the rate of change from a graph. Note: At this level, focus on linear functions and exponential functions whose domain is a subset of the integers. F-IF.7 Graph functions expressed symbolically and show key features of the graph, by hand in simple cases and using technology for more complicated cases. a. Graph linear and quadratic functions and show intercepts, maxima, and minima. e. Graph exponential and logarithmic functions, showing intercepts and end behavior, and trigonometric functions, showing period, midline, and amplitude. Note: At this level, for part e, focus on exponential functions only. F-IF.8 Write a function defined by an expression in different but equivalent forms to reveal and explain different properties of the function. a. Use the process of factoring and completing the square in a quadratic function to show zeros, extreme values, and symmetry of the graph, and interpret these in terms of a context. Note: At this level, only factoring expressions of the form ax2 + bx +c, is expected. Completing the square is not addressed at this level. b. Use the properties of exponents to interpret expressions for exponential functions. For example, identify percent rate of change in functions such as y = (1.02)t, y = (0.97)t , y = (1.01)12t, y = (1.2)t/10, and classify them as representing exponential growth or decay. F-IF.9 Compare properties of two functions each represented in a different way (algebraically, graphically, numerically in tables, or by verbal descriptions). For

Foundations of Algebra/Algebra/Math I Curriculum Map 2014-2015
example, given a graph of one quadratic function and an algebraic expression for another, say which has the larger maximum. Note: At this level, focus on linear, exponential, and quadratic functions. F-LE.5 Interpret the parameters in a linear or exponential function in terms of a context F-LE.1 Distinguish between situations that can be modeled with linear functions and with exponential functions a. Prove that linear functions grow by equal differences over equal intervals, and that exponential functions grow by equal factors over equal intervals. b. Recognize situations in which one quantity changes at a constant rate per unit interval relative to another. c. Recognize situations in which a quantity grows or decays by a constant percent rate per unit interval relative to another. F-LE.2 Construct linear and exponential functions, including arithmetic and geometric sequences, given a graph, a description of a relationship, or two input-output pairs (include reading these from a table). F-LE.3 Observe using graphs and tables that a quantity increasing exponentially eventually exceeds a quantity increasing linearly, quadratically, or (more generally) as a polynomial function. Note: At this level, limit to linear, exponential, and quadratic functions; general polynomial functions are not addressed. F-BF.1 Write a function that describes a relationship between two quantities. a. Determine an explicit expression, a recursive process, or steps for calculation from a context. b. Combine standard function types using arithmetic operations. For example, build a function that models the temperature of a cooling body by adding a constant function to a decaying exponential, and relate these functions to the model. Note: At this level, limit to addition or subtraction of constant to linear, exponential or quadratic functions or addition of linear functions to linear or
Foundations of Algebra/Algebra/Math I Curriculum Map 2014-2015
quadratic functions. F-BF.2 Write arithmetic and geometric sequences both recursively and with an explicit formula, use them to model situations, and translate between the two forms. Note: At this level, formal recursive notation is not used. Instead, use of informal recursive notation (such as NEXT = NOW + 5 starting at 3) is intended. F-BF.3 Identify the effect on the graph of replacing f(x) by f(x) + k, k f(x), f(kx), and f(x + k) for specific values of k (both positive and negative); find the value of k given the graphs. Experiment with cases and illustrate an explanation of the effects on the graph using technology. Include recognizing even and odd functions from their graphs and algebraic expressions for them. Note: At this level, limit to vertical and horizontal translations of linear and exponential functions. Even and odd functions are not addressed.
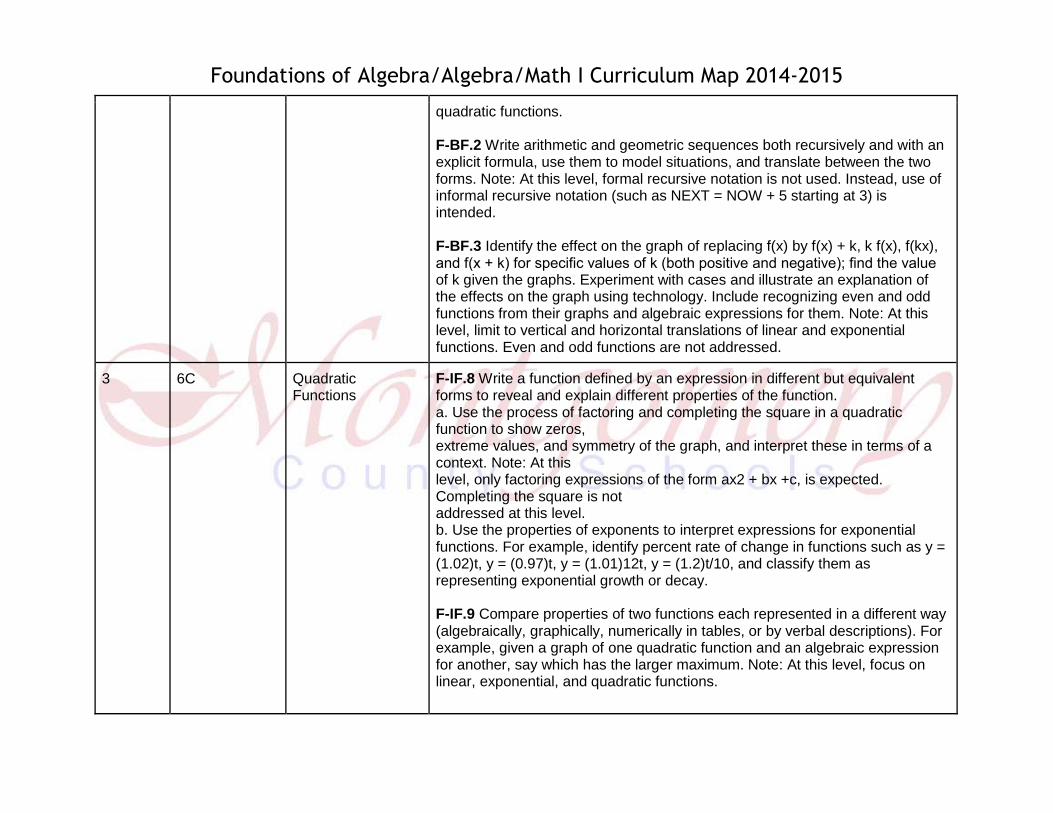
3 6C Quadratic Functions
F-IF.8 Write a function defined by an expression in different but equivalent forms to reveal and explain different properties of the function. a. Use the process of factoring and completing the square in a quadratic function to show zeros, extreme values, and symmetry of the graph, and interpret these in terms of a context. Note: At this level, only factoring expressions of the form ax2 + bx +c, is expected. Completing the square is not addressed at this level. b. Use the properties of exponents to interpret expressions for exponential functions. For example, identify percent rate of change in functions such as y = (1.02)t, y = (0.97)t, y = (1.01)12t, y = (1.2)t/10, and classify them as representing exponential growth or decay. F-IF.9 Compare properties of two functions each represented in a different way (algebraically, graphically, numerically in tables, or by verbal descriptions). For example, given a graph of one quadratic function and an algebraic expression for another, say which has the larger maximum. Note: At this level, focus on linear, exponential, and quadratic functions.

Foundations of Algebra/Algebra/Math I Curriculum Map 2014-2015
F-LE.3 Observe using graphs and tables that a quantity increasing exponentially eventually exceeds a quantity increasing linearly, quadratically, or (more generally) as a polynomial function. Note: At this level, limit to linear, exponential, and quadratic functions; general polynomial functions are not addressed. F-IF.4 For a function that models a relationship between two quantities, interpret key features of graphs and tables in terms of the quantities, and sketch graphs showing key features given a verbal description of the relationship. Key features include: intercepts; intervals where the function is increasing, decreasing, positive, or negative; relative maximums and minimums; symmetries; end behavior; and periodicity. Note: At this level, focus on linear, exponential and quadratic functions; no end behavior or periodicity.
3 7 Systems of Equations
A-REI.5 Prove that, given a system of two equations in two variables, replacing one equation by the sum of that equation and a multiple of the other produces a system with the same solutions. A-REI.6 Solve systems of linear equations exactly and approximately (e.g., with graphs), focusing on pairs of linear equations in two variables. A-REI.11 Explain why the x-coordinates of the points where the graphs of the equations y = f(x) and y = g(x) intersect are the solutions of the equation f(x) = g(x); find the solutions approximately, e.g., using technology to graph the functions, make tables of values, or find successive approximations. Include cases where f(x) and/or g(x) are linear, polynomial, rational, absolute value, exponential, and logarithmic functions. Note: At this level, focus on linear and exponential functions. A-REI.12 Graph the solutions to a linear inequality in two variables as a half- plane (excluding the boundary in the case of a strict inequality), and graph the solution set to a system of linear inequalities in two variables as the intersection of the corresponding half-planes.

Foundations of Algebra/Algebra/Math I Curriculum Map 2014-2015
A-CED.3 Represent constraints by equations or inequalities, and by systems of equations and/or inequalities, and interpret solutions as viable or non- viable options in a modeling context. For example, represent inequalities describing nutritional and cost constraints on combinations of different foods. Note: At this level, limit to linear equations and inequalities.

Foundations of Algebra/Algebra/Math I Curriculum Map 2014-2015
Unit: 1 Polynomials 6 weeks: 1
Standard Learning Target (F Targets are Foundational and M Targets are Math 1)
Focused Mathematical Practice
A-APR.1 Understand that polynomials form a system analogous to the integers, namely, they are closed under the operations of addition, subtraction, and multiplication; add, subtract, and multiply polynomials. Note: At this level, limit to addition and subtraction of quadratics and multiplication of linear A-SSE.2 Use the structure of an expression to identify ways to rewrite it. For example, see x4 – y4 as (x2)2 – (y2)2, thus recognizing it as a difference of squares that can be factored as (x2 – y2)(x2 + y2).
F1. I can explain and use the adding, subtracting and multiplying rules of polynomials. (combining like terms, adding/subtracting polynomials, monomials times monomials, power or a product, distribute a monomial times a polynomial, binomial distribution)
1. Make sense of problems and persevere in solving them. 3. Construct viable arguments and critique the reasoning of others. 6. Attend to precision. 7. Look for and make use of structure. 8. Look for and express regularity in repeated reasoning.
G-GMD.1 Give an informal argument for the formulas for the circumference of
F2. I can apply the properties of basic geometric shapes.
2. Reason abstractly and quantitatively. 4. Model with mathematics.

Foundations of Algebra/Algebra/Math I Curriculum Map 2014-2015
a circle, area of a circle, volume of a cylinder, pyramid, and cone. Use dissection arguments, Cavalieri’s principle, and informal limit arguments. Note: Informal limit arguments are not the intent at this level
7. Look for and make use of structure.
G-GMD.1 Give an informal argument for the formulas for the circumference of a circle, area of a circle, volume of a cylinder, pyramid, and cone. Use dissection arguments, Cavalieri’s principle, and informal limit arguments. Note: Informal limit arguments are not the intent at this level A-APR.1 Understand that polynomials form a system analogous to the integers, namely, they are closed under the operations of addition, subtraction, and multiplication; add, subtract, and multiply polynomials. Note: At this level, limit to addition and subtraction of quadratics and multiplication of linear A-SSE.2 Use the structure of an expression to identify ways to rewrite it. For example, see x4 – y4 as (x2)2 – (y2)2, thus recognizing it as a difference of squares that can be factored as (x2 – y2)(x2 + y2).
F3. I can apply the adding, subtracting and multiplying rules of polynomials to applications problems involving the area and perimeter of polygons and circles as well as operating with polynomials within context. Ex. The expression (‐ 6x2 + 2x – 9) represents the population of mosquitoes near a swamp, while the expression (10x2 + 3x – 8) represents the population of mosquitoes near a pond. Write a simplified equivalent expression that represents the total population of mosquitoes. Extension Ex.: Write a simplified equivalent expression that represents the total population of mosquitoes, if the populations of mosquitoes near the swamp triples, and the population of mosquitoes near the pond doubled.
1. Make sense of problems and persevere in solving them. 2. Reason abstractly and quantitatively. 3. Construct viable arguments and critique the reasoning of others. 4. Model with mathematics. 6. Attend to precision. 7. Look for and make use of structure. 8. Look for and express regularity in repeated reasoning.

Foundations of Algebra/Algebra/Math I Curriculum Map 2014-2015
N-RN.1 Explain how the definition of the meaning of rational exponents follows from extending the properties of integer exponents to those values, allowing for a notation for radicals in terms of rational exponents. For example, we define 51/3 to be the cube root of 5 because we want (51/3)3 = 5(1/3)3 to hold, so (51/3)3 must equal 5. N-RN.2 Rewrite expressions involving radicals and rational exponents using the properties of exponents. Note: At this level, focus on fractional exponents with a numerator of 1.
M4. Using the power of a product rule, I can simplify and convert between rational exponents and radicals.
3. Construct viable arguments and critique the reasoning of others. 6. Attend to precision. 7. Look for and make use of structure. 8. Look for and express regularity in repeated reasoning.

Foundations of Algebra/Algebra/Math I Curriculum Map 2014-2015
Unit: 2 Solving Equations 6 weeks: 1
Standard Learning Target (F Targets are Foundational and M Targets are Math 1)
Focused Mathematical Practice
A-REI.3 Solve linear equations and inequalities in one variable, including equations with coefficients represented by letters. A-CED.1 Create equations and inequalities in one variable and use them to solve problems. Include equations arising from linear and quadratic functions, and simple rational and exponential functions. Note: At this level, focus on linear and exponential functions. A-REI.1 Explain each step in solving a simple equation as following from the equality of numbers asserted at the previous step, starting from the assumption that the original equation has a solution. Construct a viable argument to justify a solution method.
F1. I can solve linear equations in one variable by hand and using the equation solver on the calculator. (could also integrate finding solutions by graphing or using the table of values)
1. Make sense of problems and persevere in solving them. 3. Construct viable arguments and critique the reasoning of others. 6. Attend to precision. 8. Look for and express regularity in repeated reasoning.
A-CED.1 Create equations and inequalities in one variable and use them to solve problems. Include equations arising from linear and quadratic functions, and simple rational and exponential functions. Note: At this level, focus on linear and exponential functions. G-GMD.3 Use volume formulas for cylinders, pyramids, cones, and spheres to solve problems.* Note: At this level, formulas for pyramids, cones and spheres will be given.
F2. I can set up, solve and explain the solutions of applications of linear equations in one variable by hand and using the equation solver on the calculator. (could also integrate finding solutions by graphing or using the table of values)
1. Make sense of problems and persevere in solving them. 2. Reason abstractly and quantitatively. 3. Construct viable arguments and critique the reasoning of others. 4. Model with mathematics. 5. Use appropriate tools strategically. 6. Attend to precision. 7. Look for and make use of structure. 8. Look for and express regularity in repeated reasoning.

Foundations of Algebra/Algebra/Math I Curriculum Map 2014-2015
A-CED.4 Rearrange formulas to highlight a quantity of interest, using the same reasoning as in solving equations. For example, rearrange Ohm’s law V = IR to highlight resistance R. Note: At this level, limit to formulas that are linear in the variable of interest, or to formulas involving squared or cubed variables. A-REI.3 Solve linear equations and inequalities in one variable, including equations with coefficients represented by letters.
M3. I can solve literal equations with and without context. (focus on context)
1. Make sense of problems and persevere in solving them. 2. Reason abstractly and quantitatively. 3. Construct viable arguments and critique the reasoning of others. 4. Model with mathematics. 5. Use appropriate tools strategically. 6. Attend to precision. 7. Look for and make use of structure. 8. Look for and express regularity in repeated reasoning.
A-REI.3 Solve linear equations and inequalities in one variable, including equations with coefficients represented by letters.
F3. I can solve linear inequalities in one variable.
1. Make sense of problems and persevere in solving them. 3. Construct viable arguments and critique the reasoning of others. 6. Attend to precision. 8. Look for and express regularity in repeated reasoning.
A-CED.1 Create equations and inequalities in one variable and use them to solve problems. Include equations arising from linear and quadratic functions, and simple rational and exponential functions. Note: At this level, focus on linear and exponential functions.
M4. I can set up, solve and explain the solutions of applications of linear inequalities in one variable.
1. Make sense of problems and persevere in solving them. 2. Reason abstractly and quantitatively. 3. Construct viable arguments and critique the reasoning of others. 4. Model with mathematics. 5. Use appropriate tools strategically. 6. Attend to precision. 7. Look for and make use of structure. 8. Look for and express regularity in repeated reasoning.

Foundations of Algebra/Algebra/Math I Curriculum Map 2014-2015
Unit: 3 Data Analysis 6 weeks: Foundations - 2nd 6
weeks/Math 1 - 1st 6 weeks
Standard Learning Target (F Targets are Foundational and M Targets are Math 1)
Focused Mathematical Practice
S-ID.1 Represent data with plots on the real number line (dot plots, histograms, and box plots). S-ID.2 Use statistics appropriate to the shape of the data distribution to compare center (median, mean) and spread (interquartile range, standard deviation) of two or more different data sets. S-ID.3 Interpret differences in shape, center, and spread in the context of the data sets, accounting for possible effects of extreme data points (outliers). Summarize, represent, and interpret data on two categorical and quantitative variables.
F1. I can explain and find the mean, median, mode, range, outliers, inter-quartile range, standard deviation and variance of a data set by hand and using the STAT function on the calculator.
1. Make sense of problems and persevere in solving them. 3. Construct viable arguments and critique the reasoning of others. 4. Model with mathematics. 6. Attend to precision.
S-ID.2 Use statistics appropriate to the shape of the data distribution to compare center (median, mean) and spread (interquartile range, standard deviation) of two or more different data sets.
F2. I can explain the concepts of “measure of central tendency” and “dispersion of data”.
2. Reason abstractly and quantitatively. 3. Construct viable arguments and critique the reasoning of others.
S-ID.3 Interpret differences in shape, F3. I can interpret data displays and make 2. Reason abstractly and

Foundations of Algebra/Algebra/Math I Curriculum Map 2014-2015
center, and spread in the context of the data sets, accounting for possible effects of extreme data points (outliers). Summarize, represent, and interpret data on two categorical and quantitative variables.
accurate statements about skew and the variability of the data.
quantitatively. 3. Construct viable arguments and critique the reasoning of others. 4. Model with mathematics.
S-ID.3 Interpret differences in shape, center, and spread in the context of the data sets, accounting for possible effects of extreme data points (outliers). Summarize, represent, and interpret data on two categorical and quantitative variables.
F4. I can explain all of the parts of a box and whisker plot including: lower extreme or minimum, upper extreme or maximum, first quartile or lower quartile, median or mid-quartile, third quartile or upper quartile, 5 number summary(including percentiles), inter-quartile range, range and outliers.
2. Reason abstractly and quantitatively. 3. Construct viable arguments and critique the reasoning of others. 4. Model with mathematics.
S-ID.5 Summarize categorical data for two categories in two-way frequency tables. Interpret relative frequencies in the context of the data (including joint, marginal, and conditional relative frequencies). Recognize possible associations and trends in the data.
F5. I can interpret and explain data from a given frequency table or histogram.
2. Reason abstractly and quantitatively. 3. Construct viable arguments and critique the reasoning of others. 4. Model with mathematics.
S-ID.3 Interpret differences in shape, center, and spread in the context of the data sets, accounting for possible effects of extreme data points (outliers). Summarize, represent, and interpret data on two categorical and quantitative variables.
M1. I can explain the effect on the measures of central tendency, data displays and dispersion of data when adding or removing data points from a data set.
1. Make sense of problems and persevere in solving them. 2. Reason abstractly and quantitatively. 3. Construct viable arguments and critique the reasoning of others. 4. Model with mathematics. 5. Use appropriate tools strategically. 6. Attend to precision. 7. Look for and make use of structure. 8. Look for and express regularity in repeated reasoning.

Foundations of Algebra/Algebra/Math I Curriculum Map 2014-2015
S-ID.2 Use statistics appropriate to the shape of the data distribution to compare center (median, mean) and spread (interquartile range, standard deviation) of two or more different data sets. S-ID.3 Interpret differences in shape, center, and spread in the context of the data sets, accounting for possible effects of extreme data points (outliers). Summarize, represent, and interpret data on two categorical and quantitative variables.
M2. I can explain the best times to use mean, median or mode when given information about a data set.
2. Reason abstractly and quantitatively.
S-ID.3 Interpret differences in shape, center, and spread in the context of the data sets, accounting for possible effects of extreme data points (outliers). Summarize, represent, and interpret data on two categorical and quantitative variables.
M3. I can compare and contrast data sets and make statements about the measures of central tendency, the data displays of each data set and the dispersion of the data within the data set.
1. Make sense of problems and persevere in solving them. 2. Reason abstractly and quantitatively. 3. Construct viable arguments and critique the reasoning of others. 4. Model with mathematics. 5. Use appropriate tools strategically. 6. Attend to precision. 7. Look for and make use of structure. 8. Look for and express regularity in repeated reasoning.

Foundations of Algebra/Algebra/Math I Curriculum Map 2014-2015
Unit: 4 Midpoint/Distance/Slope 6 weeks: 2
Standard Learning Target (F Targets are Foundational and M Targets are Math 1)
Focused Mathematical Practice
FOUNDATIONAL TO SUPPORT REMAINDER OF LEARNING TARGETS.
F1. I can determine when to use the midpoint, distance or slope formulas to solve problems and can explain the concept of each. (I can also use the given midpoint and one given endpoint in order to find the other endpoint)
1. Make sense of problems and persevere in solving them. 3. Construct viable arguments and critique the reasoning of others. 4. Model with mathematics. 6. Attend to precision.
G-GPE.7 Use coordinates to compute perimeters of polygons and areas of triangles and rectangles, e.g., using the distance formula.
F2. I can use the midpoint and distance formulas to compute the area or perimeter of figures on the coordinate plane.
1. Make sense of problems and persevere in solving them. 4. Model with mathematics. 6. Attend to precision.
G-CO.1 Know precise definitions of angle, circle, perpendicular line, parallel line, and line segment, based on the undefined notions of point, line, distance along a line. G-GPE.4 Use coordinates to prove simple geometric theorems algebraically. For example, prove or disprove that a figure defined by four given points in the coordinate plane is a rectangle; prove or disprove that the point (1, √3) lies on the circle centered at the origin and containing the point (0, 2).
M1. I can use the midpoint, distance and slope formulas with geometric properties to prove or disprove a given polygon or circle lies at given points on the coordinate plane.
1. Make sense of problems and persevere in solving them. 2. Reason abstractly and quantitatively. 3. Construct viable arguments and critique the reasoning of others. 4. Model with mathematics. 5. Use appropriate tools strategically. 6. Attend to precision. 7. Look for and make use of structure. 8. Look for and express regularity in repeated reasoning.

Foundations of Algebra/Algebra/Math I Curriculum Map 2014-2015
G-GPE.5 Prove the slope criteria for parallel and perpendicular lines and use them to solve geometric problems (e.g., find the equation of a line parallel or perpendicular to a given line that passes through a given point).
Foundations of Algebra/Algebra/Math I Curriculum Map 2014-2015
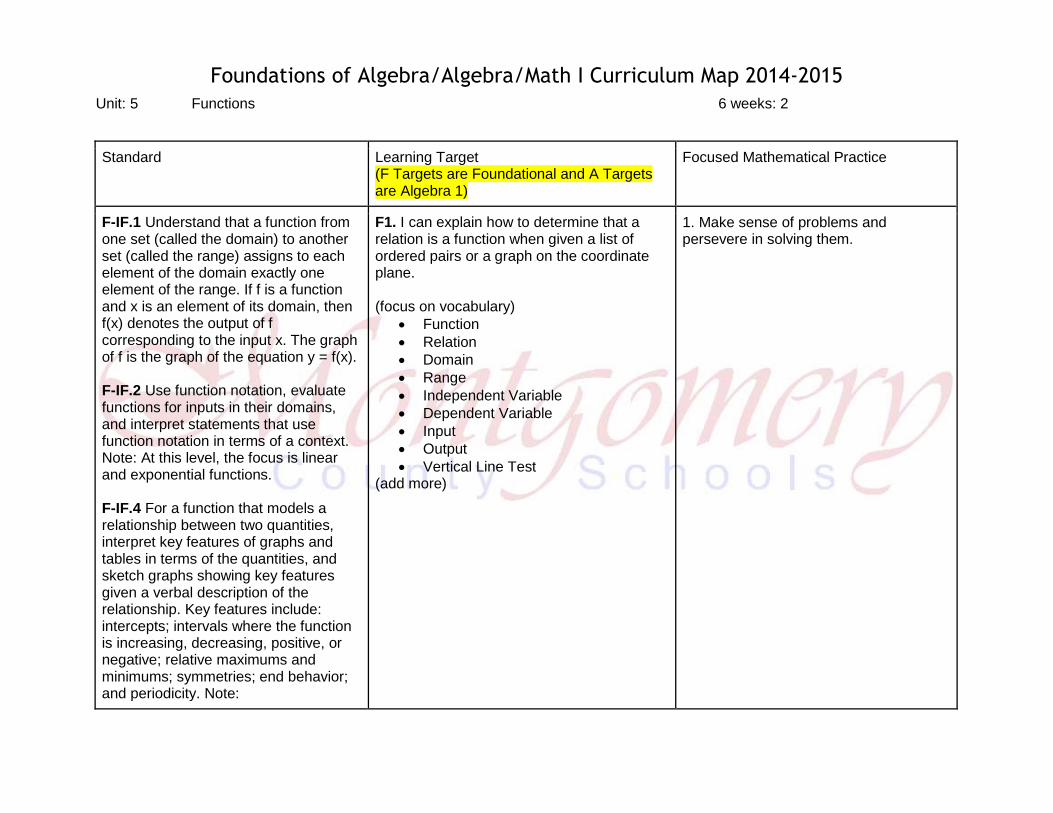
Unit: 5 Functions 6 weeks: 2
Standard Learning Target (F Targets are Foundational and A Targets are Algebra 1)
Focused Mathematical Practice
F-IF.1 Understand that a function from one set (called the domain) to another set (called the range) assigns to each element of the domain exactly one element of the range. If f is a function and x is an element of its domain, then f(x) denotes the output of f corresponding to the input x. The graph of f is the graph of the equation y = f(x). F-IF.2 Use function notation, evaluate functions for inputs in their domains, and interpret statements that use function notation in terms of a context. Note: At this level, the focus is linear and exponential functions. F-IF.4 For a function that models a relationship between two quantities, interpret key features of graphs and tables in terms of the quantities, and sketch graphs showing key features given a verbal description of the relationship. Key features include: intercepts; intervals where the function is increasing, decreasing, positive, or negative; relative maximums and minimums; symmetries; end behavior; and periodicity. Note:
F1. I can explain how to determine that a relation is a function when given a list of ordered pairs or a graph on the coordinate plane. (focus on vocabulary)
Function
Relation
Domain
Range
Independent Variable
Dependent Variable
Input
Output
Vertical Line Test (add more)
1. Make sense of problems and persevere in solving them.

Foundations of Algebra/Algebra/Math I Curriculum Map 2014-2015
At this level, focus on linear, exponential and quadratic functions; no end behavior or periodicity. F-IF.5 Relate the domain of a function to its graph and, where applicable, to the quantitative relationship it describes. For example, if the function h(n) gives the number of person-hours it takes to assemble n engines in a factory, then the positive integers would be an appropriate domain for the function. Note: At this level, focus on linear and exponential functions. F-IF.6 Calculate and interpret the average rate of change of a function (presented symbolically or as a table) over a specified interval. Estimate the rate of change from a graph. Note: At this level, focus on linear functions and exponential functions whose domain is a subset of the integers.
F-IF.2 Use function notation, evaluate functions for inputs in their domains, and interpret statements that use function notation in terms of a context. Note: At this level, the focus is linear and exponential functions.
F2. I can use and explain function notation both with and without context. Ex: Given f(x) = 3x + 8, find f(4). Ex: Given f(x) = 10x - 16, find f(x) = 24
1. Make sense of problems and persevere in solving them. 2. Reason abstractly and quantitatively. 3. Construct viable arguments and critique the reasoning of others. 4. Model with mathematics. 6. Attend to precision. 7. Look for and make use of structure. 8. Look for and express regularity in repeated reasoning.

Foundations of Algebra/Algebra/Math I Curriculum Map 2014-2015
F-IF.5 Relate the domain of a function to its graph and, where applicable, to the quantitative relationship it describes. For example, if the function h(n) gives the number of person-hours it takes to assemble n engines in a factory, then the positive integers would be an appropriate domain for the function. Note: At this level, focus on linear and exponential functions. A-REI.10 Understand that the graph of an equation in two variables is the set of all its solutions plotted in the coordinate plane, often forming a curve (which could be a line). Note: At this level, focus on linear and exponential equations.
F3. I can determine solutions and non-solutions of functions when given a graph, table, verbal description or an equation.
1. Make sense of problems and persevere in solving them. 2. Reason abstractly and quantitatively. 4. Model with mathematics. 5. Use appropriate tools strategically. 6. Attend to precision. 7. Look for and make use of structure.
F-IF.4 For a function that models a relationship between two quantities, interpret key features of graphs and tables in terms of the quantities, and sketch graphs showing key features given a verbal description of the relationship. Key features include: intercepts; intervals where the function is increasing, decreasing, positive, or negative; relative maximums and minimums; symmetries; end behavior; and periodicity. Note: At this level, focus on linear, exponential and quadratic functions; no end behavior or periodicity.
F4. I can explain the differences in equations and graphs of linear, exponential and quadratic functions including the shape, direction and intervals of increase and decrease. (without context)
1. Make sense of problems and persevere in solving them. 2. Reason abstractly and quantitatively. 3. Construct viable arguments and critique the reasoning of others. 4. Model with mathematics. 5. Use appropriate tools strategically. 6. Attend to precision. 7. Look for and make use of structure. 8. Look for and express regularity in repeated reasoning.

Foundations of Algebra/Algebra/Math I Curriculum Map 2014-2015
A-REI.10 Understand that the graph of an equation in two variables is the set of all its solutions plotted in the coordinate plane, often forming a curve (which could be a line). Note: At this level, focus on linear and exponential equations.
F5. I can interpret ordered pair solutions in context.
1. Make sense of problems and persevere in solving them. 2. Reason abstractly and quantitatively. 3. Construct viable arguments and critique the reasoning of others. 6. Attend to precision. 7. Look for and make use of structure.
F-IF.5 Relate the domain of a function to its graph and, where applicable, to the quantitative relationship it describes. For example, if the function h(n) gives the number of person-hours it takes to assemble n engines in a factory, then the positive integers would be an appropriate domain for the function. Note: At this level, focus on linear and exponential functions.
M6. I can explain, from context, the appropriate domain and range of a function as well as intervals of increase and decrease as they relate to the context.
1. Make sense of problems and persevere in solving them. 2. Reason abstractly and quantitatively. 3. Construct viable arguments and critique the reasoning of others. 6. Attend to precision. 7. Look for and make use of structure. 8. Look for and express regularity in repeated reasoning.

Foundations of Algebra/Algebra/Math I Curriculum Map 2014-2015
Unit: 6 A Linear Functions 6 weeks: Foundations 3rd six weeks and Math 1 2nd six weeks
Standard Learning Target (F Targets are Foundational and M Targets are Math 1)
Focused Mathematical Practice
F-IF.6 Calculate and interpret the average rate of change of a function (presented symbolically or as a table) over a specified interval. Estimate the rate of change from a graph. Note: At this level, focus on linear functions and exponential functions whose domain is a subset of the integers. F-LE.1 Distinguish between situations that can be modeled with linear functions and with exponential functions a. Prove that linear functions grow by equal differences over equal intervals, and that exponential functions grow by equal factors over equal intervals. b. Recognize situations in which one quantity changes at a constant rate per unit interval relative to another. c. Recognize situations in which a quantity grows or decays by a constant percent rate per unit interval relative to another.
F1. I can explain and illustrate the fact that linear functions change at constant rates or by constant amounts. (includes Now/Next statements)
1. Make sense of problems and persevere in solving them. 2. Reason abstractly and quantitatively. 3. Construct viable arguments and critique the reasoning of others. 4. Model with mathematics. 7. Look for and make use of structure. 8. Look for and express regularity in repeated reasoning.
F-IF.4 For a function that models a relationship between two quantities, interpret key features of graphs and tables in terms of the quantities, and sketch graphs showing key features
F2. I can write equations in slope intercept form when given: two points, a point and the slope, the slope and y intercept, a graph, a table of values/list of ordered pairs. (Both with and without context)
1. Make sense of problems and persevere in solving them. 2. Reason abstractly and quantitatively. 3. Construct viable arguments and critique the reasoning of others.

Foundations of Algebra/Algebra/Math I Curriculum Map 2014-2015
given a verbal description of the relationship. Key features include: intercepts; intervals where the function is increasing, decreasing, positive, or negative; relative maximums and minimums; symmetries; end behavior; and periodicity. Note: At this level, focus on linear, exponential and quadratic functions; no end behavior or periodicity. F-IF.7 Graph functions expressed symbolically and show key features of the graph, by hand in simple cases and using technology for more complicated cases. F-IF.8 Write a function defined by an expression in different but equivalent forms to reveal and explain different properties of the function. F-IF.9 Compare properties of two functions each represented in a different way (algebraically, graphically, numerically in tables, or by verbal descriptions). For example, given a graph of one quadratic function and an algebraic expression for another, say which has the larger maximum. Note: At this level, focus on linear, exponential, and quadratic functions. F-LE.5 Interpret the parameters in a linear or exponential function in terms of a context
4. Model with mathematics. 5. Use appropriate tools strategically. 6. Attend to precision. 7. Look for and make use of structure. 8. Look for and express regularity in repeated reasoning.

Foundations of Algebra/Algebra/Math I Curriculum Map 2014-2015
F-IF.9 Compare properties of two functions each represented in a different way (algebraically, graphically, numerically in tables, or by verbal descriptions). For example, given a graph of one quadratic function and an algebraic expression for another, say which has the larger maximum. Note: At this level, focus on linear, exponential, and quadratic functions. F-LE.5 Interpret the parameters in a linear or exponential function in terms of a context S-ID.7 Interpret the slope (rate of change) and the intercept (constant term) of a linear model in the context of the data.
F3. I can, from context, determine and interpret the slope, y intercept, x intercept and ordered pair solutions from a graph, table of values or verbal representation.
1. Make sense of problems and persevere in solving them. 2. Reason abstractly and quantitatively. 3. Construct viable arguments and critique the reasoning of others. 4. Model with mathematics. 5. Use appropriate tools strategically. 6. Attend to precision. 7. Look for and make use of structure. 8. Look for and express regularity in repeated reasoning.
S-ID.6 Represent data on two quantitative variables on a scatter plot, and describe how the variables are related. 1. Fit a function to the data; use functions fitted to data to solve problems in the context of the data. Use given functions or choose a function suggested by the context. Emphasize linear and exponential models. 2. Informally assess the fit of a function by plotting and analyzing residuals. Note: At this level, for part b, focus on linear models. 1. Fit a linear function for a scatter
F4. I can explain the difference in a line of best fit and an “exact” linear function.
2. Reason abstractly and quantitatively. 3. Construct viable arguments and critique the reasoning of others. 4. Model with mathematics. 5. Use appropriate tools strategically. 7. Look for and make use of structure.

Foundations of Algebra/Algebra/Math I Curriculum Map 2014-2015
plot that suggests a linear association.
S-ID.6 Represent data on two quantitative variables on a scatter plot, and describe how the variables are related. 1. Fit a function to the data; use functions fitted to data to solve problems in the context of the data. Use given functions or choose a function suggested by the context. Emphasize linear and exponential models. 2. Informally assess the fit of a function by plotting and analyzing residuals. Note: At this level, for part b, focus on linear models. 1. Fit a linear function for a scatter plot that suggests a linear association. S-ID.7 Interpret the slope (rate of change) and the intercept (constant term) of a linear model in the context of the data.
F5. I can find the equation of, predict from, and interpret all parts of the line of best fit. (Teach F5 and F6 simultaneously)
1. Make sense of problems and persevere in solving them. 2. Reason abstractly and quantitatively. 3. Construct viable arguments and critique the reasoning of others. 4. Model with mathematics. 5. Use appropriate tools strategically. 6. Attend to precision. 7. Look for and make use of structure. 8. Look for and express regularity in repeated reasoning.
S-ID.8 Compute (using technology) and interpret the correlation coefficient of a linear fit. S-ID 9 Distinguish between correlation and causation.
F6. I can find and interpret the correlation coefficient of a data set and use this to explain the closeness of fit of the data to the line of best fit.
2. Reason abstractly and quantitatively. 3. Construct viable arguments and critique the reasoning of others. 7. Look for and make use of structure. 8. Look for and express regularity in repeated reasoning.
F-IF.9 Compare properties of two functions each represented in a different way (algebraically, graphically,
F7. I can compare and contrast two linear functions when given a table of values, a graph, an equation or a verbal
1. Make sense of problems and persevere in solving them. 2. Reason abstractly and quantitatively.

Foundations of Algebra/Algebra/Math I Curriculum Map 2014-2015
numerically in tables, or by verbal descriptions). For example, given a graph of one quadratic function and an algebraic expression for another, say which has the larger maximum. Note: At this level, focus on linear, exponential, and quadratic functions.
representation. 3. Construct viable arguments and critique the reasoning of others. 4. Model with mathematics. 5. Use appropriate tools strategically. 6. Attend to precision. 7. Look for and make use of structure. 8. Look for and express regularity in repeated reasoning.
F-LE.5 Interpret the parameters in a linear or exponential function in terms of a context F-BF.1 Write a function that describes a relationship between two quantities.★ a. Combine standard function types using arithmetic operations. For example, build a function that models the temperature of a cooling body by adding a constant function to a decaying exponential, and relate these functions to the model.
M1. I can add, subtract and multiply values to linear functions and discuss the effects the change has in terms of the context, equation, table of values and graph of the function.
1. Make sense of problems and persevere in solving them. 2. Reason abstractly and quantitatively. 3. Construct viable arguments and critique the reasoning of others. 4. Model with mathematics. 5. Use appropriate tools strategically. 6. Attend to precision. 7. Look for and make use of structure. 8. Look for and express regularity in repeated reasoning.
A-REI.12 Graph the solutions to a linear inequality in two variables as a half- plane (excluding the boundary in the case of a strict inequality), and graph the solution set to a system of linear inequalities in two variables as the intersection of the corresponding half-planes.
M2. I can graph and explain solutions of a two variable linear inequality from context. (Move to Systems Unit)
1. Make sense of problems and persevere in solving them. 2. Reason abstractly and quantitatively. 3. Construct viable arguments and critique the reasoning of others. 4. Model with mathematics. 5. Use appropriate tools strategically. 6. Attend to precision. 7. Look for and make use of structure. 8. Look for and express regularity in repeated reasoning.

Foundations of Algebra/Algebra/Math I Curriculum Map 2014-2015
Unit: 6B Exponential Functions Six Weeks: 3
Standard Learning Target (F Targets are Foundational and M Targets are Math 1)
Focused Mathematical Practice
F-LE.1 Distinguish between situations that can be modeled with linear functions and with exponential functions a. Prove that linear functions grow by equal differences over equal intervals, and that exponential functions grow by equal factors over equal intervals. b. Recognize situations in which one quantity changes at a constant rate per unit interval relative to another. c. Recognize situations in which a quantity grows or decays by a constant percent rate per unit interval relative to another.
F1. I can explain and illustrate the fact that exponential functions grow or decay at equal factors (by multiplication).
2. Reason abstractly and quantitatively. 3. Construct viable arguments and critique the reasoning of others. 4. Model with mathematics. 6. Attend to precision. 7. Look for and make use of structure. 8. Look for and express regularity in repeated reasoning.
F-IF.7 Graph functions expressed symbolically and show key features of the graph, by hand in simple cases and using technology for more complicated cases. a. Graph linear and quadratic functions and show intercepts, maxima, and minima. e. Graph exponential and logarithmic functions, showing intercepts and end behavior, and trigonometric functions, showing period, midline, and amplitude. F-IF.4 For a function that models a relationship between two quantities, interpret key features of graphs and tables in terms of the quantities, and sketch graphs showing key features given a verbal description of the relationship. Key features include: intercepts; intervals where the function is increasing,
F2. I can write equations in exponential form when given: two points, a graph, a table of values/list of ordered pairs (geometric sequence) or a verbal representation. (Both with and without context)
1. Make sense of problems and persevere in solving them. 2. Reason abstractly and quantitatively. 3. Construct viable arguments and critique the reasoning of others. 4. Model with mathematics. 5. Use appropriate tools strategically. 6. Attend to precision. 7. Look for and make use of structure. 8. Look for and express regularity in repeated reasoning.

Foundations of Algebra/Algebra/Math I Curriculum Map 2014-2015
decreasing, positive, or negative; relative maximums and minimums; symmetries
F-IF.9 Compare properties of two functions each represented in a different way (algebraically, graphically, numerically in tables, or by verbal descriptions). For example, given a graph of one quadratic function and an algebraic expression for another, say which has the larger maximum. Note: At this level, focus on linear, exponential, and quadratic functions F-LE.5 Interpret the parameters in a linear or exponential function in terms of a context
F3. I can, from context, determine and interpret the rate of change, y intercept, and ordered pair solutions from a graph, table of values or verbal representation.
2. Reason abstractly and quantitatively. 3. Construct viable arguments and critique the reasoning of others. 4. Model with mathematics. 5. Use appropriate tools strategically. 6. Attend to precision. 7. Look for and make use of structure. 8. Look for and express regularity in repeated reasoning.
A-REI.10 Understand that the graph of an equation in two variables is the set of all its solutions plotted in the coordinate plane, often forming a curve (which could be a line). Note: At this level, focus on linear and exponential equations. F-IF.6 Calculate and interpret the average rate of change of a function (presented symbolically or as a table) over a specified interval. Estimate the rate of change from a graph. Note: At this level, focus on linear functions and exponential functions whose domain is a subset of the integers. F-LE.5 Interpret the parameters in a linear or exponential function in terms of a context F-LE.1 Distinguish between situations that can be modeled with linear functions and with exponential functions a. Prove that linear functions grow by equal differences over equal intervals, and that exponential
F4. I can explain how to tell the difference between a line of best fit and exponential best fitting curve.
1. Make sense of problems and persevere in solving them. 2. Reason abstractly and quantitatively. 3. Construct viable arguments and critique the reasoning of others. 4. Model with mathematics. 5. Use appropriate tools strategically. 6. Attend to precision. 7. Look for and make use of structure. 8. Look for and express regularity in repeated reasoning.

Foundations of Algebra/Algebra/Math I Curriculum Map 2014-2015
functions grow by equal factors over equal intervals. b. Recognize situations in which one quantity changes at a constant rate per unit interval relative to another. c. Recognize situations in which a quantity grows or decays by a constant percent rate per unit interval relative to another.
S-ID.6 Represent data on two quantitative variables on a scatter plot, and describe how the variables are related.
1. Fit a function to the data; use functions fitted to data to solve problems in the context of the data. Use given functions or choose a function suggested by the context. Emphasize linear and exponential models.
2. Informally assess the fit of a function by plotting and analyzing residuals.
F5. I can find the equation of, predict from, and interpret all parts of the exponential best fitting curve.
1. Make sense of problems and persevere in solving them. 2. Reason abstractly and quantitatively. 3. Construct viable arguments and critique the reasoning of others. 4. Model with mathematics. 5. Use appropriate tools strategically. 6. Attend to precision. 7. Look for and make use of structure. 8. Look for and express regularity in repeated reasoning.
F-IF.7 Graph functions expressed symbolically and show key features of the graph, by hand in simple cases and using technology for more complicated cases.
F6. I can interpret the key features of a graph of an exponential function.
2. Reason abstractly and quantitatively. 3. Construct viable arguments and critique the reasoning of others. 6. Attend to precision. 7. Look for and make use of structure. 8. Look for and express regularity in repeated reasoning.
F-IF.6 Calculate and interpret the average rate of change of a function (presented symbolically or as a table) over a specified interval. Estimate the rate of change from a graph. Note: At this level, focus on linear functions and exponential functions whose domain is a subset of the integers.
F7. I can find and explain the average rate of change from a data set or a graph.
1. Make sense of problems and persevere in solving them. 2. Reason abstractly and quantitatively. 3. Construct viable arguments and critique the reasoning of others. 6. Attend to precision. 7. Look for and make use of structure.

Foundations of Algebra/Algebra/Math I Curriculum Map 2014-2015
F-IF.4 For a function that models a relationship between two quantities, interpret key features of graphs and tables in terms of the quantities, and sketch graphs showing key features given a verbal description of the relationship. Key features include: intercepts; intervals where the function is increasing, decreasing, positive, or negative; relative maximums and minimums; symmetries; F-IF.9 Compare properties of two functions each represented in a different way (algebraically, graphically, numerically in tables, or by verbal descriptions). For example, given a graph of one quadratic function and an algebraic expression for another, say which has the larger maximum. Note: At this level, focus on linear, exponential, and quadratic functions. F-LE.5 Interpret the parameters in a linear or exponential function in terms of a context F-LE.1 Distinguish between situations that can be modeled with linear functions and with exponential functions a. Prove that linear functions grow by equal differences over equal intervals, and that exponential functions grow by equal factors over equal intervals. b. Recognize situations in which one quantity changes at a constant rate per unit interval relative to another. c. Recognize situations in which a quantity grows or decays by a constant percent rate per unit interval relative to another.
F8. I can compare and contrast two or more exponential functions when given graphs, equations, ordered pairs or verbal representations.
1. Make sense of problems and persevere in solving them. 2. Reason abstractly and quantitatively. 3. Construct viable arguments and critique the reasoning of others. 4. Model with mathematics. 5. Use appropriate tools strategically. 6. Attend to precision. 7. Look for and make use of structure. 8. Look for and express regularity in repeated reasoning.
F-IF.9 Compare properties of two functions each represented in a different way (algebraically,
F9. I can compare and contrast linear and exponential
1. Make sense of problems and persevere in solving them.

Foundations of Algebra/Algebra/Math I Curriculum Map 2014-2015
graphically, numerically in tables, or by verbal descriptions). For example, given a graph of one quadratic function and an algebraic expression for another, say which has the larger maximum. Note: At this level, focus on linear, exponential, and quadratic functions. F-IF.4 For a function that models a relationship between two quantities, interpret key features of graphs and tables in terms of the quantities, and sketch graphs showing key features given a verbal description of the relationship. Key features include: intercepts; intervals where the function is increasing, decreasing, positive, or negative; relative maximums and minimums; symmetries;
functions when given a table of values, a graph, equation or verbal representation of the function.
2. Reason abstractly and quantitatively. 3. Construct viable arguments and critique the reasoning of others. 4. Model with mathematics. 5. Use appropriate tools strategically. 6. Attend to precision. 7. Look for and make use of structure. 8. Look for and express regularity in repeated reasoning.
F-BF.1 Write a function that describes a relationship between two quantities. b. Combine standard function types using arithmetic operations. For example, build a function that models the temperature of a cooling body by adding a constant function to a decaying exponential, and relate these functions to the model. Note: At this level, limit to addition or subtraction of constant to linear, exponential or quadratic functions or addition of linear functions to linear or quadratic functions.
M1. I can add, subtract and multiply values to exponential functions and discuss the effects the change has in terms of the context, equation, table of values and graph of the function.
1. Make sense of problems and persevere in solving them. 2. Reason abstractly and quantitatively. 3. Construct viable arguments and critique the reasoning of others. 4. Model with mathematics. 5. Use appropriate tools strategically. 6. Attend to precision. 7. Look for and make use of structure. 8. Look for and express regularity in repeated reasoning.
F-BF.1 Write a function that describes a relationship between two quantities. a. Determine an explicit expression, a recursive process, or steps for calculation from a context. F-BF.2 Write arithmetic and geometric sequences both recursively and with an explicit formula, use them to model situations, and translate between the
F10. I can explain the difference between arithmetic and geometric sequences.
1. Make sense of problems and persevere in solving them. 2. Reason abstractly and quantitatively. 3. Construct viable arguments and critique the reasoning of others. 4. Model with mathematics. 5. Use appropriate tools strategically. 6. Attend to precision.

Foundations of Algebra/Algebra/Math I Curriculum Map 2014-2015
two forms. Note: At this level, formal recursive notation is not used. Instead, use of informal recursive notation (such as NEXT = NOW + 5 starting at 3) is intended.
7. Look for and make use of structure. 8. Look for and express regularity in repeated reasoning.
F-BF.1 Write a function that describes a relationship between two quantities. a. Determine an explicit expression, a recursive process, or steps for calculation from a context. b. Combine standard function types using arithmetic operations. For example, build a function that models the temperature of a cooling body by adding a constant function to a decaying exponential, and relate these functions to the model. Note: At this level, limit to addition or subtraction of constant to linear, exponential or quadratic functions or addition of linear functions to linear or quadratic functions. F-BF.2 Write arithmetic and geometric sequences both recursively and with an explicit formula, use them to model situations, and translate between the two forms. Note: At this level, formal recursive notation is not used. Instead, use of informal recursive notation (such as NEXT = NOW + 5 starting at 3) is intended.
M2. I can convert linear and exponential formulas from explicit form to recursive form and from recursive form back to explicit form. (NOW, NEXT statements)
1. Make sense of problems and persevere in solving them. 2. Reason abstractly and quantitatively. 3. Construct viable arguments and critique the reasoning of others. 4. Model with mathematics. 5. Use appropriate tools strategically. 6. Attend to precision. 7. Look for and make use of structure. 8. Look for and express regularity in repeated reasoning.
F-BF.3 Identify the effect on the graph of replacing f(x) by f(x) + k, k f(x), f(kx), and f(x + k) for specific values of k (both positive and negative); find the value of k given the graphs. Experiment with cases and illustrate an explanation of the effects on the graph using technology.
M3. I can explain the effects of translations of graphs of a linear or exponential functions.
1. Make sense of problems and persevere in solving them. 2. Reason abstractly and quantitatively. 3. Construct viable arguments and critique the reasoning of others. 4. Model with mathematics. 5. Use appropriate tools strategically. 6. Attend to precision.

Foundations of Algebra/Algebra/Math I Curriculum Map 2014-2015
7. Look for and make use of structure. 8. Look for and express regularity in repeated reasoning.
Foundations of Algebra/Algebra/Math I Curriculum Map 2014-2015
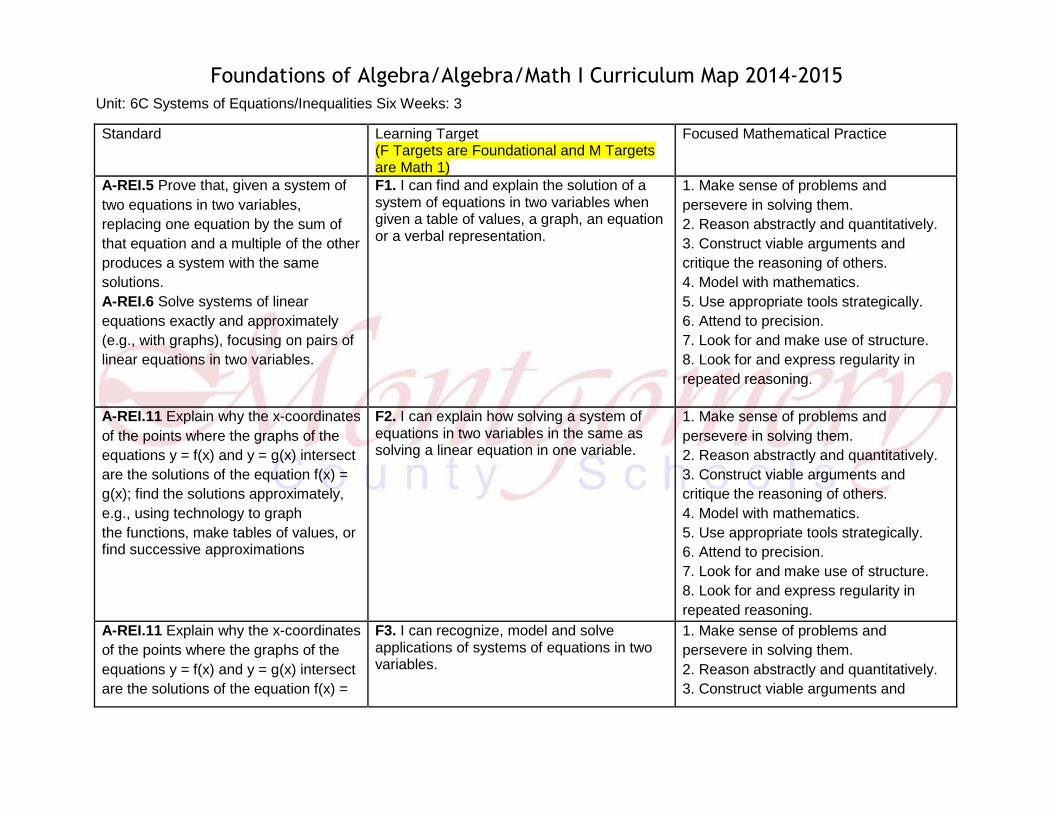
Unit: 6C Systems of Equations/Inequalities Six Weeks: 3
Standard Learning Target (F Targets are Foundational and M Targets are Math 1)
Focused Mathematical Practice
A-REI.5 Prove that, given a system of
two equations in two variables,
replacing one equation by the sum of
that equation and a multiple of the other
produces a system with the same
solutions.
A-REI.6 Solve systems of linear
equations exactly and approximately
(e.g., with graphs), focusing on pairs of
linear equations in two variables.
F1. I can find and explain the solution of a system of equations in two variables when given a table of values, a graph, an equation or a verbal representation.
1. Make sense of problems and
persevere in solving them.
2. Reason abstractly and quantitatively.
3. Construct viable arguments and
critique the reasoning of others.
4. Model with mathematics.
5. Use appropriate tools strategically.
6. Attend to precision.
7. Look for and make use of structure.
8. Look for and express regularity in
repeated reasoning.
A-REI.11 Explain why the x-coordinates
of the points where the graphs of the
equations y = f(x) and y = g(x) intersect
are the solutions of the equation f(x) =
g(x); find the solutions approximately,
e.g., using technology to graph
the functions, make tables of values, or find successive approximations
F2. I can explain how solving a system of equations in two variables in the same as solving a linear equation in one variable.
1. Make sense of problems and
persevere in solving them.
2. Reason abstractly and quantitatively.
3. Construct viable arguments and
critique the reasoning of others.
4. Model with mathematics.
5. Use appropriate tools strategically.
6. Attend to precision.
7. Look for and make use of structure.
8. Look for and express regularity in
repeated reasoning.
A-REI.11 Explain why the x-coordinates
of the points where the graphs of the
equations y = f(x) and y = g(x) intersect
are the solutions of the equation f(x) =
F3. I can recognize, model and solve applications of systems of equations in two variables.
1. Make sense of problems and
persevere in solving them.
2. Reason abstractly and quantitatively.
3. Construct viable arguments and

Foundations of Algebra/Algebra/Math I Curriculum Map 2014-2015
g(x); find the solutions approximately,
e.g., using technology to graph
the functions, make tables of values, or
find successive approximations. Include
cases where f(x) and/or g(x) are linear,
polynomial, rational, absolute value,
exponential, and logarithmic functions.
Note: At this level, focus on linear and
exponential functions.
(By hand and with calculator. Method is up to individual teacher.)
critique the reasoning of others.
4. Model with mathematics.
5. Use appropriate tools strategically.
6. Attend to precision.
7. Look for and make use of structure.
8. Look for and express regularity in
repeated reasoning.
G-GPE.5 Prove the slope criteria for parallel and perpendicular lines and use them to solve geometric problems (e.g., find the equation of a line parallel or perpendicular to a given line that passes through a given point).
F4. I can use the slopes of lines to determine whether the lines are parallel, perpendicular or neither parallel nor perpendicular.
1. Make sense of problems and
persevere in solving them.
2. Reason abstractly and quantitatively.
3. Construct viable arguments and
critique the reasoning of others.
4. Model with mathematics.
5. Use appropriate tools strategically.
6. Attend to precision.
7. Look for and make use of structure.
8. Look for and express regularity in
repeated reasoning.
A-REI.12 Graph the solutions to a
linear inequality in two variables as a
half- plane (excluding the boundary in
the case of a strict inequality), and
graph the solution set to a system of
linear inequalities in two variables as
the intersection of the corresponding
half-planes.
M1. I can solve systems of inequalities in two variables both with and without context.
1. Make sense of problems and
persevere in solving them.
2. Reason abstractly and quantitatively.
3. Construct viable arguments and
critique the reasoning of others.
4. Model with mathematics.
5. Use appropriate tools strategically.
6. Attend to precision.
7. Look for and make use of structure.
8. Look for and express regularity in
repeated reasoning.

Foundations of Algebra/Algebra/Math I Curriculum Map 2014-2015
A-CED.3 Represent constraints by
equations or inequalities, and by
systems of equations and/or
inequalities, and interpret solutions as
viable or non- viable options in a
modeling context. For example,
represent inequalities describing
nutritional and cost constraints on
combinations of different foods. Note:
At this level, limit to linear equations
and inequalities.
M2. I can use linear programming to interpret maximum and minimum values of functions and define constraints to a system of inequalities. (See unpacking document)
1. Make sense of problems and
persevere in solving them.
2. Reason abstractly and quantitatively.
3. Construct viable arguments and
critique the reasoning of others.
4. Model with mathematics.
5. Use appropriate tools strategically.
6. Attend to precision.
7. Look for and make use of structure.
8. Look for and express regularity in
repeated reasoning.
Unit 6D Quadratic Functions Six Weeks: 3
Standard Learning Target (F Targets are Foundational and M Targets are Math 1)
Focused Mathematical Practice
F-IF.4 For a function that models a relationship between two quantities, interpret key features of graphs and tables in terms of the quantities, and sketch graphs showing key features given a verbal description of the relationship. Key features include: intercepts; intervals where the function is increasing, decreasing, positive, or negative; relative maximums and
F1. I can determine and explain key features of a quadratic function.
2. Reason abstractly and quantitatively. 3. Construct viable arguments and critique the reasoning of others. 4. Model with mathematics. 7. Look for and make use of structure. 8. Look for and express regularity in repeated reasoning.

Foundations of Algebra/Algebra/Math I Curriculum Map 2014-2015
minimums; symmetries
F-IF.9 Compare properties of two functions each represented in a different way (algebraically, graphically, numerically in tables, or by verbal descriptions). For example, given a graph of one quadratic function and an algebraic expression for another, say which has the larger maximum. Note: At this level, focus on linear, exponential, and quadratic functions
F2. I can compare key features of quadratic functions to other quadratic functions using tables of values, graphs, equations and verbal representations.
1. Make sense of problems and persevere in solving them. 2. Reason abstractly and quantitatively. 3. Construct viable arguments and critique the reasoning of others. 4. Model with mathematics. 5. Use appropriate tools strategically. 6. Attend to precision. 7. Look for and make use of structure. 8. Look for and express regularity in repeated reasoning.
F-IF.9 Compare properties of two functions each represented in a different way (algebraically, graphically, numerically in tables, or by verbal descriptions). For example, given a graph of one quadratic function and an algebraic expression for another, say which has the larger maximum. Note: At this level, focus on linear, exponential, and quadratic functions
F3. I can compare quadratic functions to linear and exponential functions using tables of values, graphs, equations and verbal representations.
1. Make sense of problems and persevere in solving them. 2. Reason abstractly and quantitatively. 3. Construct viable arguments and critique the reasoning of others. 4. Model with mathematics. 5. Use appropriate tools strategically. 6. Attend to precision. 7. Look for and make use of structure. 8. Look for and express regularity in repeated reasoning.
F-IF.8 Write a function defined by an expression in different but equivalent forms to reveal and explain different properties of the function. a. Use the process of factoring and completing the square in a quadratic function to show zeros, extreme values, and symmetry of the graph, and interpret these in terms of a context. Note: At this level, only factoring
M1. I can use the factors of quadratic functions to determine its solutions and can interpret these solutions in terms of context. (Other options to find the zeroes of a quadratic equation can be used as well. Ex. quadratic formula, calculator)
1. Make sense of problems and persevere in solving them. 2. Reason abstractly and quantitatively. 3. Construct viable arguments and critique the reasoning of others. 4. Model with mathematics. 5. Use appropriate tools strategically. 6. Attend to precision. 7. Look for and make use of structure. 8. Look for and express regularity in

Foundations of Algebra/Algebra/Math I Curriculum Map 2014-2015
expressions of the form ax2 + bx +c, is expected. Completing the square is not addressed at this level
repeated reasoning.