forward-looking statements
DESCRIPTION
Forward-Looking Statements. - PowerPoint PPT PresentationTRANSCRIPT

Forward-Looking StatementsExcept for historical information, this presentation may contain certain “forward-looking statements”. These statements may involve a number of known and unknown risks and uncertainties and other factors that may cause the actual results, level of activity and performance to be materially different from the expectations and projections of Globex.
No assurance can be given that any events anticipated by the forward-looking informationwill transpire or occur, or if any of them do so, what benefits Globex will derive therefrom.A detailed discussion of the risk factors relating to Globex is available in Globex’s Annual Information Form, available at www.sedar.com.

Copper • Gold • Zinc Silver • Iron
Talc • MagnesiumCompounds
WORLDWIDEMAGNESIUM CORP.
Gold • SilverCopper • Zinc
ROYALTIES& OPTIONS
Manganese • Rare EarthsMica • Iron • Apatite
Lithium • UraniumMolybdenum
SPECIALTYMETALS & MINERALS
Copper • Zinc • Lead,Nickel • Gold • Silver
BASE METALS(POLYMETALLIC)
Gold • Silver • PlatinumPalladium
PRECIOUSMETALS
Precious Metals Recovery
Technology
At Home in North America

• Shares Issued 27, 896, 018
• Funds available for exploration• No debt• Owns 100% of its property interests• Based in North America, primarily Quebec, Ontario,
Nova Scotia and New Brunswick• Specialized and experienced Board of Directors composed
of 4 senior geologists and 1 mining accountant
Globex Mining Enterprises Inc.
• Shares Fully Diluted 29, 938, 918
(no rollbacks)
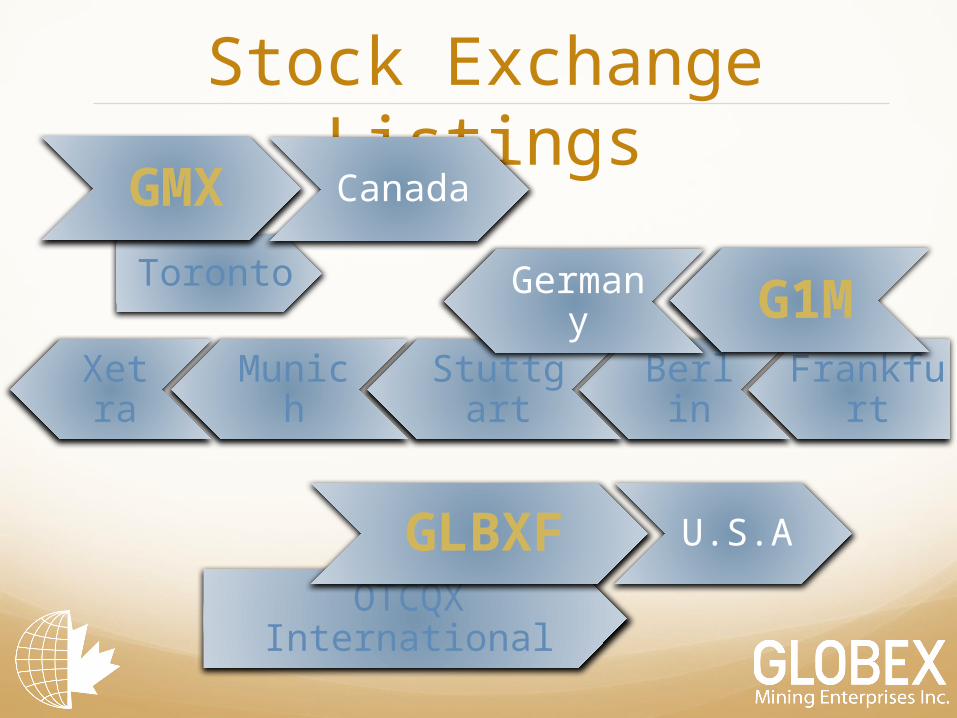
Stock Exchange Listings
FrankfurtBerlinStuttgartMunichXetra
G1MGermanyToronto
GMX Canada
OTCQX International
GLBXF U.S.A

{re
Diversified Mineral Holdings:
Au • Gold
Ag • Silver
Pt • Platinum
Pd • Palladium
Cu • Copper
Zn • Zinc
Ni • Nickel
Pb • Lead
REE • Rare Earths
Fe • Iron
Mn • Manganese
Mo • Molybdenum
U • Uranium
F • Fluorine
Li • Lithium
Hf • Hafnium
Ce • Cerium
Zr • Zirconium
Y • Yttrium
Nb • Niobium
Magnesite
Talc
Phlogopite Mica
Apatite
Precious Metals
Base Metals
Specialty Metals
Industrial Metals

116 Properties
64 Precious Metals• Gold, Silver, Platinum, Palladium
40 Base Metals & Polymetallic• Copper, Zinc, Gold, Silver, Lead, Nickel
12Specialty Metals & Minerals• Iron, Lithium, Magnesium Oxide, Manganese, Mica,
Molybdenum, Rare Earths, Talc, Uranium, Titanium
30 Royalties
9 Active options • Cash payments• Share payments• Exploration & development expenditures• Gross metal royalty
41 Historical or NI 43-101 resources
Note: Some properties have been combined due to proximity or infill staking

Diversified Mineral Holdings:

Historical Value of Production
166.61 Million oz
635.8 Million oz
Total: US $ 370 Billion
Metal Prices Used in Calculations
$163.9 B$1.49 B
$ 1.64 B
$18.0 B
$ 39.36 B
$1.64 B
$34.18 B
$52.38 B
$55.44 B
$1.64 B
Au
Ag
Zn
Cu
28.0 Billion lb
14.5 Billion lbAu $ 1400.00/ozAg $ 23.00/oz
Zn $ 0.82/lbCu $ 3.30/lb

Cadillac Gold Camp (Wood-Pandora Joint Venture)
Resources : NI 43-101 conformable
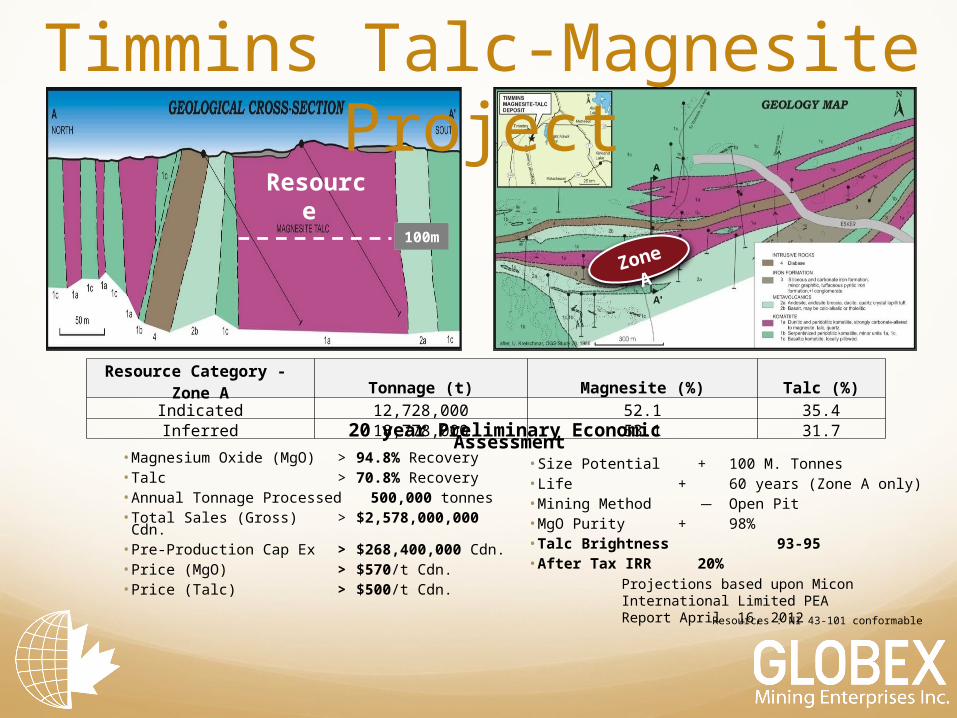
Resource Category - Zone A Tonnage (t) Magnesite (%) Talc (%)Indicated 12,728,000 52.1 35.4Inferred 18,778,000 53.1 31.7
• Magnesium Oxide (MgO) > 94.8% Recovery• Talc > 70.8% Recovery • Annual Tonnage Processed 500,000 tonnes• Total Sales (Gross) > $2,578,000,000 Cdn. • Pre-Production Cap Ex > $268,400,000 Cdn.• Price (MgO) > $570/t Cdn.• Price (Talc) > $500/t Cdn.
• Size Potential + 100 M. Tonnes• Life + 60 years (Zone A only)• Mining Method ̶ Open Pit • MgO Purity + 98% • Talc Brightness 93-95• After Tax IRR 20%
Projections based upon Micon International Limited PEA Report April 16, 2012
20 year Preliminary Economic Assessment
Resource
100m
Zone A
Timmins Talc-Magnesite Project

Iron Hill (Manganese/Iron Deposit 21 J 04)
320 m
136.50 m
88.20 m
52.17 m
32.93 m
10.45% Mn, 12.51% Fe / 20.92 m
11.17% Mn, 16.75% Fe / 19.92 m
10.18% Mn, 15.48% Fe / 19.24 m2.50% Mn, 6.90% Fe / 32.93 m 8.70% Mn, 11.76% Fe / 49.0 m
Hole ended in 10.38% Mn, 11.76% Fe
57 m
(Open)
100% imported (strategic element)Required in order to make stainless steel
100m80m60m40m20m0
108.12 m115.78 m
2.22% Mn, 7.91% Fe / 36.03 m
4.06% Mn, 9.75% Fe / 7.66 m
>8% Mn <8% Mn
GNB11-03GNB11-02110⁰
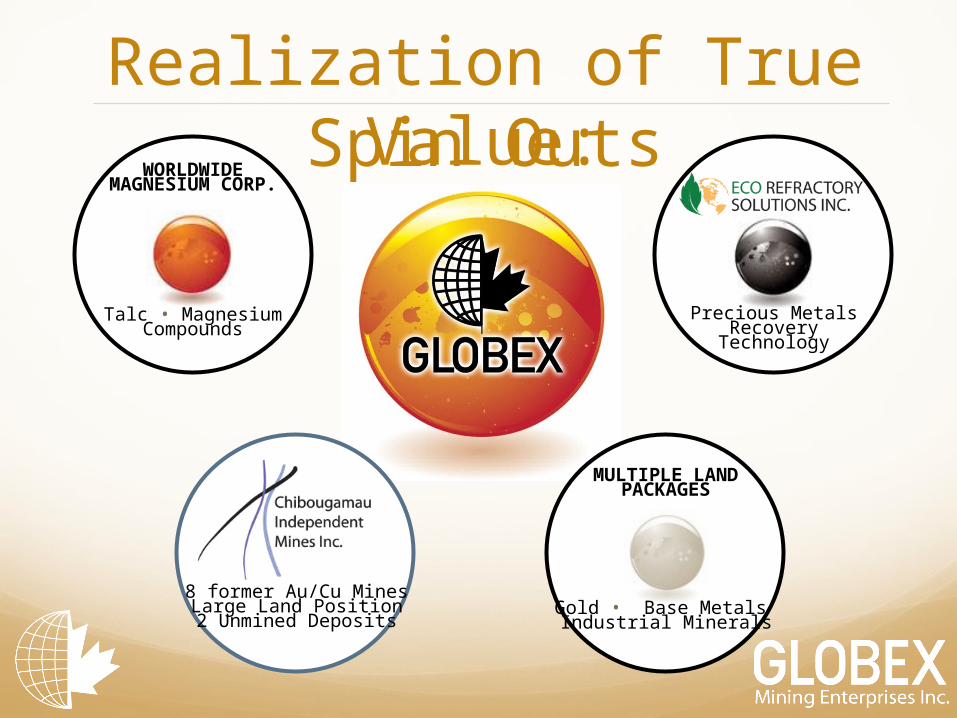
Realization of True Value:
MULTIPLE LANDPACKAGES
Gold • Base Metals Industrial Minerals
8 former Au/Cu MinesLarge Land Position2 Unmined Deposits
Spin Outs
Precious MetalsRecovery Technology
Talc • MagnesiumCompounds
WORLDWIDEMAGNESIUM CORP.
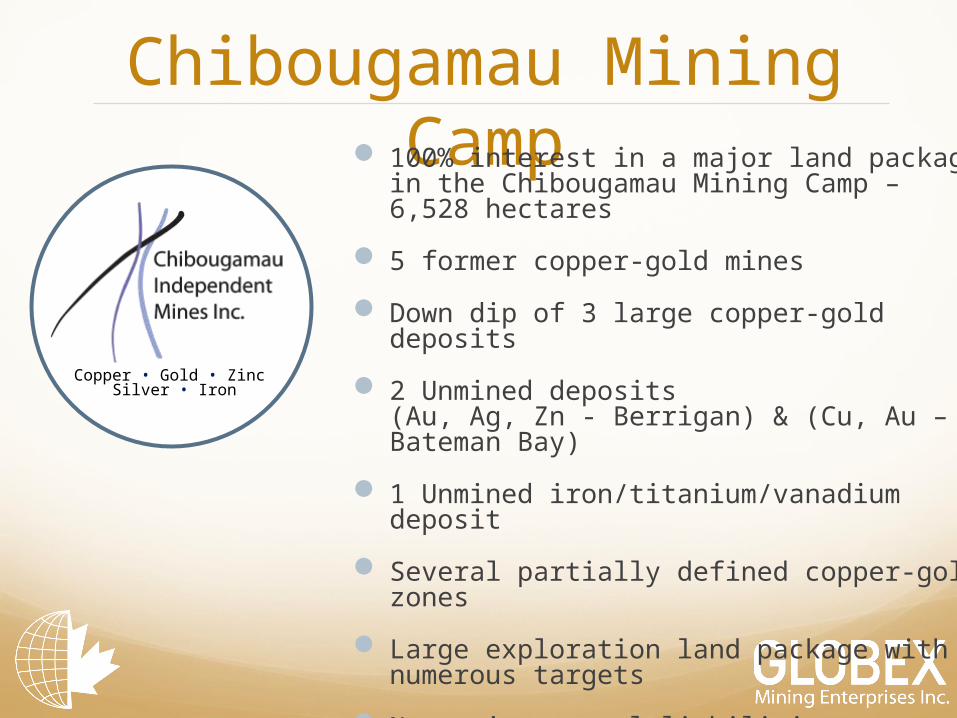
Chibougamau Mining Camp 100% interest in a major land package in the
Chibougamau Mining Camp – 6,528 hectares
5 former copper-gold mines
Down dip of 3 large copper-gold deposits
2 Unmined deposits(Au, Ag, Zn - Berrigan) & (Cu, Au – Bateman Bay)
1 Unmined iron/titanium/vanadium deposit
Several partially defined copper-gold zones
Large exploration land package withnumerous targets
No environmental liabilities
Copper • Gold • Zinc Silver • Iron
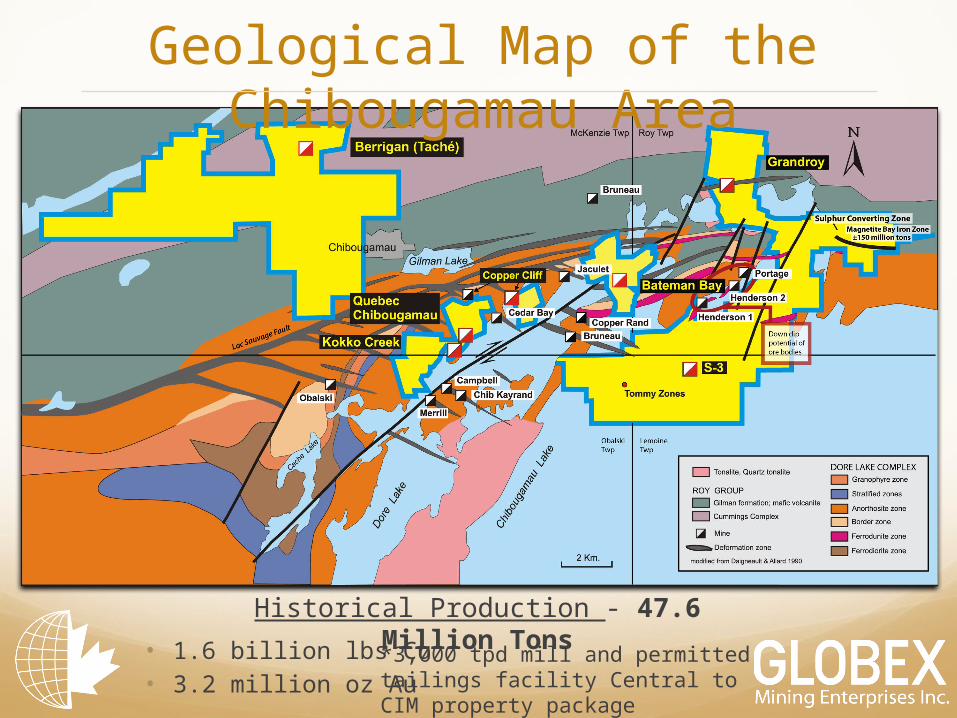
Geological Map of the Chibougamau Area
Historical Production - 47.6 Million Tons• 1.6 billion lbs Cu• 3.2 million oz Au
*3,000 tpd mill and permitted tailings facility Central to CIM property package

Longitudinal Section – Chibougamau area, Quebec
Doré Lake Complex (Copper-Gold)

Hole # From To Interval % Zn % Cu Au g/t Ag g/tA-005 131.4 m 140.2 m 8.8 m 5.70% 6.96 g/tA-010 97.3 m 105.2 m 7.9 m 4.43% 4.94 g/t 25.36 g/tA-016 18.9 m 21.2 m 2.3 m 1.51% 6.43 g/t
76.2 m 77.7 m 1.5 m 3.45% 8.91 g/tA-061 91.6 m 100.6 m 9.0 m 3.76% 0.16% 3.00 g/t 17.24 g/t
107.1 m 115.7 m 8.6 m 6.15% 0.17% 8.14 g/t 39.70 g/tA-062 59.3 m 61.1 m 1.8 m 6.92% 4.62 g/t 17.14 g/tA-063 113.7 m 114.3 m 0.6 m 17.55% 49.23 g/t 404.64 g/t
129.4 m 132.8 m 3.4 m 8.86% 8.88 g/t 68.16 g/t138.9 m 141.5 m 2.6 m 4.69% 4.04 g/t 11.14 g/t
A-065 121.6 m 125.7 m 4.6 m 7.67% 6.08 g/t 21.56 g/t139.8 m 144.5 m 4.7 m 2.80% 3.55 g/t 7.64 g/t164.7 m 167.2 m 2.5 m 3.13% 6.95 g/t 15.44 g/t
A-066 100.6 m 101.8 m 1.2 m 22.90% 36.65 g/t 39.73 g/t159.8 m 168.8 m 9.0 m 6.26% 5.19 g/t 19.60 g/t
A-067 157.1 m 158.2 m 1.1 m 16.75% 10.96 g/tA-072 188.7 m 190.9 m 2.2 m 5.08% 3.13 g/tA-073 144.8 m 145.1 m 0.3 m 27.90% 32.88 g/tA-076 126.3 m 129.8 m 3.5 m 11.07% 3.02 g/tA-083 94.3 m 96.3 m 2.0 m 4.45% 3.79 g/t 10.34 g/t
119.4 m 132.6 m 13.2 m 4.99% 2.88 g/t 15.91 g/tA-084 130.3 m 142.8 m 12.5 m 4.58% 5.10 g/t 17.18 g/tA-086 50.9 m 52.1 m 1.2 m 7.00% 15.07 g/t 59.60 g/tA-103 56.4 m 59.4 m 3.0 m 5.84% 11.61 g/t
Hole # From To Interval % Zn % Cu Au g/t Ag g/tU-02 44.9 m 45.6 m 0.7 m 2.95% 17.81 g/t 89.74 g/t
90.4 m 91.4 m 1.0 m 13.80% 26.72 g/t 58.91 g/t95.8 m 108.7 m 12.9 m 5.75% 3.11 g/t 15.17 g/t
U-03 8.2 m 16.6 m 8.4 m 13.09% 6.98 g/t 20.71 g/t49.4 m 64.0 m 14.4 m 8.69% 3.41 g/t 17.49 g/t
U-04 17.4 m 19.7 m 2.3 m 12.77% 4.60 g/t 14.65 g/t85.9 m 86.6 m 0.7 m 7.05% 37.68 g/t 78.09 g/t
U-09 71.8 m 75.8 m 4.0 m 2.32% 4.32 g/t 12.43 g/tSU-23 2.8 m 10.6 m 7.8 m 3.98% 3.33 g/t 20.54 g/tSU-52 0.0 m 5.0 m 5.0 m 3.88% 3.01 g/t 19.82 g/tSU-59 0.0 m 4.1 m 4.1 m 5.40% 3.51 g/t 31.04 g/tTA-87-27 31.1 m 32.3 m 1.2 m 5.60% 17.98 g/t 37.33 g/tTA-87-40 81.1 m 83.5 m 2.4 m 10.05% 2.96 g/t 50.05 g/t
91.4 m 94.2 m 2.8 m 10.82% 3.23 g/t 19.19 g/tTA-90-50 65.5 m 70.1 m 4.6 m 4.12% 6.78 g/t 10.12 g/t
84.6 m 87.5 m 2.9 m 3.90% 3.20 g/t95.5 m 106.7 m 11.2 m 10.39% 0.10% 2.54 g/t 19.26 g/t
114.0 m 129.5 m 15.5 m 6.57% 0.10% 8.05 g/t 23.58 g/tTA-90-51 197.4 m 200.0 m 2.6 m 5.39% 0.21% 3.52 g/t 20.10 g/tTA-90-52 201.2 m 203.3 m 2.1 m 5.21% 5.70 g/t 11.60 g/tTA-90-56 81.0 m 84.4 m 3.4 m 5.75% 4.06 g/t
164.4 m 166.9 m 2.5 m 5.23% 6.18 g/t215.7 m 219.6 m 3.9 m 6.74% 3.95 g/t
TLT-09 247.4 m 249.7 m 2.3 m 4.28 g/t
Surface diamond drill holes
Some Significant Gold Intersections Within Previous Drilling Berrigan Property 32G16

Cross Section
Henderson I - Total Ore Extracted 1960 – 1971 1,818,976 T @ 2.23% Cu, 0.045 oz/t AuHenderson II - Total Ore Extracted 1960 – 1988 6,483,479 T @ 1.60% Cu, 0.041 oz/t AuPortage Mine - Total Ore Extracted 1959 – 1997 6,212,934 T @ 1.77% Cu, 0.114 oz/t Au
June 2013
• Mine package forms a single multi-lensed orebody stretching along a broad NE-striking shear with > 1 mile of strike • Portage Mine mined to a depth of 3,600
feet • Western mining planned to explore and
develop to 5000-foot depth
Henderson-Portage Shear Plan Map with Depth Projection& Cross Section (Per Western Mining)
Globex has 75 % interest and management
Worldwide application of hydrometallurgical technology
Gold recoveries of up to 98%
Stabilizes arsenic residues
Oxidizes sulphides in residues
Low capital costs
Low operating costs No fine grinding Recyclable reagents
Extremely environmentally friendly
At Home In North America
Precious MetalsRecovery Technology
THANK YOU MERCI
DANKE GRAZIE

Joutel Compilation Map, QcTwo Copper, ZincSilver
Mines (Poirier and Joutel Copper )
One Gold Mine ( Eagle Mine)
Large exploration packageincluding showings and zonesof alteration.

Joutel Mine Model
Joutel Copper Mine
Explo Zinc Mine
PoirierMine

Tiblemont-Tavernier, Qc
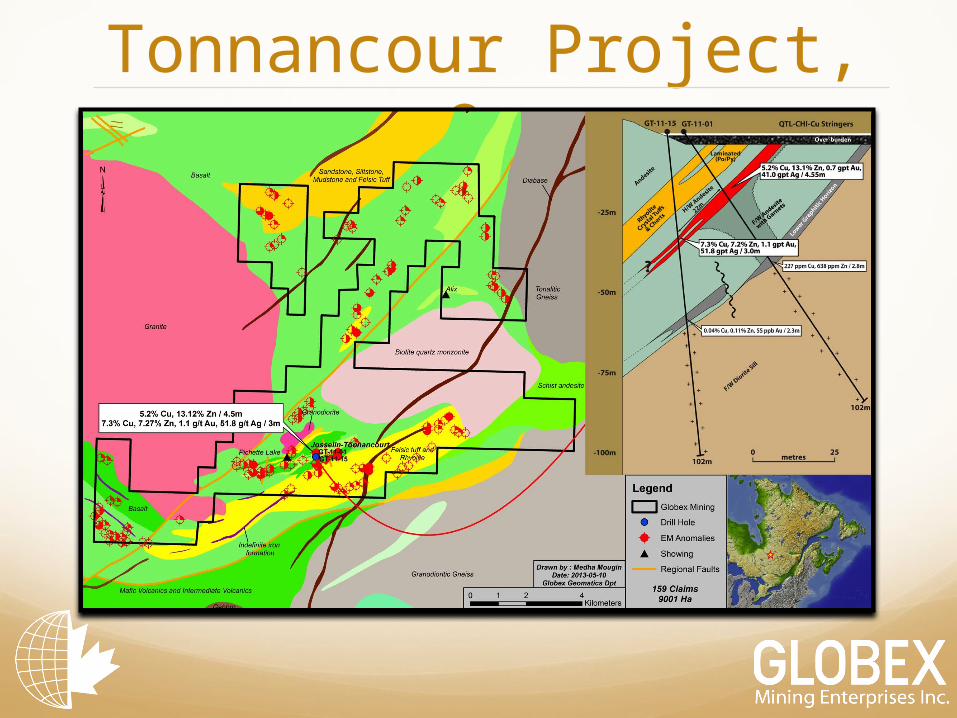
Tonnancour Project, Qc
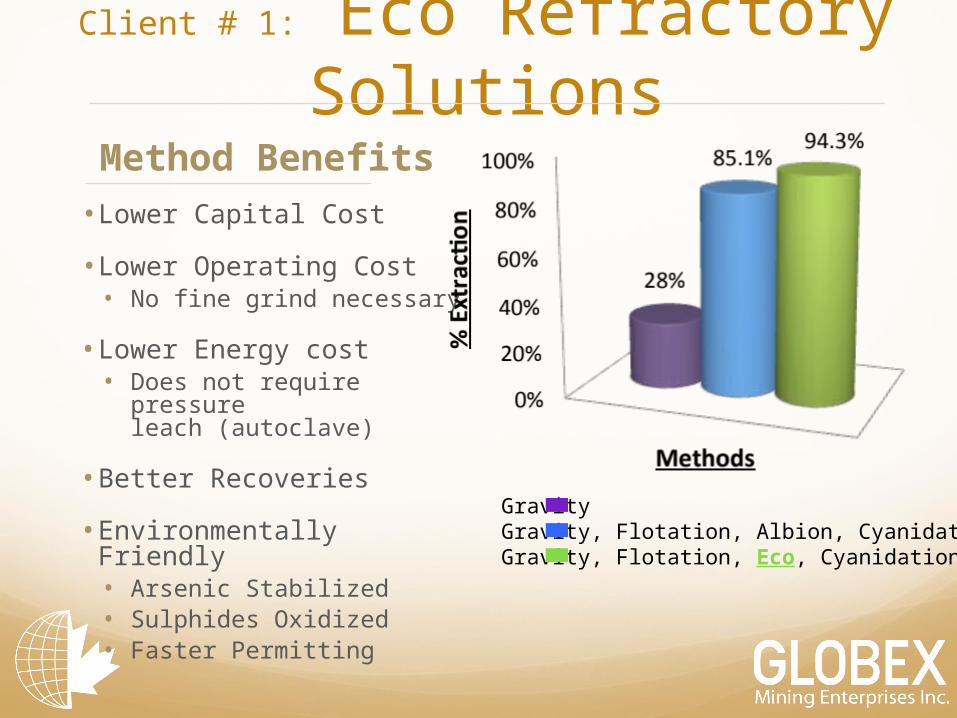
• Lower Capital Cost
• Lower Operating Cost• No fine grind necessary
• Lower Energy cost• Does not require pressure
leach (autoclave)
• Better Recoveries
• Environmentally Friendly• Arsenic Stabilized• Sulphides Oxidized• Faster Permitting
GravityGravity, Flotation, Albion, CyanidationGravity, Flotation, Eco, Cyanidation
Method Benefits
Client # 1: Eco Refractory Solutions

Client # 1: Eco Refractory Solutions
• Large Tonnage, Low Grade, Open Pittable Gold Ore• Refractory Ore – Fine Gold in Pyrite Lattice
Direct CyanidationFine Grinding, Direct CyanidationFine Grinding, *Roasting, CyanidationFine Grinding, Eco Refractory Process, Cyanidation
*Roasting requires high capital costs and energy consumption while creating numerous potentiallydangerous and expensive environmental problems

Shares, Warrants & OptionsChibougamau Independent Mines Inc.
Shares Issued December 28, 2012 Shares Cash
Common Share Dividend 27,896,018 $240,000
Flow-Through Shares (per Financing $0.65) 2,181,230 $1,417,799
Hard Dollar Shares (per Financing $0.50) 2,400,000 $1,200,000
32,477,248 $2,857,799
Principals (90% Escrow) -6,049,638
Fully Diluted
Stock Options 1,137,900 -
Two Warrants ($0.80 for 12 months) 4,581,230 $1,832,492