forschungszentrum telekommunikation wien - ieee...
TRANSCRIPT

Passive Tomography of a 3G Network:Challenges and Opportunities
Fabio Ricciato Forschungszentrum Telekommunikation Wien Francesco Vacirca Forschungszentrum Telekommunikation Wien Wolfgang Fleischer mobilkom austria AG & Ko CGJohannes Motz Kapsch CarrierComMarkus Rupp Technical University of Vienna
Forschungszentrum Telekommunikation Wien
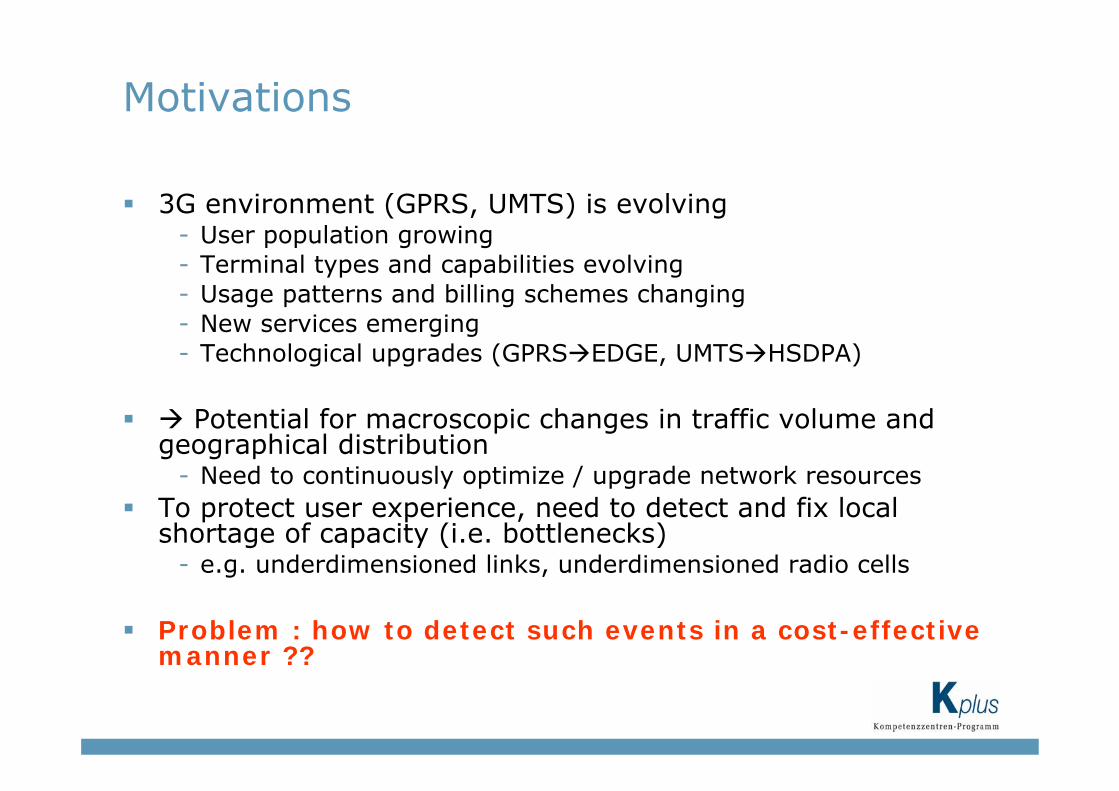
3G environment (GPRS, UMTS) is evolving- User population growing- Terminal types and capabilities evolving- Usage patterns and billing schemes changing- New services emerging- Technological upgrades (GPRS EDGE, UMTS HSDPA)
Potential for macroscopic changes in traffic volume and geographical distribution
- Need to continuously optimize / upgrade network resourcesTo protect user experience, need to detect and fix local shortage of capacity (i.e. bottlenecks)
- e.g. underdimensioned links, underdimensioned radio cells
Problem : how to detect such events in a cost-effective manner ??
Motivations

The classical approach : ask the equipments- Relay on output data from the equipments (logs, counters,..)- Need to extract, gather and correlate these data
Main problem : heterogenity !!- Extraction, gathering and correlation of such data is a hige headache !!!- Different kinds of equipments, SW releases, vendors, ...- Different data semantics, formats, ...
Other limitations - Reliability : logs and counters might be not trustable
- E.g. overload misfunctioning -> wrong data
- Granularity : counters might be too coarse-grained- Typically >5min average, per-MS counters not available, ...
- Performances : activation of fine-grain counters and verbose logging might hinder equipment performance
- Availability : important data might be simply not supported
Motivations
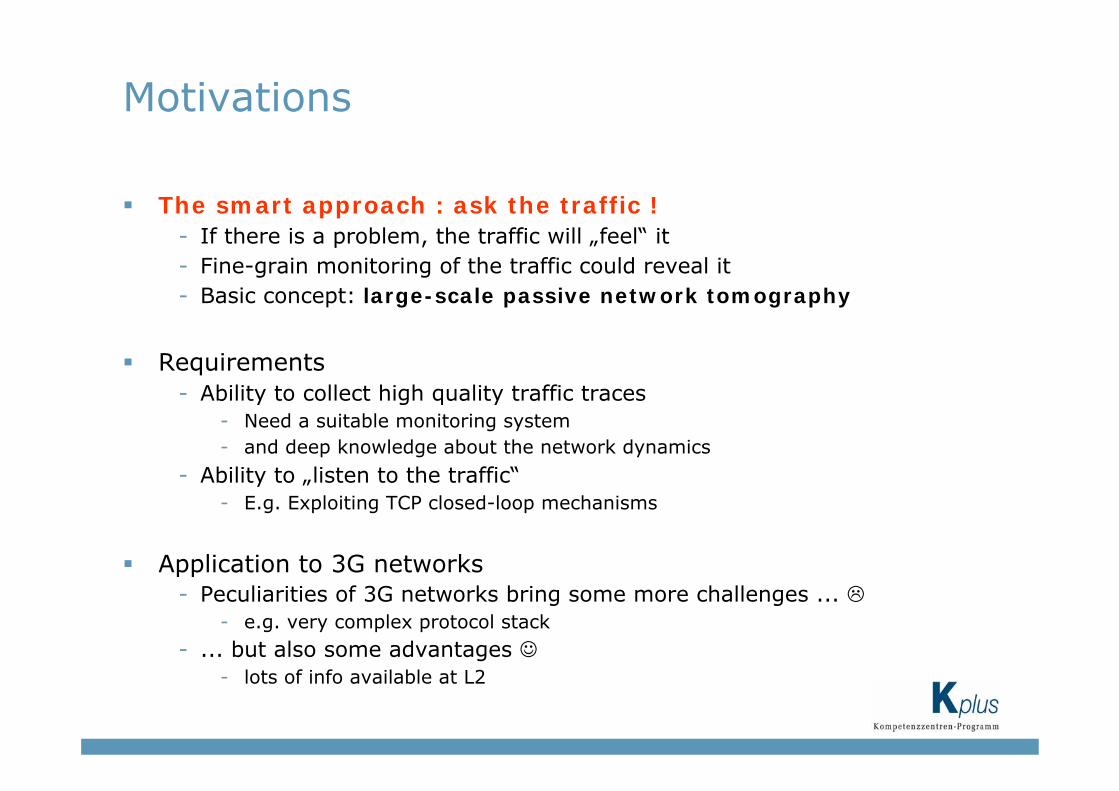
The smart approach : ask the traffic !- If there is a problem, the traffic will „feel“ it - Fine-grain monitoring of the traffic could reveal it- Basic concept: large-scale passive network tomography
Requirements- Ability to collect high quality traffic traces
- Need a suitable monitoring system- and deep knowledge about the network dynamics
- Ability to „listen to the traffic“- E.g. Exploiting TCP closed-loop mechanisms
Application to 3G networks- Peculiarities of 3G networks bring some more challenges ...
- e.g. very complex protocol stack
- ... but also some advantages ☺- lots of info available at L2
Motivations

Gp
BTSRNC
RNS
BTSBSC
BSSGPRS RAN Information
Servers (e.g. HLR)
PS-CN
Gb links
IuPSlinks
Internet
SGSN
…
…
GGSN
Gn
…
Application Servers & Proxies
Gi
MS
UMTS RAN
BG
PS-CN of other carriers
monitoring system
Radio Access Network (RAN) Core Network (CN)
Background on 3G networks: topology

GPRS user plane UMTS user plane
GPRS control plane UMTS control plane
Background on 3G networks: protocol stacks
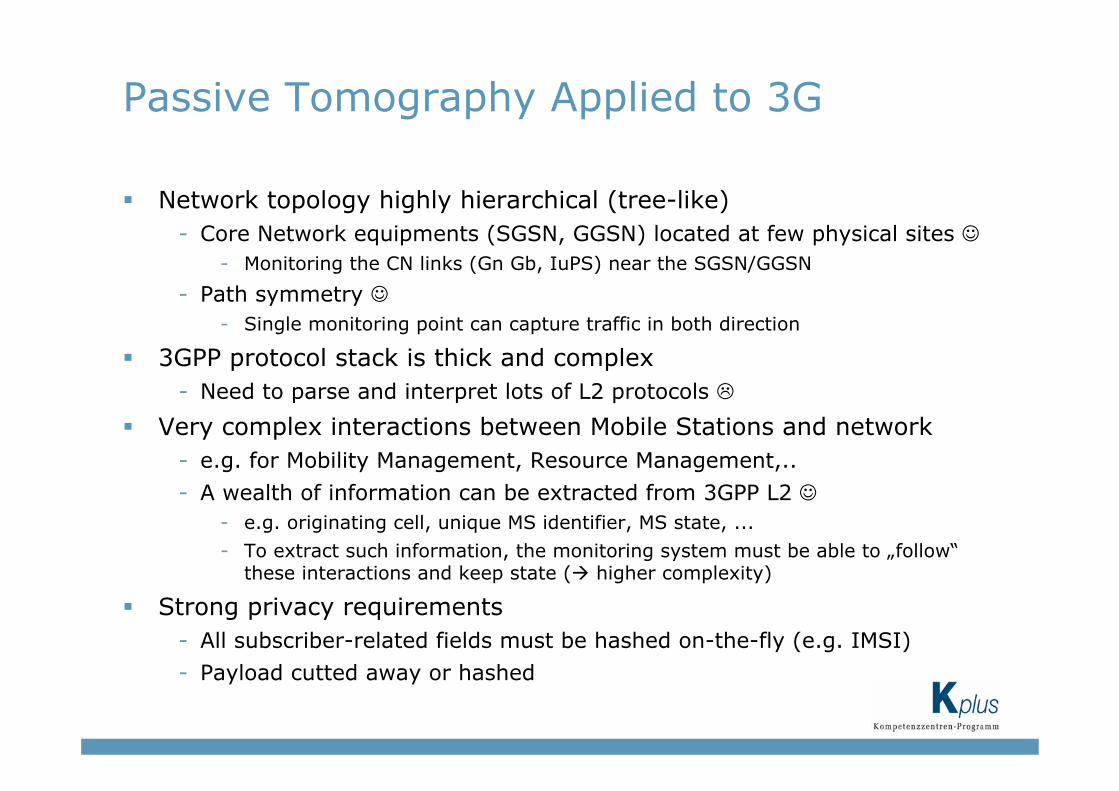
Network topology highly hierarchical (tree-like)- Core Network equipments (SGSN, GGSN) located at few physical sites ☺
- Monitoring the CN links (Gn Gb, IuPS) near the SGSN/GGSN
- Path symmetry ☺- Single monitoring point can capture traffic in both direction
3GPP protocol stack is thick and complex- Need to parse and interpret lots of L2 protocols
Very complex interactions between Mobile Stations and network - e.g. for Mobility Management, Resource Management,..
- A wealth of information can be extracted from 3GPP L2 ☺- e.g. originating cell, unique MS identifier, MS state, ...
- To extract such information, the monitoring system must be able to „follow“these interactions and keep state ( higher complexity)
Strong privacy requirements- All subscriber-related fields must be hashed on-the-fly (e.g. IMSI)
- Payload cutted away or hashed
Passive Tomography Applied to 3G
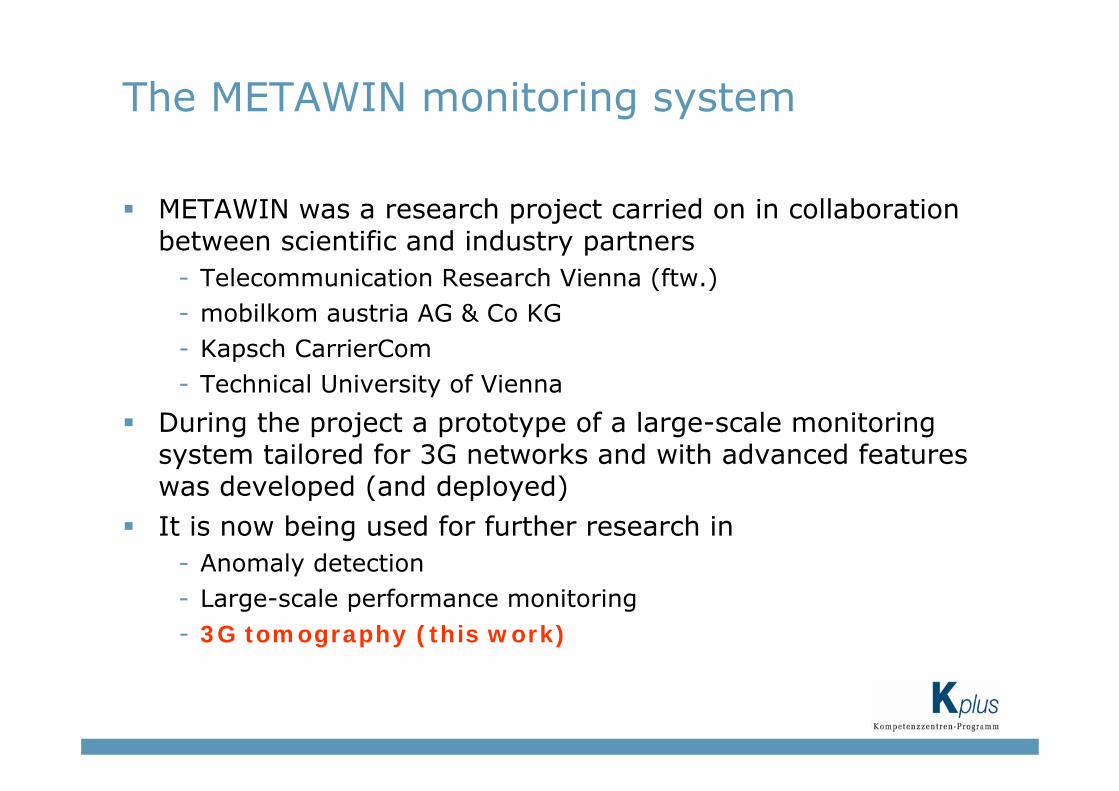
METAWIN was a research project carried on in collaboration between scientific and industry partners
- Telecommunication Research Vienna (ftw.)- mobilkom austria AG & Co KG- Kapsch CarrierCom- Technical University of Vienna
During the project a prototype of a large-scale monitoring system tailored for 3G networks and with advanced features was developed (and deployed)It is now being used for further research in
- Anomaly detection- Large-scale performance monitoring- 3G tomography (this work)
The METAWIN monitoring system
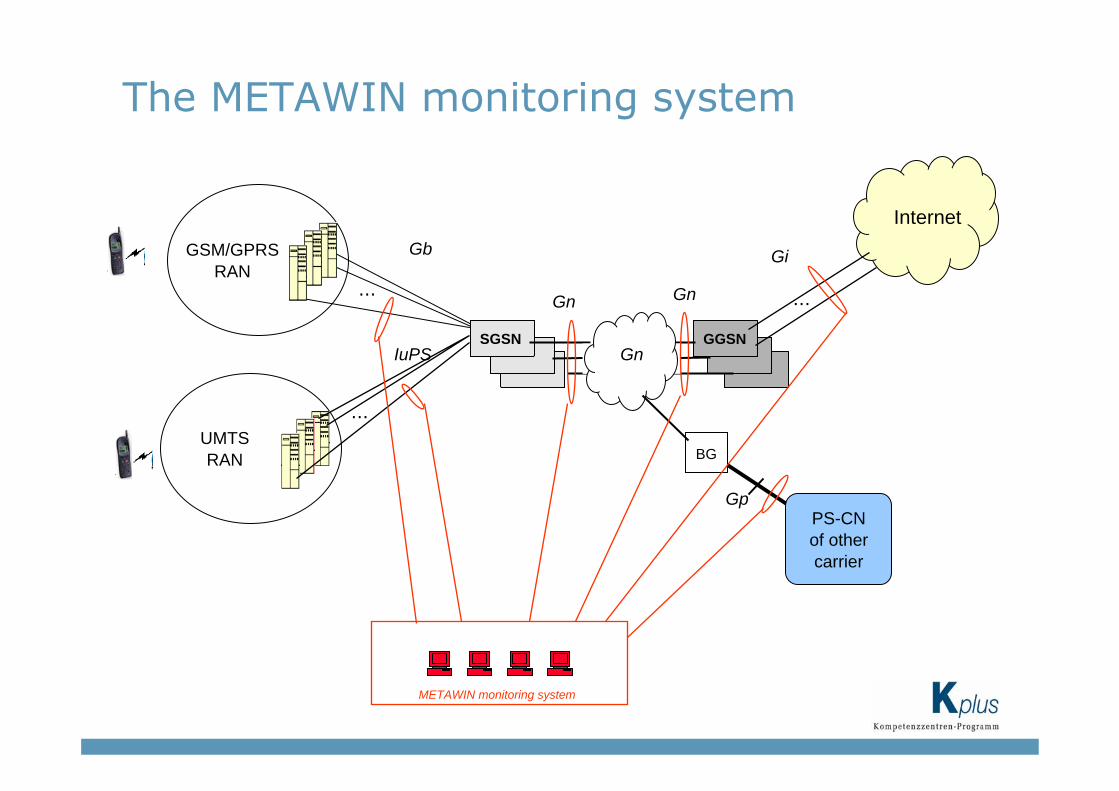
GSM/GPRS RAN
GGSN
Gi
IuPS
Gb
Internet
...
SGSN
UMTS RAN
...
PS-CN of other carrier
Gp
BG
Gn
...Gn Gn
METAWIN monitoring system
The METAWIN monitoring system

Features of the METAWIN monitoring/analysis system - Large-scale m/a
- capture all traffic- Complete m/a
- capture all interfaces: allows end-to-end analysis and correlation- Cross-layer m/a
- Capture and parse all protocol layers: allows cross-layer analysis and correlation
- Fine granularity- Can decompose into any dimension: protocol, type-of-message,
specific field values, etc. - Can track down to individual IMSI, cells/RA, etc.- Can count at sub-second time granularity
- Always-on (24h/7d)- Long-term storage
- weeks- Built-in data processing and automatic / proactive reporting
- Ongoing work
The METAWIN monitoring system
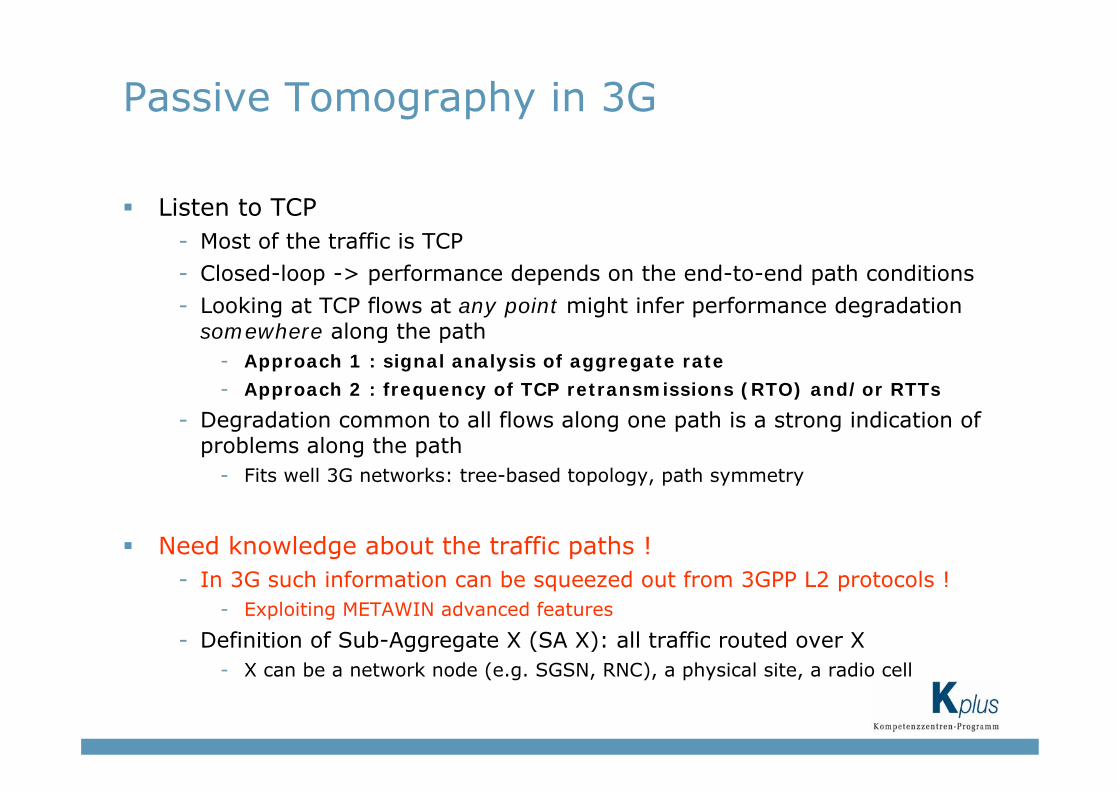
Listen to TCP- Most of the traffic is TCP
- Closed-loop -> performance depends on the end-to-end path conditions
- Looking at TCP flows at any point might infer performance degradation somewhere along the path
- Approach 1 : signal analysis of aggregate rate
- Approach 2 : frequency of TCP retransmissions (RTO) and/or RTTs
- Degradation common to all flows along one path is a strong indication of problems along the path
- Fits well 3G networks: tree-based topology, path symmetry
Need knowledge about the traffic paths !- In 3G such information can be squeezed out from 3GPP L2 protocols !
- Exploiting METAWIN advanced features
- Definition of Sub-Aggregate X (SA X): all traffic routed over X- X can be a network node (e.g. SGSN, RNC), a physical site, a radio cell
Passive Tomography in 3G
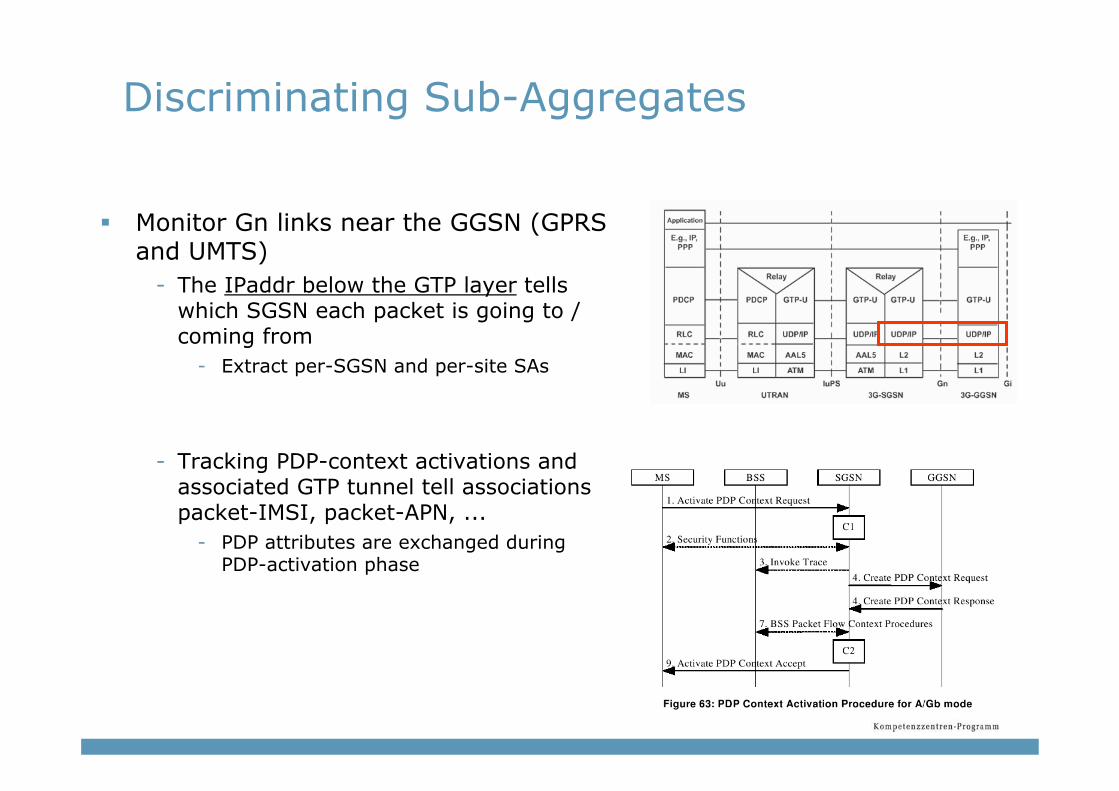
Monitor Gn links near the GGSN (GPRS and UMTS)
- The IPaddr below the GTP layer tells which SGSN each packet is going to / coming from
- Extract per-SGSN and per-site SAs
- Tracking PDP-context activations and associated GTP tunnel tell associations packet-IMSI, packet-APN, ...
- PDP attributes are exchanged during PDP-activation phase
Discriminating Sub-Aggregates
Monitor Gb links near the SGSN (for GPRS)- Stateful tracking of 3GPP signaling messages enables
maintainance of packet-to-MS and MS-to-cell associations- Enables SA discrimination per-cell, per-RoutingArea,
per-BSC/RNC,...
Monitor IuPS links near the SGSN (for UMTS)- Monitor IuPS links near the SGSN for UMTS- Similar to Gb, but involves different protocols- Resolution granularity is limited to Routing Area
- A Routing Area is a collection of cells, similar to Location Area in GSM
Discriminating Sub-Aggregates

Proof-of-concept: analysis of per-SGSN SAs captured on Gn (near the GGSN) has revealed a capacity bottlenecks on a remote Gn link
- Approach 1: by signal analysis of aggregate rate
- [F. Ricciato, W. Fleischer, Bottleneck Detection via Aggregate Rate Analysis: A Real Case in a 3G Network, IEEE/IFIP NOMS’06, Vancouver, April 2006]
- Approach 2: by estimated frequency of TCP retransmission timeouts (RTO) and round-trip-time (RTT)
- Based on a modified version of tcptrace- [F. Ricciato, F. Vacirca, M. Karner, Bottleneck
Detection In UMTS Via TCP Passive Monitoring: A Real Case, Proc. of ACM CoNEXT'05, October 24-27, 2005, Toulouse]
time
rate
(10s
bin
s)
Radio Netwo
rk
Core Network Internet
GGSN
TCP Data
TCP ACKGn
MS
Recent results
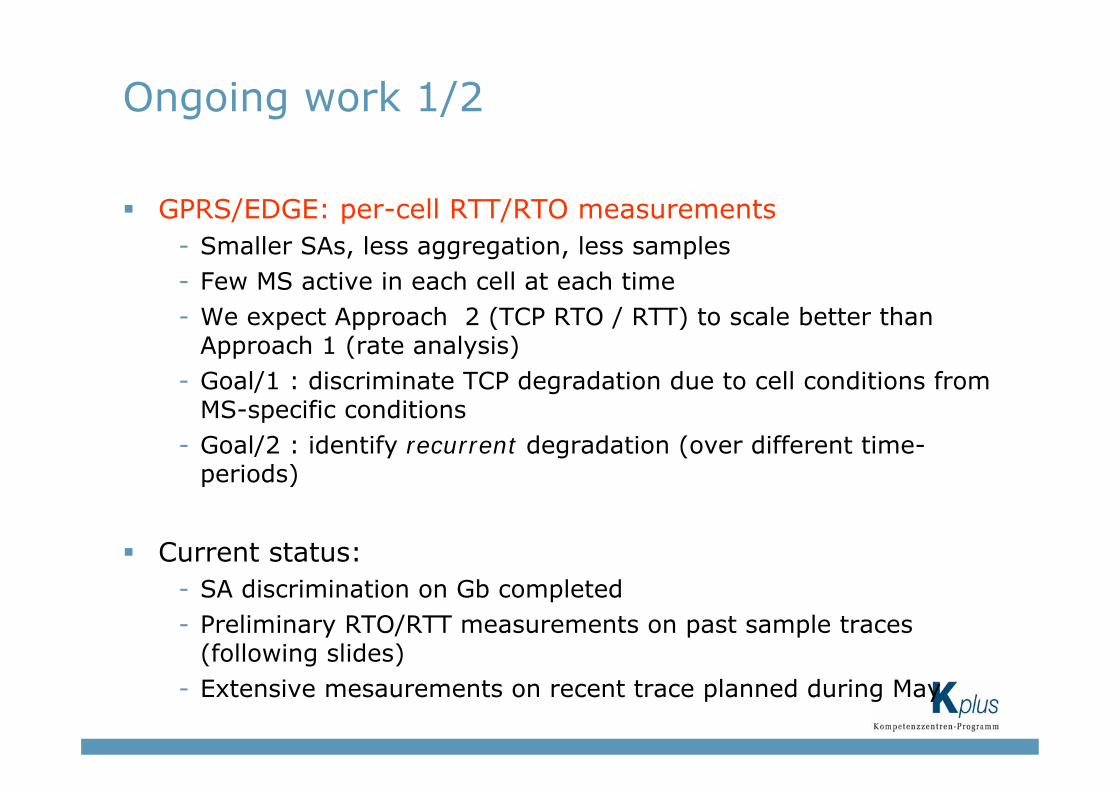
GPRS/EDGE: per-cell RTT/RTO measurements- Smaller SAs, less aggregation, less samples- Few MS active in each cell at each time - We expect Approach 2 (TCP RTO / RTT) to scale better than
Approach 1 (rate analysis)- Goal/1 : discriminate TCP degradation due to cell conditions from
MS-specific conditions- Goal/2 : identify recurrent degradation (over different time-
periods)
Current status: - SA discrimination on Gb completed- Preliminary RTO/RTT measurements on past sample traces
(following slides)- Extensive mesaurements on recent trace planned during May
Ongoing work 1/2

UMTS/HSDPA: per-RNC and per-Routing-Area RTT/RTO - Per-cell SA discrimination from IuPS traffic currently not possible
(limited to per-Routing-Area)- We expect Approach 2 (TCP RTO / RTT) to scale better- Main problem : infer presence of troubles in some cell from
measurements at the RA level (e.g. clusters of high RTO/RTT)
Current status: - SA discrimination on IuPS completed- Preliminary RTO/RTT measurements on sample traces planned in
April/May
Ongoing work 2/2
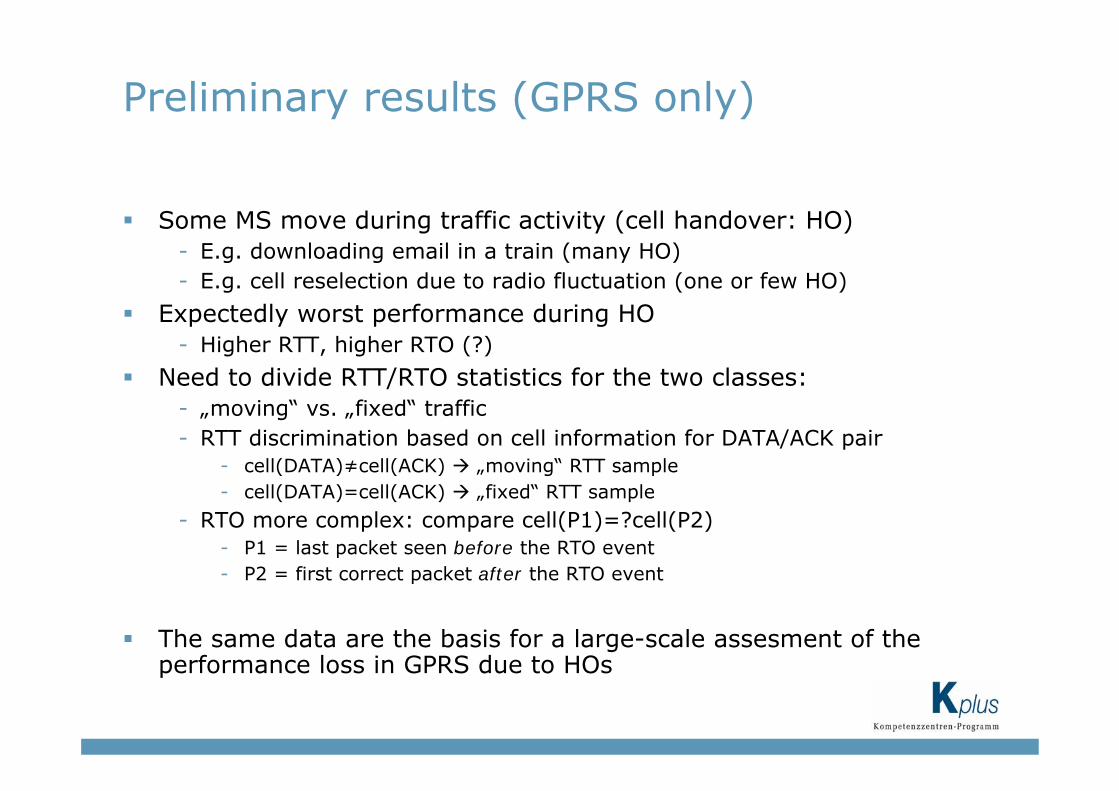
Some MS move during traffic activity (cell handover: HO)- E.g. downloading email in a train (many HO)- E.g. cell reselection due to radio fluctuation (one or few HO)
Expectedly worst performance during HO- Higher RTT, higher RTO (?)
Need to divide RTT/RTO statistics for the two classes:- „moving“ vs. „fixed“ traffic- RTT discrimination based on cell information for DATA/ACK pair
- cell(DATA)≠cell(ACK) „moving“ RTT sample- cell(DATA)=cell(ACK) „fixed“ RTT sample
- RTO more complex: compare cell(P1)=?cell(P2)- P1 = last packet seen before the RTO event- P2 = first correct packet after the RTO event
The same data are the basis for a large-scale assesment of the performance loss in GPRS due to HOs
Preliminary results (GPRS only)

CCDF of RTT samples (10.10.2005 - 2000-2100h, no EDGE yet)
- Median of „moving RTT“ was ~3sec higher
The volume of „moving traffic“ << „fixed traffic“- Relatively few GPRS connections were „moving“ (in
Oct‘2005)- Negligible impact of moving RTT to overall statistics
fixed RTT
moving RTT
Preliminary results (GPRS only):„fixed“ vs „moving“ RTT ccdf

17
.10
.05
20
.10
.05
22
.10
.05
# active MS seen in the cell RTT percentiles RTT percentilesw/o worst-2 MS
estimated RTO frequencies
Preliminary results (GPRS): (per-cell measurements, 2000-2100h for 3 days, only „fixed“ traffic)
The vision - use TCP RTT/RTO measurement from passive monitoring at few sites
in the Core Network ... - ... to detect/infer recurrent problems in the Radio Access Network- ... as input the network (re)optimization process
Current status: - Trace capturing and recovery of packet-IMSI / IMSI-cell associations
- Done, using the METAWIN monitoring system- RTT/RTO extraction
- Done, using modified version of tcptrace for off-line analysis- Extracting preliminary data:
- Done for GPRS, exploration is ongoing. tbd for UMTS- Formalization of inference problem, collection of long-term data
- ... the next steps
More on METAWIN and DARWIN projects- http://userver.ftw.at/~ricciato/darwin- Contact person: Fabio Ricciato, ftw. ([email protected])
Summary and references