formiddag jbn bioenergiklynge workshop … · efter workshoppen får deltagerne et lille regneark...
TRANSCRIPT

Biorefinery valley
Syddanmark – Schleswig/Holstein-ideer til, - indspil til
Bioenergi-strategi i Syddanmark
og Internationalt
Jens Bo Holm-NielsenCentre for Bioenergy
University of Southern Denmark and Aalborg University Esbjerg
Niels Bohrs Vej 8-9, DK-6700 Esbjerg, Denmark
Tel.: +45 7912 7715, cell: +45 2166 2511
E-mail: [email protected] & [email protected]
Web: www.sdu.dk/bio & www.acabs.dk

Den udleverede rapport er kun tænkt som en appetitvækker til selv at sam-tænke videreud fra. Efter workshoppen får deltagerne et lille regneark til at lade sig inspirere af.

Development in global mean temperature
Source: IPCC

Changes in the water balance in the 2050’ties

Global food requirement for three diets: vegetarian: 2388 kcal cap-1 day-1 of which 166 kcal cap-1 day-1 from animal products; moderate: 2388 kcal cap-1 day-1 of which 554 kcal cap-1 day-1
from animal products; and an affluent: 2746 kcal cap-1 day-1 of which 1160 kcal cap-1 day-1 from animal products. The actual population size in 1998 (5.9·109 people) and the estimated
population size in year 2050 (9.37·109 people), as expressed in grain equivalents 109 tons dry weight per year. Adapted from Wolf et al.
14.369.058.215.174.452.80Food requirement[109tTS ·year-1]
205019982050199820501998Year
Affluent diet
Quality diet(Moderate)
Vegetarian diet
Diet type
Based on:Wolf J., Bindraban P.S., Luijten J.C., Vleeshouwers L.M.: Exploratory study on the land area required for global food supply and the potential global production of bioenergy. (2003) “Agricultural Systems”, Vol. 76, 841-861.

Land requirement for moderate diet with population size equal to: 5.9·109 people and the crop yield 6 t TS grain ha-1
·year-1 (1998);9.37·109 people and the crop yield 9 t TS grain ha-1
·year-1 (2050);
2050
1998
Year [ha·person-1·year-1][ha·year-1][tTS·year-1]
0.1468.21 ·1085.17 ·109
0.0979.12 ·1088.21 ·109
Quality diet - Moderate diet

Percentage of present agriculture and arable land required for food production under moderate diet with crop yielding equal to
6 t TS grain·year-1 (1998)and 9 t TS grain·year-1 (2050)
61.4
17.2
8.6·108
14.0·108
50.1·108
5.9·109
World (1998)
65.0
18.2
9.1 ·108
14.0·108
50.1·108
9.37 ·109
World(2050)
62.4Percentage of arable land [%]
36.0Percentage of agricultural area [%]
7.1·107Land requirement [ha·year-1]
11.3·107Arable land [1000 ha]
19.7·107Agricultural area [1000 ha]
4.9·108Population [people]
EU-27

Data of total area and areas of interest for biomass production for each member of EU-27; area data in millions of hectares
0.26268.015.130.1Italy
1.09171.24.47.0Ireland
0.60504.65.99.3Hungary
0.77202.78.413.2Greece
0.213311.817.035.7Germany
0.493318.529.755.2France
0.4372.22.233.8Finland
0.63120.50.84.5Estonia
0.49532.32.74.3Denmark
0.42393.14.37.9Czech Republic
0.18110.10.10.9Cyprus
0.68303.35.311.1Bulgaria
0.13270.81.43.1Belgium
0.42171.43.48.4Austria
Hectares ofagricultural land
per capita
Arable land(106 Ha) (% of total
area)
Agricultural area (106 Ha)
Total area(106 Ha)

Data of total area and areas of interest for biomass production for each member of EU-27; area data in millions of hectares
0.4126113.5196.6433.1EU-27
0.28235.717.024.4U. K.
0.3662.73.245.0Sweden
0.732713.730.250.5Spain
0.2690.20.52.0Slovenia
0.45291.42.44.9Slovakia
0.66399.414.723.8Romania
0.37171.63.79.2Portugal
0.424012.616.231.3Poland
0.12220.91.94.2Netherlands
0.03310.010.010.03Malta
0.28240.060.10.3Luxemburg
1.02452.93.56.5Lithuania
1.08281.82.56.5Latvia
Hectares ofagricultural land
per capita
Arable land(106 Ha) (% of total
area)
Agricultural area (106 Ha)
Total area(106 Ha)
source: FAOSTAT

Energy crop potential in EU-27, depending on percentage of utilized arable land and achieved crop yield
410 Mtoe18,380 PJ274 Mtoe12,253 PJ137 Mtoe6,127 PJ30 t TS/ha
274 Mtoe12,253 PJ182 Mtoe8,169 PJ91 Mtoe4,084 PJ20 t TS/ha
137 Mtoe6,127 PJ91 Mtoe4,084 PJ46 Mtoe2,042 PJ10 t TS/ha
30% arable land in
EU-27
20% arable land in
EU-27
10% arable land in
EU-27Yield
New EU energy plan include a cut in CO2 emissions by at least 20% by 2020. The commission will propose increasing the use of renewable energy sources to 20% of the total demand, to limit global temperature changes to no more than 2°C above pre-industrial levels. It also wants to improve the
EU's energy efficiency by 20%. This would make Europe the most energy-efficient region in the world.

Source: European Commission
182 Mtoe can be achieved from biomass cultivated on 20% of arable land in EU-27.
This corresponds to more than 10% of primary energy demand in 2020, equals 50-60% of the RES share.

Energy demand for transport in EU
365.2277.5Total
223.6147.7Diesel oil
141.6129.8Gasoline
2030[Mtoe]
2000[Mtoe]
Source: Biofuels in the European Union. A vision for 2030 and beyond. Final draft of the Biofuels Research
Advisory Council. (2006)
182 Mtoe corresponds to 65% (2000) and to 50% (2030) of gasoline and diesel oil demand
in EU.

Energy potential of pig and cattle manure in EU-27
18.582720,51931,5681,578
[Mtoe][PJ][106 m3][106 m3][106 tons]
PotentialPotentialMethaneBiogasTotal
manure
Methane heat of combustion: 40.3 MJ/m3; 1 Mtoe = 44.8 PJAssumed methane content in biogas: 65%

Cultivation of non-food crops in Germany in 2006
1,561,000*396,000360,000805,000Total
10,00010,000Pharmaceutical crops
2,0002,000Fibres
18,00018,000Sugar
128,000128,000Starch
295,00077,000188,00030,000Other energy crops(incl.maize)
5,0001,0004,000Sunflower
3,0003,000Oilseed lin
1,100,000318,000172,000610,000Rapeseed
with energy crop premium
without energy crop premium
Set aside
Base areas*Total
Surface area in ha
Raw materials
Source: Shusseler P. Fachagentur Nachwachsende Rohstoffe e.V. (FNR - Agency of Renewable Resources). Personal communication, 2006.
*1,561,000 ha is 13.2% of the German arable land

Energy crops Paradigm shift through land productivity and energy balance
Biogas
Gas cleaning
Heat Electricity Fuel
Fermenter
Digestedplant residue
• The Sun as energy source
• Special energy crops that use the entire vegetation period
• Total digestion of the whole plant
• Nutrient cycle possibleLow Input High Output
• Large installations work efficiently and are friendly towards the environment
• Upgrading of biogas enables completeutilisation of the crop (the gas can bestored)
• Biorefineries;biothanol/biogas/biodiesel
Source: KWS

Cultivation target:Stepwise increase of the energy yield to
approximately 100 % in 10 years
Nowadays silo maize varieties
Energy Maize
15 – 18 t/ha
30 t/ha
Source:KWS

Growth Progress of a Conventional Silo Maize (SM) and an Energy Maize (EM)
Clearly later harvest of the Energy Maize
GTM-yield/ha
Flowering
SM
FloweringEM
HarvestSM
HarvestEM
Time
Source: KWS

Source: Report from the Danish working Group on the Co-existence of Genetically Modified Crops with Conventional and Organic Crops (DJF, 2003)

Harvest of energy maize
Source: KWS

Source: R. Braun, IFA, Austria

The Green Biorefinery
Source:
P. Kiel & J.B. Holm-Nielsen
University of Southern Denmark
1994

Source: T. Al Seadi, Department of Bioenergy, SDU, Denmark

Source: T. Al Seadi, Department of Bioenergy, SDU, Denmark

Source: T. Al Seadi, Department of Bioenergy, SDU, Denmark

. Ribe Biogas; 15 years of production, 18.000 m3 biogas/day. Source J. B. Holm-Nielsen, Bioenergy Dept., SDU, Denmark.

Process Analytical Technologies for Anaerobic Digestion Systems
- Robust Biomass Characterisation, Process Analytical Chemometrics, and
Process Optimisation

World energy scenarios – Future goals
371 000 PJSum: 1+2+3+5
152 000 PJ30% of arable land – World Wide
(20tTS/ha)6.
101 000 PJ20% of arable land – World Wide
(20tTS/ha)5.
Holm-Nielsen J.B., Madsen M., Popiel P.O.: Predicted energy crop potentials for
biogas/bioenergy. Worldwide – regions
– EU25. AAUE/SDU. Workshop: Energy crops & Bioenergy.
51 000 PJ10% of arable land – World Wide
(20tTS/ha)4.
150 000 PJ/yearForest/pastures (50%)3.
45 000 PJ/yearCollected waste processing (50%)2.
Sanders J.: Biorefinery, the bridge between
Agriculture and Chemistry. Wageningen University and Researchcenter. Workshop: Energy crops & Bioenergy.
75 000 PJ/yearNon collected straw (50%)1.
SourceNo.
Shell’s World Energy Scenario1 300 000 PJ/yearTotal energy demand year 2050
Sanders J.: Biorefinery, the bridge between
Agriculture and Chemistry. Workshop: Energy crops & Bioenergy.
1 000 000 PJ/yearTotal energy required year 2050
SourcePredicted value

Tak for opmærksomheden!

Pendlingsmønstret i Danmark
Kilde: Thomas Sick Nielsen. Institut for Skov og Landskab, KU
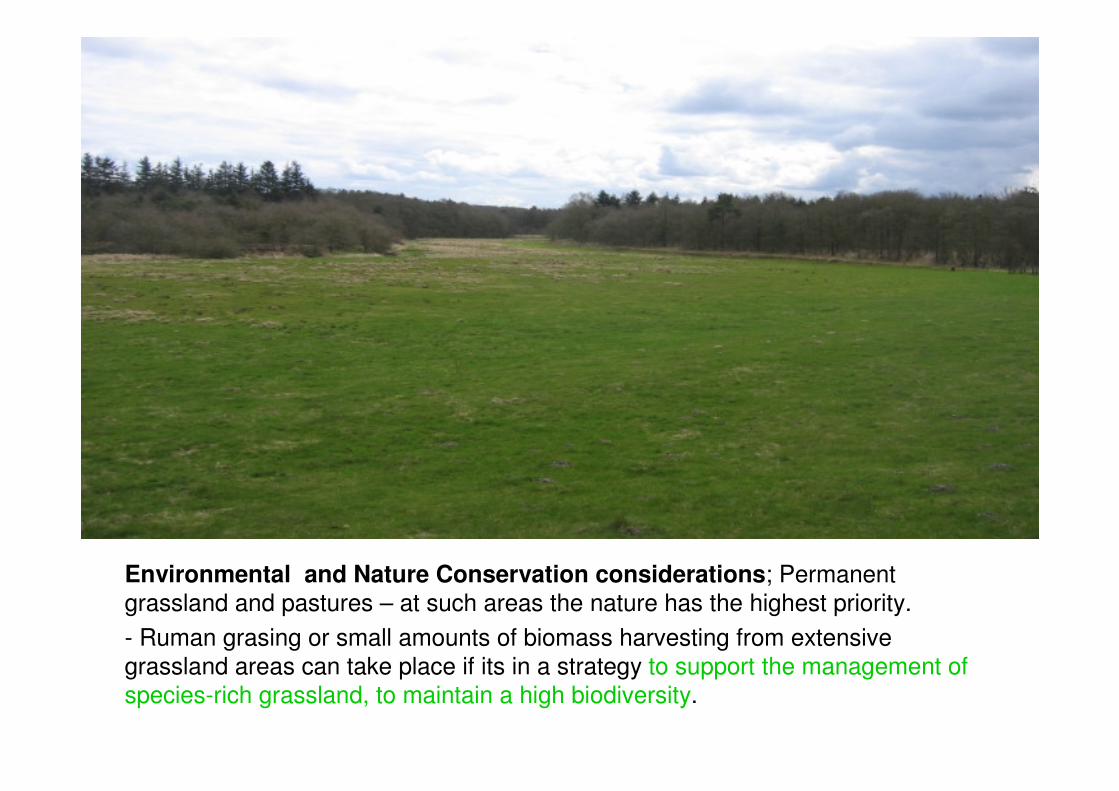
Environmental and Nature Conservation considerations; Permanent grassland and pastures – at such areas the nature has the highest priority.
- Ruman grasing or small amounts of biomass harvesting from extensive grassland areas can take place if its in a strategy to support the management of species-rich grassland, to maintain a high biodiversity.

Suggestions of regulations of biomass production forfood – feed – fuels, in a framework of environmental
sustainable and climate protection restoring conditions.
The natural resource areas must not be involved in commercial biomass production (e.g. environmental sensitive areas in Europe, natural rainforest areas and all other nature sensitive areas around the world).
4.
Biomass must only originate from the existing environmentally sustainable commercial agricultural and forestry areas;
3.
Biofuels production facilities have to be equipped with the best energy saving and energy efficient technologies (Best Available Technology - BAT standard).
2.
Reduction of CO2 emissions targets have to be minimum 70% of the CO2
reduction obtained by utilizing CHP conversion of biomass, in comparison with fossil fuel utilisation for the process energy.
1.
Suggestions of regulations of biomass production for
food – feed – fuels

Suggestions for international cooperation in the frame of EU, UN, FAO or other organisations, for implementing regulatory
mechanisms and framework conditions.
Prohibit any involvement of the nature resource areas in commercial biomass production activities.
d.
Acting as a tool for restoring climate and preventing further climate change.
c.
Sustainable rural development, paradigm change, new ways of rural economy.
b.
Environmentally and economically sustainable biomass production conditions at commercial farming and forestry areas.
a.
International CODEX of Biomass production forFOOD – FEED – FUELS