formation of the river water chemistry in the middle
TRANSCRIPT

ISSN: 0973-4945; CODEN ECJHAO
E-Journal of Chemistry
http://www.e-journals.net 2011, 8(2), 727-738
Formation of the River Water Chemistry in the
Middle Section of Dousitu River, China
QIAN HUI, LI PEIYUE, DING JIA, YANG CHAO and ZHANG XUEDI
School of Environmental Science and Engineering
Chang’an University, Xi’an, Shaanxi, 710054, China
Received 19 July 2010; Accepted 5 September 2010
Abstract: On basis of hydrogeology of the study area, the characteristics of
chemistry of river water and groundwater were analyzed. Analysis results of three
river water samples (B3, B4 and B5) collected in the middle section of Dousitu
River show the TDS increases from B3 to B4 and decreases from B4 to B5. The
concentrations of Cl-, Na+, K+, Mg2+ and HCO3- have a similar change with TDS,
but the concentrations of Ca2+ and SO42- increase steadily along flow path. The
chemical types of the river water change from HCO3•Cl-Na to Cl•SO4•HCO3-Na,
and finally to SO4•Cl-Na. The causes of these changes are analyzed and studied in
depth using various methods. Results indicate river water evaporation,
dissolution/precipitation of minerals, cation exchange and mixing of different
waters all play important roles in the formation of the river water chemistry. But in
different sections of the river, the main processes are different. The study shows
that when a reservoir is built in arid areas, the loss of water resources due to
evaporation is huge, which can lead to the degradation of water qualities. Hence,
great care should be taken to build a reservoir in arid or semi-arid regions.
Keywords: Hydrochemistry, Evaporation, Dissolution, Precipitation, Groundwater-surface water
relations, Hydrochemical modeling
Introduction
The formation of river water chemistry has always been the hot topic in hydrology and
hydrogeology. It is of great importance to study the formation and evolution of river water
chemistry for the purpose of river water quality protection and river ecology protection.
Many hydrologists and hydrogeologists around the world have done some significant studies
in this interesting and important field. Ronald J. Gibbs1 studied the water chemistry data of
the Amazon River in 1972. In his study, he recalculated the mean dissolved salts
concentration. The calculated results showed that the mean dissolved salts concentration is
11 percent lower than previous calculations for South American rivers and 2.6 percent lower

728 QIAN HUI et al.
than previous calculations for the rivers of the world. Rothwell et al.2 studied the spatial and
seasonal patterns of river water chemistry at approximately 800 sites in Northwest England and
found that there is a clear distinction between the uplands and lowlands in water quality. Upland
waters are acidic and have low concentrations of base cations, explained by background
geological sources and land cover, while in the lowlands, both past and present human activities
have a major impact on river water chemistry. Hein H. van Kleef et al.3 studied the changes
caused by reduced acidifying deposition in 68 Dutch moorland pools in 2010. Smolders et al 4
revealed the intra-annual variability of the major ion composition of the Pilcomayo River, and
its relationship to discharge. There are many more scientists5-9
paying their attention to the river
chemistry study from various aspects all over the world.
Dousitu River is one of the tributaries of the Yellow River. The source of the river is
near Etuok County of Inner Mongolia, China. It flows from east to west and intersects the
Yellow River near Xinjian Yidui (Figure 1). The length of the river is 166 km, and the
drainage area is 4160 km2. The average annual
10 runoff of the river is 1264×10
4 m.
G1
G2G3
G4
G5
G6
G7
G8
G9G10
G11G12
G13
G14
G15
G16G17
B1B2
B3B4
B5
Damiao
Xinjian Yidui Etuok County
Baoritelehai
Chahannao
Wuzhuer Town
Dousitu River
Luohandong Group
Huanhe Group
0 20 40km
G Groudwater smpling points
BRiver water smpling points
Figure 1. Location of the study area and the sampling position
The Dousitu River drainage basin is situated in an arid area of north-western China. The
main characteristics of the climate are a long and cold winter as well as a short and warm
summer. According to the monitoring data in Etuok County, the annual temperature in the
area changes from 5.3 to 8.9 oC and has an average value of 6.9
oC. The precipitation mainly
occurs between June and August. The annual precipitation ranges from 125.2 mm to 611.6
mm, and has an average value of 267.5 mm. Evaporation is intensive, and the intensity is
between 1947.7 and 2494.9 mm.
In the middle section of Dousitu River (B3 to B5 in Figure 1), the changes of the
chemistry of river water are interesting. The TDS of the river water increases from B3 to B4,
but decreases from B4 to B5. The concentration of Cl-, Na
+, K
+, Mg
2+ and HCO3
- has a
similar change with TDS, but the concentration of Ca2+
and SO42-
increases steadily from B3
to B5. Accordingly, the chemical type of river water changes from HCO3•Cl-Na to SO4•Cl – Na.

Formation of the River Water Chemistry 729
What are the reasons for the changes of the chemistry of the river water? What recharge and
discharge relationship between river water and groundwater can be drawn from these
changes? This paper gives a detailed analysis.
Method Geology and Hydrogeology In recent years, much research work has been done in Ordos Cretaceous Artesan Basin
(CAB)11-14
. Based on the hydrogeolology, recharge and discharge characteristics of
groundwater, CAB can be divided into 5 groundwater flow systems15,16
. Dousitu River
drainage basin is one of them. According to the lithology and geological age of the strata, the
aquifers in the Dousitu River drainage basin can be divided into four groups16-18
. From the
top down, they are the Cenozoic group, the Luohandong group, the Huanhe group and the
Luohe group, respectively. There is no continuous aquitard between these aquifers18,19
.
The Cenozoic group is composed of Tertiary and Quaternary strata. The lithology of the
Quaternary stratum, which covers the whole studied area, is mainly composed of fine sand
of wind, flood or river deposition, with a light yellow or grey color. The lithology of the
Tertiary strata is mainly sandstone and mudstone, rich in gypsum and other easily dissolving
salts. It occurs primarily in the western part of the studied area (Figure 1).
The Luohandong group occurs mainly in the western part of the studied area (Figure 1).
In most parts of the area, it is overlain by Tertiary stratum. It is a set of continental clastic
rocks of early Cretaceous age. The maximum thickness of the formation in the region is
more than 200 m. The lithology is primarily sandstone, coarse sandstone interbeded by fine
sandstone, conglomerate, and sandy gravel.
The Huanhe group exists in the whole studied area (Figure 1). In the eastern part, apart
from a few outcrops, the group is overlain by Quaternary stratum. In the western part, the
Huanhe group is overlain by the Luohandong group. The Huanhe group is also a set of
continental clastic rock formed in the early Cretaceous period. The maximum thickness of
the group in the region is more than 500 m. The lithology is primarily conglomerate, sandy
gravel, sandstone and becomes finer downward.
The Luohe group does not outcrop in the studied area. It is overlain by the Huanhe
group in the whole region. The lithology of the group is mainly continental clastic rock of
sandstone, mudstone, conglomerate and sandy gravel formed in the early Cretaceous period.
The maximum thickness of the group in the region is more than 300 m.
In the Dousitu River drainage basin, groundwater is mainly recharged by precipitation. In the horizontal direction, the groundwater in all the aquifers of the north bank flows from north-east to south-west, and the groundwater in all the aquifers of south bank flows from south-east to north-west
20. In the vertical direction, the level of shallow groundwater in
eastern part of the study area is higher than that of deep groundwater, so the water flows downward, whereas the level of deep groundwater in the western part of the study area is higher than that of shallow groundwater and the water flows upward. The discharge of groundwater in the region is mainly to the Dousitu River, pumping for irrigation, and drinking as well as the outflow to western boundary.
Chemical characteristics of river water and groundwater
To study the chemistry of river water and groundwater, 22 water samples including 5 river water
samples and 17 groundwater samples were collected (in September 2004) for chemical analysis.
Table 1 lists the chemical analysis results. In the table, G1~G17 are groundwater, B1~B5 are river
water. SIcal, SIgyp, and SIdol are the saturation indices of calcite, gypsum and dolomite, respectively.

Table 1. Chemical analysis results of Dousitu river water and nearby groundwater (Unit: mg/L)
Sample No. Aquifer TDS pH Na+ K
+ Ca
2+ Mg
2+ Cl
- SO4
2- HCO3
- CO3
2- SIcal SIdol SIgyp
G1 Huanhe 327.53 7.7 23.11 60.96 25.34 42.79 35.54 155.05 0 -0.019 -0.381 -2.044
G2 Huanhe 629.77 8.025 130.23 47.095 26.745 40.415 44.43 358.475 0 0.526 0.843 -2.114
G3 Huanhe 592.56 7.6 125.2 44.1 29.2 39 76.8 341.7 0 0.034 -0.075 -1.91
G4 Huanhe 524.36 7.7 184 15.03 4.38 145 95.1 161.7 0 -0.636 -1.771 -2.233
B1 River 606.07 8.3 190 3.65 21 17.1 83.6 95.6 357 6 0.441 0.828 -2.14
B2 River 619.18 8.4 190 4.55 26.1 8.3 99.3 121.5 308.1 9 0.574 0.685 -1.939
G5 Huanhe 362.15 7.7 99.8 21.4 12.3 44 59.6 222.1 0 -0.318 -0.842 -2.248
G6 Huanhe 268.17 7.4 22.5 52.1 5.5 16 40.8 115.9 0 -0.5 -1.942 -1.982
G7 Huanhe 384.71 8.4 83.62 36.37 19.5 62.47 64.22 158.83 6.24 0.481 0.729 -2.015
G8 Huanhe 243.57 8.8 95.6 2.81 0.36 32.98 40.83 129.97 12 -0.254 -1.364 -3.224
B3 River 755.12 8.4 250 5.45 22 13.1 122.3 145.5 363.1 12 0.547 0.905 -1.974
G9 Cenozoic 461.62 7.6 77.17 21.91 56.97 47.03 55.83 405.42 0 -0.198 0.055 -2.368
G10 Huanhe 566.53 7.6 189 16.89 13.84 109.92 132.56 206.64 0 -0.603 -1.259 -2.072
G11 Huanhe 525.02 8.85 170.4 16.5 0 80.7 205.3 98.55 3.6 0.334 -8.519 -1.884
G12 Luohe 905.74 8.1 244.8 61.1 0.6 76.2 492.8 59.8 0 -0.156 -2.295 -1.067
B4 River 2922.74 8.3 1010 18.5 26.1 47.1 616.8 734.9 912.2 9 0.699 1.69 -1.532
G13 Luohandong 576.13 8 93.45 72.37 29.67 160.33 136.25 168.12 0 0.334 0.318 -1.483
G14 Luohandong 2656.725 7.87 856.755 54.91 100.4 722.355 546.195 554.34 0 0.403 1.11 -1.315
G15 Luohandong 748.345 7.92 213.24 17.535 24.31 148.015 199.815 226.675 0 -0.249 -0.322 -1.935
G16 Huanhe 703.17 7.5 146.23 51.04 36.56 129.16 140.11 203.8 0 -0.257 -0.622 -1.627
G17 Huanhe 1095.4 8 273.01 70.41 46.29 379.48 184.51 283.4 0 0.484 0.825 -1.47
B5 River 1854.52 8.1 535 3.65 66.1 15.6 352.7 780.5 170.9 3 0.247 -0.104 -0.987
73
0
QIA
N H
UI et a
l.

TD
S,
g/L
Cl- ,
mg
/L
Na+
, m
g/L
Ca2
+,
mg
/L
HC
O3
- , m
g/L
K+,
mg
/L
Mg
2+,
mg
/L
SO
42
- , m
g/L
Formation of the River Water Chemistry 731
The sampling location of these water samples is shown in Figure 1. The water samples
in Table 1 are put along the flow direction. For example, the water samples before B1 in Table 1
are in the upper part of B1, the water samples between B2 and B3 are in the upper part of B3
and lower part of B2 .
Figure 2 shows the changes of TDS and concentrations of major species in river water
along the flow path. It can be seen from the figure that the TDS and the concentrations of
major species in river water remain basically unchanged from B1 to B3. From B3 to B4,
except the concentration of Ca2+
, TDS and concentrations of other species increase greatly.
From B4 to B5, except the concentrations of Ca2+
and SO42-
, TDS and concentrations of other
species decrease to some extent.
B1 B2 B3 B4 B5
0
1000
2000
3000
B1 B2 B3 B4 B5
0
400
800
B1 B2 B3 B4 B5
0
400
800
1200
B1 B2 B3 B4 B5
0
40
80
B1 B2 B3 B4 B5
0
500
1000
B1 B2 B3 B4 B5
0
10
20
B1 B2 B3 B4 B5
0
40
80
B1 B2 B3 B4 B5
0
400
800
Figure 2. Changes of TDS and concentrations of major species along flow path
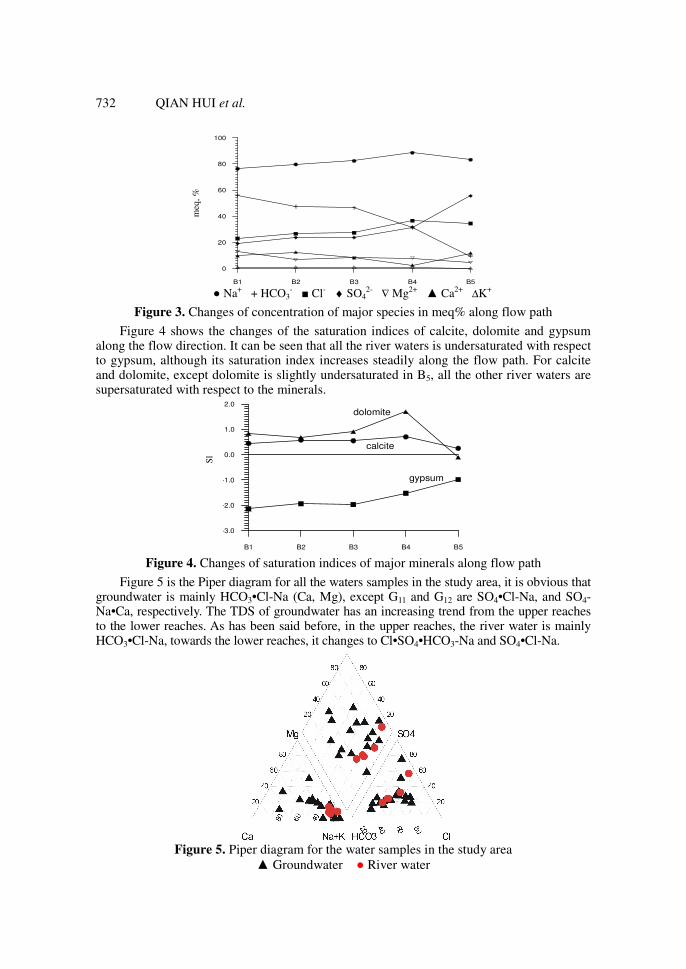
Figure 3 shows the changes of concentration of major cations and anions in meq%
along the flow path. Similarly, from B1 to B3, the concentration of all the species in meq% is
relatively steady. The concentration of Na+ in meq% is greater than 75% for all the river
waters and is obviously the primary species of all the cations. By contrast, the changes of the
concentration of anions in meq% are relatively large. From B1 to B5, HCO3- in meq%
decreases while Cl- and SO4
2- in meq% increase. The main anion in B1, B2 and B3 is HCO3
-,
Cl- and SO4
2- rank second and third respectively. From B4 to B5, the main anions change
from HCO3- to Cl
- and SO4
2-. So the chemical type of river water in B1, B2, and B3 is HCO3-
Na or HCO3•Cl-Na, in B4 it changes to Cl•SO4•HCO3-Na, in B5, it becomes SO4•Cl –Na.
meq
, %
Sl
732 QIAN HUI et al.
B1 B2 B3 B4 B5
0
20
40
60
80
100
● Na+ + HCO3
- ■ Cl- ♦ SO42- ∇ Mg2+ ▲ Ca2+ ∆K+
Figure 3. Changes of concentration of major species in meq% along flow path
Figure 4 shows the changes of the saturation indices of calcite, dolomite and gypsum along the flow direction. It can be seen that all the river waters is undersaturated with respect to gypsum, although its saturation index increases steadily along the flow path. For calcite and dolomite, except dolomite is slightly undersaturated in B5, all the other river waters are supersaturated with respect to the minerals.
B1 B2 B3 B4 B5
-3.0
-2.0
-1.0
0.0
1.0
2.0
gypsum
dolomite
calcite
Figure 4. Changes of saturation indices of major minerals along flow path
Figure 5 is the Piper diagram for all the waters samples in the study area, it is obvious that groundwater is mainly HCO3•Cl-Na (Ca, Mg), except G11 and G12 are SO4•Cl-Na, and SO4-Na•Ca, respectively. The TDS of groundwater has an increasing trend from the upper reaches to the lower reaches. As has been said before, in the upper reaches, the river water is mainly HCO3•Cl-Na, towards the lower reaches, it changes to Cl•SO4•HCO3-Na and SO4•Cl-Na.
Figure 5. Piper diagram for the water samples in the study area
▲ Groundwater ● River water

Formation of the River Water Chemistry 733
From the above discussion we know the major changes of the chemistry of river water
occurred between B3 to B5, which is in the middle section of the Dousitu River. So the river in
this section is divided into two parts for the study, which are B3-B4 and B4-B5, respectively.
Water chemistry changes from B3 to B4
From B3 to B4, the TDS and concentration of major species in river water increase to
different degrees. According to field investigation, a dam was built in B4 in 1978. Though
the dam is only 20 m high, it forms an open water surface of about 4.5 km2. The direct result
is the intensive evaporation of river water. Furthermore, the samples collected on 8~9
September, 2004 has experienced intensive evaporation during the whole summer. So the
increase of TDS and concentration in B4 is understandable. Further analysis of the chemistry
of river water from B3 to B4 indicates the increase is different for different species. The
concentrations of Cl-, SO4
2-, Na
+, Mg
2+, K
+ and TDS in B4 are 5.04, 5.05, 4.04, 3.6, 3.39 and
3.87 times of that in B3, respectively. While the increases of Ca2+
and HCO3- are relatively
small, and their concentrations in B4 are only 1.19 and 2.51 times of that in B3.
The river water in B4 is mainly recharged by upstream river water and groundwater. Because
the chemistry of river water and groundwater in the upper part of B4 are similar, the river water in
B3 is used as the recharging water to analyze the formation of the chemistry of river water in B4.
Estimation of evaporation proportion
If there were no effects of chemical reactions, the increase rate of the concentrations of various
species should be same under the sole influence of evaporation. The above-mentioned different
concentration increase rates for different species indicates the formation of the river water
chemistry in B4 has been affected by some chemical reactions. For the following reasons, the
main reactions are the dissolution of gypsum and halite, as well as the precipitation of calcite.
(1) The study area is located in the arid region, the Tertiary stratum scattered in the area
contains large amount of gypsum and halite. The river water in the area is all
undersaturated with respect to these minerals.
(2) River water in B3 and B4 is supersaturated with respect to calcite, and the concentration
increase rates of Ca2+
and HCO3- are apparently smaller than that of Cl
-, SO4
2-, Na
+,
Mg2+
and K+. Where have the Ca
2+ and HCO3
- gone during the process of evaporation?
Precipitation of calcite is the natural answer.
To estimate the evaporation proportion during the formation of river water chemistry in
B4, the effects of chemical reactions to the changes of the concentrations of various species
should be analyzed first. Because of the dissolution of halite, the concentrations of Cl- and
Na+ will increase on the basis of evaporation. So under the sole influence of evaporation, the
concentration increase rates of Cl- and Na
+ from B3 to B4 should be smaller than the present
values of 5.04 and 4.04. In other words, evaporation proportion estimated by the
concentration increase rates of Cl- and Na
+ will be larger than the real value, although we do
not know this value up to now. Because of the dissolution of gypsum, evaporation
proportion estimated by the concentration increase rate of SO42-
will also be too large.
Compared with the above species, estimates based on the increase rates of Ca2+
and HCO3-
(1.19 and 2.51, respectively) are smaller than the real value because of the precipitation of
calcite. Since the precipitation of calcite is mainly caused by the dissolution of gypsum, the
contribution of dissolution of gypsum and halite to the increase of TDS is lager than the
decrease caused by the precipitation of calcite. Therefore the evaporation proportion estimated
by the increase rate of TDS (3.87) is also larger than the real value. Through the above

734 QIAN HUI et al.
analysis, the increase rate caused solely by evaporation should be in the range of 2.51 to 3.87.
Considering the increase rates of Mg2+
and K+ (3.6 and 3.39, respectively), the average value
of their increase rates is used to estimate the effects of sole evaporation. That is to say, in the
process of formation of the chemistry of river water from B3 to B4, the concentration increase
rate caused solely by evaporation is 3.5, or the evaporation proportion in B4 is 71.43%.
Reactions forming the chemistry of river water in B4
The chemistry of river water in B3, B4 and the residual water after evaporation (WAE) by the
above proportion are compared in Table 2. It is clear although the chemistry of WAE is close
to the river water in B4, but the two have distinct differences. These differences are mainly
caused by chemical reactions. According to the saturation indices in Figure 4, halite and
gypsum are under saturated in B3 and B4, while calcite is supersaturated. So the main
reactions forming the chemistry of B4 are thought to be the dissolution of halite and gypsum,
the precipitation of calcite and degassing of CO2, the later is the common reaction
accompanying the precipitation of calcite.
Table 2 Comparison of the water chemistry of B4,B3 and WAE (Unit: mg/L)
No. TDS Na+ K
+ Ca
2+ Mg
2+ Cl
- SO4
2- HCO3
- CO3
2-
B3 755.12 250 5.45 22 13.1 122.3 145.5 363.1 12 WAE 2642.92 875 19.08 77 45.85 428.05 509.25 1270.85 42
B4 2922.74 1010 18.50 26.1 47.1 616.8 734.9 912.2 9
NaCl = Cl- + Na
+ (1)
CaSO4 = SO42-
+ Ca
2+ (2)
CO32-
+ Ca2+
= CaCO3 (3)
H2CO3 = CO2 +H2O (4)
At the same time, because the dissolution of halite can not solely explain the increase of Na
+ in B4 and the concentration of Mg
2+ increased in B4 compared with B3. Considering the
flow rate of river water decreased a lot in B4 because of the building of the reservoir and a thick layer of fine deposits formed in the reservoir bottom. So the above changes of the cation concentration are explained by the following reactions.
K+
+ NaX = Na+
+KX (5)
Ca2+
+ 2NaX = 2Na+
+CaX2 (6)
Ca2+
+MgX = Mg2+
+ CaX (7)
The method of mass balance is used to calculate the amount of chemical reactions (1) ~ (7) during the formation of the chemistry of river water in B4 from WAE. Table 3 lists the calculated results. In the table, the amounts of chemical reactions (5) ~ (7) are denoted by adsorbed amount of K
+, Ca
2+ and Ca
2+, respectively. The calculated results in Table 3
confirmed the qualitative guess. That is during the formation of chemistry of river water in B4 from WAE, the dissolution of halite and gypsum, the precipitation of calcite and the degassing of CO2 are the main reactions. Cation exchanges between K
+ and Na
+, Ca
2+ and
Na+ and Ca
2+ and Mg
2+ also play certain roles.
Table 3. Results of chemical reactions in B4 from WAE (Unit: mmol/L)
(1) (2) (3) (4) (5) (6) (7)
5.39 2.35 -3.33 -3.09 -0.01 (K+) -0.24 (Ca
2+) -0.05 (Ca
2+)
In fact, during the processes of the formation of the chemistry of river water in B4,
mineral dissolution and precipitation, cation exchange and evaporation occur at the same
time. But evaporation is the main process, which caused the subsequent chemical reactions.
The two is separated for the convenience of analysis in our discussion.
Formation of the River Water Chemistry 735
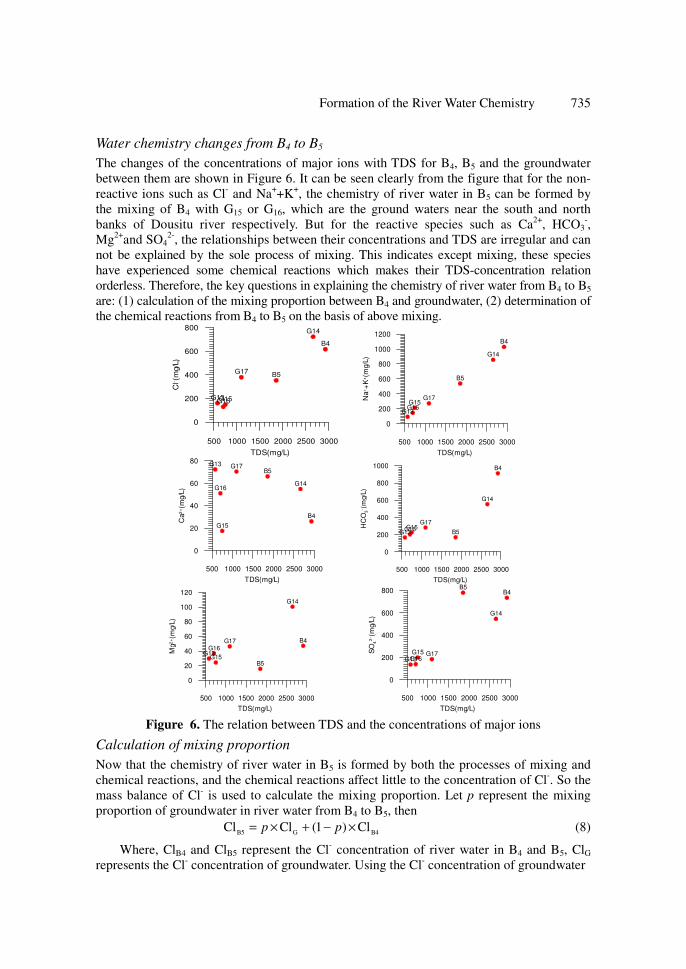
Water chemistry changes from B4 to B5
The changes of the concentrations of major ions with TDS for B4, B5 and the groundwater
between them are shown in Figure 6. It can be seen clearly from the figure that for the non-
reactive ions such as Cl- and Na
++K
+, the chemistry of river water in B5 can be formed by
the mixing of B4 with G15 or G16, which are the ground waters near the south and north
banks of Dousitu river respectively. But for the reactive species such as Ca2+
, HCO3-,
Mg2+
and SO42-
, the relationships between their concentrations and TDS are irregular and can
not be explained by the sole process of mixing. This indicates except mixing, these species
have experienced some chemical reactions which makes their TDS-concentration relation
orderless. Therefore, the key questions in explaining the chemistry of river water from B4 to B5
are: (1) calculation of the mixing proportion between B4 and groundwater, (2) determination of
the chemical reactions from B4 to B5 on the basis of above mixing.
500 1000 1500 2000 2500 3000
TDS(mg/L)
0
200
400
600
800
Cl- (
mg/L
)
B4
G13
G14
G15G16
G17 B5
500 1000 1500 2000 2500 3000
TDS(mg/L)
0
200
400
600
800
1000
1200
Na
++
K+(m
g/L
)
B4
G13
G14
G15G16
G17
B5
500 1000 1500 2000 2500 3000
TDS(mg/L)
0
20
40
60
80
Ca
2+(m
g/L
)
B4
G13
G14
G15
G16
G17B5
500 1000 1500 2000 2500 3000
TDS(mg/L)
0
200
400
600
800
1000
HC
O3
- (m
g/L
)
B4
G13
G14
G15G16G17
B5
500 1000 1500 2000 2500 3000
TDS(mg/L)
0
20
40
60
80
100
120
Mg
2+(m
g/L
)
B4
G13
G14
G15
G16G17
B5
500 1000 1500 2000 2500 3000
TDS(mg/L)
0
200
400
600
800
SO
42
- (m
g/L
)
B4
G13
G14
G15G16
G17
B5
Figure 6. The relation between TDS and the concentrations of major ions
Calculation of mixing proportion
Now that the chemistry of river water in B5 is formed by both the processes of mixing and
chemical reactions, and the chemical reactions affect little to the concentration of Cl-. So the
mass balance of Cl- is used to calculate the mixing proportion. Let p represent the mixing
proportion of groundwater in river water from B4 to B5, then
B4GB5Cl)1(ClCl ×−+×= pp (8)
Where, ClB4 and ClB5 represent the Cl- concentration of river water in B4 and B5, ClG
represents the Cl- concentration of groundwater. Using the Cl
- concentration of groundwater

736 QIAN HUI et al.
G15, G16 and their average value, the mixing proportion of groundwater in river water from
B4 to B5 can be calculated by equation (8). Table 4 lists the calculated mixing proportion and
the corresponding composition of simply-mixed water. In the table, row B4-G15, B4-G16 and
B4-Gavg are the mixed results of B4 with G15, G16, and Gavg, respectively. One thing should be
noted is that Gavg is the simple half-and-half mixing of G15 and G16.
Table 4. Calculated mixing proportion and the corresponding concentrations of mixed
waters (unit: mg/L)
No. P, % TDS Cl- Na
++K
+ Ca
2+ Mg
2+ SO4
2- HCO3
-
B4 2922.74 616.80 1028.50 26.10 47.10 734.90 912.20 B4-G15 56.337 1697.75 352.70 561.13 21.27 34.26 433.45 526.00 B4-G16 54.158 1720.67 352.70 542.20 39.61 41.39 412.77 528.54 B4-Gavg 55.226 1709.43 352.70 551.48 30.62 37.90 422.91 527.30
B5 1854.52 352.7 538.65 66.10 15.60 780.50 170.90
Table 4 shows when the mixing proportion based on mass balance of Cl-
is used, the
calculated concentration of Na++K
+ for the 3 sets of mixed water equals approximately to
that of river water in B5. This is because the property of Na++K
+ is similar to Cl
- and they all
belong to the relatively non-reactive ions. But for the reactive species of Ca2+
, Mg2+
, SO42-
and HCO3-, it is obviously improper to explain the chemistry of river water in B5 only by the
simple process of mixing. Considering the hydrogeology and calculated saturation indices of
minerals, the deviations between the simply-mixed water and B5 will be explained by the
dissolution of gypsum and the precipitation of calcite and dolomite.
Dissolution of gypsum
According to the calculated results in Table 4, the concentration of SO42-
in B5 should be
412.77~433.45 mg/L, if it were formed by the simple mixing. The actual concentration of
SO42-
in B5 is 780.5 mg/L. Since the river water in B4, B5 and the groundwater between them
are all undersaturated with respect to gypsum (Table 1) and the Cenozoic group in the area is
rich in gypsum, it is reasonable to think the extra SO42-
comes from the dissolution of
gypsum through the following reaction:
CaSO4•2H2O = Ca2+
+SO42-
+2H2O (9)
Using the calculated results in Table 4, when the amounts of gypsum dissolved by the
mixed water B4-G15, B4-G16 and B4-Gavg are 3.615 (= (780.5-433.45)/96), 3.831 and
3.725 mmol/L, respectively, the final results will be the concentration of SO42-
in B5.
Precipitation of calcite and dolomite
The dissolution of gypsum introduced Ca2+
into the water, for the mixed water B4-G15, B4-
G16 and B4-Gavg, the introduced Ca2+
are 144.60 (=3.615×40), 153.22 and 149.00 mg/L,
respectively. Hence, the concentration of Ca2+
after mixing and dissolution of gypsum
should be 165.87(=21.27+144.60), 192.83 and 179.62 mg/L, respectively. The actual
concentration of Ca2+
in B5 is 66.10 mg/L. The logical explanation for Ga2+
losses is the
precipitation of calcite through the following reaction:
Ca+2HCO3- = CaCO3+CO2+H2O (10)
This is also in accordance with the calculated saturation indices of calcite in B4 and B5. It can be seen from equation (10) that with 1 mol precipitation of Ca
2+, there will be 2 mol
decrease of HCO3- in the solution. Therefore, for the mixed water B4-G15, B4-G16, and B4-
Gavg, the concentration decreases of HCO3- caused by the precipitation of calcite are 304.31
(=2×61×(165.87-66.10)/40), 386.53 and 346.22 mg/L, respectively.

TDS, mg/L
HC
O,
mg
/L
Formation of the River Water Chemistry 737
At the same time, compared with 15.6 mg/L of Mg2+
in B5, the concentration of Mg2+
in
the mixed water is obviously too large. It will precipitate by dolomite just as Ca2+
in the
manner of calcite. Using the similar method, the concentration decrease of HCO3- caused by
the precipitation of dolomite for the mixed water B4-G15, B4-G16 and B4-Gavg are 94.86
(=2×61×(34.26-15.60)/24), 131.10 and 113.36 mg/L, respectively.
It can be seen from the above discussion that the concentration of HCO3- in the mixed
water of B4-G15, B4-G16 and B4-Gavg should be 570.07 (170.90+304.31+94.86), 688.53 and
630.48 mg/L, respectively if the dissolution of gypsum and the precipitation of calcite and
dolomite were not happened after the mixing of B4 with groundwater.
Restored results
In this paper, the restored concentration is defined as the concentration of mixed water without
chemical reactions or before chemical reactions which can get the concentration of B5 after the
chemical reactions happens. According to the above calculation, the restored concentration of
HCO3- is a little lager but close to the simply-mixed (Table 4). The reason for this is the
precipitation of calcite may not completely follow the stoichiometric relationship of equation
(10), some CO2 produced in reaction (10) may dissolve into water and not release to the
atmosphere. So the decrease of HCO3- calculated using the stoichiometric relationship of
equation (10) may be a little larger, which leads to the larger calculated concentration of HCO3-.
Here the restored B5 (represented by B5’) based on B4-Gavg is taken as an example to show the
results. In Figure 7, the restored concentration of HCO3- is drawn against TDS. In this case, B5’ has
already on the line drawn through G15, G16 and B4, which indicates the mixing of B4 with the
average mixture of G15 and G16 can form the chemistry of river water in B5 through the following
processes: (1) mixing of 44.77% B4 and 55.23% Gavg; (2) the 3.725 mmol/L dissolution of gypsum;
(3) the precipitation of calcite and dolomite by the amounts of 346.22 and 113.36 mg/L,
respectively. This process also shows from B4 to B5, at least 55% of river water is from groundwater.
Figure 7. The relation between TDS and the restored HCO3-
Conclusion
In the middle section of Dousitu River, the changes of the chemistry of river water are great.
The TDS of the river water increases from B3 to B4 and decreases from B4 to B5. The
concentration of Cl-, Na
+, K
+, Mg
2+ and HCO3
- has a similar change with TDS, but the
concentration of Ca2+
and SO42-
increases steadily. The hydrochemical types of the river water
change from HCO3•Cl-Na type to Cl•SO4•HCO3-Na type and finally to SO4•Cl –Na type.
The chemistry of river water in B4 is formed by the conjunctive processes of evaporation and chemical reaction. Evaporation is the main process, which makes the concentration of species increase by about 3.5 times. The main chemical reactions forming the chemistry of river water in B4 are dissolution of halite and gypsum, the precipitation of calcite and degassing of CO2. Cation exchanges between K
+-Na
+, Ca
2+-Na
+ and Ca
2+-Mg
2+ also play some roles.

738 QIAN HUI et al.
The concentrations of non-reactive species in B5 can be explained by the simple mixing process. But for the reactive species, chemical reactions occurred between B4 and B5 have distinct effects on their concentrations. Mass balance of Cl
- shows the river gets more than
50% of groundwater recharge between B4 and B5. On the basis of mixing, the dissolution of gypsum, precipitation of calcite and dolomite and the degassing of CO2 also play important roles in forming the chemistry of river water in B5.
The formation processes of the chemistry of river water in B4 indicate that when a reservoir is built in an arid area, the loss of water resources due to evaporation is huge, and making things worse, the evaporation can also lead to the degradation of water qualities. Hence, great care should be taken to build a reservoir in arid and semi-arid regions.
Acknowledgment
This research was supported by the projects of National Natural Scientific Foundation of China
(40772160, 40372114). The authors are grateful to senior engineer Hou Guangcai from Xi’an Institute
of Geology and Mineral Resources for his help in field and indoor study. Special thanks to senior
engineers Liu Junting and Hou Jianjun from the Geological Survey of Inner Mongolia Autonomous
Region, they gave us much help in our field study. Authors also would like to thank the editor and
anonymous reviewers for their valuable comments that have greatly improved the quality of the article.
References
1 Ronald J. Gibbs, Geochimica et Cosmochimica Acta, 1972, 36(9), 1061-1066. 2 Rothwell J J, Dise N B and Taylor K G, Allott T E H, Scholefield P, Davies H and
Neal C, Science of the Total Environ., 2010, 408(4) 841-855. 3 Smolders A J P, Hudson-Edwards K A and Van der Velde G, Roelofs J G M, Appl
Geochem., 2004, 19(11), 1745-1758. 4 Van Kleef Hein H, Emiel Brouwer and Rob S E W Leuven, Van Dam Herman, De Veries-
Brock Ankie, Van Der Velde Gerard, Esselink Hans, Environ Pollut., 2010, 158(8), 2679. 5 Ian Donohue, Martin L. McGarrigle and Paul Mills, Water Res., 2006, 40(1), 91-98. 6 Ahearn D S, Sheibley R W, Dahlgren R A and Keller K E. J Hydrol., 2004, 295(1-4), 47-63. 7 Négrel P and Lachassagne, P, J Hydrol., 2000, 237, 212–233. 8 Sobieraj J A, Elsenbeer H and McClain, M, Hydrocycl Proc., 2002, 16, 1353–1372. 9 Qian H, Dou Y, Li X J, Yang B C and Zhao Z H, Hydrogeology and Engineering
Geology, 2007, 34(1), 107-112 (in Chinese). 10 Qian H, Li M Y, Ji Y D, Yang B C and Zhao Z H, Aquatic Geochem., 2007, 13(2), 127-142 11 Li Y F, Wan W F, Wu Y G, Qu H and Hou G C, Environ Geol., 2006, 49(3), 430-436. 12 Xie Y, Wang J, Yin Y P, Wu X M, Wen D G, Jiang X S, Luo J N, Wei L W, li M H
and Zheng W M, Geological Bulletin of China, 2003, 22(10), 819-828 (in Chinese). 13 Li Y F, Xu Z H and Wang J X, Environmental Geology, 2005, 47(5), 647-652. 14 Wang J X, Li Y F and X B, Proceedings of the International Conference on Information
Technology and Environmental Systems Sciences in 2008, Henan, China, 4, 484-488. 15 Hou G C, Liang Y P, Yin L H, Tao Z P, Zhao Z H, Yang X C and Wang X Y,
Hydrogeology and Engineering Geology, 2009, 36(1), 18-23 (in Chinese). 16 Hou G C, Lin X Y and Su X S, Wang X Y and Liu J, J Jilin University (Earth
Science Edition), 2006, 36(3), 391-398 (in Chinese). 17 Xie Y, Wang J, Jiang X S, Li M H, Deng G S, Hou G C, Liu F, Wang D Q, Sun Y M, Zhu
H, Wang Y H and Luo J N, Hydrogeol Eng Geol., 2005, 32(2), 11-19 (in Chinese). 18 Li Y F, Feng J G, Wang W, Li J R, Wang J X, Xu Z H and Li Y, Northwestern
Geology, 2004, 37(1), 90-96 (in Chinese). 19 Yang Y, Chang W, Hou G C, Wang Y H and Zhang P B, Acta Sedimentologica
Sinica, 2006, 24(3), 387-393 (in Chinese).

Submit your manuscripts athttp://www.hindawi.com
Hindawi Publishing Corporationhttp://www.hindawi.com Volume 2014
Inorganic ChemistryInternational Journal of
Hindawi Publishing Corporation http://www.hindawi.com Volume 2014
International Journal ofPhotoenergy
Hindawi Publishing Corporationhttp://www.hindawi.com Volume 2014
Carbohydrate Chemistry
International Journal of
Hindawi Publishing Corporationhttp://www.hindawi.com Volume 2014
Journal of
Chemistry
Hindawi Publishing Corporationhttp://www.hindawi.com Volume 2014
Advances in
Physical Chemistry
Hindawi Publishing Corporationhttp://www.hindawi.com
Analytical Methods in Chemistry
Journal of
Volume 2014
Bioinorganic Chemistry and ApplicationsHindawi Publishing Corporationhttp://www.hindawi.com Volume 2014
SpectroscopyInternational Journal of
Hindawi Publishing Corporationhttp://www.hindawi.com Volume 2014
The Scientific World JournalHindawi Publishing Corporation http://www.hindawi.com Volume 2014
Medicinal ChemistryInternational Journal of
Hindawi Publishing Corporationhttp://www.hindawi.com Volume 2014
Chromatography Research International
Hindawi Publishing Corporationhttp://www.hindawi.com Volume 2014
Applied ChemistryJournal of
Hindawi Publishing Corporationhttp://www.hindawi.com Volume 2014
Hindawi Publishing Corporationhttp://www.hindawi.com Volume 2014
Theoretical ChemistryJournal of
Hindawi Publishing Corporationhttp://www.hindawi.com Volume 2014
Journal of
Spectroscopy
Analytical ChemistryInternational Journal of
Hindawi Publishing Corporationhttp://www.hindawi.com Volume 2014
Journal of
Hindawi Publishing Corporationhttp://www.hindawi.com Volume 2014
Quantum Chemistry
Hindawi Publishing Corporationhttp://www.hindawi.com Volume 2014
Organic Chemistry International
Hindawi Publishing Corporationhttp://www.hindawi.com Volume 2014
CatalystsJournal of
ElectrochemistryInternational Journal of
Hindawi Publishing Corporation http://www.hindawi.com Volume 2014