form 8-kd18rn0p25nwr6d.cloudfront.net/cik-0000104169/620ceb6b-3555-431d … · in accordance with...
TRANSCRIPT

UNITED STATESSECURITIES AND EXCHANGE COMMISSION
WASHINGTON, DC 20549
________________________
FORM 8-KCURRENT REPORT
PURSUANT TO SECTION 13 or 15(d) OF THESECURITIES EXCHANGE ACT OF 1934
Date of Report (Date of earliest event reported):May 18, 2017
Wal-Mart Stores, Inc.(Exact Name of Registrant as Specified in Charter)
Delaware 001-06991 71-0415188(State or Other Jurisdiction of Incorporation) (Commission File Number) (IRS Employer Identification No.)
702 S.W. 8th StreetBentonville, Arkansas 72716-0215
(Address of Principal Executive Offices) (Zip code)
Registrant’s telephone number, including area code:(479) 273-4000
Check the appropriate box below if the Form 8-K filing is intended to simultaneously satisfy the filing obligation of the registrant under any of the following provisions:
¨Written communications pursuant to Rule 425 under the Securities Act (17 CFR 230.425)
¨Soliciting material pursuant to Rule 14a-12 under the Exchange Act (17 CFR 240.14a-12)
¨Pre-commencement communications pursuant to Rule 14d-2(b) under the Exchange Act (17 CFR 240.14d-2(b))
¨Pre-commencement communications pursuant to Rule 13e-4(c) under the Exchange Act (17 CFR 240.13e-4(c))
Indicate by check mark whether the registrant is an emerging growth company as defined in Rule 405 of the Securities Act of 1933 (§230.405 of this chapter) or Rule 12b-2 of theSecurities Exchange Act of 1934 (§240.12b-2 of this chapter).
Emerging growth company ¨
If an emerging growth company, indicate by check mark if the registrant has elected not to use the extended transition period for complying with any new or revised financialaccounting standards provided pursuant to Section 13(a) of the Exchange Act ¨

Item 2.02. Results of Operations and Financial Condition.
In accordance with Item 2.02 of Form 8-K of the Securitis and Exchange Commission (the "SEC"), Wal-Mart Stores, Inc., a Delaware corporation (the "Company"),is furnishing to the SEC a press release that the Company will issue on May 18, 2017 (the "Press Release") and a financial presentation that will be first posted by theCompany on the Company’s website at http://stock.walmart.com on May 18, 2017 (the "Financial Presentation"). The Press Release and the Financial Presentation willdisclose information regarding the Company's results of operations for the three months ended April 30, 2017, and the Company's financial condition as of April 30, 2017.
In accordance with General Instruction B.2 of Form 8-K, the information in this Item 2.02 of this Current Report on Form 8-K, including Exhibits 99.1 and 99.2hereto, which are furnished herewith pursuant to and relate to this Item 2.02, shall not be deemed "filed" for purposes of Section 18 of the Securities Exchange Act of 1934, asamended (the "Exchange Act"), or otherwise be subject to the liabilities of Section 18 of the Exchange Act. The information in this Current Report on Form 8-K and Exhibits99.1 and 99.2 hereto shall not be incorporated by reference into any filing or other document filed by the Company with the SEC pursuant to the Securities Act of 1933, asamended, the rules and regulations of the SEC thereunder, the Exchange Act, or the rules and regulations of the SEC thereunder except as shall be expressly set forth byspecific reference in such filing or document.
Item 9.01. Financial Statements and Exhibits.
Exhibit 99.1 - A copy of the Press Release being furnished pursuant to and that is related to the foregoing Item 2.02 is included herewith as Exhibit 99.1.
Exhibit 99.2 - A copy of the Financial Presentation being furnished pursuant to and that is related to the foregoing Item 2.02 is included herewith as Exhibit 99.2.

SIGNATURES
Pursuant to the requirements of the Securities Exchange Act of 1934, the registrant has duly caused this report to be signed on its behalf by the undersigned hereuntoduly authorized.
Dated: May 18, 2017
WAL-MART STORES, INC.
By: /s/ M. Brett BiggsName: M. Brett BiggsTitle: Executive Vice President and
Chief Financial Officer

Walmart U.S. Q1 comps 1 grew 1.4% and Walmart U.S. eCommerce GMV grew 69%,Company reports Q1 FY18 diluted EPS of $1.00
Diluted EPS was $1.00, an increase of 2% over last year. "We delivered a solid first quarter and we'reencouraged by the start to the year. We're movingfaster to combine our digital and physical assets tomake shopping simple and easy for customers. Our planis gaining traction, and I want to thank our associatesfor their hard work, ingenuity and commitment to ourcustomers. Our customers have choices, and we have toearn their business with every interaction."
Doug McMillonPresident and CEO, Walmart
Total revenue was $117.5 billion, an increase of 1.4%. Excluding currency 2 , totalrevenue was $118.8 billion, an increase of 2.5%.
Walmart U.S. comp sales 1 increased 1.4%, driven by a traffic increase of 1.5%. Comptraffic increased 3.0% on a two-year stacked basis.
E-commerce growth at Walmart U.S. was strong as sales and GMV increased 63%and 69%, respectively. The majority of this growth was organic throughWalmart.com.
Net sales at Walmart International were $27.1 billion, a decrease of 3.5%. Excludingcurrency 2 , net sales were $28.3 billion, an increase of 0.8%.
The company generated $5.4 billion in operating cash flow and returned $3.7 billion to shareholders through dividends and share repurchases.
Key results (Amounts in millions, except as noted)
Q1 FY18 Q1 FY17 Change
Revenue $117,542 $115,904 $1,638 1.4% Revenue (constant currency) 2 $118,750 $115,904 $2,846 2.5% Operating income $5,237 $5,275 -$38 -0.7% Operating income (constant currency) 2 $5,343 $5,275 $68 1.3%
Free Cash Flow Q1 FY18 $ Change Returns to Shareholders Q1 FY18 % Change
Operating cash flow $5,385 -$808 Dividends $1,549 -1.5%Capital expenditures $1,990 -$219 Share repurchases 3 $2,185 -20.1%Free cash flow 2 $3,395 -$589 Total $3,734 -13.3%
Guidance
• Second quarter fiscal year 2018 EPS: $1.00 to $1.08, which excludes an estimated net benefit of approximately $0.05 from the sale of Suburbia, thecompany's apparel format in Mexico.
• Comp sales for the 13-week period ending July 28, 2017:◦ Walmart U.S. (ex. fuel) 2 : +1.5% to +2.0%◦ Sam's Club (ex. fuel) 2 : +1.0% to +1.5%
1 Represents Walmart U.S. comparable sales excluding fuel. Including fuel, Walmart U.S. comparable sales are 1.5%. See additional information at the end of this release regarding non-GAAP financial measures.2 See additional information at the end of this release regarding non-GAAP financial measures.3 $7.0 billion remaining of $20 billion authorization approved in October 2015. The company repurchased approximately 31 million shares in Q1 fiscal 2018.
NYSE: WMT May 18, 2017 stock.walmart.com
2
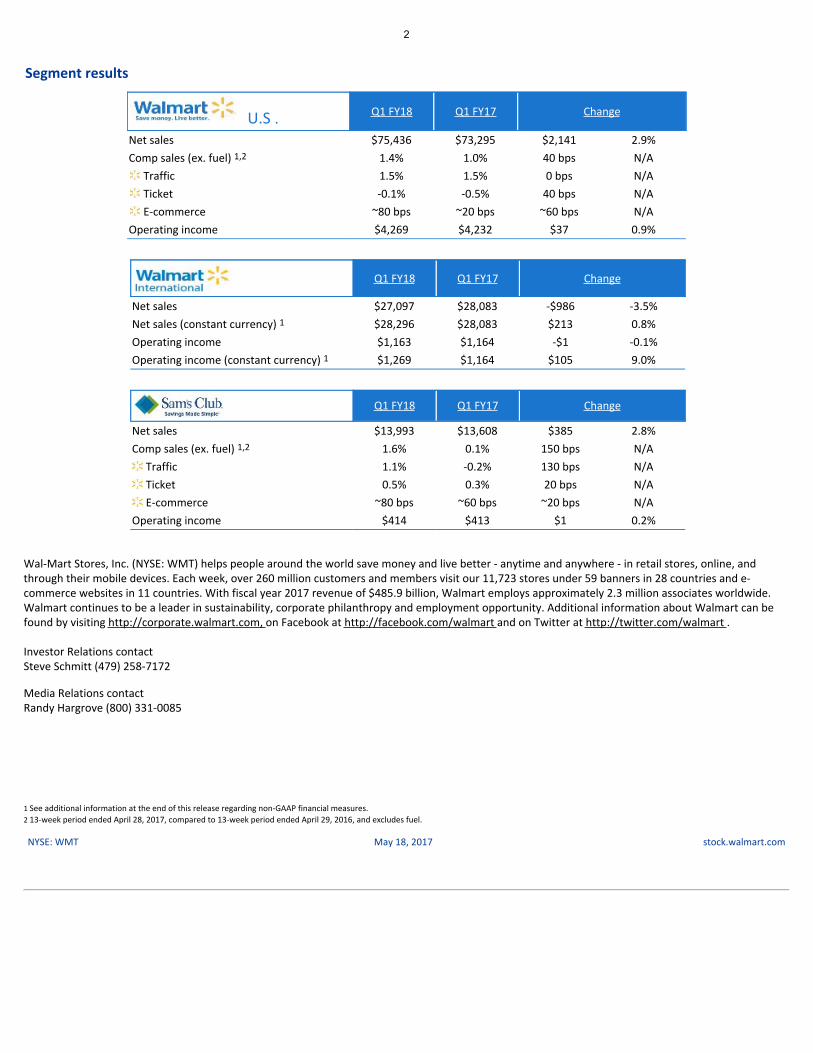
Segment results
U.S . Q1 FY18 Q1 FY17 Change
Net sales $75,436 $73,295 $2,141 2.9%Comp sales (ex. fuel) 1,2 1.4% 1.0% 40 bps N/A
Traffic 1.5% 1.5% 0 bps N/ATicket -0.1% -0.5% 40 bps N/AE-commerce ~80 bps ~20 bps ~60 bps N/A
Operating income $4,269 $4,232 $37 0.9%
Q1 FY18 Q1 FY17 Change
Net sales $27,097 $28,083 -$986 -3.5% Net sales (constant currency) 1 $28,296 $28,083 $213 0.8% Operating income $1,163 $1,164 -$1 -0.1% Operating income (constant currency) 1 $1,269 $1,164 $105 9.0%
Q1 FY18 Q1 FY17 Change
Net sales $13,993 $13,608 $385 2.8% Comp sales (ex. fuel) 1,2 1.6% 0.1% 150 bps N/A Traffic 1.1% -0.2% 130 bps N/A Ticket 0.5% 0.3% 20 bps N/A E-commerce ~80 bps ~60 bps ~20 bps N/A Operating income $414 $413 $1 0.2%
Wal-Mart Stores, Inc. (NYSE: WMT) helps people around the world save money and live better - anytime and anywhere - in retail stores, online, andthrough their mobile devices. Each week, over 260 million customers and members visit our 11,723 stores under 59 banners in 28 countries and e-commerce websites in 11 countries. With fiscal year 2017 revenue of $485.9 billion, Walmart employs approximately 2.3 million associates worldwide.Walmart continues to be a leader in sustainability, corporate philanthropy and employment opportunity. Additional information about Walmart can befound by visiting http://corporate.walmart.com, on Facebook at http://facebook.com/walmart and on Twitter at http://twitter.com/walmart .
Investor Relations contactSteve Schmitt (479) 258-7172
Media Relations contactRandy Hargrove (800) 331-0085
1 See additional information at the end of this release regarding non-GAAP financial measures.2 13-week period ended April 28, 2017, compared to 13-week period ended April 29, 2016, and excludes fuel.
NYSE: WMT May 18, 2017 stock.walmart.com

3
Along with this press release, Walmart makes available a recorded call with executive leaders and a financial presentation to review business results,provide strategic updates, and comment on expectations for the future. We provide that call in both audio form and in a written transcript. Details onaccessing the call are as follows:
• 877-523-5612 (U.S. and Canada)• 201-689-8483 (other countries)• Passcode: 9256278 (Walmart)• MP3 @ stock.walmart.com
The call is archived at stock.walmart.com
###
NYSE: WMT May 18, 2017 stock.walmart.com

4
Forward-Looking Statements This release contains statements as to Walmart management's guidance regarding earnings per share for the three months ending July 31, 2017 andWalmart U.S.'s comparable sales and Sam's Club's comparable sales, excluding fuel, for the 13 weeks ending July 28, 2017. Walmart believes suchstatements are "forward-looking statements" as defined in, and are intended to enjoy the protection of the safe harbor for forward-looking statementsprovided by, the Private Securities Litigation Reform Act of 1995, as amended. Assumptions on which such forward-looking statements are based are alsoforward-looking statements. Walmart's actual results may differ materially from the guidance provided as a result of changes in circumstances,assumptions not being realized or other risks, uncertainties and factors including:
• economic, geo-political, capital markets and business conditions, trends and events around the world and in the markets in which Walmartoperates;
• currency exchange rate fluctuations, changes in market interest rates and commodity prices;• unemployment levels;• competitive pressures;• inflation or deflation, generally and in particular product categories;• consumer confidence, disposable income, credit availability, spending levels, shopping patterns, debt levels and demand for certain merchandise;• consumer enrollment in health and drug insurance programs and such programs' reimbursement rates;• the amount of Walmart's net sales denominated in the U.S. dollar and various foreign currencies;• the financial performance of Walmart and each of its segments;• Walmart's ability to successfully integrate acquired businesses, including within the e-commerce space;• Walmart's effective tax rate and the factors affecting Walmart's effective tax rate, including assessments of certain tax contingencies, valuation
allowances, changes in law, administrative audit outcomes, impact of discrete items and the mix of earnings between the U.S. and Walmart'sinternational operations;
• customer traffic and average ticket in Walmart's stores and clubs and on its e-commerce websites;• the mix of merchandise Walmart sells, the cost of goods it sells and the shrinkage it experiences;• the amount of Walmart's total sales and operating expenses in the various markets in which it operates;• transportation, energy and utility costs and the selling prices of gasoline and diesel fuel;• supply chain disruptions and disruptions in seasonal buying patterns;• consumer acceptance of and response to Walmart's stores, clubs, e-commerce websites, mobile apps, initiatives, programs and merchandise
offerings;• cyber security events affecting Walmart and related costs;• developments in, outcomes of, and costs incurred in legal or regulatory proceedings to which Walmart is a party;• casualty and accident-related costs and insurance costs;• the turnover in Walmart's workforce and labor costs, including healthcare and other benefit costs;• changes in accounting estimates or judgments;• changes in existing tax, labor and other laws and regulations and changes in tax rates, trade agreements, trade restrictions and tariff rates;• the level of public assistance payments;• natural disasters, public health emergencies, civil disturbances, and terrorist attacks; and• Walmart's expenditures for FCPA and other compliance related costs.
Such risks, uncertainties and factors also include the risks relating to Walmart’s strategy, operations and performance and the financial, legal, tax,regulatory, compliance, reputational and other risks discussed in Walmart’s most recent annual report on Form 10-K filed with the SEC. Walmart urgesyou to consider all of the risks, uncertainties and factors identified above or discussed in such reports carefully in evaluating the forward-lookingstatements in this release. Walmart cannot assure you that the results reflected or implied by any forward-looking statement will be realized or, even ifsubstantially realized, that those results will have the forecasted or expected consequences and effects for or on Walmart’s operations or financialperformance. The forward-looking statements made in this release are as of the date of this release. Walmart undertakes no obligation to update theseforward-looking statements to reflect subsequent events or circumstances.

5
Wal-Mart Stores, Inc.Condensed Consolidated Statements of Income
(Unaudited)
Three Months Ended April 30,
(Dollars in millions, except per share data) 2017 2016 PercentChange
Revenues:
Net sales $ 116,526 $ 114,986 1.3 %
Membership and other income 1,016 918 10.7 %
Total revenues 117,542 115,904 1.4 %
Costs and expenses:
Cost of sales 87,688 86,544 1.3 %
Operating, selling, general and administrative expenses 24,617 24,085 2.2 %
Operating income 5,237 5,275 (0.7)%
Interest:
Debt 506 499 1.4 %
Capital lease and financing obligations 92 86 7.0 %
Interest income (35) (24) 45.8 %
Interest, net 563 561 0.4 %
Income before income taxes 4,674 4,714 (0.8)%
Provision for income taxes 1,522 1,498 1.6 %
Consolidated net income 3,152 3,216 (2.0)%
Consolidated net income attributable to noncontrolling interest (113) (137) (17.5)%
Consolidated net income attributable to Walmart $ 3,039 $ 3,079 (1.3)%
Net income per common share:
Basic net income per common share attributable to Walmart $ 1.00 $ 0.98 2.0 %
Diluted net income per common share attributable to Walmart $ 1.00 $ 0.98 2.0 %
Weighted-average common shares outstanding:
Basic 3,035 3,144
Diluted 3,047 3,154
Dividends declared per common share $ 2.04 $ 2.00

6
Wal-Mart Stores, Inc.Condensed Consolidated Balance Sheets
(Unaudited)
(Dollars in millions) April 30, January 31, April 30,
ASSETS 2017 2017 2016
Current assets:
Cash and cash equivalents $ 6,545 $ 6,867 $ 7,597
Receivables, net 5,252 5,835 5,187
Inventories 43,361 43,046 44,513
Prepaid expenses and other 2,178 1,941 1,800
Total current assets 57,336 57,689 59,097
Property and equipment:
Property and equipment 181,075 179,492 178,296
Less accumulated depreciation (73,625) (71,782) (68,509)
Property and equipment, net 107,450 107,710 109,787
Property under capital lease and financing obligations:
Property under capital lease and financing obligations 11,854 11,637 11,667
Less accumulated amortization (5,135) (5,169) (4,960)
Property under capital lease and financing obligations, net 6,719 6,468 6,707
Goodwill 17,575 17,037 16,751
Other assets and deferred charges 10,638 9,921 6,363
Total assets $ 199,718 $ 198,825 $ 198,705
LIABILITIES AND EQUITY
Current liabilities:
Short-term borrowings $ 2,617 $ 1,099 $ 3,813
Accounts payable 41,367 41,433 37,997
Dividends payable 4,628 — 4,723
Accrued liabilities 19,708 20,654 19,605
Accrued income taxes 2,018 921 1,328
Long-term debt due within one year 3,256 2,256 2,257
Capital lease and financing obligations due within one year 599 565 559
Total current liabilities 74,193 66,928 70,282
Long-term debt 33,774 36,015 37,151
Long-term capital lease and financing obligations 6,251 6,003 6,242
Deferred income taxes and other 9,386 9,344 7,272
Commitments and contingencies
Equity:
Common stock 302 305 313
Capital in excess of par value 2,223 2,371 1,720
Retained earnings 84,120 89,354 84,145
Accumulated other comprehensive loss (12,954) (14,232) (10,995)
Total Walmart shareholders’ equity 73,691 77,798 75,183
Nonredeemable noncontrolling interest 2,423 2,737 2,575
Total equity 76,114 80,535 77,758
Total liabilities and equity $ 199,718 $ 198,825 $ 198,705

7
Wal-Mart Stores, Inc.Condensed Consolidated Statements of Cash Flows
(Unaudited)
Three Months Ended April 30,
(Dollars in millions) 2017 2016
Cash flows from operating activities:
Consolidated net income $ 3,152 $ 3,216
Adjustments to reconcile consolidated net income to net cash provided by operating activities:
Depreciation and amortization 2,551 2,388
Deferred income taxes 2 (122)
Other operating activities (170) (33)
Changes in certain assets and liabilities:
Receivables, net 726 494
Inventories 66 264
Accounts payable (155) (234)
Accrued liabilities (1,838) (590)
Accrued income taxes 1,051 810
Net cash provided by operating activities 5,385 6,193
Cash flows from investing activities:
Payments for property and equipment (1,990) (2,209)
Proceeds from the disposal of property and equipment 196 89
Business acquisitions, net of cash acquired (88) —
Other investing activities 8 1
Net cash used in investing activities (1,874) (2,119)
Cash flows from financing activities:
Net change in short-term borrowings 1,482 1,065
Proceeds from issuance of long-term debt — 127
Payments of long-term debt (1,513) (2,013)
Dividends paid (1,549) (1,573)
Purchase of Company stock (2,185) (2,735)
Dividends paid to noncontrolling interest (54) (57)
Purchase of noncontrolling interest (8) (126)
Other financing activities (145) (120)
Net cash used in financing activities (3,972) (5,432)
Effect of exchange rates on cash and cash equivalents 139 250
Net increase (decrease) in cash and cash equivalents (322) (1,108)
Cash and cash equivalents at beginning of year 6,867 8,705
Cash and cash equivalents at end of year $ 6,545 $ 7,597
8
Wal-Mart Stores, Inc.Supplemental Financial Information
(Unaudited)
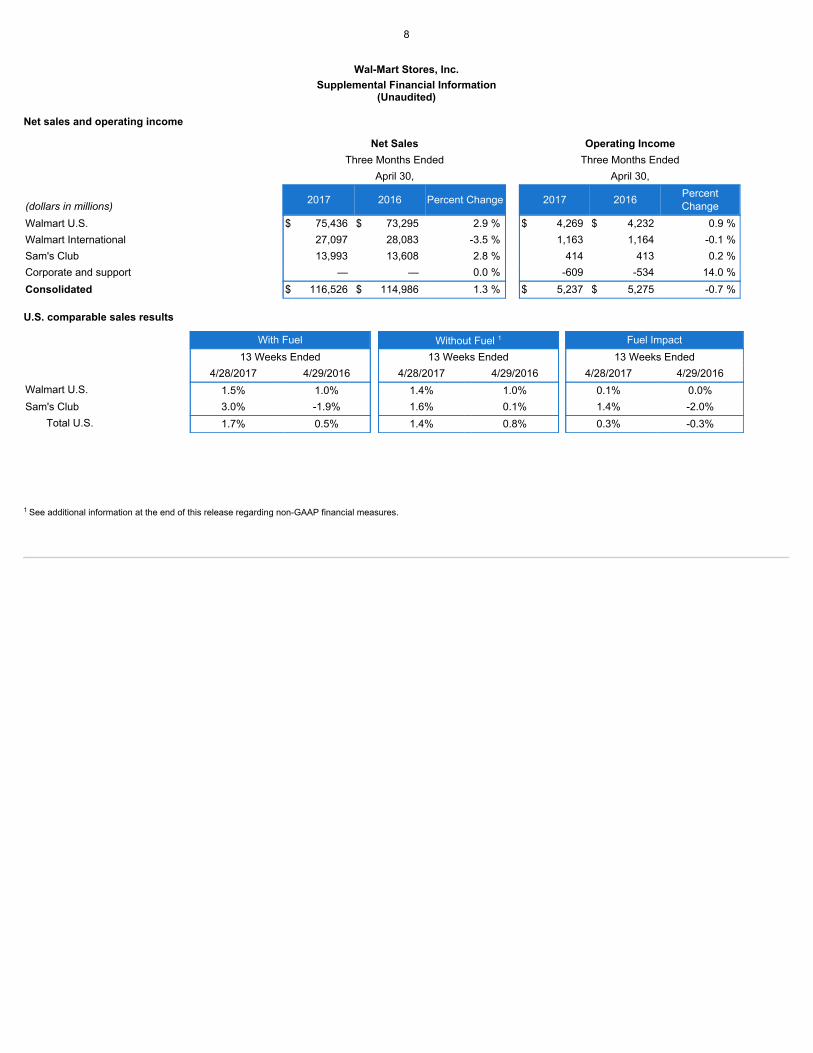
Net sales and operating income
Net Sales Operating Income Three Months Ended Three Months Ended April 30, April 30,
(dollars in millions) 2017 2016 Percent Change 2017 2016 PercentChange
Walmart U.S. $ 75,436 $ 73,295 2.9 % $ 4,269 $ 4,232 0.9 %Walmart International 27,097 28,083 -3.5 % 1,163 1,164 -0.1 %Sam's Club 13,993 13,608 2.8 % 414 413 0.2 %Corporate and support — — 0.0 % -609 -534 14.0 %Consolidated $ 116,526 $ 114,986 1.3 % $ 5,237 $ 5,275 -0.7 %
U.S. comparable sales results
With Fuel Without Fuel 1 Fuel Impact 13 Weeks Ended 13 Weeks Ended 13 Weeks Ended 4/28/2017 4/29/2016 4/28/2017 4/29/2016 4/28/2017 4/29/2016Walmart U.S. 1.5% 1.0% 1.4% 1.0% 0.1% 0.0%Sam's Club 3.0% -1.9% 1.6% 0.1% 1.4% -2.0%
Total U.S. 1.7% 0.5% 1.4% 0.8% 0.3% -0.3%
1 See additional information at the end of this release regarding non-GAAP financial measures.

9
Wal-Mart Stores, Inc.Reconciliations of and Other Information Regarding Non-GAAP Financial Measures
(Unaudited)
The following information provides reconciliations of certain non-GAAP financial measures presented in the press release to which thisreconciliation is attached to the most directly comparable financial measures calculated and presented in accordance with generally acceptedaccounting principles (GAAP). The company has provided the non-GAAP financial information presented in the press release, which is notcalculated or presented in accordance with GAAP, as information supplemental and in addition to the financial measures presented in thepress release that are calculated and presented in accordance with GAAP. Such non-GAAP financial measures should not be consideredsuperior to, as a substitute for or alternative to, and should be considered in conjunction with, the GAAP financial measures presented in thepress release. The non-GAAP financial measures in the press release may differ from similar measures used by other companies.
10
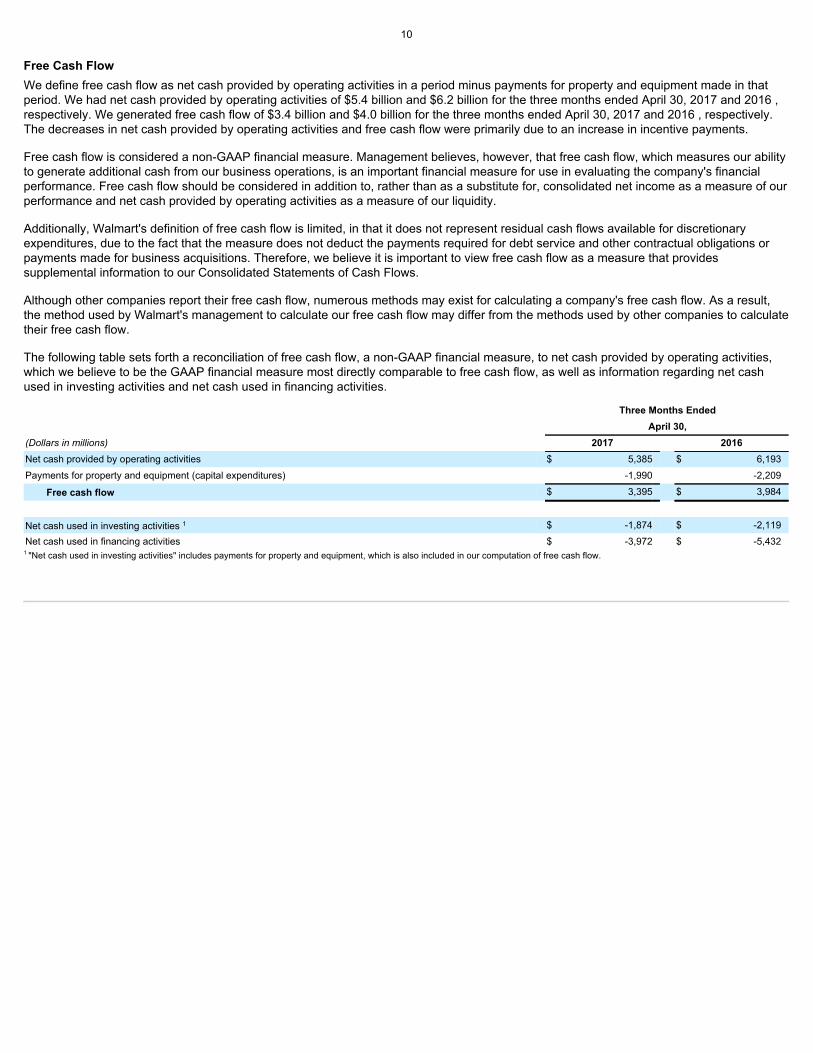
Free Cash FlowWe define free cash flow as net cash provided by operating activities in a period minus payments for property and equipment made in thatperiod. We had net cash provided by operating activities of $5.4 billion and $6.2 billion for the three months ended April 30, 2017 and 2016 ,respectively. We generated free cash flow of $3.4 billion and $4.0 billion for the three months ended April 30, 2017 and 2016 , respectively.The decreases in net cash provided by operating activities and free cash flow were primarily due to an increase in incentive payments.
Free cash flow is considered a non-GAAP financial measure. Management believes, however, that free cash flow, which measures our abilityto generate additional cash from our business operations, is an important financial measure for use in evaluating the company's financialperformance. Free cash flow should be considered in addition to, rather than as a substitute for, consolidated net income as a measure of ourperformance and net cash provided by operating activities as a measure of our liquidity.
Additionally, Walmart's definition of free cash flow is limited, in that it does not represent residual cash flows available for discretionaryexpenditures, due to the fact that the measure does not deduct the payments required for debt service and other contractual obligations orpayments made for business acquisitions. Therefore, we believe it is important to view free cash flow as a measure that providessupplemental information to our Consolidated Statements of Cash Flows.
Although other companies report their free cash flow, numerous methods may exist for calculating a company's free cash flow. As a result,the method used by Walmart's management to calculate our free cash flow may differ from the methods used by other companies to calculatetheir free cash flow.
The following table sets forth a reconciliation of free cash flow, a non-GAAP financial measure, to net cash provided by operating activities,which we believe to be the GAAP financial measure most directly comparable to free cash flow, as well as information regarding net cashused in investing activities and net cash used in financing activities.
Three Months Ended April 30,(Dollars in millions) 2017 2016Net cash provided by operating activities $ 5,385 $ 6,193Payments for property and equipment (capital expenditures) -1,990 -2,209
Free cash flow $ 3,395 $ 3,984
Net cash used in investing activities 1 $ -1,874 $ -2,119Net cash used in financing activities $ -3,972 $ -5,432
1 "Net cash used in investing activities" includes payments for property and equipment, which is also included in our computation of free cash flow.

11
Constant CurrencyIn discussing our operating results, the term currency exchange rates refers to the currency exchange rates we use to convert the operatingresults for all countries where the functional currency is not the U.S. dollar ("non-USD entities") into U.S. dollars. We calculate the effect ofchanges in currency exchange rates as the difference between current period activity translated using the current period's currency exchangerates, and the comparable prior year period's currency exchange rates. Throughout our discussion, we refer to the results of this calculationas the impact of currency exchange rate fluctuations. When we refer to constant currency operating results, this means operating resultswithout the impact of the currency exchange rate fluctuations and without the impact of acquisitions of non-USD entities, if any, until suchacquisitions are included in both comparable periods. The disclosure of constant currency amounts or results permits investors to betterunderstand Walmart's underlying performance without the effects of currency exchange rate fluctuations or acquisitions of non-USD entities.
The table below reflects the calculation of constant currency for total revenues, net sales and operating income for the three months endedApril 30, 2017.
Three Months Ended April 30, Walmart International Consolidated
(Dollars in millions) 2017Percent
Change 1 2017Percent
Change 1
Total revenues: As reported $ 27,429 -3.3 % $ 117,542 1.4 %Currency exchange rate fluctuations 2 1,208 N/A 1,208 N/AConstant currency total revenues $ 28,637 1.0 % $ 118,750 2.5 %
Net sales: As reported $ 27,097 -3.5 % $ 116,526 1.3 %Currency exchange rate fluctuations 2 1,199 N/A 1,199 N/AConstant currency net sales $ 28,296 0.8 % $ 117,725 2.4 %
Operating income: As reported $ 1,163 -0.1 % $ 5,237 -0.7 %Currency exchange rate fluctuations 2 106 N/A 106 N/AConstant currency operating income $ 1,269 9.0 % $ 5,343 1.3 %
1 Change versus prior year comparable period.2 Excludes currency exchange rate fluctuations related to acquisitions until the acquisitions are included in both comparable periods.

12
Comparable Sales Measures Excluding FuelThe comparable sales of the company's Walmart U.S. and Sam's Club operating segments for the 13-week periods ended April 28, 2017,and April 29, 2016, and our guidance for comparable sales for the 13-week period ending July 28, 2017 , in each case calculated orforecasted by excluding fuel sales for such periods (the "Comparable Sales Measures Excluding Fuel"), are non-GAAP financial measures asdefined by the SEC's rules. We believe the most directly comparable financial measures computed in accordance with GAAP are thecomparable sales calculated by including fuel sales for the corresponding periods.
We believe that the presentation of the Comparable Sales Measures Excluding Fuel provides useful information to investors regarding thecompany's financial condition and results of operations because that information permits investors to understand the effect of the fuel sales,which are affected by the volatility of fuel prices, on Walmart U.S. and Sam's Club's comparable sales for the periods presented.
###


Safe harbor and non-GAAP measures This presentation contains statements as to Walmart management's guidance regarding earnings per share for the three months ending July 31, 2017, Walmart U.S.'s comparable sales and Sam's Club's comparable sales, excluding fuel, for the 13-week period ending July 28, 2017 and the third-party FCPA- and compliance- related expenses expected to be incurred for year ending January 31, 2018. Assumptions on which such forward-looking statements are based, including without limitation assumptions regarding our effective tax rate for the year ending January 31, 2018, are also forward-looking statements. Walmart believes such statements are "forward-looking statements" as defined in, and are intended to enjoy the protection of the safe harbor for such statements provided by, the Private Securities Litigation Reform Act of 1995, as amended. Walmart's actual results may differ materially from the guidance provided as a result of changes in circumstances, assumptions not being realized or other risks, uncertainties and factors including: • economic, geo-political, capital markets and business conditions, trends and events around the world and in the markets in which Walmart operates; • currency exchange rate fluctuations, changes in market interest rates and commodity prices; • unemployment levels; • competitive pressures; • inflation or deflation, generally and in particular product categories; • consumer confidence, disposable income, credit availability, spending levels, shopping patterns, debt levels and demand for certain merchandise; • consumer enrollment in health and drug insurance programs and such programs' reimbursement rates; • the amount of Walmart's net sales denominated in the U.S. dollar and various foreign currencies; • the financial performance of Walmart and each of its segments; • Walmart's ability to successfully integrate acquired businesses, including within the e-commerce space; • Walmart's effective tax rate and the factors affecting Walmart's effective tax rate, including assessments of certain tax contingencies, valuation allowances, changes in law, administrative audit outcomes, impact of discrete items and the mix of earnings between the U.S. and Walmart's international operations; • customer traffic and average ticket in Walmart's stores and clubs and on its e-commerce websites; • the mix ofmerchandise Walmart sells, the cost of goods it sells and the shrinkage it experiences; • the amount of Walmart's total sales and operating expenses in the various markets in which it operates; • transportation, energy and utility costs and the selling prices of gasoline and diesel fuel; • supply chain disruptions and disruptions in seasonal buying patterns; • consumer acceptance of and response to Walmart's stores, clubs, e-commerce websites, mobile apps, initiatives, programs and merchandise offerings; • cyber security events affecting Walmart and related costs; • developments in, outcomes of, and costs incurred in legal or regulatory proceedings to which Walmart is a party; • casualty and accident-related costs and insurance costs; • the turnover in Walmart's workforce and labor costs, including healthcare and other benefit costs; • changes in accounting estimates or judgments; • changes in existing tax, labor and other laws and regulations and changes in tax rates, trade agreements, trade restrictions and tariff rates; • the level of public assistance payments; • natural disasters, public health emergencies, civil disturbances, and terrorist attacks; and • Walmart's expenditures for FCPA and other compliance related costs. Such risks, uncertainties and factors also include the risks relating to Walmart's strategy, operations and performance and the financial, legal, tax, regulatory, compliance and other risks discussed in Walmart's most recent annual report on Form 10-K filed with the SEC. You should read this presentation in conjunction with that annual report on Form 10-K and Walmart's subsequently filed current reports on Form 8-K. You should consider all of the risks, uncertainties and other factors identified above and in those SEC reports carefully when evaluating the forward looking statements in this presentation. Walmart cannot assure you that the future results reflected in or implied by any such forward-looking statement will be realized or, even if substantially realized, will have the forecasted or expected consequences and effects for or on Walmart's operations or financial performance. Such forward-looking statements are made as of the date of this presentation, and Walmart undertakes no obligation to update such statements to reflect subsequent events or circumstances. This presentation includes certain non-GAAP measures as defined under SEC rules, including net
sales, revenue, and operating income on a constant currency basis, comp sales excluding fuel, free cash flow and return on investment. Refer to information about the non-GAAP measures contained in this presentation. Additional information as required by Regulation G and Item 10(e) of Regulation S-K regarding non-GAAP measures can be found in our most recent Form 10-K and our Form 8-K furnished as of the date of this presentation with the SEC, which are available at www.stock.walmart.com. 2

Q2 FY18 EPS: $1.00 to $1.08 Comp sales for 13-week period, excluding fuel1: between +1.5% to +2.0% Comp sales for 13-week period, excluding fuel1: between +1.0% to +1.5% 1 13-week period from April 29, 2017 through July 28, 2017, compared to 13-week period ended July 29, 2016. See press release located at www.stock.walmart.com and additional information at the end of this presentation regarding non-GAAP financial measures. Guidance 3 The company's guidance for earnings per share for the second quarter excludes an estimated net benefit of approximately $0.05 from the sale of Suburbia, the company's apparel format in Mexico. U.S.

Wal-Mart Stores, Inc. (Amounts in millions, except per share data) Q1 $ Δ1 % Δ1 Total revenue $117,542 $1,638 1.4% Total revenue, constant currency2 $118,750 $2,846 2.5% Net sales $116,526 $1,540 1.3% Net sales, constant currency2 $117,725 $2,739 2.4% Membership & other income $1,016 $98 10.7% Operating income $5,237 -$38 -0.7% Operating income, constant currency2 $5,343 $68 1.3% Interest expense, net $563 $2 0.4% Consolidated net income attributable to Walmart $3,039 -$40 -1.3% Diluted EPS $1.00 $0.02 2.0% 1 Change versus prior year comparable period. 2 See press release located at www.stock.walmart.com and reconciliations at the end of presentation regarding non-GAAP financial measures. 4

Wal-Mart Stores, Inc. Q1 bps Δ1 Gross profit rate 24.8% 1 bps Operating expenses as a percentage of net sales 21.1% 18 bps Effective tax rate 32.6% 78 bps Debt to total capitalization2 38.7% -130 bps Return on investment3,4 15.1% -20 bps 1 Basis points change versus prior year comparable period. 2 Debt to total capitalization is calculated as of April 30, 2017. Debt includes short-term borrowings, long-term debt due within one year, capital lease and financing obligations due within one year, long-term debt, and long-term capital lease and financing obligations. Total capitalization includes debt and total Walmart shareholders' equity. 3 ROI is calculated for the trailing 12 months ended April 30, 2017. 4 See reconciliations at the end of presentation regarding non-GAAP financial measures. 5

(Amounts in millions) Q1 $ Δ1 % Δ1 Receivables, net $5,252 $65 1.3% Inventories $43,361 -$1,152 -2.6% Accounts payable $41,367 $3,370 8.9% Wal-Mart Stores, Inc. 1 Change versus prior year comparable period. 6

Wal-Mart Stores, Inc. (Amounts in millions) Q1 $ Δ1 Operating cash flow $5,385 -$808 Capital expenditures $1,990 -$219 Free cash flow2 $3,395 -$589 (Amounts in millions) Q1 % Δ1 Dividends $1,549 -1.5% Share repurchases3 $2,185 -20.1% Total $3,734 -13.3% 1 Change versus prior year comparable period. 2 See press release located at www.stock.walmart.com and reconciliations at the end of this presentation regarding non- GAAP financial measures. 3 $7.0 billion remaining of $20 billion authorization approved in October 2015. 7

Walmart U.S. (Amounts in millions) Q1 Δ1 Net sales $75,436 2.9% Comparable sales2,3 1.4% 40 bps • Comp traffic 1.5% — bps • Comp ticket -0.1% 40 bps E-commerce impact3,4 ~0.8% ~60 bps Neighborhood Market ~6.2% ~-90 bps Gross profit rate Flat — bps Operating expense rate Increase 14 bps Operating income $4,269 0.9% 1 Change versus prior year comparable period. 2 Comp sales for the 13-week period ended April 28, 2017, excluding fuel. Including fuel, Walmart U.S. comparable sales are 1.5%. See press release located at www.stock.walmart.com and reconciliations at the end of this presentation regarding non-GAAP financial measures. 3 The results of new acquisitions are not included in our comp sales metrics as acquisitions are not included until the 13th month after acquisition. 4 The company's e-commerce sales impact includes those sales initiated through the company's websites and fulfilled through the company's dedicated e-commerce distribution facilities, as well as an estimate for sales initiated online but fulfilled through the company's stores and clubs. 8

Walmart U.S. - quarterly financial highlights 9 Sales • Net sales increased 2.9%, or approximately $2.1 billion. Last year's Q1 net sales included an approximately 100 bps benefit from an extra day in February 2016 due to a leap year. • Comp sales1 increased 1.4% led by strong comp traffic of 1.5%. On a 2-year stacked basis, comp sales and traffic were up 2.4% and 3.0%, respectively. • E-commerce contributed approximately 80 bps to segment comp sales growth. • Market deflation in food, excluding price investments, did not impact comp sales results this quarter. • Strength in grocery partially offset softness in general merchandise categories due in part to the delay of customer income tax refunds. Gross Margin • Gross margin was flat as savings from procuring merchandise and the acceleration of post-holiday markdowns taken in the fourth quarter benefited the margin rate, but were offset by investments in price and the mix effects from our growing e-commerce business. Expenses • Expenses increased 3.6% (14 bps) primarily due to investments in e-commerce and technology. While expenses were not leveraged for the overall segment, expenses were leveraged in the stores. Inventory • Total inventory declined 3.3%, and comp store inventory declined 7.3%, while in-stock levels remain high. Format growth • Net openings of 12 Supercenters (including conversions and relocations) and net closings of 2 Neighborhood Markets. • Remodeled 55 stores in Q1. • As of the end of Q1, online grocery was offered in nearly 670 locations. 1 Comp sales for the 13-week period ended April 28, 2017, excluding fuel. Including fuel, Walmart U.S. comparable sales are 1.5%. See press release located at www.stock.walmart.com and reconciliations at the end of this presentation regarding non-GAAP financial measures.

Walmart U.S. - quarterly merchandise highlights Category Comp Comments Grocery1 + low single-digit Traffic in food and consumables accelerated throughout the quarter, including a strong Easter performance; market deflation in food, excluding price investments, did not impact comp sales results in Q1. Health & wellness + low single-digit Continued solid comp traffic across pharmacy and OTC. Brandeddrug inflation and pharmacy script growth favorably impacted sales. General merchandise2 - low single-digit Sales were sluggish at the start of the quarter with delayed customer income tax refund checks and the timing of post-holiday markdowns that collectively impacted higher ticket and discretionary purchases. Sales improved throughout the quarter and finished with a strong Easter. 1 Includes food and consumables. 2 General merchandise includes entertainment, toys, hardlines, apparel and home/seasonal. 10

Walmart International 1 (Amounts in millions) Reported Constant currency1 Q1 Δ2 Q1 Δ2 Net sales $27,097 -3.5% $28,296 0.8% Gross profit rate Increase 16 bps NP NP Operating income $1,163 -0.1% $1,269 9.0% 1 See press release located at www.stock.walmart.com and reconciliations at the end of presentation regarding non-GAAP financial measures. 2 Change versus prior year comparable period. NP - Not provided 11
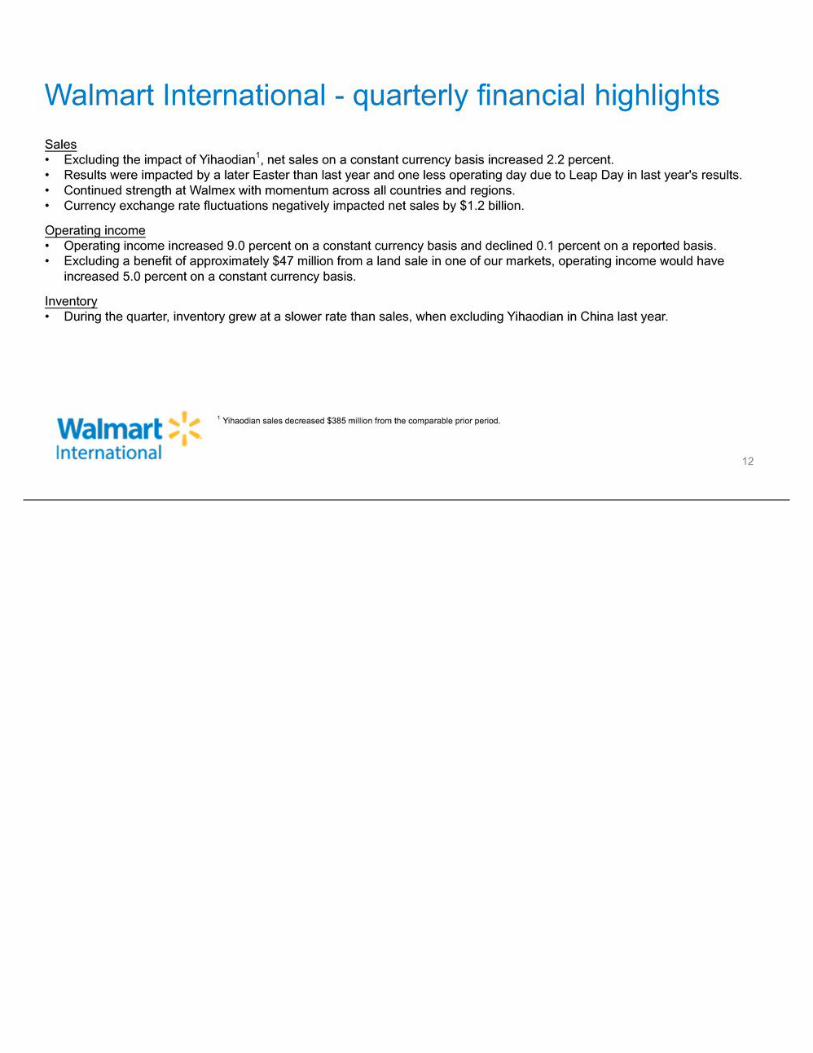
Walmart International - quarterly financial highlights 12 Sales • Excluding the impact of Yihaodian1, net sales on a constant currency basis increased 2.2 percent. • Results were impacted by a later Easter than last year and one less operating day due to Leap Day in last year's results. • Continued strength at Walmex with momentum across all countries and regions. • Currency exchange rate fluctuations negatively impacted net sales by $1.2 billion. Operating income • Operating income increased 9.0 percent on a constant currency basis and declined 0.1 percent on a reported basis. • Excluding a benefit of approximately $47 million from a land sale in one of our markets, operating income would have increased 5.0 percent on a constant currency basis. Inventory • During the quarter, inventory grew at a slower rate than sales, when excluding Yihaodian in China last year. 1 Yihaodian sales decreased $385 million from the comparable prior period.
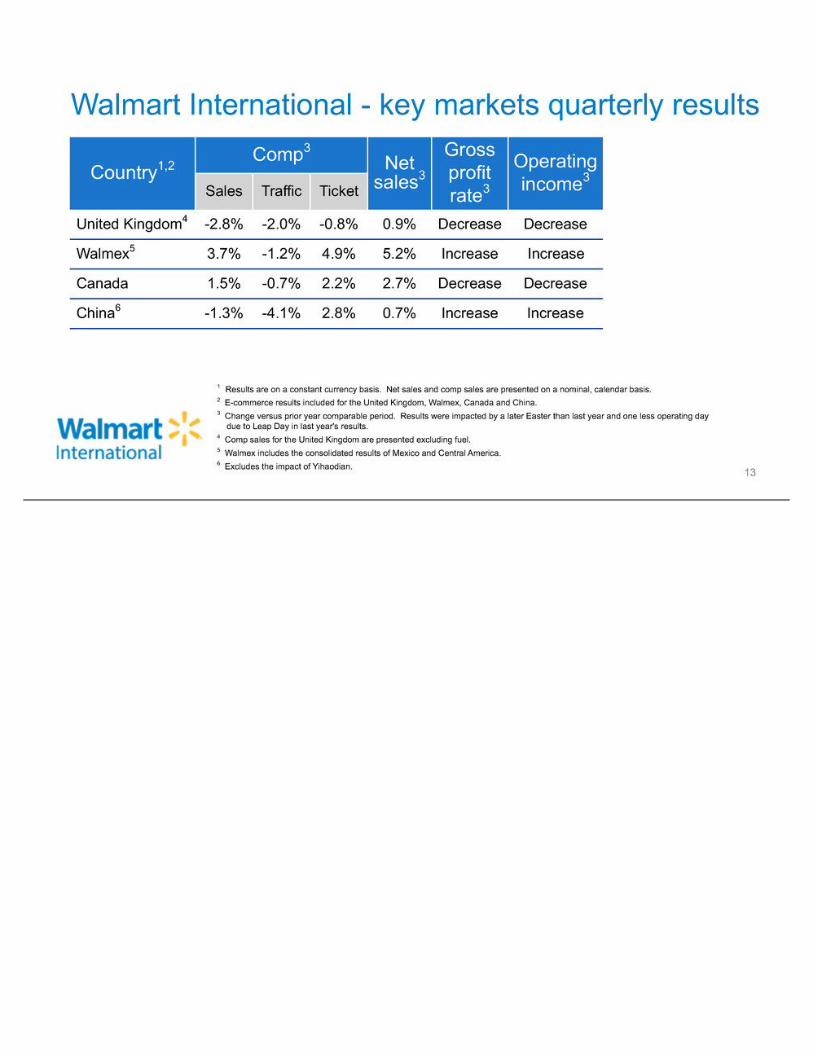
Walmart International - key markets quarterly results 1 Results are on a constant currency basis. Net sales and comp sales are presented on a nominal, calendar basis. 2 E-commerce results included for the United Kingdom, Walmex, Canada and China. 3 Change versus prior year comparable period. Results were impacted by a later Easter than last year and one less operating day due to Leap Day in last year's results. 4 Comp sales for the United Kingdom are presented excluding fuel. 5 Walmex includes the consolidated results of Mexico and Central America. 6 Excludes the impact of Yihaodian. Country1,2 Comp3 Net sales3 Gross profit rate3 Operating income3Sales Traffic Ticket United Kingdom4 -2.8% -2.0% -0.8% 0.9% Decrease Decrease Walmex5 3.7% -1.2% 4.9% 5.2% Increase Increase3¹ Canada 1.5% -0.7% 2.2% 2.7% Decrease Decrease China6 -1.3% -4.1% 2.8% 0.7% Increase Increase 13

Walmart International - key market quarterly highlights 14 Walmex • Sales momentum continued across all countries and regions, despite the later timing of Easter, one less day in the quarter as a result of Leap Day last year, and temporary store closures due to protests related to gasoline price increases. • Net sales increased 5.2 percent and comp sales increased 3.7 percent. ◦ Comp sales at Walmex increased over 12% on a two-year stacked basis. • In Mexico specifically, comp sales increased over 13 percent on a two-year stacked basis and each of our merchandise divisions outpaced ANTAD1 self-service. ◦ Strongest performance came from Sam's Club followed by Bodega. • Net sales in Central America increased 6.4 percent and all countries delivered positive comps sales. Canada • Net sales increased 2.7 percent and comp sales increased 1.5 percent. • According to Nielsen we continued to gain market share in key traffic driving categories like food and consumables & health and wellness. • Reduced inventory levels even as sales increased. • Continued planned investments in price and in-store efficiency initiatives are being supported by progress with our cost analytics program. 1 ANTAD - Asociación Nacional de Tiendas de Autoservicio y Departamentales; The National Association of Supermarkets and Department Stores

Walmart International - key market quarterly highlights 15 U.K. • Net sales increased 0.9 percent and comp sales declined 2.8 percent. ◦ When normalizing for Leap Day last year and a later Easter, we continued to see sequential improvement in comp sales. • We are beginning to see improved customer traffic numbers and basket trends as we make strategic investments in the customer value proposition. China • Net sales increased 0.7 percent and comp sales declined 1.3 percent. ◦ In addition to the impact from one less day in the quarter due to Leap Day last year, results were impacted by our strategic decision to reduce lower margin bulk sales. • Continued to see strong results within fresh categories. • "We Operate for Less" initiatives continue to drive cost efficiencies. • During the quarter we increased the number of stores that offer delivery through our partnership with New Dada to 80 locations and reduced the delivery time to 1 hour.

Sam's Club (Amounts in millions) With fuel Without fuel1 Q1 Δ2 Q1 Δ2 Net sales $13,993 2.8% $12,909 1.4% Comparable sales3 3.0% 490 bps 1.6% 150 bps • Comp traffic NP NP 1.1% 130 bps • Comp ticket NP NP 0.5% 20 bps E-commerce impact4 NP NP ~0.8% ~20 bps Gross profit rate Decrease -36 bps Decrease -22 bps Membership income NP NP NP 0.9% Operating income $414 0.2% $406 -0.5% 1 See press release located at www.stock.walmart.com and reconciliations at the end of this presentation regarding non-GAAP financial measures. 2 Change versus prior year comparable period. 3 Comp sales for the 13-week period ended April 28, 2017. 4 The company's e-commerce sales impact includes those sales initiated through the company's websites and fulfilled through the company's dedicated e-commerce distribution facilities, as well as an estimate for sales initiated online but fulfilled through the company's stores and clubs. NP - Not provided 16

Sam's Club - quarterly financial highlights 17 Sales • Comp sales1 for the period increased 1.6%, led by growth in comp traffic of 1.1%. • Market inflation positively impacted comp sales by approximately 80 basis points, primarily in tobacco. • E-commerce sales contributed approximately 80 basis points to comp sales. • Club Pickup and the direct to home business continued to have strong results. Gross Profit • Excluding fuel1, gross profit rate decreased by 22 basis points. During the quarter, certain fresh supply expenses were reclassified from operating expenses to cost of goods sold. Gross profit was also impacted by higher shrink and increased shipping costs at Samsclub.com. Operating Expenses • Operating expenses levered during the quarter by 13 basis points, primarily due to the reclassification of certain fresh supply expenses, partially offset by higher member related service expenses. Membership Income • Membership income increased 0.9% versus last year. Plus penetration increased 23 basis points. Inventory • Inventory increased 2.7% driven by food, seasonal and apparel. Comp club inventory declined 40 basis points. 1 Excludes fuel. See press release located at www.stock.walmart.com and reconciliations at the end of this presentation regarding non-GAAP financial measures.
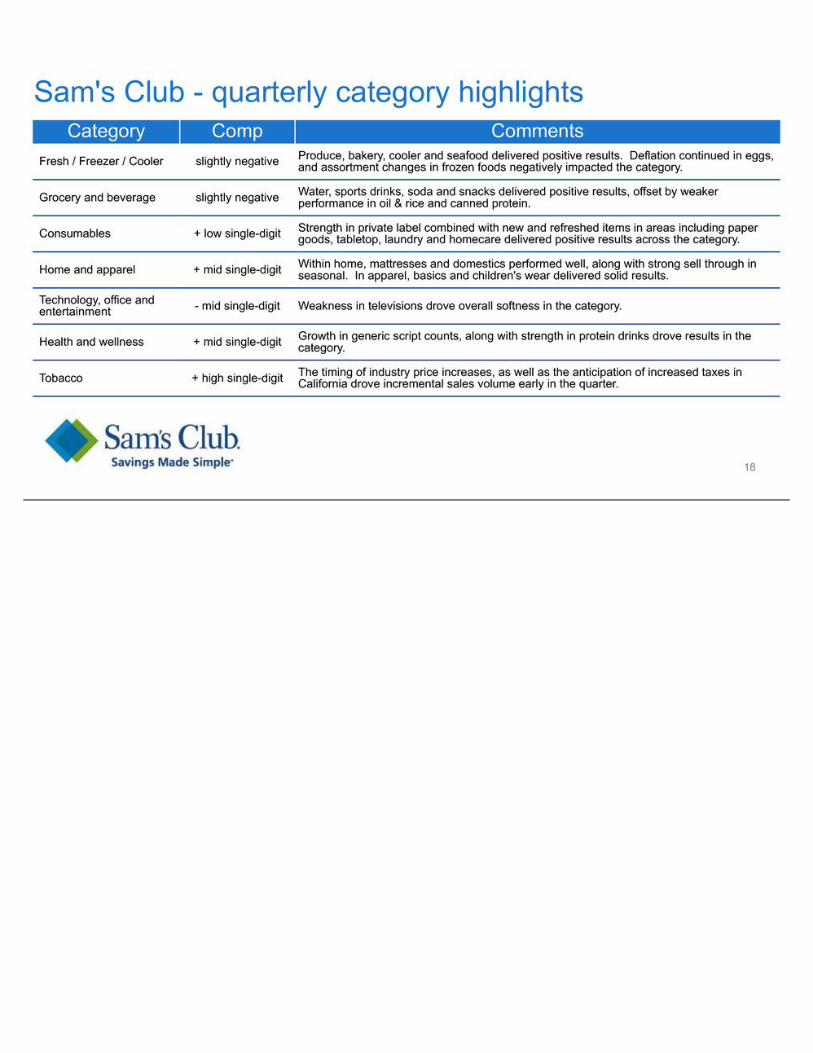
Sam's Club - quarterly category highlights 18 Category Comp Comments Fresh / Freezer / Cooler slightly negative Produce, bakery, cooler and seafood delivered positive results. Deflation continued in eggs,and assortment changes in frozen foods negatively impacted the category. Grocery and beverage slightly negative Water, sports drinks, soda and snacks delivered positive results, offset by weakerperformance in oil & rice and canned protein. Consumables + low single-digit Strength in private label combined with new and refreshed items in areas including papergoods, tabletop, laundry and homecare delivered positive results across the category. Home and apparel + mid single-digit Within home, mattresses and domestics performed well, along with strong sell through inseasonal. In apparel, basics and children's wear delivered solid results. Technology, office and entertainment - mid single-digit Weakness in televisions drove overall softness in the category. Health and wellness + mid single-digit Growth in generic script counts, along with strength in protein drinks drove results in thecategory. Tobacco + high single-digit The timing of industry price increases, as well as the anticipation of increased taxes inCalifornia drove incremental sales volume early in the quarter.

Third-party FCPA- and compliance-related expenses Q1 (Amounts in millions) FY18 FY17 Ongoing inquiries and investigations $13 $21 Global compliance program and organizational enhancements 3 4 Total $16 $25 • In fiscal year 2018, we expect our third party FCPA- and compliance-related expenses to range between $65 and $85 million. These are included in our Corporate and support expenses. 19

Non-GAAP measures - ROI We include Return on Assets ("ROA"), which is calculated in accordance with generally accepted accounting principles in the U.S. ("GAAP") as well as Return on Investment ("ROI") as measures to assess returns on assets. Management believes ROI is a meaningful measure to share with investors because it helps investors assess how effectively Walmart is deploying its assets. Trends in ROI can fluctuate over time as management balances long-term potential strategic initiatives with possible short-term impacts. We consider ROA to be the financial measure computed in accordance with GAAP that is the most directly comparable financial measure to our calculation of ROI. ROA was 7.1 percent and 7.5 percent for the trailing twelve months ended April 30, 2017 and 2016, respectively. ROI was 15.1 percent and 15.3 percent for the trailing twelve months ended April 30, 2017 and 2016, respectively. The declines in ROA and ROI were primarily due to our decrease in operating income. We define ROI as adjusted operating income (operating income plus interest income, depreciation and amortization, and rent expense) for the trailing 12 months divided by average invested capital during that period. We consider average invested capital to be the average of our beginning and ending total assets, plus average accumulated depreciation and average amortization, less average accounts payable and average accrued liabilities for that period, plus a rent factor equal to the rent for the fiscal year or trailing 12 months multiplied by a factor of 8. When we have discontinued operations, we exclude the impact of the discontinued operations. Our calculation of ROI is considered a non-GAAP financial measure because we calculate ROI using financial measures that exclude and include amounts that are included and excluded in the most directly comparable GAAP financial measure. For example, we exclude the impact of depreciation and amortization from our reported operating income in calculating the numerator of our calculation of ROI. In addition, we include a factor of 8 for rent expense that estimates the hypothetical capitalization of our operating leases. As mentioned above, we consider return on assets to be the financial measure computed in accordance with generally accepted accounting principles most directly comparable to ourcalculation of ROI. ROI differs from ROA (which is consolidated net income for the period divided by average total assets for the period) because ROI: adjusts operating income to exclude certain expense items and adds interest income; adjusts total assets for the impact of accumulated depreciation and amortization, accounts payable and accrued liabilities; and incorporates a factor of rent to arrive at total invested capital. Because of the adjustments mentioned above, we believe ROI more accurately measures how we are deploying our key assets and is more meaningful to investors than ROA. Although ROI is a standard financial measure, numerous methods exist for calculating a company's ROI. As a result, the method used by management to calculate our ROI may differ from the methods used by other companies to calculate their ROI. 20
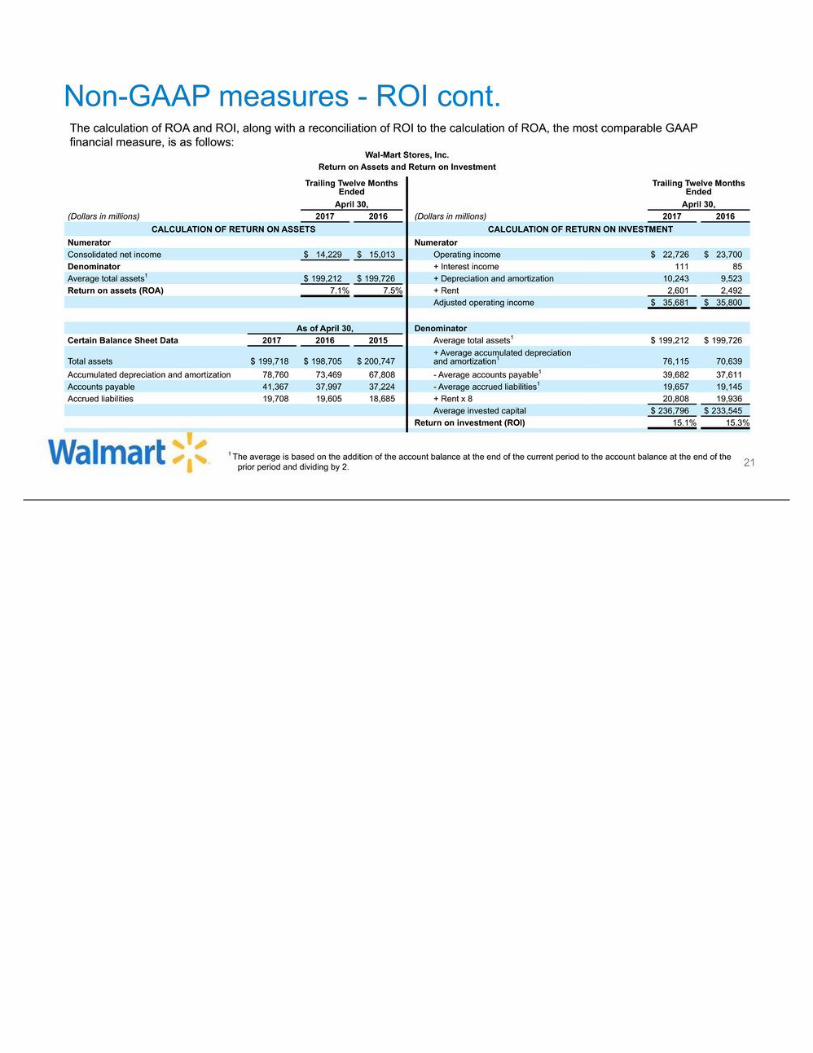
Non-GAAP measures - ROI cont. The calculation of ROA and ROI, along with a reconciliation of ROI to the calculation of ROA, the most comparable GAAP financial measure, is as follows: Wal-Mart Stores, Inc. Return on Assets and Return on Investment Trailing Twelve Months Ended Trailing Twelve Months Ended April 30, April 30, (Dollars in millions) 2017 2016 (Dollars in millions) 2017 2016 CALCULATION OF RETURN ON ASSETS CALCULATION OF RETURN ON INVESTMENT Numerator Numerator Consolidated net income $ 14,229 $ 15,013 Operating income $ 22,726 $ 23,700 Denominator + Interest income 111 85 Average total assets1 $ 199,212 $ 199,726 + Depreciation and amortization 10,243 9,523 Return on assets (ROA) 7.1% 7.5% + Rent 2,601 2,492 Adjusted operating income $ 35,681 $ 35,800 As of April 30, Denominator Certain Balance Sheet Data 2017 2016 2015 Average total assets1 $ 199,212 $ 199,726 Total assets $ 199,718 $ 198,705 $ 200,747 + Average accumulated depreciation and amortization1 76,115 70,639 Accumulated depreciation and amortization 78,760 73,469 67,808 - Average accounts payable1 39,682 37,611 Accounts payable 41,367 37,997 37,224 - Average accrued liabilities1 19,657 19,145 Accrued liabilities 19,708 19,605 18,685 + Rent x 8 20,808 19,936 Average invested capital $ 236,796 $ 233,545 Return on investment (ROI) 15.1% 15.3% 1 The average is based on the addition of the account balance at the end of the current period to the account balance at the end of the prior period and dividing by 2. 21

Non-GAAP measures - free cash flow We define free cash flow as net cash provided by operating activities in a period minus payments for property and equipment made in that period. We had net cash provided by operating activities of $5.4 billion and $6.2 billion for the three months ended April 30, 2017 and 2016, respectively. We generated free cash flow of $3.4 billion and $4.0 billion for the three months ended April 30, 2017 and 2016, respectively. The decreases in net cash provided by operating activities and free cash flow were due to an increase in incentive payments. Free cash flow is considered a non-GAAP financial measure. Management believes, however, that free cash flow, which measures our ability to generate additional cash from our business operations, is an important financial measure for use in evaluating the company's financial performance. Free cash flow should be considered in addition to, rather than as a substitute for, consolidated net income as a measure of our performance and net cash provided by operating activities as a measure of our liquidity. Additionally, Walmart's definition of free cash flow is limited, in that it does not represent residual cash flows available for discretionary expenditures, due to the fact that the measure does not deduct the payments required for debt service and other contractual obligations or payments made for business acquisitions. Therefore, we believe it is important to view free cash flow as a measure that provides supplemental information to our Consolidated Statements of Cash Flows. The following table sets forth a reconciliation of free cash flow, a non-GAAP financial measure, to net cash provided by operating activities, which we believe to be the GAAP financial measure most directly comparable to free cash flow, as well as information regarding net cash used in investing activities and net cash used in financing activities. Three Months Ended April 30, (Dollars in millions) 2017 2016 Net cash provided by operating activities $ 5,385 $ 6,193 Payments for property and equipment (capital expenditures) -1,990 -2,209 Free cash flow $ 3,395 $ 3,984 Net cash used in investing activities1 $ -1,874 $ -2,119 Net cash used in financing activities $ -3,972 $ -5,432 1 "Net cash used in investing activities" includes payments for property and equipment, which is also included in our computation of free cash flow. 22

1 Change versus prior year comparable period. 2 Excludes currency exchange rate fluctuations related to acquisitions until the acquisitions are included in both comparable periods. Non-GAAP measures - constant currency 23 The term "currency exchange rates" refers to the currency exchange rates we use to convert the operating results for all countries where the functional currency is not the U.S. dollar ("non-USD entities") into U.S. dollars. We calculate the effect of changes in currency exchange rates as the difference between current period activity translated using the current period's currency exchange rates, and the comparable prior year period's currency exchange rates. Throughout our discussion, we refer to the results of this calculation as the impact of currency exchange rate fluctuations. When we refer to constant currency operating results, this means operating results without the impact of the currency exchange rate fluctuations and without the impact of acquisitions of non-USD entities, if any, until such acquisitions are included in both comparable periods. The disclosure of constant currency amounts or results permits investors to understand better Walmart's underlying performance without the effects of currency exchange rate fluctuations or acquisitions of non-USD entities. The table below reflects the calculation of constant currency for total revenues, net sales and operating income for the three months ended April 30, 2017. Three Months Ended April 30, Walmart International Consolidated (Dollars in millions) 2017 Percent Change1 2017 Percent Change1 Total revenues: As reported $ 27,429 -3.3% $ 117,542 1.4% Currency exchange rate fluctuations2 1,208 N/A 1,208 N/A Constant currency total revenues $ 28,637 1.0% $ 118,750 2.5% Net sales: As reported $ 27,097 -3.5% $ 116,526 1.3% Currency exchange rate fluctuations2 1,199 N/A 1,199 N/A Constant currency net sales $ 28,296 0.8% $ 117,725 2.4% Operating income: As reported $ 1,163 -0.1% $ 5,237 -0.7% Currency exchange rate fluctuations2 106 N/A 106 N/A Constant currency operating income $ 1,269 9.0% $ 5,343 1.3%

Non-GAAP measures - fuel impact The net sales and operating income of Sam's Club for the three months ended April 30, 2017, the percentage changes in those financial measures from the respective comparable prior year period, comparable sales of Sam's Club and Walmart U.S. for the 13-week period ended April 28, 2017 and projected comparable sales for the 13-week period ending July 28, 2017, in each case calculated by excluding fuel sales for such periods, are non-GAAP financial measures. We believe the net sales and operating income for the three months ended April 30, 2017, the percentage changes in those financial measures from the respective comparable prior year period, comparable sales for the 13-week period ended April 28, 2017, and projected comparable sales for the 13-week period ending July 28, 2017, in each case calculated by including fuel sales for such period, are, respectively, the financial measures computed in accordance with GAAP most directly comparable to the non-GAAP financial measures described above. We believe that the presentation of the non-GAAP financial measures with respect to Sam’s Club and Walmart U.S. described above provides useful information to investors regarding Walmart’s financial condition and results of operations because that information permits investors to understand the effect of fuel sales, which are affected by the volatility of fuel prices, on Sam's Club's net sales and operating income and on Sam's Club's and Walmart U.S.'s comparable sales for the periods presented. 24
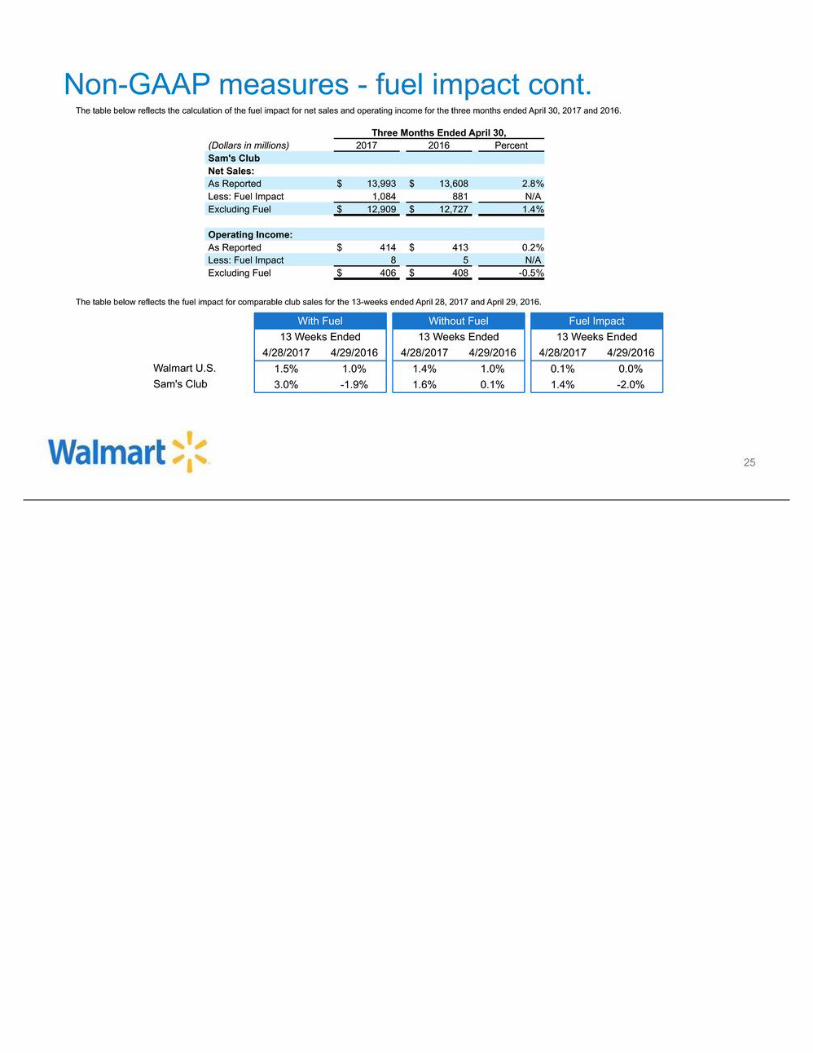
Non-GAAP measures - fuel impact cont. The table below reflects the calculation of the fuel impact for net sales and operating income for the three months ended April 30, 2017 and 2016. Three Months Ended April 30, (Dollars in millions) 2017 2016 Percent Sam's Club Net Sales: As Reported $ 13,993 $ 13,608 2.8% Less: Fuel Impact 1,084 881 N/A Excluding Fuel $ 12,909 $ 12,727 1.4% Operating Income: As Reported $ 414 $ 413 0.2% Less: Fuel Impact 8 5 N/A Excluding Fuel $ 406 $ 408 -0.5% The table below reflects the fuel impact for comparable club sales for the 13-weeks ended April 28, 2017 and April 29, 2016. With Fuel Without Fuel Fuel Impact 13 Weeks Ended 13 Weeks Ended 13 Weeks Ended 4/28/2017 4/29/2016 4/28/2017 4/29/2016 4/28/2017 4/29/2016 Walmart U.S. 1.5% 1.0% 1.4% 1.0% 0.1% 0.0% Sam's Club 3.0% -1.9% 1.6% 0.1% 1.4% -2.0% 25

• Unit counts & square footage • Comparable store sales • Terminology • Fiscal year 2018 earnings dates Additional resources at stock.walmart.com 26
