form 20-f - smfg · united states securities and exchange commission washington, d.c. 20549 form...
TRANSCRIPT

UNITED STATES SECURITIES AND EXCHANGE COMMISSIONWashington, D.C. 20549
FORM 20-F(Mark One)
‘ REGISTRATION STATEMENT PURSUANT TO SECTION 12(b) OR (g) OF THE SECURITIESEXCHANGE ACT OF 1934
OR
È ANNUAL REPORT PURSUANT TO SECTION 13 OR 15(d) OF THE SECURITIES EXCHANGEACT OF 1934For the fiscal year ended March 31, 2015
OR
‘ TRANSITION REPORT PURSUANT TO SECTION 13 OR 15(d) OF THE SECURITIESEXCHANGE ACT OF 1934For the transition period from to
OR
‘ SHELL COMPANY REPORT PURSUANT TO SECTION 13 OR 15(d) OF THE SECURITIESEXCHANGE ACT OF 1934Date of event requiring this shell company report
Commission file number: 001-34919
Kabushiki Kaisha Mitsui Sumitomo Financial Group(Exact name of Registrant as specified in its charter)
SUMITOMO MITSUI FINANCIAL GROUP, INC.(Translation of registrant’s name into English)
Japan 1-2, Marunouchi 1-chome, Chiyoda-ku, Tokyo 100-0005, Japan(Jurisdiction of incorporation or organization) (Address of principal executive offices)
Haruyuki Nagata1-2, Marunouchi 1-chome, Chiyoda-ku, Tokyo 100-0005, Japan
Telephone: +81-3-3282-8111 Facsimile: +81-3-4333-9954(Name, telephone, e-mail and/or facsimile number and address of company contact person)
Securities registered or to be registered pursuant to Section 12(b) of the Act
Title of Each Class Name of Each Exchange on which registered
Common stock, without par value The New York Stock Exchange** Not for trading, but only in connection with the listing of the American Depositary Shares, each American Depositary Share representing
1/5 of one share of the registrant’s common stock.
Securities registered or to be registered pursuant to Section 12(g) of the Act:None
Securities for which there is a reporting obligation pursuant to Section 15(d) of the Act:None
Indicate the number of outstanding shares of each of the issuer’s classes of capital or common stock as of the close ofthe period covered by the annual report.
At March 31, 2015, the following shares of capital stock were outstanding: 1,414,055,625 shares of common stock (including 46,814,201shares of common stock held by the registrant and its consolidated subsidiaries and equity-method associates as treasury stock).
Indicate by check mark if the registrant is a well-known seasoned issuer, as defined in Rule 405 of the Securities Act. Yes È No ‘
If this report is an annual or transition report, indicate by check mark if the registrant is not required to file reports pursuant to Section 13 or15(d) of the Securities Exchange Act of 1934. Yes ‘ No È
Indicate by check mark whether the registrant: (1) has filed all reports required to be filed by Section 13 or 15(d) of the Securities ExchangeAct of 1934 during the preceding 12 months (or for such shorter period that the registrant was required to file such reports), and (2) has beensubject to such filing requirements for the past 90 days. Yes È No ‘
Indicate by check mark whether the registrant has submitted electronically and posted on its corporate Web site, if any, every Interactive DataFile required to be submitted and posted pursuant to Rule 405 of Regulation S-T during the preceding 12 months (or for such shorter periodthat the registrant was required to submit and post such files). Yes ‘ No ‘
Indicate by check mark whether the registrant is a large accelerated filer, an accelerated filer, or a non-accelerated filer. See definition of“accelerated filer and large accelerated filer” in Rule 12b-2 of the Exchange Act. (Check one):Large Accelerated Filer È Accelerated Filer ‘ Non-accelerated Filer ‘
Indicate by check mark which basis of accounting the registrant has used to prepare the financial statements included in this filing:U.S. GAAP ‘ International Financial Reporting Standards as issued by the International Accounting Standards Board È Other ‘
If “Other” has been checked in response to the previous question, indicate by check mark which financial statement item the registrant haselected to follow. Item 17 ‘ Item 18 ‘
If this is an annual report, indicate by check mark whether the registrant is a shell company (as defined in Rule 12b-2 of the ExchangeAct). Yes ‘ No È

TABLE OF CONTENTS
Page
Certain Defined Terms, Conventions and Presentation of Financial Information . . . . . . . . . . . . . . . . . . . . . . 1Cautionary Statement Regarding Forward-Looking Statements . . . . . . . . . . . . . . . . . . . . . . . . . . . . . . . . . . . 2PART I . . . . . . . . . . . . . . . . . . . . . . . . . . . . . . . . . . . . . . . . . . . . . . . . . . . . . . . . . . . . . . . . . . . . . . . . . . . . . . . 3
Item 1. Identity of Directors, Senior Management and Advisers . . . . . . . . . . . . . . . . . . . . . . . . . . 3Item 2. Offer Statistics and Expected Timetable . . . . . . . . . . . . . . . . . . . . . . . . . . . . . . . . . . . . . . . 3Item 3. Key Information . . . . . . . . . . . . . . . . . . . . . . . . . . . . . . . . . . . . . . . . . . . . . . . . . . . . . . . . . 3
3.A. Selected Financial Data . . . . . . . . . . . . . . . . . . . . . . . . . . . . . . . . . . . . . . . . . . . . . . . . . . . . 33.B. Capitalization and Indebtedness . . . . . . . . . . . . . . . . . . . . . . . . . . . . . . . . . . . . . . . . . . . . . 53.C. Reasons for the Offer and Use of Proceeds . . . . . . . . . . . . . . . . . . . . . . . . . . . . . . . . . . . . . 53.D. Risk Factors . . . . . . . . . . . . . . . . . . . . . . . . . . . . . . . . . . . . . . . . . . . . . . . . . . . . . . . . . . . . . 5
Item 4. Information on the Company . . . . . . . . . . . . . . . . . . . . . . . . . . . . . . . . . . . . . . . . . . . . . . . . 184.A. History and Development of the Company . . . . . . . . . . . . . . . . . . . . . . . . . . . . . . . . . . . . . 184.B. Business Overview . . . . . . . . . . . . . . . . . . . . . . . . . . . . . . . . . . . . . . . . . . . . . . . . . . . . . . . 194.C. Organizational Structure . . . . . . . . . . . . . . . . . . . . . . . . . . . . . . . . . . . . . . . . . . . . . . . . . . . 544.D. Property, Plant and Equipment . . . . . . . . . . . . . . . . . . . . . . . . . . . . . . . . . . . . . . . . . . . . . . 56
Item 4A. Unresolved Staff Comments . . . . . . . . . . . . . . . . . . . . . . . . . . . . . . . . . . . . . . . . . . . . . . . . 57Item 5. Operating and Financial Review and Prospects . . . . . . . . . . . . . . . . . . . . . . . . . . . . . . . . . 57
5.A. Operating Results . . . . . . . . . . . . . . . . . . . . . . . . . . . . . . . . . . . . . . . . . . . . . . . . . . . . . . . . 665.B Liquidity and Capital Resources . . . . . . . . . . . . . . . . . . . . . . . . . . . . . . . . . . . . . . . . . . . . . 1095.C. Research, Development, Patents and Licenses . . . . . . . . . . . . . . . . . . . . . . . . . . . . . . . . . . 1135.D. Trend Information . . . . . . . . . . . . . . . . . . . . . . . . . . . . . . . . . . . . . . . . . . . . . . . . . . . . . . . . 1135.E. Off-Balance Sheet Arrangements . . . . . . . . . . . . . . . . . . . . . . . . . . . . . . . . . . . . . . . . . . . . 1135.F. Tabular Disclosure of Contractual Obligations . . . . . . . . . . . . . . . . . . . . . . . . . . . . . . . . . . 1145.G. Safe Harbor . . . . . . . . . . . . . . . . . . . . . . . . . . . . . . . . . . . . . . . . . . . . . . . . . . . . . . . . . . . . . 114
Item 6. Directors, Senior Management and Employees . . . . . . . . . . . . . . . . . . . . . . . . . . . . . . . . . 1156.A. Directors and Senior Management . . . . . . . . . . . . . . . . . . . . . . . . . . . . . . . . . . . . . . . . . . . 1156.B. Compensation . . . . . . . . . . . . . . . . . . . . . . . . . . . . . . . . . . . . . . . . . . . . . . . . . . . . . . . . . . . 1226.C. Board Practices . . . . . . . . . . . . . . . . . . . . . . . . . . . . . . . . . . . . . . . . . . . . . . . . . . . . . . . . . . 1226.D. Employees . . . . . . . . . . . . . . . . . . . . . . . . . . . . . . . . . . . . . . . . . . . . . . . . . . . . . . . . . . . . . . 1266.E. Share Ownership . . . . . . . . . . . . . . . . . . . . . . . . . . . . . . . . . . . . . . . . . . . . . . . . . . . . . . . . . 127
Item 7. Major Shareholders and Related Party Transactions . . . . . . . . . . . . . . . . . . . . . . . . . . . . . 1297.A. Major Shareholders . . . . . . . . . . . . . . . . . . . . . . . . . . . . . . . . . . . . . . . . . . . . . . . . . . . . . . . 1297.B. Related Party Transactions . . . . . . . . . . . . . . . . . . . . . . . . . . . . . . . . . . . . . . . . . . . . . . . . . 1297.C. Interests of Experts and Counsel . . . . . . . . . . . . . . . . . . . . . . . . . . . . . . . . . . . . . . . . . . . . . 130
Item 8. Financial Information . . . . . . . . . . . . . . . . . . . . . . . . . . . . . . . . . . . . . . . . . . . . . . . . . . . . . 1308.A. Consolidated Statements and Other Financial Information . . . . . . . . . . . . . . . . . . . . . . . . 1308.B. Significant Changes . . . . . . . . . . . . . . . . . . . . . . . . . . . . . . . . . . . . . . . . . . . . . . . . . . . . . . . 131
Item 9. The Offer and Listing . . . . . . . . . . . . . . . . . . . . . . . . . . . . . . . . . . . . . . . . . . . . . . . . . . . . . 1319.A. Offer and Listing Details . . . . . . . . . . . . . . . . . . . . . . . . . . . . . . . . . . . . . . . . . . . . . . . . . . . 1319.B. Plan of Distribution . . . . . . . . . . . . . . . . . . . . . . . . . . . . . . . . . . . . . . . . . . . . . . . . . . . . . . . 1339.C. Markets . . . . . . . . . . . . . . . . . . . . . . . . . . . . . . . . . . . . . . . . . . . . . . . . . . . . . . . . . . . . . . . . 1339.D. Selling Shareholders . . . . . . . . . . . . . . . . . . . . . . . . . . . . . . . . . . . . . . . . . . . . . . . . . . . . . . 1339.E. Dilution . . . . . . . . . . . . . . . . . . . . . . . . . . . . . . . . . . . . . . . . . . . . . . . . . . . . . . . . . . . . . . . . 1349.F. Expenses of the Issue . . . . . . . . . . . . . . . . . . . . . . . . . . . . . . . . . . . . . . . . . . . . . . . . . . . . . . 134
Item 10. Additional Information . . . . . . . . . . . . . . . . . . . . . . . . . . . . . . . . . . . . . . . . . . . . . . . . . . . . 13410.A. Share Capital . . . . . . . . . . . . . . . . . . . . . . . . . . . . . . . . . . . . . . . . . . . . . . . . . . . . . . . . . . . . 13410.B. Memorandum and Articles of Incorporation . . . . . . . . . . . . . . . . . . . . . . . . . . . . . . . . . . . . 13410.C. Material Contracts . . . . . . . . . . . . . . . . . . . . . . . . . . . . . . . . . . . . . . . . . . . . . . . . . . . . . . . . 14410.D. Exchange Controls . . . . . . . . . . . . . . . . . . . . . . . . . . . . . . . . . . . . . . . . . . . . . . . . . . . . . . . . 144
i

Page
10.E. Taxation . . . . . . . . . . . . . . . . . . . . . . . . . . . . . . . . . . . . . . . . . . . . . . . . . . . . . . . . . . . . . . . . 14510.F. Dividends and Paying Agents . . . . . . . . . . . . . . . . . . . . . . . . . . . . . . . . . . . . . . . . . . . . . . . 14910.G. Statement by Experts . . . . . . . . . . . . . . . . . . . . . . . . . . . . . . . . . . . . . . . . . . . . . . . . . . . . . . 14910.H. Documents on Display . . . . . . . . . . . . . . . . . . . . . . . . . . . . . . . . . . . . . . . . . . . . . . . . . . . . 15010.I. Subsidiary Information . . . . . . . . . . . . . . . . . . . . . . . . . . . . . . . . . . . . . . . . . . . . . . . . . . . . 150
Item 11. Quantitative and Qualitative Disclosures about Credit, Market and Other Risk . . . . . . . . 150Item 12. Description of Securities other than Equity Securities . . . . . . . . . . . . . . . . . . . . . . . . . . . . 163
12.A. Debt Securities . . . . . . . . . . . . . . . . . . . . . . . . . . . . . . . . . . . . . . . . . . . . . . . . . . . . . . . . . . . 16312.B. Warrants and Rights . . . . . . . . . . . . . . . . . . . . . . . . . . . . . . . . . . . . . . . . . . . . . . . . . . . . . . 16312.C. Other Securities . . . . . . . . . . . . . . . . . . . . . . . . . . . . . . . . . . . . . . . . . . . . . . . . . . . . . . . . . . 16312.D. American Depositary Shares . . . . . . . . . . . . . . . . . . . . . . . . . . . . . . . . . . . . . . . . . . . . . . . . 163
PART II . . . . . . . . . . . . . . . . . . . . . . . . . . . . . . . . . . . . . . . . . . . . . . . . . . . . . . . . . . . . . . . . . . . . . . . . . . . . . . 165Item 13. Defaults, Dividend Arrearages and Delinquencies . . . . . . . . . . . . . . . . . . . . . . . . . . . . . . . 165Item 14. Material Modifications to the Rights of Security Holders and Use of Proceeds . . . . . . . . 165Item 15. Controls and Procedures . . . . . . . . . . . . . . . . . . . . . . . . . . . . . . . . . . . . . . . . . . . . . . . . . . . 165Item 16A. Audit Committee Financial Expert . . . . . . . . . . . . . . . . . . . . . . . . . . . . . . . . . . . . . . . . . . . 166Item 16B. Code of Ethics . . . . . . . . . . . . . . . . . . . . . . . . . . . . . . . . . . . . . . . . . . . . . . . . . . . . . . . . . . . 166Item 16C. Principal Accountant Fees and Services . . . . . . . . . . . . . . . . . . . . . . . . . . . . . . . . . . . . . . . 167Item 16D. Exemptions from the Listing Standards for the Audit Committee . . . . . . . . . . . . . . . . . . . 167Item 16E. Purchases of Equity Securities by the Issuer and Affiliated Purchasers . . . . . . . . . . . . . . . 168Item 16F. Change in Registrant’s Certifying Accountant . . . . . . . . . . . . . . . . . . . . . . . . . . . . . . . . . . 168Item 16G. Corporate Governance . . . . . . . . . . . . . . . . . . . . . . . . . . . . . . . . . . . . . . . . . . . . . . . . . . . . . 168Item 16H. Mine Safety Disclosure . . . . . . . . . . . . . . . . . . . . . . . . . . . . . . . . . . . . . . . . . . . . . . . . . . . . 170
PART III . . . . . . . . . . . . . . . . . . . . . . . . . . . . . . . . . . . . . . . . . . . . . . . . . . . . . . . . . . . . . . . . . . . . . . . . . . . . . . 171Item 17. Financial Statements . . . . . . . . . . . . . . . . . . . . . . . . . . . . . . . . . . . . . . . . . . . . . . . . . . . . . . 171Item 18. Financial Statements . . . . . . . . . . . . . . . . . . . . . . . . . . . . . . . . . . . . . . . . . . . . . . . . . . . . . . 171Item 19. Exhibits . . . . . . . . . . . . . . . . . . . . . . . . . . . . . . . . . . . . . . . . . . . . . . . . . . . . . . . . . . . . . . . . 171
Signatures . . . . . . . . . . . . . . . . . . . . . . . . . . . . . . . . . . . . . . . . . . . . . . . . . . . . . . . . . . . . . . . . . . . . . . . . . . . . . 172Selected Statistical Data . . . . . . . . . . . . . . . . . . . . . . . . . . . . . . . . . . . . . . . . . . . . . . . . . . . . . . . . . . . . . . . . . . A-1Index to Consolidated Financial Statements . . . . . . . . . . . . . . . . . . . . . . . . . . . . . . . . . . . . . . . . . . . . . . . . . . F-1
ii

CERTAIN DEFINED TERMS, CONVENTIONS ANDPRESENTATION OF FINANCIAL INFORMATION
As used in this annual report, unless the context otherwise requires, “SMFG,” the “Company,” “we,” “us,”“our” and similar terms refer to Sumitomo Mitsui Financial Group, Inc. as well as to its subsidiaries, as thecontext requires. References to the “Group” are to us and our subsidiaries and affiliates taken as a whole.“SMBC” and “the Bank” refer to Sumitomo Mitsui Banking Corporation or to Sumitomo Mitsui BankingCorporation and its subsidiaries taken as a whole, depending on the context. The Bank is our main subsidiary.
In this annual report, all of our financial information is presented on a consolidated basis, unless we stateotherwise. As used in this annual report, “IFRS” means International Financial Reporting Standards as issued bythe International Accounting Standards Boards (“IASB”) and “Japanese GAAP” means accounting principlesgenerally accepted in Japan. Our consolidated financial information in this annual report has been prepared inaccordance with IFRS, except for the risk-weighted capital ratios, the segment results of operation and someother specifically identified information, which are prepared in accordance with Japanese banking regulations orJapanese GAAP. Unless otherwise stated or the context otherwise requires, all financial information contained inthis annual report is expressed in Japanese yen.
Our fiscal year ends on March 31.
Unless otherwise specified or required by the context: references to “days” are to calendar days; referencesto “years” are to calendar years and to “fiscal years” are to our fiscal years ending on March 31; references to“$,” “dollars” and “U.S. dollars” are to United States dollars; references to “euros” and “€” are to the currency ofthose member states of the European Union which are participating in the European Economic and MonetaryUnion pursuant to the Treaty on European Union; references to “£” and “British pounds sterling” are to thecurrency of the United Kingdom; and references to “yen” and “¥” are to Japanese yen. Unless otherwisespecified, when converting currencies into yen we use our median exchange rates for buying and selling spotdollars, or other currencies, by telegraphic transfer against yen as determined at the end of the relevant fiscalperiod.
Unless otherwise indicated, in this annual report, where information is presented in millions, billions ortrillions of yen or thousands, millions or billions of dollars, amounts of less than one thousand, one million, onebillion or one trillion, as the case may be, have been rounded. Accordingly, the total of figures presented incolumns or otherwise may not equal the total of the individual items. Except for capital ratios, which have beentruncated, percentage data, unless we state otherwise have been subjected to rounding adjustments for theconvenience of the reader.
1

CAUTIONARY STATEMENT REGARDING FORWARD-LOOKING STATEMENTS
This annual report contains statements that constitute “forward-looking statements” within the meaning ofSection 21E of the U.S. Securities Exchange Act of 1934, as amended (“Securities Exchange Act of 1934”).When included in this annual report, the words “anticipate,” “believe,” “estimate,” “expect,” “intend,” “may,”“plan,” “probability,” “risk,” “project,” “should,” “seek,” “target,” “will” and similar expressions, among others,identify forward-looking statements. You can also identify forward-looking statements in the discussions ofstrategy, plans or intentions. Such statements, which include, but are not limited to, statements contained in“Item 3. Key Information—Risk Factors,” “Item 5. Operating and Financial Review and Prospects” and“Item 11. Quantitative and Qualitative Disclosures about Credit, Market and Other Risk,” reflect our currentviews with respect to future events and are inherently subject to risks, uncertainties and assumptions, includingthe risk factors described in this annual report. Should one or more of these risks or uncertainties materialize, orshould underlying assumptions prove incorrect, actual results may vary materially from those described here asanticipated, believed, estimated, expected or intended.
The U.S. Private Securities Litigation Reform Act of 1995 provides a “safe harbor” for forward-lookinginformation to encourage companies to provide prospective information about themselves. We rely on this safeharbor in making these forward-looking statements.
Forward-looking statements are not guarantees of future performance and involve risks and uncertainties,and actual results may differ from those in the forward-looking statements as a result of various factors, and thedifferences may be material. Potential risks and uncertainties include, without limitation, the following:
• deterioration of Japanese and global economic conditions and financial markets;
• constraints on our operations due to capital adequacy requirements;
• declines in the value of our securities portfolio;
• changes in the level or volatility of market rates or prices;
• incurrence of significant credit-related costs;
• a significant downgrade of our credit ratings;
• our ability to successfully implement our business strategy through our subsidiaries, affiliates andalliance partners;
• exposure to new risks as we expand the scope of our business;
• the industry specific risks of the consumer finance industry;
• the recoverability of deferred tax assets;
• litigation and regulatory proceedings;
• insufficient liquidity;
• problems of other financial institutions; and
• adverse regulatory developments or changes in government policies.
Given these and other risks and uncertainties, you should not place undue reliance on forward-lookingstatements, which speak only as of the date of the filing of this annual report. We expressly disclaim anyobligation to update or to announce publicly any revision to any of the forward-looking statements contained inthis annual report to reflect any changes in events, conditions, circumstances or other developments upon whichany such statement is based. The information contained in this annual report identifies important factors inaddition to those referred to above that could cause differences in our actual results.
2
PART I
Item 1. Identity of Directors, Senior Management and Advisers
Not applicable.
Item 2. Offer Statistics and Expected Timetable
Not applicable.
Item 3. Key Information
3.A. SELECTED FINANCIAL DATA
Selected Financial Data
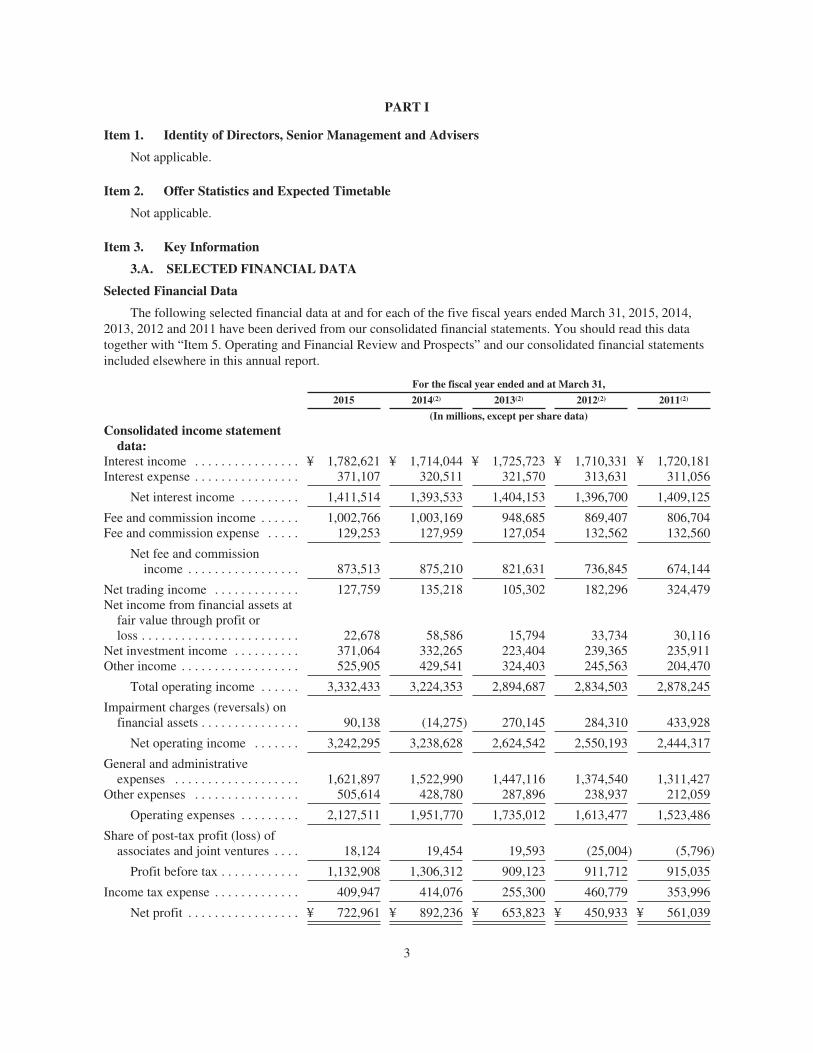
The following selected financial data at and for each of the five fiscal years ended March 31, 2015, 2014,2013, 2012 and 2011 have been derived from our consolidated financial statements. You should read this datatogether with “Item 5. Operating and Financial Review and Prospects” and our consolidated financial statementsincluded elsewhere in this annual report.
For the fiscal year ended and at March 31,
2015 2014(2) 2013(2) 2012(2) 2011(2)
(In millions, except per share data)Consolidated income statement
data:Interest income . . . . . . . . . . . . . . . . ¥ 1,782,621 ¥ 1,714,044 ¥ 1,725,723 ¥ 1,710,331 ¥ 1,720,181Interest expense . . . . . . . . . . . . . . . . 371,107 320,511 321,570 313,631 311,056
Net interest income . . . . . . . . . 1,411,514 1,393,533 1,404,153 1,396,700 1,409,125
Fee and commission income . . . . . . 1,002,766 1,003,169 948,685 869,407 806,704Fee and commission expense . . . . . 129,253 127,959 127,054 132,562 132,560
Net fee and commissionincome . . . . . . . . . . . . . . . . . 873,513 875,210 821,631 736,845 674,144
Net trading income . . . . . . . . . . . . . 127,759 135,218 105,302 182,296 324,479Net income from financial assets at
fair value through profit orloss . . . . . . . . . . . . . . . . . . . . . . . . 22,678 58,586 15,794 33,734 30,116
Net investment income . . . . . . . . . . 371,064 332,265 223,404 239,365 235,911Other income . . . . . . . . . . . . . . . . . . 525,905 429,541 324,403 245,563 204,470
Total operating income . . . . . . 3,332,433 3,224,353 2,894,687 2,834,503 2,878,245
Impairment charges (reversals) onfinancial assets . . . . . . . . . . . . . . . 90,138 (14,275) 270,145 284,310 433,928
Net operating income . . . . . . . 3,242,295 3,238,628 2,624,542 2,550,193 2,444,317
General and administrativeexpenses . . . . . . . . . . . . . . . . . . . 1,621,897 1,522,990 1,447,116 1,374,540 1,311,427
Other expenses . . . . . . . . . . . . . . . . 505,614 428,780 287,896 238,937 212,059
Operating expenses . . . . . . . . . 2,127,511 1,951,770 1,735,012 1,613,477 1,523,486
Share of post-tax profit (loss) ofassociates and joint ventures . . . . 18,124 19,454 19,593 (25,004) (5,796)
Profit before tax . . . . . . . . . . . . 1,132,908 1,306,312 909,123 911,712 915,035
Income tax expense . . . . . . . . . . . . . 409,947 414,076 255,300 460,779 353,996
Net profit . . . . . . . . . . . . . . . . . ¥ 722,961 ¥ 892,236 ¥ 653,823 ¥ 450,933 ¥ 561,039
3
For the fiscal year ended and at March 31,
2015 2014(2) 2013(2) 2012(2) 2011(2)
(In millions, except per share data)
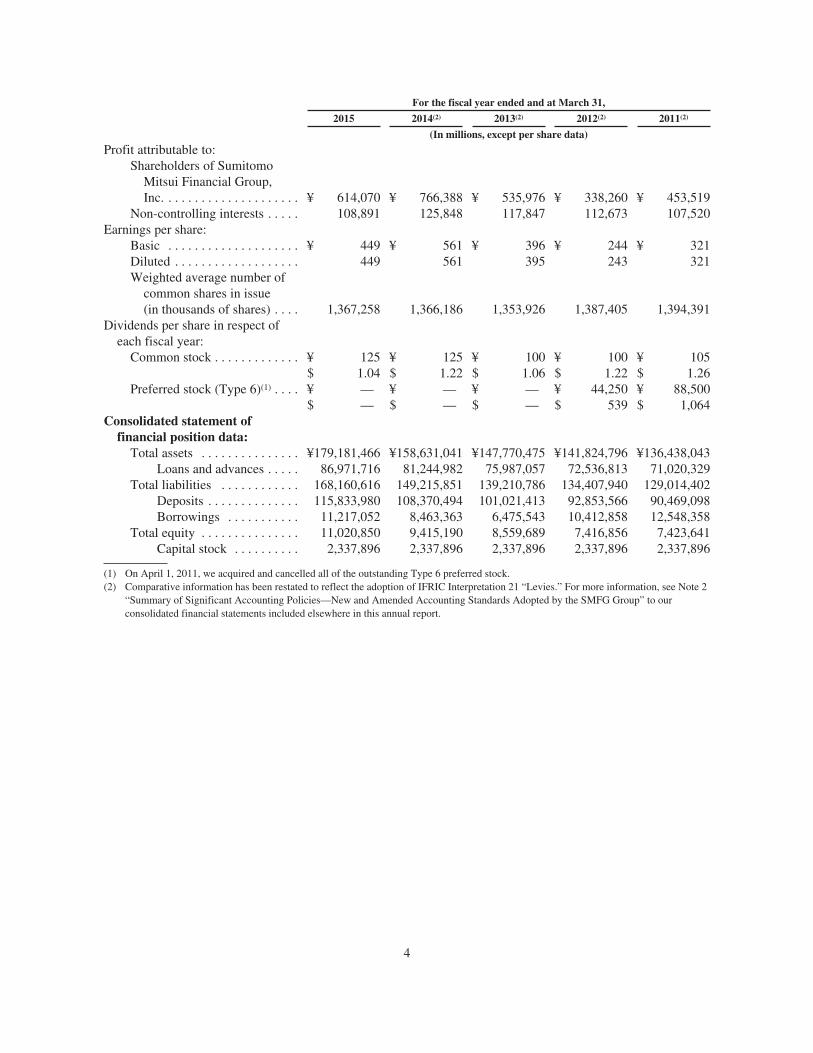
Profit attributable to:Shareholders of Sumitomo
Mitsui Financial Group,Inc. . . . . . . . . . . . . . . . . . . . . ¥ 614,070 ¥ 766,388 ¥ 535,976 ¥ 338,260 ¥ 453,519
Non-controlling interests . . . . . 108,891 125,848 117,847 112,673 107,520Earnings per share:
Basic . . . . . . . . . . . . . . . . . . . . ¥ 449 ¥ 561 ¥ 396 ¥ 244 ¥ 321Diluted . . . . . . . . . . . . . . . . . . . 449 561 395 243 321Weighted average number of
common shares in issue(in thousands of shares) . . . . 1,367,258 1,366,186 1,353,926 1,387,405 1,394,391
Dividends per share in respect ofeach fiscal year:
Common stock . . . . . . . . . . . . . ¥ 125 ¥ 125 ¥ 100 ¥ 100 ¥ 105$ 1.04 $ 1.22 $ 1.06 $ 1.22 $ 1.26
Preferred stock (Type 6)(1) . . . . ¥ — ¥ — ¥ — ¥ 44,250 ¥ 88,500$ — $ — $ — $ 539 $ 1,064
Consolidated statement offinancial position data:
Total assets . . . . . . . . . . . . . . . ¥179,181,466 ¥158,631,041 ¥147,770,475 ¥141,824,796 ¥136,438,043Loans and advances . . . . . 86,971,716 81,244,982 75,987,057 72,536,813 71,020,329
Total liabilities . . . . . . . . . . . . 168,160,616 149,215,851 139,210,786 134,407,940 129,014,402Deposits . . . . . . . . . . . . . . 115,833,980 108,370,494 101,021,413 92,853,566 90,469,098Borrowings . . . . . . . . . . . 11,217,052 8,463,363 6,475,543 10,412,858 12,548,358
Total equity . . . . . . . . . . . . . . . 11,020,850 9,415,190 8,559,689 7,416,856 7,423,641Capital stock . . . . . . . . . . 2,337,896 2,337,896 2,337,896 2,337,896 2,337,896
(1) On April 1, 2011, we acquired and cancelled all of the outstanding Type 6 preferred stock.(2) Comparative information has been restated to reflect the adoption of IFRIC Interpretation 21 “Levies.” For more information, see Note 2
“Summary of Significant Accounting Policies—New and Amended Accounting Standards Adopted by the SMFG Group” to ourconsolidated financial statements included elsewhere in this annual report.
4
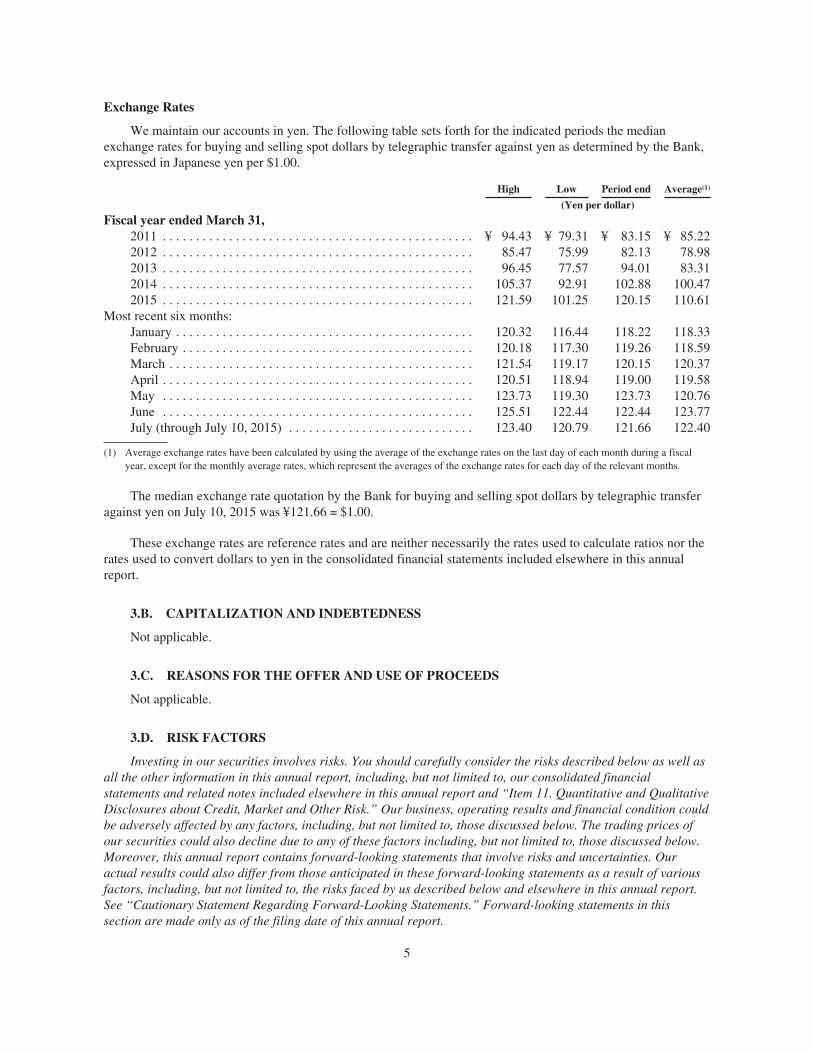
Exchange Rates
We maintain our accounts in yen. The following table sets forth for the indicated periods the medianexchange rates for buying and selling spot dollars by telegraphic transfer against yen as determined by the Bank,expressed in Japanese yen per $1.00.
High Low Period end Average(1)
(Yen per dollar)
Fiscal year ended March 31,2011 . . . . . . . . . . . . . . . . . . . . . . . . . . . . . . . . . . . . . . . . . . . . . . . ¥ 94.43 ¥ 79.31 ¥ 83.15 ¥ 85.222012 . . . . . . . . . . . . . . . . . . . . . . . . . . . . . . . . . . . . . . . . . . . . . . . 85.47 75.99 82.13 78.982013 . . . . . . . . . . . . . . . . . . . . . . . . . . . . . . . . . . . . . . . . . . . . . . . 96.45 77.57 94.01 83.312014 . . . . . . . . . . . . . . . . . . . . . . . . . . . . . . . . . . . . . . . . . . . . . . . 105.37 92.91 102.88 100.472015 . . . . . . . . . . . . . . . . . . . . . . . . . . . . . . . . . . . . . . . . . . . . . . . 121.59 101.25 120.15 110.61
Most recent six months:January . . . . . . . . . . . . . . . . . . . . . . . . . . . . . . . . . . . . . . . . . . . . . 120.32 116.44 118.22 118.33February . . . . . . . . . . . . . . . . . . . . . . . . . . . . . . . . . . . . . . . . . . . . 120.18 117.30 119.26 118.59March . . . . . . . . . . . . . . . . . . . . . . . . . . . . . . . . . . . . . . . . . . . . . . 121.54 119.17 120.15 120.37April . . . . . . . . . . . . . . . . . . . . . . . . . . . . . . . . . . . . . . . . . . . . . . . 120.51 118.94 119.00 119.58May . . . . . . . . . . . . . . . . . . . . . . . . . . . . . . . . . . . . . . . . . . . . . . . 123.73 119.30 123.73 120.76June . . . . . . . . . . . . . . . . . . . . . . . . . . . . . . . . . . . . . . . . . . . . . . . 125.51 122.44 122.44 123.77July (through July 10, 2015) . . . . . . . . . . . . . . . . . . . . . . . . . . . . 123.40 120.79 121.66 122.40
(1) Average exchange rates have been calculated by using the average of the exchange rates on the last day of each month during a fiscalyear, except for the monthly average rates, which represent the averages of the exchange rates for each day of the relevant months.
The median exchange rate quotation by the Bank for buying and selling spot dollars by telegraphic transferagainst yen on July 10, 2015 was ¥121.66 = $1.00.
These exchange rates are reference rates and are neither necessarily the rates used to calculate ratios nor therates used to convert dollars to yen in the consolidated financial statements included elsewhere in this annualreport.
3.B. CAPITALIZATION AND INDEBTEDNESS
Not applicable.
3.C. REASONS FOR THE OFFER AND USE OF PROCEEDS
Not applicable.
3.D. RISK FACTORS
Investing in our securities involves risks. You should carefully consider the risks described below as well asall the other information in this annual report, including, but not limited to, our consolidated financialstatements and related notes included elsewhere in this annual report and “Item 11. Quantitative and QualitativeDisclosures about Credit, Market and Other Risk.” Our business, operating results and financial condition couldbe adversely affected by any factors, including, but not limited to, those discussed below. The trading prices ofour securities could also decline due to any of these factors including, but not limited to, those discussed below.Moreover, this annual report contains forward-looking statements that involve risks and uncertainties. Ouractual results could also differ from those anticipated in these forward-looking statements as a result of variousfactors, including, but not limited to, the risks faced by us described below and elsewhere in this annual report.See “Cautionary Statement Regarding Forward-Looking Statements.” Forward-looking statements in thissection are made only as of the filing date of this annual report.
5

Risks Related to the Economic and Financial Environment
We may be adversely affected if Japanese and global economic conditions and financial marketsdeteriorate.
Our financial condition and results of operations are materially affected by general economic conditions andfinancial markets in Japan and foreign countries, which would be influenced by the changes of various factorssuch as fiscal and monetary policies, and laws and regulations. Those factors include, for example, the Japaneseconsumption tax rate. The Japanese consumption tax rate increased from 5% to 8% in April 2014 and wasscheduled to further increase to 10% in October 2015. However, the increase in the consumption tax rate to 10%has been postponed until April 1, 2017. Furthermore, geopolitical instability in various parts of the world,including North Africa, the Middle East, Asia and Eastern Europe could also contribute to economic instability inthose and other regions and that could affect Japanese and global economic conditions.
The deterioration of Japanese and global economic conditions, or financial market turmoil, could result in aworsening of our liquidity and capital conditions, an increase in our credit costs, and an increase in impairment ofour investment securities and, as a result, adversely affect our business, financial condition and results ofoperations.
Risks Related to Our Business
Failure to satisfy capital adequacy requirements could constrain our and the Bank’s operations.
We and the Bank are subject to capital adequacy requirements established by the Financial Services Agencyof Japan (“FSA”). The current requirements reflect the principal risk-weighted capital measures of the Basel IIIrules text published by the Basel Committee on Banking Supervision (“BCBS”) in December 2010 and are beingphased in from March 2013 to March 2019. Compared to the previous requirements, the current requirementsincrease both the quality and quantity of the risk-weighted capital base.
With respect to the quality of the capital base, certain capital instruments, including existing preferredsecurities and subordinated debt, are eligible for inclusion as Tier 1 capital or Tier 2 capital only for thephase-out period. Furthermore, deferred tax assets that arise from timing differences will be recognized as part ofthe common equity component of Tier 1, with recognition capped at 10% of the bank’s common equitycomponent under certain conditions, while deferred tax assets that arise from net loss carry forwards will bededucted from the common equity component of Tier 1. Such recognition and deduction are implemented in aphased manner and will be fully implemented in March 2018.
With respect to the quantity of the capital base, the minimum Common Equity Tier 1 risk-weighted capitalratio applicable to us and the Bank began increasing incrementally from March 2013 reaching 4.5% byMarch 2015. Moreover, we and the Bank will be required to hold a capital conservation buffer of 2.5% towithstand future periods of stress, and failure to maintain capital at the full buffer levels will result in restrictionson bonuses and capital distributions. The capital conservation buffer will be phased in from March 2016 toMarch 2019. As a result, the total minimum Common Equity Tier 1 risk-weighted capital ratio will be increasedto 7%, and the total minimum risk-weighted capital ratio will be increased to 10.5%. At March 31, 2015, on aconsolidated basis, our total risk-weighted capital ratio was 16.58% compared to the minimum required totalrisk-weighted capital ratio of 8.0%. Out of our total risk-weighted capital ratio, our Tier 1 risk-weighted capitalratio was 12.89%, including 11.30% of Common Equity Tier 1 risk-weighted capital ratio, compared to theminimum required ratios of 6% and 4.5%, respectively.
In addition, in November 2014, we and other organizations were identified by the Financial Stability Board(“FSB”) as Global Systemically Important Financial Institutions (“G-SIFIs”). The list of G-SIFIs is updated eachyear in November, and the requirements for additional loss absorption capacity above the Basel III minimumrequirement will apply from 2016, initially to those financial institutions identified in November 2014 asG-SIFIs.
6

Our and the Bank’s capital ratios could decline as a result of decreases in Tier 1 and Tier 2 capital orincreases in risk-weighted assets. The following circumstances, among others, could reduce our risk-weightedcapital ratio and that of the Bank:
• declines in the value of securities;
• inability to refinance subordinated debt obligations or preferred securities with those qualified asregulatory capital under the new capital adequacy requirements which phased in from March 2013; and
• increases in risk-weighted assets resulting from business growth, strategic investments, borrowerdowngrades or changes in parameters such as probability of default (“PD”).
We and the Bank have adopted the advanced internal rating-based (“IRB”) approach for measuringexposure to credit risk and the advanced measurement approach (“AMA”) to measure exposure to operationalrisk. If the FSA revokes its approval of such implementation or otherwise changes its approach to measurecapital adequacy ratios, our and the Bank’s ability to maintain capital at the required levels may be adverselyaffected.
If our capital ratios fall below required levels, the FSA may require us to take a variety of corrective actions,including withdrawal from all international operations or suspension of all or part of our and the Bank’soperations, which may indirectly affect our or the Bank’s ability to fulfill our and the Bank’s contractualobligations or may result in restrictions on our and the Bank’s businesses. In addition, some of the Bank’sdomestic and overseas subsidiaries are also subject to local capital ratio requirements. Failure of thosesubsidiaries to meet local requirements may result in administrative actions or sanctions imposed by localregulatory authorities.
Future declines of securities prices on Japanese stock markets or other global markets could cause us toexperience impairment losses and unrealized losses on our equity securities portfolio, which couldnegatively affect our financial condition, results of operations and regulatory capital position.
The reported value of our available-for-sale equity instruments accounted for 3.6% of our total assets atMarch 31, 2015, approximately 88.3% of which were Japanese equity securities. This value depends mainly onprices of the instruments in the stock market. In addition, the reported value, gross unrealized gains and losses,and cost of those available-for-sale equity instruments at March 31, 2015 are described in “Item 5.A. OperatingResults—Investment Securities.”
A listed equity security is impaired primarily based on its market price. If we conclude that a particularsecurity is impaired, we calculate the impairment loss based on the market price of that security at the end of therelevant period. Declines in the Japanese stock markets or other global markets could result in further losses fromimpairment of the securities in our equity securities portfolio or sales of these securities, adversely affecting ourresults of operations and financial condition.
Our regulatory capital position and that of the Bank depend in part on the fair value of our equity securitiesportfolio. Substantial declines in the Japanese stock markets or other global markets would negatively affect ourand the Bank’s capital positions, and limit the Bank’s ability to make distributions to us.
We may further reduce our holdings of equity securities in order to reduce financial risks. Any disposal byus of equity holdings of our customers’ shares could adversely affect our relationships with those customers.
Changes in the levels or volatility of market rates or prices could adversely affect our financial conditionand results of operations.
We engage in trading and investing activities dealing with various kinds of financial instruments such asbonds, equities, currencies, derivatives and funds. Our financial condition and results of operations could be
7

adversely affected by actual changes or volatility in interest rates, foreign exchange rates and market prices ofother investment securities. For example, we have substantial investments in debt securities. In particular,Japanese government bonds represent a significant part of our fixed income portfolio. At March 31, 2015, we had¥9 trillion of Japanese government bonds classified as available-for-sale financial assets, which accounted forapproximately 5.2% of our total assets. Increases in interest rates could substantially decrease the value of ourfixed income portfolio, and any unexpected changes in yield curves could adversely affect the value of our bondand interest rate derivative positions, resulting in lower-than-expected revenues from trading and investmentactivities. Market volatility may also result in significant unrealized losses or impairment losses on suchinstruments. Furthermore, the downgrading of investment securities by credit rating agencies may also causedeclines in the value of our securities portfolio.
Adverse economic conditions and deterioration of the financial conditions of our customers could increaseour credit costs.
Our non-performing loans (“NPLs”) and credit costs for corporate and individual customers may increasesignificantly if:
• domestic or global economic conditions worsen or do not improve;
• our customers do not repay their loans, due to reasons including deterioration of their financialconditions; and
• the value of collateral declines.
We have substantial exposure to corporate customers in the following sectors: real estate and goods rentaland leasing, manufacturing, wholesale and retail, transportation, communications and public enterprises, andservices, including electric utilities, and to individual customers mainly through housing loans. The financialconditions of those customers may be subject to changes in the industry-specific economic conditions as well asgeneral economic conditions. In addition, adverse region-specific economic conditions could worsen ourcustomers’ financial conditions or could decrease the value of our collateral provided to us in such regions. As aresult, we may be required to record increases in our allowance for loan losses.
Moreover, for certain borrowers, we may choose to engage in debt-for-equity swaps or provide partial debtwrite-offs, additional financing or other forms of assistance as an alternative to exercising our full legal rights asa creditor if we believe that doing so may increase our ultimate recoverable amount of the loan. We may berequired to, or choose to, provide new or additional financing to customers who may incur unexpected liabilities,have difficulty in the future in continuing operations, encounter difficulties or need to devote significantresources to repair their infrastructures, as a result of natural disasters or other calamities.
In addition, changes in laws or government policies may have an adverse impact on the rights of creditors.For example, the Government of Japan has provided or may provide in the future government guarantees andother government support measures in response to the financial crisis or other unexpected incidents such as theGreat East Japan Earthquake of March 2011 and collateral events. Even if our current or future loans toborrowers have received or will receive any government support measures, it is unclear to what extent thoseloans will benefit, directly or indirectly, from the current or any future government guarantees or supportmeasures.
In addition, our NPLs may increase and there may be additional credit costs if we fail to accurately estimatethe incurred losses in our loan portfolio. These estimates require difficult, subjective and complex judgmentssuch as credit evaluation of our borrowers, valuation of collateral and forecasts of economic conditions.
The ratio of impaired loans and advances to the total loans and advances, both net of allowance for loanlosses, were 1.0%, 1.3% and 1.8% at March 31, 2015, 2014 and 2013, respectively. For further information, see“Item 5.A. Operating Results—Loans and Advances.”
8

A significant downgrade of our credit ratings could have a negative effect on us.
At the date of this annual report, SMFG has the issuer credit ratings of A/A-1 from Standard & Poor’sRatings Japan K.K., (“S&P”), and the foreign and local currency issuer default ratings of A-/F1 from FitchRatings Japan Limited (“Fitch”). There can be no assurance that these ratings will be maintained.
A material downgrade of our credit ratings may have various effects including, but not limited to, thefollowing:
• we may have to accept less favorable terms in our transactions with counterparties, including capitalraising activities, or may be unable to enter into certain transactions;
• foreign regulatory bodies may impose restrictions on our overseas operations;
• existing agreements or transactions may be cancelled; and
• we may be required to provide additional collateral in connection with derivatives transactions.
Any of these or other effects of a downgrade of our credit ratings could have a negative impact on theprofitability of our treasury and other operations, and could adversely affect our regulatory capital position,liquidity position, financial condition and results of operations. For more information about our credit ratings, see“Item 5.B. Liquidity and Capital Resources.”
We face significant challenges in achieving the goals of our business strategy, and our business may not besuccessful.
In May 2014, we and the Bank announced a new medium-term management plan through March 2017. Webelieve that we have targeted appropriate business areas. However, our initiatives to offer new products andservices and to increase sales of our existing products and services may not succeed, if current market conditionsdo not stabilize, market opportunities develop more slowly than expected, our initiatives have less potential thanwe envisioned originally or the profitability of these products and services is undermined by competitivepressures. Consequently, we may be unable to achieve or maintain profitability in our targeted business areas.
In order to implement our business strategy successfully, we need to hire and train qualified personnelcontinuously and in a proactive manner, as well as to attract and retain employees with professional experienceand specialized product knowledge. However, we face competition from other commercial banks, investmentbanks, consumer finance companies and other financial services providers in hiring highly competent employees.There can be no assurance that we will succeed in attracting, integrating and retaining appropriately qualifiedpersonnel.
We are exposed to new risks as we expand our businesses, the range of our products and services, andgeographic scope of our businesses overseas.
As part of our business strategies we have expanded and may continue to expand our businesses or ourrange of products and services beyond our core business, commercial banking. This could expose us to new risks,such as adverse regulatory changes, more competition or deterioration in the operating environments that affectthose businesses, products and services. Some of those risks could be types with which we have no or onlylimited experience. As a result, our risk management systems may prove to be insufficient and may not beeffective in all cases or to the degree required.
In accordance with our strategy to further increase our presence in the international financial markets, wemay continue to expand the scale of our overseas businesses, especially in emerging economies, notably Asiancountries and regions. The expansion of our overseas businesses may further increase our exposure to risks ofadverse developments in foreign economies and markets, including interest rate and foreign exchange rate risk,
9

regulatory risk and political risk. Our overseas expansion also exposes us to the compliance risks and the creditand market risks specific to the countries and regions in which we operate, including the risk of deterioratingconditions in the credit profile of overseas borrowers.
Failure of our business strategies through our subsidiaries, affiliates and other business alliance partnerscould negatively affect our financial condition and results of operations, including impairment losses ongoodwill or investments.
Aligned with our business strategies, we have made and may undertake acquisition of a subsidiary,investments in affiliates and other business alliance partners, and reorganization within our Group companies. Itis uncertain whether we will receive the expected benefits from those business strategies, due to any adverseregulatory changes, worsening of economic conditions, increased competition or other factors that maynegatively affect the related business activities. Furthermore, unanticipated costs and liabilities may be incurredin connection with those business strategies, including liabilities from the claims related to the businesses prior toour business alliances, and cost from actions by regulatory authorities.
When we acquire a subsidiary, we may recognize goodwill and intangible assets. Impairment losses ongoodwill or intangible assets in connection with acquisitions must be recognized when the recoverable amount ofgoodwill or intangible assets of the business is lower than the carrying amount at the time of impairment testing,which is performed annually or whenever there is an indication that the goodwill or intangible assets may beimpaired.
We account for some of our investments in affiliates under the equity method. Therefore, net losses incurredby equity method investees may cause us to record our share of the net losses. Furthermore, we may lose thecapital which we have invested in business alliances or may incur impairment losses on securities acquired insuch alliances. We may also be required under contractual or other arrangements to provide financial support,including credit support and equity investments, to business alliance partners in the future. Additionally, we mayalso incur credit costs from our credit exposure to such partners.
We are exposed to the industry specific risks of the consumer finance industry.
Changes in the legal environment have severely adversely affected the business performance of consumerlending and credit card companies. We have exposures to the risks specific to the consumer finance industrythrough our subsidiaries, including Cedyna Financial Corporation (“Cedyna”) and SMBC Consumer FinanceCo., Ltd. (“SMBC Consumer Finance”).
Consumer lending and credit card companies had offered unsecured personal loans, which included loanswith so-called “gray zone” interest in excess of the maximum rate prescribed by the Interest Rate Restriction Act(ranging from 15% to 20%) up to the 29.2% maximum rate permitted under the Act Regulating the Receipt ofContributions, Receipt of Deposits and Interest Rates (“Contributions Act”). However, as a result of courtdecisions unfavorable to those companies, claims for refunds of amounts paid in excess of the applicablemaximum allowed rate by the Interest Rate Restriction Act have increased substantially. Although Cedyna,SMBC Consumer Finance and other subsidiaries have each recorded a provision for claims for refunds of grayzone interest on loans, we may be required to recognize additional losses if such provisions are determined to beinsufficient.
Amendments to laws regulating moneylenders, which were promulgated in 2006 and which became fullyeffective in June 2010, increased the authority of government regulators, prohibited gray zone interest andintroduced an upper limit on aggregate credit extensions to an individual by moneylenders at one-third of theborrower’s annual income. After the promulgation of such amendments, Cedyna, SMBC Consumer Finance andother companies engaged in related business reduced their interest rates on loans in preparation for theprohibition of gray zone interest. As a consequence, margins earned by those companies, as well as the amountsof loans extended, have decreased.
10
Inability to generate sufficient future taxable profits or adverse changes to tax laws, regulatoryrequirements or accounting standards could have a negative impact on the recoverability of certain deferredtax assets.
We recognize deferred tax assets relating to tax losses carried forward and deductible temporary differencesonly to the extent that it is probable that future taxable profit will be available against which the tax losses carriedforward and the temporary differences can be utilized. The deferred tax assets are quantified on the basis ofcurrent tax rates and accounting standards and are subject to change as a result of changes to future tax rates orthe rules for computing taxable profits and allowable losses. Failure to generate sufficient future taxable profitsor changes in tax laws or accounting standards may reduce our estimated recoverable amount of net deferred taxassets. Such a reduction could have an adverse effect on our financial condition and results of operations.
Declines in returns on our plan assets or revised actuarial assumptions for retirement benefits mayadversely affect our financial condition and results of operations.
The Bank and some of our other subsidiaries have various defined benefit plans. We have experienced in thepast, and may experience in the future, declines in returns on plan assets and changes in the discount rates andother actuarial assumptions. If returns on plan assets decrease, or if we revise the discount rates and otherassumptions, the deficit of the impacted defined benefit plan may increase and adversely affect our financialcondition and results of operations. Because more than half of our plan assets are composed of equityinstruments, the plan assets are greatly affected by volatility in the prices of equity securities. Substantialdeclines in the prices for publicly traded Japanese stocks would negatively affect our plan assets. For furtherinformation, see Note 23 “Retirement Benefits” to our consolidated financial statements included elsewhere inthis annual report.
Our business relies on our information technology systems, and their failure could harm our relationshipswith customers or adversely affect our provision of services to customers.
In all aspects of our business, we use information technology systems to deliver services to and executetransactions on behalf of our customers as well as for back-office operations. We therefore depend on thecapacity and reliability of the electronic and information technology systems supporting our operations. We mayencounter service disruptions in the future, owing to failures of these information technology systems. Ourinformation technology systems are subject to damage or incapacitation as a result of quality problems, humanerrors, natural disasters, power losses, sabotage, computer viruses, acts of terrorism, cyber attacks and similarevents. While we have taken steps to protect information technology systems from those risks, including byestablishing data recovery capability and functionality, these measures may not be sufficient. In addition, we maynot be prepared to address all contingencies that could arise in the event of a major disruption of services. Thefailure to address such contingencies could harm our relationships with customers or adversely affect ourprovision of services to customers.
We handle personal information obtained from our individual and corporate customers in relation to ourbanking, securities, consumer lending, credit card and other businesses. The systems we have implemented toprotect the confidentiality of personal information, including those designed to meet the strict requirements of theAct on the Protection of Personal Information, may not be effective in preventing disclosure of personalinformation by unauthorized access from a third party. Leakage of personal information could expose us todemands for compensation or lawsuits for ensuing economic losses or emotional distress, administrative actionsor sanctions, additional expenses associated with making necessary changes to our systems and reputationalharm. As a result, our business, financial condition and results of operations could be materially and adverselyaffected.
11
Our risk management policies and procedures may not adequately address unidentified or unanticipatedrisks.
We are exposed to a variety of operational, legal and regulatory risks throughout our organization.Management of these risks requires, among other things, policies and procedures to properly record and verifylarge numbers of transactions and events. However, these policies and procedures may not be fully effective orsufficient. We have devoted significant resources to strengthening our risk management policies and proceduresand expect to continue doing so in the future. Nevertheless, particularly in light of the continuing evolution of ouroperations and expansion into new areas, our policies and procedures designed to identify, monitor and managerisks may not be fully effective. Some of our methods of managing risks are based upon our use of observedhistorical market behavior and thus may not accurately predict future risks. Violations of laws including theJapanese antitrust and fair trade laws by us or by the Bank may result in administrative sanctions. Furthermore,investigations, administrative actions or litigation could commence in relation to violations, which may involvecosts and may result in deterioration of our reputation.
Fraud, misconduct or other unlawful behavior by directors, officers and employees or third parties couldsubject us to losses and regulatory sanctions.
We are exposed to potential losses resulting from fraud, misconduct and other unlawful behavior bydirectors, officers and employees. Directors, officers and employees may bind us to transactions that exceedauthorized limits or present unacceptable risks, hide from us and from our customers unauthorized activities,improperly use confidential information or otherwise abuse customer confidences. Third parties may engage infraudulent activities, including fraudulent use of bank accounts or the use of false identities to open accounts formoney laundering, tax evasion or other illegal purposes. Third parties could also use stolen or forged ATM cardsor engage in credit card fraud, and we may be required to indemnify victims of such fraud for related losses. Inthe broad range of businesses in which we engage, fraud, misconduct and other unlawful behavior are difficult toprevent or detect. In addition, with or without actual fraud, misconduct and other unlawful behavior by directors,officers and employees, investigations, administrative actions or litigation could commence in relation to them.Furthermore, we may not be able to recover the losses caused by these activities, including possible deteriorationof our reputation.
Transactions involving Iran and other countries designated by the U.S. Department of State as statesponsors of terrorism or targets that are subject to other U.S. economic sanctions may lead some potentialcustomers and investors to avoid doing business with us or investing in our securities or may limit ourbusiness operations.
U.S. law generally prohibits or substantially restricts U.S. persons from doing business with countriesdesignated by the U.S. Department of State as state sponsors of terrorism (“Designated Countries”), whichcurrently are Iran, Sudan and Syria. Under U.S. law, there are similar prohibitions or restrictions on countries, aregion and persons that are the subject of other U.S. economic sanctions administered by the U.S. Department ofthe Treasury’s Office of Foreign Assets Control (“OFAC”) or other agencies (collectively with the DesignatedCountries, the “Restricted Targets”). We maintain a Group-wide policy designed to ensure compliance withapplicable U.S. laws and regulations. This policy, which covers the Bank and our banking subsidiaries thatprovide financial services globally, prohibits the new extension of credit to Iranian entities. Our non-U.S. officesengage in transactions relating to the Restricted Targets on a limited basis and in compliance with applicablelaws and regulations. These activities include remittance of Japanese yen with respect to our customers’ export orimport transactions, maintenance of correspondent banking accounts with Iranian banks, including the CentralBank of Iran, and the payment of fees in Japanese yen to certain Iranian banks in connection with performancebonds issued in the past by the Bank through these Iranian banks related to our customers’ projects in Iran. Theperformance bonds expired and have not been renewed, but the Bank continues to be obligated to pay certain feesto the Iranian banks. In addition, we maintain a representative office in Iran that mainly performs an information-collecting function.
12

We do not believe that our operations relating to the Restricted Targets materially affect our business,financial condition or results of operations. A limited number of the Bank’s potential violations of U.S. economicsanctions were identified and voluntarily disclosed to OFAC. These transactions resulted from inadvertentoperational errors or the lack of familiarity of some personnel of the Bank with the requirements of the relevantregulations in the past, or from the inherent limitation on information about underlying transactions that can beobtained in the course of normal banking operations. Since the discovery of these potential violations we havefurther strengthened our Group-wide OFAC compliance program in an effort to prevent the recurrence of suchpotential violations. We settled some of the voluntarily disclosed potential violations with OFAC while othersremain unsettled. However, in light of the inadvertent nature of such potential violations and the degree to whichour strengthened OFAC compliance program aims to mitigate the risk of potential violations, we do not believethat our settlement with OFAC, or any possible penalties that OFAC may impose with respect to the otherpotential violations that remain unsettled, will have a material impact on our reputation, financial condition orresults of operations, or on the prices of our securities.
We are aware of initiatives by U.S. states and U.S. institutional investors, such as pension funds, to adoptlaws, regulations or policies prohibiting transactions with or investment in, or requiring divestment from, entitiesengaged in certain business with Iran and other Designated Countries. It is possible that such laws and initiativesmay result in our inability to enter into transactions with those entities that are subject to such prohibitions or toretain or acquire such entities as customers or investors in our securities.
In recent years, the U.S. government has implemented a number of sanctions targeting non-U.S. companiesthat engage in certain Iran-related transactions. The Comprehensive Iran Sanctions, Accountability andDivestment Act of 2010 (“CISADA”) may lead to the imposition of sanctions against non-U.S. financialinstitutions, such as us, if they are determined by the Secretary of the Treasury to have facilitated “significanttransactions” or provided “significant financial services” for certain Iran-linked individuals or entities, or theIranian Revolutionary Guard Corps. In addition, the National Defense Authorization Act for Fiscal Year 2012(“2012 NDAA”), Executive Order 13622, the Iran Threat Reduction and Syria Human Rights Act of 2012(“ITRA”), the Iran Freedom and Counter-Proliferation Act of 2012 (“IFCA”) and Executive Order 13645broadened the range of sanctionable Iran-related transactions. For a description of the laws and Executive Ordersmentioned above, as well as the status of Japan’s exception under the 2012 NDAA (“NDAA Exception”) andcertain U.S. secondary sanctions relief pursuant to the November 24, 2013 Joint Plan of Action (“JPOA”)between the permanent members of the United Nations Security Council, plus Germany (“P5+1”) and Iran, see“Item 4.B. Business Overview—Regulations in the United States—Laws Prohibiting Money Laundering andTerrorist Financing.”
In addition, the U.S. government has enacted a series of Ukraine-related sanctions, including those under theUkraine-Related Sanctions Regulations, the Ukraine Freedom Support Act of 2014 and “sectoral” sanctions onthe financial, energy and defense sectors of the Russian economy.
The laws and Executive Orders referenced above or similar legislative or regulatory developments mayfurther limit our business operations. If we were determined to have engaged in activities targeted by certainU.S. statutes or Executive Orders or regulations, we could lose our ability to open or maintain correspondent orpayable-through accounts with U.S. financial institutions, among other potential sanctions. In addition,depending on sociopolitical developments, even though we ensure compliance with applicable laws andregulations, our reputation may suffer due to our association with the Restricted Targets. The abovecircumstances could have a significant adverse effect on our business or the prices of our securities.
Our business could be adversely affected by litigation and regulatory proceedings globally.
We conduct business in many locations in and outside of Japan. We face the risk of litigation and regulatoryproceedings in connection with our operations. For example, if we engage in activities targeted by CISADA, the2012 NDAA, or other related U.S. statutes or Executive Orders, this could result in the imposition of sanctions
13

by the U.S. government against us. Lawsuits and regulatory actions may result in sanctions of very largeindeterminate amounts or limit our operations, and costs to defend either could be substantial. Moreover, theBank and one of its subsidiaries contribute to financial benchmarks such as the Tokyo Interbank Offered Rate(“TIBOR”) and the London Interbank Offered Rate (“LIBOR”) for certain specific currencies. These benchmarksare widely referenced in jurisdictions in which we operate and do not operate. We face or may face someinvestigations, litigation and regulatory proceedings, and an adverse regulatory decision, judgment or ruling,including in jurisdictions we do not operate in, could have a material adverse effect on our business, results ofoperations and financial condition.
Risks Related to Our Industry
Our liquidity could be adversely affected by actual or perceived weaknesses in our businesses and by factorswe cannot control, such as a general decline in the level of business activity in the financial services sector.
We need liquidity to maintain our lending activities, meet deposit withdrawals, pay our operating expensesand pay interest on and principal of debt and dividends on capital stock. Adverse market and economicconditions in the domestic and global economies may limit or adversely affect our access to liquidity required tooperate our business. If our counterparties or the markets are reluctant to finance our operations due to factorsincluding actual or perceived weaknesses in our businesses as a result of large losses, changes in our creditratings, or a general decline in the level of business activity in the financial services sector, we may be unable tomeet our payment obligations when they become due or only be able to meet them with funding obtained onunfavorable terms. Circumstances unrelated to our businesses and outside of our control, such as, but not limitedto, adverse economic conditions, disruptions in the financial markets or negative developments concerning otherfinancial institutions perceived to be comparable to us, may also limit or adversely affect our ability to replacematuring liabilities in a timely manner. Without sufficient liquidity, we will be forced to curtail our operations,which could adversely affect our business, results of operations and financial condition.
We may incur losses as a result of financial difficulties of counterparties and other financial institutions.
We regularly execute transactions with counterparties in the financial services industry. Many of thesetransactions expose us to credit risk in the event of deterioration of creditworthiness of a counterparty or client.With respect to secured transactions, our credit risk may be exacerbated when the collateral cannot be foreclosedon or is liquidated at prices not sufficient to recover the full amount of the loan or other exposures due to us.Losses from our investments in and loans to other financial institutions could materially and adversely affect ourbusiness, financial condition and results of operations. We may also be requested to participate in providingassistance to distressed financial institutions that are not our subsidiaries. In addition, if the funds collected by theDeposit Insurance Corporation of Japan (“DIC”) are insufficient to insure the deposits of failed Japanese banks,the insurance premiums that we pay to the DIC will likely be increased, which could adversely affect ourbusiness and results of operations.
Adverse regulatory developments or changes in government policies could have a negative impact on ourresults of operations.
Our businesses are subject to extensive regulation and associated regulatory risks, including the effects ofchanges in the laws, regulations, policies, voluntary codes of practice and interpretations in Japan and the otherjurisdictions in which we operate. Those changes and their effects on us are unpredictable and beyond ourcontrol.
Changes in the regulatory environment may adversely affect our financial condition and results ofoperations. In particular, the financial crisis has led to calls for significant financial reform measures, and variousgovernments are at different stages of enacting legislation that will affect financial institutions.
In response to the financial and economic turmoil, regulatory authorities have been reviewing and revisingcapital adequacy guidelines, particularly in relation to quality of capital and accounting standards; such revisions
14

could adversely affect our capital ratios. In December 2010, the BCBS published the Basel III rules text, settingout certain changes to capital requirements which include raising the quality of banks’ capital bases, enhancingrisk coverage, inhibiting leverage, reducing pro-cyclicality and introducing liquidity regulation. The changes thatthe FSA made to its capital adequacy guidelines in response to Basel III, have been generally applied fromMarch 31, 2013.
The FSA’s Financial Inspection Manual for financial institutions and related guidelines are revised oramended from time to time. Our implementation of any such changes could result in an increase in ouradministrative expenses, which could have an adverse effect on our results of operations and financial condition.
The FSA and regulatory authorities in the United States and other jurisdictions, along with theUnited Nations, have in recent years made sanctions as a means to promote the prevention of money launderingand terrorism financing a focus of governmental policy relating to financial institutions. Any regulatory action orchange in regulatory focus, whether as a result of inspections or regulatory developments, may negatively affectour banking operations and may require expensive remediation.
The Dodd-Frank Wall Street Reform and Consumer Protection Act (“Dodd-Frank Act”), which was enactedin July 2010, provides a broad framework for significant regulatory changes across most areas of U.S. financialregulations. The Dodd-Frank Act addresses, among other issues, systemic risk oversight, bank capital standards,the resolution of failing systemically significant financial institutions, over-the-counter (“OTC”) derivatives, theability of banking entities to engage in proprietary trading activities and invest in hedge funds and private equityfunds, consumer and investor protection, and securitization. Implementation of the Dodd-Frank Act is takingplace through detailed rulemaking over multiple years by various regulators. The final details, impact and timingof some of the rules, particularly of rules relating to derivatives, remain uncertain, and they could result inadditional costs, or restrict or otherwise affect the way we conduct our business.
These and similar, or any other kind of significant regulatory developments could adversely affect ourcapital ratios and results of operations. For further details, see “Item 4.B. Business Overview—Regulations inJapan, Regulations in the United States, and Regulations in Other Jurisdictions.” Since those changes inregulation or fiscal or other policies and their effects are unpredictable and beyond our control, we may not beable to comply with those changes at all times, despite our efforts. Any such failures could result inadministrative or judicial proceedings against us, including suspension of our business and financial penalties,which could materially adversely affect our business, reputation, results of operations and financial condition.
We operate in the highly competitive financial services industry.
Deregulation of the financial system, consolidation among financial institutions, diversification within thefinancial services industry, and the expanded presence of foreign financial institutions and investors have madethe Japanese financial services market highly competitive. Moreover, competition in overseas markets hasintensified due to global consolidation, convergence and alliances among financial institutions. We compete withvarious types of financial services companies, including:
• banking groups, including Japan’s other major banking groups;
• government-controlled and government-affiliated entities;
• regional banking institutions;
• major investment banks; and
• non-bank financial institutions.
Government actions, such as those taken to stabilize the market and to alter the regulatory framework, mayaffect our competitive position. In response to the recent financial crisis, the Government of Japan has taken andmay adopt policies, including providing fiscal stimulus or extending credit support to other Japanese financial
15

institutions, which adversely affect our competitive position. Under the Postal Privatization Act, the Japan PostBank Co., Ltd. (“Japan Post Bank”), one of the world’s largest deposit-taking financial institutions, is allowed toexpand its business with prior approval of the government. Increased competition in Japan may put downwardpressure on prices for our financial services, cause us to lose market share or require us to incur additionalexpenses in order to remain competitive. Internationally, various forms of financial support provided by foreigngovernments to foreign banks and other financial institutions during the current financial crisis may reduce thecost of capital to those institutions and otherwise give them competitive advantages. There can be no assurancethat we will be able to respond effectively to current or future competition.
Damage to our reputation may have an adverse effect on our business and results of operations.
Maintaining our reputation is vital to our ability to attract and maintain customers, investors and employees.Our reputation could be damaged through a variety of circumstances, including, among others, fraud or othermisconduct or unlawful behavior by directors, officers or employees, systems failures, compliance failures,investigations, adverse litigation judgments or regulatory decisions, or unfavorable outcomes of governmentalinspections. Negative media coverage of Japan’s financial services industry or us, even if inaccurate or notapplicable to us, may have a materially adverse effect on our brand image and may undermine depositorconfidence, thereby affecting our businesses and results of operations. For example, actual or rumoredinvestigations of us or our directors, officers or employees, or actual or rumored litigation or regulatoryproceedings, or media coverage of the same, may have a material adverse effect on our reputation and couldnegatively affect the prices of our securities. Actions by the financial services industry generally or by certainmembers in the industry can also adversely affect customers’ confidence on the financial services industry. Suchreputational harm could also lead to a decreased customer base, reduced revenues and higher operating costs.
Other Risks
Our failure to establish, maintain and apply adequate internal controls over financial reporting couldnegatively impact investor confidence in the reliability of our financial statements.
In order to operate as a global financial institution, it is essential for us to have effective internal controls,corporate compliance functions, and accounting systems to manage our assets and operations.
As a New York Stock Exchange (“NYSE”)-listed company and a registrant with the U.S. Securities andExchange Commission (“SEC”) under section 404 of the U.S. Sarbanes-Oxley Act of 2002, our management isrequired to assess the effectiveness of our internal control over financial reporting and disclose whether suchinternal controls are effective. Our independent registered public accounting firm has to conduct an audit toevaluate and then render an opinion on the effectiveness of our internal control over financial reporting. TheFinancial Instruments and Exchange Act of Japan (“FIEA”) also requires companies listed on a Japanese stockexchange, such as us, to file, together with their annual securities reports required by the FIEA, audited internalcontrol reports assessing the effectiveness of their internal controls over financial reporting.
We have established internal controls over financial reporting, as well as rules for evaluating those controls,in order to provide reasonable assurance of the reliability of our financial reporting and the preparation offinancial statements. However, these controls may not prevent or detect errors. Any evaluation of effectiveness tofuture periods is subject to the risks that controls may become inadequate because of changes in conditions, orthat the degree of compliance with the policies or procedures may deteriorate. To the extent any issues areidentified through the foregoing processes, there can be no assurance that we will be able to resolve them in atimely manner or at all. If this occurs, our reputation may be damaged, which could lead to a decline in investorconfidence in us.
16

Our business operations are exposed to risks of natural disasters, terrorism, pandemics and othercalamities.
Our business operations are subject to the risks of natural disasters, terrorism, pandemics, blackouts,geopolitical incidents and other calamities, any of which could impair our business operations. Despite ourpreparation of operation manuals and other backup measures and procedures, such calamities could cause us tosuspend operations and could adversely affect our businesses, financial condition and results of operations.Massive natural disasters such as the Great East Japan Earthquake and any subsequent collateral events, mayadversely affect economic conditions in general, the financial conditions of our corporate and individualcustomers and stock market prices, or cause other negative effects, any or all of which could materially andadversely affect our financial condition and results of operations owing to, for example, an associated increase inthe amount of credit-related costs or an increase in losses related to our holdings of securities.
Sales of our shares by us or the Bank may have an adverse effect on the market price of our shares and maydilute existing shareholders.
We may issue shares from the unissued portion of our authorized share capital and sell shares held astreasury stock, generally without a shareholder vote. In addition, the Bank may sell any of our shares that itholds. Sales of shares in the future may be at prices below prevailing market prices and may be dilutive.
It may not be possible for investors to effect service of process within the United States upon us or ourdirectors, corporate auditors or senior management, or to enforce against us or those persons judgmentsobtained in U.S. courts predicated upon the civil liability provisions of the U.S. federal or state securitieslaws.
We are a joint stock corporation incorporated under the laws of Japan. Almost all of our directors, corporateauditors and senior management reside outside the United States. Many of our assets and the assets of thesepersons are located in Japan and elsewhere outside the United States. It may not be possible, therefore, forU.S. investors to affect service of process within the United States upon us or these persons or to enforce, againstus or these persons, judgments obtained in U.S. courts predicated upon the civil liability provisions of the federalor state securities laws. We believe that there is doubt as to the enforceability in Japan, in original actions or inactions to enforce judgments of U.S. courts, of claims predicated solely upon the U.S. federal or state securitieslaws mainly because the Civil Execution Act of Japan requires Japanese courts to deny requests for theenforcement of judgments of foreign courts if foreign judgments fail to satisfy the requirements prescribed by theCivil Execution Act, including requirements that:
• the jurisdiction of the foreign court be recognized under laws, regulations, treaties or conventions;
• proper service of process be made on relevant defendants, or relevant defendants be given appropriateprotection if such service is not received;
• the judgment and proceedings of the foreign court not be repugnant to public policy as applied inJapan; and
• there exist reciprocity as to the recognition by a court of the relevant foreign jurisdiction of a finaljudgment of a Japanese court.
Judgments obtained in U.S. courts, predicated upon the civil liability provisions of the U.S. federal or statesecurities laws, may not satisfy these requirements.
As a holder of our American Depositary Shares (“ADSs”), you have fewer rights than a shareholder ofrecord in our shareholder register because you must act through the depositary to exercise these rights.
The rights of our shareholders under Japanese law to take actions such as voting their shares, receivingdividends and distributions, bringing derivative actions, examining our accounting books and records and
17

exercising appraisal rights are available only to our shareholders of record. Because the depositary, through itscustodian, is the record holder of the shares underlying the ADSs, only the depositary can exercise shareholderrights relating to the deposited shares. ADS holders will not be able to directly bring a derivative action, examineour accounting books and records or exercise appraisal rights.
Pursuant to the deposit agreement among us, the depositary and the holders and beneficial owners of ADSs,the depositary will endeavor to exercise voting and other rights associated with shares underlying ADSs inaccordance with instructions given by ADS holders, and the depositary will also pay to ADS holders dividendsand distributions collected from us. However, the depositary is permitted under the deposit agreement to exercisereasonable discretion in carrying out those instructions or in making distributions, and is not liable for failure tocarry out instructions or make distributions as long as it acts in good faith. Therefore, ADS holders may not beable to exercise voting or other rights associated with the shares underlying ADSs in the manner that they intend,or may lose some or all of the value of dividends or distributions collected from us. Moreover, the depositagreement may be amended or terminated by us and the depositary without any reason, or consent from or noticeto ADS holders. As a result, ADS holders may not be able to exercise rights in connection with the depositedshares exercised in the way they wish or at all.
ADS holders are dependent on the depositary for certain communications from us. We send to thedepositary most of our communications to ADS holders in Japanese. ADS holders may not receive all of ourcommunications in the same manner as or on an equal basis with shareholders of record in our shareholderregister.
Item 4. Information on the Company
4.A. HISTORY AND DEVELOPMENT OF THE COMPANY
Legal and Commercial Name
Our legal name is Sumitomo Mitsui Financial Group, Inc. Our commercial name is Sumitomo MitsuiFinancial Group.
Date of Incorporation
We were established in December 2002.
Domicile and Legal Form
We are a joint stock corporation incorporated with limited liability under the laws of Japan. Our address is:Sumitomo Mitsui Financial Group, Inc., 1-2, Marunouchi 1-chome, Chiyoda-ku, Tokyo 100-0005, Japan. Ourtelephone number is: +81-3-3282-8111.
History and Development
We were established in December 2002 as a holding company for the Group through a statutory sharetransfer (kabushiki-iten) of all of the outstanding equity securities of the former SMBC in exchange for ournewly issued securities. Upon our formation and completion of the statutory share transfer, the former SMBCbecame our direct, wholly owned subsidiary. The Bank was established in March 2003 through the merger of theformer SMBC with Wakashio Bank, which was established in 1996 as a subsidiary of Sakura Bank. The formerSMBC was established in April 2001 through the merger of Sumitomo Bank and Sakura Bank, which wasestablished through the merger of Taiyo Kobe Bank and Mitsui Bank in 1990. Mitsui and Sumitomo started theirbanking businesses in 1876 and 1895, respectively. The origins of both banking businesses can be traced back tothe seventeenth century.
18
Information Concerning the Principal Capital Expenditures and Divestitures
In June 2012, the Bank, Sumitomo Mitsui Finance and Leasing Company, Limited (“SMFL”) andSumitomo Corporation, a non-affiliate, acquired the aircraft leasing business of The Royal Bank of ScotlandGroup plc, and commenced its operation as SMBC Aviation Capital. The business which we acquired for a totalprice of ¥93 billion, comprises companies including SMBC Aviation Capital Limited (former RBS AerospaceLimited), SMBC Aviation Capital (UK) Limited (former RBS Aerospace (UK) Limited), and SMBC AviationCapital Australia Leasing Pty Limited (former RBS Australia Leasing Pty Limited).
In June 2012, the Bank transferred all of its shares of ORIX Credit Corporation (“ORIX Credit”), aconsumer finance provider which became a subsidiary of the Bank in July 2009, to ORIX Corporation (“ORIX”).As a result, ORIX Credit is no longer our subsidiary.
Public Takeover Offers
Not applicable.
4.B. BUSINESS OVERVIEW
Overview
We are a holding company that directly owns 100% of the issued and outstanding shares of the Bank, one ofthe largest commercial banks in Japan. We are one of the three largest banking groups in Japan with anestablished presence across all of the consumer and corporate banking sectors. Our subsidiaries in ourCommercial Banking segment include, in addition to the Bank, Kansai Urban Banking Corporation (“KUBC”),THE MINATO BANK, LTD. (“The Minato Bank”), Sumitomo Mitsui Banking Corporation Europe Limited(“SMBC Europe”), and Sumitomo Mitsui Banking Corporation (China) Limited (“SMBC (China)”). Oursubsidiaries also include SMFL in our Leasing segment; SMBC Nikko Securities Inc. (“SMBC NikkoSecurities”) and SMBC Friend Securities Co., Ltd. (“SMBC Friend Securities”) in our Securities segment; andSumitomo Mitsui Card Company, Limited (“Sumitomo Mitsui Card”), Cedyna and SMBC Consumer Finance inour Consumer Finance segment. See “Item 4.C. Organizational Structure.”
Management Philosophy
Our Group-wide management philosophy is as follows:
• we grow and prosper together with our customers, by providing services of greater value to them;
• we aim to maximize our shareholders’ value through the continuous growth of our business; and
• we create a work environment that encourages and rewards diligent and highly-motivated employees.
In addition to our Group-wide management philosophy, we have also established a code of conduct. Ourcode of conduct is designed to be a guideline for the conduct of our directors, officers and employees in therealization of our Group-wide management philosophy in all areas. Our code of conduct is as follows:
• to strive to increase shareholder value whilst also maintaining healthy relationships with customers,employees and other stakeholders. To give utmost consideration to the trust which people have in theBank, to abide by all laws and regulations, to maintain a high ethical standard, and to act fairly andsincerely;
• to continue improving our knowledge and capability and, at the same time, to raise our productivity inorder to provide superior financial services at competitive prices;
• to establish a top brand global bank by understanding the needs of each customer and by providingvaluable services which meet those needs;
19

• to be selective and focused in the implementation of our business strategy, to define and develop thecompetitive advantages which we have over our competitors and, by allocating managerial resourcesstrategically to those businesses, to become a top player in our selected markets;
• to be creative, proactive and courageous in order to be in a leading position in all business areas andalways a step ahead of our competitors;
• to build a strong organization based on market practice and sound principles whilst reflecting ourdiverse values. To delegate internal authority under an efficient and effective management systemwhich facilitates speedy decision-making and execution; and
• to support the growth of our business by setting challenging targets for our staff and employing results-based evaluation and compensation systems.
Environment
We recognize preservation of the environment as one of our most important management objectives andstrive to achieve harmony with the natural environment in our corporate activities.
Basic Philosophy Regarding the Group’s Environmental Activities
Recognizing the importance of realizing a sustainable society as one of our most important tasks, we makecontinuous efforts to harmonize environmental preservation and pollution control with corporate activities, inorder to support the economy and contribute to the betterment of society as a whole.
We and our principal Group companies have obtained ISO 14001 certification, the international standard forenvironmental management systems. Every year we set environmental objectives which we systematicallypursue through environmental activities based on a PDCA (Plan, Do, Check and Act) cycle. The Bank and someof our other Group companies adopted “Principles for Financial Action towards a Sustainable Society” inOctober 2011, which have been set forth for the purposes of making environmental financing widely-known andimproving the quality of environmental financing.
The Bank made its head office “carbon neutral” and requires land pledged as collateral to undergo soilcontamination and asbestos risk assessment. In addition, we also apply the “Equator Principles,” a set ofguidelines for financial institutions to assess and manage social and environmental impacts related to thefinancing of large-scale development projects, when we finance such projects.
Description of Operations and Principal Activities
Commercial Banking
We offer commercial banking services to a wide range of customers including large corporations, mid-sizedcompanies, small-sized companies, individuals, governments and governmental entities mainly through theBank. The Bank has solid franchises in both corporate and consumer banking in Japan. The Bank has long-standing and close business relationships with many companies listed on the First Section of the Tokyo StockExchange and long historical relationships with the so-called Sumitomo Group and Mitsui Group companies.
The Bank provides an extensive range of corporate and consumer banking services in Japan and wholesalebanking services overseas. In Japan, the Bank accepts deposits from, makes loans to, extends guarantees to andprovides other products and services to corporations, individuals, governments and governmental entities. TheBank offers financing solutions through loan syndication, structured finance and project finance to largecorporate customers in the domestic and overseas markets, as well as a variety of financing options to domesticmid-sized companies, small-sized companies and individuals. The Bank also underwrites and deals in bondsissued by or guaranteed by the Government of Japan and local government authorities, and acts in various
20

administrative and advisory capacities for select types of corporate and government bonds. Internationally, theBank operates through a network of branches, representative offices, subsidiaries and affiliates to provide loansyndication, project finance and cash management services and participate in international securities markets.
Until March 31, 2014, the Bank conducted its primary banking business through five business units: theConsumer Banking Unit, the Middle Market Banking Unit, the Corporate Banking Unit, the InternationalBanking Unit and the Treasury Unit. On April 1, 2014, the Bank restructured its domestic business operationsand reorganized its domestic business units, in order to further enhance its capability to meet the needs of ourclients and deliver higher value-added products and services. Under the new structure, the Consumer BankingUnit, the Middle Market Banking Unit and the Corporate Banking Unit were reorganized into two business units:the Wholesale Banking Unit and the Retail Banking Unit. Accordingly, the Bank operates its primary bankingbusiness through four business units. In addition to the four business units, the Bank also has several cross-sectional units and divisions including the Investment Banking Unit, the Corporate Advisory Division, thePrivate Advisory Division and the Transaction Business Division. Further, the Bank has a Corporate Staff Unit, aCorporate Services Unit, a Compliance Unit, a Risk Management Unit and an Internal Audit Unit.
The Bank’s Wholesale Banking Unit
The Bank’s Wholesale Banking Unit aims to offer business solutions for the increasingly complex anddiverse management issues that are faced by large Japanese corporations, including listed companies and mid-sized companies, and, together with certain of our Group companies, provides a wide range of financial productsand services targeting those corporations and companies, through 179 sales channels of the Bank at March 31,2015. The financial products and services that this business unit provides include deposits, loans includingsyndicated loans, commitment lines, structured finance and nonrecourse loans, settlement services, cashmanagement, leasing, factoring, management information systems consulting, collection and investment bankingservices. This business unit also provides the following products and services:
• Services for Globalizing Corporations. In light of the recent overseas expansion trend, the Bankfocuses on offering products and services whereby the Bank assists those customers entering newmarkets, especially in China and other Asian countries, and accommodates an increase in theirinternational trade operations.
• Loan Products and Services to Promote Socially Responsible Activities. The Bank provides a variety ofloan products and services designed for corporate clients engaging in socially responsible activities.These activities include environmentally friendly activities, improvement of eating habits, developmentof agricultural and fishery industries, and development of risk management systems for emergencysituations. The Bank evaluates their socially responsible activities and offers loans with certainconditions incorporating the results of its evaluation. Furthermore, in connection with these loans, theBank provides advice in relation to the client’s socially responsible initiatives.
• Services to Promote B-to-B Transactions. The Bank, with its subsidiaries and affiliates, providesvarious internet settlement services to meet its customers’ needs. The Bank has promoted theseservices to stimulate greater demand for its solutions business. Using these services, corporatecustomers are able to transfer money more easily and effectively, and also utilize foreign exchangeservices to transfer funds to and from their overseas counterparts in foreign currencies.
The Bank’s Retail Banking Unit
The Bank’s Retail Banking Unit provides financial services to both consumers residing in Japan anddomestic small-sized companies.
21

For consumers, this business unit offers a wide range of financial services including personal bank accounts,deposit products such as ordinary deposits, time deposits and foreign currency deposits, and the followingproducts and services through various channels:
• Housing Loans. Housing loans, which are principally secured by collateral or supported by guarantees,are one of the primary products offered by this business unit. The Bank provides housing loans with avariety of terms and interest rates, including 2- to 35-year term, fixed-rate loans, to meet diversifiedcustomer needs. For instance, the Bank offers a housing loan combined with an insurance policy thatcovers the repayment of the outstanding loan balance in the event the borrower is diagnosed withcertain diseases.
• Investment Trust. The Bank, as a broker, provides a variety of investment trust products with varyingrisk-return profiles that are developed and managed by experienced asset management companieswithin Japan and overseas. Also, the Bank, together with its subsidiary SMBC Nikko Securities, offersdiscretionary investment management services.
• Insurance Products. The Bank, as an agent, offers pension-type insurance, whereby customers whomake all premium payments are able to receive annuity payments when they reach a certain age. TheBank, as an agent, also sells a wide range of insurance products, including medical insurance, juvenileinsurance, home fire insurance, single-premium whole life insurance and level-premium life insurance.
• Consumer Finance Services. The Bank offers a variety of consumer loan products such as unsecuredcard loan products to its individual customers.
In addition, the Bank is promoting the collaboration with its subsidiary SMBC Nikko Securities to meetcustomers’ diverse needs for asset management by leveraging their respective strengths of a broad client base anda high advisory capability.
The operations are mainly conducted through a large and well developed branch network. The Bank had adomestic network consisting of 441 branch offices at March 31, 2015, most of which were located in the Tokyoand Osaka regions. Some branches provide financial consulting services for asset management and housing loansduring extended hours, including weekday evenings, weekends and national holidays, for the convenience ofindividual customers.
The Bank also operates an extensive network of ATMs in Japan. At March 31, 2015, the Bank offers itscustomers’ access to 51,055 ATMs, some of which are the Bank’s ATMs and the majority of which are ATMsmade available through arrangements with other ATM providers such as convenience store chains.
This business unit also offers internet banking services for consumers. At March 31, 2015, the Bank’sinternet banking services had approximately 14 million registered users. The users are able to transfer funds,perform balance inquiries, make time deposits and foreign currency deposits, and buy and sell investment trustsover the internet, as well as over the mobile phone or the traditional telephone.
For small-sized companies, this business unit provides a wide array of financial products and services tocomprehensively address in the same place business owners’ needs as both corporate managers and individualssuch as business and asset succession.
The Bank also offers the wealth management services to its customers in collaboration with SMBC NikkoSecurities and Barclays PLC (“Barclays”). See “—Other Major Group Companies and Alliances—Alliance withBarclays PLC.”
22

The Bank’s International Banking Unit
The Bank’s International Banking Unit mainly supports companies, financial institutions, sovereign/quasi-sovereign entities outside Japan, and multinational companies operating in Japan. This business unit provides avariety of tailored products and services to meet customer and market requirements, including loans, deposits,clearing services, trade finance, project finance, loan syndication and global cash management services.
At March 31, 2015, the Bank’s international network consisted of 15 branches, 17 sub-branches and7 representative offices and the Bank seeks to meet customers’ needs globally, together with the network of theBank’s foreign banking subsidiaries such as SMBC Europe with 7 offices and SMBC (China) with 15 offices,and foreign banking associates including PT Bank Tabungan Pensiunan Nasional Tbk, the Bank of East Asia,Limited and Vietnam Export Import Commercial Joint Stock Bank.
Based on our strategy of expanding our businesses globally, the Bank has been promoting strategic alliancesto enhance products and services with leading financial institutions such as Barclays, Kotak Mahindra BankLimited, and ACLEDA Bank Plc. Additionally, in order to further expand our business in the U.S., we and theBank obtained financial holding company status under the U.S. Bank Holding Company Act of 1956, asamended (“Bank Holding Company Act”), on May 7, 2013, which allows the expansion of the scope of servicesto provide in the U.S., including underwriting and trading of securities and providing other investment bankingservices.
The Bank’s Treasury Unit
The Bank’s Treasury Unit operates in the domestic and international money, foreign exchange, securitiesand derivatives markets to serve customer needs and the Bank’s own asset and liability managementrequirements.
To further expand the Bank’s customer base, this business unit also seeks to provide specialized solutionsand enhance customer service capabilities in market transactions through the following activities:
• providing a variety of products from traditional money and foreign exchange transactions to derivativetransactions; and
• developing channels such as an internet banking site providing foreign exchange transactions to satisfya variety of requirements and orders from customers.
Others
The Bank also engages in the following business activities through its business units:
• Payment Services. The Bank handles money remittances for municipalities, public and privatecorporations and individuals in Japan and overseas. Domestic remittance services are significant inJapan, where checks are rarely used and money remittance is a major means of payment. The Bank alsohandles the collection for its customers of promissory notes, bills of exchange and checks.
• Foreign Exchange. The Bank engages in a variety of foreign exchange transactions, including foreigncurrency exchange, overseas transfers and trade finance for export and import activities.
The following unit or divisions operate across the business units discussed above and in cooperation withour Group companies, including SMBC Nikko Securities.
• Investment Banking Unit. The Investment Banking Unit provides a broad range of sophisticatedfinancial products and services, as follows:
• Customized Financial Services and Financing Solutions. The Bank provides a wide range ofinnovative financial services and financing solutions to its corporate clients, including loan
23

syndication, structured finance, project finance, acquisition financing such as LBO and MBOfinancing, non-recourse real estate finance, securitization, derivatives and M&A advisory.
• Securities Intermediary Services for Corporate Clients. The Bank provides corporate clients withsecurities intermediary services, and offers structured bonds, subordinated bonds and otherproducts to corporate clients in cooperation with SMBC Nikko Securities.
• Corporate Bond Trust Services. The Bank serves as a trustee or co-trustee of corporate mortgagebonds. The Bank also serves as a commissioned company for bondholders and as a fiscal andpaying agent for unsecured bonds that are issued and publicly offered by domestic and foreigncustomers. In this role, the Bank also advises issuers about market conditions and providesadministrative services on behalf of issuers.
• Other Trust Services. The Bank offers other trust services to its customers, including monetaryclaims trusts for asset securitizations and trusts for structured finance.
• Principal Investments. The Bank, directly or through private equity funds, invests in corporatecustomers seeking to restructure or reorganize themselves or expand their businesses.
• Solutions Related to Growing Industrial Sectors. The Bank provides a wide range of solutions tocorporate customers addressing businesses related to growing industrial sectors, such asenvironmental, infrastructure, water, new energy, agriculture, health care, and robot industries.
• Corporate Advisory Division. The Corporate Advisory Division complements our service lineup forboth listed and non-listed companies, providing financial solutions for the increasingly sophisticatedand diverse management issues faced by corporate clients. This division provides a centralizedinformation platform that maintains the Bank’s accumulated information and knowledge concerning awide range of industries. Leveraging this centralized information platform, this division provides theBank’s customers with proposals for strategic initiatives to help enhance their corporate value. Thisdivision establishes a separate team for each project and works in cooperation with the Bank’s otherdepartments and our Group companies, including SMFL and SMBC Nikko Securities. This divisionaims to offer comprehensive solutions for M&A, strategic investment, business alliances and othermanagement issues.
• Private Advisory Division. The Private Advisory Division addresses areas where the needs ofindividuals and corporate clients overlap, including private banking, corporate employees business,business succession and asset succession consulting for business owners and high-net-worthindividuals.
• Transaction Business Division. The Transaction Business Division complements our transaction andfinancing services, including cash management, settlement, foreign exchange and supply chain financefor our corporate clients. This division aims to offer a variety of products and services to capturecustomers’ cash flows and business flows.
In addition to the Bank, our domestic banking subsidiaries include KUBC, The Minato Bank and SMBCTrust Bank Ltd. (“SMBC Trust Bank”). KUBC and The Minato Bank are regional financial institutions based inKansai area and provide commercial banking services to corporations and individuals. SMBC Trust Bank, whichbecame our wholly owned subsidiary in October 2013, offers extensive trust services tailored to the needs ofcustomers, such as wealth management solutions.
Our domestic banking associate is The Japan Net Bank, Limited (“The Japan Net Bank”), which, as aninternet bank, provides internet-based services such as deposits, loans and investment products. The Japan NetBank, which had been our subsidiary, became our associate in April 2014 due to a decrease in our proportion ofvoting rights.
24

Our foreign banking subsidiaries include SMBC Europe, SMBC (China), Manufacturers Bank, SumitomoMitsui Banking Corporation of Canada, Banco Sumitomo Mitsui Brasileiro S.A., JSC Sumitomo Mitsui RusBank, PT Bank Sumitomo Mitsui Indonesia and Sumitomo Mitsui Banking Corporation Malaysia Berhad.
Our foreign banking associates include PT Bank Tabungan Pensiunan Nasional Tbk, the Bank of East Asia,Limited, one of the largest commercial banks in Hong Kong, which became our associate in March 2015, andVietnam Export Import Commercial Joint Stock Bank.
Leasing
Sumitomo Mitsui Finance and Leasing Company, Limited
Sumitomo Mitsui Finance and Leasing Company, Limited (“SMFL”), one of the major leasing companies inJapan, provides a variety of leasing services including equipment lease, operating lease, leveraged lease andaircraft operating lease. In 2007, SMFL was formed as a result of the merger of SMBC Leasing and SumishoLease. We have a 60% equity interest in SMFL, while the remaining 40% is held by Sumitomo Corporation, anon-affiliate.
In June 2012, the Bank, SMFL and Sumitomo Corporation acquired the aircraft leasing business of TheRoyal Bank of Scotland Group plc, and commenced its operation as SMBC Aviation Capital. In March 2013, theintegration of the existing aircraft leasing businesses of SMFL and Sumitomo Corporation into SMBC AviationCapital was completed. We and Sumitomo Corporation intend to further expand and develop the aircraft leasingbusiness in Asia and other emerging markets.
Others
In addition to the above companies, our U.S. subsidiary SMBC Leasing and Finance, Inc. engages in theleasing business. Our associate Sumitomo Mitsui Auto Service Company, Limited engages in the auto leasingbusiness.
Securities
SMBC Nikko Securities Inc.
As one of the major Japanese securities companies, SMBC Nikko Securities Inc. (“SMBC NikkoSecurities”), our wholly owned subsidiary, offers a wide range of financial products and investment consultationand administrative services to its individual and corporate customers in Japan. For individual customers, SMBCNikko Securities provides consulting services to meet diversified asset management needs at 123 branchesnationwide at March 31, 2015, and a widely used online trading tool. For corporate customers, it also offerstrading capabilities and financial products, debt and equity underwriting, and M&A advisory services, mainly inJapan.
SMBC Nikko Securities, together with its overseas network, SMBC Nikko Securities (Hong Kong) Limited,SMBC Nikko Securities (Singapore) Pte. Ltd., SMBC Nikko Capital Markets Limited and SMBC NikkoSecurities America, Inc. (“SMBC Nikko Securities America”), seeks to provide financial services such asbrokerage services of Japanese stocks and M&A advisory services to clients on a global basis. To strengthen ourcross border M&A and other advisory services to Japanese companies, SMBC Nikko Securities, the Bank andMoelis & Company, a global investment bank headquartered in New York, established a business alliance inMarch 2011. In February 2012, we invested approximately $93 million in Moelis & Company to enhance theexisting business alliance.
25

SMBC Friend Securities Co., Ltd.
SMBC Friend Securities Co., Ltd. (“SMBC Friend Securities”), our wholly owned subsidiary, is a full-linesecurities company focusing on retail business. SMBC Friend Securities has a nationwide network that offersservices tailored to the needs of its clients and offers online financial consulting services.
Business Alliance with Citigroup Inc.
In May 2009, we entered into a strategic business alliance with Citigroup Inc. (“Citigroup”) centering on avariety of collaborative activities between SMBC Nikko Securities and Citigroup. As part of this alliance,Citigroup provides us with access to its global corporate and investment banking networks, including sales andtrading and M&A services. The long-standing relationship between Citigroup and the former Nikko CordialSecurities Inc. in the origination and distribution of financial products in Japan and globally is being upheld withSMBC Nikko Securities.
Consumer Finance
Sumitomo Mitsui Card Company, Limited
Sumitomo Mitsui Card Company, Limited (“Sumitomo Mitsui Card”) is a leading company in Japan’scredit card industry, having introduced the Visa brand into the Japanese market. Sumitomo Mitsui Card conductsa comprehensive credit card business with a strong brand, and offers a variety of settlement and finance servicesto meet diverse customer needs.
We, Sumitomo Mitsui Card, the Bank and NTT DoCoMo, Inc. (“NTT DoCoMo”) formed a strategicbusiness and capital alliance in credit payment service. We have a 66% equity interest in Sumitomo Mitsui Card,while the remaining 34% is held by NTT DoCoMo. Pursuant to the alliance, Sumitomo Mitsui Card offers acredit payment service using NTT DoCoMo’s mobile phones equipped with contactless IC chips.
In addition, Sumitomo Mitsui Card issues a variety of affiliated credit cards in cooperation with partnersincluding, but not limited to, railway companies, airline companies, department stores and retailers to satisfy boththese partners’ and cardholders’ needs. Sumitomo Mitsui Card also provides services for customers such astravelers and retailers both in Japan and China, in alliance from 2005, with China UnionPay Co., Ltd., a bankcardassociation in China.
Cedyna Financial Corporation
Cedyna Financial Corporation (“Cedyna”), our wholly owned subsidiary, conducts credit card, installment(such as shopping credit and automobile loan) and solution (such as collection outsourcing and factoring)businesses.
In March 2012, Cedyna made SMBC Finance Service Co., Ltd. (“SMBC Finance Service”) a wholly ownedsubsidiary. SMBC Finance Service, which had been a subsidiary of the Bank before the reorganization, providescollection outsourcing services and has a strong customer base and internet settlement know-how. In April 2014,Cedyna transferred its own collection outsourcing business to SMBC Finance Service in order to strengthen itscompetitive edge by taking advantage of scale and promoting streamlining.
SMBC Consumer Finance Co., Ltd.
SMBC Consumer Finance Co., Ltd. (“SMBC Consumer Finance”), which became our wholly ownedsubsidiary in April 2012 and changed its company name from Promise in July 2012, is a core entity in ourconsumer lending business. It provides consumer loans, together with its wholly owned subsidiary Mobit Co.,LTD., that consist mainly of unsecured loans to individuals, and conducts other business including loanguarantee business. SMBC Consumer Finance guarantees certain consumer loans made by the Bank.
26
ORIX Credit Corporation
In July 2009, the Bank acquired a 51% equity interest in ORIX Credit Corporation (“ORIX Credit”) as partof a collaborative initiative with ORIX, and ORIX Credit became a subsidiary of the Bank. ORIX Credit offereda wide range of card loan products, focusing on a card loan with a low interest rate and large credit line.However, in June 2012, the Bank transferred all of its shares of ORIX Credit to ORIX and, as a result, ORIXCredit is no longer our subsidiary.
Others
In addition to the above companies, our subsidiary Sakura Card Co., Ltd., which is scheduled to be mergedwith Cedyna by April 2016, and our associate Pocket Card Co., Ltd. engage in the credit card business, and oursubsidiary SMM Auto Finance, Inc. engages in automobile sale financing.
Other Major Group Companies and Alliances
The Japan Research Institute, Limited
The Japan Research Institute, Limited (“The Japan Research Institute”) is our wholly owned subsidiary thatprovides financial consultation services on management reform, IT, the planning and development of strategicinformation systems and outsourcing. It also conducts diverse activities including domestic and internationaleconomic research and analysis, policy recommendations and business incubation.
Alliance with Barclays PLC
Barclays PLC (“Barclays”) and the Bank have allied to explore joint business development opportunities,and in April 2010, Barclays, the Bank and SMBC Nikko Securities established a division in SMBC NikkoSecurities to provide wealth management services to high-net-worth individuals in Japan. In May 2010, the Bankentered into a business alliance agreement with Absa Bank Limited, a group company of Barclays, regardingcollaboration on services to Japanese companies in South Africa and other African countries. We have intensifiedour management-level communications with Barclays regarding, for example, the effects of strengthenedregulation of the global banking industry. The Bank believes these initiatives will yield mutual benefits and willfacilitate business expansion for us in targeted growth business areas, both foreign and domestic.
Credit Loss Protection Agreement with Goldman Sachs
To expand its overseas portfolio and revenue, the Bank entered into agreements with Goldman Sachs in2003 to provide credit protection to Goldman Sachs’ extension of credit to their investment grade clients inexchange for receiving a proportion of the fees and interest income from the borrowers. In connection with theagreements, Goldman Sachs established certain wholly owned subsidiaries (“William Street Entities”) that mightmake credit commitments and extensions. Goldman Sachs entered into credit loss protection arrangements withthe Bank in order to hedge in part the credit risk to its investment in the William Street Entities. The Bank,through its Cayman Islands branch, would issue letters of credit in exchange for fees equal to a portion of thefees and interest to be paid by the borrowers to the William Street Entities. The first letter of credit (“FLC”), wasissued in 2003 in a maximum available amount of $1 billion, and is available over a 20-year period, subject toearly termination or extension. Also, from time to time over a 20-year period, subject to early termination orextension and other conditions, upon the request of Goldman Sachs, the Bank has issued letters of credit and mayissue one or more additional letters of credit (each a second letter of credit (“SLC Series”) exposing the Bank torisk rated BBB/Baa2 or higher in an aggregate maximum available amount of $1.125 billion). Goldman Sachsmay draw on the letters of credit in the event that Goldman Sachs realizes certain losses (“Specified Losses”),with respect to loan commitments or loans extended thereunder that Goldman Sachs has entered into withspecified borrowers approved by the Bank and Goldman Sachs.
27

Under the FLC, Goldman Sachs is entitled to draw from time to time amounts equal to approximately95% of Specified Losses, up to an aggregate stated amount of $1 billion. Under the SLC Series, Goldman Sachsis entitled, subject to certain conditions, to draw from time to time amounts equal to approximately 70% ofSpecified Losses above specified loss thresholds, up to an aggregate stated amount of $1.125 billion. GoldmanSachs has made a small number of drawdowns under the FLC in accordance with its terms.
In connection with these credit arrangements, the Bank pays Goldman Sachs an administration fee based onthe aggregate amount of commitments covered by the FLC.
The credit loss protection arrangements contain a number of provisions that give the Bank some controlover the determination of borrowers to which it has potential exposure under the FLC and any SLC Series:
• Goldman Sachs may make credit commitments covered by the arrangements only to borrowersapproved by the Bank.
• Unless the Bank and Goldman Sachs agree otherwise, the borrowers covered by the FLC and any SLCSeries that are rated by both of the two major rating agencies must be rated investment grade by at leastone, and borrowers that are rated only by one of the two major rating agencies must be ratedinvestment grade by that rating agency. If neither of the two major rating agencies rates a borrower,then further credit to the borrower shall no longer be covered by the FLC or any SLC Series, if theBank and Goldman Sachs determine the borrower’s credit conditions are lower than investment grade.
• If the ratings of an approved borrower fall below investment grade in the judgment of both major ratingagencies (or, if a borrower is rated investment grade by only one agency, and that agency downgradesthe borrower below investment grade), further credit to that borrower will no longer be covered bythese arrangements, unless the Bank and Goldman Sachs otherwise agree.
• On the fifth, tenth and fifteenth anniversaries of the transaction, the Bank has the right to causeGoldman Sachs to stop extending new credit to borrowers the Bank deems to have become“unbankable.” Unbankable borrowers are those who have investment grade ratings from the two majorrating agencies but are deemed by the Bank to be below BB- and below Ba3 based on the Bank’sapplication of rating agency methodologies and criteria. If Goldman Sachs disagrees with the Bank, thematter is to be referred to arbitration, and a suspension is effective unless and until an arbitrator rules infavor of Goldman Sachs.
The Bank, through a separate bankruptcy-remote Cayman Islands subsidiary, has collateralized theobligations on the FLC and a portion of the SLC Series by buying $1.723 billion of Goldman Sachs demandnotes and pledging those demand notes to Goldman Sachs. If Goldman Sachs activates an SLC Series that is notcollateralized, the Bank through its Cayman Islands subsidiary will be required to purchase and pledge additionalGoldman Sachs demand notes with a principal amount equal to the stated amount of that SLC Series. Subject tocertain conditions, the Bank has the right to substitute as collateral high quality liquid securities for the GoldmanSachs demand notes.
These arrangements are designed to collateralize the Bank’s obligations in the event the Bank’s CaymanIslands branch fails to perform on the FLC or any SLC Series, including as a result of our insolvency or theinsolvency of the Bank or the Bank’s Cayman Islands branch.
If Goldman Sachs’ credit rating, as determined by either of the two major credit rating agencies, falls belowinvestment grade, Goldman Sachs is obligated to provide collateral to the Bank to support Goldman Sachs’obligations under the Goldman Sachs demand notes. After an initial 15-year period under the letters of credit, theBank and Goldman Sachs will negotiate in good faith to extend the terms of the letter of credit arrangements forone additional five-year term. Before the expiration of the initial 20-year term, in certain circumstances, the letterof credit arrangements with the Bank may be terminated by the Bank or Goldman Sachs, in which eventGoldman Sachs would be obligated to prepay any outstanding demand notes. In circumstances related primarily
28

to the creditworthiness of the Bank or a breach of its representations or covenants, Goldman Sachs may draw onthe letters of credit for early termination amounts of up to the remaining undrawn or available amount on theletters of credit. In connection with draws on the letters of credit of early termination amounts, Goldman Sachswould have to prepay any outstanding demand notes. Goldman Sachs also would be obligated to pay the Bank onthe originally scheduled expiration date of the letter of credit arrangements an amount equal to the earlytermination amounts minus the losses that would have been reimbursed under the letters of credit had they notterminated early.
Management Policies
In May 2011, we launched a medium-term management plan for the three years from the fiscal year endedMarch 31, 2012 to the fiscal year ended March 31, 2014, with the two management objectives as follows: “aimfor top quality in strategic business areas” and “establish a solid financial base and corporate infrastructure tomeet the challenges of financial regulations and the highly competitive environment.” The financial objectivesand targets were also set with the aim of improving and seeking a balance between financial soundness,profitability and growth.
Our basic policies for the fiscal year ended March 31, 2014, the last year of the medium-term managementplan were as follows: “proactively contribute to the revitalization of Japanese economy, and as a result achieveour growth” and “create new business models and challenge for ‘innovation’ in order to make the next leapforward.” We continued to proactively support the revitalization of Japanese economy through financing, andproceeded with the establishment of new business models to accommodate changes in the financial needs of ourclients and business environment in order to achieve medium- to long-term growth. We also achieved objectivesand financial targets that we set in the medium-term management plan.
In May 2014, we and the Bank announced our vision for the next decade and the new management goals forthe three-year medium-term management plan through March 2017.
Vision for the Next Decade
Our vision for the next decade, in view of the changing business environment, including the growth ofAsia’s emerging countries, the aging and shrinking Japanese population and global financial regulatory reform, isto become a global financial group that, by earning the highest trust of our customers, lead the growth of Japanand the Asian region. Specifically, we aim to achieve the following three points.
We aim to become a truly Asia-centric institution. Strengthening our business in Asia is the key strategy forrealizing our vision in view of the high medium- to long-term growth potential of Asia’s emergingcountries. We will proactively invest our resources in the region in order to become a leading financialgroup in Asia.
We aim to develop the best-in-class earnings base in Japan. Japan is a mature market but there areopportunities within the market segments and we aim to proactively contribute to the revitalization of theJapanese economy by investing our resources in such growth areas and taking appropriate risks. At the sametime, we intend to capture a high market share and build a solid earnings base by implementing specificstrategies for enhancing our capability to meet our clients’ needs.
We aim to realize true globalization and continue to evolve our business model. We intend to expand ourglobal franchise and implement measures to realize the true globalization of our corporate infrastructure thatsupports our growth. At the same time, we intend to continue to evolve our business model by anticipatingchanges in our business environment, both domestic and international.
29

Three-Year Management Goals
In the next three years, we aim to further evolve our client-centric business models, revise our portfoliostructure, and enhance our client base with speed in order to achieve the sustainable growth of our top-line profitand further increase our enterprise value. We also set the following four goals for our three-year medium-termmanagement plan as the first step toward realizing our vision.
Develop and evolve client-centric business models for main domestic and international businesses. Theneeds of our clients are becoming more diverse and sophisticated, and we are implementing a number ofinitiatives to meet their needs. We have revised our client segmentation and are implementing strategies andevolving business models accordingly, and allocating resources from the perspective of group optimization.
• Large corporate business strategy. The activities of our large corporate clients are becoming moreglobal, and cross-border, and accordingly, their financial needs are becoming bigger and morecomplex. We are creating a unique business model, Global-Corporate and Investment Banking(“G-CIB”) model, to meet their needs, thereby enhancing our client base and top-line profit.
• Middle market and small and medium-sized enterprise business strategy. In the middle and small andmedium-sized enterprise markets, where we have a number of strengths, we have revised the clientsegmentation and grouped clients based on attributes in order to fully meet the financial needs of eachindividual company. Further, under the newly launched Area system, we aim to comprehensivelyaddress needs of business owners both as corporate managers and as individuals, through one-stop-services.
• Consumer banking business strategy. The financial needs of individuals are changing, under thecircumstances of the accelerated shift from savings to investment, the arrival of the great era ofinheritance, and changing lifestyles. We intend to meet their needs by implementing strategies based ona new client segmentation on a Group-wide basis and achieve the top business base in Japan.
• Consumer finance and credit card business strategy. In the consumer finance business, we aim toexpand the variety of our client base and achieve an overwhelming share in the domestic marketthrough the integrated operation of the planning and promotion functions of SMBC and SMBCConsumer Finance. In the credit card business, we intend to reinforce our top-line profit by leveragingthe strengths of Sumitomo Mitsui Card and Cedyna as bank-based and retail-based credit cardcompanies, respectively. At the same time, we intend to pursue cost synergies by managing thebusiness on a group basis through measures such as integrating the management platforms of theGroup’s credit card companies.
• International business strategy. In our international business, we intend to shift our business model inorder to achieve sustainable growth by improving the efficiency of assets while depending less onlending volume. At the same time, we intend to enhance our global franchise. Specifically, we aim tostrengthen multi-faceted transactions with globally operating non-Japanese corporate clients. To thisend, we are enhancing our product line-up and promoting cross-selling by strengthening the transactionbanking business, and revising our client coverage to a more global-based framework. Further, we willcreate a highly profitable asset portfolio by diversifying and flexibly rebalancing our portfolio.
• Institutional investor business strategy. We intend to create a new business model to meet the needs ofinstitutional investors by establishing a Group-wide framework, centered on the Bank and SMBCNikko Securities, enhancing our ability to provide products to institutional investors and strengtheningour capability to source, underwrite and distribute deals domestically and internationally.
• IT and transaction banking business strategy. Information and communication technology (“ICT”) andtransaction banking business are necessary underpinnings for creating new businesses, and we intend tooffer new leading-edge services through various measures, including alliances with leading players inICT.
30

Build a platform for realizing Asia-centric operations and capture growth opportunities. We aim to becomea global financial group that, by earning the highest trust of our customers, leads the growth of Japan and theAsian region. This is our vision for the next decade and, to this end, we aim to steadily create a businessplatform in Asia, with the enhancement of our Asia business as the principal strategy for the whole group,and prioritize the allocation of resources, including human resources and infrastructure, to Asia.
Realize sustainable growth of top-line profit while maintaining soundness and profitability. Underpinned bythe stable financial base built during the previous years, we intend to focus more on growth in the newmedium-term management plan. We intend to achieve sustainable growth of our top-line profit bydeveloping and evolving our business models and allocating resources to growth fields while continuing tofocus on maintaining soundness and profitability.
Upgrade corporate infrastructure to support our next stage of growth. Our business is expanding globallyand on a Group-wide basis, and we intend to strengthen our management platform to support our businessgrowth. Specifically, we intend to globalize our organization and human resources and intensify groupmanagement. To this end, we recently established “Global Human Resources Department.” We alsorecently established “Diversity and Inclusion Committee” to promote diversity as we believe diversity is asource of competitiveness. We are also upgrading our risk management system.
Revenues by Region
The following table sets forth the percentage of our total operating income under IFRS for the fiscal yearsended March 31, 2015, 2014, and 2013, based on the total operating income of our offices in the indicatedregions. For each of the periods presented, we earned most of our total operating income in Japan, where wecompete with other major Japanese banking groups and financial service providers. We earned the remainder inthe Americas, Europe and Middle East, and Asia and Oceania, where we mainly compete with global financialinstitutions.
For the fiscal year ended March 31,
2015 2014 2013
Region:Japan . . . . . . . . . . . . . . . . . . . . . . . . . . . . . . . . . . . . . . . . . . . . . . . . . . . . . . . . . . . 76% 78% 82%Foreign:
Americas . . . . . . . . . . . . . . . . . . . . . . . . . . . . . . . . . . . . . . . . . . . . . . . . . . . 5% 6% 4%Europe and Middle East . . . . . . . . . . . . . . . . . . . . . . . . . . . . . . . . . . . . . . . . 11% 9% 7%Asia and Oceania (excluding Japan) . . . . . . . . . . . . . . . . . . . . . . . . . . . . . . 8% 7% 7%
Total . . . . . . . . . . . . . . . . . . . . . . . . . . . . . . . . . . . . . . . . . . . . . . . . . . . 100% 100% 100%
Seasonality
Our business is not materially affected by seasonality.
Sources and Availability of Raw Materials
We are not reliant on any particular source of raw materials.
Marketing Channels
See “—Description of Operations and Principal Activities” for a discussion of our marketing channels.
31

Regulations in Japan
Our businesses are subject to extensive regulation, including the effects of changes in the laws, regulations,policies, voluntary codes of practice and interpretations in Japan. On the other hand, deregulation of bankingactivities in Japan, and more generally of the Japanese financial system, has proceeded, which has made theJapanese banking industry highly competitive.
Supervisory and regulatory authorities
Pursuant to the Banking Act, the FSA has the authority in Japan to supervise banks, bank holding companiesand banks’ principal shareholders, meaning bank shareholders having 20% (or 15% in some cases) or more of thevoting rights of a bank. The Bank of Japan (“BOJ”) also has supervisory authority over banks in Japan basedprimarily on its contractual agreements and transactions with Japanese banks. Only companies licensed by thePrime Minister are defined as banks under the Banking Act, and licenses may be granted only to a kabushikikaisha, a joint stock corporation, with paid-up capital of ¥2 billion or more.
The Financial Services Agency of Japan
The Prime Minister has supervisory authority over banks in Japan, which is generally delegated to theFinancial Services Agency of Japan (“FSA”) except for matters prescribed by cabinet order. The Minister forFinancial Services has the power to direct the FSA. Under the Banking Act, the FSA has supervisory control overbanks, bank holding companies and banks’ principal shareholders in Japan, except for matters to which the PrimeMinister retains authority.
The FSA’s authority includes granting and revoking of operating licenses, and approving business activitiessuch as becoming a principal shareholder, establishment of subsidiaries or overseas offices, mergers, corporatesplits or business transfers, and dissolutions or discontinuations of business by existing banks, etc.
The FSA may also instruct a Japanese bank to suspend its business or to remove directors if the bankviolates laws, other regulations or their articles of incorporation or commits acts contrary to public policy. TheFSA may also direct a Japanese bank in financial difficulty to take certain actions, such as holding certainproperty in Japan for the protection of depositors. Under the prompt corrective action (“PCA”) system, the FSAmay take corrective actions in the case of capital deterioration of financial institutions.
The Ministry of Finance and the FSA have introduced a number of regulatory measures into the bankingsector in Japan to secure sound management of banks, as well as measures to increase the transparency of theregulatory process, such as bank holding company regulations, single customer credit limits, disclosureregulations, regulations regarding reserves for loan losses and inspections.
The Banking Act authorizes the FSA to inspect banks and bank holding companies in Japan at any time andwith any frequency. Such inspections are conducted by officials from the FSA’s Inspection Department. TheFSA monitors the financial soundness of banks and the status and performance of their control systems andreviews their compliance with laws and regulations. The FSA has issued guidelines on its inspection of financialinstitutions called the Financial Inspection Manual. The Financial Inspection Manual itself does not have theforce of law, but the FSA’s inspections of banks are based on the Financial Inspection Manual, which emphasizesthe need for bank self-assessment rather than assessment based on the advice of the government authority andrisk management by each bank instead of a mere assessment of its assets. Following an inspection, the FSA mayexercise its authority over a bank under the Banking Act to suspend or terminate its banking business.
The Ministry of Finance
The Ministry of Finance conducts examinations of banks in relation to foreign exchange transactions underthe Foreign Exchange and Foreign Trade Act.
32

The Bank of Japan
The Bank of Japan (“BOJ”) is the central bank of Japan and serves as the principal instrument for theexecution of Japan’s monetary policy. The BOJ implements monetary policy mainly by adjusting its basic loanrate, open market operations and imposing deposit reserve requirements. All banks in Japan maintain depositswith the BOJ and rely substantially upon obtaining borrowings from and rediscounting bills with the BOJ.Moreover, most banks in Japan maintain current accounts under agreements with the BOJ pursuant to which theBOJ can conclude a contract with the Bank concerning on-site examinations. BOJ supervision is intended tosupport the effective execution of monetary policy, while FSA supervision aims to maintain the sound operationsof banks in Japan and promote the security of depositors. Through its examinations, the BOJ seeks to identifyproblems at an early stage and give corrective guidance where necessary.
Regulations Regarding Capital Adequacy and Liquidity
Capital Adequacy Requirement
In 1988, the BCBS issued the Basel Capital Accord. The Basel Capital Accord sets minimum risk-weightedcapital ratios for the purpose of maintaining sound management of banks which have international operations.The minimum risk-weighted capital ratio required was 8% on both a consolidated and nonconsolidated basis. In2004, the BCBS issued the amended Basel Capital Accord (“Basel II”), which includes detailed measurement ofcredit risk, the addition of operational risk, a supervisory review process and market discipline throughdisclosure. These amendments did not change the minimum risk-weighted capital ratio of 8% applicable to bankswith international operations (including the Bank). These rules took effect in Japan in 2007, and since 2008,banks are able to apply the advanced IRB approach for credit risk and the AMA for operational risk.
In July 2009, the BCBS approved a final package of measures to enhance certain elements of the Basel IIframework, which includes an increase of the risk weights of resecuritization instruments and revisions of certaintrading book rules (referred to as “Basel 2.5”), and the FSA’s capital adequacy guidelines which reflect suchframework have been applied in Japan from December 2011.
In September 2009, the Group of Central Bank Governors and Heads of Supervision reached an agreementon several key measures to strengthen regulation of the banking sector, and in December 2009 the BCBSpublished a consultative document entitled “Strengthening the resilience of the banking sector” containingproposals on these measures centering on several core areas. The BCBS’ proposals focused on raising thequality, consistency and transparency of the regulatory capital base through measures including a requirementthat the predominant form of Tier 1 capital must be common shares and retained earnings; limitations on the useof hybrid instruments with an incentive to redeem; a requirement that regulatory adjustments, includingdeductions of the amount of net deferred tax assets which rely on the future profitability of a bank, be applied tocommon equity generally; and a requirement for additional disclosure regarding regulatory capital levels.
The BCBS’ proposals also cover the following key areas:
• strengthening the risk coverage of the capital framework;
• introducing a leverage ratio as a supplementary measure to the Basel II risk-based framework with aview to migrating to a Pillar 1 (minimum capital requirement) treatment based on appropriate reviewand calibration (for further information, see “Leverage Ratio” below);
• introducing measures to promote the build-up of capital buffers in good times that can be drawn uponin periods of stress; and
• introducing minimum liquidity standards for internationally active banks that include a 30-day liquiditycoverage ratio requirement underpinned by a longer-term structural liquidity ratio (for furtherinformation, see “Liquidity Requirement” below).
33

In July 2010, the Group of Central Bank Governors and Heads of Supervision reached a broad agreement onthe overall design of the BCBS’ capital and liquidity reform package. In addition, in August 2010, the BCBSissued for consultation a proposal to enhance the loss absorbency function of regulatory capital. In September2010, the Group of Central Bank Governors and Heads of Supervision announced a substantial strengthening ofexisting capital requirements. The framework of the proposed reform was endorsed by the G-20 leaders at theirSeoul summit in November 2010. These capital reforms increased the minimum common equity requirementfrom 2% to 4.5% and will require banks to hold a capital conservation buffer of 2.5% to withstand future periodsof stress, bringing the total common equity requirement to 7%. The Tier 1 capital requirement also increasedfrom 4% to 6% (increasing to 8.5% when included together with the above capital conservation buffer). The totalcapital requirement remains at 8% but will increase to 10.5% with the capital conservation buffer. In addition, acountercyclical buffer within a range of 0% to 2.5% of common equity or other fully loss-absorbing capital willbe implemented according to national circumstances. The Group of Central Bank Governors and Heads ofSupervision also agreed on transitional arrangements for implementing the new standards. Under the transitionalarrangements, these new capital requirements are being phased in between January 1, 2013 and January 1, 2019.In December 2010, the BCBS published the new Basel III rules text. To reflect changes made by the BCBS, theFSA changed its capital adequacy guidelines. The FSA’s changes have mostly been applied from March 31,2013, which generally reflects the main measures of the minimum capital requirements of the BCBS that startedto be phased in on January 1, 2013 and will be fully applied from March 2019.
In September 2013, the BCBS and the International Organization of Securities Commissions (“IOSCO”)released the final framework for margin requirements for non-centrally cleared derivatives (“2013 framework”).This framework will require high quality liquid assets to be posted as margin on non-centrally cleared derivativetransactions, which could adversely affect our liquidity position. The requirements were originally planned to bephased in over a four-year period beginning in December 2015 with the largest, most active and mostsystemically important participants in the derivatives market, including us. In March 2015, the BCBS andIOSCO released revisions to the 2013 framework, which delay the beginning of the phase-in period for collectingand posting initial margin on non-centrally cleared trades from December 2015 to September 2016. The fullphase-in schedule has been adjusted to reflect this nine-month delay. The revisions also institute a six-monthphase-in period of the requirement to exchange variation margin, beginning in September 2016.
In addition to the above-mentioned minimum capital requirements and capital buffer requirements underBasel III, organizations identified by the FSB as G-SIFIs, which as of November 2014 included us, will berequired to maintain an additional 1% to 2.5% of common equity as a percentage of risk-weighted assets basedon the organization’s size, interconnectedness, substitutability, complexity and cross-jurisdictional activity asdetermined by the FSB. This requirement is commonly referred to as the G-SIFI capital surcharge, and theamount of G-SIFI capital surcharge that would have applied to us based on the FSB’s determination as ofNovember 2014 was 1% of risk-weighted assets. The G-SIFI capital surcharge requirement will be phased infrom January 2016 to January 2019. The FSB updates its list of G-SIFIs on an annual basis.
In November 2014, the FSB issued policy proposals consisting of a set of principles and a detailed termsheet on the adequacy of loss-absorbing and recapitalization capacity for G-SIFIs for public consultation. Theproposals have been developed by the FSB in consultation with the BCBS and will, once finalized, form a newminimum standard of total loss-absorbing capacity (“TLAC”). The FSB proposes to ensure the availability ofadequate loss-absorbing capacity for G-SIFIs in resolution by setting a new minimum requirement for TLAC.G-SIFIs will be required to meet this new standard by as early as January 2019. The proposals are scheduled tobe finalized by the time of the next G-20 leaders’ summit in 2015.
Furthermore, as a disincentive for G-SIFIs facing the maximum G-SIFI capital surcharge to “increasematerially their global systemic importance in the future,” an additional 1% capital surcharge could be applied.So long as we are identified as a G-SIFI, we are also subject to stronger supervisory mandates and highersupervisory expectations for risk management functions, data aggregation capabilities, risk governance and
34

internal controls. The substance of this heightened supervision has not yet been fixed, but we anticipate that at aminimum any rules will contain more stringent reporting requirements and impose common frameworks for dataaggregation and internal risk management processes on G-SIFIs.
Because we have been identified as a G-SIFI, we are also subject to, among other things, resolution-relatedrequirements described in the FSB’s “Key Attributes of Effective Resolution Regimes for Financial Institutions.”In particular, the FSB has required the initial group of G-SIFIs to have in place a recovery and resolution plan,including a group-level plan, containing various specified elements, to be subject to regular resolvabilityassessments. Under the Comprehensive Guidelines for Supervision of Financial Instruments Business Operators,etc., issued by the FSA, as part of crisis management, financial institutions identified as G-SIFIs must prepareand submit a recovery plan, which includes a description of events that would trigger implementation of therecovery plan and the analysis of the recovery options to the FSA, and the FSA must prepare the resolution planfor each G-SIFI.
In December 2014, the BCBS published a consultative document on the design of a capital floor frameworkwhich will replace the current transitional floor based on the Basel I standard with a capital floor based on theBasel II/III standard. The proposed framework will be based on the finalized version of the standardizedapproach, which is also being revised. The BCBS intends to publish the final standards of the capital floorframework around the end of 2015.
In June 2015, the BCBS also issued a consultative document on the risk management, capital treatment andsupervision of interest rate risk in the banking book (“IRRBB”). Such document presents two options for thecapital treatment of IRRBB: (i) a Pillar 1 (minimum capital requirement) approach and (ii) an enhanced Pillar 2approach.
Our securities subsidiaries in Japan are also subject to capital adequacy requirements under the FIEA. Underthe requirements, securities firms must maintain a minimum capital adequacy ratio of 120% on anonconsolidated basis and must file periodic reports with the Commissioner of the FSA or the Director-Generalof the appropriate Local Finance Bureau, and also publicly disclose their capital adequacy ratio on a quarterlybasis. Failure to meet the capital adequacy requirements will trigger mandatory regulatory action. For example, asecurities firm with a capital adequacy ratio of greater than 120%, but less than 140% will be required to filedaily reports with the Commissioner of the FSA or the Director-General of the appropriate Local FinanceBureau. A securities firm with a capital adequacy ratio of less than 120% may be ordered to change its businessconduct, place its property in trust or be subject to other supervisory orders, as the relevant authorities deemappropriate. A securities firm with a capital adequacy ratio of less than 100% may be subject to temporarysuspension of all or part of its business operations or cancellation of its license to act as a securities broker anddealer.
The capital adequacy ratio for securities firms is defined as the ratio of adjusted capital to a quantified totalof business risks, which include market risks, counterparty risks and operational risks (e.g., risks in carrying outdaily business activities, such as administrative problems with securities transactions and clerical mistakes)quantified in the manner specified by a rule promulgated under the FIEA. Adjusted capital is defined as net worthless illiquid assets, as determined in accordance with Japanese GAAP. Net worth consists mainly of statedcapital, additional paid-in capital, retained earnings, reserves for securities transactions, certain allowances fordoubtful current accounts, net unrealized gains (losses) in the market value of investment securities, andsubordinated debt. Illiquid assets generally include non-current market assets, certain deposits and advances, andprepaid expenses.
In May 2010, the FIEA was amended, introducing a minimum capital adequacy requirement on aconsolidated basis applicable to securities firms whose total assets exceed ¥1,000 billion. These amendmentsbecame effective from April 2011.
35
Leverage Ratio
In March 2015, the FSA published its leverage ratio guidelines which have been applied from March 31,2015 to help ensure broad and adequate capture of both on- and off-balance sheet sources of leverage forinternationally active banks. The FSA’s leverage ratio guidelines are based on the text of the leverage ratioframework and disclosure requirements issued by the BCBS in January 2014. Any final adjustments to thedefinition and calibration of the leverage ratio will be made by the BCBS by 2017, with a view to migrate to aPillar 1 treatment on January 1, 2018, based on appropriate review and calibration.
Liquidity Requirement
In October 2014, the FSA published its guidelines for liquidity coverage ratio (“LCR”) applicable to bankswith international operations that have been applied from March 31, 2015. These guidelines are based on the fulltext of the LCR standard issued by the BCBS in January 2013. LCR is intended to promote resilience to potentialliquidity disruptions over a thirty-day horizon and help ensure that global banks have sufficient, unencumbered,high-quality liquid assets to offset the net cash outflows they could encounter under an acute short-term stressscenario. Under the FSA’s LCR guidelines, banks with international operations must maintain LCR of 100% onboth a consolidated basis and a nonconsolidated basis, while the minimum LCR requirements are being phased inbetween March 31, 2015 and March 31, 2019 with an increase of 10% in each year starting from 60%.
In October 2014, the BCBS issued the final standard for the net stable funding ratio (“NSFR”), whichrequires a minimum amount of stable sources of funding at a bank relative to the liquidity profiles of the bank’sassets, as well as the potential for contingent liquidity needs arising from off-balance sheet commitments, over aone-year horizon. NSFR is scheduled to be introduced as a minimum standard by January 1, 2018.
Self-Assessment, Reserves and Related Disclosure
Financial institutions, including the Bank, are required to establish self-assessment programs to, amongother things, analyze their assets giving due consideration to accounting principles and other applicable rules andto classify their assets into categories taking into account the likelihood of repayment and the risk of impairmentto the value of the assets. These classifications determine whether an addition to or reduction in reserves orwrite-offs is necessary.
Pursuant to the Japanese Institute of Certified Public Accountants (“JICPA”) guidelines, the outcome ofeach financial institution’s self-assessment leads to substantially all of a bank’s loans and other claims oncustomers being analyzed by classifying obligors into five categories: (1) normal borrowers; (2) borrowersrequiring caution; (3) potentially bankrupt borrowers; (4) effectively bankrupt borrowers; and (5) bankruptborrowers. The reserve for possible loan losses is then calculated based on the obligor categories.
FSA guidelines require banks to classify their assets not only by the five categories of obligor but also byfour categories of quality. The Bank has adopted its own internal guidelines for self-assessment which conformto guidelines currently in effect and comply with the PCA system requirements.
Based on the results of the self-assessment discussed above, the Bank is required to establish a reserve forits loan portfolio in an amount the Bank considers adequate at a balance sheet date. Three categories of reservesthe Bank establishes, for statutory purposes, along with the Accounting Standards for Banks issued by theJapanese Bankers Association, are a general reserve, a specific reserve and a reserve for specific overseas loanlosses.
Under the Banking Act, banks and bank holding companies must disclose their non- and under-performingloans (consolidated and nonconsolidated) as risk-monitored loans. Risk-monitored loans are classified into fourcategories: (1) bankrupt loans, (2) non-accrual loans, (3) past due loans (three months or more) and(4) restructured loans. Banks and bank holding companies are required to submit to the FSA annual reports on
36
their business including the amount of risk-monitored loans. Banks and bank holding companies must disclosetheir financial statements on an annual basis. The financial statements consist of the balance sheet and incomestatement, and explanatory documents regarding business and asset conditions, each prepared under the BankingAct both on a nonconsolidated and consolidated basis.
Independent of the Banking Act disclosure regulations, the Act Concerning Emergency Measures for theRevitalization of Financial Functions requires banks to disclose their loans and their other problem assets. Underthis law, assets are classified into four categories: (1) bankrupt and quasi-bankrupt assets, (2) doubtful assets,(3) substandard assets and (4) normal assets. Generally, bankrupt and quasi-bankrupt assets correspond to thetotal of bankrupt loans and the lower tier of the non-accrual loans (the borrowers of which are effectivelybankrupt) under the Banking Act disclosure. Doubtful assets generally correspond to the higher tier portion of thenon-accrual loans (the borrowers of which are not, but have the potential to become, bankrupt). The substandardassets generally correspond to the total of the restructured loans and past due loans (three months or more).Bankrupt and quasi-bankrupt assets and doubtful assets also include non-loan assets, for example, securitieslending, foreign exchange, accrued interest, advanced payments and customers’ liabilities for acceptances andguarantees.
Prompt Corrective Action System
Under the Prompt Corrective Action (“PCA”) system, the FSA may take corrective actions depending uponthe extent of capital deterioration of a financial institution. The FSA may require a bank to submit and implementa capital reform plan, if;
• the total risk-weighted capital ratio of a bank with international operations becomes less than 8% butnot less than 4%;
• the Common Equity Tier 1 risk-weighted capital ratio becomes less than 4.5% but not less than 2.25%;or
• the Tier 1 risk-weighted capital ratio becomes less than 6% but not less than 3%.
The FSA may order a bank to (1) submit and implement a plan for improving its capital; (2) prohibit orrestrict the payment of dividends to shareholders or bonuses to officers; (3) reduce assets or restrict any increasein assets; (4) prohibit or restrict the acceptance of deposits under terms less advantageous than ordinary terms;(5) reduce the business of some offices; (6) eliminate some offices other than the head office; (7) reduce orprevent the launching of non-banking businesses; or (8) take certain other actions, if;
• the total risk-weighted capital ratio of a bank with international operations declines to less than 4% butnot less than 2%;
• the Common Equity Tier 1 risk-weighted capital ratio becomes less than 2.25% but not less than1.13%; or
• the Tier 1 risk-weighted capital ratio becomes less than 3% but not less than 1.5%.
The FSA may order a bank to conduct any one of the following: (1) a capital increase; (2) a substantialreduction in its business; (3) a merger; or (4) abolishment of its banking business, if;
• the total risk-weighted capital ratio of a bank with international operations declines to less than 2% butnot less than 0%;
• the Common Equity Tier 1 risk-weighted capital ratio becomes less than 1.13% but not less than 0%;or
• the Tier 1 risk-weighted capital ratio becomes less than 1.5% but not less than 0%.
37
The FSA may order the bank to suspend all or part of its business, if the total risk-weighted capital ratio, theCommon Equity Tier 1 risk-weighted capital ratio or Tier 1 risk-weighted capital ratio of a bank withinternational operations declines below 0%.
The FSA may take actions similar to the actions the FSA may take with respect to a bank, if;
• the total risk-weighted capital ratio of a bank holding company that holds a bank with internationaloperations declines to levels below 8%;
• the Common Equity Tier 1 risk-weighted capital ratio declines to levels below 4.5%; or
• the Tier 1 risk-weighted capital ratio declines to levels below 6%.
Prompt Warning System
The prompt warning system currently in effect allows the FSA to take precautionary measures to maintainand promote the sound operation of financial institutions before those financial institutions become subject to thePCA system. These measures include requiring a financial institution to reform: (1) profitability, if deemednecessary to improve profitability based upon a fundamental profit index; (2) credit risk management, if deemednecessary to reform management of credit risk based upon the degree of large credit concentration and othercircumstances; (3) stability, if deemed necessary to reform management of market and other risks based upon, inparticular, the effect of securities price fluctuations; and (4) cash flow management, if deemed necessary toreform management of liquidity risks based upon deposit trends and level of reserve for liquidity.
Regulations for Stabilizing the Financial System
Deposit Insurance System
The Deposit Insurance Act was enacted to protect depositors when deposit-taking institutions fail to meettheir obligations. The Deposit Insurance Corporation of Japan (“DIC”) implements the law and is supervised bythe Prime Minister and the Minister of Finance. Subject to limited exceptions, the Prime Minister’s authority isdelegated to the FSA Commissioner.
From April 2011 to March 2014, the DIC received annual insurance premiums from member deposit-takingfinancial institutions, amounting to 0.107% of deposits that bear no interest, are redeemable upon demand andare used by depositors primarily for payment and settlement purposes, and 0.082% of other deposits. From April2014, they amounted to 0.108% and 0.081%, respectively. For the fiscal years ended March 31, 2013 through2015, a certain amount was reimbursed to the member institutions each fiscal year because there were no failuresof insured deposit-taking financial institutions. From April 2015, annual insurance premiums amounted to0.054% of deposits primarily for payment and settlement purposes and 0.041% of deposits for other deposits.
Premiums held by the DIC may be either deposited at deposit-taking institutions or used to purchasemarketable securities. The insurance money may be paid out to depositors in case of a suspension of repaymentsof deposits, banking license revocation, dissolution or bankruptcy of a bank. Payouts are generally limited to amaximum of ¥10 million of principal amount together with any interest accrued with respect to each depositor.Only non-interest-bearing deposits that are redeemable upon demand and used by depositors primarily forpayment and settlement functions are protected in full.
City banks (including the Bank), regional banks (including member banks of the second association ofregional banks), trust banks, credit associations, credit cooperatives, labor banks and Japan Post Bank participatein the deposit insurance system on a compulsory basis.
The Deposit Insurance Act also provides a permanent system for resolving failed deposit-taking institutions.
38

The basic method for resolving a failed deposit-taking institution under the Deposit Insurance Act iscessation of the business by paying insurance money to depositors up to the principal amount of ¥10 million plusaccrued interest per depositor, or pay-off or transfer of the business to another deposit-taking institution, withfinancial assistance provided within the cost of pay-off. Under the Deposit Insurance Act, transfer of business isregarded as the primary method. In order to affect a prompt transfer of business, the following framework hasbeen established:
• a Financial Reorganization Administrator is appointed by the FSA Commissioner and takes control ofthe management and assets of the failed deposit-taking institution. The administrator is expected todiligently search for a deposit-taking institution which will succeed to the business of the failedinstitution;
• if no successor deposit-taking institution can be immediately found, a “bridge bank” will be establishedby the DIC for the purpose of temporarily maintaining the operations of the failed deposit-takinginstitution, and the bridge bank will seek to transfer the failed deposit-taking institution’s assets toanother deposit-taking institution or dissolve the failed deposit-taking institution; and
• in order to facilitate or encourage a deposit-taking institution to succeed to a failed business, financialaid may be provided by the DIC to any successor deposit-taking institution to enhance its capital aftersuccession or to indemnify it for losses incurred as a result of the succession.
Where it is anticipated that the failure of a deposit-taking institution may cause an extremely grave problemin maintaining the financial order in Japan or the region where the deposit-taking institution is operating, thefollowing exceptional measures may be taken following deliberation by Japan’s Financial Crisis ResponseCouncil:
• the DIC may subscribe for shares or other instruments issued by the relevant deposit-taking institutionor the holding company thereof and require the institution to submit to the DIC a plan to reestablishsound management (Item 1 measures) (dai ichigo sochi);
• once the deposit-taking institution fails, financial aid exceeding the cost of pay-off may be available tothe institution (Item 2 measures) (dai nigo sochi); and
• if the failed institution is a bank and the problem cannot be avoided by other measures, then the DICmay acquire all of the shares of the bank (Item 3 measures) (dai sango sochi).
In order to fund the above-mentioned activities, the DIC may borrow from financial institutions or issuebonds which may be guaranteed by the Government of Japan.
In addition, on June 12, 2013, a bill to amend the Deposit Insurance Act which includes establishment of anew orderly resolution regime of financial institutions was enacted and became effective on March 6, 2014.Financial institutions including banks, securities companies and insurance companies and their holdingcompanies will be subject to the new resolution regime that includes, among others, the following features.
Under the new resolution regime, where the Prime Minister recognizes that the failure of a financialinstitution which falls into either of (a) or (b) below may cause significant disruption in the financial markets orother financial systems in Japan if measures described in (a) (specified Item 1 measures) (tokutei dai ichigosochi) or measures described in (b) (specified Item 2 measures) (tokutei dai nigo sochi) are not taken, the PrimeMinister may confirm that any of the following measures need to be applied to the financial institution followingdeliberation by Japan’s Financial Crisis Response Council:
(a) if the financial institution is not a financial institution whose liabilities exceed its assets, which means itis unable to fully perform its obligations with its assets, the DIC shall supervise the operation of business andmanagement and disposal of assets of that financial institution, and may provide it with loans or guarantees
39

necessary to avoid the risk of significant disruption in the financial systems in Japan, or subscribe for shares orsubordinated bonds of, or lend subordinated loans to, the financial institution, taking into consideration thefinancial condition of the financial institution;
(b) if the financial institution is a financial institution whose liabilities exceed or are likely to exceed itsassets or which has suspended or is likely to suspend payment of its obligations, the DIC shall supervise theoperation of business and management and disposal of assets of that financial institution and may providefinancial aid necessary to assist a merger, business transfer, corporate split or other reorganization in respect tosuch failed financial institution; and
if a measure set out in (b) above is determined to be taken with respect to a financial institution, the PrimeMinister may order that the financial institution’s operations of business and management and disposal of assetsbe placed under the control of the DIC. The business or liabilities of the financial institution subject to thesupervision by the DIC as set forth above may also be transferred to a “bridge bank” established by the DIC forthe purpose of the temporary maintenance and continuation of operations of, or repayment of the liabilities of,such financial institution, and the bridge bank will seek to transfer the financial institution’s business or liabilitiesto another financial institution or dissolve the financial institution. The financial aid provided by the DIC to assista merger, business transfer, corporate split or other reorganization in respect to the financial institution set out in(b) above may take the form of a monetary grant, loan or deposit of funds, purchase of assets, guarantee orassumption of debts, subscription of preferred stock or subordinated bonds, subordinated loan, or loss sharing.
The expenses for implementation of the measures for these crisis management operations will be borne bythe financial industry; provided, however, the Government of Japan may provide subsidies to the DIC within thelimit to be specified in the government budget in cases where it is likely to cause extremely serious hindrance tothe maintenance of the credit system in Japan or significant turmoil in the financial market or other financialsystem of Japan if such expenses are to be borne only by the financial industry.
On March 6, 2014, the FSA made an announcement clarifying the requirement of loss absorbency at thepoint of non-viability for additional Tier 1 instruments and Tier 2 instruments under Basel III issued by banksand bank holding companies. According to the announcement, (i) additional Tier 1 instruments and Tier 2instruments under Basel III issued by a bank must be written-down or converted into common shares when thePrime Minister of Japan confirms (nintei) that the above-described “Item 2 measures (dai nigo sochi),” “Item 3measures (dai sango sochi),” or “specified Item 2 measures (tokutei dai nigo sochi)” need to be applied to thebank and (ii) additional Tier 1 instruments and Tier 2 instruments under Basel III issued by a bank holdingcompany must be written-down or converted into common shares when the Prime Minister of Japan confirms(nintei) that the above-described “specified Item 2 measures (tokutei dai nigo sochi)” need to be applied to thebank holding company. The FSA also stated in the announcement that the trigger event for loss absorbency at thepoint of non-viability with respect to such instruments should be construed in accordance with the then effectivefinancial crisis response framework for banks and bank holding companies that have failed or are likely to fail,since the purpose of such write-down or conversion required under Basel III is to ensure that all classes of thesecapital instruments fully absorb losses at the point of non-viability before taxpayers are exposed to loss.
Special Measures Act Concerning Facilitation of Reorganization by Financial Institutions, Etc.
Under the Special Measures Act Concerning Facilitation of Reorganization by Financial Institutions, Etc.:(1) for one year after the merger or transfer of the entire business of a deposit-taking institution, the maximumamount to be covered by the deposit insurance will be ¥10 million multiplied by the number of parties to themerger or business transfer; and (2) the procedures are simplified to a certain extent in connection with thetransfer of an entire business or a merger with another deposit-taking institution by a deposit-taking institutionthat is made in accordance with a management base-strengthening plan that has been approved by theGovernment of Japan.
40

Single Customer Credit Limit
The Banking Act restricts the aggregate amount of credit and loans that may be extended to any singlecustomer in order to avoid the excessive concentration of credit risks and promote the fair and extensive use ofbank credit. To tighten the restrictions under Japanese law to meet international standards, the Banking Act andthe related cabinet order were amended in June 2013 and October 2014, respectively and those amendmentsbecame effective in December 2014. As a result of the amendments, the credit limit of bank holding companies,banks or bank groups for any single customer, including certain of the customer’s affiliates, was lowered from40% to 25% of the total qualifying capital of the bank holding company, bank or bank group, with certainadjustments.
Restrictions on Activities of a Bank Holding Company
Under the Banking Act, a bank holding company is prohibited from carrying on any business other thanmanagement of its subsidiaries and other incidental businesses. A bank holding company may have any of thefollowing as a subsidiary: a bank, a securities company, an insurance company or a foreign subsidiary thatengages in the banking, securities or insurance business. In addition, a bank holding company may have as asubsidiary any company that engages in finance-related business, such as a credit card company, a leasingcompany or an investment advisory company. Certain companies that are designated by ministerial ordinance asthose that cultivate new business fields may also become the subsidiary of a bank holding company.
Restriction on Aggregate Shareholdings by a Bank
The Act Concerning Restriction on Shareholdings by Banks requires Japanese banks and their qualifiedsubsidiaries to limit the aggregate market value (excluding unrealized gains, if any) of their equity securitiesholdings to an amount equal to 100% of their consolidated Tier 1 capital, with adjustments, in order to reduceexposure to stock price fluctuations. Treasury shares, shares issued by subsidiaries, shares not listed on any stockexchange or not registered with any OTC market, shares held as trust assets, and shares acquired through debt-for-equity swaps in restructuring transactions are excluded from this limitation. In order to facilitate thedisposition of shares of listed stocks held by banks while preventing adverse effects caused by sales of largeamounts of shares in a short period of time, share purchases by the Banks’ Shareholdings Purchase Corporationof listed shares have been restarted from March 2009.
Shareholding Restrictions Applicable to a Bank Holding Company and a Bank
The provision of the Act on Prohibition of Private Monopolization and Maintenance of Fair Trade whichprohibits banks from holding more than 5% of the voting rights of non-financial companies in Japan does notapply to bank holding companies. However, the Banking Act generally prohibits a bank holding company and itssubsidiaries, on an aggregated basis, from holding more than 15% of the voting rights of certain types ofcompanies which are not permitted to become subsidiaries of bank holding companies. Also, the Banking Actgenerally prohibits a bank and its subsidiaries, on an aggregated basis, from holding more than 5% of the votingrights of certain types of companies which are not permitted to become subsidiaries of banks.
Examination and Reporting Applicable to Shareholders of a Bank
The FSA may request the submission of reports or other materials from a bank and/or its bank holdingcompany, or inspect the bank and/or the bank holding company, if necessary, in order to secure the sound andappropriate operation of the business of a bank.
Under the Banking Act, a person who desires to hold 20% (in some exceptional cases, 15%) or more of thevoting rights of a bank is required to obtain advance approval of the FSA Commissioner. In addition, the FSAmay request the submission of reports or materials from, or may conduct an inspection of, any principalshareholder who holds 20% (in some exceptional cases, 15%) or more of the voting rights of a bank if the FSA
41

deems the action necessary in order to secure the sound and appropriate operation of the business of the bank.Under limited circumstances, the FSA may order the principal shareholder to take such measures as the FSAdeems necessary.
Furthermore, any person who becomes a holder of more than 5% of the voting rights of a bank holdingcompany or a bank must report the ownership of the voting rights to the Director General of the relevant localfinance bureau within five business days. This requirement is separate from the significant shareholdings reportrequired under the FIEA. In addition, a similar report must be made in respect of any subsequent change of 1% ormore in any previously reported holding or in respect of any change in material matters set out in reportspreviously filed, with some exceptions.
Regulations for Protection of Customers
Protection of Personal Information
The Act on the Protection of Personal Information and related rules, regulations and guidelines imposerequirements on businesses that use databases containing personal information, including appropriate custody ofpersonal information and restrictions on information sharing with third parties.
Act on Sales, Etc. of Financial Products
Due to deregulatory measures in the banking and other financial services industries, more financialproducts, including highly structured and other complicated products, may now be marketed to a broad base ofcustomers. The Act on Sales, Etc. of Financial Products was enacted to better protect customers from incurringunexpected losses as a result of purchasing these financial products. Under this law, sellers of financial productshave a duty to their potential customers to explain important matters (i.e., the nature and magnitude of riskinvolved) regarding the financial products that they sell. If a seller fails to comply with the duty, the loss in valueof the purchased investment product due to the failure to explain is refutably presumed to be the amount of thecustomer’s loss. An amendment to this law, together with other related laws including the FIEA, becameeffective in September 2007. The amended law enlarges the scope of the duty of financial services providers toinform customers of important matters related to the financial products that they offer.
Act Concerning Protection of Depositors and Relief for Victims of Certain Types of Fraud
The Act Concerning Protection of Depositors from Illegal Withdrawals Made by Forged or Stolen Cardsrequires financial institutions to establish internal systems to prevent illegal withdrawals of deposits made usingforged or stolen bank cards. The law also requires financial institutions to compensate depositors for any amountillegally withdrawn using forged or stolen bankcards, subject to certain conditions.
The Act Concerning Payment of Dividends for Relief of Damages from Funds in Account used inconnection with Crimes requires that financial institutions take appropriate measures against various crimesincluding the closing of accounts used in connection with fraud and other crimes. The law also requires financialinstitutions to make, in accordance with specified procedures, payments from funds collected from the closedaccounts to victims of certain crimes.
Act on Prevention of Transfer of Criminal Proceeds
Under the Act on Prevention of Transfer of Criminal Proceeds, which addresses money laundering andterrorism concerns, financial institutions and certain other entities, such as credit card companies, are required toperform customer identification, submit suspicious transaction reports and keep records of their transactions.
42

Other Regulations Related to Our Business
Financial Instruments and Exchange Act of Japan
The Financial Instruments and Exchange Act of Japan (“FIEA”) regulates the securities industry and mostaspects of securities transactions in Japan, including public offerings, private placements and secondary tradingof securities, ongoing disclosure by securities issuers, tender offers for securities, organization and operation ofsecurities exchanges and self-regulatory organizations and registration of securities companies. The PrimeMinister has the authority to regulate the securities industry and securities companies, which authority isdelegated to the FSA Commissioner under the FIEA. The Securities and Exchange Surveillance Commission, anexternal agency of the FSA, is independent from the Agency’s other bureaus and is vested with authority toconduct day-to-day monitoring of the securities markets and to investigate irregular activities that hinder fairtrading of securities, including inspection of securities companies as well as banks in connection with theirsecurities business. Furthermore, the FSA Commissioner delegates certain authority to the Director General ofthe Local Finance Bureau to inspect local securities companies and their branches. A violation of applicable lawsand regulations may result in various administrative sanctions, including revocation of registration orauthorization, suspension of business or an order to discharge any Director or Executive Officer who has failed tocomply with applicable laws and regulations. Securities companies are also subject to the rules and regulations ofthe Japanese stock exchanges and the Japan Securities Dealers Association, a self-regulatory organization ofsecurities companies.
An amendment to the FIEA was promulgated in September 2012 in order to, among other things, facilitatethe establishment of a “Comprehensive Exchange,” in which securities, financial derivatives and commodityderivatives are traded comprehensively. It enables Financial Instruments Exchanges to trade commodityderivatives to enhance user convenience. The FSA conducts supervision of the “Comprehensive Exchange.” Theamendment with regard to the “Comprehensive Exchange” became effective on March 11, 2014.
Regulation of the Consumer Finance Business
In order to resolve the problems of heavily indebted borrowers and to effect proper regulation of theconsumer finance business, in June 2010, maximum legal interest rates were reduced to levels prescribed by theInterest Rate Restriction Act, ranging from 15% to 20%, and gray zone interest, which is interest on loans inexcess of rates prescribed by the Interest Rate Restriction Act up to the 29.2% maximum rate permitted under theContributions Act, was abolished. Judicial decisions have strictly interpreted the conditions under whichconsumer finance companies may retain gray zone interest. As a result, claims for refunds of gray zone interestincreased substantially. Amendments to the Money Lending Business Act provide an additional upper limit onaggregate borrowings by an individual from all moneylenders over which moneylenders may not extend furtherloans, as well as stricter regulation and supervision of moneylender activities.
Installment Sales Act
In order to ensure the fairness of transactions with respect to installment and other sales, prevent damage toconsumers and manage credit card numbers, the Installment Sales Act imposes requirements on those whoconduct installment sales businesses. In June 2008, revisions to the Installment Sales Act were enacted, most ofwhich became effective in December 2009. The revisions impose more stringent and expanded requirements forcredit card companies, including, among other things: (1) wider coverage of installment sales under theregulations; (2) measures to prevent inappropriate extensions of credit for certain credit transactions;(3) measures to prevent excessive lending for certain credit transactions that include requirements to investigatethe payment ability of consumers by use of designated credit information organizations and prohibition ofexecution of credit agreements that exceed the payment ability of consumers; and (4) measures to protect certaininformation, such as credit numbers.
43

Base Erosion and Profit Shifting (BEPS)
In July 2013, the Organization for Economic Co-operation and Development (“OECD”) published theAction Plan on Base Erosion and Profit Shifting (“BEPS”) in order to prevent exploiting of gaps and mismatchesin tax rules and artificial shifting of profits to low or no-tax locations. The Action Plan on BEPS identified15 key areas to be addressed by 2015. In September 2014, reports on recommendations for a coordinatedinternational approach for seven key areas were delivered and those for the other key areas are scheduled to bedelivered in 2015. An integrated package of such deliverables is scheduled to be delivered to the G-20 FinanceMinisters in October 2015. These measures will apply once they are implemented either in domestic laws or inthe network of bilateral tax treaties. Some of the deliverables published by OECD have been partially reflected toJapanese tax regulations by the tax reform adopted in 2015.
Deregulation
The developments toward deregulation of the financial system including those described below have madethe Japanese banking industry highly competitive.
Deregulation of Bank Engagement in the Securities Business
The gradual relaxation of the restrictions under the Securities and Exchange Act allowed banks to engage inthe following business lines, after taking appropriate registration measures with the FSA:
• underwriting and dealing in Japanese government bonds, Japanese municipal bonds, Japanesegovernment guaranteed bonds, commercial paper and certain bonds issued by special purposecompanies;
• selling beneficiary certificates of investment trusts and securities issued by an investment company;and
• dealing in listed or OTC securities or derivatives transactions as well as in the securities intermediarybusiness.
In addition, amendments to the FIEA and the Banking Act relating to firewalls and conflicts of interestbetween banks, securities companies and insurance companies became effective on June 1, 2009. Theamendment relating to firewalls abolished the ban on certain officers and employees from holding concurrentposts in banks, securities companies and insurance companies, and relaxed restrictions on the transfer ofnon-public customer information. On the other hand, the amendment relating to conflicts of interest requiresthose financial institutions, including banks, to implement proper information management procedures and todevelop appropriate internal systems to prevent customer interests from being unfairly harmed through trading bythe companies or by other companies within their group. For example, the companies may be required to createinformation barriers between departments and monitor how it executes transactions with customers.
Deregulation of Insurance Products
The gradual deregulation of the financial services industry permitted banks in Japan to offer an increasedvariety of insurance products, including pension-type insurance to the full range, as an agent.
Privatization of Japan Post Holdings Co., Ltd.’s subsidiaries
The Government of Japan began privatizing or eliminating several government institutions in connectionwith making Japan Post Holdings Co., Ltd. (“Japan Post Holdings”), a joint stock corporation that holds shares offour operating companies. Privatization of Japan Post Holdings’ banking and insurance subsidiaries, which wasoriginally planned to be completed by 2017, was suspended in December 2009. In April 2012, a law was enactedto abolish the deadline of the privatization of Japan Post Holdings’ banking and insurance subsidiaries. Under thePostal Privatization Act, Japan Post Holdings’ banking subsidiary, one of the world’s largest deposit-takinginstitutions, is allowed to expand its business with prior approval of the government.
44

Regulations in the United States
As a result of its operations in the United States, the Bank and SMFG are subject to extensive federal andstate banking and securities supervision and regulation. The Bank engages in U.S. banking activities directlythrough its branches in Los Angeles, San Francisco and New York and through its representative office inHouston. The Bank also controls a U.S. banking subsidiary, Manufacturers Bank, and a U.S. broker-dealersubsidiary, SMBC Nikko Securities America.
The Bank’s New York branch is supervised by the Federal Reserve Bank of New York and the New YorkState Department of Financial Services, but its deposits are not insured (or eligible to be insured) by the FederalDeposit Insurance Corporation (“FDIC”). The Bank’s Los Angeles and San Francisco branches are supervised bythe Federal Reserve Bank of San Francisco and the California Department of Business Oversight, but theirdeposits are not insured (or eligible to be insured) by the FDIC. The Bank’s representative office in Houston issubject to regulation and examination by the Texas Department of Banking and the Federal Reserve Bank ofDallas.
The Bank and SMFG are qualifying foreign banking organizations under the U.S. International Banking Actof 1978, as amended (“International Banking Act”), and as such are subject to regulation as bank holdingcompanies under the Bank Holding Company Act. Additionally, the Bank and SMFG are bank holdingcompanies by virtue of their ownership of Manufacturers Bank. As a result, the Bank, SMFG and theirU.S. operations are subject to regulation, supervision and examination by the Federal Reserve Board as theirU.S. “umbrella supervisor.”
Manufacturers Bank is a California state-chartered bank that is not a member of the Federal ReserveSystem. As a state non-member bank the deposits of which are insured by the FDIC, Manufacturers Bank issubject to regulation, supervision and examination by the FDIC and the California Department of BusinessOversight.
In order to further expand our business in the U.S., we and the Bank obtained financial holding companystatus under the Bank Holding Company Act on May 7, 2013, which authorizes the expansion of the scope ofservices we provide in the U.S., including the underwriting and trading of securities and other investmentbanking services.
Restrictions on Business Activities
As described below, federal and state banking laws and regulations restrict the Bank’s and SMFG’s abilityto engage, directly or indirectly through subsidiaries, in certain activities in the United States.
The Bank and SMFG are required to obtain the prior approval of the Federal Reserve Board before directlyor indirectly acquiring the ownership or control of more than 5% of any class of voting shares of U.S. banks,certain other depository institutions and bank or depository institution holding companies. Under the BankHolding Company Act and the Federal Reserve Board regulations, the Bank is required to serve as a source offinancial strength to Manufacturers Bank. In addition, the Bank’s U.S. banking operations (includingManufacturers Bank and the Bank’s U.S. branches) are also restricted from engaging in certain “tying”arrangements involving products and services.
As financial holding companies, we, the Bank and the companies under our control are permitted to engagein a broader range of activities in the U.S. and abroad than permitted for bank holding companies and theirsubsidiaries. Unless otherwise limited by the Federal Reserve Board, financial holding companies generally canengage, directly or indirectly in the U.S. and abroad, in financial activities, either de novo or by acquisition, byproviding after-the-fact notice to the Federal Reserve Board. These financial activities include underwriting anddealing in securities, insurance underwriting and brokerage and making investments in non-financial companies
45

for a limited period of time, as long as the financial holding company does not directly or indirectly manage thenon-financial companies’ day-to-day activities, and the financial holding company’s banking subsidiaries engageonly in permitted cross-marketing with the non-financial companies. If we or the Bank cease to qualify asfinancial holding companies, we could be barred from new financial activities or acquisitions, and have todiscontinue the broader range of activities permitted to financial holding companies.
Other Prudential Restrictions
The Bank’s U.S. branches and Manufacturers Bank are subject to requirements and restrictions underU.S. federal and state law, including requirements to maintain reserves against deposits, restrictions on the typesand amounts of loans that may be made and limitations on the types of investments that may be made and thetypes of services that may be offered. Various consumer laws and regulations also affect the operations ofManufacturers Bank, and to a limited extent, the Bank’s New York and California branches.
In addition, under U.S. federal banking laws, state-chartered banks (such as Manufacturers Bank) andstate-licensed branches and agencies of foreign banks (such as the Bank’s New York branch) may not, as ageneral matter, engage as a principal in any type of activity not permissible for their federally chartered orlicensed counterparts, unless (i) in the case of state-chartered banks, the FDIC determines that the additionalactivity would pose no significant risk to the FDIC’s Deposit Insurance Fund and is consistent with soundbanking practices and (ii) in the case of state-licensed branches and agencies of foreign banks, the FederalReserve Board determines that the additional activity is consistent with sound banking practices. The U.S. federalbanking laws also subject state branches and agencies of foreign banks to the same single-borrower lendinglimits that apply to federal branches or agencies, which are substantially similar to the lending limits applicableto national banks. For the Bank’s U.S. branches, these single-borrower lending limits are based on the worldwidecapital of the Bank.
Under the International Banking Act, the Federal Reserve Board may terminate the activities of anyU.S. office of a foreign bank if it determines (i) that the foreign bank is not subject to comprehensive supervisionon a consolidated basis in its home country (unless the home country is making demonstrable progress towardestablishing such supervision), (ii) that there is reasonable cause to believe that such foreign bank or its affiliatehas violated the law or engaged in an unsafe or unsound banking practice in the United States and, as a result ofsuch violation or practice, the continued operation of the U.S. office would be inconsistent with the publicinterest or with the purposes of federal banking laws, or (iii) for a foreign bank that presents a risk to the stabilityof the United States financial system, the home country of the foreign bank has not adopted, or madedemonstrable progress toward adopting, an appropriate system of financial regulation to mitigate such risk.
There are various qualitative and quantitative restrictions on the extent to which SMFG and its subsidiariescan borrow or otherwise obtain credit from its U.S. bank subsidiary, Manufacturers Bank, or engage in certainother transactions involving that subsidiary. In general, these transactions must be on terms that would ordinarilybe offered by Manufacturers Bank to unaffiliated entities, and credit transactions must be secured by designatedamounts of specified collateral. In addition, certain transactions, such as certain purchases by ManufacturersBank from the Bank or its non-bank subsidiaries, are subject to volume limitations. Effective in July 2012, theDodd-Frank Act (discussed below) subjects credit exposure arising from derivative transactions, securitiesborrowing and lending transactions, and repurchase/reverse repurchase agreements to these collateral and volumetransactions limitations.
Regulatory Requirements applicable to Financial Holding Companies
As financial holding companies, we and the Bank are subject to additional regulatory requirements. Forexample, we, the Bank and Manufacturers Bank, which is our U.S. insured depository institution subsidiary, mustbe “well capitalized,” meaning maintenance of a Tier 1 risk-based capital ratio of at least 6% and a totalrisk-based capital ratio of at least 10% under the revised capital standards of Basel III, which became effective on
46

January 1, 2015 in the U.S. In addition, we, the Bank and Manufacturers Bank must be “well managed,”including maintenance of examination ratings that are at least satisfactory. Further, the Bank is also required tobe well capitalized and well managed under its home country standards, which must be comparable to thoserequired for a U.S. bank. Failure to comply with such requirements would require us and the Bank to prepare aremediation plan, and we would not be able to undertake new business activities or acquisitions based on ourstatus as a financial holding company during any period of noncompliance without the prior approval of theFederal Reserve Board. Divestiture or termination of certain business activities in the U.S. may also be requiredas a consequence of failure to correct such conditions within 180 days.
Regulations for Stabilizing the Financial System
Dodd-Frank Wall Street Reform and Consumer Protection Act
The Dodd-Frank Wall Street Reform and Consumer Protection Act (“Dodd-Frank Act”) provides a broadframework for significant regulatory changes across most areas of U.S. financial regulation. The Dodd-Frank Actaddresses, among other issues, systemic risk oversight, bank capital standards, the resolution of failingsystemically significant financial institutions, OTC derivatives, the ability of banking entities to engage inproprietary trading activities and invest in hedge funds and private equity funds, consumer and investorprotection, hedge fund registration, and securitization.
Implementation of the Dodd-Frank Act is taking place through detailed rulemaking over multiple years byvarious regulators, including the Office of the Comptroller of the Currency (“OCC”), the Federal Reserve Board,the SEC, the FDIC, the Commodity Futures Trading Commission (“CFTC”), the Financial Stability OversightCouncil and the Consumer Financial Protection Bureau. The final details, impact and timing of some of theimplementing rules, particularly of rules relating to derivatives remain uncertain, and they could result inadditional costs, or restrict or otherwise affect the way we conduct our business.
In December 2013, the Federal Reserve Board, the SEC, the OCC, the FDIC, and the CFTC adopted finalrules implementing what is known as the “Volcker Rule.” The final rules require banking entities to conform tocertain restrictions on proprietary trading activities, hedge fund and private equity fund activities and certainother enumerated investment restrictions, but contain a number of exclusions and exemptions that substantiallylimit their extraterritorial reach. Concurrently, with the release of the final rules in December 2013, the FederalReserve Board issued an order extending the conformance period until July 21, 2015. During the conformanceperiod, banking entities must engage in good-faith efforts to conform their activities and investments to therequirements of the final rules by the conformance deadline. In December 2014, the Federal Reserve Boardannounced its intention to extend the conformance period until July 21, 2017 for certain investments in andrelationships with hedge funds and private equity funds that were in place as of December 31, 2013. Althoughcomplying with the final rules could result in additional costs, or restrict or otherwise affect the way we conductour business, the impact remains uncertain.
The Dodd-Frank Act provides regulators with tools to impose greater capital, leverage and liquidityrequirements and other prudential standards, particularly for financial institutions that pose significant systemicrisk and bank holding companies with assets of $50 billion or more. In imposing heightened prudential standardson non-U.S. financial institutions such as us and the Bank, the Federal Reserve Board is directed to take intoaccount the principle of national treatment and equality of competitive opportunity, and the extent to which thenon-U.S. bank holding company is subject to comparable home country standards.
On February 18, 2014, the Federal Reserve Board adopted final rules that will apply enhanced prudentialstandards to the U.S. operations of large non-U.S. banking organizations, including us. The final rules, effectiveJuly 1, 2016, will require large non-U.S. banking organizations, such as us, to certify that they are subject tohome country capital standards that are broadly consistent with the Basel capital framework, including Basel III;conduct home country capital stress tests that are comparable to U.S. standards; comply with a qualitative
47

liquidity framework, including, among other things, a U.S. liquidity buffer requirement for its U.S. branches andagencies based on the results of internal liquidity stress testing; and establish a U.S. risk committee thatunderstands the risk management policies and framework of its U.S. operations and has a general understandingof the risk management practices of the U.S. operations.
Under the final rules, non-U.S. banking organizations with combined U.S. assets (excluding assets held byits U.S. branches and agencies) of $50 billion or more, will be required to establish a separately capitalizedtop-tier U.S. intermediate holding company. However, this requirement will not apply to us. The final rules forsingle counterparty credit limits and for early remediation have yet to be promulgated.
Effective in July 2011, the Dodd-Frank Act removed a longstanding prohibition on the payment of intereston demand deposits by Manufacturers Bank and the Bank’s three branches in the United States. In addition, theDodd-Frank Act requires that the lending limits take into account credit exposure arising from derivativetransactions and securities lending, securities borrowing, and repurchase agreements and reverse repurchaseagreements with counterparties. In June 2013, the OCC adopted the final rules that implement these new lendinglimits, and compliance with these new lending limits is required for our New York, Los Angeles and SanFrancisco branches from October 1, 2013, in addition to existing state lending limits that apply to the branches.Additionally, as a California state-chartered bank, Manufacturers Bank is subject to state lending limits, whichalso apply to credit exposure arising from derivative transactions.
Furthermore, the Dodd-Frank Act provides for an extensive framework for the regulation of OTCderivatives, including mandatory clearing, exchange trading and transaction reporting of certain OTC derivatives.In October 2012, the final joint rules of the CFTC and the SEC that further define “swap” and “security basedswap” became effective. As a result, certain entities are required to register with the CFTC as “swap dealers” or“major swap participants” and our subsidiary, SMBC Capital Markets, Inc., became provisionally registered as aswap dealer on or around December 31, 2012. While some of the U.S. swaps requirements are already final andeffective, others are subject to further rulemaking or deferred compliance dates. Mandatory clearing, tradeexecution and reporting requirements for swaps took effect in the first half of 2013.
Furthermore, the Dodd-Frank Act requires the SEC to establish rules requiring issuers with listed securities,which may include non-U.S. private issuers such as us, to establish a “clawback” policy to recoup previouslyawarded compensation in the event of an accounting restatement. The Dodd-Frank Act also grants the SECdiscretionary rule-making authority to impose a new fiduciary standard on brokers, dealers and investmentadvisers, and expands the extraterritorial jurisdiction of U.S. courts over actions brought by the SEC or theUnited States with respect to violations of the antifraud provisions in the Securities Act of 1933, the SecuritiesExchange Act of 1934 and the Investment Advisers Act of 1940.
Laws Prohibiting Money Laundering and Terrorist Financing
The Bank Secrecy Act / USA PATRIOT Act of 2001
The Bank Secrecy Act, as amended by the USA PATRIOT Act of 2001 (“PATRIOT Act”) containsmeasures to prevent and detect the financing of terrorism and international money laundering by imposingsignificant compliance and due diligence obligations, creating crimes, providing for penalties and expanding theextraterritorial jurisdiction of the United States. The Bank Secrecy Act, as amended, imposes anti-moneylaundering compliance obligations on U.S. financial institutions, including the U.S. offices of foreign banks. Thepassage of the PATRIOT Act and other events have resulted in heightened scrutiny of compliance with the BankSecrecy Act and anti-money laundering rules by federal and state regulatory and law enforcement authorities.Certain provisions of the USA Patriot Act expired in June 2015 and were extended in part by the USA FreedomAct of 2015, enacted on June 2015.
48

U.S. Sanctions Targeting Iran Related Activities
In July 2010, the U.S. government enacted legislation designed to restrict economic and financialtransactions with Iran, i.e., CISADA, which, as amended, may lead to the imposition of sanctions againstnon-U.S. financial institutions, such as us, if they are determined by the U.S. Secretary of the Treasury to havefacilitated “significant transactions” or provided “significant financial services” for certain Iran-linkedindividuals or entities or the Iranian Revolutionary Guard Corps. Non-U.S. financial institutions that engage insanctionable activity could lose their ability to open or maintain correspondent or payable-through accounts withU.S. financial institutions, among other possible sanctions.
In December 2011, the U.S. government adopted Section 1245 of the 2012 NDAA, which broadened therange of sanctionable transactions to include conducting or facilitating “significant financial transactions” withthe Central Bank of Iran or other Iranian financial institutions designated for sanctions under the InternationalEmergency Economic Powers Act in connection with Iran’s weapons of mass destruction proliferation or supportfor international terrorism.
In addition, in July 2012, Executive Order 13622, as amended, authorizes the U.S. Secretary of theTreasury, in consultation with the U.S. Secretary of State, to impose correspondent account sanctions on anyforeign financial institution that knowingly conducts or facilitates a significant financial transaction with theNational Iranian Oil Company or Naftiran Intertrade Company, or that knowingly conducts or facilitates asignificant transaction for the purchase, acquisition, sale, transport or marketing of petroleum, petroleumproducts or petrochemical products from Iran, with certain exceptions.
Further, in August 2012, the President signed the ITRA into law, which strengthens existing sanctions onIran, especially those aimed at third-country nationals engaging in business with Iran, and includes measuresrelating to human rights abuses in Iran and Syria. It exposes non-U.S. persons to possible sanctions if theyengage in specified activities relating to Iran.
In addition, the IFCA, which is included in the U.S. National Defense Authorization Act for Fiscal Year2013, imposes, among other things, new sanctions against the energy, shipping and shipbuilding sectors of Iran,as well as Iranian port operators, and the sale, supply or transfer to or from Iran of certain precious and othermetals and materials. Executive Order 13645 targets, among other things, the automotive sector of Iran andtransactions in Iran’s currency, the rial. The IFCA and Executive Order 13645 provide for the imposition ofsanctions on persons, including foreign financial institutions, that knowingly engage in activities related to thesectors and conduct targeted by the IFCA and Executive Order 13645, and activities involving certain Iranianpersons included on the Specially Designated Nationals and Blocked Persons List (the “SDN List”) maintainedby OFAC.
The U.S. Secretary of State announced on March 20, 2012 that Japan was among a number of countries thathad significantly reduced the volume of crude oil purchases from Iran, and that therefore the 2012 NDAAsanctions would not apply to Japanese financial institutions for a period of 180 days, which period could berenewed based on ongoing reductions in crude oil purchases from Iran. The NDAA Exception was renewed onSeptember 14, 2012, March 13, 2013, and September 6, 2013. The NDAA Exception, which was subject tocertain restrictions, also exempted Japanese financial institutions from sanctions under certain provisions ofExecutive Order 13622, the IFCA, and Executive Order 13645.
On January 20, 2014, the U.S. government issued certain temporary sanctions waivers as part of the JPOAamong the P5 + 1 and Iran (“JPOA Waivers”). While in effect, the JPOA Waivers supersede the NDAAException, which expired on March 5, 2014. The effective period of the JPOA Waivers (“JPOA Relief Period”)was originally from January 20, 2014 through July 20, 2014, but was successively extended through July 13,2015. Pursuant to the JPOA Waivers, the U.S. government agreed not to seek reductions in the volume of Iraniancrude oil purchased by current authorized purchasers, including Japan, during the JPOA Relief Period.Additionally, non-U.S. financial institutions, such as us, that engaged in certain transactions initiated andcompleted during the JPOA Relief Period relating to exports of Iranian petrochemical products, petroleum and
49
petroleum products, Iran’s automotive sector, Iran’s trade in gold and precious metals, and the supply andinstallation of certain spare parts and services for civil aircraft in Iran would not be targeted for secondarysanctions under U.S. law, pursuant to the JPOA Waivers. As discussed below, on July 14, 2015, the sanctionsrelief provided for in the JPOA was further extended.
As part of the JPOA, the P5 + 1 and Iran agreed on a process to authorize or facilitate the release ininstallments over the initial JPOA Relief Period (January 20, 2014 through July 20, 2014) of $4.2 billion of Iran’srestricted funds held in banks outside Iran and outside the United States, contingent on Iran fulfilling itscommitments under the JPOA. The United States Government worked with non-U.S. financial institutions toimplement the release of such funds to Iran. As part of the extension of the JPOA Relief Period to November 24,2014, the P5 + 1 agreed to allow Iran access to an additional $2.8 billion of its restricted assets in installments.According to the U.S. Treasury Department, the P5+1 fulfilled their commitments to facilitate the release of$4.2 billion during the initial JPOA Relief Period and to facilitate the release of a further $2.8 billion throughNovember 24, 2014. Further, as part of a further extension of the JPOA Relief Period, the P5 + 1 agreed tofacilitate the release in installments of an additional $4.9 billion of Iran’s restricted funds during the periodbeginning on November 25, 2014, and ending on June 30, 2015. In addition, the JPOA, among other things,established a financial channel to facilitate humanitarian trade for Iran’s domestic needs using Iranian oilrevenues held abroad. For a description of the remittances the Bank conducted in connection with the export ofhumanitarian goods to Iran under applicable laws and regulations, see “—Disclosure Pursuant to Section 13(r) ofthe Securities Exchange Act of 1934.”
In April 2015, the parties to the JPOA reached an understanding on the framework for a JointComprehensive Plan of Action for containing Iran’s nuclear program (“JCPOA”). In May 2015, PresidentObama signed into law the Iran Nuclear Agreement Review Act of 2015, which establishes a mechanism forCongressional review of any new agreement reached between the United States and Iran related to Iran’s nuclearprogram.
On July 14, 2015, the P5 + 1 and Iran, with the European Union, agreed on the final text of the JCPOA .Building on the framework for a JCPOA announced in April, the JCPOA will provide Iran with phased sanctionsrelief upon verification that Iran has implemented key nuclear commitments. Under the JCPOA, U.S. sanctionsrelief will be provided through the suspension and eventual termination of nuclear-related secondary sanctions,beginning once the International Atomic Energy Agency (“IAEA”) verifies that Iran has implemented keynuclear-related measures described in the JCPOA (“Implementation Day”). The U.S. government has stated thatit will publish detailed guidance related to the JCPOA prior to Implementation Day, but as of July 15, 2015, thisguidance has not yet been issued. Pursuant to the JCPOA, the sanctions relief provided for in the JPOA has beenextended through Implementation Day. This JPOA sanctions relief is the only Iran-related sanctions relief ineffect until further notice. Effective July 14, 2015, all specific licenses issued pursuant to OFAC’s “SecondAmended Statement of Licensing Policy on Activities Related to the Safety of Iran’s Civil Aviation Industry”with an expiration date on or before July 14, 2015, are hereby authorized to remain in effect according to theirterms until Implementation Day.
Ukraine Freedom Support Act of 2014
In order to deter the Russian government from further destabilizing and invading Ukraine, the U.S.government enacted H.R. 5859, the Ukraine Freedom Support Act of 2014 (signed into law on December 18,2014). Among other things, the Act authorizes prohibitions or strict limitations on the opening or maintaining ofcorrespondent or payable-through accounts in the United States by non-U.S. financial institutions determined bythe U.S. government (i) to have knowingly engaged in on or after December 18, 2014 in significant transactionsinvolving certain activities described in the Act, including those involving individuals or entities on whomsanctions are imposed pursuant to the Act for making a significant investment in a project for the extraction ofdeepwater, Arctic offshore or shale formation crude oil in Russia, or (ii) to have knowingly facilitated, on or afterJune 16, 2015, a significant financial transaction on behalf of any Russian individual or entity included on theSDN List pursuant to Ukraine-related sanction programs.
50
Foreign Account Tax Compliance Act
Provisions of the U.S. tax law commonly referred to as the Foreign Account Tax Compliance Act(“FATCA”), which became effective on July 1, 2014, aim to prevent U.S. persons from hiding their financialassets or evading their U.S. federal income tax obligations by the use of offshore accounts. A foreign financialinstitution that has entered into an agreement with the U.S. Internal Revenue Service (“IRS”) pursuant to which itagrees to comply with FATCA, referred to as a “participating foreign financial institution” (“PFFI”), is requiredto perform specified due diligence, reporting and withholding functions (a “PFFI agreement”). Specifically,under FATCA, a PFFI is required to ascertain the U.S. status of customers through specified due diligence andreport certain information annually to the IRS. In cases where customers are not compliant with FATCA, PFFIsare obligated to carry out specified reporting and withholding procedures as prescribed. The consequences forforeign financial institutions that are not compliant with FATCA include being subjected to a 30% withholdingtax on certain withholdable payments from U.S. sources and reporting to the IRS.
As of July 1, 2015, the United States entered into intergovernmental agreements or reached agreements insubstance with more than 100 countries in furtherance of the objectives of FATCA, which modify the operationof FATCA with respect to financial institutions located in those countries. On June 11, 2013 the United Statesand Japan entered into an intergovernmental agreement to facilitate the implementation of FATCA pursuant towhich Japanese financial institutions (such as us and certain of our Group companies) are directed by theJapanese authorities to register with the IRS and fulfill obligations consistent with those required under a PFFIagreement. We have registered with the IRS to become a PFFI. We are committed to complying with FATCA asa PFFI and abiding by the terms of our PFFI agreement with the IRS within the jurisdictions in which we operateand in accordance with the time frame set out by the IRS. We intend to closely monitor FATCA developmentsand evolving industry practices to ensure continued compliance with FATCA moving forward.
Other Regulations in the United States
In the United States, the Bank’s U.S.-registered broker-dealer subsidiary, SMBC Nikko Securities America,is regulated by the SEC. Broker-dealers are subject to regulations that cover all aspects of the securities business,including:
• sales methods;
• trade practices among broker-dealers;
• use and safekeeping of customers’ funds and securities;
• capital structure;
• record-keeping;
• the financing of customers’ purchases; and
• the conduct of directors, officers and employees.
In addition, SMBC Nikko Securities America is a member of and regulated by the Financial IndustryRegulatory Authority and is regulated by the individual state securities authorities in the states in which itoperates. The U.S. government agencies and self-regulatory organizations, as well as state securities authoritiesin the United States having jurisdiction over the Bank’s U.S. broker-dealer affiliates, are empowered to conductadministrative proceedings that can result in censure, fine, the issuance of cease-and-desist orders or thesuspension or expulsion of a broker-dealer or its directors, officers or employees.
Regulations in Other Jurisdictions
Elsewhere in the world, our operations are subject to regulation and control by local central banks andmonetary authorities.
51
Disclosure Pursuant to Section 13(r) of the Securities Exchange Act of 1934
Section 13(r) of the Securities Exchange Act of 1934, as amended, requires an issuer to disclose whether itor any of its affiliates knowingly engaged in certain activities or transactions relating to Iran or with individualsor entities designated by the U.S. government under specified Executive Orders, even if those activities are notprohibited by U.S. law and are conducted outside the United States by non-U.S. affiliates. During the twelvemonths ended March 31, 2015, one affiliate of SMFG, SMBC, engaged in activities subject to disclosure underSection 13(r). SMBC conducted these activities consistent with its internal policies and procedures, the policiesand procedures of SMFG, and applicable laws and regulations.
SMBC issued letters of credit and provided remittance and other settlement services in connection withcustomers’ trade transactions between Japan and Iran. These transactions principally involved the importation ofoil into Japan or exportation of civilian commercial products from Japan and were conducted with Iranian banks.Under the exception for Japanese financial institutions under the 2012 NDAA, SMBC supported a Japaneseimporting company by paying bills of exchange in connection with imports of crude oil from an Iranian oilcompany designated under Executive Order 13382. These transactions did not involve the settlement ofU.S. dollar-denominated payments cleared through U.S. banks. SMBC has informed SMFG that it intends tocontinue to engage in these types of transactions on a limited basis to the extent permitted under applicableregulations. For the twelve months ended March 31, 2015, the gross revenue related to these transactions was¥11.8 million, representing about 0.0004% of SMFG’s total interest and fee income. SMFG does not allocatedirect costs to interest and fee income and therefore does not calculate net profits with respect to thesetransactions.
In addition, in accordance with the JPOA, SMBC has conducted certain settlement services related tohumanitarian trades with Iran. We are voluntarily disclosing such transactions, although we do not believe thosetransactions are subject to disclosure under Section 13(r) of the Securities Exchange Act of 1934. The JPOAprovides for the establishment of a financial channel to facilitate humanitarian trade for Iran’s domestic needsusing Iranian oil revenues held abroad. The overall framework to provide these services is based on an agreementbetween the U.S. and Japanese authorities and was reviewed by U.S. and Japanese authorities for compliancewith applicable laws and regulations. The services provided under the framework are permitted under certainconditions; the remittance must be in Japanese Yen through a “Special Purpose Account” for humanitarian trade;and the sellers of the humanitarian goods, namely food, agricultural products, medicines and medical devices, arelimited to Japanese entities and entities permitted by U.S. regulators. To facilitate the export of humanitariangoods to Iran, at the request of U.S. and Japanese regulators and with the written authorization of the U.S.government, SMBC has provided remittances in connection with the export of humanitarian goods to Iranstarting in March 2014. These transactions were conducted through the use of yen accounts maintained withSMBC in Japan by some Iranian financial institutions that are not designated under Executive Order 13382 or13224, nor controlled by the Iranian government. These transactions did not involve U.S. dollars or clearingservices of U.S. banks for the settlement of payments. SMBC intends to continue to provide these remittance andother settlement services in connection with the exports of humanitarian goods to Iran to the extent that U.S. andJapanese regulators continue to make such requests, and that the services are permitted under applicable laws andregulations.
In the past, SMBC has issued performance bonds that supported various projects, including the constructionof petroleum plants in Iran. Some of these performance bonds may have had counterparties that were entities orinstrumentalities of the Government of Iran, or were issued through Iranian banks that have since beendesignated under Executive Order 13382 or 13224. All of these performance bonds have matured, and SMBC hasnot renewed and will not renew them, but SMBC continues to have obligations under the matured performancebonds until they are returned or cancelled by the beneficiaries. In connection with a beneficiary’s cancellation ofa performance bond, SMBC paid a cancellation fee of ¥42 million in Japanese yen, with the authorization of theMinistry of Finance of Japan, to an Iranian bank that is designated under Executive Order 13382. SMBC has alsoreceived fees from its customers on whose behalf it issued the performance bonds. For the twelve months endedMarch 31, 2015, the gross revenue relating to these transactions was ¥50 million, representing less than 0.0018%
52

of SMFG’s total interest and fee income. As noted above, SMFG does not allocate direct costs to interest and feeincome and therefore does not calculate net profits with respect to these transactions. SMBC has informed SMFGthat it intends to continue to accept fee income from its customers for whose account the performance bondswere issued and to pay the relevant fees to the Iranian banks, to the extent authorized by the Ministry of Financeof Japan or otherwise permitted under applicable regulations, until the bonds are returned or cancelled. However,SMBC strongly urges the relevant customers to ask the beneficiaries to agree to return or cancel theseperformance bonds.
SMBC has frozen all accounts of Iranian banks designated under Executive Order 13382 or 13224 pursuantto Japanese foreign exchange laws, and has frozen U.S. dollar accounts of other Iranian banks. SMBC stillmaintains two Japanese yen accounts of government-owned Iranian banks, including an account for the CentralBank of Iran, and certain transactions described in this disclosure were conducted through the use of suchaccounts. These transactions were conducted in accordance with Japanese law, and we do not believe that thetransactions were sanctionable under U.S. sanctions, due to the exception for Japanese financial institutionsunder the 2012 NDAA and JPOA Waivers that were in effect at the time the transactions occurred. For adescription of the exception under the 2012 NDAA and JPOA Waivers described in this paragraph,see “—Regulations in the United States—Laws Prohibiting Money Laundering and Terrorist Financing.” Thegross revenue attributable to the accounts of government-owned Iranian banks for the twelve months endedMarch 31, 2015, was less than ¥0.1 million, representing less than 0.0001% of SMFG’s total interest and feeincome. SMFG does not allocate direct costs to interest and fee income and therefore does not calculate netprofits with respect to these transactions. SMBC has informed SMFG that it intends to continue to maintain theIranian accounts described above to the extent permitted under applicable laws and regulations.
Between 2001 and 2006, prior to changes in applicable laws and regulations, SMBC made loans toJapanese-owned entities involved in financing the development of petroleum-related projects in Iran that mayhave been commissioned by the Government of Iran. One such borrower owed SMBC an overdue balance untilNovember 2014, at which time it repaid the entire amount pursuant to a specific license from OFAC. Noadditional loans have been extended since then, and SMBC has no plans to do so in the future.
As of the date of this annual report, to our knowledge, there are no other activities for the twelve monthsended March 31, 2015 that require disclosure under Section 13(r) of the Securities Exchange Act of 1934.
53
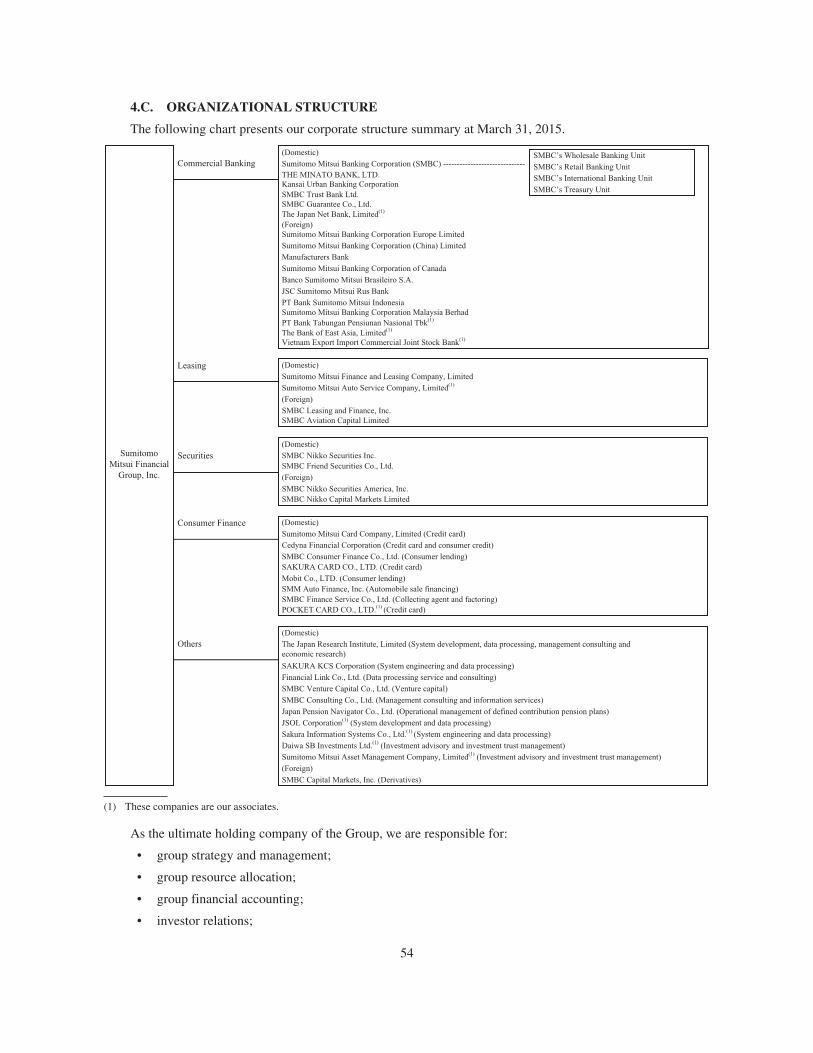
4.C. ORGANIZATIONAL STRUCTURE
The following chart presents our corporate structure summary at March 31, 2015.
SumitomoMitsui Financial
Group, Inc.
Commercial Banking(Domestic)
Leasing
Securities(Domestic)
SMBC Nikko Securities Inc.SMBC Friend Securities Co., Ltd.
(Foreign)
(Foreign)
SMBC Nikko Securities America, Inc.SMBC Nikko Capital Markets Limited
Consumer Finance (Domestic)
Sumitomo Mitsui Card Company, Limited (Credit card)
Cedyna Financial Corporation (Credit card and consumer credit)
SMBC Consumer Finance Co., Ltd. (Consumer lending)SAKURA CARD CO., LTD. (Credit card)
SMM Auto Finance, Inc. (Automobile sale financing)Mobit Co., LTD. (Consumer lending)
SMBC Finance Service Co., Ltd. (Collecting agent and factoring)POCKET CARD CO., LTD.(1) (Credit card)
Others
Sumitomo Mitsui Banking Corporation (SMBC) ------------------------------SMBC’s Wholesale Banking Unit
SMBC’s International Banking Unit
SMBC’s Treasury Unit
SMBC’s Retail Banking UnitTHE MINATO BANK, LTD.Kansai Urban Banking CorporationSMBC Trust Bank Ltd.
The Japan Net Bank, Limited(1)SMBC Guarantee Co., Ltd.
(Foreign)Sumitomo Mitsui Banking Corporation Europe Limited
Sumitomo Mitsui Banking Corporation (China) Limited
Manufacturers Bank
Sumitomo Mitsui Banking Corporation of Canada
Banco Sumitomo Mitsui Brasileiro S.A.
JSC Sumitomo Mitsui Rus Bank
PT Bank Sumitomo Mitsui IndonesiaSumitomo Mitsui Banking Corporation Malaysia BerhadPT Bank Tabungan Pensiunan Nasional Tbk(1)
The Bank of East Asia, Limited(1)
Vietnam Export Import Commercial Joint Stock Bank(1)
(Domestic)
Sumitomo Mitsui Finance and Leasing Company, Limited
Sumitomo Mitsui Auto Service Company, Limited(1)
(Foreign)
SMBC Leasing and Finance, Inc.SMBC Aviation Capital Limited
(Domestic)
The Japan Research Institute, Limited (System development, data processing, management consulting andeconomic research)
SAKURA KCS Corporation (System engineering and data processing)
Financial Link Co., Ltd. (Data processing service and consulting)
SMBC Venture Capital Co., Ltd. (Venture capital)
SMBC Consulting Co., Ltd. (Management consulting and information services)
Japan Pension Navigator Co., Ltd. (Operational management of defined contribution pension plans)
JSOL Corporation(1) (System development and data processing)
Sakura Information Systems Co., Ltd.(1) (System engineering and data processing)
Daiwa SB Investments Ltd.(1) (Investment advisory and investment trust management)
Sumitomo Mitsui Asset Management Company, Limited(1) (Investment advisory and investment trust management)
SMBC Capital Markets, Inc. (Derivatives)
(1) These companies are our associates.
As the ultimate holding company of the Group, we are responsible for:
• group strategy and management;
• group resource allocation;
• group financial accounting;
• investor relations;
54
• capital strategy;
• group IT strategy;
• HR management for group executives;
• group risk management, internal control and compliance;
• compensation schemes; and
• efficiently harmonizing our operations on a Group-wide basis.
Principal Subsidiaries
Our principal subsidiaries at March 31, 2015 are shown in the list below. We consolidate all entities that wecontrol. We control an entity when we are exposed, or have rights, to variable returns from our involvement withthe entity and have the ability to affect those returns through our power over the entity.
Principal domestic subsidiaries
Company Name
Proportionof Ownership
Interest(1)
Proportionof VotingRights(1) Main Business
(%) (%)Sumitomo Mitsui Banking Corporation . . . . . 100.0 100.0 Commercial bankingTHE MINATO BANK, LTD. . . . . . . . . . . . . 6.0 46.4(2)(3) Commercial bankingKansai Urban Banking Corporation . . . . . . . . 59.8 60.1 Commercial bankingSMBC Trust Bank Ltd. . . . . . . . . . . . . . . . . . . 100.0 100.0 Trust BankingSMBC Guarantee Co., Ltd. . . . . . . . . . . . . . . 100.0 100.0 Credit guaranteeSumitomo Mitsui Finance and Leasing
Company, Limited . . . . . . . . . . . . . . . . . . . 60.0 60.0 LeasingSMBC Nikko Securities Inc. . . . . . . . . . . . . . 100.0 100.0 SecuritiesSMBC Friend Securities Co., Ltd. . . . . . . . . . 100.0 100.0 SecuritiesSumitomo Mitsui Card Company, Limited . . 65.9 65.9 Credit cardCedyna Financial Corporation . . . . . . . . . . . . 100.0 100.0 Credit card and consumer creditSMBC Consumer Finance Co., Ltd. . . . . . . . . 100.0 100.0 Consumer lendingSAKURA CARD CO., LTD. . . . . . . . . . . . . . 100.0 100.0 Credit cardMobit Co., LTD. . . . . . . . . . . . . . . . . . . . . . . . 100.0 100.0 Consumer lendingSMM Auto Finance, Inc. . . . . . . . . . . . . . . . . 51.0 51.0 Automobile sales financingSMBC Finance Service Co., Ltd. . . . . . . . . . . 100.0 100.0 Collecting agent and factoringThe Japan Research Institute, Limited . . . . . . 100.0 100.0 System development, data processing,
management consulting and economicresearch
SAKURA KCS Corporation . . . . . . . . . . . . . . 50.2 50.2 System engineering and data processingFinancial Link Co., Ltd. . . . . . . . . . . . . . . . . . 100.0 100.0 Data processing service and consultingSMBC Venture Capital Co., Ltd. . . . . . . . . . . 40.0 40.0(3) Venture capitalSMBC Consulting Co., Ltd. . . . . . . . . . . . . . . 100.0 100.0 Management consulting and information
servicesJapan Pension Navigator Co., Ltd. . . . . . . . . . 69.7 69.7 Operational management of defined
contribution pension plans
(1) Percentages of proportion of ownership interest and proportion of voting rights have been truncated.(2) We have a 6.0% direct holding in THE MINATO BANK, LTD., and can control a further 40.4% of the voting rights held by the Bank’s
retirement benefit trust under contractual agreements between the Bank and the retirement benefit trust.(3) These companies are accounted for as subsidiaries, despite our holdings of less than 50% of the voting rights, because we are able to
govern the financial and operating policies of these companies under a statute or an agreement, or by delegating the majority of themembers of the board of directors.
55
Principal foreign subsidiaries
Company NameCountry of
Incorporation
Proportionof Ownership
Interest(1)
Proportionof VotingRights(1) Main Business
(%) (%)
Sumitomo Mitsui Banking Corporation EuropeLimited . . . . . . . . . . . . . . . . . . . . . . . . . . . . . . . U.K. 100.0 100.0 Commercial banking
Sumitomo Mitsui Banking Corporation (China)Limited . . . . . . . . . . . . . . . . . . . . . . . . . . . . . . . China 100.0 100.0 Commercial banking
Manufacturers Bank . . . . . . . . . . . . . . . . . . . . . . . U.S.A. 100.0 100.0 Commercial bankingSumitomo Mitsui Banking Corporation of
Canada . . . . . . . . . . . . . . . . . . . . . . . . . . . . . . . Canada 100.0 100.0 Commercial bankingBanco Sumitomo Mitsui Brasileiro S.A. . . . . . . . Brazil 100.0 100.0 Commercial bankingJSC Sumitomo Mitsui Rus Bank . . . . . . . . . . . . . Russia 100.0 100.0 Commercial bankingPT Bank Sumitomo Mitsui Indonesia . . . . . . . . . Indonesia 98.4 98.4 Commercial bankingSumitomo Mitsui Banking Corporation Malaysia
Berhad . . . . . . . . . . . . . . . . . . . . . . . . . . . . . . . . Malaysia 100.0 100.0 Commercial bankingSMBC Leasing and Finance, Inc. . . . . . . . . . . . . . U.S.A. 100.0 100.0 LeasingSMBC Aviation Capital Limited . . . . . . . . . . . . . Ireland 90.0 90.0 LeasingSMBC Nikko Securities America, Inc. . . . . . . . . . U.S.A. 100.0 100.0 SecuritiesSMBC Nikko Capital Markets Limited . . . . . . . . U.K. 100.0 100.0 SecuritiesSMBC Capital Markets, Inc. . . . . . . . . . . . . . . . . U.S.A. 100.0 100.0 Derivatives
(1) Percentages of proportion of ownership interest and proportion of voting rights have been truncated.
4.D. PROPERTY, PLANT AND EQUIPMENT
The assets for rent we own for the purpose of operating leases mainly consist of aircraft for the leasingbusiness. We own or lease the land and buildings in which we conduct our business. Most of the property that weoperate in Japan is owned by us to be used by our branches. In contrast, our international operations areconducted out of leased premises. Our head office building in Marunouchi is leased from a third party. Ourlargest property is the site of the Bank’s former Otemachi head office, with a net carrying value of ¥123 billion atMarch 31, 2015. The redevelopment of the building on the site started in April 2011 and was completed in June2015.
The following table shows the net carrying amount of our tangible fixed assets at March 31, 2015.
At March 31, 2015
(In millions)
Assets for rent . . . . . . . . . . . . . . . . . . . . . . . . . . . . . . . . . . . . . . . . . . . . . . . . . . . . . . . . . . . . . . . . ¥ 1,506,709Land . . . . . . . . . . . . . . . . . . . . . . . . . . . . . . . . . . . . . . . . . . . . . . . . . . . . . . . . . . . . . . . . . . . . . . . . 492,732Buildings . . . . . . . . . . . . . . . . . . . . . . . . . . . . . . . . . . . . . . . . . . . . . . . . . . . . . . . . . . . . . . . . . . . . 302,641Leased assets . . . . . . . . . . . . . . . . . . . . . . . . . . . . . . . . . . . . . . . . . . . . . . . . . . . . . . . . . . . . . . . . . 8,368Others . . . . . . . . . . . . . . . . . . . . . . . . . . . . . . . . . . . . . . . . . . . . . . . . . . . . . . . . . . . . . . . . . . . . . . . 186,047
Total . . . . . . . . . . . . . . . . . . . . . . . . . . . . . . . . . . . . . . . . . . . . . . . . . . . . . . . . . . . . . . . . . . . . ¥ 2,496,497
For more information, see Note 12 “Property, Plant and Equipment” and Note 38 “Assets Pledged andReceived as Collateral” to our consolidated financial statements included elsewhere in this annual report.
The total area of land related to our material office and other properties at March 31, 2015 wasapproximately 721,000 square meters for owned land and approximately 17,000 square meters for leased land.
We are not aware of any material environmental issues that may affect the utilization of our assets.
56

Item 4A. Unresolved Staff Comments
None.
Item 5. Operating and Financial Review and Prospects
The discussion below should be read together with “Item 3.A. Selected Financial Data” and ourconsolidated financial statements and related notes included elsewhere in this annual report. Unless otherwiseindicated, we present our information on a consolidated basis.
OVERVIEW
Operating Environment
Our results of operations and financial condition are significantly affected by developments in Japan as wellas the global economy.
For the fiscal year ended March 31, 2015, Japanese gross domestic product (“GDP”) decreased by 0.9%,compared with an increase of 2.1% in the previous fiscal year, based on data published in June 2015 by theCabinet Office of the Government of Japan.
In the first half of the fiscal year ended March 31, 2015, the Japanese economy was temporarily sluggish,reflecting a decline in demand following the rush demand ahead of the consumption tax increase that took placein April 2014. Quarter-on-quarter growth rates of Japanese GDP were minus 1.7% for the period from April toJune 2014 and minus 0.5% for the period from July to September 2014. In the second half of the fiscal year, theeconomy gradually improved, supported by improvements in corporate earnings and employment situation. As aresult, Japanese GDP increased, on a quarter-on-quarter basis, by 0.3% for the period from October to December2014 and by 1.0% for the period from January to March 2015.
Private consumption, which accounts for about 58% of Japanese GDP, decreased by 3.1% for the fiscal yearended March 31, 2015. The decrease reflected a decline in demand following the rush demand ahead of theconsumption tax increase that took place in April 2014. In particular, for the period from April to June 2014,immediately after the consumption tax increase, private consumption decreased by 5.1% on a quarter-on-quarterbasis, although it increased by 0.4% on a quarter-on-quarter basis for the period from July to September 2014. Inthe second half of the fiscal year, private consumption showed some resilience, reflecting the gradualimprovement in the employment and income situation. For both periods from October to December 2014 andfrom January to March 2015, private consumption increased by 0.4% on a quarter-on-quarter basis.
Private investment, which accounts for about 16% of Japanese GDP, consists of capital investments bybusiness and private residential investments. Capital investments by business increased by 0.4% for the fiscalyear ended March 31, 2015. Capital investments by business decreased by 4.8% on a quarter-on-quarter basis forthe period from April to June 2014. Thereafter, capital investments increased, on a quarter-on-quarter basis, by0.1% for the period from July to September 2014, by 0.3% for the period from October to December 2014, andby 2.7% for the period from January to March 2015, reflecting the improvement in corporate earnings. Privateresidential investments decreased by 11.7% for the fiscal year ended March 31, 2015, due to a decline in demandfollowing the rush demand ahead of the consumption tax increase in April 2014. For the periods from April toJune 2014 and July to September 2014, private residential investments decreased, on a quarter-on-quarter basis,by 10.8% and 6.4%, respectively. Thereafter, the decrease slowed and the quarter-on-quarter growth rate ofprivate residential investments was minus 0.6% for the period from October to December 2014. Then, for theperiod from January to March 2015, private residential investments increased by 1.7% on a quarter-on-quarterbasis.
Changes in private inventories contributed 0.5 percentage points to Japanese GDP growth for the fiscal yearended March 31, 2015. For the period from April to June 2014, changes in private inventories contributed
57

1.3 percentage points to Japanese GDP growth on a quarter-on-quarter basis. However, changes in privateinventories pulled down Japanese GDP growth, on a quarter-on-quarter basis, by 0.7 percentage points for theperiod from July to September 2014 and by 0.2 percentage points for the period from October to December 2014.Thereafter, for the period from January to March 2015, changes in private inventories contributed 0.6 percentagepoints to Japanese GDP growth on a quarter-on-quarter basis.
The ratio of exports of goods and services to Japanese GDP was about 17%, and exports of goods andservices increased by 8.0% for the fiscal year ended March 31, 2015. For the period from April to June 2014,exports of goods and services were almost flat on a quarter-on-quarter basis, due to a slow recovery of exports tothe U.S. and some Asian countries. However, exports of goods and services subsequently increased, on a quarter-on-quarter basis, by 1.6% for the period from July to September 2014, by 3.2% for the period from October toDecember 2014 and by 2.4% for the period from January to March 2015, reflecting the depreciation of the yenand increasing demand in the U.S. where the economy was resilient.
The ratio of imports of goods and services to Japanese GDP was about 15%, and imports of goods andservices increased by 3.7% for the fiscal year ended March 31, 2015. For the period from April to June 2014,imports of goods and services decreased by 5.2% on a quarter-on-quarter basis, due to a decline in demandfollowing the rush demand ahead of the consumption tax increase that took place in April 2014. Thereafter,imports of goods and services continued to increase, reflecting robust domestic demand. Imports of goods andservices increased, on a quarter-on-quarter basis, by 1.1% for the period from July to September 2014, by 1.4%for the period from October to December 2014 and by 2.9% for the period from January to March 2015.
Industrial production was relatively weak in the first half of the fiscal year ended March 31, 2015, butshowed some signs of improvement in the second half of the fiscal year. The momentum of recovery in industrialproduction was maintained as a whole.
The employment situation improved as a whole during the fiscal year ended March 31, 2015. The active jobopenings-to-applicants ratio continued to improve as a whole. In addition, the unemployment rate remainedrelatively low, and the unemployment rate in March 2015 was 3.4%, a decrease of 0.2% from the same month ofthe previous year, based on the Labor Force Survey by the Statistics Bureau in the Ministry of Internal Affairsand Communications. On the other hand, compensation of employees decreased by 1.6% on a quarter-on-quarterbasis for the period from April to June 2014. However, it increased by 0.6% on a quarter-on-quarter basis for theperiod from July to September 2014. It was flat on a quarter-on-quarter basis for the period from October toDecember 2014 and increased on a quarter-on-quarter basis by 0.6% for the period from January to March 2015.
Further, according to Teikoku Databank, a research institution in Japan, there were approximately 9,000corporate bankruptcies in Japan during the fiscal year ended March 31, 2015, a decrease of 10.5% from theprevious fiscal year, involving approximately ¥1.9 trillion in total liabilities, a decrease of 31.3% from theprevious fiscal year.
In Japanese financial and capital markets, the uncollateralized overnight call rate, which is the benchmarkshort-term interest rate, remained at relatively low levels during the fiscal year ended March 31, 2015, due to theongoing provision of ample funds by the BOJ. The yield on newly issued Japanese government bonds with amaturity of 10 years, which is the benchmark long-term interest rate, temporarily declined to the 0.1%-or-morelevel, but was around 0.4% at March 31, 2015.
The Nikkei Stock Average, which is a price-weighted average of 225 stocks listed on the Tokyo StockExchange First Section, rose from ¥14,827.83 at March 31, 2014 to ¥19,206.99 at March 31, 2015. It stood at¥19,754.36 at March 23, 2015, its highest closing level since April 2000.
The yen depreciated against the U.S. dollar from ¥102.98 at March 31, 2014 to ¥120.21 at March 31, 2015,according to the statistical data published by the BOJ. Thereafter, the yen exchange rate against the U.S. dollar atJune 30, 2015 was ¥122.25.
58

The global economy gradually headed toward recovery for the fiscal year ended March 31, 2015. Theeconomies of developed countries, including the U.S. and certain European countries, continued to recovergradually, in spite of slower growth in some emerging economies. For further information on exposures tocertain European countries, see “Item 5.A. Operating Results—Financial Condition—Exposures to SelectedEuropean Countries.”
The U.S. economy continued to recover for the fiscal year ended March 31, 2015, led by domestic demand.However, the pace of the recovery slowed down toward the end of the fiscal year due to the strong dollar andlower oil prices, which led to a slowdown in U.S. oil production and related investments. The European economycontinued to recover due to a pick-up in private consumption, although it showed some signs of leveling off inthe middle of the fiscal year. China’s economic growth slowed down, and the growth momentum in other Asianeconomies as a whole continued to be slow for the fiscal year ended March 31, 2015.
In addition to economic factors and conditions, we expect that our results of operations and financialcondition will be significantly affected by regulatory trends.
To address perceived weaknesses in financial regulation revealed by the global financial crisis, regulatoryauthorities in Japan and foreign countries have been and may continue taking significant steps to enhanceregulation of the financial sector. The BCBS and other international bodies are leading efforts to formulateenhanced regulations, including in the areas of capital adequacy and liquidity. The BCBS published the Basel IIIrules text in December 2010, reflecting agreement on global regulatory standards on capital adequacy andliquidity of internationally active banks. The new rules started to be phased in on January 1, 2013 and will befully applied from January 2019. To reflect the principal risk-weighted capital measures of the Basel III rulestext, the FSA has promulgated new capital adequacy requirements which started to be phased in on March 31,2013 and will be fully applied from March 31, 2019. For a more detailed description of the capital adequacy rulesbased on Basel III, see “Item 4.B. Business Overview—Regulations in Japan.”
In the United States, the Dodd-Frank Act which was enacted in July 2010, provides a broad framework forsignificant regulatory changes across most areas of U.S. financial regulation. The Dodd-Frank Act addresses,among other issues, systemic risk oversight, bank capital standards, the resolution of failing systemicallysignificant U.S. financial institutions, OTC derivatives, the ability of banking entities to engage in proprietarytrading activities and invest in hedge funds and private equity funds, consumer and investor protection, hedgefund registration, and securitization. For a more detailed description of the Dodd-Frank Act, see “Item 4.B.Business Overview—Regulations in the United States.”
For a more detailed description of regulations to which we are subject, risks associated with regulatorydevelopment and our management policy under this environment, see “Item 3.D. Risk Factors—Risks Related toOur Business, and Risks Related to Our Industry,” “Item 4.B. Business Overview—Regulations in Japan,Regulations in the United States, Regulations in Other Jurisdictions and Description of Operations and PrincipalActivities—Management Policies.”
Factors Affecting Results of Operation
Income (Loss)
We have three principal sources of operating income: net interest income, net fee and commission income,and net income from trading/investment securities.
Net Interest Income. Net interest income, or the difference between interest income and interest expense, isdetermined by:
• the amount of interest-earning assets and interest-bearing liabilities;
• the interest spread;
59
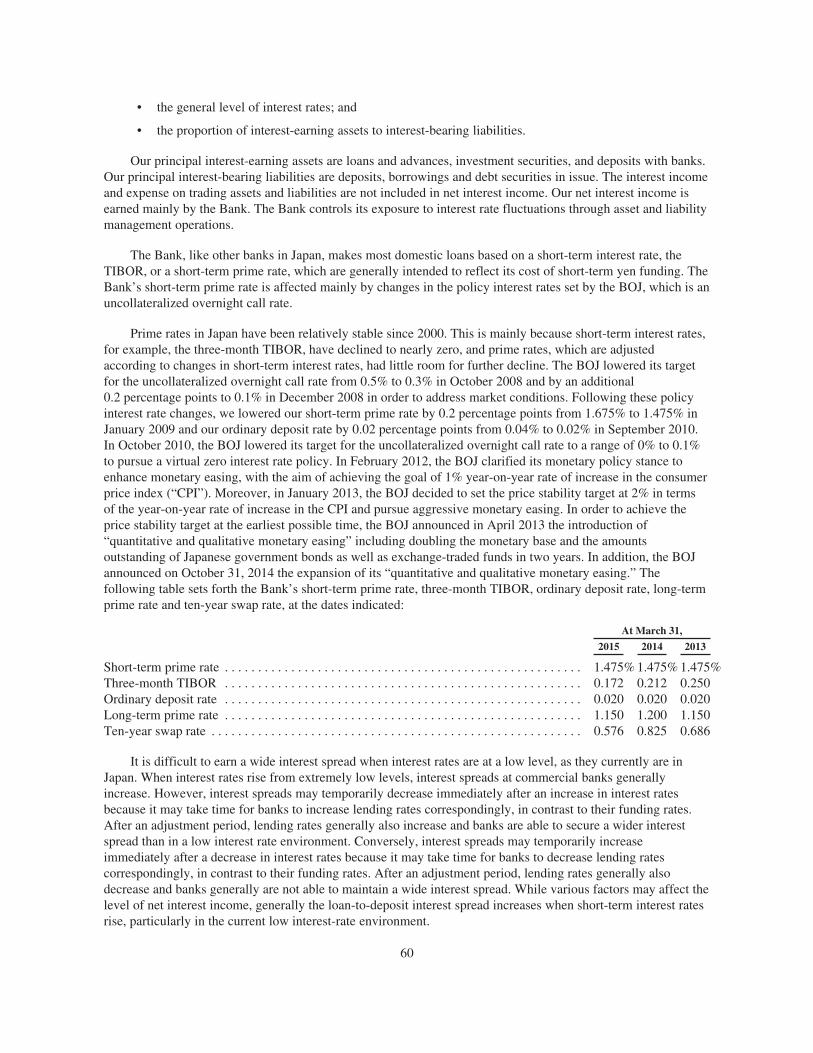
• the general level of interest rates; and
• the proportion of interest-earning assets to interest-bearing liabilities.
Our principal interest-earning assets are loans and advances, investment securities, and deposits with banks.Our principal interest-bearing liabilities are deposits, borrowings and debt securities in issue. The interest incomeand expense on trading assets and liabilities are not included in net interest income. Our net interest income isearned mainly by the Bank. The Bank controls its exposure to interest rate fluctuations through asset and liabilitymanagement operations.
The Bank, like other banks in Japan, makes most domestic loans based on a short-term interest rate, theTIBOR, or a short-term prime rate, which are generally intended to reflect its cost of short-term yen funding. TheBank’s short-term prime rate is affected mainly by changes in the policy interest rates set by the BOJ, which is anuncollateralized overnight call rate.
Prime rates in Japan have been relatively stable since 2000. This is mainly because short-term interest rates,for example, the three-month TIBOR, have declined to nearly zero, and prime rates, which are adjustedaccording to changes in short-term interest rates, had little room for further decline. The BOJ lowered its targetfor the uncollateralized overnight call rate from 0.5% to 0.3% in October 2008 and by an additional0.2 percentage points to 0.1% in December 2008 in order to address market conditions. Following these policyinterest rate changes, we lowered our short-term prime rate by 0.2 percentage points from 1.675% to 1.475% inJanuary 2009 and our ordinary deposit rate by 0.02 percentage points from 0.04% to 0.02% in September 2010.In October 2010, the BOJ lowered its target for the uncollateralized overnight call rate to a range of 0% to 0.1%to pursue a virtual zero interest rate policy. In February 2012, the BOJ clarified its monetary policy stance toenhance monetary easing, with the aim of achieving the goal of 1% year-on-year rate of increase in the consumerprice index (“CPI”). Moreover, in January 2013, the BOJ decided to set the price stability target at 2% in termsof the year-on-year rate of increase in the CPI and pursue aggressive monetary easing. In order to achieve theprice stability target at the earliest possible time, the BOJ announced in April 2013 the introduction of“quantitative and qualitative monetary easing” including doubling the monetary base and the amountsoutstanding of Japanese government bonds as well as exchange-traded funds in two years. In addition, the BOJannounced on October 31, 2014 the expansion of its “quantitative and qualitative monetary easing.” Thefollowing table sets forth the Bank’s short-term prime rate, three-month TIBOR, ordinary deposit rate, long-termprime rate and ten-year swap rate, at the dates indicated:
At March 31,
2015 2014 2013
Short-term prime rate . . . . . . . . . . . . . . . . . . . . . . . . . . . . . . . . . . . . . . . . . . . . . . . . . . . . . . 1.475% 1.475% 1.475%Three-month TIBOR . . . . . . . . . . . . . . . . . . . . . . . . . . . . . . . . . . . . . . . . . . . . . . . . . . . . . . 0.172 0.212 0.250Ordinary deposit rate . . . . . . . . . . . . . . . . . . . . . . . . . . . . . . . . . . . . . . . . . . . . . . . . . . . . . . 0.020 0.020 0.020Long-term prime rate . . . . . . . . . . . . . . . . . . . . . . . . . . . . . . . . . . . . . . . . . . . . . . . . . . . . . . 1.150 1.200 1.150Ten-year swap rate . . . . . . . . . . . . . . . . . . . . . . . . . . . . . . . . . . . . . . . . . . . . . . . . . . . . . . . . 0.576 0.825 0.686
It is difficult to earn a wide interest spread when interest rates are at a low level, as they currently are inJapan. When interest rates rise from extremely low levels, interest spreads at commercial banks generallyincrease. However, interest spreads may temporarily decrease immediately after an increase in interest ratesbecause it may take time for banks to increase lending rates correspondingly, in contrast to their funding rates.After an adjustment period, lending rates generally also increase and banks are able to secure a wider interestspread than in a low interest rate environment. Conversely, interest spreads may temporarily increaseimmediately after a decrease in interest rates because it may take time for banks to decrease lending ratescorrespondingly, in contrast to their funding rates. After an adjustment period, lending rates generally alsodecrease and banks generally are not able to maintain a wide interest spread. While various factors may affect thelevel of net interest income, generally the loan-to-deposit interest spread increases when short-term interest ratesrise, particularly in the current low interest-rate environment.
60

Net Fee and Commission Income. We earn fees and commissions from a variety of services. The primarycomponents of the Bank’s net fee and commission income are fees and commissions related to moneyremittances and transfers, investment trusts, loans (such as loan commitment fees and loan arrangement fees),securities transactions (such as bond trustee fees and bond recording agency fees) and guarantees andacceptances. Other fees and commissions include fees from investment banking and electronic banking.
In addition, we earn a significant amount of fees and commissions from our credit card business, conductedthrough Sumitomo Mitsui Card and Cedyna, and from our securities business, conducted through SMBC NikkoSecurities and SMBC Friend Securities. The principal components of Sumitomo Mitsui Card’s and Cedyna’s feesand commissions are membership fees from retailers and annual cardholder membership fees, while those ofSMBC Nikko Securities’ and SMBC Friend Securities’ fees and commissions are subscription and agentcommissions from investment trusts and underwriting commissions.
The principal factors affecting fees and commissions are the demand for the services provided, the feescharged for those services and fees charged by competitors for similar services. The volume of services providedalso affects profitability, as our fee businesses have significant economies of scale. In order to diversify sourcesof revenue and enhance return on assets, we are expanding our fees and commissions businesses, including salesof investment trusts and life insurance products, and investment banking businesses.
Net Income from Trading/Investment Securities. We undertake significant trading activities involving avariety of financial instruments, including derivatives. Our income from these activities is subject to volatilitycaused by, among other things, changes in interest rates, foreign exchange rates, equity prices or other marketvariables. Any unexpected change in interest rates could affect the fair value of our interest rate derivativepositions and our net income from trading activities. Net trading income consists of margins made on market-making and our customer business as well as changes in fair value of trading assets and liabilities and derivativefinancial instruments. It also includes net interest and dividend income on these instruments.
We have substantial investments in debt securities as available-for-sale financial assets. In particular,Japanese government bonds represent a significant part of our bond portfolio. We also own debt securitiesdenominated in foreign currencies, principally the U.S. dollars. We also have investments in equity securities asavailable-for-sale financial assets, which include our strategic investments in stocks issued by our customers. Netinvestment income includes the gains and losses arising from the sales or redemptions of available-for-salefinancial assets and the dividend income earned from available-for-sale equity instruments. Increases in interestrates or declines in equity prices could substantially decrease the fair value of our available-for-sale financialassets.
Operating income from other than these three principal sources is included in “Net income from financialassets at fair value through profit or loss” or “Other income.” Net income from financial assets at fair valuethrough profit or loss includes gains and losses arising from sales and the change in the fair value of theinstruments such as hybrid instruments classified as financial assets at fair value through profit or loss. It alsoincludes interest and dividend income on these instruments. Other income consists primarily of income fromoperating leases conducted by SMFL and income related to IT solution services.
Expenses
Impairment Charges on Financial Assets. Our impairment charges are recorded primarily due to impairmenton loans and advances and on investment securities.
Impairment charges on loans and advances are affected by the economic environment and financialconditions of borrowers. During periods of economic slowdown, corporate and individual borrowers aregenerally more likely to suffer credit rating downgrades, or become delinquent or default on their borrowings.The slowdown in the domestic or global economy may increase credit costs relating to a wide range of industries.
61
Declines in market prices for domestic and foreign investment securities may result in our recordingimpairment charges. We assess at the end of each reporting period whether there is any objective evidence that afinancial asset or a group of financial assets is impaired. In the case of equity instruments classified as available-for-sale, a significant or prolonged decline in the fair value of the instrument below its cost is also considered tobe such evidence in determining whether the assets are impaired. If any such evidence exists for available-for-sale financial assets, the cumulative loss, measured as the difference between the cost and the current fair valueless any impairment charges on that financial asset previously recognized in profit or loss, is removed fromequity and recognized in profit or loss.
General and Administrative Expenses. General and administrative expenses consist primarily of personnelexpenses (salaries and related expenses), depreciation and amortization expenses, and other expenses (rent andlease expenses, premiums for deposit insurance, publicity and advertising expenses, and communicationexpenses).
Other Expenses. Other expenses consist primarily of cost of operating leases, costs related to IT solutionservices and IT systems, losses on disposal of property, plant and equipment, and other intangible assets, andimpairment losses of property, plant and equipment.
Unrealized Gains or Losses on Investment Securities Portfolio
Changes in the fair value of domestic and foreign investment securities result in an increase or a decrease inunrealized gains or losses on available-for-sale financial assets. Unrealized gains or losses arising from changesin the fair value of the investments in these securities are recognized directly in equity, until they arederecognized or impaired.
Most of our domestic equity instruments consist of publicly traded Japanese stocks. The Nikkei StockAverage increased by 19.6% from ¥12,397.91 at March 29, 2013, to ¥14,827.83 at March 31, 2014, andincreased by 29.5% to ¥19,206.99 at March 31, 2015. At March 31, 2015, we had net unrealized gains ondomestic equity securities of ¥3,031,726 million, an increase of ¥1,005,748 million from ¥2,025,978 million atMarch 31, 2014. For more information, see “Item 5.A. Operating Results—Financial Condition—InvestmentSecurities.”
Strengthening of Equity Capital
In response to the imposition of more stringent regulatory capital requirements, we have been taking aproactive approach to managing our risk-weighted capital ratio by focusing on increasing qualifying capital,including by building up our retained earnings, identifying risks, and controlling risk-weighted assets.
Foreign Currency Fluctuations
The average exchange rate used to convert dollars to yen in the consolidated financial statements includedelsewhere in this annual report for the fiscal year ended March 31, 2015 was ¥109.76 per $1.00, compared to theprevious fiscal year’s average exchange rate of ¥100.17 per $1.00. The percentage of revenue we earned fromour foreign operations for the fiscal years ended March 31, 2015 and 2014 was 24% and 22%, respectively. Formore information, see “Item 4.B. Business Overview—Revenues by Region.”
Critical Accounting Estimates and Judgments
Our financial position and results of operations are influenced by estimates and judgments that managementemploys in the course of preparation of our consolidated financial statements. We identified the following areasof significant accounting policies to be particularly sensitive in terms of estimates and judgments made bymanagement. Estimates and judgments are continually evaluated based on historical experience and other factors,including expectations of future events that are believed to be reasonable.
62
Allowance for Loan Losses
Allowance for loan losses represents management’s estimate of the losses incurred in the loan portfolios atthe end of each reporting period. Management exercises judgments in making assumptions and estimations whencalculating the allowance for loan losses on both individually and collectively assessed loans.
The allowance for loan losses for individually significant impaired loans is estimated by management basedon the expected future cash flows, taking into account factors such as historical loss information, theappropriateness of the borrower’s business plan or operational improvement plan, the status of progress of itsplan, the overall support from financial institutions, and the realizable value of any collateral held. The allowancefor loan losses is the difference between the carrying amount of a loan and the discounted present value ofexpected future cash flows that are estimated by management. The actual future cash flows may differ from theestimates by management and consequently may cause actual loan losses to differ from the reported allowancefor loan losses.
The allowance for loan losses for impaired loans that are not individually significant and non-impaired loansis collectively calculated based on the historical loss experience for loans which have similar credit riskcharacteristics to those in the current loan portfolio using statistical methods. These statistical methods aresubject to estimation uncertainty. In normal circumstances, the use of statistical methods evidenced by historicalinformation provides the most objective methodology in assessing inherent losses on loans with similar creditrisk characteristics. However, in certain circumstances, the use of historical loss experience alone may not berepresentative of current loss experiences and as a result it may provide less relevant information about the lossincurred in a given portfolio at the end of the reporting period, particularly in a situation where there have beenchanges in economic conditions. In these circumstances, we make a judgment to update the historical lossexperience based on the most recent loss information, taking into account, among others, the effect of the currenteconomic environment. To estimate the allowance for loan losses for non-impaired loans, which reflects incurredbut not yet identified losses for the period between the impairment occurring and the loss being identified,management develops assumptions and methodologies to estimate the loss identification period.
Management estimates and judgments may change from time to time as the economic environment changesor new information becomes available. Changes in these estimates and judgments will result in a differentallowance for loan losses and may have a direct impact on impairment charges. Impairment charges on loans andadvances amounting to ¥79,552 million and ¥138,375 million were recognized for the fiscal years endedMarch 31, 2015 and 2013 respectively, whereas previously recognized impairment charges on loans andadvances amounting to ¥25,806 million were reversed for the fiscal year ended March 31, 2014.
Fair Value of Financial Instruments
Some of our financial instruments are measured at fair value with changes in fair value recognized in profitor loss, such as trading assets and liabilities, financial assets at fair value through profit or loss, and derivativefinancial instruments. Available-for-sale financial assets are also measured at fair value with changes in fairvalue reported in other comprehensive income.
The fair value of a financial instrument is the price that would be received to sell an asset or paid to transfera liability in an orderly transaction between market participants at the measurement date. Our financial assets andliabilities measured at fair value are mostly valued based on quoted prices in active markets, or using valuationtechniques that incorporate inputs, other than quoted market prices, that are observable either directly orindirectly in the market, including dealers’ quotes. We principally use valuation techniques that are commonlyused by market participants to price the instruments. To the extent practical, the valuation models makemaximum use of observable data. However, for certain financial assets and liabilities, the fair values aremeasured by using valuation techniques with significant unobservable inputs. In such cases, significantmanagement estimates are made, resulting in a less objective measurement of fair value.
63

The risk management departments in each subsidiary regularly review significant valuation methodologiesand recalibrate model parameters and inputs, both observable and unobservable, in an effort to ensure anappropriate estimation of fair value has been made. Where significant management judgments are required invaluation, we establish a valuation control framework to validate the valuation models and fair values calculatedbased on such valuation models. Under the framework, the accounting department is responsible for ensuring thatthe accounting policies and procedures to determine the fair values are in compliance with the relevantaccounting standards.
If the fair value at the trade date, which is measured using a valuation technique with significantunobservable inputs, differs from the transaction price, any gain or loss on the trade date is adjusted to bedeferred. Management judgment is required to determine whether significant unobservable inputs exist in thevaluation technique.
The financial assets and liabilities are classified into one of three levels within a fair value hierarchy basedon the inputs used in the fair value measurement. The three levels of the fair value hierarchy are as follows:
• Level 1. Quoted prices (unadjusted) in active markets for identical assets or liabilities that the entity canaccess at the measurement date;
• Level 2. Inputs other than quoted prices included within Level 1 that are observable for the asset orliability, either directly or indirectly; and
• Level 3. Significant unobservable inputs for the asset or liability.
Management judgment is involved in determining the level of hierarchy to which each financial instrumentshould be categorized and in periodical assessments of market liquidity for inputs and price transparency.
In addition to the fair value hierarchy disclosure, we provide a sensitivity analysis of the impact on theLevel 3 financial instruments carried at fair value by using reasonably possible alternatives for the unobservableparameters in Note 43 “Fair Value of Financial Assets and Liabilities” to our consolidated financial statementsincluded elsewhere in this annual report. The determination of reasonably possible alternatives requiressignificant management judgment.
Impairment of Available-for-sale Financial Assets
Available-for-sale financial assets are measured at fair value with changes in fair value reported inavailable-for-sale financial assets reserve as a separate component of equity until the financial assets are eitherderecognized or become impaired. If there is objective evidence of impairment as a result of loss events whichhave an impact on the estimated future cash flows of the financial assets that can be reliably estimated, thecumulative loss previously recognized in equity is removed and recognized in profit or loss as an impairmentcharge.
We exercise judgment in determining whether there is objective evidence of occurrence of loss events whichresult in a decrease in estimated future cash flows. The estimation of future cash flows also requires judgment. Inthe assessment of impairment of available-for-sale equity instruments, we also consider whether there has been asignificant or prolonged decline in fair value below their cost. The determination of what is a significant orprolonged decline requires management judgment.
Impairment may occur when there is objective evidence of deterioration in the financial conditions of theinvestee, industry and sector performance, or changes in operating and financing cash flows. The determinationof impairment in this respect also includes significant management judgment.
Management estimates and judgments may change from time to time upon future events that may or maynot occur and changes in these estimates and judgments could adversely affect the carrying amounts of available-
64

for-sale financial assets. Impairment charges on available-for-sale financial assets reclassified from equity toprofit or loss totaled ¥10,586 million, ¥11,531 million and ¥131,770 million for the fiscal years ended March 31,2015, 2014 and 2013, respectively.
Impairment of Goodwill
Goodwill is tested for impairment at least annually and whenever events or changes in circumstancesindicate that it may be impaired. The first step of the impairment test is identifying the cash-generating units(“CGUs”), which represent the smallest identifiable groups of assets that generate cash inflows that are largelyindependent of the cash inflows from other assets or groups of assets. Goodwill is then allocated to the CGUs,considering how the goodwill is recognized and other relevant factors.
In the impairment test, the carrying amount of the CGU to which goodwill is allocated is compared againstits recoverable amount, which is the higher of its fair value less costs to sell and its value in use. Suchrecoverable amounts are determined based on significant management judgments and assumptions.
We determine the recoverable amount using the estimated future cash flows, pre-tax discount rates, growthrates and other factors. The estimation of future cash flows inherently reflects management judgments, eventhough such forecasts are prepared taking into account actual past performance and external economic data. Thepre-tax discount rates and growth rates may be significantly affected by market interest rates or other marketconditions, which are beyond management’s control, and therefore significant management judgments are madeto determine these assumptions.
These management judgments are made based on the facts and circumstances at the time of the impairmenttest, and may vary depending on the situation and time. Changes in management judgments may result indifferent impairment test results and different impairment losses recognized. There were no impairment lossesrecognized on goodwill for the fiscal years ended March 31, 2015, 2014 and 2013.
Provision for Interest Repayment
Provision for interest repayment represents management’s estimate of future claims for the refund of grayzone interest, taking into account historical experience such as the number of customer claims for a refund, theamount of repayments and the characteristics of customers, and the length of the period during which claims areexpected to be received in the future.
Management estimates and judgments may change from time to time as the legal environment and marketconditions change or new information becomes available. Changes in these estimates and judgments could affectthe balance of provision for interest repayment. Provision for interest repayment is recorded in provisions as aliability, and it totaled ¥166,715 million and ¥189,993 million at March 31, 2015 and 2014, respectively.
Retirement Benefits
We have defined benefit plans such as defined benefit pension plans and lump-sum severance indemnityplans. The present value of the defined benefit obligation is calculated based on actuarial valuations that aredependent upon a number of assumptions, including discount rates, mortality rates and future salary (benefit)increases. The discount rates are equivalent to market yields of AA credit-rated corporate bonds that have termsto maturity approximating those of the related obligations. Future mortality rates are based on the officialmortality table generally used for actuarial assumptions in Japan. Other assumptions used for the calculation ofthe defined benefit obligation are based on historical records. Due to the long-term nature of these plans, suchestimates are subject to significant uncertainty. While we believe that these assumptions are appropriate, anychange in these assumptions will impact actuarial gains and losses, as well as the present value of the definedbenefit obligations and the net retirement benefit expense for each period. Actuarial gains and losses arising from
65

experience adjustments and changes in actuarial assumptions in the year, and return on plan assets excludinginterest income are recognized in other comprehensive income and are never reclassified to profit or loss.
The difference between the fair value of the plan assets and the present value of the defined benefitobligation at the end of the reporting period is recognized as assets and liabilities in the consolidated statement offinancial position. When this calculation for each plan results in a benefit to us, the recognized asset is limited tothe present value of any economic benefits available in the form of refunds from the plan or reductions in futurecontributions to the plan. An economic benefit is available to us, if it is realizable during the life of the plan or onsettlement of the plan obligation. The net total of assets and liabilities in the consolidated statement of financialposition amounted to net assets of ¥332,674 million and ¥122,118 million at March 31, 2015 and 2014,respectively.
Deferred Tax Assets
We recognize deferred tax assets relating to tax losses carried forward and deductible temporary differences,only to the extent that it is probable that future taxable profit will be available against which the tax losses carriedforward and the deductible temporary differences can be utilized. This assessment requires significantmanagement judgments and assumptions. Future taxable profit is estimated based on, among other relevantfactors, forecasted results of operations, which are based on historical financial performance and the businessplans that management believes to be prudent and feasible. While we carefully assess the realization of tax lossescarried forward and deductible temporary differences, the actual taxable profit in the future may be less than theforecast. The deferred tax assets amounted to ¥117,500 million and ¥147,241 million at March 31, 2015 and2014, respectively, while the net total of deferred tax assets and liabilities amounted to net liabilities of¥446,305 million and ¥2,010 million in the consolidated statement of financial position at March 31, 2015 and2014, respectively.
New and Amended Accounting Standards and Recent Accounting Pronouncements
See “New and Amended Accounting Standards Adopted by the SMFG Group” and “Recent AccountingPronouncements” under Note 2 “Summary of Significant Accounting Policies” to our consolidated financialstatements included elsewhere in this annual report.
5.A. OPERATING RESULTS
Under the economic and financial circumstances described in “Item 5. Operating and Financial Review andProspects—Overview—Operating Environment,” we made a profit through our commercial banking and otherfinancial services businesses. Our net profit decreased by ¥169,275 million from ¥892,236 million for the fiscalyear ended March 31, 2014 to ¥722,961 million for the fiscal year ended March 31, 2015. Although our totaloperating income increased by ¥108,080 million from ¥3,224,353 million for the fiscal year ended March 31,2014 to ¥3,332,433 million for the fiscal year ended March 31, 2015, primarily due to increases in net investmentincome and other income, our net profit decreased primarily due to increases in impairment charges on financialassets and operating expenses.
Our total assets increased by ¥20,550,425 million from ¥158,631,041 million at March 31, 2014 to¥179,181,466 million at March 31, 2015, primarily due to increases in cash and deposits with banks and loansand advances.
Our total liabilities increased by ¥18,944,765 million from ¥149,215,851 million at March 31, 2014 to¥168,160,616 million at March 31, 2015, primarily due to increases in deposits, borrowings and debt securities inissue.
Our total equity increased by ¥1,605,660 million from ¥9,415,190 million at March 31, 2014 to¥11,020,850 million at March 31, 2015, primarily due to increases in retained earnings and other reserves.
66

Operating Results
The following table presents information as to our income, expenses and net profit for the fiscal years endedMarch 31, 2015, 2014 and 2013.
For the fiscal year ended March 31,
2015 2014(1) 2013(1)
(In millions, except per share data)
Interest income . . . . . . . . . . . . . . . . . . . . . . . . . . . . . . . . . . . . . . . . . . . . . ¥1,782,621 ¥1,714,044 ¥1,725,723Interest expense . . . . . . . . . . . . . . . . . . . . . . . . . . . . . . . . . . . . . . . . . . . . . 371,107 320,511 321,570
Net interest income . . . . . . . . . . . . . . . . . . . . . . . . . . . . . . . . . . . . . . . . . . 1,411,514 1,393,533 1,404,153
Fee and commission income . . . . . . . . . . . . . . . . . . . . . . . . . . . . . . . . . . . 1,002,766 1,003,169 948,685Fee and commission expense . . . . . . . . . . . . . . . . . . . . . . . . . . . . . . . . . . 129,253 127,959 127,054
Net fee and commission income . . . . . . . . . . . . . . . . . . . . . . . . . . . . . . . . 873,513 875,210 821,631
Net trading income . . . . . . . . . . . . . . . . . . . . . . . . . . . . . . . . . . . . . . . . . . 127,759 135,218 105,302Net income from financial assets at fair value through profit or loss . . . . 22,678 58,586 15,794Net investment income . . . . . . . . . . . . . . . . . . . . . . . . . . . . . . . . . . . . . . . 371,064 332,265 223,404Other income . . . . . . . . . . . . . . . . . . . . . . . . . . . . . . . . . . . . . . . . . . . . . . . 525,905 429,541 324,403
Total operating income . . . . . . . . . . . . . . . . . . . . . . . . . . . . . . . . . . . . . . 3,332,433 3,224,353 2,894,687
Impairment charges (reversals) on financial assets . . . . . . . . . . . . . . . . . . 90,138 (14,275) 270,145
Net operating income . . . . . . . . . . . . . . . . . . . . . . . . . . . . . . . . . . . . . . . 3,242,295 3,238,628 2,624,542
General and administrative expenses . . . . . . . . . . . . . . . . . . . . . . . . . . . . 1,621,897 1,522,990 1,447,116Other expenses . . . . . . . . . . . . . . . . . . . . . . . . . . . . . . . . . . . . . . . . . . . . . 505,614 428,780 287,896
Operating expenses . . . . . . . . . . . . . . . . . . . . . . . . . . . . . . . . . . . . . . . . . 2,127,511 1,951,770 1,735,012
Share of post-tax profit of associates and joint ventures . . . . . . . . . . . . . . 18,124 19,454 19,593
Profit before tax . . . . . . . . . . . . . . . . . . . . . . . . . . . . . . . . . . . . . . . . . . . . 1,132,908 1,306,312 909,123
Income tax expense . . . . . . . . . . . . . . . . . . . . . . . . . . . . . . . . . . . . . . . . . . 409,947 414,076 255,300
Net profit . . . . . . . . . . . . . . . . . . . . . . . . . . . . . . . . . . . . . . . . . . . . . . . . . ¥ 722,961 ¥ 892,236 ¥ 653,823
Profit attributable to:Shareholders of Sumitomo Mitsui Financial Group, Inc. . . . . . . . . . ¥ 614,070 ¥ 766,388 ¥ 535,976Non-controlling interests . . . . . . . . . . . . . . . . . . . . . . . . . . . . . . . . . . 108,891 125,848 117,847
Earnings per share:Basic . . . . . . . . . . . . . . . . . . . . . . . . . . . . . . . . . . . . . . . . . . . . . . . . . ¥ 449.13 ¥ 560.97 ¥ 395.87Diluted . . . . . . . . . . . . . . . . . . . . . . . . . . . . . . . . . . . . . . . . . . . . . . . . 448.86 560.68 395.32
(1) Comparative information has been restated to reflect the adoption of IFRIC Interpretation 21 “Levies.” For more information, see Note 2“Summary of Significant Accounting Policies—New and Amended Accounting Standards Adopted by the SMFG Group” to ourconsolidated financial statements included elsewhere in this annual report.
Fiscal Year Ended March 31, 2015 Compared to Fiscal Year Ended March 31, 2014
Total operating income increased by ¥108,080 million, or 3%, from ¥3,224,353 million for the fiscal yearended March 31, 2014 to ¥3,332,433 million for the fiscal year ended March 31, 2015, primarily due to increasesin net investment income of ¥38,799 million and other income of ¥96,364 million as discussed in detail below.Although impairment charges on financial assets increased, net operating income also increased by¥3,667 million from ¥3,238,628 million for the fiscal year ended March 31, 2014 to ¥3,242,295 million for thefiscal year ended March 31, 2015, due to the increase in total operating income described above.
67
Net profit decreased by ¥169,275 million from ¥892,236 million for the fiscal year ended March 31, 2014 to¥722,961 million for the fiscal year ended March 31, 2015, as a result of increases in general and administrativeexpenses and other expenses.
Fiscal Year Ended March 31, 2014 Compared to Fiscal Year Ended March 31, 2013
Total operating income increased by ¥329,666 million, or 11%, from ¥2,894,687 million for the fiscal yearended March 31, 2013 to ¥3,224,353 million for the fiscal year ended March 31, 2014, primarily due to increasesin net investment income of ¥108,861 million and other income of ¥105,138 million as discussed in detail below.In addition, due to a decrease in impairment charges on financial assets, net operating income increased by¥614,086 million from ¥2,624,542 million for the fiscal year ended March 31, 2013 to ¥3,238,628 million for thefiscal year ended March 31, 2014.
Net profit increased by ¥238,413 million from ¥653,823 million for the fiscal year ended March 31, 2013 to¥892,236 million for the fiscal year ended March 31, 2014, as a result of the increase in net operating incomedescribed above, which was partially offset by increases in operating expenses and income tax expenses.
68
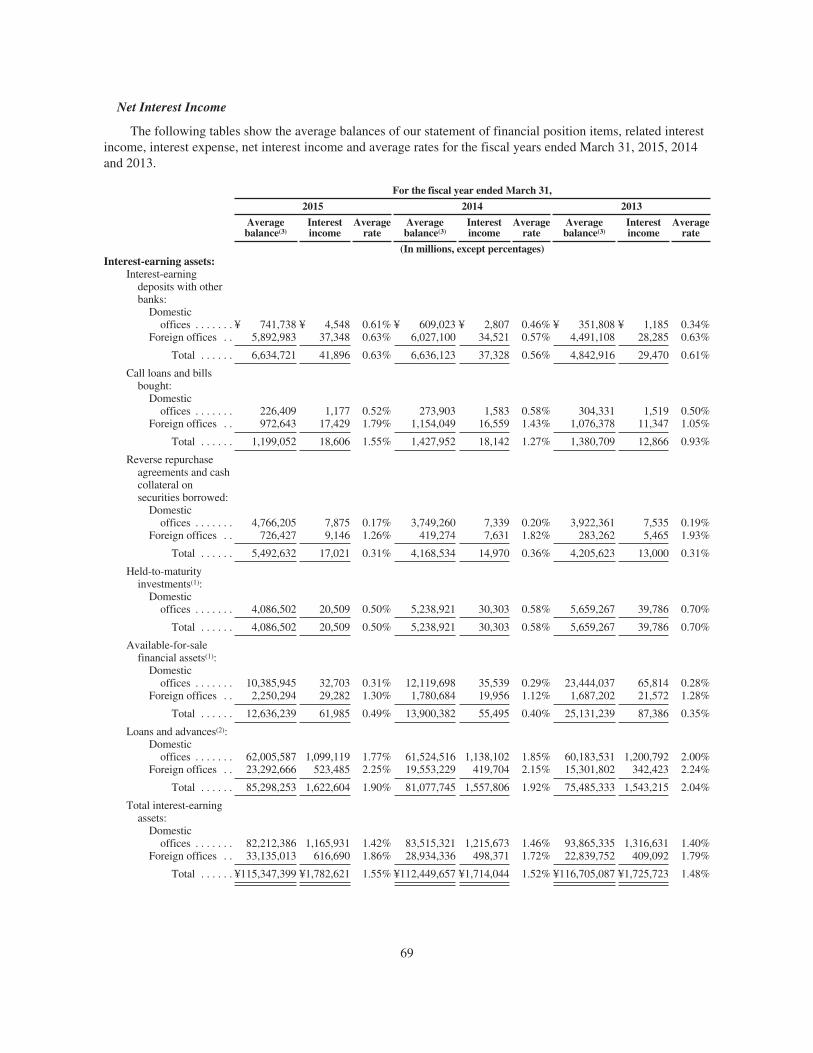
Net Interest Income
The following tables show the average balances of our statement of financial position items, related interestincome, interest expense, net interest income and average rates for the fiscal years ended March 31, 2015, 2014and 2013.
For the fiscal year ended March 31,
2015 2014 2013
Averagebalance(3)
Interestincome
Averagerate
Averagebalance(3)
Interestincome
Averagerate
Averagebalance(3)
Interestincome
Averagerate
(In millions, except percentages)Interest-earning assets:
Interest-earningdeposits with otherbanks:
Domesticoffices . . . . . . . ¥ 741,738 ¥ 4,548 0.61% ¥ 609,023 ¥ 2,807 0.46% ¥ 351,808 ¥ 1,185 0.34%
Foreign offices . . 5,892,983 37,348 0.63% 6,027,100 34,521 0.57% 4,491,108 28,285 0.63%
Total . . . . . . 6,634,721 41,896 0.63% 6,636,123 37,328 0.56% 4,842,916 29,470 0.61%
Call loans and billsbought:
Domesticoffices . . . . . . . 226,409 1,177 0.52% 273,903 1,583 0.58% 304,331 1,519 0.50%
Foreign offices . . 972,643 17,429 1.79% 1,154,049 16,559 1.43% 1,076,378 11,347 1.05%
Total . . . . . . 1,199,052 18,606 1.55% 1,427,952 18,142 1.27% 1,380,709 12,866 0.93%
Reverse repurchaseagreements and cashcollateral onsecurities borrowed:
Domesticoffices . . . . . . . 4,766,205 7,875 0.17% 3,749,260 7,339 0.20% 3,922,361 7,535 0.19%
Foreign offices . . 726,427 9,146 1.26% 419,274 7,631 1.82% 283,262 5,465 1.93%
Total . . . . . . 5,492,632 17,021 0.31% 4,168,534 14,970 0.36% 4,205,623 13,000 0.31%
Held-to-maturityinvestments(1):
Domesticoffices . . . . . . . 4,086,502 20,509 0.50% 5,238,921 30,303 0.58% 5,659,267 39,786 0.70%
Total . . . . . . 4,086,502 20,509 0.50% 5,238,921 30,303 0.58% 5,659,267 39,786 0.70%
Available-for-salefinancial assets(1):
Domesticoffices . . . . . . . 10,385,945 32,703 0.31% 12,119,698 35,539 0.29% 23,444,037 65,814 0.28%
Foreign offices . . 2,250,294 29,282 1.30% 1,780,684 19,956 1.12% 1,687,202 21,572 1.28%
Total . . . . . . 12,636,239 61,985 0.49% 13,900,382 55,495 0.40% 25,131,239 87,386 0.35%
Loans and advances(2):Domestic
offices . . . . . . . 62,005,587 1,099,119 1.77% 61,524,516 1,138,102 1.85% 60,183,531 1,200,792 2.00%Foreign offices . . 23,292,666 523,485 2.25% 19,553,229 419,704 2.15% 15,301,802 342,423 2.24%
Total . . . . . . 85,298,253 1,622,604 1.90% 81,077,745 1,557,806 1.92% 75,485,333 1,543,215 2.04%
Total interest-earningassets:
Domesticoffices . . . . . . . 82,212,386 1,165,931 1.42% 83,515,321 1,215,673 1.46% 93,865,335 1,316,631 1.40%
Foreign offices . . 33,135,013 616,690 1.86% 28,934,336 498,371 1.72% 22,839,752 409,092 1.79%
Total . . . . . . ¥115,347,399 ¥1,782,621 1.55% ¥112,449,657 ¥1,714,044 1.52% ¥116,705,087 ¥1,725,723 1.48%
69

For the fiscal year ended March 31,
2015 2014 2013
Averagebalance(3)
Interestexpense
Averagerate
Averagebalance(3)
Interestexpense
Averagerate
Averagebalance(3)
Interestexpense
Averagerate
(In millions, except percentages)Interest-bearing liabilities:
Deposits:Domestic
offices . . . . . . . ¥ 74,397,836 ¥ 49,356 0.07% ¥ 72,376,165 ¥ 48,446 0.07% ¥ 70,452,092 ¥ 51,975 0.07%Foreign offices . . . 21,263,919 116,211 0.55% 17,014,587 91,944 0.54% 12,801,814 71,403 0.56%
Total . . . . . . . 95,661,755 165,567 0.17% 89,390,752 140,390 0.16% 83,253,906 123,378 0.15%
Call money and billssold:
Domesticoffices . . . . . . . 2,040,724 1,504 0.07% 1,497,244 1,222 0.08% 1,233,733 1,039 0.08%
Foreign offices . . . 877,127 2,510 0.29% 651,839 2,261 0.35% 642,899 3,098 0.48%
Total . . . . . . . 2,917,851 4,014 0.14% 2,149,083 3,483 0.16% 1,876,632 4,137 0.22%
Repurchase agreementsand cash collateralon securities lent:
Domesticoffices . . . . . . . 5,584,584 6,091 0.11% 4,167,460 4,558 0.11% 4,970,577 7,781 0.16%
Foreign offices . . . 1,455,125 3,829 0.26% 990,721 2,989 0.30% 1,079,763 4,228 0.39%
Total . . . . . . . 7,039,709 9,920 0.14% 5,158,181 7,547 0.15% 6,050,340 12,009 0.20%
Borrowings:Domestic
offices . . . . . . . 9,170,288 54,915 0.60% 5,879,723 50,833 0.86% 6,999,912 63,926 0.91%Foreign offices . . . 790,516 16,122 2.04% 787,217 17,433 2.21% 808,775 21,293 2.63%
Total . . . . . . . 9,960,804 71,037 0.71% 6,666,940 68,266 1.02% 7,808,687 85,219 1.09%
Debt securities in issue:Domestic
offices . . . . . . . 7,000,273 109,960 1.57% 6,223,653 92,481 1.49% 5,804,668 87,980 1.52%Foreign offices . . . 2,819,687 9,829 0.35% 2,355,748 7,636 0.32% 1,884,813 8,132 0.43%
Total . . . . . . . 9,819,960 119,789 1.22% 8,579,401 100,117 1.17% 7,689,481 96,112 1.25%
Other interest-bearingliabilities:
Domesticoffices . . . . . . . 96,873 731 0.75% 90,049 689 0.77% 81,915 683 0.83%
Foreign offices . . . 3,025 49 1.62% 2,898 19 0.66% 7,732 32 0.41%
Total . . . . . . . 99,898 780 0.78% 92,947 708 0.76% 89,647 715 0.80%
Total interest-bearingliabilities:
Domesticoffices . . . . . . . 98,290,578 222,557 0.23% 90,234,294 198,229 0.22% 89,542,897 213,384 0.24%
Foreign offices . . . 27,209,399 148,550 0.55% 21,803,010 122,282 0.56% 17,225,796 108,186 0.63%
Total . . . . . . . ¥125,499,977 ¥ 371,107 0.30% ¥112,037,304 ¥ 320,511 0.29% ¥106,768,693 ¥ 321,570 0.30%
Net interest income andinterest rate spread. . . . . ¥1,411,514 1.25% ¥1,393,533 1.23% ¥1,404,153 1.18%
(1) Taxable investment securities and non-taxable investment securities are not disclosed separately because the aggregate effect of theseaverage balances and interest income would not be material. In addition, the yields on tax-exempt obligations have not been calculatedon a tax equivalent basis because the effect of such calculation would not be material.
(2) Loans and advances include impaired loans and advances. The amortized portion of net loan origination fees (costs) is included ininterest income on loans and advances.
(3) Average balances are generally based on a daily average. Weekly, month-end or quarter-end averages are used for certain averagebalances where it is not practical to obtain applicable daily averages. The allocations of amounts between domestic and foreign are basedon the location of the office.
70

The following tables show changes in our interest income, interest expense and net interest income based onchanges in volume and changes in rate for the fiscal year ended March 31, 2015 compared to the fiscal yearended March 31, 2014, and those for the fiscal year ended March 31, 2014 compared to the fiscal year endedMarch 31, 2013.
Fiscal year ended March 31, 2015compared to
fiscal year ended March 31, 2014Increase / (decrease)
Fiscal year ended March 31, 2014compared to
fiscal year ended March 31, 2013Increase / (decrease)
Volume Rate Net change Volume Rate Net change
(In millions)
Interest income:Interest-earning deposits with other
banks:Domestic offices . . . . . . . . . . . . . ¥ 690 ¥ 1,051 ¥ 1,741 ¥ 1,083 ¥ 539 ¥ 1,622Foreign offices . . . . . . . . . . . . . . (779) 3,606 2,827 8,956 (2,720) 6,236
Total . . . . . . . . . . . . . . . . . . (89) 4,657 4,568 10,039 (2,181) 7,858
Call loans and bills bought:Domestic offices . . . . . . . . . . . . . (258) (148) (406) (162) 226 64Foreign offices . . . . . . . . . . . . . . (2,845) 3,715 870 865 4,347 5,212
Total . . . . . . . . . . . . . . . . . . (3,103) 3,567 464 703 4,573 5,276
Reverse repurchase agreements andcash collateral on securitiesborrowed:
Domestic offices . . . . . . . . . . . . . 1,837 (1,301) 536 (337) 141 (196)Foreign offices . . . . . . . . . . . . . . 4,379 (2,864) 1,515 2,491 (325) 2,166
Total . . . . . . . . . . . . . . . . . . 6,216 (4,165) 2,051 2,154 (184) 1,970
Held-to-maturity investments:Domestic offices . . . . . . . . . . . . . (6,117) (3,677) (9,794) (2,790) (6,693) (9,483)
Total . . . . . . . . . . . . . . . . . . (6,117) (3,677) (9,794) (2,790) (6,693) (9,483)
Available-for-sale financial assets:Domestic offices . . . . . . . . . . . . . (5,262) 2,426 (2,836) (32,763) 2,488 (30,275)Foreign offices . . . . . . . . . . . . . . 5,785 3,541 9,326 1,151 (2,767) (1,616)
Total . . . . . . . . . . . . . . . . . . 523 5,967 6,490 (31,612) (279) (31,891)
Loans and advances:Domestic offices . . . . . . . . . . . . . 8,841 (47,824) (38,983) 26,359 (89,049) (62,690)Foreign offices . . . . . . . . . . . . . . 83,406 20,375 103,781 91,889 (14,608) 77,281
Total . . . . . . . . . . . . . . . . . . 92,247 (27,449) 64,798 118,248 (103,657) 14,591
Total interest income:Domestic offices . . . . . . . . . . . . . (269) (49,473) (49,742) (8,610) (92,348) (100,958)Foreign offices . . . . . . . . . . . . . . 89,946 28,373 118,319 105,352 (16,073) 89,279
Total . . . . . . . . . . . . . . . . . . ¥89,677 ¥(21,100) ¥ 68,577 ¥ 96,742 ¥(108,421) ¥ (11,679)
71
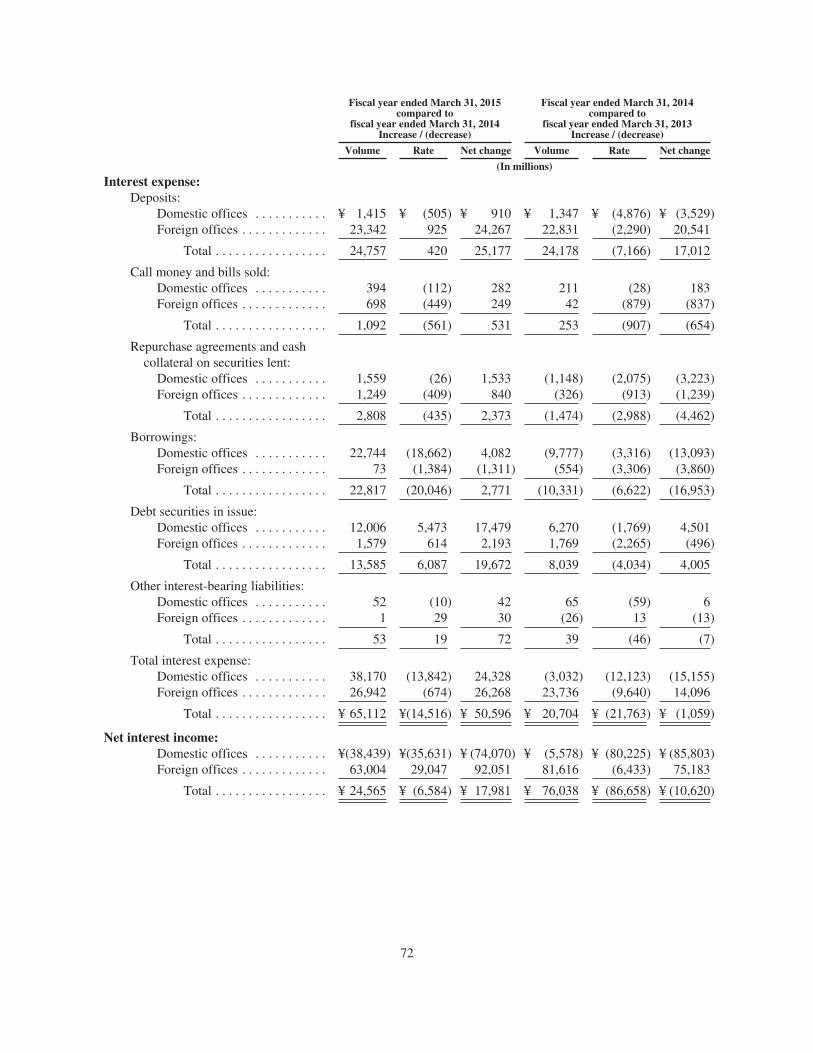
Fiscal year ended March 31, 2015compared to
fiscal year ended March 31, 2014Increase / (decrease)
Fiscal year ended March 31, 2014compared to
fiscal year ended March 31, 2013Increase / (decrease)
Volume Rate Net change Volume Rate Net change
(In millions)
Interest expense:Deposits:
Domestic offices . . . . . . . . . . . ¥ 1,415 ¥ (505) ¥ 910 ¥ 1,347 ¥ (4,876) ¥ (3,529)Foreign offices . . . . . . . . . . . . . 23,342 925 24,267 22,831 (2,290) 20,541
Total . . . . . . . . . . . . . . . . . 24,757 420 25,177 24,178 (7,166) 17,012
Call money and bills sold:Domestic offices . . . . . . . . . . . 394 (112) 282 211 (28) 183Foreign offices . . . . . . . . . . . . . 698 (449) 249 42 (879) (837)
Total . . . . . . . . . . . . . . . . . 1,092 (561) 531 253 (907) (654)
Repurchase agreements and cashcollateral on securities lent:
Domestic offices . . . . . . . . . . . 1,559 (26) 1,533 (1,148) (2,075) (3,223)Foreign offices . . . . . . . . . . . . . 1,249 (409) 840 (326) (913) (1,239)
Total . . . . . . . . . . . . . . . . . 2,808 (435) 2,373 (1,474) (2,988) (4,462)
Borrowings:Domestic offices . . . . . . . . . . . 22,744 (18,662) 4,082 (9,777) (3,316) (13,093)Foreign offices . . . . . . . . . . . . . 73 (1,384) (1,311) (554) (3,306) (3,860)
Total . . . . . . . . . . . . . . . . . 22,817 (20,046) 2,771 (10,331) (6,622) (16,953)
Debt securities in issue:Domestic offices . . . . . . . . . . . 12,006 5,473 17,479 6,270 (1,769) 4,501Foreign offices . . . . . . . . . . . . . 1,579 614 2,193 1,769 (2,265) (496)
Total . . . . . . . . . . . . . . . . . 13,585 6,087 19,672 8,039 (4,034) 4,005
Other interest-bearing liabilities:Domestic offices . . . . . . . . . . . 52 (10) 42 65 (59) 6Foreign offices . . . . . . . . . . . . . 1 29 30 (26) 13 (13)
Total . . . . . . . . . . . . . . . . . 53 19 72 39 (46) (7)
Total interest expense:Domestic offices . . . . . . . . . . . 38,170 (13,842) 24,328 (3,032) (12,123) (15,155)Foreign offices . . . . . . . . . . . . . 26,942 (674) 26,268 23,736 (9,640) 14,096
Total . . . . . . . . . . . . . . . . . ¥ 65,112 ¥(14,516) ¥ 50,596 ¥ 20,704 ¥ (21,763) ¥ (1,059)
Net interest income:Domestic offices . . . . . . . . . . . ¥(38,439) ¥(35,631) ¥ (74,070) ¥ (5,578) ¥ (80,225) ¥ (85,803)Foreign offices . . . . . . . . . . . . . 63,004 29,047 92,051 81,616 (6,433) 75,183
Total . . . . . . . . . . . . . . . . . ¥ 24,565 ¥ (6,584) ¥ 17,981 ¥ 76,038 ¥ (86,658) ¥ (10,620)
72

Fiscal Year Ended March 31, 2015 Compared to Fiscal Year Ended March 31, 2014
Interest Income
Our interest income increased by ¥68,577 million, or 4%, from ¥1,714,044 million for the fiscal year endedMarch 31, 2014 to ¥1,782,621 million for the fiscal year ended March 31, 2015. This increase reflected anincrease in interest income on loans and advances, which was partially offset by a decrease in interest income onheld-to-maturity investments. Interest income on loans and advances increased by ¥64,798 million, or 4%, from¥1,557,806 million for the fiscal year ended March 31, 2014 to ¥1,622,604 million for the fiscal year endedMarch 31, 2015. Interest income on loans and advances at foreign offices increased by ¥103,781 million, or 25%,from ¥419,704 million for the fiscal year ended March 31, 2014 to ¥523,485 million for the fiscal year endedMarch 31, 2015, due to an increase in the average balances of loans to foreign customers, reflecting ourallocation of assets primarily to Asian countries and the United States. Interest income on loans and advances atdomestic offices decreased by ¥38,983 million, or 3%, from ¥1,138,102 million for the fiscal year endedMarch 31, 2014 to ¥1,099,119 million for the fiscal year ended March 31, 2015, due to a decrease in average ratereflecting increasing competition in the commercial banking industry. Interest income on held-to-maturityinvestments decreased by ¥9,794 million, or 32%, from ¥30,303 million for the fiscal year ended March 31, 2014to ¥20,509 million for the fiscal year ended March 31, 2015, due to a decrease in average balances at ourdomestic offices reflecting a decrease in investments in Japanese government bonds.
Interest Expense
Our interest expense increased by ¥50,596 million, from ¥320,511 million for the fiscal year endedMarch 31, 2014 to ¥371,107 million for the fiscal year ended March 31, 2015, primarily due to increases ininterest expense on deposits and debt securities in issue. Our interest expense on deposits increased by¥25,177 million, or 18%, from ¥140,390 million for the fiscal year ended March 31, 2014 to ¥165,567 million forthe fiscal year ended March 31, 2015, primarily due to an increase at foreign offices. Interest expense on debtsecurities in issue increased by ¥19,672 million, or 20%, from ¥100,117 million for the fiscal year endedMarch 31, 2014 to ¥119,789 million for the fiscal year ended March 31, 2015, primarily due to an increase inaverage balances.
Net Interest Income
Our net interest income increased by ¥17,981 million, or 1%, from ¥1,393,533 million for the fiscal yearended March 31, 2014 to ¥1,411,514 million for the fiscal year ended March 31, 2015. The net interest incomeincreased primarily due to an increase in interest income on loans and advances, which was partially offset byincreases in the interest expense on deposits and debt securities in issue.
From the fiscal year ended March 31, 2014 to March 31, 2015, the average rate on loans and advances atdomestic offices decreased by 0.08 percentage points from 1.85% to 1.77%, primarily due to the increasingcompetition in the commercial banking industry. The average rate on loans and advances at foreign officesincreased by 0.10 percentage points from 2.15% to 2.25%, resulting in the total for loans and advancesdecreasing by 0.02 percentage points from 1.92% to 1.90%. On the other hand, the average rate on deposits atdomestic offices was 0.07%, the same level as that of the previous fiscal year, and the average rate on deposits atforeign offices slightly increased by 0.01 percentage points from 0.54% to 0.55%, resulting in the total fordeposits increasing slightly by 0.01 percentage points from 0.16% to 0.17%.
Fiscal Year Ended March 31, 2014 Compared to Fiscal Year Ended March 31, 2013
Interest Income
Our interest income decreased by ¥11,679 million, or 1%, from ¥1,725,723 million for the fiscal year endedMarch 31, 2013 to ¥1,714,044 million for the fiscal year ended March 31, 2014. This decrease reflected adecrease in interest income on available-for-sale financial assets, which was partially offset by an increase in
73
interest income on loans and advances. Interest income on available-for-sale financial assets decreased by¥31,891 million, or 36%, from ¥87,386 million for the fiscal year ended March 31, 2013 to ¥55,495 million forthe fiscal year ended March 31, 2014, primarily due to a decrease in average balances at our domestic officesreflecting a decrease in investments in Japanese government bonds. Interest income on loans and advancesincreased by ¥14,591 million, or 1%, from ¥1,543,215 million for the fiscal year ended March 31, 2013 to¥1,557,806 million for the fiscal year ended March 31, 2014. Interest income on loans and advances at foreignoffices increased by ¥77,281 million, or 23%, from ¥342,423 million for the fiscal year ended March 31, 2013 to¥419,704 million for the fiscal year ended March 31, 2014, due to an increase in the average balances of loans toforeign customers, reflecting our allocation of assets primarily to Asian countries. Interest income on loans andadvances at domestic offices decreased by ¥62,690 million, or 5%, from ¥1,200,792 million for the fiscal yearended March 31, 2013 to ¥1,138,102 million for the fiscal year ended March 31, 2014, due to a decrease inaverage rates reflecting increasing competition in the commercial banking industry and a decrease in short-terminterest rates in Japanese financial and capital markets.
Interest Expense
Our interest expense decreased by ¥1,059 million, from ¥321,570 million for the fiscal year endedMarch 31, 2013 to ¥320,511 million for the fiscal year ended March 31, 2014, primarily due to a decrease ininterest expense on borrowings, which was partially offset by an increase in interest expense on deposits. Interestexpense on borrowings decreased by ¥16,953 million, or 20%, from ¥85,219 million for the fiscal year endedMarch 31, 2013 to ¥68,266 million for the fiscal year ended March 31, 2014. Interest expense on depositsincreased by ¥17,012 million, or 14%, from ¥123,378 million for the fiscal year ended March 31, 2013 to¥140,390 million for the fiscal year ended March 31, 2014, primarily due to an increase in average balance atforeign offices.
Net Interest Income
Our net interest income decreased by ¥10,620 million, or 1%, from ¥1,404,153 million for the fiscal yearended March 31, 2013 to ¥1,393,533 million for the fiscal year ended March 31, 2014. The net interest incomedecreased primarily due to a decrease in the interest income on available-for-sale financial assets and an increasein interest expense on deposits, although the interest income on loans and advances increased.
From the fiscal year ended March 31, 2013 to March 31, 2014, the average rate on loans and advances atdomestic offices decreased by 0.15 percentage points from 2.00% to 1.85%, primarily due to the increasingcompetition in the commercial banking industry and a decrease in short-term interest rates in Japanese financialand capital markets. The average rate on loans and advances at foreign offices also decreased by 0.09 percentagepoints from 2.24% to 2.15%, resulting in the total for loans and advances decreasing by 0.12 percentage pointsfrom 2.04% to 1.92%. On the other hand, the average rate on deposits at domestic offices was 0.07%, the samelevel as that of the previous fiscal year, and the average rate on deposits at foreign offices decreased by0.02 percentage points from 0.56% to 0.54%, resulting in the total for deposits increasing by 0.01 percentagepoints from 0.15% to 0.16%.
74
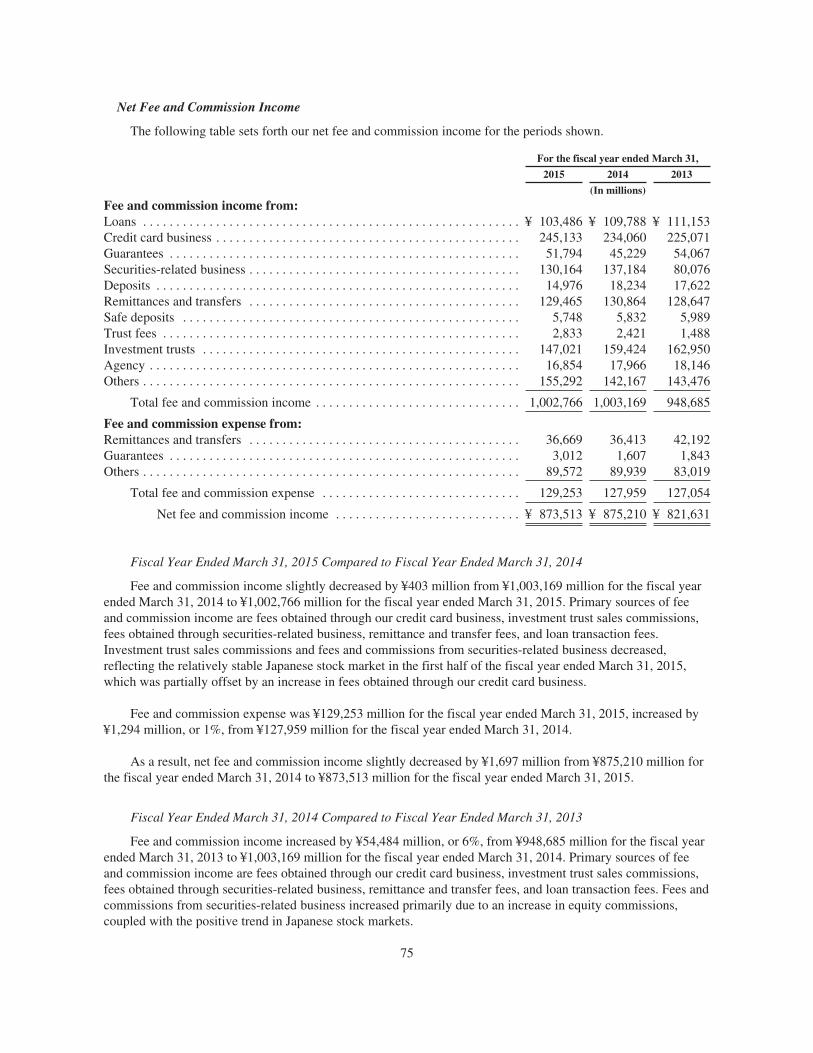
Net Fee and Commission Income
The following table sets forth our net fee and commission income for the periods shown.
For the fiscal year ended March 31,
2015 2014 2013
(In millions)
Fee and commission income from:Loans . . . . . . . . . . . . . . . . . . . . . . . . . . . . . . . . . . . . . . . . . . . . . . . . . . . . . . . . . ¥ 103,486 ¥ 109,788 ¥ 111,153Credit card business . . . . . . . . . . . . . . . . . . . . . . . . . . . . . . . . . . . . . . . . . . . . . . 245,133 234,060 225,071Guarantees . . . . . . . . . . . . . . . . . . . . . . . . . . . . . . . . . . . . . . . . . . . . . . . . . . . . . 51,794 45,229 54,067Securities-related business . . . . . . . . . . . . . . . . . . . . . . . . . . . . . . . . . . . . . . . . . 130,164 137,184 80,076Deposits . . . . . . . . . . . . . . . . . . . . . . . . . . . . . . . . . . . . . . . . . . . . . . . . . . . . . . . 14,976 18,234 17,622Remittances and transfers . . . . . . . . . . . . . . . . . . . . . . . . . . . . . . . . . . . . . . . . . 129,465 130,864 128,647Safe deposits . . . . . . . . . . . . . . . . . . . . . . . . . . . . . . . . . . . . . . . . . . . . . . . . . . . 5,748 5,832 5,989Trust fees . . . . . . . . . . . . . . . . . . . . . . . . . . . . . . . . . . . . . . . . . . . . . . . . . . . . . . 2,833 2,421 1,488Investment trusts . . . . . . . . . . . . . . . . . . . . . . . . . . . . . . . . . . . . . . . . . . . . . . . . 147,021 159,424 162,950Agency . . . . . . . . . . . . . . . . . . . . . . . . . . . . . . . . . . . . . . . . . . . . . . . . . . . . . . . . 16,854 17,966 18,146Others . . . . . . . . . . . . . . . . . . . . . . . . . . . . . . . . . . . . . . . . . . . . . . . . . . . . . . . . . 155,292 142,167 143,476
Total fee and commission income . . . . . . . . . . . . . . . . . . . . . . . . . . . . . . . 1,002,766 1,003,169 948,685
Fee and commission expense from:Remittances and transfers . . . . . . . . . . . . . . . . . . . . . . . . . . . . . . . . . . . . . . . . . 36,669 36,413 42,192Guarantees . . . . . . . . . . . . . . . . . . . . . . . . . . . . . . . . . . . . . . . . . . . . . . . . . . . . . 3,012 1,607 1,843Others . . . . . . . . . . . . . . . . . . . . . . . . . . . . . . . . . . . . . . . . . . . . . . . . . . . . . . . . . 89,572 89,939 83,019
Total fee and commission expense . . . . . . . . . . . . . . . . . . . . . . . . . . . . . . 129,253 127,959 127,054
Net fee and commission income . . . . . . . . . . . . . . . . . . . . . . . . . . . . ¥ 873,513 ¥ 875,210 ¥ 821,631
Fiscal Year Ended March 31, 2015 Compared to Fiscal Year Ended March 31, 2014
Fee and commission income slightly decreased by ¥403 million from ¥1,003,169 million for the fiscal yearended March 31, 2014 to ¥1,002,766 million for the fiscal year ended March 31, 2015. Primary sources of feeand commission income are fees obtained through our credit card business, investment trust sales commissions,fees obtained through securities-related business, remittance and transfer fees, and loan transaction fees.Investment trust sales commissions and fees and commissions from securities-related business decreased,reflecting the relatively stable Japanese stock market in the first half of the fiscal year ended March 31, 2015,which was partially offset by an increase in fees obtained through our credit card business.
Fee and commission expense was ¥129,253 million for the fiscal year ended March 31, 2015, increased by¥1,294 million, or 1%, from ¥127,959 million for the fiscal year ended March 31, 2014.
As a result, net fee and commission income slightly decreased by ¥1,697 million from ¥875,210 million forthe fiscal year ended March 31, 2014 to ¥873,513 million for the fiscal year ended March 31, 2015.
Fiscal Year Ended March 31, 2014 Compared to Fiscal Year Ended March 31, 2013
Fee and commission income increased by ¥54,484 million, or 6%, from ¥948,685 million for the fiscal yearended March 31, 2013 to ¥1,003,169 million for the fiscal year ended March 31, 2014. Primary sources of feeand commission income are fees obtained through our credit card business, investment trust sales commissions,fees obtained through securities-related business, remittance and transfer fees, and loan transaction fees. Fees andcommissions from securities-related business increased primarily due to an increase in equity commissions,coupled with the positive trend in Japanese stock markets.
75

Fee and commission expense was ¥127,959 million for the fiscal year ended March 31, 2014, increased by¥905 million, or 1%, from ¥127,054 million for the fiscal year ended March 31, 2013.
As a result, net fee and commission income increased by ¥53,579 million, or 7%, from ¥821,631 million forthe fiscal year ended March 31, 2013 to ¥875,210 million for the fiscal year ended March 31, 2014.
Net Income from Trading, Financial Assets at Fair Value Through Profit or Loss and InvestmentSecurities
The following table sets forth our net income from trading, financial assets at fair value through profit orloss and investment securities for the periods shown.
For the fiscal year ended March 31,
2015 2014 2013
(In millions)
Net trading income:Interest rate . . . . . . . . . . . . . . . . . . . . . . . . . . . . . . . . . . . . . . . . . . . . . . . . . . . ¥ 248,372 ¥184,859 ¥ 269,030Foreign exchange . . . . . . . . . . . . . . . . . . . . . . . . . . . . . . . . . . . . . . . . . . . . . . . (136,708) (81,154) (141,025)Equity . . . . . . . . . . . . . . . . . . . . . . . . . . . . . . . . . . . . . . . . . . . . . . . . . . . . . . . . 499 10,496 (32,987)Credit . . . . . . . . . . . . . . . . . . . . . . . . . . . . . . . . . . . . . . . . . . . . . . . . . . . . . . . . 16,970 20,983 9,955Others . . . . . . . . . . . . . . . . . . . . . . . . . . . . . . . . . . . . . . . . . . . . . . . . . . . . . . . . (1,374) 34 329
Total net trading income . . . . . . . . . . . . . . . . . . . . . . . . . . . . . . . . . . . . . ¥ 127,759 ¥135,218 ¥ 105,302
Net income from financial assets at fair value through profit or loss:Net income from debt instruments . . . . . . . . . . . . . . . . . . . . . . . . . . . . . . . . . ¥ 13,123 ¥ 53,142 ¥ 10,265Net income from equity instruments . . . . . . . . . . . . . . . . . . . . . . . . . . . . . . . . 9,555 5,444 5,529
Total net income from financial assets at fair value through profit orloss . . . . . . . . . . . . . . . . . . . . . . . . . . . . . . . . . . . . . . . . . . . . . . . . . . . . ¥ 22,678 ¥ 58,586 ¥ 15,794
Net investment income:Net gain (loss) from disposal of debt instruments . . . . . . . . . . . . . . . . . . . . . . ¥ 45,193 ¥ (1,753) ¥ 99,855Net gain from disposal of equity instruments . . . . . . . . . . . . . . . . . . . . . . . . . 190,570 225,185 41,140Dividend income . . . . . . . . . . . . . . . . . . . . . . . . . . . . . . . . . . . . . . . . . . . . . . . 135,301 108,833 82,409
Total net investment income . . . . . . . . . . . . . . . . . . . . . . . . . . . . . . . . . . ¥ 371,064 ¥332,265 ¥ 223,404
Fiscal Year Ended March 31, 2015 Compared to Fiscal Year Ended March 31, 2014
Net trading income, which includes income and losses from trading assets and liabilities and derivativefinancial instruments, decreased by ¥7,459 million from ¥135,218 million for the fiscal year ended March 31,2014 to ¥127,759 million for the fiscal year ended March 31, 2015. The decrease was due to an increase in nettrading loss from foreign exchange transactions and a decrease in net trading income from equity relatedtransactions and other transactions in spite of an increase in net trading income from interest rate relatedtransactions.
The increase in net trading loss from foreign exchange transactions was primarily due to an increase in theimpact of the depreciation of the yen against the U.S. dollar on gains or losses arising from foreign exchangetransactions related to the “economic hedges.”
We have carried out hedging transactions to hedge the foreign exchange risk of foreign currencydenominated assets and liabilities. Of those hedges, the economic hedges are economically effective for riskmanagement but are not accounted for as hedge accounting under IFRS as they do not meet the conditions forhedge accounting under IFRS. Hedged items and hedging instruments related to the economic hedges are
76
classified into three types: (1) net investments in foreign subsidiaries and associates hedged by using foreigncurrency denominated financial liabilities such as deposits and borrowings, (2) foreign currency denominatedequity instruments classified as available-for-sale financial assets hedged by using foreign currency denominatedfinancial liabilities, and (3) foreign currency denominated financial assets and liabilities such as loans anddeposits hedged by using derivative financial instruments such as currency swaps.
As those economic hedge transactions lead to accounting mismatches (i.e., when the gains or losses on thehedged items and hedging instruments do not offset each other either in profit or loss, or in other comprehensiveincome), large depreciations or appreciations of the yen against other currencies may result in significantfluctuations to net trading income from foreign exchange transactions.
The yen exchange rate against the U.S. dollar was ¥120.15, ¥102.88 and ¥94.01 at March 31, 2015, 2014and 2013, respectively. This resulted in the 17.27-yen depreciation of the yen against the U.S. dollar during thefiscal year ended March 31, 2015, which was larger than the 8.87-yen depreciation during the previous fiscalyear. Therefore, this contributed to the increase in the impact of the depreciation of the yen against theU.S. dollar mentioned above. For information about the yen exchange rates, see “Item 3. Key Information—3.A.Selected Financial Data—Exchange Rates.”
On the other hand, net trading income from interest rate related transactions increased primarily due to anincrease in income related to fixed income products.
Net income from financial assets at fair value through profit or loss decreased by ¥35,908 million from¥58,586 million for the fiscal year ended March 31, 2014 to ¥22,678 million for the fiscal year ended March 31,2015, primarily due to a decrease in the fair value of debt instruments.
Net investment income increased by ¥38,799 million from ¥332,265 million for the fiscal year endedMarch 31, 2014 to ¥371,064 million for the fiscal year ended March 31, 2015. This was primarily due to anincrease in net gains from sales of bonds, which was partially offset by a decrease in net gains from sales of listedstocks.
Fiscal Year Ended March 31, 2014 Compared to Fiscal Year Ended March 31, 2013
Net trading income, which includes income and losses from trading assets and liabilities and derivativefinancial instruments, increased by ¥29,916 million from ¥105,302 million for the fiscal year ended March 31,2013 to ¥135,218 million for the fiscal year ended March 31, 2014. The increase was primarily due to a decreasein net trading loss from foreign exchange transactions and an increase in net trading income from equity relatedtransactions, partially offset by a decrease in net trading income from interest rate related transactions.
The decrease in net trading loss from foreign exchange transactions was primarily due to a decrease in theimpact of the depreciation of the yen against the U.S. dollar on gains or losses arising from foreign exchangetransactions related to the economic hedges as described in the previous section.
The yen exchange rate against the U.S. dollar was ¥102.88, ¥94.01 and ¥82.13 at March 31, 2014, 2013 and2012, respectively. This resulted in the 8.87-yen depreciation of the yen against the U.S. dollar during the fiscalyear ended March 31, 2014, which was smaller than the 11.88-yen depreciation during the previous fiscal year.Therefore, this contributed to the decrease in the impact of the depreciation of the yen against the U.S. dollarmentioned above. For information about the yen exchange rates, see “Item 3. Key Information—3.A. SelectedFinancial Data—Exchange Rates.”
In addition, the increase in net trading income from equity related transactions was due to our appropriateresponse to, or forecast for Japanese stock markets.
77

On the other hand, net trading income from interest rate related transactions decreased primarily due to adecrease in income related to fixed income products.
Net income from financial assets at fair value through profit or loss increased by ¥42,792 million from¥15,794 million for the fiscal year ended March 31, 2013 to ¥58,586 million for the fiscal year ended March 31,2014 primarily due to an increase in the fair value of debt instruments.
Net investment income increased by ¥108,861 million from ¥223,404 million for the fiscal year endedMarch 31, 2013 to ¥332,265 million for the fiscal year ended March 31, 2014. This was primarily due to anincrease in net gains from sales of equity index-linked investment trusts, which was partially offset by a decreasein net gains from sales of bonds.
Other Income
The following table sets forth our other income for the periods shown.
For the fiscal year ended March 31,
2015 2014 2013
(In millions)
Income from operating leases . . . . . . . . . . . . . . . . . . . . . . . . . . . . . . . . . . . . . . ¥179,632 ¥148,211 ¥110,906Income related to disposal of assets leased . . . . . . . . . . . . . . . . . . . . . . . . . . . . 183,590 149,448 84,631Income related to IT solution services . . . . . . . . . . . . . . . . . . . . . . . . . . . . . . . . 35,506 41,043 30,709Gains on disposal of property, plant and equipment, and other intangible
assets . . . . . . . . . . . . . . . . . . . . . . . . . . . . . . . . . . . . . . . . . . . . . . . . . . . . . . . . 538 2,634 240Reversal of impairment losses of investments in associates and joint
ventures . . . . . . . . . . . . . . . . . . . . . . . . . . . . . . . . . . . . . . . . . . . . . . . . . . . . . — — 14,970Gains on step acquisition of subsidiaries . . . . . . . . . . . . . . . . . . . . . . . . . . . . . . — 1,565 141Gains on step acquisition of associates and joint ventures . . . . . . . . . . . . . . . . 37,997 — —Others . . . . . . . . . . . . . . . . . . . . . . . . . . . . . . . . . . . . . . . . . . . . . . . . . . . . . . . . . 88,642 86,640 82,806
Total other income . . . . . . . . . . . . . . . . . . . . . . . . . . . . . . . . . . . . . . . . . . . ¥525,905 ¥429,541 ¥324,403
Fiscal Year Ended March 31, 2015 Compared to Fiscal Year Ended March 31, 2014
Other income increased by ¥96,364 million, or 22%, from ¥429,541 million for the fiscal year endedMarch 31, 2014 to ¥525,905 million for the fiscal year ended March 31, 2015. The increase was primarily due toincreases in income from operating leases and income related to disposal of assets leased.
Fiscal Year Ended March 31, 2014 Compared to Fiscal Year Ended March 31, 2013
Other income increased by ¥105,138 million, or 32%, from ¥324,403 million for the fiscal year endedMarch 31, 2013 to ¥429,541 million for the fiscal year ended March 31, 2014. The increase was primarily due toincreases in income from operating leases and income related to disposal of assets leased. On the other hand, noreversal of impairment losses of investments in associates and joint ventures was recognized for the fiscal yearended March 31, 2014 as the fair values of previously impaired investments in associates and joint ventures werenot recovered.
78
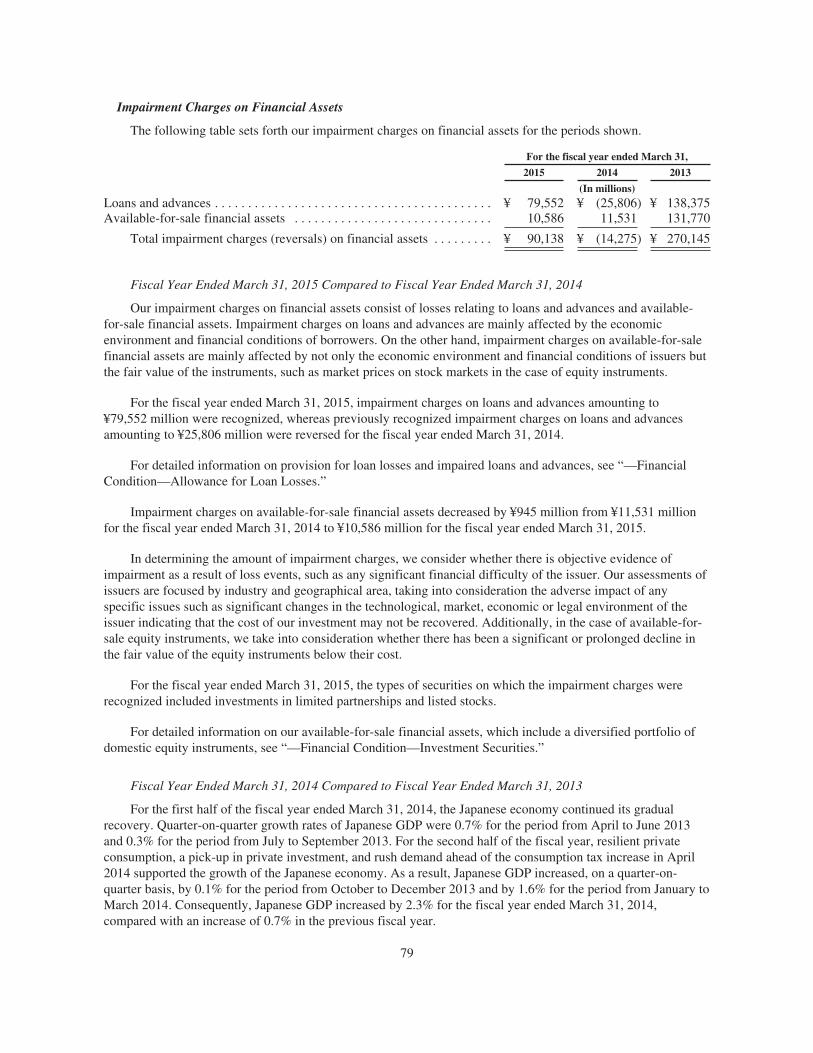
Impairment Charges on Financial Assets
The following table sets forth our impairment charges on financial assets for the periods shown.
For the fiscal year ended March 31,
2015 2014 2013
(In millions)Loans and advances . . . . . . . . . . . . . . . . . . . . . . . . . . . . . . . . . . . . . . . . . . ¥ 79,552 ¥ (25,806) ¥ 138,375Available-for-sale financial assets . . . . . . . . . . . . . . . . . . . . . . . . . . . . . . 10,586 11,531 131,770
Total impairment charges (reversals) on financial assets . . . . . . . . . ¥ 90,138 ¥ (14,275) ¥ 270,145
Fiscal Year Ended March 31, 2015 Compared to Fiscal Year Ended March 31, 2014
Our impairment charges on financial assets consist of losses relating to loans and advances and available-for-sale financial assets. Impairment charges on loans and advances are mainly affected by the economicenvironment and financial conditions of borrowers. On the other hand, impairment charges on available-for-salefinancial assets are mainly affected by not only the economic environment and financial conditions of issuers butthe fair value of the instruments, such as market prices on stock markets in the case of equity instruments.
For the fiscal year ended March 31, 2015, impairment charges on loans and advances amounting to¥79,552 million were recognized, whereas previously recognized impairment charges on loans and advancesamounting to ¥25,806 million were reversed for the fiscal year ended March 31, 2014.
For detailed information on provision for loan losses and impaired loans and advances, see “—FinancialCondition—Allowance for Loan Losses.”
Impairment charges on available-for-sale financial assets decreased by ¥945 million from ¥11,531 millionfor the fiscal year ended March 31, 2014 to ¥10,586 million for the fiscal year ended March 31, 2015.
In determining the amount of impairment charges, we consider whether there is objective evidence ofimpairment as a result of loss events, such as any significant financial difficulty of the issuer. Our assessments ofissuers are focused by industry and geographical area, taking into consideration the adverse impact of anyspecific issues such as significant changes in the technological, market, economic or legal environment of theissuer indicating that the cost of our investment may not be recovered. Additionally, in the case of available-for-sale equity instruments, we take into consideration whether there has been a significant or prolonged decline inthe fair value of the equity instruments below their cost.
For the fiscal year ended March 31, 2015, the types of securities on which the impairment charges wererecognized included investments in limited partnerships and listed stocks.
For detailed information on our available-for-sale financial assets, which include a diversified portfolio ofdomestic equity instruments, see “—Financial Condition—Investment Securities.”
Fiscal Year Ended March 31, 2014 Compared to Fiscal Year Ended March 31, 2013
For the first half of the fiscal year ended March 31, 2014, the Japanese economy continued its gradualrecovery. Quarter-on-quarter growth rates of Japanese GDP were 0.7% for the period from April to June 2013and 0.3% for the period from July to September 2013. For the second half of the fiscal year, resilient privateconsumption, a pick-up in private investment, and rush demand ahead of the consumption tax increase in April2014 supported the growth of the Japanese economy. As a result, Japanese GDP increased, on a quarter-on-quarter basis, by 0.1% for the period from October to December 2013 and by 1.6% for the period from January toMarch 2014. Consequently, Japanese GDP increased by 2.3% for the fiscal year ended March 31, 2014,compared with an increase of 0.7% in the previous fiscal year.
79

For the fiscal year ended March 31, 2014, previously recognized impairment charges on loans and advancesamounting to ¥25,806 million were reversed, whereas impairment charges on loans and advances amounting to¥138,375 million were recognized for the fiscal year ended March 31, 2013. This reflected the continuing gradualrecovery of the Japanese economy and improvement of our loan portfolio. Impaired loans and advancesdecreased by ¥534,328 million from ¥2,483,141 million for the fiscal year ended March 31, 2013 to¥1,948,813 million for the fiscal year ended March 31, 2014. Allowance for loan losses for impaired loans andadvances also decreased by ¥287,035 million from ¥1,144,130 million for the fiscal year ended March 31, 2013to ¥857,095 million for the fiscal year ended March 31, 2014.
For detailed information on provision for loan losses and impaired loans and advances, see “—FinancialCondition—Allowance for Loan Losses,” and “—Financial Condition—Impaired Loans and Advances,”respectively.
Impairment charges on available-for-sale financial assets significantly decreased by ¥120,239 million from¥131,770 million for the fiscal year ended March 31, 2013 to ¥11,531 million for the fiscal year ended March 31,2014.
For the fiscal year ended March 31, 2014, the types of securities on which the impairment charges wererecognized included investments in limited partnerships, investment trusts, unlisted stocks and publicly tradedJapanese stocks. Impairment charges on publicly traded Japanese stocks, which had accounted for the majority ofthe impairment charges on available-for-sale financial assets in the previous years, were very small, reflecting thepositive trend in Japanese stock markets.
For detailed information on our available-for-sale financial assets, which include a diversified portfolio ofdomestic equity instruments, see “—Financial Condition—Investment Securities.”
General and Administrative Expenses
The following table sets forth our general and administrative expenses for the periods shown.
For the fiscal year ended March 31,
2015 2014 2013
(In millions)
Personnel expenses . . . . . . . . . . . . . . . . . . . . . . . . . . . . . . . . . . . . . . . . . . ¥ 749,480 ¥ 706,376 ¥ 666,073Depreciation and amortization . . . . . . . . . . . . . . . . . . . . . . . . . . . . . . . . . 146,233 137,742 130,382Rent and lease expenses . . . . . . . . . . . . . . . . . . . . . . . . . . . . . . . . . . . . . . 116,745 113,314 111,327Building and maintenance expenses . . . . . . . . . . . . . . . . . . . . . . . . . . . . . 10,068 8,886 7,926Supplies expenses . . . . . . . . . . . . . . . . . . . . . . . . . . . . . . . . . . . . . . . . . . . 14,865 15,482 14,267Communication expenses . . . . . . . . . . . . . . . . . . . . . . . . . . . . . . . . . . . . . 35,126 35,017 33,099Publicity and advertising expenses . . . . . . . . . . . . . . . . . . . . . . . . . . . . . . 68,481 56,791 48,979Taxes and dues . . . . . . . . . . . . . . . . . . . . . . . . . . . . . . . . . . . . . . . . . . . . . 67,913 57,782 57,617Outsourcing expenses . . . . . . . . . . . . . . . . . . . . . . . . . . . . . . . . . . . . . . . . 91,189 88,072 87,583Premiums for deposit insurance . . . . . . . . . . . . . . . . . . . . . . . . . . . . . . . . 56,789 54,532 53,687Office equipment expenses . . . . . . . . . . . . . . . . . . . . . . . . . . . . . . . . . . . . 47,318 40,388 35,749Others . . . . . . . . . . . . . . . . . . . . . . . . . . . . . . . . . . . . . . . . . . . . . . . . . . . . 217,690 208,608 200,427
Total general and administrative expenses . . . . . . . . . . . . . . . . . . . . ¥1,621,897 ¥1,522,990 ¥1,447,116
Fiscal Year Ended March 31, 2015 Compared to Fiscal Year Ended March 31, 2014
General and administrative expenses increased by ¥98,907 million, or 6%, from ¥1,522,990 million for thefiscal year ended March 31, 2014 to ¥1,621,897 million for the fiscal year ended March 31, 2015, primarily due
80

to increases in expenses related to overseas business development including an increase in our overseas staff,expenses to enhance operating income from our securities and credit card businesses, and taxes and duesreflecting the consumption tax increase.
Fiscal Year Ended March 31, 2014 Compared to Fiscal Year Ended March 31, 2013
General and administrative expenses increased by ¥75,874 million, or 5%, from ¥1,447,116 million for thefiscal year ended March 31, 2013 to ¥1,522,990 million for the fiscal year ended March 31, 2014, primarily dueto increases in expenses to enhance operating income from the securities business, and expenses related tooverseas business development including an increase in our overseas staff.
Other Expenses
The following table sets forth our other expenses for the periods shown.
For the fiscal year ended March 31,
2015 2014 2013
(In millions)Cost of operating leases . . . . . . . . . . . . . . . . . . . . . . . . . . . . . . . . . . . . . . . . . . . . . ¥ 87,206 ¥ 72,268 ¥ 58,252Cost related to disposal of assets leased . . . . . . . . . . . . . . . . . . . . . . . . . . . . . . . . 171,707 146,196 81,083Cost related to IT solution services and IT systems . . . . . . . . . . . . . . . . . . . . . . . 84,300 75,173 69,636Provision for interest repayment . . . . . . . . . . . . . . . . . . . . . . . . . . . . . . . . . . . . . . 64,195 49,764 416Losses on disposal of property, plant and equipment, and other intangible
assets . . . . . . . . . . . . . . . . . . . . . . . . . . . . . . . . . . . . . . . . . . . . . . . . . . . . . . . . . 6,703 6,763 5,432Impairment losses of property, plant and equipment . . . . . . . . . . . . . . . . . . . . . . . 5,108 3,157 4,333Impairment losses of intangible assets . . . . . . . . . . . . . . . . . . . . . . . . . . . . . . . . . 4 193 35Losses on sale of investments in subsidiaries and associates . . . . . . . . . . . . . . . . 2,221 — 8Impairment losses of investments in associates and joint ventures . . . . . . . . . . . . 4,631 4,686 7,347Others . . . . . . . . . . . . . . . . . . . . . . . . . . . . . . . . . . . . . . . . . . . . . . . . . . . . . . . . . . . 79,539 70,580 61,354
Total other expenses . . . . . . . . . . . . . . . . . . . . . . . . . . . . . . . . . . . . . . . . . . . ¥505,614 ¥428,780 ¥287,896
Fiscal Year Ended March 31, 2015 Compared to Fiscal Year Ended March 31, 2014
Other expenses increased by ¥76,834 million, or 18%, from ¥428,780 million for the fiscal year endedMarch 31, 2014 to ¥505,614 million for the fiscal year ended March 31, 2015, primarily due to increases in costof operating leases and cost related to disposal of assets leased.
Fiscal Year Ended March 31, 2014 Compared to Fiscal Year Ended March 31, 2013
Other expenses increased by ¥140,884 million, or 49%, from ¥287,896 million for the fiscal year endedMarch 31, 2013 to ¥428,780 million for the fiscal year ended March 31, 2014, primarily due to increases in costof operating leases and cost related to disposal of assets leased.
Share of Post-tax Profit of Associates and Joint Ventures
Fiscal Year Ended March 31, 2015 Compared to Fiscal Year Ended March 31, 2014
Share of post-tax profit of associates and joint ventures decreased by ¥1,330 million from ¥19,454 millionfor the fiscal year ended March 31, 2014 to ¥18,124 million for the fiscal year ended March 31, 2015. This wasprimarily due to the exclusion of our share of the profit of Mobit Co., LTD., which had been our equity-methodassociate but became our subsidiary in March 2014, and a decrease in our share of the profit from the investmentbusiness of associates and joint ventures. The decrease was partially offset by the effect of The Japan Net Bank,which had been our subsidiary but became our equity-method associate in April 2014.
81
Fiscal Year Ended March 31, 2014 Compared to Fiscal Year Ended March 31, 2013
Share of post-tax profit of associates and joint ventures decreased by ¥139 million from ¥19,593 million forthe fiscal year ended March 31, 2013 to ¥19,454 million for the fiscal year ended March 31, 2014. This wasprimarily due to a decrease in our share of the profit from the investment business of associates and jointventures, which was partially offset by the inclusion of our share of the profit from PT Bank Tabungan PensiunanNasional Tbk, which became our equity-method associate in May 2013.
Income Tax Expense
Fiscal Year Ended March 31, 2015 Compared to Fiscal Year Ended March 31, 2014
Income tax expense decreased by ¥4,129 million from ¥414,076 million for the fiscal year ended March 31,2014 to ¥409,947 million for the fiscal year ended March 31, 2015, due to a decrease in deferred tax expense.The decrease was primarily due to a decrease in a reversal of deductible temporary differences attributable toloans and advances. The decrease was partially offset by an increase in deferred tax expense associated with adecrease of net deferred tax assets which resulted from changes in Japanese corporation tax rates. For a moredetailed description of changes in Japanese corporation tax rates, see Note 22 “Deferred Income Tax” to ourconsolidated financial statements included elsewhere in this annual report.
Fiscal Year Ended March 31, 2014 Compared to Fiscal Year Ended March 31, 2013
Income tax expense increased by ¥158,776 million from ¥255,300 million for the fiscal year endedMarch 31, 2013 to ¥414,076 million for the fiscal year ended March 31, 2014, primarily due to an increase inprofit before tax and an increase in deferred tax expense relating to a reversal of temporary differencesattributable to loans and advances.
Business Segment Analysis
Our business segment information is prepared based on the internal reporting system utilized by ourmanagement to assess the performance of our business segments under Japanese GAAP. We have four mainbusiness segments: Commercial Banking, Leasing, Securities and Consumer Finance, with the remainingoperations recorded in Others. The Commercial Banking segment covers the Bank, which accounts for the majorportion of our total assets and revenue, other domestic banking subsidiaries, such as KUBC, The Minato Bankand SMBC Trust Bank, as well as foreign banking subsidiaries, such as SMBC Europe, SMBC (China) andManufacturers Bank. We have SMFL in the Leasing segment, SMBC Nikko Securities and SMBC FriendSecurities in the Securities segment and Sumitomo Mitsui Card, Cedyna and SMBC Consumer Finance in theConsumer Finance segment. Since the Bank has a significant impact on our overall performance, its performanceis reported to management in more detail by each business unit based on customer market.
Until March 31, 2014, the Bank conducted its primary banking business through five business units: theConsumer Banking Unit, the Middle Market Banking Unit, the Corporate Banking Unit, the InternationalBanking Unit and the Treasury Unit. On April 1, 2014, the Bank restructured its domestic business operationsand reorganized its domestic business units, in order to further enhance its capability to meet the needs of ourclients and deliver higher value-added products and services. Under the new structure, the Consumer BankingUnit, the Middle Market Banking Unit and the Corporate Banking Unit were reorganized into two business units:the Wholesale Banking Unit and the Retail Banking Unit. Accordingly, the Bank operates its primary bankingbusiness through four business units. Comparative information has been restated to reflect this change. Inaddition to the four business units, the Bank also has several cross-sectional units and divisions, including theInvestment Banking Unit, the Corporate Advisory Division, the Private Advisory Division and the TransactionBusiness Division. The revenues and expenses of these units and divisions are generally allocated to eachbusiness unit. Organizational charts of SMFG and the Bank are provided in “Item 4.C. Organizational Structure.”Since figures reported to management are prepared under Japanese GAAP, the segment information does not
82

agree to figures in the consolidated financial statements under IFRS. This difference is addressed in Note 4“Segment Analysis—Reconciliation of Segmental Results of Operation to Consolidated Income Statement” toour consolidated financial statements included elsewhere in this annual report.
Segmental Results of Operation
For the fiscal year ended March 31, 2015:
Commercial Banking
SMBC Others(2) Total
WholesaleBanking Unit
RetailBanking Unit
InternationalBanking Unit
TreasuryUnit Others SMBC Total
(In billions)Gross profit . . . . . . . . . . . . . . . . . ¥ 555.4 ¥ 386.8 ¥ 345.3 ¥ 354.0 ¥ (7.2) ¥ 1,634.3 ¥ 289.4 ¥ 1,923.7
Net interest income . . . . . . . 315.8 313.2 227.8 212.4 52.2 1,121.4 171.3 1,292.7Net non-interest income . . . . 239.6 73.6 117.5 141.6 (59.4) 512.9 118.1 631.0
General and administrativeexpenses and others . . . . . . . . . (206.8) (350.1) (106.6) (25.9) (101.8) (791.2) (203.0) (994.2)
Consolidated net businessprofit(1)(7) . . . . . . . . . . . . . . . . . ¥ 348.6 ¥ 36.7 ¥ 238.7 ¥ 328.1 ¥ (109.0) ¥ 843.1 ¥ 86.4 ¥ 929.5
Leasing Securities Consumer Finance Others Total
SMFL(3) Total(4)
SMBCNikko
Securities(5)
SMBCFriend
Securities Total(4)
SumitomoMitsuiCard Cedyna(6)
SMBCConsumerFinance(3) Total(4)
(In billions)Gross profit . . . . . . . . . . . . . . . . ¥ 137.0 ¥149.3 ¥ 346.3 ¥ 50.4 ¥ 393.9 ¥ 196.4 ¥ 164.2 ¥ 215.5 ¥ 576.9 ¥(63.4) ¥2,980.4
Net interest income . . . . . . 19.3 24.4 1.5 1.2 3.8 13.6 25.9 149.0 178.7 5.6 1,505.2Net non-interest income . . 117.7 124.9 344.8 49.2 390.1 182.8 138.3 66.5 398.2 (69.0) 1,475.2
General and administrativeexpenses and others . . . . . . . (56.5) (60.8) (248.7) (40.0) (301.9) (146.0) (121.7) (96.1) (381.9) 68.9 (1,669.9)
Consolidated net businessprofit(1)(7) . . . . . . . . . . . . . . . . ¥ 80.5 ¥ 88.5 ¥ 97.6 ¥ 10.4 ¥ 92.0 ¥ 50.4 ¥ 42.5 ¥ 119.4 ¥ 195.0 ¥ 5.5 ¥1,310.5
Gross Profit by Business Segment(For the fiscal year ended March 31, 2015)
Securities
ConsumerFinance
SMBC
Commercial Banking
Others(2)Leasing
83

For the fiscal year ended March 31, 2014:
Commercial Banking
SMBC Others(2) Total
WholesaleBanking Unit
RetailBanking Unit
InternationalBanking Unit
TreasuryUnit Others SMBC Total
(In billions)Gross profit . . . . . . . . . . . . . . . . . ¥ 558.5 ¥ 405.4 ¥ 296.0 ¥ 325.5 ¥ (27.3) ¥ 1,558.1 ¥ 249.1 ¥ 1,807.2
Net interest income . . . . . . . 323.4 321.3 174.6 225.2 20.4 1,064.9 171.1 1,236.0Net non-interest income . . . . 235.1 84.1 121.4 100.3 (47.7) 493.2 78.0 571.2
General and administrativeexpenses and others . . . . . . . . . (200.7) (336.4) (89.1) (22.9) (96.6) (745.7) (195.6) (941.3)
Consolidated net businessprofit(1)(7) . . . . . . . . . . . . . . . . . ¥ 357.8 ¥ 69.0 ¥ 206.9 ¥ 302.6 ¥ (123.9) ¥ 812.4 ¥ 53.5 ¥ 865.9
Leasing Securities Consumer Finance Others Total
SMFL(3) Total(4)
SMBCNikko
Securities(5)
SMBCFriend
Securities Total(4)
SumitomoMitsuiCard Cedyna(6)
SMBCConsumerFinance(3) Total(4)
(In billions)Gross profit . . . . . . . . . . . . . . . ¥ 127.9 ¥138.4 ¥ 339.3 ¥ 58.2 ¥ 397.8 ¥ 189.9 ¥ 167.6 ¥ 181.8 ¥ 540.1 ¥ 14.7 ¥ 2,898.2
Net interest income . . . . . 29.1 35.2 0.2 1.4 2.7 13.9 28.3 124.4 156.6 53.7 1,484.2Net non-interest
income . . . . . . . . . . . . . 98.8 103.2 339.1 56.8 395.1 176.0 139.3 57.4 383.5 (39.0) 1,414.0General and administrative
expenses and others . . . . . . . (52.9) (54.4) (235.3) (42.5) (292.0) (139.6) (123.6) (73.0) (352.8) 80.8 (1,559.7)
Consolidated net businessprofit(1)(7) . . . . . . . . . . . . . . . ¥ 75.0 ¥ 84.0 ¥ 104.0 ¥ 15.7 ¥ 105.8 ¥ 50.3 ¥ 44.0 ¥ 108.8 ¥ 187.3 ¥ 95.5 ¥ 1,338.5
84

For the fiscal year ended March 31, 2013:
Commercial Banking
SMBC Others(2) Total
WholesaleBanking Unit
RetailBanking Unit
InternationalBanking Unit
TreasuryUnit Others SMBC Total
(In billions)Gross profit . . . . . . . . . . . . . . . . . ¥ 549.3 ¥ 445.8 ¥ 240.5 ¥ 295.3 ¥ 9.2 ¥ 1,540.1 ¥ 258.7 ¥ 1,798.8
Net interest income . . . . . . . 320.3 351.8 142.0 125.5 31.6 971.2 156.0 1,127.2Net non-interest income . . . . 229.0 94.0 98.5 169.8 (22.4) 568.9 102.7 671.6
General and administrativeexpenses and others . . . . . . . . . (198.3) (335.5) (72.7) (20.9) (100.3) (727.7) (180.6) (908.3)
Consolidated net businessprofit(1)(7) . . . . . . . . . . . . . . . . . ¥ 351.0 ¥ 110.3 ¥ 167.8 ¥ 274.4 ¥ (91.1) ¥ 812.4 ¥ 78.1 ¥ 890.5
Leasing Securities Consumer Finance Others Total
SMFL(3) Total(4)
SMBCNikko
Securities(5)
SMBCFriend
Securities Total(4)
SumitomoMitsuiCard Cedyna(6)
SMBCConsumerFinance(3) Total(4)
(In billions)Gross profit . . . . . . . . . . . . . . . . ¥ 114.8 ¥120.4 ¥ 278.7 ¥ 59.4 ¥ 341.5 ¥ 183.1 ¥ 166.2 ¥ 165.8 ¥ 520.0 ¥ 12.2 ¥ 2,792.9
Net interest income . . . . . . 40.8 46.2 (1.6) 0.4 — 15.5 30.8 117.6 157.5 61.7 1,392.6Net non-interest income . . 74.0 74.2 280.3 59.0 341.5 167.6 135.4 48.2 362.5 (49.5) 1,400.3
General and administrativeexpenses and others . . . . . . . . (50.0) (47.7) (204.0) (41.4) (260.7) (132.6) (125.1) (64.3) (336.5) 62.2 (1,491.0)
Consolidated net businessprofit(1)(7) . . . . . . . . . . . . . . . . ¥ 64.8 ¥ 72.7 ¥ 74.7 ¥ 18.0 ¥ 80.8 ¥ 50.5 ¥ 41.1 ¥ 101.5 ¥ 183.5 ¥ 74.4 ¥ 1,301.9
(1) The calculation method of consolidated net business profit was changed on April 1, 2014 in order to improve the group management.Under the new method, consolidated net business profit is calculated based on consolidated income statement under Japanese GAAP.Consolidated net business profit = Gross profit (*) � General and administrative expenses + share of profit or loss of equity-methodassociates. Comparative information has been restated accordingly.(*)Gross profit = (Interest income � Interest expenses) + Trust fees + (Fee and commission income � Fee and commission expenses) +(Trading income � Trading losses) + (Other operating income � Other operating expenses).
(2) Others in Commercial Banking consist of SMFG’s banking subsidiaries except SMBC, such as KUBC, The Minato Bank, SMBCEurope, and SMBC (China).
(3) The figures represent consolidated figures of respective companies.(4) Total under each business segment, except Commercial Banking, includes the aggregation of the results from the operating units that
were not separately identified.(5) The figures are the sum of SMBC Nikko Securities (nonconsolidated basis) and its overseas securities subsidiaries.(6) The figures represent Cedyna’s consolidated figures excluding insignificant subsidiaries.(7) The Group’s total credit cost (reversal) for the fiscal years ended March 31, 2015, 2014 and 2013 were ¥7.8 billion, ¥(49.1) billion and
¥173.1 billion, respectively, of which ¥(68.3) billion, ¥(116.5) billion and ¥63.7 billion were for Commercial Banking, ¥(6.1) billion,¥(0.9) billion and ¥5.3 billion were for Leasing, ¥(0.2) billion, nil and ¥0.3 billion were for Securities and ¥78.8 billion, ¥66.8 billion and¥69.3 billion were for Consumer Finance. Total credit costs include gains on recoveries of written-off claims. The Group’s total creditcosts (reversal) are not included in the consolidated net business profit.
85

Commercial Banking
Fiscal Year Ended March 31, 2015 Compared to Fiscal Year Ended March 31, 2014
Our consolidated net business profit from our Commercial Banking segment increased by ¥64 billion from¥866 billion for the fiscal year ended March 31, 2014 to ¥930 billion for the fiscal year ended March 31, 2015.This was due to an increase in gross profit, which was partially offset by an increase in general andadministrative expenses.
The Bank’s Wholesale Banking Unit
Both gross profit and consolidated net business profit from the Bank’s Wholesale Banking Unit decreasedby ¥4 billion and ¥9 billion from ¥559 billion and ¥358 billion for the fiscal year ended March 31, 2014 to¥555 billion and ¥349 billion for the fiscal year ended March 31, 2015, respectively. Net interest incomedecreased primarily due to a decrease in the interest rate spreads for loans as a result of the increasing lendingcompetition in the commercial banking industry in Japan, although loans to domestic companies increased.
The Bank’s Retail Banking Unit
Both gross profit and consolidated net business profit from the Bank’s Retail Banking Unit decreased by¥18 billion and ¥32 billion from ¥405 billion and ¥69 billion for the fiscal year ended March 31, 2014 to¥387 billion and ¥37 billion for the fiscal year ended March 31, 2015, respectively. Net interest incomedecreased primarily due to a decrease in the interest rate spreads for and the balance of housing loans, reflectingthe increasing competition in the housing loan market in Japan. Non-interest income decreased primarily due to adecrease in fees and commissions related to investment trust.
The Bank’s International Banking Unit
Both gross profit and consolidated net business profit from the Bank’s International Banking Unit increasedby ¥49 billion and ¥32 billion from ¥296 billion and ¥207 billion for the fiscal year ended March 31, 2014 to¥345 billion and ¥239 billion for the fiscal year ended March 31, 2015, respectively. Net interest incomeincreased due to an increase in the balance of loans to the foreign customers, reflecting our allocation of assetsprimarily to Asian countries and the United States. The increase in gross profit was partially offset by an increasein general and administrative expenses as a result of an increase in expenses related to overseas businessdevelopment.
The Bank’s Treasury Unit
Both gross profit and consolidated net business profit from the Bank’s Treasury Unit increased by¥28 billion and ¥25 billion from ¥326 billion and ¥303 billion for the fiscal year ended March 31, 2014 to¥354 billion and ¥328 billion for the fiscal year ended March 31, 2015, respectively. This was primarily due to anincrease in profits from equity index-linked investment trusts and sales of bonds.
Fiscal Year Ended March 31, 2014 Compared to Fiscal Year Ended March 31, 2013
Our consolidated net business profit from our Commercial Banking segment decreased by ¥25 billion from¥891 billion for the fiscal year ended March 31, 2013 to ¥866 billion for the fiscal year ended March 31, 2014.This was due to a decrease in net non-interest income and an increase in general and administrative expenses,which were partially offset by an increase in net interest income.
The Bank’s Wholesale Banking Unit
Both gross profit and consolidated net business profit from the Bank’s Wholesale Banking Unit increased by¥10 billion and ¥7 billion from ¥549 billion and ¥351 billion for the fiscal year ended March 31, 2013 to¥559 billion and ¥358 billion for the fiscal year ended March 31, 2014, respectively. The increase was primarily due
86
to a growing demand for financing of M&A deals and leveraged buyout transactions, although the interest ratespreads for loans decreased due to the increasing lending competition in the commercial banking industry in Japan.
The Bank’s Retail Banking Unit
Both gross profit and consolidated net business profit from the Bank’s Retail Banking Unit decreased by¥41 billion and ¥41 billion from ¥446 billion and ¥110 billion for the fiscal year ended March 31, 2013 to¥405 billion and ¥69 billion for the fiscal year ended March 31, 2014, respectively. Net interest incomedecreased primarily due to a decrease in the interest rate spreads for and the balance of housing loans, reflectingthe increasing competition in the housing loan market in Japan. Non-interest income decreased due to a decreasein fees and commissions related to investment trust and life insurance products.
The Bank’s International Banking Unit
Both gross profit and consolidated net business profit from the Bank’s International Banking Unit increasedby ¥55 billion and ¥39 billion from ¥241 billion and ¥168 billion for the fiscal year ended March 31, 2013 to¥296 billion and ¥207 billion for the fiscal year ended March 31, 2014, respectively. Net interest incomeincreased due to an increase in the balance of loans to the foreign customers, reflecting our allocation of assetsprimarily to Asian countries. Net non-interest income also increased due to an increase in commissions inrelation to loan transactions. The increase in gross profit was partially offset by an increase in general andadministrative expenses as a result of an increase in our overseas staff and expenses related to overseas businessdevelopment.
The Bank’s Treasury Unit
Both gross profit and consolidated net business profit from the Bank’s Treasury Unit increased by¥31 billion and ¥29 billion from ¥295 billion and ¥274 billion for the fiscal year ended March 31, 2013 to¥326 billion and ¥303 billion for the fiscal year ended March 31, 2014, respectively. This was primarily due to anincrease in profits from equity index-linked investment trusts, which was partially offset by a decrease in netgains from sales of bonds.
Leasing
Fiscal Year Ended March 31, 2015 Compared to Fiscal Year Ended March 31, 2014
Both gross profit and consolidated net business profit in our Leasing segment increased by ¥11 billion and¥5 billion from ¥138 billion and ¥84 billion for the fiscal year ended March 31, 2014 to ¥149 billion and¥89 billion for the fiscal year ended March 31, 2015, respectively. Although net interest income decreased, netnon-interest income increased primarily due to an increase in net non-interest income of SMFL.
Fiscal Year Ended March 31, 2014 Compared to Fiscal Year Ended March 31, 2013
Both gross profit and consolidated net business profit in our Leasing segment increased by ¥18 billion and¥11 billion from ¥120 billion and ¥73 billion for the fiscal year ended March 31, 2013 to ¥138 billion and¥84 billion for the fiscal year ended March 31, 2014, respectively. Although net interest income decreased, netnon-interest income increased primarily due to an increase in net non-interest income of SMFL.
Securities
Fiscal Year Ended March 31, 2015 Compared to Fiscal Year Ended March 31, 2014
Both gross profit and consolidated net business profit in our Securities segment decreased by ¥4 billion and¥14 billion from ¥398 billion and ¥106 billion for the fiscal year ended March 31, 2014 to ¥394 billion and¥92 billion for the fiscal year ended March 31, 2015, respectively. This was primarily due to an increase ingeneral and administrative expenses of SMBC Nikko Securities associated with its business development and adecrease in net non-interest income of SMBC Friend Securities.
87
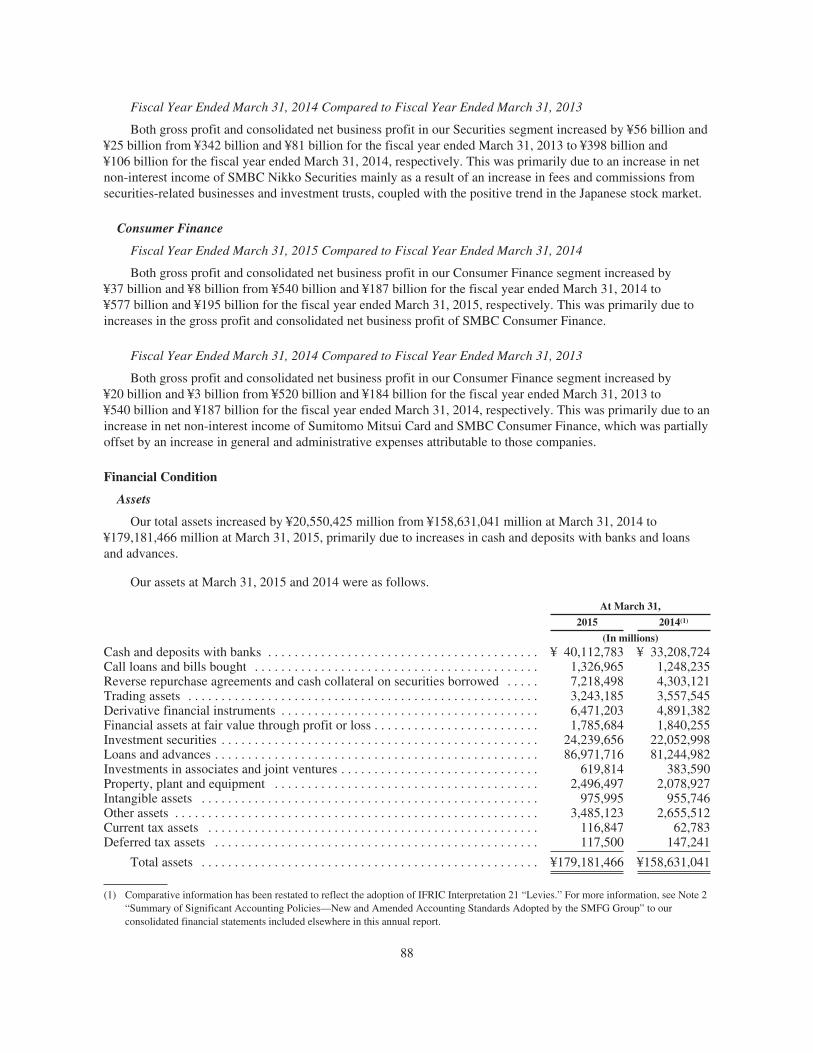
Fiscal Year Ended March 31, 2014 Compared to Fiscal Year Ended March 31, 2013
Both gross profit and consolidated net business profit in our Securities segment increased by ¥56 billion and¥25 billion from ¥342 billion and ¥81 billion for the fiscal year ended March 31, 2013 to ¥398 billion and¥106 billion for the fiscal year ended March 31, 2014, respectively. This was primarily due to an increase in netnon-interest income of SMBC Nikko Securities mainly as a result of an increase in fees and commissions fromsecurities-related businesses and investment trusts, coupled with the positive trend in the Japanese stock market.
Consumer Finance
Fiscal Year Ended March 31, 2015 Compared to Fiscal Year Ended March 31, 2014
Both gross profit and consolidated net business profit in our Consumer Finance segment increased by¥37 billion and ¥8 billion from ¥540 billion and ¥187 billion for the fiscal year ended March 31, 2014 to¥577 billion and ¥195 billion for the fiscal year ended March 31, 2015, respectively. This was primarily due toincreases in the gross profit and consolidated net business profit of SMBC Consumer Finance.
Fiscal Year Ended March 31, 2014 Compared to Fiscal Year Ended March 31, 2013
Both gross profit and consolidated net business profit in our Consumer Finance segment increased by¥20 billion and ¥3 billion from ¥520 billion and ¥184 billion for the fiscal year ended March 31, 2013 to¥540 billion and ¥187 billion for the fiscal year ended March 31, 2014, respectively. This was primarily due to anincrease in net non-interest income of Sumitomo Mitsui Card and SMBC Consumer Finance, which was partiallyoffset by an increase in general and administrative expenses attributable to those companies.
Financial Condition
Assets
Our total assets increased by ¥20,550,425 million from ¥158,631,041 million at March 31, 2014 to¥179,181,466 million at March 31, 2015, primarily due to increases in cash and deposits with banks and loansand advances.
Our assets at March 31, 2015 and 2014 were as follows.
At March 31,
2015 2014(1)
(In millions)Cash and deposits with banks . . . . . . . . . . . . . . . . . . . . . . . . . . . . . . . . . . . . . . . . . ¥ 40,112,783 ¥ 33,208,724Call loans and bills bought . . . . . . . . . . . . . . . . . . . . . . . . . . . . . . . . . . . . . . . . . . . 1,326,965 1,248,235Reverse repurchase agreements and cash collateral on securities borrowed . . . . . 7,218,498 4,303,121Trading assets . . . . . . . . . . . . . . . . . . . . . . . . . . . . . . . . . . . . . . . . . . . . . . . . . . . . . 3,243,185 3,557,545Derivative financial instruments . . . . . . . . . . . . . . . . . . . . . . . . . . . . . . . . . . . . . . . 6,471,203 4,891,382Financial assets at fair value through profit or loss . . . . . . . . . . . . . . . . . . . . . . . . . 1,785,684 1,840,255Investment securities . . . . . . . . . . . . . . . . . . . . . . . . . . . . . . . . . . . . . . . . . . . . . . . . 24,239,656 22,052,998Loans and advances . . . . . . . . . . . . . . . . . . . . . . . . . . . . . . . . . . . . . . . . . . . . . . . . . 86,971,716 81,244,982Investments in associates and joint ventures . . . . . . . . . . . . . . . . . . . . . . . . . . . . . . 619,814 383,590Property, plant and equipment . . . . . . . . . . . . . . . . . . . . . . . . . . . . . . . . . . . . . . . . 2,496,497 2,078,927Intangible assets . . . . . . . . . . . . . . . . . . . . . . . . . . . . . . . . . . . . . . . . . . . . . . . . . . . 975,995 955,746Other assets . . . . . . . . . . . . . . . . . . . . . . . . . . . . . . . . . . . . . . . . . . . . . . . . . . . . . . . 3,485,123 2,655,512Current tax assets . . . . . . . . . . . . . . . . . . . . . . . . . . . . . . . . . . . . . . . . . . . . . . . . . . 116,847 62,783Deferred tax assets . . . . . . . . . . . . . . . . . . . . . . . . . . . . . . . . . . . . . . . . . . . . . . . . . 117,500 147,241
Total assets . . . . . . . . . . . . . . . . . . . . . . . . . . . . . . . . . . . . . . . . . . . . . . . . . . . ¥179,181,466 ¥158,631,041
(1) Comparative information has been restated to reflect the adoption of IFRIC Interpretation 21 “Levies.” For more information, see Note 2“Summary of Significant Accounting Policies—New and Amended Accounting Standards Adopted by the SMFG Group” to ourconsolidated financial statements included elsewhere in this annual report.
88

Loans and Advances
Our main operating activity is the lending business. We make loans and extend other types of creditprincipally to corporate and individual customers in Japan and to corporate and sovereign customers in foreigncountries.
At March 31, 2015, our loans and advances were ¥86,971,716 million, or 49% of total assets, representingan increase of ¥5,726,734 million, or 7%, from ¥81,244,982 million at March 31, 2014. The increase in loans andadvances was due to increases in both those to domestic customers and foreign customers. The increase in loansand advances to our domestic customers was primarily due to an increase in those to corporate customerssupported by the improvement in corporate earnings and business sentiment, as we actively responded to thedemand for financing, which was partially offset by a decrease in loans and advances to individual customers as aresult of a decline in new housing loans, reflecting a decline in housing demand following the rush demand aheadof the consumption tax increase in April 2014. The increase in loans and advances to our foreign customers wasprimarily due to our allocation of assets to Asian countries and the United States, and the depreciation of the yen.
Domestic
Through the Bank and other banking and non-bank subsidiaries, we make loans to a broad range ofindustrial, commercial and individual customers in Japan. The following table shows our outstanding loans andadvances to customers whose domiciles are in Japan, classified by industry, before deducting the allowance forloan losses, and adjusting unearned income, unamortized premiums-net and deferred loan fees-net at the datesindicated.
At March 31,
2015 2014
(In millions)
Manufacturing . . . . . . . . . . . . . . . . . . . . . . . . . . . . . . . . . . . . . . . . . . . . . . . . . . . . . . . ¥ 8,061,654 ¥ 8,018,568Agriculture, forestry, fisheries and mining . . . . . . . . . . . . . . . . . . . . . . . . . . . . . . . . . 171,855 177,012Construction . . . . . . . . . . . . . . . . . . . . . . . . . . . . . . . . . . . . . . . . . . . . . . . . . . . . . . . . 1,150,616 1,152,388Transportation, communications and public enterprises . . . . . . . . . . . . . . . . . . . . . . . 5,175,949 5,086,361Wholesale and retail . . . . . . . . . . . . . . . . . . . . . . . . . . . . . . . . . . . . . . . . . . . . . . . . . . 5,664,385 5,505,570Finance and insurance . . . . . . . . . . . . . . . . . . . . . . . . . . . . . . . . . . . . . . . . . . . . . . . . . 2,869,967 2,537,347Real estate and goods rental and leasing . . . . . . . . . . . . . . . . . . . . . . . . . . . . . . . . . . . 8,766,724 8,117,000Services . . . . . . . . . . . . . . . . . . . . . . . . . . . . . . . . . . . . . . . . . . . . . . . . . . . . . . . . . . . . 4,776,706 4,855,536Municipalities . . . . . . . . . . . . . . . . . . . . . . . . . . . . . . . . . . . . . . . . . . . . . . . . . . . . . . . 1,353,949 1,279,010Lease financing . . . . . . . . . . . . . . . . . . . . . . . . . . . . . . . . . . . . . . . . . . . . . . . . . . . . . . 2,211,773 2,133,760Consumer(1) . . . . . . . . . . . . . . . . . . . . . . . . . . . . . . . . . . . . . . . . . . . . . . . . . . . . . . . . . 18,817,259 19,086,241Others . . . . . . . . . . . . . . . . . . . . . . . . . . . . . . . . . . . . . . . . . . . . . . . . . . . . . . . . . . . . . 3,211,240 3,159,438
Total domestic . . . . . . . . . . . . . . . . . . . . . . . . . . . . . . . . . . . . . . . . . . . . . . . . . . . ¥62,232,077 ¥61,108,231
(1) The balance in Consumer mainly consists of housing loans. The housing loan balances amounted to ¥14,087,453 million and¥14,420,225 million at March 31, 2015 and 2014, respectively.
89

Foreign
The following table shows the outstanding loans and advances to our customers whose domiciles are not inJapan, classified by industry, before deducting the allowance for loan losses, and adjusting unearned income,unamortized premiums-net and deferred loan fees-net at the dates indicated.
At March 31,
2015 2014
(In millions)
Public sector . . . . . . . . . . . . . . . . . . . . . . . . . . . . . . . . . . . . . . . . . . . . . . . . . . . . . . . . ¥ 164,495 ¥ 163,685Financial institutions . . . . . . . . . . . . . . . . . . . . . . . . . . . . . . . . . . . . . . . . . . . . . . . . . . 3,880,655 3,450,482Commerce and industry . . . . . . . . . . . . . . . . . . . . . . . . . . . . . . . . . . . . . . . . . . . . . . . 20,010,729 16,435,047Lease financing . . . . . . . . . . . . . . . . . . . . . . . . . . . . . . . . . . . . . . . . . . . . . . . . . . . . . . 308,128 267,394Others . . . . . . . . . . . . . . . . . . . . . . . . . . . . . . . . . . . . . . . . . . . . . . . . . . . . . . . . . . . . . 1,375,624 947,826
Total foreign . . . . . . . . . . . . . . . . . . . . . . . . . . . . . . . . . . . . . . . . . . . . . . . . . . . . ¥25,739,631 ¥21,264,434
Allowance for Loan Losses
We calculate the allowance for loan losses using the latest assignment of obligor grades (our internal creditrating) and supplementary data such as the borrowers’ operating cash flows, realizable value of collateral andrecent economic conditions.
Our consistent implementation of consultative actions tailored to our borrowers’ businesses and financialcondition, such as by supporting the development of operational improvement plans for borrowers, contributed tothe improvement of our loan portfolio and the containment of credit costs.
Fiscal Year Ended March 31, 2015 Compared to Fiscal Year Ended March 31, 2014
For the fiscal year ended March 31, 2015, the allowance for loan losses decreased by ¥157,113 million, or17%, from ¥950,665 million at March 31, 2014 to ¥793,552 million at March 31, 2015. The balance of theallowance for loan losses increases when the provision for loan losses is recognized and decreases whencharge-offs are recognized through the sales of loans and write-offs. As we recorded a provision for loan lossesof ¥79,552 million and charge-offs of ¥249,896 million for the fiscal year ended March 31, 2015, and charge-offsexceeded the provision for loan losses, the overall allowance for loan losses decreased.
Charge-offs decreased by ¥52,785 million from the previous fiscal year to ¥249,896 million for the fiscalyear ended March 31, 2015. Charge-offs of domestic loans and advances decreased by ¥42,371 million comparedto the previous fiscal year to ¥240,663 million for the fiscal year ended March 31, 2015, primarily due to adecrease in charge-offs related to customers from the real estate and goods rental and leasing, and constructionindustries. Charge-offs of foreign loans and advances decreased by ¥10,414 million compared to the previousfiscal year to ¥9,233 million for the fiscal year ended March 31, 2015.
Fiscal Year Ended March 31, 2014 Compared to Fiscal Year Ended March 31, 2013
For the fiscal year ended March 31, 2014, the allowance for loan losses decreased by ¥311,813 million, or25%, from ¥1,262,478 million at March 31, 2013 to ¥950,665 million at March 31, 2014, as the previouslyrecognized allowance for loan losses amounting to ¥25,806 million was reversed.
For the first half of the fiscal year ended March 31, 2014, the Japanese economy continued its gradualrecovery. Quarter-on-quarter growth rates of Japanese GDP were 0.7% for the period from April to June 2013and 0.3% for the period from July to September 2013. For the second half of the fiscal year, resilient privateconsumption, a pick-up in private investment, and rush demand ahead of the consumption tax increase in April
90

2014 supported the growth of the Japanese economy. As a result, Japanese GDP increased, on a quarter-on-quarter basis, by 0.1% for the period from October to December 2013 and by 1.6% for the period from January toMarch 2014. Consequently, Japanese GDP increased by 2.3% for the fiscal year ended March 31, 2014,compared with an increase of 0.7% in the previous fiscal year.
Charge-offs increased by ¥38,483 million from the previous fiscal year to ¥302,681 million for the fiscalyear ended March 31, 2014. The overall charge-offs of domestic loans and advances increased by¥41,897 million compared to the previous fiscal year to ¥283,034 million for the fiscal year ended March 31,2014, primarily due to an increase in charge-offs related to customers from the real estate and goods rental andleasing industries. Charge-offs of foreign loans and advances decreased by ¥3,414 million compared to theprevious fiscal year to ¥19,647 million for the fiscal year ended March 31, 2014.
Because both charge-offs, which are recognized through the sales of loans and write-offs, and a reversal ofprovision for loan losses decrease the balance of the allowance for loan losses, the overall allowance for loanlosses decreased by ¥311,813 million at March 31, 2014 compared to March 31, 2013. The decrease wasprimarily due to a decrease in allowance for loan losses related to customers from the real estate and goods rentaland leasing industries.
The following table shows our allowance for loan losses for each of the periods indicated.
For the fiscal year ended March 31,
2015 2014 2013
(In millions)
Allowance for loan losses at beginning of period . . . . . . . . . . . . . . . . . . . . ¥950,665 ¥1,262,478 ¥1,381,164Provision (credit) for loan losses . . . . . . . . . . . . . . . . . . . . . . . . . . . . . . . . . 79,552 (25,806) 138,375Charge-offs:
Domestic . . . . . . . . . . . . . . . . . . . . . . . . . . . . . . . . . . . . . . . . . . . . . . . . 240,663 283,034 241,137Foreign . . . . . . . . . . . . . . . . . . . . . . . . . . . . . . . . . . . . . . . . . . . . . . . . . 9,233 19,647 23,061
Total . . . . . . . . . . . . . . . . . . . . . . . . . . . . . . . . . . . . . . . . . . . . . . . 249,896 302,681 264,198
Recoveries:Domestic . . . . . . . . . . . . . . . . . . . . . . . . . . . . . . . . . . . . . . . . . . . . . . . . 9,517 9,293 10,103Foreign . . . . . . . . . . . . . . . . . . . . . . . . . . . . . . . . . . . . . . . . . . . . . . . . . 380 362 333
Total . . . . . . . . . . . . . . . . . . . . . . . . . . . . . . . . . . . . . . . . . . . . . . . 9,897 9,655 10,436
Net charge-offs . . . . . . . . . . . . . . . . . . . . . . . . . . . . . . . . . . . . . . . . . . . . . . . 239,999 293,026 253,762Others(1) . . . . . . . . . . . . . . . . . . . . . . . . . . . . . . . . . . . . . . . . . . . . . . . . . . . . 3,334 7,019 (3,299)
Allowance for loan losses at end of period . . . . . . . . . . . . . . . . . . . . . . . . . ¥793,552 ¥ 950,665 ¥1,262,478
(1) Others mainly include foreign exchange translations for the fiscal years ended March 31, 2015 and 2014, whereas the amount for thefiscal year ended March 31, 2013 mainly includes foreign exchange translations as well as the exclusion of the allowance for loan lossesrelated to ORIX Credit, as the Bank transferred all of its shares of ORIX Credit to ORIX in June 2012.
Impaired Loans and Advances
A portion of the total domestic and foreign loans and advances consists of impaired loans and advances,which are comprised of “potentially bankrupt, effectively bankrupt and bankrupt (loans and advances),” “pastdue three months or more (loans),” “restructured (loans)” and “other impaired (loans and advances).” The loansand advances for which management has serious doubts about the ability of the borrowers to comply in the nearfuture with the repayment terms are wholly included in impaired loans and advances.
“Potentially bankrupt, effectively bankrupt and bankrupt (loans and advances)” comprise loans andadvances to borrowers that are perceived to have a high risk of falling into bankruptcy, may not have been legallyor formally declared bankrupt but are essentially bankrupt, or have been legally or formally declared bankrupt.
91

Loans classified as “past due three months or more (loans)” represent those loans that are three months ormore past due as to principal or interest, which are not included in “potentially bankrupt, effectively bankruptand bankrupt (loans and advances).”
The category “restructured (loans)” comprises loans not included above for which the terms of the loanshave been modified to grant concessions because of problems with the borrower.
“Other impaired (loans and advances)” represent impaired loans and advances, which are not included in“potentially bankrupt, effectively bankrupt and bankrupt (loans and advances),” “past due three months or more(loans),” or “restructured (loans),” but for which information about credit problems cause management to classifythem as impaired loans and advances.
92
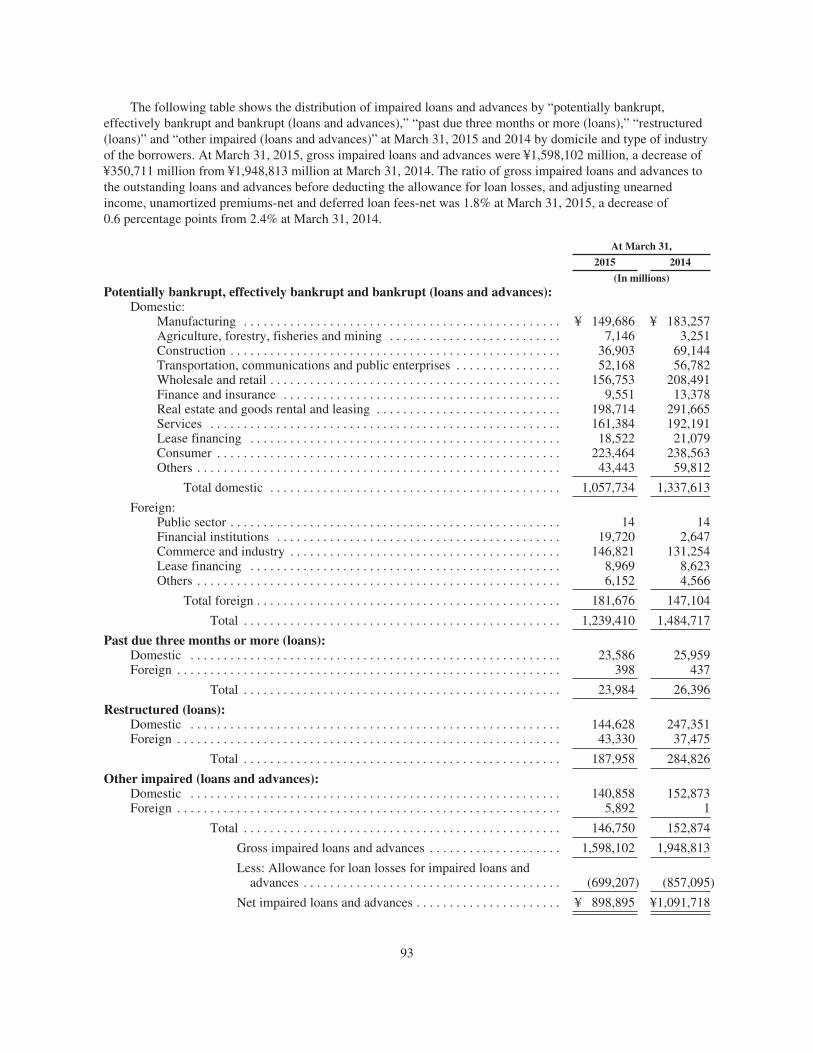
The following table shows the distribution of impaired loans and advances by “potentially bankrupt,effectively bankrupt and bankrupt (loans and advances),” “past due three months or more (loans),” “restructured(loans)” and “other impaired (loans and advances)” at March 31, 2015 and 2014 by domicile and type of industryof the borrowers. At March 31, 2015, gross impaired loans and advances were ¥1,598,102 million, a decrease of¥350,711 million from ¥1,948,813 million at March 31, 2014. The ratio of gross impaired loans and advances tothe outstanding loans and advances before deducting the allowance for loan losses, and adjusting unearnedincome, unamortized premiums-net and deferred loan fees-net was 1.8% at March 31, 2015, a decrease of0.6 percentage points from 2.4% at March 31, 2014.
At March 31,
2015 2014
(In millions)Potentially bankrupt, effectively bankrupt and bankrupt (loans and advances):
Domestic:Manufacturing . . . . . . . . . . . . . . . . . . . . . . . . . . . . . . . . . . . . . . . . . . . . . . . . ¥ 149,686 ¥ 183,257Agriculture, forestry, fisheries and mining . . . . . . . . . . . . . . . . . . . . . . . . . . 7,146 3,251Construction . . . . . . . . . . . . . . . . . . . . . . . . . . . . . . . . . . . . . . . . . . . . . . . . . . 36,903 69,144Transportation, communications and public enterprises . . . . . . . . . . . . . . . . 52,168 56,782Wholesale and retail . . . . . . . . . . . . . . . . . . . . . . . . . . . . . . . . . . . . . . . . . . . . 156,753 208,491Finance and insurance . . . . . . . . . . . . . . . . . . . . . . . . . . . . . . . . . . . . . . . . . . 9,551 13,378Real estate and goods rental and leasing . . . . . . . . . . . . . . . . . . . . . . . . . . . . 198,714 291,665Services . . . . . . . . . . . . . . . . . . . . . . . . . . . . . . . . . . . . . . . . . . . . . . . . . . . . . 161,384 192,191Lease financing . . . . . . . . . . . . . . . . . . . . . . . . . . . . . . . . . . . . . . . . . . . . . . . 18,522 21,079Consumer . . . . . . . . . . . . . . . . . . . . . . . . . . . . . . . . . . . . . . . . . . . . . . . . . . . . 223,464 238,563Others . . . . . . . . . . . . . . . . . . . . . . . . . . . . . . . . . . . . . . . . . . . . . . . . . . . . . . . 43,443 59,812
Total domestic . . . . . . . . . . . . . . . . . . . . . . . . . . . . . . . . . . . . . . . . . . . . 1,057,734 1,337,613
Foreign:Public sector . . . . . . . . . . . . . . . . . . . . . . . . . . . . . . . . . . . . . . . . . . . . . . . . . . 14 14Financial institutions . . . . . . . . . . . . . . . . . . . . . . . . . . . . . . . . . . . . . . . . . . . 19,720 2,647Commerce and industry . . . . . . . . . . . . . . . . . . . . . . . . . . . . . . . . . . . . . . . . . 146,821 131,254Lease financing . . . . . . . . . . . . . . . . . . . . . . . . . . . . . . . . . . . . . . . . . . . . . . . 8,969 8,623Others . . . . . . . . . . . . . . . . . . . . . . . . . . . . . . . . . . . . . . . . . . . . . . . . . . . . . . . 6,152 4,566
Total foreign . . . . . . . . . . . . . . . . . . . . . . . . . . . . . . . . . . . . . . . . . . . . . . 181,676 147,104
Total . . . . . . . . . . . . . . . . . . . . . . . . . . . . . . . . . . . . . . . . . . . . . . . . 1,239,410 1,484,717
Past due three months or more (loans):Domestic . . . . . . . . . . . . . . . . . . . . . . . . . . . . . . . . . . . . . . . . . . . . . . . . . . . . . . . . 23,586 25,959Foreign . . . . . . . . . . . . . . . . . . . . . . . . . . . . . . . . . . . . . . . . . . . . . . . . . . . . . . . . . . 398 437
Total . . . . . . . . . . . . . . . . . . . . . . . . . . . . . . . . . . . . . . . . . . . . . . . . 23,984 26,396
Restructured (loans):Domestic . . . . . . . . . . . . . . . . . . . . . . . . . . . . . . . . . . . . . . . . . . . . . . . . . . . . . . . . 144,628 247,351Foreign . . . . . . . . . . . . . . . . . . . . . . . . . . . . . . . . . . . . . . . . . . . . . . . . . . . . . . . . . . 43,330 37,475
Total . . . . . . . . . . . . . . . . . . . . . . . . . . . . . . . . . . . . . . . . . . . . . . . . 187,958 284,826
Other impaired (loans and advances):Domestic . . . . . . . . . . . . . . . . . . . . . . . . . . . . . . . . . . . . . . . . . . . . . . . . . . . . . . . . 140,858 152,873Foreign . . . . . . . . . . . . . . . . . . . . . . . . . . . . . . . . . . . . . . . . . . . . . . . . . . . . . . . . . . 5,892 1
Total . . . . . . . . . . . . . . . . . . . . . . . . . . . . . . . . . . . . . . . . . . . . . . . . 146,750 152,874
Gross impaired loans and advances . . . . . . . . . . . . . . . . . . . . 1,598,102 1,948,813
Less: Allowance for loan losses for impaired loans andadvances . . . . . . . . . . . . . . . . . . . . . . . . . . . . . . . . . . . . . . . (699,207) (857,095)
Net impaired loans and advances . . . . . . . . . . . . . . . . . . . . . . ¥ 898,895 ¥1,091,718
93
In addition to the discussion in this section, see Note 45 “Financial Risk Management—Credit Risk” to ourconsolidated financial statements included elsewhere in this annual report.
Investment Securities
Our investment securities, including available-for-sale financial assets and held-to-maturity investments,totaled ¥24,239,656 million at March 31, 2015, an increase of ¥2,186,658 million, or 10%, from¥22,052,998 million at March 31, 2014. The increase of our investment securities was primarily due to anincrease in our holdings of available-for-sale bonds.
Our bond portfolio is principally held for asset and liability management purposes. Our bond portfoliomostly consisted of Japanese government bonds, U.S. Treasury and other U.S. government agency bonds, andbonds issued by other governments and official institutions.
Our held-to-maturity investments amounted to ¥3,396,895 million at March 31, 2015, a decrease of¥1,131,359 million, or 25%, from ¥4,528,254 million at March 31, 2014, primarily due to a decrease in Japanesegovernment bonds, which are the principal components of our held-to-maturity investments portfolio.
Domestic available-for-sale financial assets included ¥9,673,700 million of domestic debt instruments atMarch 31, 2015, which was an increase of ¥770,807 million, or 9%, from ¥8,902,893 million at March 31, 2014.The increase was primarily due to an increase in our holdings of Japanese government bonds. Moreover, wemanage the average duration of our Japanese government bonds to be short, and Japanese government bondswith a maturity of less than a year and those with a maturity of less than five years accounted for 18% and 100%,respectively, of our total Japanese government bonds at March 31, 2015. As for our foreign available-for-salefinancial assets, we had ¥4,739,748 million of foreign debt instruments, including ¥4,267,705 million of bondsissued by foreign governments, government agencies and official institutions, at March 31, 2015, which was anincrease of ¥1,168,345 million, or 33%, from ¥3,571,403 million at March 31, 2014. The increase was primarilydue to an increase in our holdings of non-U.S. foreign government bonds. Of our bonds issued by foreigngovernments, government agencies and official institutions, which mainly consisted of U.S. government bonds,66% had a maturity of less than five years.
We had ¥5,676,371 million of domestic equity instruments and ¥752,942 million of foreign equity instrumentsat March 31, 2015. Our domestic equity instruments, which consisted principally of publicly traded Japanese stocksand included common and preferred stocks issued by our customers, increased by ¥1,206,124 million, or 27%, from¥4,470,247 million at March 31, 2014. Net unrealized gains on our domestic equity instruments increased by¥1,005,748 million, or 50%, from ¥2,025,978 million at March 31, 2014 to ¥3,031,726 million at March 31, 2015.The increase was primarily due to a rise in the market prices of these stocks in a market environment where, asdescribed in “Item 5. Operating and Financial Review and Prospects—Overview—Operating Environment,” theNikkei Stock Average rose from ¥14,827.83 at March 31, 2014 to ¥19,206.99 at March 31, 2015. Net unrealizedgains on our foreign equity instruments increased by ¥101,904 million, or 47%, from ¥215,814 million at March 31,2014 to ¥317,718 million at March 31, 2015.
We recognize the risks associated with our equity portfolio, owing to its volatility, and have been activelylooking to minimize the negative effect of holding a large equity portfolio through economic hedging andderivative transactions.
We have no transactions pursuant to repurchase agreements, securities lending transactions or othertransactions involving the transfer of financial assets with an obligation to repurchase such transferred assets thatare treated as sales for accounting purposes.
94

The following tables show the amortized cost, gross unrealized gains and losses and fair value of ourinvestment securities, which are classified as held-to-maturity investments and available-for-sale financial assetsat March 31, 2015, 2014 and 2013.
At March 31, 2015
Amortizedcost
Gross unrealizedgains
Gross unrealizedlosses Fair value
(In millions)
Held-to-maturity investments:Domestic:
Japanese government bonds . . . . . . . . . . ¥ 3,282,787 ¥ 20,441 ¥ — ¥ 3,303,228Japanese municipal bonds . . . . . . . . . . . 67,843 222 — 68,065Japanese corporate bonds . . . . . . . . . . . . 46,265 174 — 46,439
Total domestic . . . . . . . . . . . . . . . . 3,396,895 20,837 — 3,417,732
Foreign . . . . . . . . . . . . . . . . . . . . . . . . . . . . . . — — — —
Total . . . . . . . . . . . . . . . . . . . . ¥ 3,396,895 ¥ 20,837 ¥ — ¥ 3,417,732
Available-for-sale financial assets:Domestic:
Japanese government bonds . . . . . . . . . . ¥ 9,376,173 ¥ 17,318 ¥ 3,532 ¥ 9,389,959Japanese municipal bonds . . . . . . . . . . . 51,882 281 13 52,150Japanese corporate bonds . . . . . . . . . . . . 229,726 1,928 63 231,591
Total domestic debt instruments . . . 9,657,781 19,527 3,608 9,673,700Equity instruments . . . . . . . . . . . . . . . . . 2,644,645 3,033,813 2,087 5,676,371
Total domestic . . . . . . . . . . . . 12,302,426 3,053,340 5,695 15,350,071
Foreign:U.S. Treasury and other U.S.
government agency bonds . . . . . . . . . 2,064,938 2,497 5,392 2,062,043Bonds issued by other governments and
official institutions . . . . . . . . . . . . . . . 2,178,318 27,976 632 2,205,662Mortgage-backed securities . . . . . . . . . . 257,277 231 408 257,100Other debt instruments . . . . . . . . . . . . . . 213,815 1,621 493 214,943
Total foreign debt instruments . . . . 4,714,348 32,325 6,925 4,739,748Equity instruments . . . . . . . . . . . . . . . . . 435,224 317,801 83 752,942
Total foreign . . . . . . . . . . . . . . 5,149,572 350,126 7,008 5,492,690
Total . . . . . . . . . . . . . . . . ¥ 17,451,998 ¥ 3,403,466 ¥ 12,703 ¥ 20,842,761
95
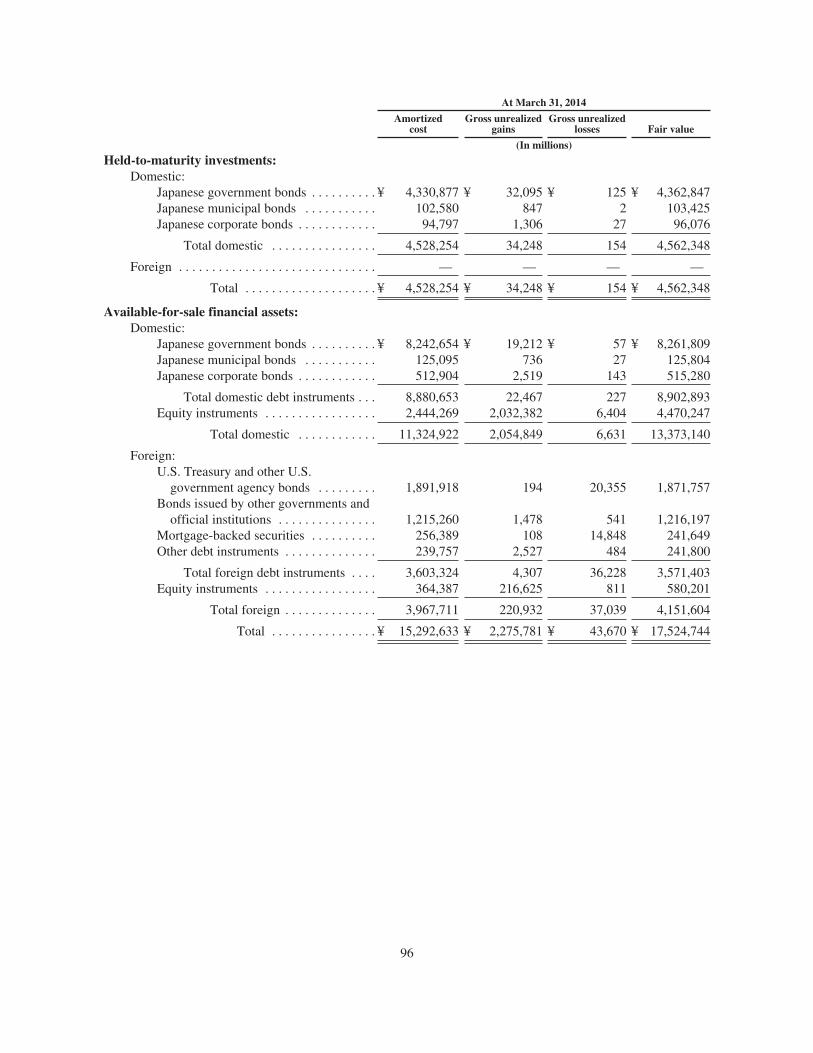
At March 31, 2014
Amortizedcost
Gross unrealizedgains
Gross unrealizedlosses Fair value
(In millions)
Held-to-maturity investments:Domestic:
Japanese government bonds . . . . . . . . . . ¥ 4,330,877 ¥ 32,095 ¥ 125 ¥ 4,362,847Japanese municipal bonds . . . . . . . . . . . 102,580 847 2 103,425Japanese corporate bonds . . . . . . . . . . . . 94,797 1,306 27 96,076
Total domestic . . . . . . . . . . . . . . . . 4,528,254 34,248 154 4,562,348
Foreign . . . . . . . . . . . . . . . . . . . . . . . . . . . . . . — — — —
Total . . . . . . . . . . . . . . . . . . . . ¥ 4,528,254 ¥ 34,248 ¥ 154 ¥ 4,562,348
Available-for-sale financial assets:Domestic:
Japanese government bonds . . . . . . . . . . ¥ 8,242,654 ¥ 19,212 ¥ 57 ¥ 8,261,809Japanese municipal bonds . . . . . . . . . . . 125,095 736 27 125,804Japanese corporate bonds . . . . . . . . . . . . 512,904 2,519 143 515,280
Total domestic debt instruments . . . 8,880,653 22,467 227 8,902,893Equity instruments . . . . . . . . . . . . . . . . . 2,444,269 2,032,382 6,404 4,470,247
Total domestic . . . . . . . . . . . . 11,324,922 2,054,849 6,631 13,373,140
Foreign:U.S. Treasury and other U.S.
government agency bonds . . . . . . . . . 1,891,918 194 20,355 1,871,757Bonds issued by other governments and
official institutions . . . . . . . . . . . . . . . 1,215,260 1,478 541 1,216,197Mortgage-backed securities . . . . . . . . . . 256,389 108 14,848 241,649Other debt instruments . . . . . . . . . . . . . . 239,757 2,527 484 241,800
Total foreign debt instruments . . . . 3,603,324 4,307 36,228 3,571,403Equity instruments . . . . . . . . . . . . . . . . . 364,387 216,625 811 580,201
Total foreign . . . . . . . . . . . . . . 3,967,711 220,932 37,039 4,151,604
Total . . . . . . . . . . . . . . . . ¥ 15,292,633 ¥ 2,275,781 ¥ 43,670 ¥ 17,524,744
96

At March 31, 2013
Amortizedcost
Gross unrealizedgains
Gross unrealizedlosses Fair value
(In millions)
Held-to-maturity investments:Domestic:
Japanese government bonds . . . . . . . . . . ¥ 5,514,196 ¥ 57,018 ¥ 37 ¥ 5,571,177Japanese municipal bonds . . . . . . . . . . . 159,148 1,883 — 161,031Japanese corporate bonds . . . . . . . . . . . . 166,913 2,547 4 169,456
Total domestic . . . . . . . . . . . . . . . . 5,840,257 61,448 41 5,901,664
Foreign . . . . . . . . . . . . . . . . . . . . . . . . . . . . . . — — — —
Total . . . . . . . . . . . . . . . . . . . . ¥ 5,840,257 ¥ 61,448 ¥ 41 ¥ 5,901,664
Available-for-sale financial assets:Domestic:
Japanese government bonds . . . . . . . . . . ¥ 19,529,436 ¥ 47,954 ¥ 255 ¥ 19,577,135Japanese municipal bonds . . . . . . . . . . . 196,263 1,658 14 197,907Japanese corporate bonds . . . . . . . . . . . . 522,489 4,194 419 526,264
Total domestic debt instruments . . . 20,248,188 53,806 688 20,301,306Equity instruments . . . . . . . . . . . . . . . . . 2,325,705 1,616,621 3,795 3,938,531
Total domestic . . . . . . . . . . . . 22,573,893 1,670,427 4,483 24,239,837
Foreign:U.S. Treasury and other U.S.
government agency bonds . . . . . . . . . 3,803,402 3,068 1,990 3,804,480Bonds issued by other governments and
official institutions . . . . . . . . . . . . . . . 1,213,015 2,997 346 1,215,666Mortgage-backed securities . . . . . . . . . . 331,881 517 3,794 328,604Other debt instruments . . . . . . . . . . . . . . 296,004 3,559 420 299,143
Total foreign debt instruments . . . . 5,644,302 10,141 6,550 5,647,893Equity instruments . . . . . . . . . . . . . . . . . 340,528 184,183 99 524,612
Total foreign . . . . . . . . . . . . . . 5,984,830 194,324 6,649 6,172,505
Total . . . . . . . . . . . . . . . . ¥ 28,558,723 ¥ 1,864,751 ¥ 11,132 ¥ 30,412,342
97

The following tables show the fair value and gross unrealized losses of our investment securities, aggregatedby the length of time that the individual securities have been in a continuous unrealized loss position atMarch 31, 2015, 2014 and 2013. None of the available-for-sale equity instruments included in the tables havebeen in a continuous unrealized loss position for twelve months or more, since under our accounting policy, asignificant or prolonged decline in the fair value of an equity instrument below its cost is considered to be anobjective evidence of impairment.
At March 31, 2015
Less than twelve months Twelve months or more Total
Fair value
Grossunrealized
losses Fair value
Grossunrealized
losses Fair value
Grossunrealized
losses
(In millions)Held-to-maturity investments:
Domestic:Japanese government bonds . . . . . ¥ — ¥ — ¥ — ¥ — ¥ — ¥ —Japanese municipal bonds . . . . . . — — — — — —Japanese corporate bonds . . . . . . . — — — — — —
Total domestic . . . . . . . . . . . . . — — — — — —
Foreign . . . . . . . . . . . . . . . . . . . . . . . — — — — — —
Total . . . . . . . . . . . . . . . . . . . ¥ — ¥ — ¥ — ¥ — ¥ — ¥ —
Available-for-sale financial assets:Domestic:
Japanese government bonds . . . . . ¥ 2,067,924 ¥ 3,531 ¥ 22 ¥ 1 ¥ 2,067,946 ¥ 3,532Japanese municipal bonds . . . . . . 1,550 8 1,476 5 3,026 13Japanese corporate bonds . . . . . . . 36,668 61 498 2 37,166 63
Total domestic debtinstruments . . . . . . . . . . . . . . 2,106,142 3,600 1,996 8 2,108,138 3,608
Equity instruments . . . . . . . . . . . . 37,689 2,087 — — 37,689 2,087
Total domestic . . . . . . . . . . . 2,143,831 5,687 1,996 8 2,145,827 5,695
Foreign:U.S. Treasury and other U.S.
government agency bonds . . . . 387,664 2,535 441,641 2,857 829,305 5,392Bonds issued by other
governments and officialinstitutions . . . . . . . . . . . . . . . . 633,935 604 23,507 28 657,442 632
Mortgage-backed securities . . . . . — — 15,208 408 15,208 408Other debt instruments . . . . . . . . . 89,627 110 1,909 383 91,536 493
Total foreign debtinstruments . . . . . . . . . . . . . . 1,111,226 3,249 482,265 3,676 1,593,491 6,925
Equity instruments . . . . . . . . . . . . 5,066 83 — — 5,066 83
Total foreign . . . . . . . . . . . . . 1,116,292 3,332 482,265 3,676 1,598,557 7,008
Total . . . . . . . . . . . . . . . . . ¥ 3,260,123 ¥ 9,019 ¥ 484,261 ¥ 3,684 ¥ 3,744,384 ¥ 12,703
98

At March 31, 2014
Less than twelve months Twelve months or more Total
Fair value
Grossunrealized
losses Fair value
Grossunrealized
losses Fair value
Grossunrealized
losses
(In millions)Held-to-maturity investments:
Domestic:Japanese government bonds . . . . . ¥ — ¥ — ¥ 269,649 ¥ 125 ¥ 269,649 ¥ 125Japanese municipal bonds . . . . . . 1,882 2 — — 1,882 2Japanese corporate bonds . . . . . . . 6,585 19 1,208 8 7,793 27
Total domestic . . . . . . . . . . . . . 8,467 21 270,857 133 279,324 154
Foreign . . . . . . . . . . . . . . . . . . . . . . . — — — — — —
Total . . . . . . . . . . . . . . . . . . . ¥ 8,467 ¥ 21 ¥ 270,857 ¥ 133 ¥ 279,324 ¥ 154
Available-for-sale financial assets:Domestic:
Japanese government bonds . . . . . ¥ 35,592 ¥ 57 ¥ 22 ¥ — ¥ 35,614 ¥ 57Japanese municipal bonds . . . . . . 4,740 18 2,277 9 7,017 27Japanese corporate bonds . . . . . . . 48,777 74 22,476 69 71,253 143
Total domestic debtinstruments . . . . . . . . . . . . . . 89,109 149 24,775 78 113,884 227
Equity instruments . . . . . . . . . . . . 123,013 6,404 — — 123,013 6,404
Total domestic . . . . . . . . . . . 212,122 6,553 24,775 78 236,897 6,631
Foreign:U.S. Treasury and other U.S.
government agency bonds . . . . 1,095,165 15,531 97,688 4,824 1,192,853 20,355Bonds issued by other
governments and officialinstitutions . . . . . . . . . . . . . . . . 540,015 541 — — 540,015 541
Mortgage-backed securities . . . . . 224,568 14,846 426 2 224,994 14,848Other debt instruments . . . . . . . . . 25,733 444 51,751 40 77,484 484
Total foreign debtinstruments . . . . . . . . . . . . . . 1,885,481 31,362 149,865 4,866 2,035,346 36,228
Equity instruments . . . . . . . . . . . . 13,704 811 — — 13,704 811
Total foreign . . . . . . . . . . . . . 1,899,185 32,173 149,865 4,866 2,049,050 37,039
Total . . . . . . . . . . . . . . . . . ¥ 2,111,307 ¥ 38,726 ¥ 174,640 ¥ 4,944 ¥ 2,285,947 ¥ 43,670
99

At March 31, 2013
Less than twelve months Twelve months or more Total
Fair value
Grossunrealized
losses Fair value
Grossunrealized
losses Fair value
Grossunrealized
losses
(In millions)Held-to-maturity investments:
Domestic:Japanese government bonds . . . . . ¥ 269,676 ¥ 37 ¥ — ¥ — ¥ 269,676 ¥ 37Japanese municipal bonds . . . . . . 373 — — — 373 —Japanese corporate bonds . . . . . . . 716 — 507 4 1,223 4
Total domestic . . . . . . . . . . . . . 270,765 37 507 4 271,272 41
Foreign . . . . . . . . . . . . . . . . . . . . . . . — — — — — —
Total . . . . . . . . . . . . . . . . . . . ¥ 270,765 ¥ 37 ¥ 507 ¥ 4 ¥ 271,272 ¥ 41
Available-for-sale financial assets:Domestic:
Japanese government bonds . . . . . ¥ 1,714,251 ¥ 255 ¥ 23 ¥ — ¥ 1,714,274 ¥ 255Japanese municipal bonds . . . . . . 2,244 14 127 — 2,371 14Japanese corporate bonds . . . . . . . 41,272 115 13,890 304 55,162 419
Total domestic debtinstruments . . . . . . . . . . . . . . 1,757,767 384 14,040 304 1,771,807 688
Equity instruments . . . . . . . . . . . . 78,378 3,795 — — 78,378 3,795
Total domestic . . . . . . . . . . . 1,836,145 4,179 14,040 304 1,850,185 4,483
Foreign:U.S. Treasury and other U.S.
government agency bonds . . . . 1,148,832 1,990 — — 1,148,832 1,990Bonds issued by other
governments and officialinstitutions . . . . . . . . . . . . . . . . 429,021 309 33,638 37 462,659 346
Mortgage-backed securities . . . . . 299,869 3,794 — — 299,869 3,794Other debt instruments . . . . . . . . . 15,120 55 68,011 365 83,131 420
Total foreign debtinstruments . . . . . . . . . . . . . . 1,892,842 6,148 101,649 402 1,994,491 6,550
Equity instruments . . . . . . . . . . . . 17,831 99 — — 17,831 99
Total foreign . . . . . . . . . . . . . 1,910,673 6,247 101,649 402 2,012,322 6,649
Total . . . . . . . . . . . . . . . . . ¥ 3,746,818 ¥ 10,426 ¥ 115,689 ¥ 706 ¥ 3,862,507 ¥ 11,132
100

Trading Assets
The following table shows our trading assets at March 31, 2015 and 2014. Our trading assets were¥3,243,185 million at March 31, 2015, a decrease of ¥314,360 million from ¥3,557,545 million at March 31,2014. The decrease in trading assets was primarily due to a decrease in our holdings of Japanese governmentbonds.
At March 31,
2015 2014
(In millions)Debt instruments . . . . . . . . . . . . . . . . . . . . . . . . . . . . . . . . . . . . . . . . . . . . . . . . . . . . . . . ¥2,618,593 ¥3,263,085Equity instruments . . . . . . . . . . . . . . . . . . . . . . . . . . . . . . . . . . . . . . . . . . . . . . . . . . . . . . 624,592 294,460
Total trading assets . . . . . . . . . . . . . . . . . . . . . . . . . . . . . . . . . . . . . . . . . . . . . . . . . ¥3,243,185 ¥3,557,545
Financial Assets at Fair Value Through Profit or Loss
The following table shows the fair value of our financial assets at fair value through profit or loss atMarch 31, 2015 and 2014. The fair value was ¥1,785,684 million at March 31, 2015, a decrease of¥54,571 million from ¥1,840,255 million at March 31, 2014, primarily due to a decrease in our holdings of debtinstruments.
At March 31,
2015 2014
(In millions)Debt instruments . . . . . . . . . . . . . . . . . . . . . . . . . . . . . . . . . . . . . . . . . . . . . . . . . . . . . . . ¥1,654,259 ¥1,697,872Equity instruments . . . . . . . . . . . . . . . . . . . . . . . . . . . . . . . . . . . . . . . . . . . . . . . . . . . . . . 131,425 142,383
Total financial assets at fair value through profit or loss . . . . . . . . . . . . . . . . . . . . ¥1,785,684 ¥1,840,255
Exposures to Selected European Countries
The following tables show exposures to Greece, Italy, Ireland, Portugal and Spain at March 31, 2015 and2014. Our exposures to those countries consisted mainly of loans, trade financing, leases, guarantees and unusedcommitments to large corporations, and project finance transactions. All figures in this subsection are based onthe data collected for our internal risk management.
At March 31, 2015
SovereignFinancial
institutionsNon-financialcorporations Total
(In billions)Greece . . . . . . . . . . . . . . . . . . . . . . . . . . . . . . . . . . . . . . . ¥ — ¥ — ¥ 7.6 ¥ 7.6Italy . . . . . . . . . . . . . . . . . . . . . . . . . . . . . . . . . . . . . . . . . — 0.9 221.9 222.8Ireland . . . . . . . . . . . . . . . . . . . . . . . . . . . . . . . . . . . . . . . — — 236.0 236.0Portugal . . . . . . . . . . . . . . . . . . . . . . . . . . . . . . . . . . . . . . — — 6.1 6.1Spain . . . . . . . . . . . . . . . . . . . . . . . . . . . . . . . . . . . . . . . . . 2.3 0.2 260.5 263.0
Total . . . . . . . . . . . . . . . . . . . . . . . . . . . . . . . . . . . . . ¥ 2.3 ¥ 1.1 ¥ 732.1 ¥ 735.5
At March 31, 2014
SovereignFinancial
institutionsNon-financialcorporations Total
(In billions)Greece . . . . . . . . . . . . . . . . . . . . . . . . . . . . . . . . . . . . . . . ¥ — ¥ — ¥ 6.4 ¥ 6.4Italy . . . . . . . . . . . . . . . . . . . . . . . . . . . . . . . . . . . . . . . . . 0.2 1.1 290.5 291.8Ireland . . . . . . . . . . . . . . . . . . . . . . . . . . . . . . . . . . . . . . . — — 103.7 103.7Portugal . . . . . . . . . . . . . . . . . . . . . . . . . . . . . . . . . . . . . . — — 4.4 4.4Spain . . . . . . . . . . . . . . . . . . . . . . . . . . . . . . . . . . . . . . . . . 1.2 0.2 249.7 251.1
Total . . . . . . . . . . . . . . . . . . . . . . . . . . . . . . . . . . . . . ¥ 1.4 ¥ 1.3 ¥ 654.7 ¥ 657.4
101

Liabilities
Our total liabilities increased by ¥18,944,765 million from ¥149,215,851 million at March 31, 2014 to¥168,160,616 million at March 31, 2015, primarily due to increases in deposits, borrowings and debt securities inissue.
The following table shows our liabilities at March 31, 2015 and 2014.
At March 31,
2015 2014(1)
(In millions)
Deposits . . . . . . . . . . . . . . . . . . . . . . . . . . . . . . . . . . . . . . . . . . . . . . . . . . . . . . . . . . ¥115,833,980 ¥108,370,494Call money and bills sold . . . . . . . . . . . . . . . . . . . . . . . . . . . . . . . . . . . . . . . . . . . . 5,873,124 4,112,429Repurchase agreements and cash collateral on securities lent . . . . . . . . . . . . . . . . 8,820,083 7,041,075Trading liabilities . . . . . . . . . . . . . . . . . . . . . . . . . . . . . . . . . . . . . . . . . . . . . . . . . . 2,193,400 1,865,243Derivative financial instruments . . . . . . . . . . . . . . . . . . . . . . . . . . . . . . . . . . . . . . . 6,739,787 4,980,991Borrowings . . . . . . . . . . . . . . . . . . . . . . . . . . . . . . . . . . . . . . . . . . . . . . . . . . . . . . . 11,217,052 8,463,363Debt securities in issue . . . . . . . . . . . . . . . . . . . . . . . . . . . . . . . . . . . . . . . . . . . . . . 11,051,431 8,769,094Provisions . . . . . . . . . . . . . . . . . . . . . . . . . . . . . . . . . . . . . . . . . . . . . . . . . . . . . . . . 207,624 225,473Other liabilities . . . . . . . . . . . . . . . . . . . . . . . . . . . . . . . . . . . . . . . . . . . . . . . . . . . . 5,548,965 5,143,853Current tax liabilities . . . . . . . . . . . . . . . . . . . . . . . . . . . . . . . . . . . . . . . . . . . . . . . . 111,365 94,585Deferred tax liabilities . . . . . . . . . . . . . . . . . . . . . . . . . . . . . . . . . . . . . . . . . . . . . . . 563,805 149,251
Total liabilities . . . . . . . . . . . . . . . . . . . . . . . . . . . . . . . . . . . . . . . . . . . . . . . . ¥168,160,616 ¥149,215,851
(1) Comparative information has been restated to reflect the adoption of IFRIC Interpretation 21 “Levies.” For more information, see Note 2“Summary of Significant Accounting Policies—New and Amended Accounting Standards Adopted by the SMFG Group” to ourconsolidated financial statements included elsewhere in this annual report.
Deposits
We offer a wide range of standard banking accounts through the offices of our banking subsidiaries inJapan, including non-interest-bearing demand deposits, interest-bearing demand deposits, deposits at notice, timedeposits and negotiable certificates of deposit. Domestic deposits, approximately 80% of total deposits, are ourprincipal source of funds for our domestic operations. The deposits in the domestic offices of our bankingsubsidiaries are principally from individuals and private corporations, with the balance from governmental bodies(including municipal authorities) and financial institutions.
The Bank’s foreign offices accept deposits mainly in U.S. dollars, but also in yen and other currencies, andare active participants in the Euro-currency market as well as the United States domestic money market. Foreigndeposits mainly consist of stable types of deposits, such as deposits at notice, time deposits, and negotiablecertificates of deposit. These deposits typically pay interest rates determined with reference to market rates suchas LIBOR.
Our deposit balances at March 31, 2015 were ¥115,833,980 million, an increase of ¥7,463,486 million,or 7%, from ¥108,370,494 million at March 31, 2014, primarily due to increases in demand deposits at domesticoffices and time deposits and deposits at notice at foreign offices, reflecting our efforts to expand and diversifyour foreign currency funding sources.
102

The following table shows a breakdown of our domestic and foreign offices’ deposits at the dates indicated.
At March 31,
2015 2014
(In millions)
Domestic offices:Non-interest-bearing demand deposits . . . . . . . . . . . . . . . . . . . . . . . . . . . . ¥ 15,387,795 ¥ 14,465,654Interest-bearing demand deposits . . . . . . . . . . . . . . . . . . . . . . . . . . . . . . . . 40,593,134 38,652,993Deposits at notice . . . . . . . . . . . . . . . . . . . . . . . . . . . . . . . . . . . . . . . . . . . . 821,717 871,081Time deposits . . . . . . . . . . . . . . . . . . . . . . . . . . . . . . . . . . . . . . . . . . . . . . . 24,186,585 24,136,904Negotiable certificates of deposit . . . . . . . . . . . . . . . . . . . . . . . . . . . . . . . . 5,705,862 5,458,722Others . . . . . . . . . . . . . . . . . . . . . . . . . . . . . . . . . . . . . . . . . . . . . . . . . . . . . 5,736,495 4,977,829
Total domestic offices . . . . . . . . . . . . . . . . . . . . . . . . . . . . . . . . . . . . . 92,431,588 88,563,183
Foreign offices:Non-interest-bearing demand deposits . . . . . . . . . . . . . . . . . . . . . . . . . . . . 862,698 607,657Interest-bearing demand deposits . . . . . . . . . . . . . . . . . . . . . . . . . . . . . . . . 1,448,643 1,129,154Deposits at notice . . . . . . . . . . . . . . . . . . . . . . . . . . . . . . . . . . . . . . . . . . . . 7,968,300 6,499,694Time deposits . . . . . . . . . . . . . . . . . . . . . . . . . . . . . . . . . . . . . . . . . . . . . . . 4,897,880 3,200,421Negotiable certificates of deposit . . . . . . . . . . . . . . . . . . . . . . . . . . . . . . . . 8,120,036 8,254,818Others . . . . . . . . . . . . . . . . . . . . . . . . . . . . . . . . . . . . . . . . . . . . . . . . . . . . . 104,835 115,567
Total foreign offices . . . . . . . . . . . . . . . . . . . . . . . . . . . . . . . . . . . . . . 23,402,392 19,807,311
Total deposits . . . . . . . . . . . . . . . . . . . . . . . . . . . . . . . . . . . . . . . ¥ 115,833,980 ¥ 108,370,494
Borrowings
Borrowings include short-term borrowings, unsubordinated and subordinated long-term borrowings,liabilities associated with securitization transactions of our own assets, and lease obligations. At March 31, 2015,our borrowings were ¥11,217,052 million, an increase of ¥2,753,689 million, or 33%, from ¥8,463,363 million atMarch 31, 2014, primarily due to an increase in short-term borrowings.
At March 31, 2015, our short-term borrowings accounted for 60% of our total borrowings, and our long-term borrowings accounted for 29% of our total borrowings.
The following table shows the balances with respect to our borrowings at March 31, 2015 and 2014.
At March 31,
2015 2014
(In millions)
Short-term borrowings . . . . . . . . . . . . . . . . . . . . . . . . . . . . . . . . . . . . . . . . . . . . ¥ 6,746,249 ¥ 3,092,892Long-term borrowings:
Unsubordinated . . . . . . . . . . . . . . . . . . . . . . . . . . . . . . . . . . . . . . . . . . . . . . 2,947,573 3,885,678Subordinated . . . . . . . . . . . . . . . . . . . . . . . . . . . . . . . . . . . . . . . . . . . . . . . . 317,461 282,450
Liabilities associated with securitization transactions . . . . . . . . . . . . . . . . . . . . 1,103,929 1,108,720Lease obligations . . . . . . . . . . . . . . . . . . . . . . . . . . . . . . . . . . . . . . . . . . . . . . . . . 101,840 93,623
Total borrowings . . . . . . . . . . . . . . . . . . . . . . . . . . . . . . . . . . . . . . . . . ¥ 11,217,052 ¥ 8,463,363
For more information, see Note 18 “Borrowings” to our consolidated financial statements includedelsewhere in this annual report, which sets forth summaries of short- and long-term borrowings with theircontractual interest rates and currencies.
103

Debt Securities in Issue
Debt securities in issue at March 31, 2015 were ¥11,051,431 million, an increase of ¥2,282,337 million, or26%, from ¥8,769,094 million at March 31, 2014, primarily due to increases in commercial paper and seniorbonds, which primarily reflects our efforts to expand foreign currency funding sources.
At March 31,
2015 2014
(In millions)
Commercial paper . . . . . . . . . . . . . . . . . . . . . . . . . . . . . . . . . . . . . . . . . . . . . . . . . . . . . ¥ 4,813,902 ¥3,669,912Bonds . . . . . . . . . . . . . . . . . . . . . . . . . . . . . . . . . . . . . . . . . . . . . . . . . . . . . . . . . . . . . . . 4,461,425 3,399,672Subordinated bonds . . . . . . . . . . . . . . . . . . . . . . . . . . . . . . . . . . . . . . . . . . . . . . . . . . . . 1,776,104 1,699,510
Total debt securities in issue . . . . . . . . . . . . . . . . . . . . . . . . . . . . . . . . . . . . . . . . . ¥11,051,431 ¥8,769,094
For additional information, see Note 19 “Debt Securities in Issue” to our consolidated financial statementsincluded elsewhere in this annual report, which sets forth summaries of debt securities in issue with theircontractual interest rates and currencies.
In the normal course of business, we enter into contractual obligations that require future cash payments.“Item 5.F. Tabular Disclosure of Contractual Obligations” sets forth a summary of our contractual cashobligations at March 31, 2015.
Total Equity
Our total equity increased by ¥1,605,660 million from ¥9,415,190 million at March 31, 2014 to¥11,020,850 million at March 31, 2015, primarily due to increases in retained earnings and other reserves. Theincrease in retained earnings mainly reflected our net profit. The increase in other reserves was primarily due toincreases in available-for-sale financial assets reserve reflecting a rise in market prices of domestic equityinstruments, and exchange differences on translating the foreign operations reserve reflecting the depreciation ofthe yen. For more information, see Note 24 “Shareholders’ Equity” and Note 25 “Non-controlling Interests” toour consolidated financial statements included elsewhere in this annual report.
At March 31,
2015 2014(1)
(In millions)
Capital stock . . . . . . . . . . . . . . . . . . . . . . . . . . . . . . . . . . . . . . . . . . . . . . . . . . . . . . . . . . ¥ 2,337,896 ¥2,337,896Capital surplus . . . . . . . . . . . . . . . . . . . . . . . . . . . . . . . . . . . . . . . . . . . . . . . . . . . . . . . . . 862,971 862,518Retained earnings . . . . . . . . . . . . . . . . . . . . . . . . . . . . . . . . . . . . . . . . . . . . . . . . . . . . . . 3,554,688 3,112,571Other reserves . . . . . . . . . . . . . . . . . . . . . . . . . . . . . . . . . . . . . . . . . . . . . . . . . . . . . . . . . 2,759,084 1,546,826Treasury stock . . . . . . . . . . . . . . . . . . . . . . . . . . . . . . . . . . . . . . . . . . . . . . . . . . . . . . . . . (175,261) (175,115)
Equity attributable to shareholders of Sumitomo Mitsui Financial Group, Inc. . . . 9,339,378 7,684,696Non-controlling interests . . . . . . . . . . . . . . . . . . . . . . . . . . . . . . . . . . . . . . . . . . . . . 1,681,472 1,730,494
Total equity . . . . . . . . . . . . . . . . . . . . . . . . . . . . . . . . . . . . . . . . . . . . . . . . . . . ¥11,020,850 ¥9,415,190
(1) Comparative information has been restated to reflect the adoption of IFRIC Interpretation 21 “Levies.” For more information, see Note 2“Summary of Significant Accounting Policies—New and Amended Accounting Standards Adopted by the SMFG Group” to ourconsolidated financial statements included elsewhere in this annual report.
104

Reconciliation with Japanese GAAP
Our consolidated financial statements are prepared in accordance with IFRS as summarized in Note 2“Summary of Significant Accounting Policies” to our consolidated financial statements included elsewhere inthis annual report. These policies differ in some respects from Japanese GAAP. Under Japanese bankingregulations, we report our annual financial results prepared under Japanese GAAP. To show the majorreconciling items between our IFRS and Japanese GAAP consolidated financial statements, we have providedbelow, with respect to our most recent fiscal year, a reconciliation of consolidated net profit and total equityunder IFRS with those amounts under Japanese GAAP.
At and for the fiscal year endedMarch 31, 2015
Total equity Net profit
(In millions)IFRS . . . . . . . . . . . . . . . . . . . . . . . . . . . . . . . . . . . . . . . . . . . . . . . . . . . . . . . . . . . ¥ 11,020,850 ¥ 722,961Differences arising from different accounting for:
1. Scope of consolidation . . . . . . . . . . . . . . . . . . . . . . . . . . . . . . . . . . . . . . 111,553 3,9102. Derivative financial instruments . . . . . . . . . . . . . . . . . . . . . . . . . . . . . . . 103,591 84,4993. Investment securities . . . . . . . . . . . . . . . . . . . . . . . . . . . . . . . . . . . . . . . . (296,041) (10,232)4. Loans and advances . . . . . . . . . . . . . . . . . . . . . . . . . . . . . . . . . . . . . . . . . (695) 116,3185. Investments in associates and joint ventures . . . . . . . . . . . . . . . . . . . . . . (33,149) (23,604)6. Property, plant and equipment . . . . . . . . . . . . . . . . . . . . . . . . . . . . . . . . (8,039) 1,0187. Lease accounting . . . . . . . . . . . . . . . . . . . . . . . . . . . . . . . . . . . . . . . . . . . (2,001) 2,0008. Defined benefit plans . . . . . . . . . . . . . . . . . . . . . . . . . . . . . . . . . . . . . . . (4,796) (3,080)9. Deferred tax assets . . . . . . . . . . . . . . . . . . . . . . . . . . . . . . . . . . . . . . . . . (64,501) 13,11010. Foreign currency translation . . . . . . . . . . . . . . . . . . . . . . . . . . . . . . . . . . — 23,054
Others . . . . . . . . . . . . . . . . . . . . . . . . . . . . . . . . . . . . . . . . . . . . . . . . . . (133,204) (17,413)Tax effect of the above . . . . . . . . . . . . . . . . . . . . . . . . . . . . . . . . . . . . . 2,704 (44,525)
Japanese GAAP . . . . . . . . . . . . . . . . . . . . . . . . . . . . . . . . . . . . . . . ¥ 10,696,272 ¥ 868,016
The explanations below summarize certain differences between IFRS and Japanese GAAP that may besignificant. The paragraphs below refer to the corresponding items as set forth in the table above.
1. Scope of consolidation
Under Japanese GAAP, we consolidate an entity when we effectively control the decision making body ofthe entity’s operating and financing policies. Control is generally presumed to exist when we own more than halfof the voting power, or own from 40% to 50% of the voting power and certain facts exist indicating control.Certain entities established for securitization are presumed not to be controlled. Under IFRS, we consolidate anentity when we control the entity. Control is generally presumed to exist when we are exposed, or have rights, tovariable returns from our involvement with the entity and have the ability to affect those returns through ourpower over the entity. The existence and effect of potential voting rights that are deemed to be substantive aretaken into account when assessing the control. When assessing control of an entity under IFRS, we apply a singleconsolidation model to all types of entities, irrespective of their nature. This results in a difference in the scope ofconsolidation between Japanese GAAP and IFRS. Most significantly, certain entities designed for specialpurpose such as securitization, usually in the form of trusts under the Trust Act of Japan, are not consolidatedunder Japanese GAAP but consolidated under IFRS. Accordingly, both the cumulative gains on transfers offinancial assets to these securitization vehicles and amortization of our retained subordinate interest underJapanese GAAP were not recognized under IFRS due to consolidation of such vehicles.
2. Derivative financial instruments
Under Japanese GAAP, an embedded derivative shall be separately accounted for when the host contractmay suffer losses arising from the embedded derivative. Also, an entity may separately account for an embedded
105

derivative if the entity manages it separately, even though the criteria for separation are not fully met. UnderIFRS, an embedded derivative shall be separated from the host contract and accounted for as a derivative if, andonly if its economic characteristics and risks are not closely related to those of the host contract. Accordingly,certain embedded derivatives that are separately accounted for under Japanese GAAP but do not meet the criteriafor separation under IFRS are adjusted such that they are combined with the host contract, and vice versa. Inaddition, the separation of the embedded derivatives from the host contract is adjusted so as not to result in anygain or loss at initial recognition under IFRS.
We apply hedge accounting under Japanese GAAP. However, IFRS imposes onerous documentation andeffectiveness testing requirements on entities wishing to apply hedge accounting. The result of theserequirements is that it is more difficult to achieve hedge accounting under IFRS than under Japanese GAAP, andthe effects of hedge accounting under Japanese GAAP have therefore been reversed under IFRS.
Japanese GAAP and IFRS require OTC derivatives to be measured at fair value. In principle, there is nosignificant difference in the definitions of fair value, but in practice there is diversity in the application ofvaluation techniques used for fair value under Japanese GAAP and IFRS. Therefore to meet the requirements offair value under IFRS, adjustments have been made to the fair values under Japanese GAAP to reflect credit riskadjustments for OTC derivatives. Certain guarantees under Japanese GAAP do not meet the definition of afinancial guarantee under IFRS but meet that of a derivative. These guarantees are measured at fair value and thechange in fair value is recognized in the consolidated income statement under IFRS.
3. Investment securities
Under Japanese GAAP, certain financial assets classified as available-for-sale, such as unlisted stocks, aremeasured at cost. However, under IFRS available-for-sale financial assets (and financial assets at fair valuethrough profit or loss) should be measured at fair value. The fair value of financial instruments where there is noquoted price in an active market is determined by using valuation techniques. In addition, the fair values offinancial instruments under Japanese GAAP have been adjusted in order to meet the requirements of fair valueunder IFRS. For example, the SMFG Group uses the last 1-month average of the closing transaction prices forthe fair value measurement of available-for-sale financial assets (listed stocks) under Japanese GAAP, whereasclosing spot prices are used under IFRS. Additionally under IFRS, we classify certain hybrid instruments asfinancial assets at fair value through profit or loss as we are unable to measure the embedded derivativeseparately from its host contract although it is required to separate the embedded derivative from the hostcontract. Accordingly, the change in fair value of such hybrid instruments is recognized in profit or loss.
Under Japanese GAAP, we recognize impairment of available-for-sale equity instruments if the decline infair value below the cost, less previously recognized impairment loss, is in general 50% or more. Under IFRS, weassess whether there is objective evidence that available-for-sale equity instruments are impaired, including asignificant or prolonged decline in the fair value below cost and other qualitative impairment indicators.Additionally, under Japanese GAAP, we reverse impairment losses recognized in a previous interim period,whereas the reversal of the impairment losses on equity instruments is not allowed under IFRS.
4. Loans and advances
Under Japanese GAAP, the reserve for possible loan losses for specifically identified significant loans iscalculated by the discounted cash flow (“DCF”) method, which is based on the present value of reasonablyestimated cash flows discounted at the original contractual interest rate of the loan. The reserve for possible loanlosses for the remaining loans is collectively calculated using the historical loss experience, or individuallycalculated based on the estimated uncollectible amount considering the historical loss experience and therecoveries from collateral, guarantees and any other collectible cash flows. The historical loss experience for1 year or 3 years, according to the obligor grade, is calculated basically based on the averaged historical resultsof at least the past three years. Under IFRS, the allowance for loan losses for individually significant impairedloans is calculated by the DCF method based on the best estimate of cash flows discounted at the original
106

effective interest rate which differs from the calculation of the DCF method under Japanese GAAP. The scope ofthe loans that are subject to the DCF method under IFRS is wider than that under Japanese GAAP. The allowancefor loan losses for the remaining loans is collectively calculated by homogeneous group using statistical methodsbased on the historical loss experience and incorporating the effect of the time value of money. A qualitativeanalysis based on related economic factors is then performed to reflect the current conditions at the end of thereporting period. The allowance for the non-impaired loan losses is calculated as incurred but not yet identifiedlosses for the period between the impairment occurring and the loss being identified, which are different from theexpected losses under Japanese GAAP.
Under Japanese GAAP, loan origination fees and costs are generally recognized in the consolidated incomestatement as incurred. Under IFRS, loan origination fees and costs that are incremental and directly attributableto the origination of a loan are deferred and thus, included in the calculation of the effective interest rate.
Under Japanese GAAP, loan commitments are not recognized in the consolidated statement of financialposition. Provision for the credit risk on these commitments is included as part of the reserve for possible loanlosses. Under IFRS, loan commitments are not recognized in the consolidated statement of financial position anda provision for the expected losses to us in relation to the loan commitments is measured based on IAS 37“Provisions, Contingent Liabilities and Contingent Assets.” Under Japanese GAAP, all guarantee contracts areaccounted for by accruing both asset and liability accounts at the nominal guarantee amount. A provision for thecredit risk of the guarantee is calculated using the same method as the reserve for possible loan losses and isincluded as part of it. Under IFRS, a financial guarantee contract is specifically defined in IAS 39 “FinancialInstruments: Recognition and Measurement” as a contract that requires the issuer to make specified payments toreimburse the holder for a loss it incurs because a specified debtor fails to make payment when due in accordancewith the original or modified terms of the debt instruments. Financial guarantees are initially recognized at fairvalue and subsequently measured at the higher of the amount determined in accordance with IAS 37 or theamount initially recognized (i.e., fair value) less, when appropriate, cumulative amortization recognized inaccordance with IAS 18 “Revenue.”
5. Investments in associates and joint ventures
Under Japanese GAAP, although goodwill related to investments in associates and joint ventures is includedin the carrying amount of the investments, we are required to recognize and measure impairment losses only ongoodwill separately from the investments if impairment indicators for the goodwill are identified. Under IFRS,for investments in associates and joint ventures, if we identify objective evidence of impairment, the entirecarrying amount of the investment is tested for impairment since goodwill is not separately recognized on theinitial acquisition of the investment. Additionally, the net profit of associates is adjusted for differences betweenJapanese GAAP and IFRS in accordance with our accounting policy prior to applying the equity method underIFRS.
6. Property, plant and equipment
For certain assets that are depreciated using the declining balance method under Japanese GAAP, we applythe straight-line method of depreciation to those assets under IFRS as we consider that the straight-line methodmost closely reflects the expected pattern of consumption of the future economic benefits embodied in thoseassets. Additionally under IFRS, residual values of assets are reviewed at least at the end of each reportingperiod. After reviews of all categories of property, plant and equipment, the residual values of assets areconsidered to be zero under IFRS, whereas residual values are assigned to certain assets under Japanese GAAP.
7. Lease accounting
We account for finance lease transactions without a transfer of ownership commencing before April 1, 2008as operating leases under Japanese GAAP. However, such accounting treatment is not allowed under IFRS. Thus,we made certain adjustments for those transactions in order to comply with the accounting treatment under IFRS.
107

From the fiscal year beginning after April 1, 2008, a new Japanese GAAP standard for lease accounting becameeffective, which removed the differences for finance leases (with or without a transfer of ownership) betweenJapanese GAAP and IFRS. Therefore, no adjustment is needed for finance lease transactions entered into afterApril 1, 2008.
8. Defined benefit plans
Under Japanese GAAP, the present value of the defined benefit obligation is discounted by the rates basedon the market yields of long-term Japanese government bonds. Additionally, the discount rates for the previousreporting period can be used for the current reporting period, if the change in the present value of the definedbenefit obligation caused by a change in the discount rates from the previous reporting period to the currentreporting period is less than 10%. Under IFRS, the discount rates are determined by market yields on high qualitycorporate bonds at the end of each reporting period.
Under Japanese GAAP, the expected rates of return on plan assets for the previous reporting period can beused for the current reporting period, unless the impact of the profit or loss for the current reporting period isconsidered to be significant. Under IFRS, the interest cost and expected return on plan assets are replaced with anet interest amount which is calculated by applying the discount rate to the net defined benefit liability (asset).
Under Japanese GAAP, the actuarial gains and losses are recognized in other comprehensive income, andare amortized using the straight-line method. Under IFRS, actuarial gains and losses arising from experienceadjustments and changes in actuarial assumptions in the year, and return on plan assets excluding interest incomeare recognized in other comprehensive income and are never reclassified to profit and loss.
Under Japanese GAAP, past service costs are recognized in other comprehensive income and are amortizedusing the straight-line method. Under IFRS, past service costs are recognized immediately in the consolidatedincome statement.
9. Deferred tax assets
Under Japanese GAAP, pursuant to the practical guidelines issued by the Japanese Institute of CertifiedPublic Accountants, we recognize deferred tax assets to the extent that the realization of the tax benefit is highlyprobable based on the schedule. Under IFRS, deferred tax assets are recognized to the extent that it is probablethat future taxable profit will be available against which the temporary differences can be utilized. For example,deferred tax assets for deductible temporary differences relating to impairment of financial instruments of whichthe timing of the reversal is difficult to estimate cannot be recognized under Japanese GAAP, whereas they canbe recognized under IFRS to the extent that it is probable that future taxable profit will be available.
10. Foreign currency translation
Under Japanese GAAP, the income statement items of foreign operations are translated into Japanese yen,our presentation currency, using the (spot) closing rate, whereas under IFRS they are translated into thepresentation currency using the exchange rate at the dates of the transactions or, if the exchange rates do notfluctuate significantly, at average exchange rates. In addition, under Japanese GAAP, certain foreign operations’monetary items denominated in foreign currencies are translated into Japanese yen using the exchange rate at theend of the reporting period. However, under IFRS the monetary items for which settlement is neither planned norlikely to occur in the foreseeable future are translated using the exchange rates at the dates of initial transactions.
108
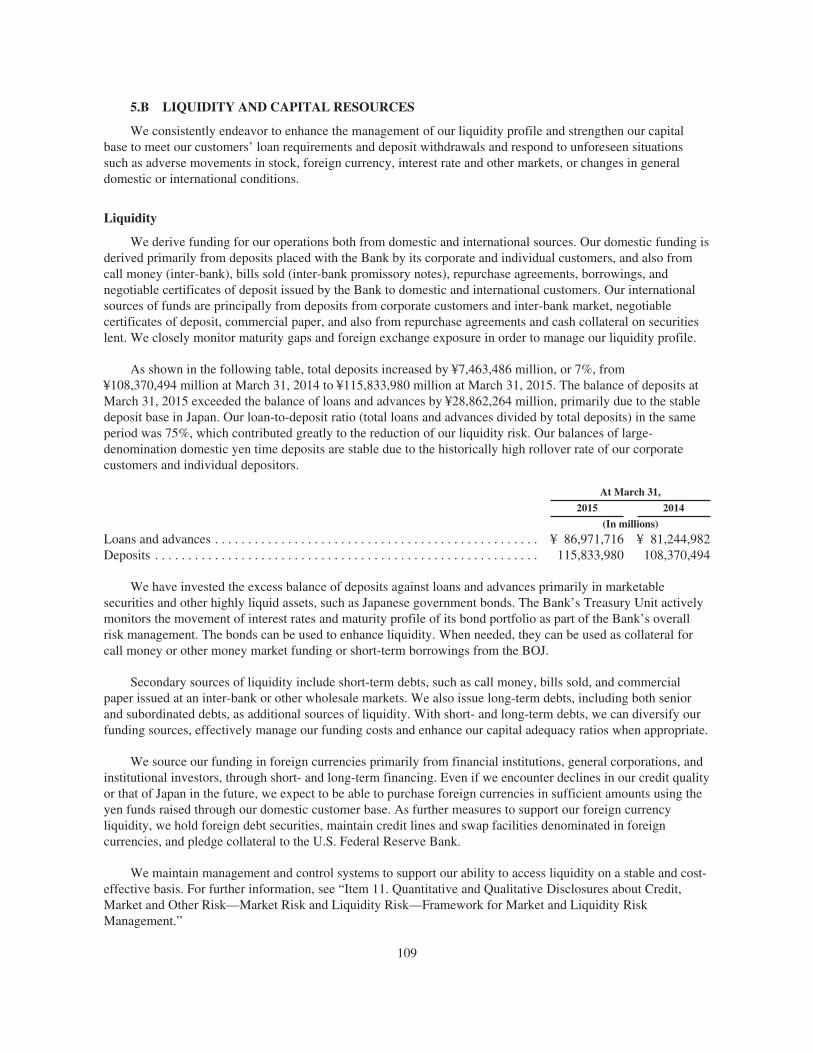
5.B LIQUIDITY AND CAPITAL RESOURCES
We consistently endeavor to enhance the management of our liquidity profile and strengthen our capitalbase to meet our customers’ loan requirements and deposit withdrawals and respond to unforeseen situationssuch as adverse movements in stock, foreign currency, interest rate and other markets, or changes in generaldomestic or international conditions.
Liquidity
We derive funding for our operations both from domestic and international sources. Our domestic funding isderived primarily from deposits placed with the Bank by its corporate and individual customers, and also fromcall money (inter-bank), bills sold (inter-bank promissory notes), repurchase agreements, borrowings, andnegotiable certificates of deposit issued by the Bank to domestic and international customers. Our internationalsources of funds are principally from deposits from corporate customers and inter-bank market, negotiablecertificates of deposit, commercial paper, and also from repurchase agreements and cash collateral on securitieslent. We closely monitor maturity gaps and foreign exchange exposure in order to manage our liquidity profile.
As shown in the following table, total deposits increased by ¥7,463,486 million, or 7%, from¥108,370,494 million at March 31, 2014 to ¥115,833,980 million at March 31, 2015. The balance of deposits atMarch 31, 2015 exceeded the balance of loans and advances by ¥28,862,264 million, primarily due to the stabledeposit base in Japan. Our loan-to-deposit ratio (total loans and advances divided by total deposits) in the sameperiod was 75%, which contributed greatly to the reduction of our liquidity risk. Our balances of large-denomination domestic yen time deposits are stable due to the historically high rollover rate of our corporatecustomers and individual depositors.
At March 31,
2015 2014
(In millions)
Loans and advances . . . . . . . . . . . . . . . . . . . . . . . . . . . . . . . . . . . . . . . . . . . . . . . . . ¥ 86,971,716 ¥ 81,244,982Deposits . . . . . . . . . . . . . . . . . . . . . . . . . . . . . . . . . . . . . . . . . . . . . . . . . . . . . . . . . . 115,833,980 108,370,494
We have invested the excess balance of deposits against loans and advances primarily in marketablesecurities and other highly liquid assets, such as Japanese government bonds. The Bank’s Treasury Unit activelymonitors the movement of interest rates and maturity profile of its bond portfolio as part of the Bank’s overallrisk management. The bonds can be used to enhance liquidity. When needed, they can be used as collateral forcall money or other money market funding or short-term borrowings from the BOJ.
Secondary sources of liquidity include short-term debts, such as call money, bills sold, and commercialpaper issued at an inter-bank or other wholesale markets. We also issue long-term debts, including both seniorand subordinated debts, as additional sources of liquidity. With short- and long-term debts, we can diversify ourfunding sources, effectively manage our funding costs and enhance our capital adequacy ratios when appropriate.
We source our funding in foreign currencies primarily from financial institutions, general corporations, andinstitutional investors, through short- and long-term financing. Even if we encounter declines in our credit qualityor that of Japan in the future, we expect to be able to purchase foreign currencies in sufficient amounts using theyen funds raised through our domestic customer base. As further measures to support our foreign currencyliquidity, we hold foreign debt securities, maintain credit lines and swap facilities denominated in foreigncurrencies, and pledge collateral to the U.S. Federal Reserve Bank.
We maintain management and control systems to support our ability to access liquidity on a stable and cost-effective basis. For further information, see “Item 11. Quantitative and Qualitative Disclosures about Credit,Market and Other Risk—Market Risk and Liquidity Risk—Framework for Market and Liquidity RiskManagement.”
109
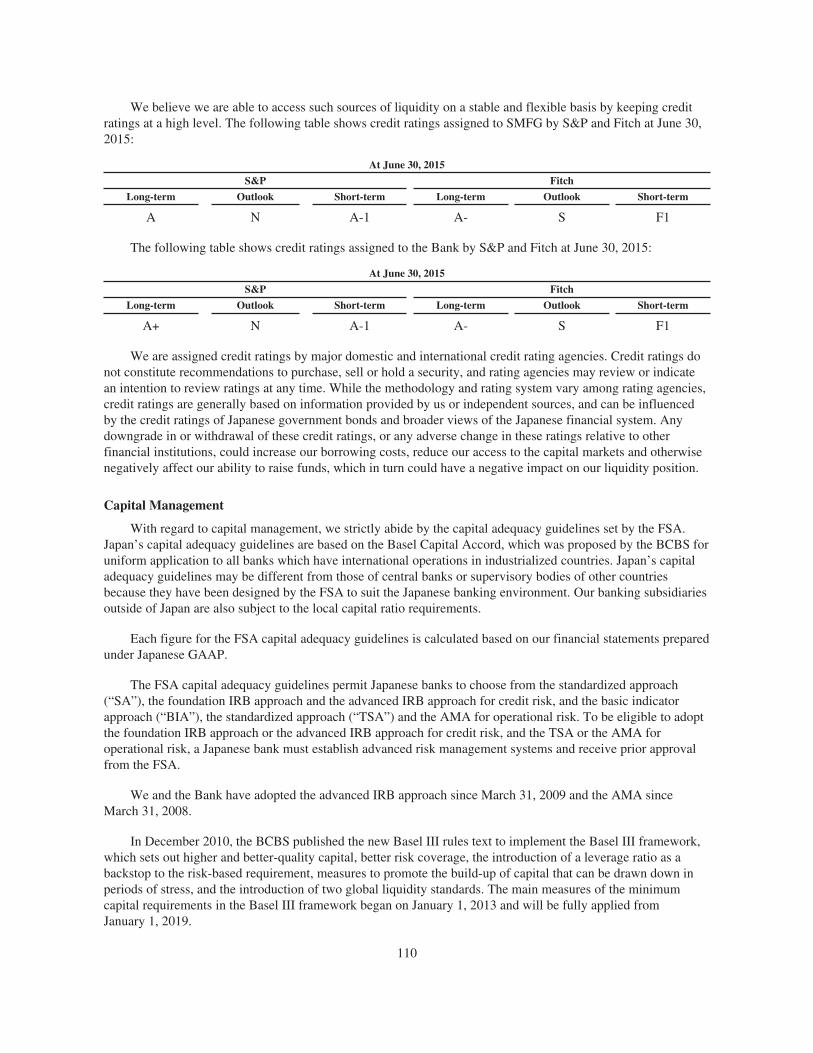
We believe we are able to access such sources of liquidity on a stable and flexible basis by keeping creditratings at a high level. The following table shows credit ratings assigned to SMFG by S&P and Fitch at June 30,2015:
At June 30, 2015
S&P Fitch
Long-term Outlook Short-term Long-term Outlook Short-term
A N A-1 A- S F1
The following table shows credit ratings assigned to the Bank by S&P and Fitch at June 30, 2015:
At June 30, 2015
S&P Fitch
Long-term Outlook Short-term Long-term Outlook Short-term
A+ N A-1 A- S F1
We are assigned credit ratings by major domestic and international credit rating agencies. Credit ratings donot constitute recommendations to purchase, sell or hold a security, and rating agencies may review or indicatean intention to review ratings at any time. While the methodology and rating system vary among rating agencies,credit ratings are generally based on information provided by us or independent sources, and can be influencedby the credit ratings of Japanese government bonds and broader views of the Japanese financial system. Anydowngrade in or withdrawal of these credit ratings, or any adverse change in these ratings relative to otherfinancial institutions, could increase our borrowing costs, reduce our access to the capital markets and otherwisenegatively affect our ability to raise funds, which in turn could have a negative impact on our liquidity position.
Capital Management
With regard to capital management, we strictly abide by the capital adequacy guidelines set by the FSA.Japan’s capital adequacy guidelines are based on the Basel Capital Accord, which was proposed by the BCBS foruniform application to all banks which have international operations in industrialized countries. Japan’s capitaladequacy guidelines may be different from those of central banks or supervisory bodies of other countriesbecause they have been designed by the FSA to suit the Japanese banking environment. Our banking subsidiariesoutside of Japan are also subject to the local capital ratio requirements.
Each figure for the FSA capital adequacy guidelines is calculated based on our financial statements preparedunder Japanese GAAP.
The FSA capital adequacy guidelines permit Japanese banks to choose from the standardized approach(“SA”), the foundation IRB approach and the advanced IRB approach for credit risk, and the basic indicatorapproach (“BIA”), the standardized approach (“TSA”) and the AMA for operational risk. To be eligible to adoptthe foundation IRB approach or the advanced IRB approach for credit risk, and the TSA or the AMA foroperational risk, a Japanese bank must establish advanced risk management systems and receive prior approvalfrom the FSA.
We and the Bank have adopted the advanced IRB approach since March 31, 2009 and the AMA sinceMarch 31, 2008.
In December 2010, the BCBS published the new Basel III rules text to implement the Basel III framework,which sets out higher and better-quality capital, better risk coverage, the introduction of a leverage ratio as abackstop to the risk-based requirement, measures to promote the build-up of capital that can be drawn down inperiods of stress, and the introduction of two global liquidity standards. The main measures of the minimumcapital requirements in the Basel III framework began on January 1, 2013 and will be fully applied fromJanuary 1, 2019.
110

These capital reforms increase the minimum common equity requirement from 2% to 4.5% and requirebanks to hold a capital conservation buffer of 2.5% to withstand future periods of stress, bringing the totalcommon equity requirement to 7%. The Tier 1 capital requirement will also be increased from 4% to 6%,resulting in a total requirement of 8.5% when combined with the above-mentioned conservation buffer. The totalcapital requirement remains at the existing level of 8% but also increases to 10.5% due to the capitalconservation buffer. In addition, a countercyclical buffer within a range of 0% to 2.5% of common equity orother fully loss absorbing capital will be implemented according to national circumstances. The Group of CentralBank Governors and Heads of Supervision also agreed on transitional arrangements for implementing the newrequirements.
To reflect the Basel III framework, the FSA changed its capital adequacy guidelines. Under the FSA capitaladequacy guidelines, the new capital requirements are being phased in from March 31, 2013 through March 31,2019. On March 31, 2013, the minimum Common Equity Tier 1 capital requirement and Tier 1 capitalrequirement were raised to 3.5% and 4.5%, respectively. The minimum Common Equity Tier 1 capitalrequirement and Tier 1 capital requirement rose to 4% and 5.5%, respectively on March 31, 2014, and rose to4.5% and 6%, respectively on March 31, 2015. Meanwhile the capital conservation buffer and countercyclicalbuffer, which will be phased in from January 1, 2016 under the Basel III accord, have not yet been incorporatedinto the FSA capital adequacy guidelines.
The table below presents our total risk-weighted capital ratio, total capital, and risk-weighted assets underJapanese GAAP at March 31, 2015, based on the Basel III rules.
At March 31, 2015
(In billions, exceptpercentages)
Total risk-weighted capital ratio (consolidated) . . . . . . . . . . . . . . . . . . . . . . . . . . . . . . . . . . . . . . 16.58%Tier 1 risk-weighted capital ratio (consolidated) . . . . . . . . . . . . . . . . . . . . . . . . . . . . . . . . . . . . . . 12.89%Common Equity Tier 1 risk-weighted capital ratio (consolidated) . . . . . . . . . . . . . . . . . . . . . . . . 11.30%Total capital (Common Equity Tier 1 capital + Additional Tier 1 capital + Tier 2 capital) . . . . . ¥ 10,965.9Tier 1 capital (Common Equity Tier 1 capital + Additional Tier 1 capital) . . . . . . . . . . . . . . . . . 8,528.6Common Equity Tier 1 capital . . . . . . . . . . . . . . . . . . . . . . . . . . . . . . . . . . . . . . . . . . . . . . . . . . . . 7,476.5Risk-weighted assets . . . . . . . . . . . . . . . . . . . . . . . . . . . . . . . . . . . . . . . . . . . . . . . . . . . . . . . . . . . 66,136.8The amount of minimum capital requirements . . . . . . . . . . . . . . . . . . . . . . . . . . . . . . . . . . . . . . . 5,290.9
Common Equity Tier 1 capital consists primarily of capital stock, capital surplus and retained earningsrelating to common shares, and minority interests that meet the criteria set forth in the FSA capital adequacyguidelines for inclusion in Common Equity Tier 1 capital.
Minority interests arising from the issue of common shares by a fully consolidated subsidiary of a bank mayreceive recognition in Common Equity Tier 1 capital only if: (1) the instrument giving rise to the minorityinterest would, if issued by the bank, meet all of the criteria set forth in the FSA capital adequacy guidelines forclassification as common shares for regulatory capital purposes; and (2) the subsidiary that issued the instrumentis itself a bank or other financial institution subject to similar capital adequacy guidelines.
Minority interests that will no longer qualify as Common Equity Tier 1 capital, additional Tier 1 capital, orTier 2 capital under Basel III are being phased out beginning March 31, 2014 by increments of 20% and will befully phased out by March 31, 2018.
Regulatory adjustments such as goodwill and other intangibles, deferred tax assets, investment in thecommon equity capital of banking financial and insurance entities and defined benefit pension fund assets andliabilities are to be applied mainly to the calculation of Common Equity Tier 1 capital in the form of a deduction.Such regulatory adjustments are being phased in from March 31, 2014 through March 31, 2018.
111
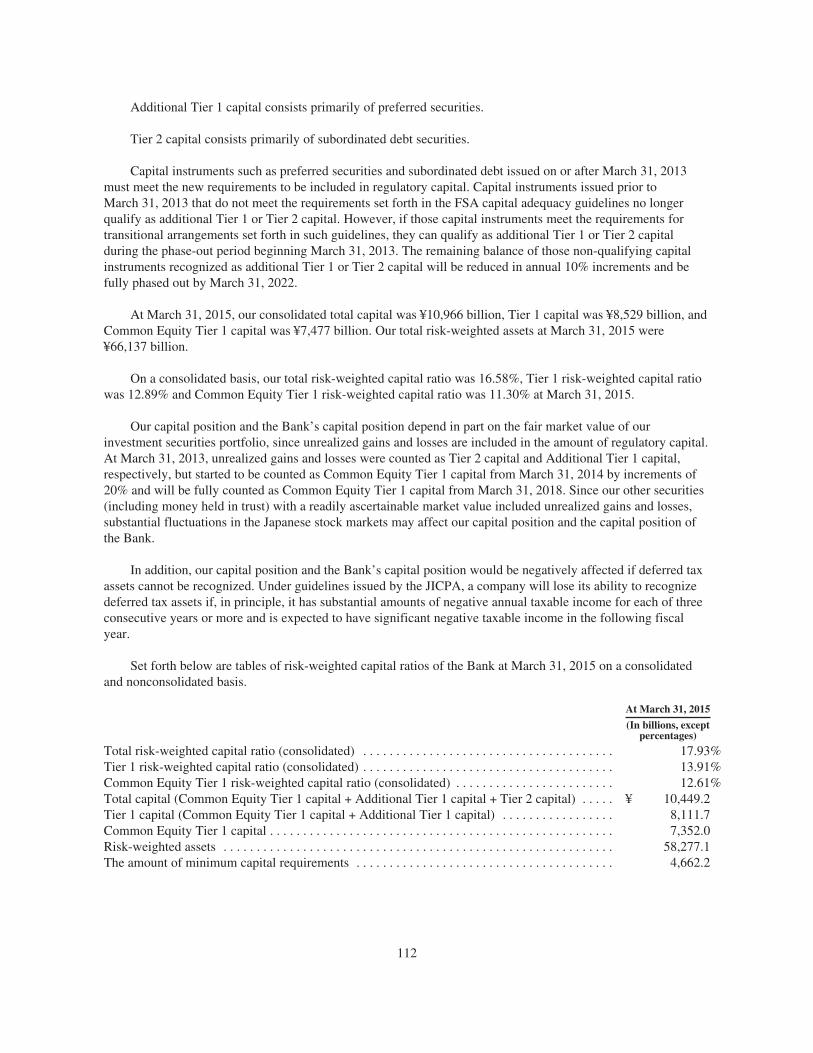
Additional Tier 1 capital consists primarily of preferred securities.
Tier 2 capital consists primarily of subordinated debt securities.
Capital instruments such as preferred securities and subordinated debt issued on or after March 31, 2013must meet the new requirements to be included in regulatory capital. Capital instruments issued prior toMarch 31, 2013 that do not meet the requirements set forth in the FSA capital adequacy guidelines no longerqualify as additional Tier 1 or Tier 2 capital. However, if those capital instruments meet the requirements fortransitional arrangements set forth in such guidelines, they can qualify as additional Tier 1 or Tier 2 capitalduring the phase-out period beginning March 31, 2013. The remaining balance of those non-qualifying capitalinstruments recognized as additional Tier 1 or Tier 2 capital will be reduced in annual 10% increments and befully phased out by March 31, 2022.
At March 31, 2015, our consolidated total capital was ¥10,966 billion, Tier 1 capital was ¥8,529 billion, andCommon Equity Tier 1 capital was ¥7,477 billion. Our total risk-weighted assets at March 31, 2015 were¥66,137 billion.
On a consolidated basis, our total risk-weighted capital ratio was 16.58%, Tier 1 risk-weighted capital ratiowas 12.89% and Common Equity Tier 1 risk-weighted capital ratio was 11.30% at March 31, 2015.
Our capital position and the Bank’s capital position depend in part on the fair market value of ourinvestment securities portfolio, since unrealized gains and losses are included in the amount of regulatory capital.At March 31, 2013, unrealized gains and losses were counted as Tier 2 capital and Additional Tier 1 capital,respectively, but started to be counted as Common Equity Tier 1 capital from March 31, 2014 by increments of20% and will be fully counted as Common Equity Tier 1 capital from March 31, 2018. Since our other securities(including money held in trust) with a readily ascertainable market value included unrealized gains and losses,substantial fluctuations in the Japanese stock markets may affect our capital position and the capital position ofthe Bank.
In addition, our capital position and the Bank’s capital position would be negatively affected if deferred taxassets cannot be recognized. Under guidelines issued by the JICPA, a company will lose its ability to recognizedeferred tax assets if, in principle, it has substantial amounts of negative annual taxable income for each of threeconsecutive years or more and is expected to have significant negative taxable income in the following fiscalyear.
Set forth below are tables of risk-weighted capital ratios of the Bank at March 31, 2015 on a consolidatedand nonconsolidated basis.
At March 31, 2015
(In billions, exceptpercentages)
Total risk-weighted capital ratio (consolidated) . . . . . . . . . . . . . . . . . . . . . . . . . . . . . . . . . . . . . . 17.93%Tier 1 risk-weighted capital ratio (consolidated) . . . . . . . . . . . . . . . . . . . . . . . . . . . . . . . . . . . . . . 13.91%Common Equity Tier 1 risk-weighted capital ratio (consolidated) . . . . . . . . . . . . . . . . . . . . . . . . 12.61%Total capital (Common Equity Tier 1 capital + Additional Tier 1 capital + Tier 2 capital) . . . . . ¥ 10,449.2Tier 1 capital (Common Equity Tier 1 capital + Additional Tier 1 capital) . . . . . . . . . . . . . . . . . 8,111.7Common Equity Tier 1 capital . . . . . . . . . . . . . . . . . . . . . . . . . . . . . . . . . . . . . . . . . . . . . . . . . . . . 7,352.0Risk-weighted assets . . . . . . . . . . . . . . . . . . . . . . . . . . . . . . . . . . . . . . . . . . . . . . . . . . . . . . . . . . . 58,277.1The amount of minimum capital requirements . . . . . . . . . . . . . . . . . . . . . . . . . . . . . . . . . . . . . . . 4,662.2
112

At March 31, 2015
(In billions, exceptpercentages)
Total risk-weighted capital ratio (nonconsolidated) . . . . . . . . . . . . . . . . . . . . . . . . . . . . . . . . . . . 18.89%Tier 1 risk-weighted capital ratio (nonconsolidated) . . . . . . . . . . . . . . . . . . . . . . . . . . . . . . . . . . . 14.26%Common Equity Tier 1 risk-weighted capital ratio (nonconsolidated) . . . . . . . . . . . . . . . . . . . . . 12.80%Total capital (Common Equity Tier 1 capital + Additional Tier 1 capital + Tier 2 capital) . . . . . ¥ 9,682.5Tier 1 capital (Common Equity Tier 1 capital + Additional Tier 1 capital) . . . . . . . . . . . . . . . . . 7,309.1Common Equity Tier 1 capital . . . . . . . . . . . . . . . . . . . . . . . . . . . . . . . . . . . . . . . . . . . . . . . . . . . . 6,559.2Risk-weighted assets . . . . . . . . . . . . . . . . . . . . . . . . . . . . . . . . . . . . . . . . . . . . . . . . . . . . . . . . . . . 51,232.8The amount of minimum capital requirements . . . . . . . . . . . . . . . . . . . . . . . . . . . . . . . . . . . . . . . 4,098.6
Our securities subsidiaries in Japan, SMBC Nikko Securities and SMBC Friend Securities, are also subjectto capital adequacy requirements under the FIEA described in “Item 4.B. Business Overview—Regulations inJapan—Regulations Regarding Capital Adequacy and Liquidity.” At March 31, 2015, the capital adequacy ratioswere 478.3% for SMBC Nikko Securities and 984.1% for SMBC Friend Securities, and sufficiently above the140%, below which level they would be required to file daily reports with the Commissioner of the FSA.
5.C. RESEARCH, DEVELOPMENT, PATENTS AND LICENSES
We did not conduct any significant research and development activities for the fiscal year ended March 31,2015. However, there are certain research and development activities conducted by subsidiaries in charge ofsystems development and information processing for our information system infrastructure.
5.D. TREND INFORMATION
Our trend information is contained elsewhere in this annual report, including but not limited to“Item 4.B. Business Overview,” and “—A. Operating Results,” and “—B. Liquidity and Capital Resources” inthis Item.
5.E. OFF-BALANCE SHEET ARRANGEMENTS
To meet our customers’ financing needs, we engage in various types of off-balance sheet arrangements inthe ordinary course of business.
Our arrangements include loan commitments, financial guarantees and other credit-related contingentliabilities. Loan commitment contracts on overdrafts and loans are agreements to lend up to a prescribed amountto customers, as long as there is no violation of any condition established in the contracts. Financial guaranteesare contracts that require the issuer to make specified payments to reimburse the holder for a loss it incursbecause a specified debtor fails to make payments when due in accordance with the terms of the debt instrument.Other credit-related contingent liabilities include performance bonds, which are contracts that providecompensation if another party fails to perform the contractual obligation.
The table below shows the nominal amounts of undrawn loan commitments, and financial guarantees andother credit-related contingent liabilities at March 31, 2015 and 2014.
At March 31,
2015 2014
(In millions)
Loan commitments . . . . . . . . . . . . . . . . . . . . . . . . . . . . . . . . . . . . . . . . . . . . . . . . . . . ¥53,665,583 ¥49,285,032Financial guarantees and other credit-related contingent liabilities . . . . . . . . . . . . . . 7,076,536 6,396,144
Total . . . . . . . . . . . . . . . . . . . . . . . . . . . . . . . . . . . . . . . . . . . . . . . . . . . . . . . . . . ¥60,742,119 ¥55,681,176
113

The nominal amounts of these off-balance sheet instruments generally represent the maximum potentialamounts of future payments without consideration of possible recoveries under recourse provisions or fromcollateral held. For example, since many of these loan commitments are expected to expire without being drawndown, the total amount of unused commitments does not necessarily represent an actual future cash flowrequirement. Many of these loan commitments include clauses under which we can reject an application fromcustomers or reduce the contract amounts in cases where economic conditions change, we need to secure claims,or some other significant event occurs. In addition, we may request the customers to pledge collateral such aspremises and securities at the time of the contracts, and take necessary measures such as monitoring customers’financial positions, revising contracts when the need arises and securing claims after the contracts are made. Weregularly review the credit quality of the customer based on our risk management system as set forth in“Item 11. Quantitative and Qualitative Disclosures about Credit, Market and Other Risk” and Note 45 “FinancialRisk Management” to our consolidated financial statements included elsewhere in this annual report.
In addition to the above-mentioned off-balance sheet arrangements, some of the Group’s off-balance sheetarrangements are related to activities of structured entities. For further information, see Note 48 “StructuredEntities” to our consolidated financial statements included elsewhere in this annual report.
5.F. TABULAR DISCLOSURE OF CONTRACTUAL OBLIGATIONS
In the normal course of business, we enter into contractual obligations that require future cash payments.The following table sets forth a summary of our contractual cash obligations at March 31, 2015.
At March 31, 2015
Due inone year or less
Due fromone year tothree years
Due fromthree years to
five yearsDue afterfive years Total(1)
(In millions)
Time deposits . . . . . . . . . . . . . ¥ 24,033,835 ¥ 3,597,782 ¥ 607,580 ¥ 826,224 ¥ 29,065,421Negotiable certificate of
deposits . . . . . . . . . . . . . . . . 13,506,712 286,742 30,254 2,190 13,825,898Borrowings . . . . . . . . . . . . . . . 7,356,140 665,327 926,245 2,166,598 11,114,310Debt securities in issue . . . . . . 5,837,166 1,799,923 942,988 2,461,070 11,041,147Capital (finance) lease
obligation . . . . . . . . . . . . . . . 21,905 35,407 29,340 19,389 106,041Operating lease obligation . . . . 44,637 68,515 44,741 126,404 284,297Purchase obligation(2) . . . . . . . 161,579 401,237 679,115 1,646,785 2,888,716
Total . . . . . . . . . . . . . . . . ¥ 50,961,974 ¥ 6,854,933 ¥ 3,260,263 ¥ 7,248,660 ¥ 68,325,830
(1) The amount of interest on debt instruments is not included in the maturity table above due to its insignificance.(2) Purchase obligation in the above table includes the contractual commitments to purchase aircraft to be leased to customers and to
purchase goods or services of construction and information technology that are binding on us for the payment of more than ¥100 million.The contractual commitments to purchase aircraft are based upon fixed price agreements with the manufacturers, an element of which areadjusted for inflation and include price escalation formulas, but are also subject to agreed price concessions where applicable.
5.G. SAFE HARBOR
See the discussion under “Cautionary Statement Regarding Forward-Looking Statements.”
114

Item 6. Directors, Senior Management and Employees
6.A. DIRECTORS AND SENIOR MANAGEMENT
Directors, Senior Management and Corporate Auditors
Under our corporate governance system, our board of directors is responsible for supervising the businessoperations of the Group as a whole, and has established four board committees to enhance the effectiveness ofgovernance by our board of directors in exercising its management responsibilities. Those committees are:
• the risk management committee;
• the auditing committee;
• the compensation committee; and
• the nominating committee.
For more information, see “Item 6.C. Board Practices.”
Our board of directors is comprised of thirteen directors, five of whom are outside directors as defined underthe Companies Act, and our board of corporate auditors is comprised of six corporate auditors, three of whom areoutside corporate auditors as defined under the Companies Act.
115

At June 26, 2015, the following persons held the indicated positions with us:
Name(Date of birth)
Current positions andprincipal outside positions Business experience
Expiration ofcurrent term as
director orcorporate auditor
Masayuki Oku(December 2, 1944)
Chairman of the Board andDirector of the Company
April 1968 Joined Sumitomo Bank At the close of theannual generalmeeting ofshareholders to beheld for the fiscalyear endingMarch 31, 2017.
June 1994 Director of Sumitomo Bank
November 1998 Managing Director of Sumitomo Bank
June 1999 Managing Director and ManagingExecutive Officer of Sumitomo Bank
January 2001 Senior Managing Director and SeniorManaging Executive Officer ofSumitomo Bank
April 2001 Senior Managing Director and SeniorManaging Executive Officer of theBank
December 2002 Resigned as Director of the Bank
December 2002 Senior Managing Director of theCompany
June 2003 Retired as Director of the Company
Deputy President and Executive Officerof the Bank
June 2005 Chairman of the Board and Director ofthe Company (to present)
President and Chief Executive Officerof the Bank
April 2011 Resigned as Director of the Bank
Koichi Miyata(November 16, 1953)
President andRepresentative Directorof the Company
Director of the Bank
April 1976 Joined Mitsui Bank At the close of theannual generalmeeting ofshareholders to beheld for the fiscalyear endingMarch 31, 2016.
June 2003 Executive Officer of the Bank
October 2006 Managing Executive Officer of theBank
April 2009 Director and Senior ManagingExecutive Officer of the Bank
April 2010 Senior Managing Executive Officer ofthe Company
June 2010 Director of the Company
April 2011 Director and President of the Company(to present)
Director of the Bank (to present)
Takeshi Kunibe(March 8, 1954)
Director of the Company
President and ChiefExecutive Officer of theBank
April 1976 Joined Sumitomo Bank At the close of theannual generalmeeting ofshareholders to beheld for the fiscalyear endingMarch 31, 2017.
June 2003 Executive Officer of the Bank
October 2006 Managing Executive Officer of theBank
April 2007 Managing Executive Officer of theCompany
June 2007 Director of the Company (to present)
April 2009 Director and Senior ManagingExecutive Officer of the Bank
April 2011 President and Chief Executive Officerof the Bank (to present)
116

Name(Date of birth)
Current positions andprincipal outside positions Business experience
Expiration ofcurrent term as
director orcorporate auditor
Yujiro Ito(August 3, 1955)
Representative Director ofthe Company
Officer in charge ofGeneral AffairsDepartment and HumanResources Department
Director and DeputyPresident of the Bank
April 1979 Joined Sumitomo Bank At the close of theannual generalmeeting ofshareholders to beheld for the fiscalyear endingMarch 31, 2017.
June 2005 Executive Officer of the Bank
April 2009 Managing Executive Officer of theBank
April 2011 Managing Executive Officer of theCompany
Director and Managing ExecutiveOfficer of the Bank
June 2011 Director of the Company (to present)
April 2012 Director and Senior ManagingExecutive Officer of the Bank
April 2014 Director and Deputy President of theBank (to present)
Kozo Ogino(May 9, 1958)
Director of the Company
Officer in charge of AuditDepartment
Director and SeniorManaging ExecutiveOfficer of the Bank
April 1981 Joined Mitsui Bank At the close of theannual generalmeeting ofshareholders to beheld for the fiscalyear endingMarch 31, 2017.
April 2010 Executive Officer of the Bank
April 2011 Managing Executive Officer of theBank
April 2013 Managing Executive Officer of theCompany
June 2013 Director of the Company (to present)
April 2014 Director and Senior ManagingExecutive Officer of the Bank (topresent)
Toshiyuki Teramoto(September 15, 1958)
Director of the Company
Officer in charge ofCorporate RiskManagement Department
Director and SeniorManaging ExecutiveOfficer of the Bank
April 1981 Joined Mitsui Bank At the close of theannual generalmeeting ofshareholders to beheld for the fiscalyear endingMarch 31, 2017.
April 2008 Executive Officer of the Bank
April 2011 Managing Executive Officer of theBank
April 2014 Director and Senior ManagingExecutive Officer of the Bank (topresent)
April 2015 Senior Managing Executive Officer ofthe Company
June 2015 Director of the Company (to present)
Jun Ohta(February 12, 1958)
Director of the Company
Officer in charge of PublicRelations Department,Corporate PlanningDepartment, FinancialAccounting Departmentand Subsidiaries &Affiliates Department
Director and SeniorManaging ExecutiveOfficer of the Bank
April 1982 Joined Sumitomo Bank At the close of theannual generalmeeting ofshareholders to beheld for the fiscalyear endingMarch 31, 2016.
April 2009 Executive Officer of the Bank
May 2009 General Manager of InvestmentBanking Planning Department of theCompany
April 2012 Managing Executive Officer of theBank
April 2013 Managing Executive Officer of theCompany
April 2014 Senior Managing Executive Officer ofthe Company
Senior Managing Executive Officer ofthe Bank
June 2014 Director of the Company (to present)
April 2015 Director and Senior ManagingExecutive Officer of the Bank (topresent)
117

Name(Date of birth)
Current positions andprincipal outside positions Business experience
Expiration ofcurrent term as
director orcorporate auditor
Katsunori Tanizaki(April 12, 1957)
Director of the Company
Officer in charge of ITPlanning Department
Director and SeniorManaging ExecutiveOfficer of the Bank
April 1982 Joined Sumitomo Bank At the close of theannual generalmeeting ofshareholders to beheld for the fiscalyear endingMarch 31, 2017.
April 2010 Executive Officer of the Bank
April 2011 General Manager of IT PlanningDepartment of the Company
April 2013 Managing Executive Officer of theBank
April 2015 Senior Managing Executive Officer ofthe Company
Director and Senior ManagingExecutive Officer of the Bank (topresent)
June 2015 Director of the Company (to present)
Yoshinori Yokoyama(1)
(September 16, 1942)Director of the Company April 1966 Joined Mayekawa Kunio Associates,
Architects & EngineersAt the close of theannual generalmeeting ofshareholders to beheld for the fiscalyear endingMarch 31, 2016.
September 1973 Joined Davis Brody & Associates
September 1975 Joined McKinsey & Company, Inc.
July 1987 Director (Senior Partner) of McKinsey& Company, Inc.
June 2002 Retired from McKinsey & Company,Inc.
June 2002 Director of ORIX Corporation
April 2003 Corporate Auditor of IndustrialRevitalization Corporation of Japan
June 2006 Director of the Company (to present)
Director of the Bank
June 2015 Resigned as Director of the Bank
Kuniaki Nomura(1)
(June 13, 1945)Director of the Company April 1970 Registered as an attorney at law (to
present)At the close of theannual generalmeeting ofshareholders to beheld for the fiscalyear endingMarch 31, 2017.
Attorney at law at Yanagida Law Office(currently, Yanagida & Partners)
June 2009 Director of the Company (to present)
Director of the Bank
June 2009 Attorney at law at Nomura & Partners(to present)
June 2015 Retired as Director of the Bank
Arthur M. Mitchell(1)
(July 23,1947)Director of the Company July 1976 Registered as an attorney at law,
admitted in New York, the U.S.A. (topresent)
At the close of theannual generalmeeting ofshareholders to beheld for the fiscalyear endingMarch 31, 2017.
January 2003 General Counsel of the AsianDevelopment Bank
September 2007 Joined White & Case LLP
January 2008 Registered as Foreign Attorney in Japan(to present)
Registered Foreign Attorney in Japan atWhite & Case LLP (to present)
June 2015 Director of the Company (to present)
118

Name(Date of birth)
Current positions andprincipal outside positions Business experience
Expiration ofcurrent term as
director orcorporate auditor
Masaharu Kohno(1)
(December 21, 1948)Director of the Company April 1973 Joined Ministry of Foreign Affairs of
JapanAt the close of theannual generalmeeting ofshareholders to beheld for the fiscalyear endingMarch 31, 2017.
August 2005 Director-General of Foreign PolicyBureau in Ministry of Foreign Affairs ofJapan
January 2007 Deputy Minister for Foreign Affairs (incharge of economy) of Ministry ofForeign Affairs of Japan
February 2009 Ambassador of Japan to Russia
May 2009 Ambassador of Japan to Russia, Armenia,Turkmenistan and Belarus
March 2011 Ambassador of Japan to Italy
May 2011 Ambassador of Japan to Italy, Albania,San Marino and Malta
September 2014 Retired from office
June 2015 Director of the Company (to present)
Eriko Sakurai(1)
(November 16, 1960)Director of the Company June 1987 Joined Dow Corning Corporation At the close of the
annual generalmeeting ofshareholders to beheld for the fiscalyear endingMarch 31, 2017.
May 2008 Director of Dow Corning Toray Co., Ltd.
March 2009 Chairman and Chief Executive Officer ofDow Corning Toray Co., Ltd. (to present)
May 2011 Regional President -Japan/Korea of DowCorning Corporation (to present)
February 2015 President and Representative Director ofDow Corning Holding Japan Co., Ltd (topresent)
June 2015 Director of the Company (to present)
Koichi Minami(March 21, 1955)
Corporate Auditor of theCompany
Corporate Auditor of theBank
April 1977 Joined Sumitomo Bank At the close of theannual generalmeeting ofshareholders to beheld for the fiscalyear endingMarch 31, 2017.
June 2005 Executive Officer of the Bank
April 2008 Managing Executive Officer of the Bank
April 2011 Director and Senior Managing ExecutiveOfficer of the Bank
April 2013 Director of the Bank
June 2013 Corporate Auditor of the Company (topresent)
Corporate Auditor of the Bank (topresent)
Kazuhiko Nakao(July 1, 1959)
Corporate Auditor of theCompany
April 1982 Joined Taiyo Kobe Bank At the close of theannual generalmeeting ofshareholders to beheld for the fiscalyear endingMarch 31, 2018.
April 2010 General Manager of Himeji CorporateBusiness Office of the Bank
April 2011 Senior General Manager of HimejiCorporate Business Office of the Bank
April 2012 Co-General Manager of General AffairsDepartment of the Company
Senior General Manager ofAdministrative Services Department ofthe Bank
April 2014 Senior General Manager of Head Officeof the Bank
June 2014 Corporate Auditor of the Company (topresent)
119

Name(Date of birth)
Current positions andprincipal outside positions Business experience
Expiration ofcurrent term as
director orcorporate auditor
Toru Mikami(August 27, 1960)
Corporate Auditor of theCompany
April 1984 Joined Sumitomo Bank At the close of theannual generalmeeting ofshareholders to beheld for the fiscalyear endingMarch 31, 2019.
April 2006 General Manager of Legal Departmentof the Bank
April 2013 Co-General Manager of General AffairsDepartment of the Company
April 2015 Senior Manager of Head Office of theBank
June 2015 Corporate Auditor of the Company (topresent)
Ikuo Uno(2)
(January 4, 1935)Corporate Auditor of the
CompanyMarch 1959 Joined Nippon Life Insurance Company At the close of the
annual generalmeeting ofshareholders to beheld for the fiscalyear endingMarch 31, 2017.
Executive Advisor to theBoard of Nippon LifeInsurance Company
April 1997 President of Nippon Life InsuranceCompany
April 2005 Chairman of the Board andRepresentative Director of Nippon LifeInsurance Company
June 2005 Corporate Auditor of the Company (topresent)
June 2006 Corporate Auditor of the Bank
April 2011 Director and Executive Advisor to theBoard of Nippon Life InsuranceCompany
July 2011 Executive Advisor to the Board ofNippon Life Insurance Company (topresent)
June 2015 Resigned as Corporate Auditor of theBank
Satoshi Itoh(2)
(July 25, 1942)Corporate Auditor of the
CompanyJanuary 1967 Joined Tokyo Office of Arthur
Andersen & Co.At the close of theannual generalmeeting ofshareholders to beheld for the fiscalyear endingMarch 31, 2017.
December 1970 Registered as a certified publicaccountant (to present)
September 1978 Partner of Arthur Andersen & Co.
October 1993 Representative Partner of Asahi & Co.(currently, KPMG AZSA LLC)
August 2001 Retired from Arthur Andersen & Co.
Retired from Asahi & Co. (currently,KPMG AZSA LLC)
April 2002 Special Professor at Chuo UniversityGraduate School of InternationalAccounting
March 2007 Retired as Special Professor from ChuoUniversity Graduate School ofInternational Accounting
June 2009 Corporate Auditor of the Company (topresent)
Corporate Auditor of the Bank
June 2015 Resigned as Corporate Auditor of theBank
120

Name(Date of birth)
Current positions andprincipal outside positions Business experience
Expiration ofcurrent term as
director orcorporate auditor
Rokuro Tsuruta(2)
(June 16, 1943)Corporate Auditor of the
CompanyApril 1970 Appointed as a Prosecutor at Tokyo
District Public Prosecutors OfficeAt the close of theannual generalmeeting ofshareholders to beheld for the fiscalyear endingMarch 31, 2016.
April 2005 Superintending Prosecutor of NagoyaHigh Public Prosecutors Office
June 2006 Retired from his position as Prosecutor
July 2006 Registered as an attorney at law (topresent)
October 2006 Professor at Chiba University LawSchool
September 2008 Retired from his position as Professor atChiba University Law School
April 2009 Professor at Surugadai University LawSchool
March 2012 Retired from his position as Professor atSurugadai University Law School
June 2012 Corporate Auditor of the Company (topresent)
Corporate Auditor of the Bank
June 2015 Resigned as Corporate Auditor of theBank
(1) Messrs. and Ms. Yokoyama, Nomura, Mitchell, Kohno and Sakurai satisfy the requirements for an “outside director” under theCompanies Act.
(2) Messrs. Uno, Itoh and Tsuruta satisfy the requirements for an “outside corporate auditor” under the Companies Act.
For more information, see “Item 6.C. Board Practices.”
Familial Relationships
There are no familial relationships between any of the directors and corporate auditors listed above.
Arrangements and Understandings
There is no arrangement or understanding with any major shareholder, customer, supplier or other party,pursuant to which any of the directors and corporate auditors listed above were selected as a director or memberof corporate auditors.
121

6.B. COMPENSATION
The aggregate amounts of compensation paid by us during the fiscal year ended March 31, 2015 to ourdirectors and to our corporate auditors were ¥940 million and ¥192 million, respectively.
The following table sets forth the details of individual compensation, disclosed pursuant to the provision ofthe FIEA and related ordinance, by SMFG and its subsidiaries in amounts equal to or exceeding ¥100 millionduring the fiscal year ended March 31, 2015:
Compensation
DirectorAggregate
amount Paid by Annual salary Stock option Bonus
(In millions)(1)
Masayuki Oku . . . . . . . . . . . . . . . . . . . ¥ 122 SMFG ¥ 86 ¥ 10 ¥ 26SMBC — — —
Koichi Miyata . . . . . . . . . . . . . . . . . . . ¥ 129 SMFG ¥ 69 ¥ 8 ¥ 22SMBC 21 1 4
Takeshi Kunibe . . . . . . . . . . . . . . . . . . ¥ 129 SMFG ¥ 21 ¥ 1 ¥ 4SMBC 69 8 22
(1) Amounts less than one million yen have been truncated.
Compensation for our directors, including bonuses and incentive stock options, must be approved at ourgeneral meeting of shareholders, unless otherwise provided in our articles of incorporation. The shareholders’approval may specify the upper limit of the aggregate amount of compensation or calculation methods, but ifcompensation includes benefits in kind, the shareholders’ approval must include the description of such benefits.Similarly, compensation to our corporate auditors must be approved by our shareholders at our general meetingof shareholders unless otherwise specified in our articles of incorporation. Our articles of incorporation currentlydo not have such provisions with respect to compensation for directors and corporate auditors.
Compensation for an individual director and corporate auditor is determined by our board of directors andby consultation among our corporate auditors, respectively, in accordance with our internal rules and ourstandard practice of approval at our general meeting of shareholders. To ensure objectivity in the process ofdetermining such compensation, bonuses and stock options to our board of directors and the board of directors ofthe Bank, we have formed a compensation committee in which an outside director serves as the chairman of thecommittee.
In June 2010, a shareholders resolution was passed at the general meeting of shareholders to introduce astock option compensation program to certain directors and corporate auditors in connection with the abolition oftheir retirement benefit program. Following such resolution, we granted stock options for certain directors,corporate auditors and executive officers of the Company and the Bank on August 13, 2010. Because theresolution also abolished the retirement benefit program for our corporate directors and auditors, no amountswere set aside for the payment of any retirement benefits for them during the fiscal year ended March 31, 2015.For additional information, see “Item 6.E. Share Ownership” or Note 39 “Share-Based Payment” to ourconsolidated financial statements included elsewhere in this annual report.
6.C. BOARD PRACTICES
General
The Companies Act permits three types of governance systems for large public companies. The first systemis for companies with a nominating committee, an audit committee and a compensation committee, and thesecond one is for companies with an audit and supervisory committee. The last one is for companies with a boardof corporate auditors. We employ the board of corporate auditors governance system. Pursuant to Article 4 of our
122

articles of incorporation, we maintain a corporate governance system consisting of a general meeting ofshareholders, individual directors, a board of directors, individual corporate auditors, a board of corporateauditors and an accounting auditor as its primary components.
Our articles of incorporation provide for a board of directors consisting of not fewer than three directors. Wecurrently have thirteen directors. Our board of directors has ultimate responsibility for the administration of ouraffairs.
By resolution, our board of directors elects representative directors from the directors who are severallyauthorized to represent us. Our board of directors may elect directors with titles (yakutsuki-torishimariyaku), andexecutive officers with titles (yakutsuki-shikkoyakuin), and may elect or remove executive officers and otherimportant employees by resolution. In addition, our board of directors may assign or change the designation ofthe duties of the directors and executive officers by resolution.
Our president executes business affairs in accordance with resolutions adopted by the board of directors.Our deputy presidents, senior managing directors and managing directors assist the president in the managementof our day-to-day operations. Our chairman serves as the chairman of and presides over our board of directors.This is done in order to separate the role of our president, whose responsibility is to exercise overall supervisionof our business activities and other group companies, from the role of our chairman.
The Companies Act requires a resolution of the board of directors for a company to execute importantbusiness strategies, including acquiring and disposing of material assets; borrowing substantial amounts ofmoney; establishing, changing or abolishing branch offices or other material corporate organizations; issuingbonds; establishing internal control systems; and exempting directors and corporate auditors from liability to theCompany in accordance with applicable laws and regulations.
Under the Companies Act, a company with a board of corporate auditors is not obligated to have any outsidedirectors or to have any audit, nomination or compensation committees. However, we have five outside directorsas part of our efforts to enhance corporate governance. In addition, we have voluntarily established our auditing,risk management, compensation and nominating committees to enhance the effectiveness of our board ofdirectors. To ensure the compliance of our execution of our business operations with legal regulations andgenerally accepted practices, the outside directors are selected from among experts (including certified publicaccountants, lawyers and persons with consulting or business management experience).
“Outside director” means a director of any corporation who satisfies all of the following requirements: (a) aperson who is not an executive director, executive officer (shikkoyaku), or an employee, including a manager(“Executive Director, etc.”), and has not been an Executive Director, etc. of such corporation or any of itssubsidiaries for the ten years prior to assuming his/her office; (b) if the person has been a director, accountingadvisor or corporate auditor of such corporation or any of its subsidiaries (excluding a person who has been anExecutive Director, etc.) at any time within the ten years prior to assuming his/her office, a person who has notbeen an Executive Director, etc. of such corporation or any of its subsidiaries for the ten years prior to assuminghis/her office as director, accounting advisor, or corporate auditor; (c) a person who is not a parent corporation orany entity which is prescribed by the applicable Ordinance of the Ministry of Justice as a person who controls themanagement of the corporation (excluding entities who are juridical persons) (“parent corporation, etc.”) of suchcorporation (limited to a natural person) or director or executive officer (shikkoyaku), or other employee,including a manager, of a parent corporation, etc.; (d) a person who is not an Executive Director, etc. of asubsidiary or any entity which is prescribed by the applicable Ordinance of the Ministry of Justice as the juridicalperson for which management is controlled by the person other than the corporation (“subsidiary, etc.”) of aparent corporation, etc. of such corporation; and (e) a person who is not a spouse or relative within the seconddegree of kinship of a director or executive officer (shikkoyaku), manager, or other important employee of suchcorporation, or its parent corporation, etc. (limited to a natural person).
123
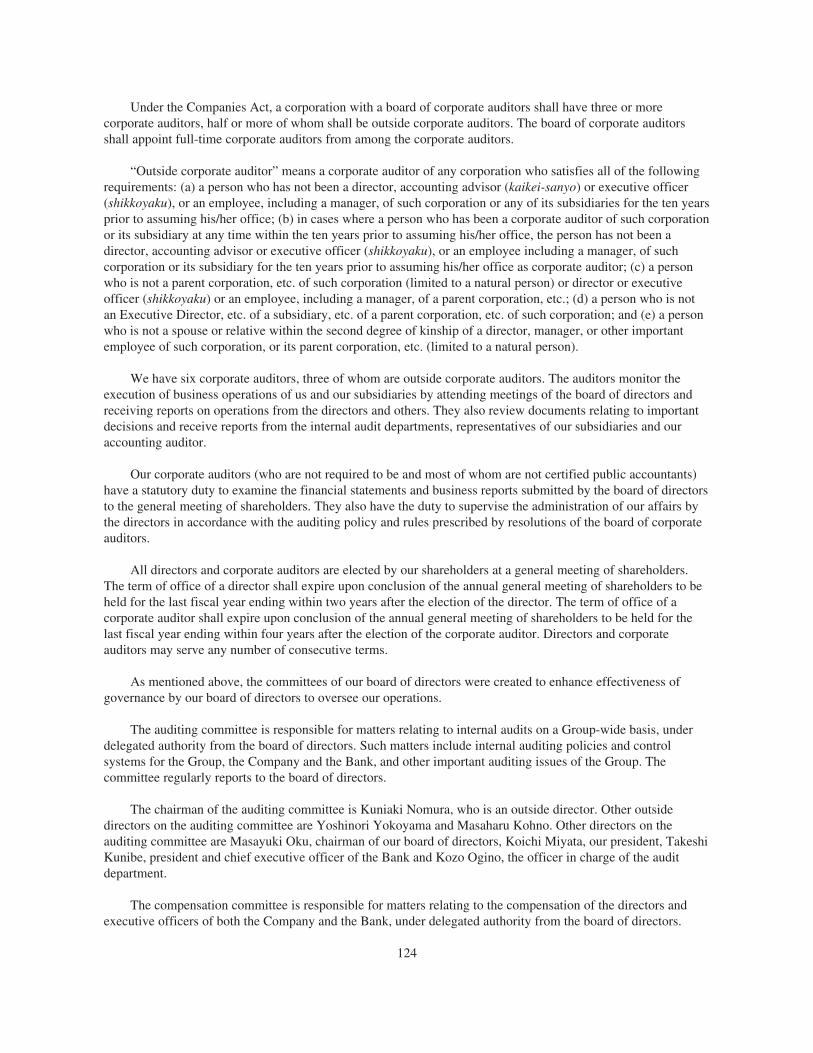
Under the Companies Act, a corporation with a board of corporate auditors shall have three or morecorporate auditors, half or more of whom shall be outside corporate auditors. The board of corporate auditorsshall appoint full-time corporate auditors from among the corporate auditors.
“Outside corporate auditor” means a corporate auditor of any corporation who satisfies all of the followingrequirements: (a) a person who has not been a director, accounting advisor (kaikei-sanyo) or executive officer(shikkoyaku), or an employee, including a manager, of such corporation or any of its subsidiaries for the ten yearsprior to assuming his/her office; (b) in cases where a person who has been a corporate auditor of such corporationor its subsidiary at any time within the ten years prior to assuming his/her office, the person has not been adirector, accounting advisor or executive officer (shikkoyaku), or an employee including a manager, of suchcorporation or its subsidiary for the ten years prior to assuming his/her office as corporate auditor; (c) a personwho is not a parent corporation, etc. of such corporation (limited to a natural person) or director or executiveofficer (shikkoyaku) or an employee, including a manager, of a parent corporation, etc.; (d) a person who is notan Executive Director, etc. of a subsidiary, etc. of a parent corporation, etc. of such corporation; and (e) a personwho is not a spouse or relative within the second degree of kinship of a director, manager, or other importantemployee of such corporation, or its parent corporation, etc. (limited to a natural person).
We have six corporate auditors, three of whom are outside corporate auditors. The auditors monitor theexecution of business operations of us and our subsidiaries by attending meetings of the board of directors andreceiving reports on operations from the directors and others. They also review documents relating to importantdecisions and receive reports from the internal audit departments, representatives of our subsidiaries and ouraccounting auditor.
Our corporate auditors (who are not required to be and most of whom are not certified public accountants)have a statutory duty to examine the financial statements and business reports submitted by the board of directorsto the general meeting of shareholders. They also have the duty to supervise the administration of our affairs bythe directors in accordance with the auditing policy and rules prescribed by resolutions of the board of corporateauditors.
All directors and corporate auditors are elected by our shareholders at a general meeting of shareholders.The term of office of a director shall expire upon conclusion of the annual general meeting of shareholders to beheld for the last fiscal year ending within two years after the election of the director. The term of office of acorporate auditor shall expire upon conclusion of the annual general meeting of shareholders to be held for thelast fiscal year ending within four years after the election of the corporate auditor. Directors and corporateauditors may serve any number of consecutive terms.
As mentioned above, the committees of our board of directors were created to enhance effectiveness ofgovernance by our board of directors to oversee our operations.
The auditing committee is responsible for matters relating to internal audits on a Group-wide basis, underdelegated authority from the board of directors. Such matters include internal auditing policies and controlsystems for the Group, the Company and the Bank, and other important auditing issues of the Group. Thecommittee regularly reports to the board of directors.
The chairman of the auditing committee is Kuniaki Nomura, who is an outside director. Other outsidedirectors on the auditing committee are Yoshinori Yokoyama and Masaharu Kohno. Other directors on theauditing committee are Masayuki Oku, chairman of our board of directors, Koichi Miyata, our president, TakeshiKunibe, president and chief executive officer of the Bank and Kozo Ogino, the officer in charge of the auditdepartment.
The compensation committee is responsible for matters relating to the compensation of the directors andexecutive officers of both the Company and the Bank, under delegated authority from the board of directors.
124

Such matters include the determination of bonuses and stock option awards. The compensation committee seeksto determine appropriate levels of compensation in a transparent and objective manner. The committee reports tothe board of directors.
The chairman of the compensation committee is Yoshinori Yokoyama, who is an outside director. Otheroutside directors on the compensation committee are Kuniaki Nomura, Arthur M. Mitchell, Masaharu Kohno andEriko Sakurai. Other directors on the compensation committee are Masayuki Oku, chairman of our board ofdirectors, Koichi Miyata, our president, and Takeshi Kunibe, president and chief executive officer of the Bank.
In addition, the risk management committee supervises and reports to our board of directors on materialGroup-wide risk management and compliance issues. The nominating committee supervises and reports to ourboard of directors on the selection of directors of both the Company and the Bank, issues related to selection ofcandidates for directorships, the appointment of managing directors and the appointment of representativedirectors and other material director personnel issues.
These committees are each composed of seven to nine members including the chairman of the board, thepresident, and three or more outside directors. Outside directors are appointed to all these committees to facilitatecorporate governance from an objective perspective. As noted above, because the need for objectivity isparticularly acute in the case of the auditing committee and the compensation committee, the chairmanship ofthese committees is assigned to outside directors.
At the operational level, we have created the Management Committee to act as the top decision-making bodywith respect to business administration and management supervision of the entire Group. The committee, composed ofdirectors designated by our president, considers important matters relating to the execution of business in accordancewith the basic policies set by the board of directors and based on discussions held by the committee members.
For the purpose of protecting the interests of shareholders in general, some Japanese securities exchanges,including the Tokyo Stock Exchange, requires a listed company to have, from amongst its outside directors oroutside corporate auditors, at least one independent director or corporate auditor who does not have conflictinginterests with shareholders as specified under the rule. All companies on these securities exchanges are requiredto report the name of such independent director or corporate auditor, which is disclosed to the public. In addition,the Japan’s Corporate Governance Code (“Corporate Governance Code”) formulated by the Tokyo StockExchange, which establishes fundamental principles for effective corporate governance at listed companies inJapan and took effect in June 2015, provides that listed companies should appoint at least two independentdirectors. The independence standard for such independent directors will be determined by the subject listedcompany taking into consideration the independence standards of the Japanese stock exchanges. We alsoestablished the SMFG Corporate Governance Guideline in consideration of the content of the CorporateGovernance Code and such Corporate Governance Guideline provides that one-third or more of the directors, andat least two of them, will be elected as independent outside directors. We designated all five outside directors andoutside corporate auditors as independent directors and independent corporate auditors, respectively.
Exemption from Liability
Under the Companies Act and our articles of incorporation, we may exempt our non-executive directors andcorporate auditors from liabilities to us arising in connection with their failure to execute their duties, within thelimits stipulated by applicable laws and regulations. Pursuant to such authority, we have entered into a liabilitylimitation agreement with each non-executive directors and corporate auditor which limits the maximum amountof their liability to the Company arising in connection with a failure to execute their duties to the greater of either¥10 million or the minimum liability amount prescribed in applicable laws.
Corporate Governance Practices
Companies listed on the NYSE, must comply with certain corporate governance standards provided underSection 303A of the NYSE Listed Company Manual. However, NYSE-listed companies that are foreign private
125

issuers, including us, are permitted to follow home country practices in lieu of certain provisions of Section 303Aif such foreign private issuers meet certain criteria. See “Item 16.G. Corporate Governance” for a summary ofsignificant ways in which our corporate governance practices differ from those required to be followed byNYSE-listed U.S. companies.
Independent Registered Public Accounting Firm
We are required to appoint an independent registered public accounting firm, whose appointment isapproved at a general meeting of shareholders. The independent registered public accounting firm has thestatutory duty to examine the financial statements prepared in accordance with the Companies Act and approvedby the board of directors, and report its opinion thereon to the designated corporate auditors and to the designateddirectors for notification to the shareholders. Examination by independent registered public accounting firm ofour financial statements is also required for the purpose of the securities report filed through the Kanto LocalFinance Bureau to the Prime Minister for public inspection in accordance with the FIEA. Our independentregistered public accounting firm for these purposes is KPMG AZSA LLC (“KPMG AZSA”).
Benefits upon Termination of Employment
Neither we nor our subsidiaries maintain any directors’ service contracts providing for benefits upontermination of employment.
6.D. EMPLOYEES
At March 31, 2015, 2014 and 2013, on a consolidated basis, we had approximately 68,700, 66,500, and64,600 employees, respectively, including locally hired staff in our foreign offices but excluding temporaryemployees. We also had an average of approximately 16,300 temporary employees during the fiscal year endedMarch 31, 2015.
The following tables show our full-time employees at March 31, 2015 on a consolidated basis underJapanese GAAP broken down based on business segment and geographical location:
Percentage of full-timeemployees at
March 31, 2015
Business segment:Commercial Banking(1) . . . . . . . . . . . . . . . . . . . . . . . . . . . . . . . . . . . . . . . . . . . . . . . . . . 50%Leasing . . . . . . . . . . . . . . . . . . . . . . . . . . . . . . . . . . . . . . . . . . . . . . . . . . . . . . . . . . . . . . . 4Securities . . . . . . . . . . . . . . . . . . . . . . . . . . . . . . . . . . . . . . . . . . . . . . . . . . . . . . . . . . . . . 16Consumer Finance . . . . . . . . . . . . . . . . . . . . . . . . . . . . . . . . . . . . . . . . . . . . . . . . . . . . . . 16Others . . . . . . . . . . . . . . . . . . . . . . . . . . . . . . . . . . . . . . . . . . . . . . . . . . . . . . . . . . . . . . . . 14
Total . . . . . . . . . . . . . . . . . . . . . . . . . . . . . . . . . . . . . . . . . . . . . . . . . . . . . . . . . . . . . 100%
(1) The number of employees of the Bank represents 39% of the number of our employees on a consolidated basis. Further, the number ofemployees in the Bank’s Wholesale Banking Unit, Retail Banking Unit, International Banking Unit, Treasury Unit and Others represent7%, 16%, 6%, 1% and 9% of the number of our employees on a consolidated basis, respectively.
Percentage of full-timeemployees at
March 31, 2015
Location:Japan . . . . . . . . . . . . . . . . . . . . . . . . . . . . . . . . . . . . . . . . . . . . . . . . . . . . . . . . . . . . . . . . . 89%Americas . . . . . . . . . . . . . . . . . . . . . . . . . . . . . . . . . . . . . . . . . . . . . . . . . . . . . . . . . . . . . . 2Europe and Middle East . . . . . . . . . . . . . . . . . . . . . . . . . . . . . . . . . . . . . . . . . . . . . . . . . . 2Asia and Oceania . . . . . . . . . . . . . . . . . . . . . . . . . . . . . . . . . . . . . . . . . . . . . . . . . . . . . . . 7
Total . . . . . . . . . . . . . . . . . . . . . . . . . . . . . . . . . . . . . . . . . . . . . . . . . . . . . . . . . . . . . 100%
126

Most of the employees of the Bank are members of the Sumitomo Mitsui Banking Corporation Workers’Union, which negotiates with the Bank concerning remuneration and working conditions. The union is affiliatedwith the Federation of City Bank Workers’ Unions. The Bank considers its labor relations to be excellent.
We consider our level of remuneration, fringe benefits (including an employee share ownership program),working conditions and other allowances, which include lump-sum payments and annuities to employees uponretirement, to be generally competitive with those offered by other large enterprises in Japan.
6.E. SHARE OWNERSHIP
Shareholdings by Directors, Senior Management and Corporate Auditors
The following table shows the number of shares of our common stock owned by our directors and corporateauditors at June 26, 2015:
Number of shares owned
Directors and corporate auditors:Masayuki Oku . . . . . . . . . . . . . . . . . . . . . . . . . . . . . . . . . . . . . . . . . . . . . . . . . . . . . . . . 16,300Koichi Miyata . . . . . . . . . . . . . . . . . . . . . . . . . . . . . . . . . . . . . . . . . . . . . . . . . . . . . . . . 13,000Takeshi Kunibe . . . . . . . . . . . . . . . . . . . . . . . . . . . . . . . . . . . . . . . . . . . . . . . . . . . . . . . 12,788Yujiro Ito . . . . . . . . . . . . . . . . . . . . . . . . . . . . . . . . . . . . . . . . . . . . . . . . . . . . . . . . . . . . 8,022Kozo Ogino . . . . . . . . . . . . . . . . . . . . . . . . . . . . . . . . . . . . . . . . . . . . . . . . . . . . . . . . . . 7,000Toshiyuki Teramoto . . . . . . . . . . . . . . . . . . . . . . . . . . . . . . . . . . . . . . . . . . . . . . . . . . . 7,000Jun Ohta . . . . . . . . . . . . . . . . . . . . . . . . . . . . . . . . . . . . . . . . . . . . . . . . . . . . . . . . . . . . . 5,900Katsunori Tanizaki . . . . . . . . . . . . . . . . . . . . . . . . . . . . . . . . . . . . . . . . . . . . . . . . . . . . 5,800Yoshinori Yokoyama . . . . . . . . . . . . . . . . . . . . . . . . . . . . . . . . . . . . . . . . . . . . . . . . . . —Kuniaki Nomura . . . . . . . . . . . . . . . . . . . . . . . . . . . . . . . . . . . . . . . . . . . . . . . . . . . . . . —Arthur M. Mitchell . . . . . . . . . . . . . . . . . . . . . . . . . . . . . . . . . . . . . . . . . . . . . . . . . . . . —Masaharu Kohno . . . . . . . . . . . . . . . . . . . . . . . . . . . . . . . . . . . . . . . . . . . . . . . . . . . . . . —Eriko Sakurai . . . . . . . . . . . . . . . . . . . . . . . . . . . . . . . . . . . . . . . . . . . . . . . . . . . . . . . . . —Koichi Minami . . . . . . . . . . . . . . . . . . . . . . . . . . . . . . . . . . . . . . . . . . . . . . . . . . . . . . . 8,100Kazuhiko Nakao . . . . . . . . . . . . . . . . . . . . . . . . . . . . . . . . . . . . . . . . . . . . . . . . . . . . . . 1,000Toru Mikami . . . . . . . . . . . . . . . . . . . . . . . . . . . . . . . . . . . . . . . . . . . . . . . . . . . . . . . . . 300Ikuo Uno . . . . . . . . . . . . . . . . . . . . . . . . . . . . . . . . . . . . . . . . . . . . . . . . . . . . . . . . . . . . —Satoshi Itoh . . . . . . . . . . . . . . . . . . . . . . . . . . . . . . . . . . . . . . . . . . . . . . . . . . . . . . . . . . —Rokuro Tsuruta . . . . . . . . . . . . . . . . . . . . . . . . . . . . . . . . . . . . . . . . . . . . . . . . . . . . . . . —
None of our directors or corporate auditors is the owner of more than one percent of our common stock, andno director or corporate auditor has voting rights with respect to our common stock that are different from anyother holder of our common stock.
Stock Option Plans and Other Remuneration for Directors and Senior Management
In June 2010, a resolution was passed at the general meeting of shareholders to introduce a stock optioncompensation program for directors, corporate auditors and executive officers of the Company and the Bank(“SMFG Stock Acquisition Rights”). This serves to incentivize grantees to further contribute to the equityappreciation and improved corporate performance through a sharing of the benefits and risks of share priceperformance of our shares. These changes reflected a review of our compensation system and the elimination ofretirement benefits for directors, corporate auditors and executive officers.
127
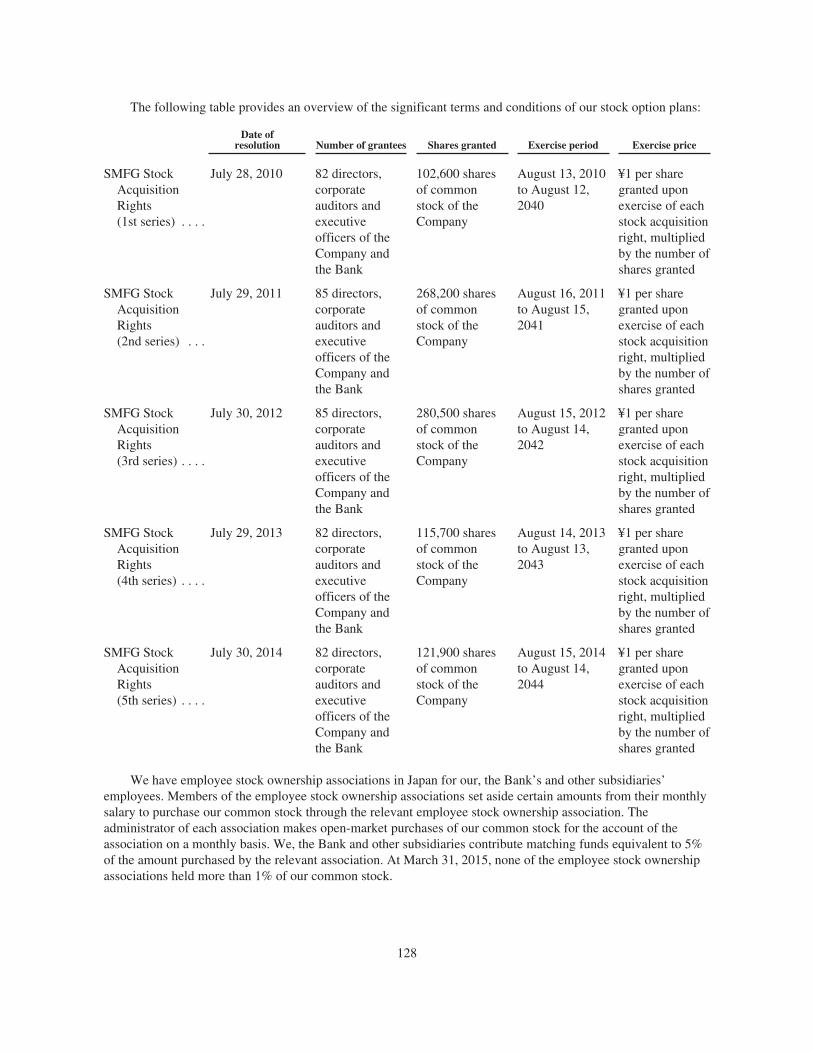
The following table provides an overview of the significant terms and conditions of our stock option plans:
Date ofresolution Number of grantees Shares granted Exercise period Exercise price
SMFG StockAcquisitionRights(1st series) . . . .
July 28, 2010 82 directors,corporateauditors andexecutiveofficers of theCompany andthe Bank
102,600 sharesof commonstock of theCompany
August 13, 2010to August 12,2040
¥1 per sharegranted uponexercise of eachstock acquisitionright, multipliedby the number ofshares granted
SMFG StockAcquisitionRights(2nd series) . . .
July 29, 2011 85 directors,corporateauditors andexecutiveofficers of theCompany andthe Bank
268,200 sharesof commonstock of theCompany
August 16, 2011to August 15,2041
¥1 per sharegranted uponexercise of eachstock acquisitionright, multipliedby the number ofshares granted
SMFG StockAcquisitionRights(3rd series) . . . .
July 30, 2012 85 directors,corporateauditors andexecutiveofficers of theCompany andthe Bank
280,500 sharesof commonstock of theCompany
August 15, 2012to August 14,2042
¥1 per sharegranted uponexercise of eachstock acquisitionright, multipliedby the number ofshares granted
SMFG StockAcquisitionRights(4th series) . . . .
July 29, 2013 82 directors,corporateauditors andexecutiveofficers of theCompany andthe Bank
115,700 sharesof commonstock of theCompany
August 14, 2013to August 13,2043
¥1 per sharegranted uponexercise of eachstock acquisitionright, multipliedby the number ofshares granted
SMFG StockAcquisitionRights(5th series) . . . .
July 30, 2014 82 directors,corporateauditors andexecutiveofficers of theCompany andthe Bank
121,900 sharesof commonstock of theCompany
August 15, 2014to August 14,2044
¥1 per sharegranted uponexercise of eachstock acquisitionright, multipliedby the number ofshares granted
We have employee stock ownership associations in Japan for our, the Bank’s and other subsidiaries’employees. Members of the employee stock ownership associations set aside certain amounts from their monthlysalary to purchase our common stock through the relevant employee stock ownership association. Theadministrator of each association makes open-market purchases of our common stock for the account of theassociation on a monthly basis. We, the Bank and other subsidiaries contribute matching funds equivalent to 5%of the amount purchased by the relevant association. At March 31, 2015, none of the employee stock ownershipassociations held more than 1% of our common stock.
128
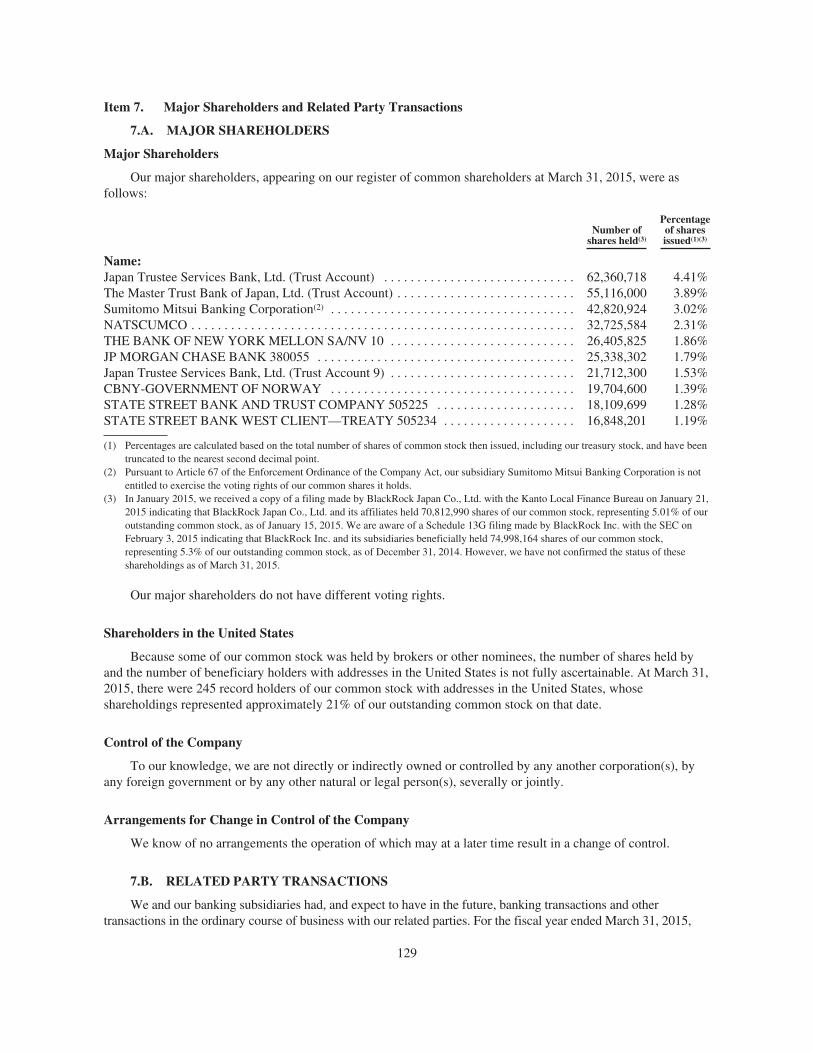
Item 7. Major Shareholders and Related Party Transactions
7.A. MAJOR SHAREHOLDERS
Major Shareholders
Our major shareholders, appearing on our register of common shareholders at March 31, 2015, were asfollows:
Number ofshares held(3)
Percentageof sharesissued(1)(3)
Name:Japan Trustee Services Bank, Ltd. (Trust Account) . . . . . . . . . . . . . . . . . . . . . . . . . . . . . 62,360,718 4.41%The Master Trust Bank of Japan, Ltd. (Trust Account) . . . . . . . . . . . . . . . . . . . . . . . . . . . 55,116,000 3.89%Sumitomo Mitsui Banking Corporation(2) . . . . . . . . . . . . . . . . . . . . . . . . . . . . . . . . . . . . . 42,820,924 3.02%NATSCUMCO . . . . . . . . . . . . . . . . . . . . . . . . . . . . . . . . . . . . . . . . . . . . . . . . . . . . . . . . . . 32,725,584 2.31%THE BANK OF NEW YORK MELLON SA/NV 10 . . . . . . . . . . . . . . . . . . . . . . . . . . . . 26,405,825 1.86%JP MORGAN CHASE BANK 380055 . . . . . . . . . . . . . . . . . . . . . . . . . . . . . . . . . . . . . . . 25,338,302 1.79%Japan Trustee Services Bank, Ltd. (Trust Account 9) . . . . . . . . . . . . . . . . . . . . . . . . . . . . 21,712,300 1.53%CBNY-GOVERNMENT OF NORWAY . . . . . . . . . . . . . . . . . . . . . . . . . . . . . . . . . . . . . 19,704,600 1.39%STATE STREET BANK AND TRUST COMPANY 505225 . . . . . . . . . . . . . . . . . . . . . 18,109,699 1.28%STATE STREET BANK WEST CLIENT—TREATY 505234 . . . . . . . . . . . . . . . . . . . . 16,848,201 1.19%
(1) Percentages are calculated based on the total number of shares of common stock then issued, including our treasury stock, and have beentruncated to the nearest second decimal point.
(2) Pursuant to Article 67 of the Enforcement Ordinance of the Company Act, our subsidiary Sumitomo Mitsui Banking Corporation is notentitled to exercise the voting rights of our common shares it holds.
(3) In January 2015, we received a copy of a filing made by BlackRock Japan Co., Ltd. with the Kanto Local Finance Bureau on January 21,2015 indicating that BlackRock Japan Co., Ltd. and its affiliates held 70,812,990 shares of our common stock, representing 5.01% of ouroutstanding common stock, as of January 15, 2015. We are aware of a Schedule 13G filing made by BlackRock Inc. with the SEC onFebruary 3, 2015 indicating that BlackRock Inc. and its subsidiaries beneficially held 74,998,164 shares of our common stock,representing 5.3% of our outstanding common stock, as of December 31, 2014. However, we have not confirmed the status of theseshareholdings as of March 31, 2015.
Our major shareholders do not have different voting rights.
Shareholders in the United States
Because some of our common stock was held by brokers or other nominees, the number of shares held byand the number of beneficiary holders with addresses in the United States is not fully ascertainable. At March 31,2015, there were 245 record holders of our common stock with addresses in the United States, whoseshareholdings represented approximately 21% of our outstanding common stock on that date.
Control of the Company
To our knowledge, we are not directly or indirectly owned or controlled by any another corporation(s), byany foreign government or by any other natural or legal person(s), severally or jointly.
Arrangements for Change in Control of the Company
We know of no arrangements the operation of which may at a later time result in a change of control.
7.B. RELATED PARTY TRANSACTIONS
We and our banking subsidiaries had, and expect to have in the future, banking transactions and othertransactions in the ordinary course of business with our related parties. For the fiscal year ended March 31, 2015,
129

such transactions included, but were not limited to, loans, deposits and guarantees. Furthermore, such transactionswere immaterial and were made at prevailing market rates, terms and conditions, and did not involve more than thenormal risk of collectibility or present other unfavorable features.
During the fiscal year ended March 31, 2015, none of our directors or corporate auditors or the Bank’sdirectors, and none of the close members of their respective families, had any transactions that were material orany transactions that were unusual in their nature or conditions, involving goods, services or tangible orintangible assets, to which we were a party, and no such transactions were proposed at March 31, 2015. Duringthe fiscal year ended March 31, 2015, we made no loans to our directors or corporate auditors or the Bank’sdirectors other than those that were made in the ordinary course of business, on substantially the same terms,including interest rates and collateral, as those prevailing at the time for comparable transactions with otherpersons, and did not involve more than the normal risk of collectibility or present other unfavorable features.
7.C. INTERESTS OF EXPERTS AND COUNSEL
Not applicable.
Item 8. Financial Information
8.A. CONSOLIDATED STATEMENTS AND OTHER FINANCIAL INFORMATION
Financial Statements
All relevant financial statements are attached hereto. See “Item 18. Financial Statements.” See “Item 5.A.Operating Results—Reconciliation with Japanese GAAP” for a reconciliation of consolidated net profit and totalequity for the fiscal year ended March 31, 2015 under IFRS, with those amounts under Japanese GAAP.
Export Sales
Not applicable.
Legal Proceedings
We are party to routine litigation incidental to our business, none of which is currently expected to have amaterial adverse effect on our financial condition or results of operations. However, there can be no assurancethat an adverse decision in one or more of these lawsuits will not have a material adverse effect.
Dividend Policy and Dividends
The declaration, payment and determination of any year-end dividend are subject to the approval ofshareholders of our common stock at our general meeting of shareholders and to statutory restrictions. Thedeclaration, payment and determination of the amount of any interim dividend require a resolution of our boardof directors and are subject to statutory restrictions. Dividend payments are made to shareholders or pledgees ofrecord at the record dates for each payment. March 31 is the record date for year-end dividends andSeptember 30 is the record date for interim dividends. The payment of year-end and interim dividends oncommon stock is subject to prior payment of dividends on our preferred stock, if any.
We have a basic policy of pursuing the sustainable growth of shareholder value and increasing the dividendper share in a stable manner, by achieving higher profitability and growth through growth investments with afocus on capital efficiency, while enhancing retained earnings to maintain financial soundness.
130
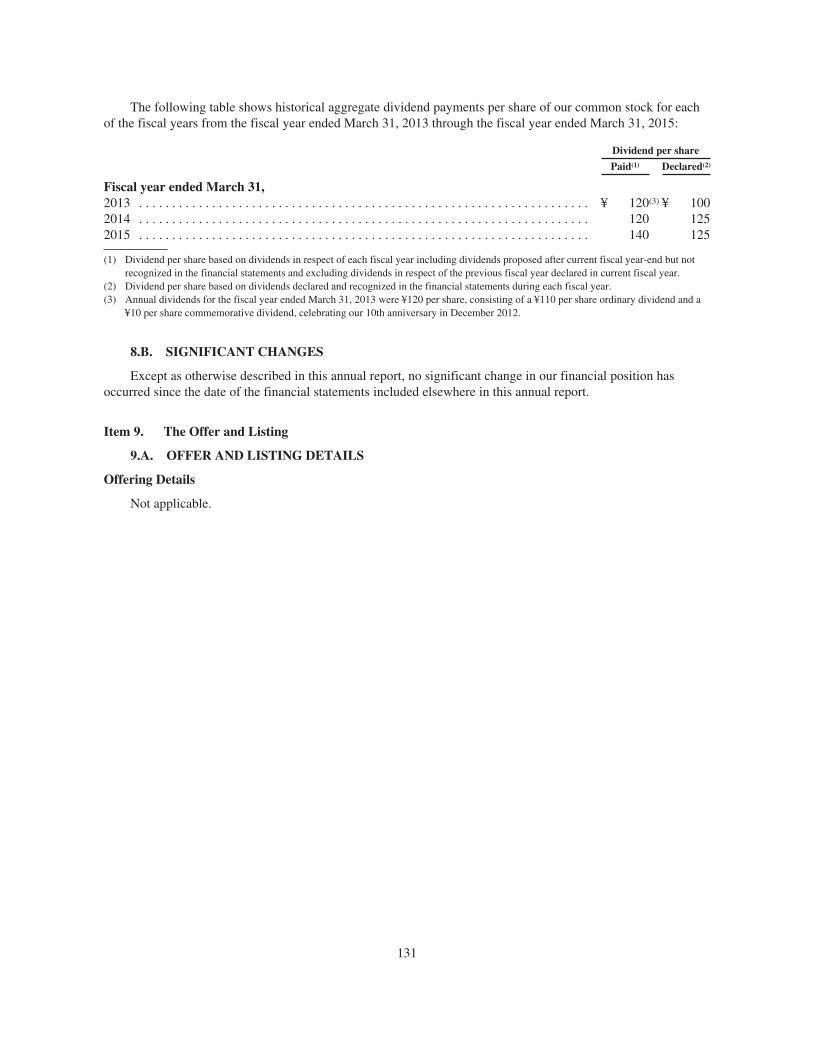
The following table shows historical aggregate dividend payments per share of our common stock for eachof the fiscal years from the fiscal year ended March 31, 2013 through the fiscal year ended March 31, 2015:
Dividend per share
Paid(1) Declared(2)
Fiscal year ended March 31,2013 . . . . . . . . . . . . . . . . . . . . . . . . . . . . . . . . . . . . . . . . . . . . . . . . . . . . . . . . . . . . . . . . . . . . ¥ 120(3) ¥ 1002014 . . . . . . . . . . . . . . . . . . . . . . . . . . . . . . . . . . . . . . . . . . . . . . . . . . . . . . . . . . . . . . . . . . . . 120 1252015 . . . . . . . . . . . . . . . . . . . . . . . . . . . . . . . . . . . . . . . . . . . . . . . . . . . . . . . . . . . . . . . . . . . . 140 125
(1) Dividend per share based on dividends in respect of each fiscal year including dividends proposed after current fiscal year-end but notrecognized in the financial statements and excluding dividends in respect of the previous fiscal year declared in current fiscal year.
(2) Dividend per share based on dividends declared and recognized in the financial statements during each fiscal year.(3) Annual dividends for the fiscal year ended March 31, 2013 were ¥120 per share, consisting of a ¥110 per share ordinary dividend and a
¥10 per share commemorative dividend, celebrating our 10th anniversary in December 2012.
8.B. SIGNIFICANT CHANGES
Except as otherwise described in this annual report, no significant change in our financial position hasoccurred since the date of the financial statements included elsewhere in this annual report.
Item 9. The Offer and Listing
9.A. OFFER AND LISTING DETAILS
Offering Details
Not applicable.
131

Price History of the Shares
Market Price Information for Our American Depositary Shares
The following table sets forth, for the periods indicated, the high and low trading prices, and average dailytrading volume for our ADSs on the NYSE since their listing on November 1, 2010:
Price per ADS Average dailytrading volumeHigh Low
(In dollars) (Number ofshares)
Fiscal year ended March 31, except quarter and month data:2011 (from November 1, 2010) . . . . . . . . . . . . . . . . . . . . . . . . . . . . . . . . . . . . . . . $ 7.77 $5.75 539,9062012 . . . . . . . . . . . . . . . . . . . . . . . . . . . . . . . . . . . . . . . . . . . . . . . . . . . . . . . . . . . . 7.06 5.12 432,5312013 . . . . . . . . . . . . . . . . . . . . . . . . . . . . . . . . . . . . . . . . . . . . . . . . . . . . . . . . . . . . 9.46 5.55 888,2102014:
First quarter . . . . . . . . . . . . . . . . . . . . . . . . . . . . . . . . . . . . . . . . . . . . . . . . . . 9.96 7.32 2,512,657Second quarter . . . . . . . . . . . . . . . . . . . . . . . . . . . . . . . . . . . . . . . . . . . . . . . . 10.20 8.82 1,136,321Third quarter . . . . . . . . . . . . . . . . . . . . . . . . . . . . . . . . . . . . . . . . . . . . . . . . . . 10.59 9.45 1,436,759Fourth quarter . . . . . . . . . . . . . . . . . . . . . . . . . . . . . . . . . . . . . . . . . . . . . . . . . 10.45 8.11 1,301,701
Full year . . . . . . . . . . . . . . . . . . . . . . . . . . . . . . . . . . . . . . . . . . . . . . . . . 10.59 7.32 1,600,3592015:
First quarter . . . . . . . . . . . . . . . . . . . . . . . . . . . . . . . . . . . . . . . . . . . . . . . . . . 8.83 7.59 1,319,744Second quarter . . . . . . . . . . . . . . . . . . . . . . . . . . . . . . . . . . . . . . . . . . . . . . . . 8.61 7.90 1,195,001Third quarter . . . . . . . . . . . . . . . . . . . . . . . . . . . . . . . . . . . . . . . . . . . . . . . . . . 8.42 6.95 2,062,355Fourth quarter . . . . . . . . . . . . . . . . . . . . . . . . . . . . . . . . . . . . . . . . . . . . . . . . . 8.24 6.74 2,494,071
Full year . . . . . . . . . . . . . . . . . . . . . . . . . . . . . . . . . . . . . . . . . . . . . . . . . 8.83 6.74 1,760,924Most recent six months:
January . . . . . . . . . . . . . . . . . . . . . . . . . . . . . . . . . . . . . . . . . . . . . . . . . . . . . . 7.34 6.74 2,687,278February . . . . . . . . . . . . . . . . . . . . . . . . . . . . . . . . . . . . . . . . . . . . . . . . . . . . . 8.12 6.74 3,008,254March . . . . . . . . . . . . . . . . . . . . . . . . . . . . . . . . . . . . . . . . . . . . . . . . . . . . . . . 8.24 7.70 1,874,362April . . . . . . . . . . . . . . . . . . . . . . . . . . . . . . . . . . . . . . . . . . . . . . . . . . . . . . . . 8.96 7.74 1,916,344May . . . . . . . . . . . . . . . . . . . . . . . . . . . . . . . . . . . . . . . . . . . . . . . . . . . . . . . . . 9.15 8.58 2,737,568June . . . . . . . . . . . . . . . . . . . . . . . . . . . . . . . . . . . . . . . . . . . . . . . . . . . . . . . . . 9.25 8.39 2,571,116July (through July 10, 2015) . . . . . . . . . . . . . . . . . . . . . . . . . . . . . . . . . . . . . . 8.92 8.42 1,281,131
132

Market Price Information for Our Shares
See “Item 9.C. Markets” for information on the stock exchanges on which our common stock is listed.
The following table sets forth, for the periods indicated, the high and low trading prices, and average dailytrading volume for our common stock since the fiscal year ended March 31, 2011 on the Tokyo Stock Exchange.
Price per shares Average dailytrading volumeHigh Low
(In yen) (Number ofshares)
Fiscal year ended March 31, except quarter and month data:2011 . . . . . . . . . . . . . . . . . . . . . . . . . . . . . . . . . . . . . . . . . . . . . . . . . . . . . . . . . . . ¥3,355 ¥2,235 12,022,6072012 . . . . . . . . . . . . . . . . . . . . . . . . . . . . . . . . . . . . . . . . . . . . . . . . . . . . . . . . . . . 2,933 2,003 8,339,5262013 . . . . . . . . . . . . . . . . . . . . . . . . . . . . . . . . . . . . . . . . . . . . . . . . . . . . . . . . . . . 4,255 2,231 7,228,2992014:
First quarter . . . . . . . . . . . . . . . . . . . . . . . . . . . . . . . . . . . . . . . . . . . . . . . . . 4,995 3,545 14,108,235Second quarter . . . . . . . . . . . . . . . . . . . . . . . . . . . . . . . . . . . . . . . . . . . . . . . 4,990 4,320 6,453,141Third quarter . . . . . . . . . . . . . . . . . . . . . . . . . . . . . . . . . . . . . . . . . . . . . . . . . 5,470 4,605 7,291,623Fourth quarter . . . . . . . . . . . . . . . . . . . . . . . . . . . . . . . . . . . . . . . . . . . . . . . . 5,468 4,061 8,351,850
Full year . . . . . . . . . . . . . . . . . . . . . . . . . . . . . . . . . . . . . . . . . . . . . . . . 5,470 3,545 9,052,0262015:
First quarter . . . . . . . . . . . . . . . . . . . . . . . . . . . . . . . . . . . . . . . . . . . . . . . . . 4,608 3,800 8,256,444Second quarter . . . . . . . . . . . . . . . . . . . . . . . . . . . . . . . . . . . . . . . . . . . . . . . 4,537 3,978 5,746,754Third quarter . . . . . . . . . . . . . . . . . . . . . . . . . . . . . . . . . . . . . . . . . . . . . . . . . 4,699 3,823 7,553,595Fourth quarter . . . . . . . . . . . . . . . . . . . . . . . . . . . . . . . . . . . . . . . . . . . . . . . . 4,915 3,902 8,954,048
Full year . . . . . . . . . . . . . . . . . . . . . . . . . . . . . . . . . . . . . . . . . . . . . . . . 4,915 3,800 7,609,582Most recent six months:
January . . . . . . . . . . . . . . . . . . . . . . . . . . . . . . . . . . . . . . . . . . . . . . . . . . . . . 4,350 3,952 7,919,100February . . . . . . . . . . . . . . . . . . . . . . . . . . . . . . . . . . . . . . . . . . . . . . . . . . . . 4,788 3,902 10,727,974March . . . . . . . . . . . . . . . . . . . . . . . . . . . . . . . . . . . . . . . . . . . . . . . . . . . . . . 4,915 4,560 8,315,841April . . . . . . . . . . . . . . . . . . . . . . . . . . . . . . . . . . . . . . . . . . . . . . . . . . . . . . . 5,324 4,530 8,508,181May . . . . . . . . . . . . . . . . . . . . . . . . . . . . . . . . . . . . . . . . . . . . . . . . . . . . . . . . 5,744 5,055 10,167,139June . . . . . . . . . . . . . . . . . . . . . . . . . . . . . . . . . . . . . . . . . . . . . . . . . . . . . . . . 5,747 5,192 8,241,555July (through July 10, 2015) . . . . . . . . . . . . . . . . . . . . . . . . . . . . . . . . . . . . . 5,657 5,025 9,421,250
9.B. PLAN OF DISTRIBUTION
Not applicable.
9.C. MARKETS
The primary trading market for our common stock is the Tokyo Stock Exchange (First Section), and ourcommon stock is also listed on the Nagoya Stock Exchange (First Section). Our common stock is not listed onany stock exchange outside of Japan.
Our ADSs have been listed on the NYSE since November 1, 2010 and are quoted under the ticker symbol“SMFG.”
9.D. SELLING SHAREHOLDERS
Not applicable.
133

9.E. DILUTION
Not applicable.
9.F. EXPENSES OF THE ISSUE
Not applicable.
Item 10. Additional Information
10.A. SHARE CAPITAL
Not applicable.
10.B. MEMORANDUM AND ARTICLES OF INCORPORATION
Set out below is information concerning our share capital, including a summary of provisions of our articlesof incorporation and share handling regulations and of the Companies Act relating to joint stock corporations(kabushiki-kaisha) and related legislation, each as currently in effect.
Register and Entry, Objects and Purposes of the Company
The Company is a joint stock corporation (kabushiki-kaisha) incorporated in Japan under the CompaniesAct (kaishaho) of Japan. It is registered in the commercial register (shogyo-tokibo) maintained by the ChiyodaBranch Office of the Tokyo Bureau of Legal Affairs.
Article 2 of our articles of incorporation provides that our purpose is to engage in the following businessactivities:
• management of banks and other corporations which are permitted to become, or to be established as,subsidiaries under the Banking Act; and
• any business incidental to the business mentioned in the foregoing item.
Provisions Relating to Directors
With respect to directors, the Companies Act and our articles of incorporation, bylaws and associatedinternal rules issued pursuant to the articles provide in summary as follows:
• a director is not entitled to vote on a proposal or arrangement or contract in which the director has aspecial interest;
• the aggregate remuneration for directors are determined at a general meeting of shareholders and,within the upper limit approved at the general meeting of shareholders, our board of directors willdetermine the amount of compensation for each director; our board of directors may, by its resolution,leave such decision to the discretion of our representative director;
• the board of directors has authority to approve transactions between the directors and us;
• there are no provisions requiring the mandatory retirement of directors at a specified age; and
• share ownership is not required in order to be eligible to serve as a director.
Rights, Preferences and Restrictions of the Shares
A joint stock corporation is a legal entity incorporated under the Companies Act. The rights of shareholdersof a joint stock corporation are represented by shares of stock in the corporation, and shareholders’ liability islimited to the amount of the subscription for the shares.
134

We may issue shares within our authorized but unissued share capital following a resolution by our board ofdirectors. An increase in our authorized share capital requires an amendment of our articles of incorporation,which generally requires approval of our common and preferred shareholders, if any.
Common Stock
General
On January 5, 2009, a central clearing system of shares of Japanese listed companies was enacted under theAct Concerning Book-Entry Transfer of Corporate Bonds, Shares and Other Securities (“Book-Entry TransferAct”) and the shares of all Japanese companies listed on any Japanese stock exchange, including our shares,became subject to this system, and all share certificates of companies then listed in Japan became null and voidon the effective date of the Book-Entry Transfer Act.
Under the clearing system, a person must have an account at an account managing institution or at JapanSecurities Depository Center, Inc. (“JASDEC”) in order to purchase, hold, sell or otherwise dispose of listed shares.Account managing institutions include financial instruments traders (i.e., securities companies), banks, trustcompanies and certain other financial institutions which meet the requirements prescribed by the Book-EntryTransfer Act, and only those financial institutions that meet further stringent requirements of the Book-EntryTransfer Act can open accounts directly at JASDEC. Under the Book-Entry Transfer Act, any transfer of shares iseffected through book entry, and title to the shares passes to the transferee at the time when the transferred numberof the shares is recorded in the transferee’s account at an account managing institution. The holder of an account atan account managing institution is presumed to be the legal owner of the shares held in such account.
Under the Companies Act and the Book-Entry Transfer Act, in order to assert shareholders’ rights againstus, a shareholder’s name and address must be registered in our register of shareholders, except in limitedcircumstances. Under the clearing system, such registration is made upon our receipt of the necessaryinformation from JASDEC. Nonresidents of Japan or non-Japanese corporations without a permanentestablishment in Japan (“Nonresident Shareholders”) are required to appoint a standing proxy in Japan or providea mailing address in Japan. Each Nonresident Shareholder must give notice of a standing proxy or a mailingaddress to the relevant account managing institution. That notice will be forwarded to us through JASDEC.Japanese securities companies and commercial banks customarily act as standing proxies and provide relatedservices for standard fees. Notices from us to Nonresident Shareholders are delivered to standing proxies or theirmailing addresses in Japan.
Our transfer agent is Sumitomo Mitsui Trust Bank, Limited.
Distributions of Surplus
As a holding company, we expect that most of our cash flow will come from dividends that the Bank paysus. Under some circumstances, various statutory or contractual provisions may restrict the dividends the Bankcan pay us. For example, if the Bank does not have sufficient distributable amounts, it will be unable to paydividends and we, in turn, may be unable to pay dividends on shares of our common stock. Therefore, our abilityto pay dividends mainly depends on the financial performance of our principal operating subsidiary, the Bank.
Under the Companies Act, distribution of cash or other assets by a joint stock corporation to itsshareholders, including dividends, takes the form of distributions of surplus (as described in “—Restriction onDistributions of Surplus”). We are permitted to make distributions of surplus to our shareholders any number oftimes per fiscal year, subject to limitations described in “—Restriction on Distributions of Surplus.” Distributionsof surplus are required in principle to be authorized by a resolution of a general meeting of shareholders.Distributions of surplus are, however, permitted pursuant to a resolution of the board of directors if:
(1) our articles of incorporation so provide (our current articles of incorporation do not have a provision tothat effect);
135

(2) the normal term of office of our directors is no longer than one year (our current articles ofincorporation provide that the normal term of office of our directors expires upon the close of thegeneral meeting of shareholders to be held for the last fiscal year ending within two years after theelection); and
(3) our nonconsolidated annual financial statements and certain documents for the latest fiscal year fairlypresent our assets and profit or loss, as required by an ordinance of the Ministry of Justice.
In an exception to the above rule, even if the requirements described in (1) through (3) are not met, we arepermitted to make distributions of surplus in cash to our shareholders by resolutions of the board of directorsonce per fiscal year if our articles of incorporation so provide. Our current articles of incorporation provide fordistributions of surplus as interim dividends, the record date for which is September 30 of each year.
Distributions of surplus may be made in cash or in kind in proportion to the number of shares of commonstock held by each shareholder. A resolution of a general meeting of shareholders or by the board of directorsauthorizing a distribution of surplus must specify the kind and aggregate book value of assets to be distributed,the manner of allocation of the assets to shareholders, and the effective date of the distribution. If a distributionof surplus is to be made in kind, we may, pursuant to a resolution of a general meeting of shareholders or by theboard of directors, grant the right to our shareholders to require us to make the distribution in cash instead of inkind. If that right is not granted to shareholders, then the relevant distribution of surplus must be approved by aspecial resolution of a general meeting of shareholders.
Under our articles of incorporation, the record dates for annual dividends and interim dividends areMarch 31 and September 30, respectively, in each year. In Japan, both “ex-dividend date” (the date from whichpurchasers at shares through Japanese stock exchanges will not be entitled to the dividends to be paid toregistered shareholders as any record date) and the record date for dividends precede the date of determination ofthe amount of the dividend to be paid. The ex-dividend date of the shares of common stock is generally the thirdbusiness day prior to the record date. Under our articles of incorporation, we are not obligated to pay anydistributions of surplus to be made in cash which have not been received after five years from thecommencement date of those distributions.
Restriction on Distributions of Surplus
Payment of dividends on shares of common stock is also subject to the prior payment of dividends on sharesof preferred stock, if any. In the event we pay an interim dividend on shares of our common stock, the interimdividend payment is also subject to the prior payment of interim dividends on the shares of preferred stock, ifany.
When we make a distribution of surplus, we must set aside in our capital reserve or retained earningsreserve an amount equal to one-tenth of the amount of surplus so distributed as required by an ordinance of theMinistry of Justice.
136
The amount of surplus at any given time must be calculated in accordance with the following formula:
A + B + C + D – (E + F + G)
In the above formula:
“A” = the total amount of other capital surplus and other retained earnings, each being the amountthat appears on our nonconsolidated balance sheet as of the end of the last fiscal year;
“B” = if we have disposed of treasury stock after the end of the last fiscal year, the amount of theconsideration for that treasury stock received by us less the book value thereof;
“C” = if we have reduced our stated capital after the end of the last fiscal year, the amount of thatreduction less the portion thereof that has been transferred to capital reserve or retainedearnings reserve, if any:
“D” = if we have reduced our capital reserve or retained earnings reserve after the end of the lastfiscal year, the amount of that reduction less the portion thereof that has been transferred tostated capital, if any:
“E” = if we have cancelled treasury stock after the end of the last fiscal year, the book value of thattreasury stock;
“F” = if we have distributed surplus to our shareholders after the end of the last fiscal year, the totalbook value of the surplus so distributed; and
“G” = other amounts set forth in an ordinance of the Ministry of Justice, including:
• if we have reduced surplus and increased our stated capital, capital reserve or retained earningsreserve after the end of the last fiscal year, the amount of that reduction; and
• if we have distributed surplus to shareholders after the end of the last fiscal year, the amount setaside in our capital reserve or retained earnings reserve, if any, as required by ordinances of theMinistry of Justice.
The aggregate book value of surplus distributed by us may not exceed a prescribed distributable amount ascalculated on the effective date of the distribution. Our prescribed distributable amount at any given time shall bethe amount of surplus less the aggregate of (a) the book value of our treasury stock, (b) the amount ofconsideration for any treasury stock we disposed of after the end of the last fiscal year, (c) the sum of netunrealized losses on other securities and unrealized losses on land valuation, and (d) other amounts set forth in anordinance of the Ministry of Justice, including (if the sum of one-half of our goodwill and deferred assetsexceeds the total of the stated capital, capital reserve and retained earnings reserve, each being the amount in ournonconsolidated balance sheet at the end of the last fiscal year) all or a certain part of the exceeding amount ascalculated in accordance with the ordinances of the Ministry of Justice. If we have prepared interim financialstatements in accordance with the ordinances of the Ministry of Justice as described below, and if the interimfinancial statements have been approved by the board of directors or (if so required) by a general meeting ofshareholders, then the prescribed distributable amount must be adjusted to take into account the amount of profitor loss, and the amount of consideration for any of our treasury stock disposed of by us, during the period forwhich the interim financial statements have been prepared. We will be permitted to prepare nonconsolidatedinterim financial statements consisting of a balance sheet at any date subsequent to the end of the last fiscal yearand an income statement for the period from the first day of the current fiscal year to the date of the balancesheet. Interim financial statements so prepared by us must be audited by our corporate auditors and/or accountingauditors, as required by an ordinance of the Ministry of Justice.
Voting Rights
Holders of shares of common stock have one voting right for each unit of shares held by them. Except asotherwise provided by law or by our articles of incorporation, a resolution can be adopted at a general meeting of
137
shareholders by the holder of a majority of the total number of the voting rights represented at the meeting. In ourarticles of incorporation the quorum to elect directors and corporate auditors is one-third of the total number ofvoting rights. Our shareholders are not entitled to cumulative voting in the election of directors. Our shareholdersmay cast their votes by mail or via the internet. Our shareholders may also exercise their voting rights throughproxies, provided that the proxies are also holders of shares with voting rights.
The Companies Act provides that certain important matters shall be approved by a special resolution of ageneral meeting of shareholders. Under our articles of incorporation, the quorum for a special resolution is one-third of the total number of voting rights and the approval of at least two-thirds of the voting rights represented atthe meeting is required for adopting a special resolution. Important matters include:
• amending the articles of incorporation (except for amendments that may be authorized by the board ofdirectors under the Companies Act);
• reducing stated capital which meets certain requirements, with some exceptions;
• removing a corporate auditor;
• dissolving, merging or consolidating requiring shareholders’ approval;
• establishing a parent and a wholly owned subsidiary relationship by way of a share transfer(kabushiki-iten) or share exchange (kabushiki-kokan) requiring shareholders’ approval;
• transferring the whole or a substantial part of our business;
• transferring all or part of the shares of a subsidiary which meets certain requirements;
• taking over the whole business of another company requiring shareholders’ approval;
• corporate split requiring shareholders’ approval;
• consolidating shares of common stock;
• acquiring shares of common stock from a specific shareholder other than one of our subsidiaries;
• issuing or transferring new shares or existing shares held by us as treasury stock to persons other thanthe shareholders at a specially favorable price;
• issuing stock acquisition rights (including those incorporated in bonds with stock acquisition rights) topersons other than the shareholders under specially favorable conditions;
• exempting some liability of a director or corporate auditor; and
• distributing surplus in-kind if shareholders are not granted the right to require us to make a distributionin cash instead of in-kind.
Capital and Reserves
When we issue new shares, the amount of the cash or assets paid or contributed by subscribers for newshares (with some exceptions) is required to be accounted for as stated capital, although we may account for anamount not exceeding one-half of the cash or assets as capital reserve by resolutions of the board of directors.
We may reduce our capital reserve or retained earnings reserve generally by resolution of a general meetingof shareholders. We may account for the whole or any part of the reduction as stated capital if we so decide bythe same resolution. On the other hand, we may reduce our stated capital generally by special resolution of ageneral meeting of shareholders and may account for the whole or any part of the reduction as capital reserve ifwe so decide by the same resolution. We may reduce our surplus and increase either (1) stated capital or(2) capital reserve and/or retained earnings reserve by the same amount, in either case by resolution of a generalmeeting of shareholders.
138

Stock Splits
We may at any time split our outstanding shares of common stock into a greater number of shares ofcommon stock by resolution of the board of directors. When a stock split is to be made, so long as our only classof outstanding stock is the common stock, we may increase the number of authorized shares in the same ratio asthat of the stock split by amending our articles of incorporation. We may effect such an amendment by resolutionof the board of directors without shareholder approval.
We must give public notice of a stock split, specifying the record date therefore, not less than two weeksprior to the record date.
Unit Share System
We have a unit share system, under which 100 shares of our common stock constitute one unit. Under theunit share system, shareholders have one voting right for each unit of shares held by them at a general meeting ofshareholders, and shares constituting a fractional unit carry no voting rights. Under our articles of incorporation,the holders of shares constituting a fractional unit do not have shareholder rights except for those specified in theCompanies Act or an ordinance of the Ministry of Justice, which include the rights (1) to receive dividends,(2) to receive cash or other assets in case of consolidation or split of shares, share exchange or share transfer, ormerger, or (3) to be allotted rights to subscribe for free new shares and stock acquisition rights when those rightsare granted to shareholders. We may cease to use the unit share system by amendment to the articles ofincorporation without shareholders’ approval even though amendments to the articles of incorporation generallyrequire a special resolution of the general meeting of shareholders.
A holder of shares of our common stock constituting less than one unit may at any time request us topurchase those shares. In addition, a holder of shares of our common stock constituting less than one unit may atany time request us to sell to it the number of shares necessary to raise its share ownership to a whole unit. Underthe clearing system operated by JASDEC, such request must be made through the financial institution where theshareholder has opened its account.
The price at which shares of our common stock constituting less than one unit will be purchased or sold byus pursuant to such request will be equal to either (a) the closing price of shares of our common stock reported bythe Tokyo Stock Exchange on the day when such request is received by our transfer agent, or (b) if no sale takesplace on the Tokyo Stock Exchange on that day, the price at which sale of such shares is executed on the TokyoStock Exchange immediately thereafter. Pursuant to our share handling regulations, an amount equal to theapplicable brokerage commission will be deducted from the price so determined.
Under the new clearing system, shares constituting less than one unit are transferable. Under the rules of theJapanese stock exchanges, however, shares constituting less than one unit do not comprise a trading unit, exceptin limited circumstances, and accordingly, may not be sold on the Japanese stock exchanges.
Liquidation Rights
In the event of our liquidation, the assets remaining after payment of all debts, liquidation expenses, taxesand required distribution payments to preferred shareholders, if any, will be distributed among shareholders ofcommon stock in proportion to the respective number of shares which they hold. For liquidation preference forresidual assets to the holders of preferred stock, see “—Preferred Stock—Liquidation Rights.”
Redemption Provisions and Sinking Fund Provisions
Our common stock has no redemption provisions or sinking fund provisions.
139

Liability to Further Calls or Assessments
Our shares of common stock outstanding, including shares represented by the ADSs, are fully paid andnonassessable.
Legal Restrictions on Acquisitions of Shares
The FIEA and its related regulations require any person who has become solely or jointly a beneficial holderof more than 5% of the total issued shares of capital stock of a company listed on any Japanese stock exchange,to file with the director of an appropriate local finance bureau of the Ministry of Finance within five businessdays a report concerning the shareholdings. With some exceptions, a similar report must also be filed in respectof any subsequent change of 1% or more in those holdings or any change in material matters set out in reportspreviously filed. For this purpose, shares issuable to a holder upon conversion of convertible securities orexercise of share subscription warrants or stock acquisition rights are taken into account in determining both thenumber of shares held by such holder and the issuer’s total issued share capital. Copies of each report must alsobe furnished to the company and to all the Japanese stock exchanges on which the shares are listed.
Under the Banking Act, a person who desires to hold 20% (in some exceptional cases, 15%) or more of thevoting rights of a bank is required to obtain advance approval of the FSA Commissioner. In addition, any personwho becomes a holder of more than 5% of the voting rights of a bank holding company or a bank must report theownership of the voting rights to the director of an appropriate local finance bureau within five business days.This requirement is separate from the significant shareholdings report required under the FIEA. See “Item 4.B.Business Overview—Regulations in Japan—Regulations for Stabilizing the Financial System—Examination andReporting Applicable to Shareholders of a Bank.”
Subscription Rights
Holders of shares of our common stock have no preemptive rights. Authorized but unissued shares ofcommon stock may be issued at the times, and upon the terms the board of directors determines, subject to thelimitations as to the issuance of new shares of common stock at a specially favorable price mentioned in“—Voting Rights” above. The board of directors may, however, determine that the holders of shares of commonstock be given subscription rights to new shares of common stock, in which case they must be given on uniformterms to all holders of shares of common stock at a record date of which not less than two weeks’ prior publicnotice must be given. Each of the shareholders to whom subscription rights is given must also be given at leasttwo weeks’ prior notice of the date on which the rights expire.
Stock Acquisition Rights
We may issue stock acquisition rights (shinkabu-yoyakuken). Holders of stock acquisition rights are entitledto acquire shares from us upon payment of the applicable exercise price and subject to other terms and conditionsthereof. We may also issue bonds with stock acquisition rights (shinkabu-yoyakuken-tsuki-shasai). The issuanceof stock acquisition rights and bonds with stock acquisition rights may be authorized by the board of directorsunless it is made under specially favorable conditions, as described in “—Voting Rights.”
Record Date
March 31 is the record date for the payment of year-end dividends and the determination of shareholdersentitled to vote at the annual general meeting of shareholders. September 30 is the record date for payment ofinterim dividends. In addition, by a resolution of the board of directors and after giving at least two weeks’ priorpublic notice, we may at any time set a record date in order to determine the shareholders who are entitled tocertain rights pertaining to the common stock.
140

Under the Book-Entry Transfer Act, we are required to give notice of each record date to JASDEC at leasttwo weeks prior to such record date. JASDEC is required to give us notice of the names and addresses of ourshareholders, the numbers of shares held by them, and other relevant information at a record date promptly afterwe set it.
Our Acquisition of Our Own Shares of Common Stock
We may acquire shares of our common stock (1) by way of purchase on any Japanese stock exchange onwhich shares of our common stock are listed, or by way of tender offer (in either case, pursuant to an ordinaryresolution of a general meeting of shareholders or a resolution of the board of directors), (2) from a specificshareholder other than any of our subsidiaries (pursuant to a special resolution of a general meeting ofshareholders), or (3) from any of our subsidiaries (pursuant to a resolution of the board of directors). In the caseof (2) above, any other shareholder may make a request to a director, at least five days prior to the relevantgeneral meeting of shareholders, to include the shareholder as a seller in the proposed purchase. However, thatright is not available if the purchase price or any other consideration to be received by the relevant specificshareholder does not exceed the then market price of the shares to be purchased from the shareholder.
The total amount of the purchase price of shares of common stock may not exceed the prescribeddistributable amount, as described in “—Common Stock—Restriction on Distributions of Surplus.”
We may hold the shares of common stock acquired, and may generally dispose of or cancel those shares byresolution of the board of directors.
Disposal of Shares of Our Common Stock Held by Shareholders Whose Location Is Unknown
We are not required to send notices to a shareholder if notices have failed to arrive for five consecutiveyears or more at his or her address in our register of shareholders unless we are notified of a new address. If theshareholder also fails to receive distributions of surplus on the shares for five or more consecutive years at his orher address in our register of shareholders or otherwise as specified, then we may in general dispose of thoseshares at their then-market price and hold or deposit the proceeds of that disposal on behalf of that shareholder.
Preferred Stock
The following is a summary of information concerning provisions of our articles of incorporation.
General
At the date of this annual report, under our articles of incorporation, we are authorized to issue167,000 shares of Type 5 preferred stock, 167,000 shares of Type 7 preferred stock, 115,000 shares of Type 8preferred stock and 115,000 shares of Type 9 preferred stock. In June 2013, our articles of incorporation wereamended to delete the provisions regarding Type 6 preferred stock, as these provisions have become unnecessary.
In March 2005, we issued 70,001 shares of our 1st series Type 6 preferred stock for an aggregate issue priceof ¥210 billion. The Type 6 preferred stock was allocated using a third-party allocation of shares at a price of¥3,000,000 per share, ¥1,500,000 of which was accounted for as stated capital. Sumitomo Life InsuranceCompany acquired 23,334 shares, Nippon Life Insurance Company acquired 20,000 shares, Mitsui LifeInsurance Company, Limited acquired 16,667 shares and Mitsui Sumitomo Insurance Company, Limitedacquired 10,000 shares. On April 1, 2011, we acquired and cancelled all of the outstanding 1st series Type 6preferred stock.
At the date of this annual report, we have no preferred stock outstanding. The following is a summary of therelevant provisions of our articles of incorporation regarding preferred stock.
141
Preferred Dividends
Our articles of incorporation provide that, if we pay dividends, we must pay cash dividends to holders ofshares of our preferred stock in preference to the holders of our common stock. If preferred interim dividendsstipulated in our articles of incorporation were paid during the relevant fiscal year, the amount of the preferredinterim dividends shall be subtracted from the amount of annual preferred dividends.
Our failure to declare annual preferred dividends in full in respect of any fiscal year on a series of preferredstock gives the holders of that preferred stock certain voting rights.
Liquidation Rights
In the event of our voluntary or involuntary liquidation, holders of our preferred stock will be entitled,equally in rank as among themselves and in preference over shares of our common stock, to receive out of ourresidual assets upon liquidation a distribution of ¥3,000,000 per share.
Preferred stockholders are not entitled to any further dividends or other participation or distribution of ourresidual assets upon our liquidation.
Voting Rights
Our articles of incorporation provide that holders of preferred stock are only entitled to receive notice of,and to vote at, a general meeting of shareholders;
• from the commencement of our annual general meeting of shareholders if an agenda for approval todeclare a preferred dividend is not submitted to the meeting; or
• from the close of our annual general meeting of shareholders if a proposed resolution to declare apreferred dividend is not approved at the meeting.
In both cases, these rights of our preferred stockholders lapse when a resolution of a general meeting ofshareholders declaring a preferred dividend is approved.
The Companies Act provides that a separate resolution of a meeting of the holders of the preferred stock isrequired in order to approve certain matters which would prejudice their interests, including;
• amendments to the articles of incorporation to add new classes of shares to be issued, alter the terms ofthe shares or increase the number of shares or authorized number of any class of shares, with certainexceptions;
• consolidations or splits of shares;
• dividends of shares or stock acquisition rights to shareholders without any consideration;
• grants of preemptive rights for new shares or stock acquisition rights;
• amalgamations or mergers;
• certain corporate splits;
• share exchanges;
• share transfers; and
• other matters set forth in the articles of incorporation.
Except for the amendments described above, the articles of incorporation may expressly permit certain ofthe above matters to be approved without a separate resolution. Our articles of incorporation do not include thatexpress permission.
142

Ranking
If issued, the outstanding shares of our preferred stock would rank pari passu with each other as toparticipation in our profits or assets, including dividends and distributions of residual assets upon our liquidation.
Unless holders of our preferred stock give approval, we may not create or issue any other shares ranking inpriority in terms of the right to receive distributions of surplus or the right to receive distributions of residualassets or otherwise in priority to the preferred stock already issued. However, without obtaining the consent ofholders of the preferred stock, we may issue other preferred stock ranking pari passu with the preferred stockalready issued as to the order of participation in our profits or assets, carrying rights to preferred dividends, orterms of conversion that our board of directors may determine, subject to limitations set forth in our articles ofincorporation and the Companies Act.
Purchase or Redemption of Preferred Stock
Subject to the requirements of the Companies Act, we may purchase out of our prescribed distributableamounts any shares of our preferred stock outstanding at any time and cancel that preferred stock. In June 2013,we amended our articles of incorporation in order to qualify our preferred stock for inclusion in our regulatorycapital in accordance with the new FSA capital adequacy guidelines based on the Basel III framework. Under theamended articles of incorporation, we will acquire our outstanding preferred stock without consideration or inexchange for common stock if we become non-viable.
Mandatory Redemption Provisions and Sinking Fund Provisions
Our articles of incorporation do not provide any mandatory redemption provisions and sinking fundprovisions.
Stock Splits
Our articles of incorporation provide that no stock split shall be made to the preferred stock unless otherwiseprovided for in any law or regulation.
Subscription Rights
Our articles of incorporation provide that we shall not grant holders of preferred stock any right to subscribefor new shares or stock acquisition rights.
Conditions to Change Shareholders’ Rights
Our articles of incorporation do not specify what actions or quorums are required to change the rights ofholders of our stock.
General Meeting of Shareholders
Our annual general meeting of shareholders is held within three months after the end of each fiscal year. Inaddition, we may hold an extraordinary general meeting of shareholders whenever necessary. Notice of a generalmeeting of shareholders stating the place, the time and the purpose thereof, and certain matters set forth in theCompanies Act and in ordinances of the Ministry of Justice, must be given to each holder of shares of commonstock with voting rights (or to the standing proxy or mailing address in Japan of a nonresident shareholder) atleast two weeks prior to the date set for the meeting. The record date for an annual general meeting ofshareholders is March 31 of each year.
Any shareholder or group of shareholders holding at least three percent of the total outstanding votingrights, for a continuous period of six months or longer, may require the convocation of a general meeting of
143

shareholders for a particular purpose. Unless such a general meeting of shareholders is convened promptly, or aconvocation notice of a meeting which is to be held not later than eight weeks from the day of such demand isdispatched, the requiring shareholders may, upon obtaining court approval, convene such general meeting ofshareholders.
Any shareholder holding at least 300 voting rights or one percent of our total number of voting rights for sixmonths or longer may propose a matter to be considered at a general meeting of shareholders by submitting awritten request to a director at least eight weeks prior to the date of the meeting. Any of the minimumpercentages, time periods and number of voting rights necessary for exercising the minority shareholder rightsdescribed above may be decreased or shortened if our articles of incorporation so provide. Our articles ofincorporation currently do not include any of those provisions.
To attend a general meeting of shareholders in person or by proxy, shareholders must provide proof ofidentity upon request. Shareholders may appoint a proxy by a written power of attorney for the meeting. Suchproxy must be one of our shareholders with voting rights.
Limitations on the Rights to Hold Our Common Stock by Foreign Investors
There are no specific limitations imposed by the laws of Japan, our articles of incorporation, or our otherconstituent documents, on the rights of nonresidents or foreign shareholders to hold or exercise voting rights onour shares of common stock or preferred stock. For additional information, See “Common Stock—VotingRights.”
Anti-Change in Control Provisions
There is no provision in our articles of incorporation that would have the effect of delaying, deferring orpreventing a change in control of us, and that would operate only with respect to a merger, consolidation,acquisition or corporate restructuring involving us.
Provisions Governing Changes in the Company’s Capital
We have no conditions more stringent than are required by law imposed by our articles of incorporationgoverning changes in capital.
10.C. MATERIAL CONTRACTS
All contracts that we are currently a party to, or were a party to during our two most recently completedfiscal years up to the date of this annual report, were entered into in the ordinary course of business or wereotherwise immaterial.
10.D. EXCHANGE CONTROLS
Japanese Foreign Exchange Regulations
The Foreign Exchange and Foreign Trade Act of Japan, and the cabinet orders and ministerial ordinances,collectively known as the Foreign Exchange Act, set forth, among other things, the regulations relating to thereceipt by nonresidents of Japan of payment with respect to our shares, and the acquisition and holding of ourshares by nonresidents of Japan and foreign investors, both as defined below.
Nonresidents of Japan are individuals who are not residents in Japan and corporations whose principaloffices are located outside Japan. Generally, branches and offices of nonresident corporations located in Japanare regarded as residents of Japan while the branches and offices of Japanese corporations located outside Japanare regarded as nonresidents of Japan.
144
“Foreign investors” are defined as:
• individuals not residing in Japan;
• corporations which are organized under the laws of foreign countries or whose principal offices arelocated outside Japan;
• corporations of which 50% or more of the voting rights are held, directly or indirectly, by individualsnot residing in Japan and/or corporations which are organized under the laws of foreign countries orwhose principal offices are located outside Japan; and
• corporations, a majority of officers (or a majority of officers having the power of representation) ofwhich are individuals not residing in Japan.
Acquisition of Shares
In general, a nonresident who acquires our shares from a resident of Japan is not subject to any prior filingrequirement, although the Foreign Exchange Act authorizes the Minister of Finance of Japan and the Ministersresponsible for the business to require a prior submission for any such acquisition in certain limitedcircumstances.
If a foreign investor acquires shares of our common stock, and, together with parties who have a specialrelationship with such foreign investor, holds 10% or more of the issued shares of our common stock as a resultof the acquisition, the foreign investor must file a report of the acquisition with the Minister of Finance and anyother competent minister by the fifteenth day of the month immediately following the month to which the date ofsuch acquisition belongs.
Except for the general limitation under Japanese antitrust and antimonopoly regulations againstshareholdings in the capital stock of a Japanese corporation, which lead or may lead to a restraint of trade ormonopoly, and general limitations under the Companies Act or our articles of incorporation on the rights ofshareholders applicable, regardless of residence or nationality, there is no limitation under Japanese law andregulations applicable to us, or under our articles of incorporation on the rights of nonresident or foreignshareholders to hold or exercise voting rights on our shares.
Dividends and Proceeds of Sale
Under the Foreign Exchange Act, dividends paid on, and the proceeds of sales in Japan of, shares held bynonresidents of Japan, may, in general, be converted into any foreign currency and repatriated abroad. Theacquisition of our shares by nonresidents by way of a stock split is not, in general, subject to any notification orreporting requirements.
10.E. TAXATION
Japanese Taxation
The following is a summary of the principal Japanese national tax consequences to owners of shares of ourcommon stock or ADSs representing shares of our common stock who are Nonresident Shareholders. Thestatements regarding Japanese tax laws set forth below are based on the laws and treaties currently in force andas interpreted by the Japanese tax authorities at the date of this annual report and are subject to changes in theapplicable Japanese law or tax treaties, conventions or agreements, or in the interpretation thereof, occurring afterthat date. This summary does not include all possible tax considerations which may apply to a particular investorand potential investors are advised to satisfy themselves as to the overall tax consequences of the acquisition,ownership and disposition of shares of our common stock or ADSs, including specifically the tax consequencesunder Japanese law, the laws of the jurisdiction of which they are resident, and any tax treaty, convention oragreement between Japan and their country of residence, by consulting their own tax advisors.
145

For the purpose of Japanese taxation, a Nonresident Shareholder of ADSs will generally be treated as theowner of the shares underlying the ADSs, which may be evidenced by one or more American DepositaryReceipts (“ADRs”).
Generally, a Nonresident Shareholder of shares of our common stock or ADSs will be subject to Japaneseincome tax collected by way of withholding on dividends we pay. Stock splits are, in general, not subject toJapanese income tax or corporation tax.
In the absence of any applicable tax treaty, convention or agreement reducing the maximum rate of Japanesewithholding tax or allowing exemption from Japanese withholding tax, the rate of Japanese withholding taxapplicable to dividends paid by a Japanese corporation to Nonresident Shareholders is generally 20.42%.However, with respect to dividends paid on listed shares issued by a Japanese corporation (including shares ofour common stock or ADSs) to Nonresident Shareholders, except for any individual shareholder who owns3% or more of the total number of shares issued by the relevant Japanese corporation, the aforementioned20.42% withholding tax rate is reduced to 15.315% for dividends due and payable on or before December 31,2037. Due to the imposition of a special additional withholding tax (2.1% of the original withholding taxamount) to secure funds for reconstruction from the Great East Japan Earthquake, the original withholding taxrate of 15% and 20%, as applicable, has been effectively increased, respectively, to 15.315% and 20.42%, duringthe period beginning on January 1, 2013 and ending on December 31, 2037.
At the date of this annual report, Japan has income tax treaties in force, whereby the above-mentionedwithholding tax rate is reduced, generally, to 15% for portfolio investors, with, among others, Belgium, Canada,Denmark, Finland, Germany, Ireland, Italy, Luxembourg, New Zealand, Norway, Singapore and Spain, while theincome tax treaties with, among others, Australia, France, Hong Kong, the Netherlands, Portugal, Sweden,Switzerland, the United Kingdom and the United States generally reduce the withholding tax rate to 10% forportfolio investors. In addition, under the income tax treaty between Japan and the United States, dividends paidto pension funds which are qualified U.S. residents eligible to enjoy treaty benefits are exempt from Japaneseincome taxation by way of withholding or otherwise unless the dividends are derived from the carrying on of abusiness, directly or indirectly, by those pension funds. Under the income tax treaties with the Netherlands,Switzerland and the United Kingdom, similar treatment will be applied to dividends. Under Japanese tax law, anyreduced maximum rate applicable under a tax treaty will be available when the maximum rate is below the rateotherwise applicable under Japanese tax law referred to in the preceding paragraph with respect to the dividendsto be paid by us on shares of common stock or ADSs. A Nonresident Shareholder of shares of our common stockwho is entitled, under any tax treaty, to a reduced rate of Japanese withholding tax, or exemption therefrom, asthe case may be, is required to submit an Application Form for Income Tax Convention Regarding Relief fromJapanese Income Tax and Special Income Tax for Reconstruction on Dividends (together with any other requiredforms and documents) in advance, through the withholding agent, to the relevant tax authority before payment ofdividends. A standing proxy for a Nonresident Shareholder may provide the application services. See “Item 10.B.Memorandum and Articles of Incorporation—Common Stock—General.” In addition, a simplified special filingprocedure is available for Nonresident Shareholders to claim treaty benefits of exemption from or reduction ofJapanese withholding tax by submitting a Special Application Form for Income Tax Convention RegardingRelief from Japanese Income Tax and Special Income Tax for Reconstruction on Dividends of Listed Stocks(together with any other required forms and documents). With respect to ADSs, this reduced rate or exemptionwill be applicable to Nonresident Shareholders of ADSs if the Depositary or its agent submits two ApplicationForms (one before payment of dividends and the other within eight months after the record date concerning suchpayment of dividends), together with certain other documents. To claim this reduced rate or exemption,Nonresident Shareholders of ADSs will be required to file a proof of taxpayer status, residence and beneficialownership, as applicable, and to provide other information or documents as may be required by the Depositary.A Nonresident Shareholder who is entitled, under any applicable tax treaty, to a reduced rate of Japanesewithholding tax below the rate otherwise applicable under Japanese tax law mentioned above, or exemptiontherefrom, as the case may be, but fails to submit the required application in advance may nevertheless beentitled to claim a refund from the relevant Japanese tax authority of withholding taxes withheld in excess of the
146

rate under an applicable tax treaty (if the Nonresident Shareholder is entitled to a reduced treaty rate under theapplicable tax treaty) or the full amount of tax withheld (if the Nonresident Shareholder is entitled to anexemption under the applicable tax treaty), as the case may be, by complying with certain subsequent filingprocedures. We do not assume any responsibility to ensure withholding at the reduced treaty rate, or exemptiontherefrom, for shareholders who would be so eligible under an applicable tax treaty but where the requiredprocedures as stated above are not followed.
Gains derived from the sale outside Japan of shares of our common stock or ADSs by a NonresidentShareholder who is a portfolio investor are, in general, not subject to Japanese income tax or corporation tax.
Any deposits or withdrawals of shares of our common stock by a Nonresident Shareholder in exchange forADSs are, in general, not subject to Japanese income or corporation tax.
Japanese inheritance and gift taxes at progressive rates may be payable by an individual who has acquiredshares of our common stock or ADSs from another individual as a legatee, heir or donee, even if the individual isnot a Japanese resident.
Potential investors should consult with their own tax advisors regarding the Japanese tax consequences ofthe ownership and disposition of shares of common stock or ADSs in light of their particular situations.
United States Federal Income Taxation
The following is a discussion of material U.S. federal income tax consequences to the U.S. Holdersdescribed below of owning and disposing of shares or ADSs, but it does not purport to be a comprehensivedescription of all the tax considerations that may be relevant to a particular person’s decision to hold the sharesor ADSs. This discussion does not address U.S. state, local or non-U.S. tax consequences. As used herein, a U.S.Holder is a beneficial owner of shares or ADSs that is, for U.S. federal income tax purposes: (1) a citizen orindividual resident of the United States; (2) a corporation, or other entity taxable as a corporation, created ororganized in or under the laws of the United States or any political subdivision thereof; or (3) an estate or trustthe income of which is subject to U.S. federal income taxation regardless of its source.
The discussion applies only to U.S. Holders who hold the shares or ADSs as capital assets for U.S. federalincome tax purposes. The discussion does not address any alternative minimum or Medicare contribution taxconsequences, nor does it address all of the tax consequences which may be applicable to special classes ofholders, such as:
• certain financial institutions;
• insurance companies;
• dealers and certain traders in securities;
• persons holding shares or ADSs as part of a hedge, straddle, conversion or other integrated transaction;
• persons whose functional currency for U.S. federal income tax purposes is not the U.S. dollar;
• regulated investment companies;
• real estate investment trusts;
• partnerships or other entities classified as partnerships for U.S. federal income tax purposes;
• persons liable for the alternative minimum tax;
• tax-exempt entities, including “individual retirement accounts” or “Roth IRAs”;
• persons who acquired our shares or ADSs pursuant to the exercise of an employee stock option orotherwise as compensation;
147

• persons holding shares or ADSs that own or are deemed to own 10% or more of our voting stock; or
• persons holding shares or ADSs in connection with a trade or business conducted outside the UnitedStates.
If a partnership holds shares or ADSs, the tax treatment of a partner will generally depend upon the status ofthe partner and the activities of the partnership. Partnerships holding shares or ADSs, and partners in suchpartnerships, should consult their own tax advisors.
This discussion is based on the Internal Revenue Code of 1986, as amended, administrative pronouncements,judicial decisions and final, temporary and proposed United States Treasury regulations, as well as the doubletaxation treaty between Japan and the United States (“Treaty”) all as of the date hereof. These laws are subject tochange, possibly on a retroactive basis. It is also based in part on representations by the Depositary and assumes thateach obligation under the Deposit Agreement and any related agreement or undertaking will be performed inaccordance with its terms.
In general, a U.S. Holder who owns ADSs will be treated as the owner of the underlying shares representedby those ADSs for U.S. federal income tax purposes. Accordingly, no gain or loss will be recognized if aU.S. Holder exchanges ADSs for the underlying shares represented by those ADSs.
The U.S. Treasury has expressed concern that parties to whom ADSs are released before shares aredelivered to the depositary, or intermediaries in the chain of ownership between holders and the issuer of thesecurity underlying the ADSs, may be taking actions that are inconsistent with the claiming of foreign tax creditsby holders of ADSs. These actions would also be inconsistent with the claiming of the reduced rate of tax,described below, applicable to dividends received by certain noncorporate holders. Accordingly, the creditabilityof Japanese taxes, and the availability of the reduced tax rate for dividends received by certain noncorporateU.S. Holders, each described below, could be affected by actions taken by such parties or intermediaries.
U.S. Holders should consult their own tax advisors concerning the U.S. federal, state, local and non-U.S. taxconsequences of owning and disposing of shares or ADSs in their particular circumstances.
This discussion assumes that we are not, and will not become, a passive foreign investment company(a “PFIC”), as described below.
Taxation of Distributions
Distributions received by a U.S. Holder on shares or ADSs, including the amount of any Japanese taxeswithheld, other than certain pro rata distributions of shares, will constitute foreign-source dividend income to theextent paid out of our current or accumulated earnings and profits (as determined under U.S. federal income taxprinciples). Because we do not maintain calculations of our earnings and profits under U.S. federal income taxprinciples, we expect that distributions generally will be reported to a U.S. Holder as dividends. The amount ofthe dividend a U.S. Holder will be required to include in income will equal the U.S. dollar value of the yendividend, calculated by reference to the exchange rate in effect on the date the payment is received by the holder,or in the case of ADSs, by the Depositary, regardless of whether the payment is converted into U.S. dollars onthe date of receipt. If the dividend is converted into U.S. dollars on the date of receipt, the U.S. Holder generallyshould not be required to recognize foreign currency gain or loss in respect of the dividend payment. AU.S. Holder may have foreign currency gain or loss if the dividend is converted into U.S. dollars after the date ofreceipt. Any foreign currency gain or loss realized by a U.S. Holder on a sale or other disposition of yen will beU.S.-source ordinary income or loss. Corporate U.S. Holders will not be entitled to claim a dividends-receiveddeduction with respect to our dividends. Subject to applicable limitations, and the discussion above regardingconcerns expressed by the U.S. Treasury, dividends received from us by certain noncorporate U.S. Holders maybe taxable at favorable rates. Noncorporate U.S. Holders should consult their own tax advisors to determinewhether they are subject to any special rules that limit their ability to be taxed at these favorable rates.
148
Subject to applicable restrictions and limitations that vary depending upon the U.S. Holder’s circumstancesand the discussion above regarding concerns expressed by the U.S. Treasury, Japanese taxes withheld fromdividends on shares or ADSs (at a rate not exceeding the applicable rate provided by the Treaty, in the case of aU.S. Holder who is eligible for the Treaty’s benefits) will be creditable against the U.S. Holder’s U.S. federalincome tax liability. Instead of claiming a credit, a U.S. Holder may elect to deduct such Japanese taxes incomputing its taxable income, subject to generally applicable limitations. The limitation on foreign taxes eligiblefor credit is calculated separately with respect to two categories of income, passive income and general income.The rules governing foreign tax credits are complex. U.S. Holders should consult their own tax advisorsregarding the availability of foreign tax credits and deductions in their particular circumstances.
Sale and Other Disposition of the Shares or ADSs
A U.S. Holder will generally recognize capital gain or loss on the sale or other disposition of shares orADSs, which will be long-term capital gain or loss if the U.S. Holder has held the shares or ADSs for more thanone year. The amount of the U.S. Holder’s gain or loss will equal the difference between the amount realized onthe sale or other disposition and the U.S. Holder’s tax basis in the shares or ADSs, each as determined inU.S. dollars. The deductibility of capital losses is subject to limitations. Any gain or loss will generally beU.S.-source gain or loss for foreign tax credit purposes.
PFIC Rules
Based upon certain proposed Treasury regulations that are not yet in effect, but are generally proposed tobecome effective for taxable years beginning after December 31, 1994, we believe that we were not a PFIC forU.S. federal income tax purposes for our taxable year ended March 31, 2015. However, since PFIC statusdepends upon the composition of our income and assets and the market value of our assets from time to time,there can be no assurance that we will not be a PFIC for any taxable year. If we were a PFIC for any taxable yearduring which a U.S. Holder held shares, certain adverse U.S. federal income tax consequences could apply to theU.S. Holder.
Information Reporting and Backup Withholding
Payments of dividends and sales proceeds that are made within the United States or through certainU.S.-related financial intermediaries may be subject to information reporting and backup withholding unless theU.S. Holder is an exempt recipient or, in the case of backup withholding, the U.S. Holder provides a correcttaxpayer identification number and certifies that no loss of exemption from backup withholding has occurred.The amount of any backup withholding from a payment to a U.S. Holder will be allowed as a credit against theU.S. Holder’s U.S. federal income tax liability and may entitle the U.S. Holder to a refund, provided that therequired information is timely furnished to the Internal Revenue Service.
Certain U.S. Holders who are individuals may be required to report information relating to their ownershipof an interest in certain foreign financial assets, including stock of a non-U.S. person, generally on Form 8938,subject to exceptions (including an exception for stock held through a U.S. financial institution). CertainU.S. Holders that are entities may be subject to similar rules in the future. U.S. Holders should consult their taxadvisors regarding their reporting obligations with respect to the shares or ADSs.
10.F. DIVIDENDS AND PAYING AGENTS
Not applicable.
10.G. STATEMENT BY EXPERTS
Not applicable.
149

10.H. DOCUMENTS ON DISPLAY
We are subject to the reporting requirements of the Securities Exchange Act of 1934. In accordance withthese requirements, we file annual reports on Form 20-F and furnish periodic reports on Form 6-K with the SEC.
These materials, including this annual report and the exhibits thereto, may be inspected and copied at theCommission’s Public Reference Room at Room 1580, 100 F Street, N.E., Washington, D.C. 20549. The publicmay obtain information on the operation of the Commission’s Public Reference Room by calling theCommission in the United States at 1-800-SEC-0330. The Commission also maintains a website athttp://www.sec.gov that contains reports and proxy information regarding issuers that file electronically with theCommission. Some of the information may also be found on our website at http://www.smfg.co.jp.
10.I. SUBSIDIARY INFORMATION
Not applicable.
Item 11. Quantitative and Qualitative Disclosures about Credit, Market and Other Risk
Quantitative and Qualitative Information about Risk Management
Basic Approach
As risks in the financial services industry increase in diversity and complexity, risk management(identifying, measuring, and controlling risk) has never been more important in the management of a financialinstitution. We have established a basic approach to be employed in risk management and include these in themanual entitled Regulations on Integrated Risk Management. The fundamental principles are as follows:
• Risk management on a Group-wide basis. Various risks taken at the Group companies are managed ona consolidated basis according to the nature of their business and significance in conformity with therelevant laws and regulations.
• Risk management based on quantification. The risks are quantitatively managed according to therelevant risk characteristics after specifying the scope of quantification.
• Ensuring consistency with the business strategy. Risk management is consistent with the businessstrategy.
• System for check and balance. The risk management framework is developed to ensure effective checkand balance function for business operations.
• Measures for emergencies and critical situations. Necessary measures are developed by assumingsituations and scenarios as to materialization of risk which would have a significant impact on thebusiness and financial management of the Group.
• Verification of the actual situation. The actual risk management process is verified by the InternalAudit Unit.
Types of Risk to Be Managed
We classify risk into the following categories:
Credit Risk. Credit risk is the possibility of a loss arising from a credit event, such as deterioration in thefinancial condition of a borrower, that causes an asset (including off-balance sheet transactions) to lose value orbecome worthless.
Market Risk. Market risk is the possibility that fluctuations in interest rates, foreign exchange rates or stockprices will change the market value of financial products, leading to a loss.
150

Liquidity Risk. Liquidity risk is the risk that there may be difficulties in raising funds needed for settlements,as a result of the mismatching of uses of funds and sources of funds or unexpected outflows of funds, which maymake it necessary to raise funds at higher rates than normal.
Operational Risk (including Processing Risk and System Risk). Operational risk is the possibility of lossesarising from inadequate or failed internal processes, people, and systems or from external events.
Processing Risk. Processing risk is the possibility of losses arising from negligent processing by employees,accidents or unauthorized activities.
System Risk. System risk is the possibility of losses arising from failure, malfunction, or unauthorized use ofcomputer systems.
Risk Management System
The Group-wide basic policies for risk management are determined by the Management Committee, whichconsists of designated board members, and they are authorized by the board of directors.
The policies also include fundamental principles for each risk category, which each Group company has tofollow when establishing its own risk management system. The Corporate Risk Management Department, incooperation with the Corporate Planning Department, performs risk management according to the above policies.In addition, the Internal Audit Department is responsible for the independent review of risk management withinthe Group.
Risk management systems are in place at individual Group companies and they have been established inaccordance with the Group-wide basic policies for risk management and implementation guidance provided byus. Based on these policies and guidance, each Group company implements guidelines and establishes processesfor risk management. On an ongoing basis, these processes and risks are monitored by us.
For example, at the Bank, specific departments have been appointed to oversee the handling of the four riskcategories listed above, in addition to the risks associated with settlement. Each risk category is managed takinginto account the particular characteristics of that category. In addition, the Risk Management Unit has beenestablished—independent of the business units—and the risk management system has been strengthened byconsolidating the functions for managing risks—credit, market, liquidity, operational and settlement—into theRisk Management Unit and enhancing our across-the-board risk monitoring ability. One board member isassigned to oversee the Risk Management Unit comprising the Corporate Risk Management Department and theCredit & Investment Planning Department. The Corporate Risk Management Department—the unit’s planningdepartment—seeks to manage all categories of risk in cooperation with the Corporate Planning Department.Moreover the Internal Audit Unit—independent of all business units—conducts periodic audits to ensure that themanagement system is functioning properly.
The decision-making process for addressing the risks at the operating level is also strengthened by theCredit Risk Management Committee and the Market Risk Management Committee, which are subcommittees ofthe Management Committee of the Bank.
Integrated Risk Management
Risk Capital-Based Management
In order to maintain a balance between risk and return, we employ a risk capital-based management method.We measure “risk capital” based on value at risk (“VaR”), and other specific measures such as uniform basicmeasures of credit, market and operational risks, taking into account the special characteristics of each type ofrisk and the business activities of each Group company.
151

We then allocate risk capital to each unit to keep the total exposure to various risks within the scope of ourresources, i.e., capital. The allocation to each unit is determined by the Management Committee and authorizedby the board of directors. In this framework, risk capital includes credit concentration risk and interest rate risk inthe banking book, which are taken into account under Pillar 2 of the Basel Capital Accord. In addition, weconduct risk capital-based management activities on a consolidated basis, including each Group company.
Liquidity risk is managed within the context of cash-flow plans and funding gap. Other risk categories aremanaged with procedures closely attuned to the nature of the risk, as described in the following paragraphs.
Disclosures of the objectives, policies and processes to manage each risk and the methods used to measureeach risk have been included in “Credit Risk,” “Market Risk and Liquidity Risk,” “Operational Risk, ProcessingRisk and System Risk” and “Other Risk.”
Stress Tests
In the current volatile business environment, stress tests are essential to analyze and estimate the effects ofstress events brought about by the economic recession and market turbulence. When establishing our medium-term management plan or annual business plan, we conduct stress testing to appraise the likely financial impacton the Group, so that we can prepare actions in advance to deal with emerging stress events as they occur.
Stress testing consists of four processes: scenario design, scenario setting, estimation of the impact onfinancial items, and reporting to the Management Committee and Board of Directors. In the scenario designprocess, we create some scenarios such as a global economic slowdown or a sharp increase in Japanesegovernment bond rates based on the economic environment and global trends at the time, including those onmacroeconomic indicators such as Japanese GDP, stock prices, interest rates and foreign exchange rates, viadiscussions of the future trends in the global situation with related departments. In the scenario setting process,the Risk Management Unit and the business units of the Bank discuss the scenarios and the scenarios may berevised as necessary. In the estimation of the impact on financial items process, we estimate the financial impactunder the scenarios and analyze their impact on financial items such as the common equity Tier 1 ratios. Afterthese three processes, the scenarios and impact on financial items are reported to the Management Committeeand Board of Directors.
Furthermore, the Bank has in place a system enabling flexible control of operations at a time of suddenchanges in its business environment. The Risk Management Unit and other relevant business units regularly holdjoint meetings in order to share understanding of macro-environment, assume hypothetical stress events thatmight affect our business operation, and consider appropriate responses to those stress events.
Risk Appetite Framework
To ensure an appropriate risk-return balance, and to avoid enormous unforeseen losses, we have in place arisk appetite framework. Specifically, we define risk appetite as the types and levels of risk we are willing toundertake or prepared to tolerate in order to drive earnings growth and incorporate it into our business operations.
Furthermore, to quantitatively grasp the risk appetite, we set risk appetite indicators from each category:financial soundness, profitability, liquidity and others. The target levels and limits of risk appetite indicators aredecided by the Management Committee and the Board of Directors at the beginning of each fiscal year andmonitored during the period.
Implementation of Basel Regulation
Basel III is an international agreement on minimum capital, leverage, liquidity and other requirementsapplicable to internationally active banks. The Basel III capital framework was implemented in Japan fromMarch 31, 2013 pursuant to revised capital adequacy guidelines adopted by the FSA, subject to the phase-in ofsome requirements, as contemplated by Basel III.
152

The framework of Basel III is a continuation of Basel II, with multiple approaches to calculating capitalrequirements; we adopted the advanced IRB approach for credit risk from March 31, 2009, and the AMA foroperational risk from March 31, 2008.
Details of relevant initiatives are provided below, and detailed information on our capital ratio is provided inthe discussion on Capital Ratio Information in “Item 4.B. Business Overview—Regulations in Japan—RegulationsRegarding Capital Adequacy and Liquidity” and “Item 5.B. Liquidity and Capital Resources—CapitalManagement.”
Credit Risk
Credit risk is the risk of incurring losses from decline or loss of the value of an asset (including off-balancesheet items) that is caused by a credit event including but not limited to the deterioration of financial condition ofa borrower. Overseas credits transactions also entail country risk, which is closely related to credit risk. Countryrisk is the risk of incurring losses caused by changes in political or economic conditions. Credit exposures ariseprimarily from lending activities such as loans and advances, acquiring investment securities, derivativetransactions, and off-balance sheet transactions such as unused portion of loan commitments.
Credit Risk Management System
Credit risk is the most significant risk to which we are exposed. The purpose of credit risk management is tokeep the credit risk exposure to a permissible level relative to capital, to maintain the quality of assets and toensure returns commensurate with risk.
On the basis of Group-wide basic policies for risk management, our Group companies follow thefundamental principles established by us to assess and manage credit risk. Each of our Group companiesmanages credit risk according to the nature of its business, and assesses and manages the credit risks ofindividual loans and credit portfolios quantitatively, using consistent standards.
At the Bank, our significant banking subsidiary, the Credit & Investment Planning Department within theRisk Management Unit is responsible for the comprehensive management of credit risk. This department draftsand administers credit policies, the internal rating system, credit authority guidelines, and credit applicationguidelines, and manages NPLs, including impaired loans, and other aspects of credit portfolio management. Thedepartment also cooperates with the Corporate Risk Management Department in quantifying credit risk (riskcapital and risk-weighted assets) and controls the Bank’s entire credit risk. Further, the Credit PortfolioManagement Department within the Credit & Investment Planning Department strives to stabilize the creditportfolio and manage the risk through credit derivatives, loan asset sales and other instruments.
The credit departments within each business unit conduct credit risk management for loans handled by theirunits and manage their units’ portfolios. The credit limits they use are based on the baseline amounts that theCredit & Investment Planning Department establishes for each grading category, with particular attention paid toevaluating and managing customers or loans perceived to have particularly high credit risk. The CorporateResearch Department engages in research on industries and analyzes the business and financial conditions ofborrower enterprises to detect early signs of problems or growth potential.
The Credit Administration Department is responsible for handling NPLs of borrowers classified aspotentially bankrupt or lower, and formulates plans for workouts, including write-offs, and corporaterehabilitation. The department closely liaises with SMBC Servicer Co., Ltd., our Group company, which engagesin related services to efficiently reduce the amount of NPLs, including through the sale of loans.
The Internal Audit Unit, operating independently of the business units, audits asset quality, accuracy ofgrading and state of credit risk management, and reports the results directly to the board of directors and theManagement Committee.
153

The Bank has established the Credit Risk Committee to undertake control of credit risk and to ensure theoverall soundness of the loan operations.
Credit Risk Management Methods
To effectively manage the risk involved in individual loans as well as its credit portfolio as a whole, theBank first acknowledges that every loan entails credit risk, assesses the credit risk posed by each borrower andloan using an internal rating system, and quantifies that risk for control purposes.
Credit Risk Evaluation
The Credit & Investment Planning Department manages an internal rating system for each asset controlcategory set according to portfolio characteristics. For example, credits to commercial and industrial (“C&I”)companies, individuals for business purposes (domestic only), sovereigns, public sector entities, and financialinstitutions are assigned an “obligor grade,” which indicates the borrower’s creditworthiness, and/or “facilitygrade,” which indicates the collectability of assets taking into account the transaction conditions such asguarantee/collateral, and tenor. The business units determine an obligor grade by first assigning a financial gradeusing a financial strength grading model and data obtained from the obligor’s financial statements, including networth and cash flows. The financial grade is then adjusted taking into account the actual state of the obligor’sfinancial position and qualitative factors to derive the obligor grade. The qualitative factors mainly include theexpected future cash flows taking into account factors such as historical loss information, the appropriateness ofthe borrower’s business plan or operational improvement plan, the status of progress of its plan, and the overallsupport from financial institutions. In the event that the borrower is domiciled overseas, internal ratings for creditare made after taking into consideration the country rank, which represents an assessment of the credit quality ofeach country based on its political and economic situation, as well as its current account balance and externaldebt. Obligor grades and facility grades are reviewed once a year and as otherwise necessary, such as when thereare changes in the credit situation. Our subsidiaries carry out credit risk evaluations in line with the Bank.
There are also grading systems for loans to individuals such as housing loans and structured financeincluding project finance, where the repayment source is limited to the cash flows generated by a particularbusiness or asset. For example, the obligor grade of housing loans is determined taking into account variousrelevant factors such as proportion of the repayment to revenue, proportion of down payment to the value andpast due information.
The Credit & Investment Planning Department centrally manages the internal rating systems, and designs,operates, supervises and validates the grading models. It validates the grading models (including statisticalvalidation) of main assets following the procedure manual once a year to ensure their effectiveness andsuitability.
Quantification of Credit Risk
Credit risk quantification refers to the process of estimating the degree of credit risk of a portfolio orindividual loan taking into account not just the obligor’s PD, but also the concentration of risk in a specificcustomer or industry and the loss impact of fluctuations in the value of collateral, such as real estate andsecurities.
Specifically, the PD by grade, loss given default (“LGD”), credit quality correlation among obligors, andother parameter values are estimated using the historical data of obligors and facilities stored in a database tocalculate the credit risk. Then, based on these parameters, the Bank runs a simulation of simultaneous defaultusing the Monte Carlo Simulation to calculate the Bank’s maximum loss exposure to the estimated amount of themaximum losses/expected shortfall that may be incurred. Based on these quantitative results, the Bank allocatesrisk capital.
154
Risk quantification is also executed for purposes such as to determine the portfolio’s risk concentration or tosimulate economic movements (stress tests), and the results are used for making optimal decisions across thewhole range of business operations, including formulating business plans and providing a standard against whichindividual credit applications are assessed.
Credit Assessment
At the Bank, the credit assessment of corporate loans involves a variety of financial analyses, including cashflows, to predict an enterprise’s capability of loan repayment and its growth prospects. These quantitativemeasures, when combined with qualitative analyses of industrial trends, the enterprise’s research anddevelopment capabilities, the competitiveness of its products or services, and its management caliber, result in acomprehensive credit assessment. The loan application is analyzed in terms of the intended utilization of thefunds and the repayment schedule. In the assessment of housing loans for individuals, the Bank employs a creditassessment model based on credit data amassed and analyzed by the Bank over many years, taking into accountvarious relevant factors including proportion of the repayment to revenue, proportion of down payment to thevalue and past due information.
Credit Monitoring
At the Bank, in addition to analyzing loans at the application stage, the Credit Monitoring System is utilizedto reassess obligor grades, and review credit policies for each obligor so that problems can be detected at an earlystage, and quick and effective action can be taken. The system includes annual monitoring that is carried out eachtime the financial results of the obligor enterprise are obtained, as well as ad-hoc monitoring that is performedeach time credit conditions change.
Credit Portfolio Management
Risk-Taking Within the Scope of Capital
To keep the credit risk exposure to a permissible level relative to capital, the Bank’s Corporate RiskManagement Department sets a credit risk capital limit for internal control purposes. Under this limit, sub-limitsare set for each business unit. The Corporate Risk Management Department conducts monthly monitoring tomake sure that these limits are being followed.
Controlling Concentration Risk
Once the credit concentration risk is realized, the equity capital of the Bank may be materially impaired.The Bank’s Credit & Investment Planning Department therefore takes measures to manage concentration risks,such as introducing large exposure limits and conducting intensive loan reviews for obligors with largeexposures, with an increased focus on industrial sectors with an excessive concentration of credit risk. Further, tomanage country risk, the Credit Management Department of the International Banking Unit has credit limitguidelines based on each country’s creditworthiness.
Toward Active Portfolio Management
The Bank’s Credit Portfolio Management Department makes use of credit derivatives, loan asset sales, andother instruments to proactively and flexibly manage its portfolio to stabilize credit risk.
Market Risk and Liquidity Risk
Market risk is the possibility that fluctuations in interest rates, foreign exchange rates, stock prices or othermarket prices will change the market value of financial products, leading to a loss. The purpose of market riskmanagement is to keep the market risk exposure to a permissible level relative to capital.
155

Liquidity risk is defined as the uncertainty around our ability to meet our debt obligations without incurringunacceptably large losses. An example of such risk is the possible inability to meet our current and future cashflow/collateral needs, both expected and unexpected. In such cases, we may be required to raise funds at less thanfavorable rates or be unable to raise sufficient funds for settlement. The purpose of liquidity risk management isto ensure that we are in a position to address its liquidity obligations through monitoring the liquidity gapbetween assets and liabilities, and maintaining highly liquid supplementary funding resources.
On the basis of the Group-wide basic policies for risk management, we have a quantitative managementprocess to control market and liquidity risks on a Group-wide basis by setting allowable risk limits by company.We at least annually review and identify which companies primarily carry the market and liquidity risks withinthe Group. We set permissible levels and upper limits of risk for each identified company in consideration ofthose companies’ business plans. We ensure that each identified company establishes a risk management systemthat is appropriate to the risks it faces, and has built-in transparent risk management processes, clearly separatingfront office, middle office and back office operations, and establishing a control system of mutual checks andbalances.
Framework for Market and Liquidity Risk Management
The board of directors authorizes important matters relating to the management of market and liquidityrisks, such as the basic policies and risk limits, which are decided by the Management Committee.
Additionally, at the Bank, the Corporate Risk Management Department manages market and liquidity risksin an integrated manner. The Corporate Risk Management Department is the planning department of the RiskManagement Unit, which is independent of the business units that directly handle market transactions, and notonly monitors the current risk situations but also reports regularly to the Management Committee and the boardof directors. Furthermore, the Bank’s Asset Liability Management (“ALM”) Committee meets on a monthlybasis to examine reports on the state of observance of the Bank’s limits on market and liquidity risks and toreview and discuss the Bank’s ALM operations.
To prevent unforeseen processing errors as well as fraudulent transactions, it is important to establish asystem of checks on the business units (front office). At the Bank, both the processing departments (back office)and the administrative departments (middle office) conduct the checks. In addition, the Internal Audit Unit of theBank periodically performs internal audits to verify that the risk management framework is functioning properly.
Market Risk Management Methods
Market Risk Management Process
We manage market risk from trading activities and non-trading activities, including strategic equityinvestment and other transactions within the risk capital limit, which is determined taking into account ourshareholders’ equity and other principal indicators of our financial position. We also establish an upper limit onVaR and losses within the risk capital limits.
Our market risk can be divided into various factors: interest rates, foreign exchange rates, equity prices andoption risks. We manage each of these risks employing the VaR method as well as supplemental indicatorssuitable for managing each risk, such as the basis point value (“BPV”).
VaR is the largest predicted loss that is possible given a fixed confidence interval. For example, our VaRindicates the largest loss that is possible for a holding period of one day and a confidence interval of 99.0%. BPVis the amount of change in assessed value as a result of a one-basis-point (0.01%) movement in interest rates.
156

Market Risk Measurement Techniques—Value at Risk
The principal Group companies’ internal VaR model makes use of historical data to prepare scenarios formarket fluctuations and, by conducting simulations of gains and losses on a net position basis, the modelestimates the maximum losses that may occur. The VaR calculation method we employ for both trading and non-trading activities is based mainly on the following:
• the historical simulation method;
• a one-sided confidence interval of 99.0%;
• a one-day holding period (a one-year holding period for the strategic equity investment portfolio); and
• an observation period of four years (ten years for the strategic equity investment portfolio).
The relationship between the VaR calculated with the model and the actual profit and loss data is back-tested periodically. The back-testing results for the Group’s trading accounts during the fiscal year endedMarch 31, 2015 are shown below. A data point below the diagonal line indicates a loss in excess of the predictedVaR for that day; however, there were no significant excess losses as with the previous year. This demonstratesthat the Group’s VaR model, with a one-sided confidence interval of 99.0%, is sufficiently reliable.
Back-Testing Results (Trading Book—SMFG consolidated)
Marginal Profit or Loss (in ¥100 million)
VaR (in ¥100 million)
Trading Activities
Most of our trading activity is undertaken to accommodate the needs of commercial banking customers forinterest rate and foreign exchange transactions. However, some interest rate and foreign exchange rate positionsare taken using derivatives and other on-balance sheet instruments with the objective of earning a profit fromfavorable movements in market rates. The overall objective of managing market risk is to avoid unexpectedlosses due to changes in market prices.
Non-trading Activities
The market risk for non-trading activity arises principally from the interest rate risk of our ALM operations,or banking, including loans, debt investment securities, deposits, and long- and short-term borrowings, and from
157

the equity risk of our strategic investments. ALM operations are regularly reviewed and discussed by the ALMCommittee so as not to be heavily exposed to market fluctuations. Strategic equity investment is a portfolio thatconsists principally of publicly traded Japanese equities. This portfolio, like that of other financial institutions inJapan, has historically included shares of our customers.
VaR Summary for the Fiscal Years Ended March 31, 2015 and 2014
The following tables show our VaR by risk category and these figures are prepared based on the internalreporting provided to management.
Our material market risk exposure categories consist of interest rate risk, foreign exchange risk, equities andcommodities risk and others. The section headed “VaR for Trading Activity” shows our VaR for instrumentsentered into for trading purposes and the VaR model for the trading book includes principal consolidatedsubsidiaries. The section headed “VaR for Non-Trading Activity” shows our VaR for instruments entered into forpurposes other than trading purposes. “Strategic Equity Investment” in the “VaR for Non-Trading Activity”section is a portfolio that consists principally of publicly traded Japanese equities. This portfolio, like that ofother financial institutions in Japan, has historically included shares of our customers.
VaR for Trading Activity
The aggregate VaR for our total trading activities at March 31, 2015 was ¥14.5 billion, an increase from¥9.5 billion at March 31, 2014 primarily due to an increase in the net risk exposure of equities.
Interest raterisk
Foreignexchange risk
Equities andcommodities
risk Others Total(1)
(In billions)
For the fiscal year ended March 31, 2015:SMBC Consolidated
Maximum . . . . . . . . . . . . . . . . . . . . . . . . . . . ¥ 11.9 ¥ 3.6 ¥ 9.6 ¥ 1.1 ¥ 19.0Minimum . . . . . . . . . . . . . . . . . . . . . . . . . . . . 4.6 0.7 3.1 0.6 8.9Daily average . . . . . . . . . . . . . . . . . . . . . . . . . 6.7 1.7 5.9 0.8 13.9At March 31, 2015 . . . . . . . . . . . . . . . . . . . . . 6.5 1.3 5.9 1.0 13.8
SMFG ConsolidatedMaximum . . . . . . . . . . . . . . . . . . . . . . . . . . . ¥ 12.5 ¥ 3.6 ¥ 9.9 ¥ 1.1 ¥ 20.2Minimum . . . . . . . . . . . . . . . . . . . . . . . . . . . . 5.4 0.7 3.2 0.6 9.9Daily average . . . . . . . . . . . . . . . . . . . . . . . . . 7.4 1.7 6.2 0.8 14.8At March 31, 2015 . . . . . . . . . . . . . . . . . . . . . 7.2 1.3 6.0 1.0 14.5
Interest raterisk
Foreignexchange risk
Equities andcommodities
risk Others Total(1)
(In billions)
For the fiscal year ended March 31, 2014:SMBC Consolidated
Maximum . . . . . . . . . . . . . . . . . . . . . . . . . . . ¥ 7.7 ¥ 4.6 ¥ 19.0 ¥ 1.1 ¥ 27.9Minimum . . . . . . . . . . . . . . . . . . . . . . . . . . . . 3.6 0.5 2.8 0.2 7.6Daily average . . . . . . . . . . . . . . . . . . . . . . . . . 5.0 2.0 7.3 0.6 13.7At March 31, 2014 . . . . . . . . . . . . . . . . . . . . . 4.3 0.6 3.2 0.9 8.5
SMFG ConsolidatedMaximum . . . . . . . . . . . . . . . . . . . . . . . . . . . ¥ 8.3 ¥ 4.6 ¥ 19.3 ¥ 1.1 ¥ 28.8Minimum . . . . . . . . . . . . . . . . . . . . . . . . . . . . 4.2 0.5 3.0 0.2 8.2Daily average . . . . . . . . . . . . . . . . . . . . . . . . . 5.7 2.0 7.5 0.6 14.6At March 31, 2014 . . . . . . . . . . . . . . . . . . . . . 5.2 0.6 3.3 0.9 9.5
(1) Total for “Maximum,” “Minimum,” and “Daily average” represent the maximum, minimum and daily average of the total of the tradingbook. For certain subsidiaries, we employ the standardized method and/or the historical simulation method for the VaR calculationmethod.
158
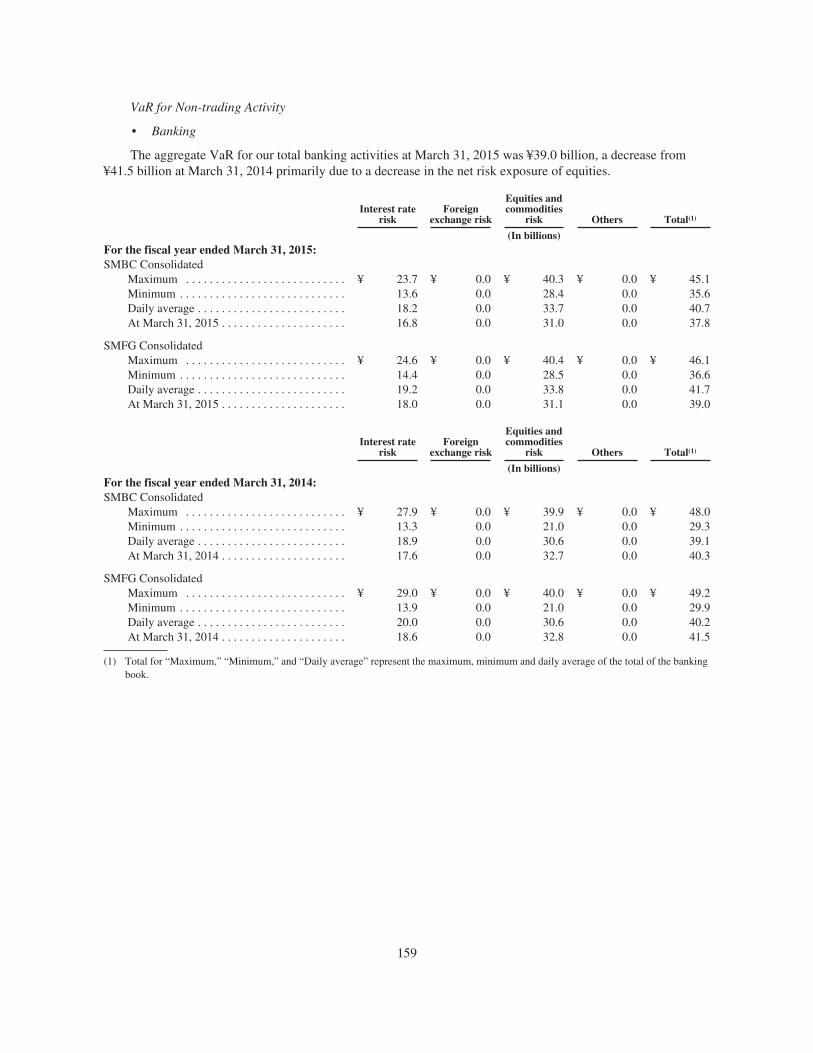
VaR for Non-trading Activity
• Banking
The aggregate VaR for our total banking activities at March 31, 2015 was ¥39.0 billion, a decrease from¥41.5 billion at March 31, 2014 primarily due to a decrease in the net risk exposure of equities.
Interest raterisk
Foreignexchange risk
Equities andcommodities
risk Others Total(1)
(In billions)For the fiscal year ended March 31, 2015:SMBC Consolidated
Maximum . . . . . . . . . . . . . . . . . . . . . . . . . . . ¥ 23.7 ¥ 0.0 ¥ 40.3 ¥ 0.0 ¥ 45.1Minimum . . . . . . . . . . . . . . . . . . . . . . . . . . . . 13.6 0.0 28.4 0.0 35.6Daily average . . . . . . . . . . . . . . . . . . . . . . . . . 18.2 0.0 33.7 0.0 40.7At March 31, 2015 . . . . . . . . . . . . . . . . . . . . . 16.8 0.0 31.0 0.0 37.8
SMFG ConsolidatedMaximum . . . . . . . . . . . . . . . . . . . . . . . . . . . ¥ 24.6 ¥ 0.0 ¥ 40.4 ¥ 0.0 ¥ 46.1Minimum . . . . . . . . . . . . . . . . . . . . . . . . . . . . 14.4 0.0 28.5 0.0 36.6Daily average . . . . . . . . . . . . . . . . . . . . . . . . . 19.2 0.0 33.8 0.0 41.7At March 31, 2015 . . . . . . . . . . . . . . . . . . . . . 18.0 0.0 31.1 0.0 39.0
Interest raterisk
Foreignexchange risk
Equities andcommodities
risk Others Total(1)
(In billions)For the fiscal year ended March 31, 2014:SMBC Consolidated
Maximum . . . . . . . . . . . . . . . . . . . . . . . . . . . ¥ 27.9 ¥ 0.0 ¥ 39.9 ¥ 0.0 ¥ 48.0Minimum . . . . . . . . . . . . . . . . . . . . . . . . . . . . 13.3 0.0 21.0 0.0 29.3Daily average . . . . . . . . . . . . . . . . . . . . . . . . . 18.9 0.0 30.6 0.0 39.1At March 31, 2014 . . . . . . . . . . . . . . . . . . . . . 17.6 0.0 32.7 0.0 40.3
SMFG ConsolidatedMaximum . . . . . . . . . . . . . . . . . . . . . . . . . . . ¥ 29.0 ¥ 0.0 ¥ 40.0 ¥ 0.0 ¥ 49.2Minimum . . . . . . . . . . . . . . . . . . . . . . . . . . . . 13.9 0.0 21.0 0.0 29.9Daily average . . . . . . . . . . . . . . . . . . . . . . . . . 20.0 0.0 30.6 0.0 40.2At March 31, 2014 . . . . . . . . . . . . . . . . . . . . . 18.6 0.0 32.8 0.0 41.5
(1) Total for “Maximum,” “Minimum,” and “Daily average” represent the maximum, minimum and daily average of the total of the bankingbook.
159
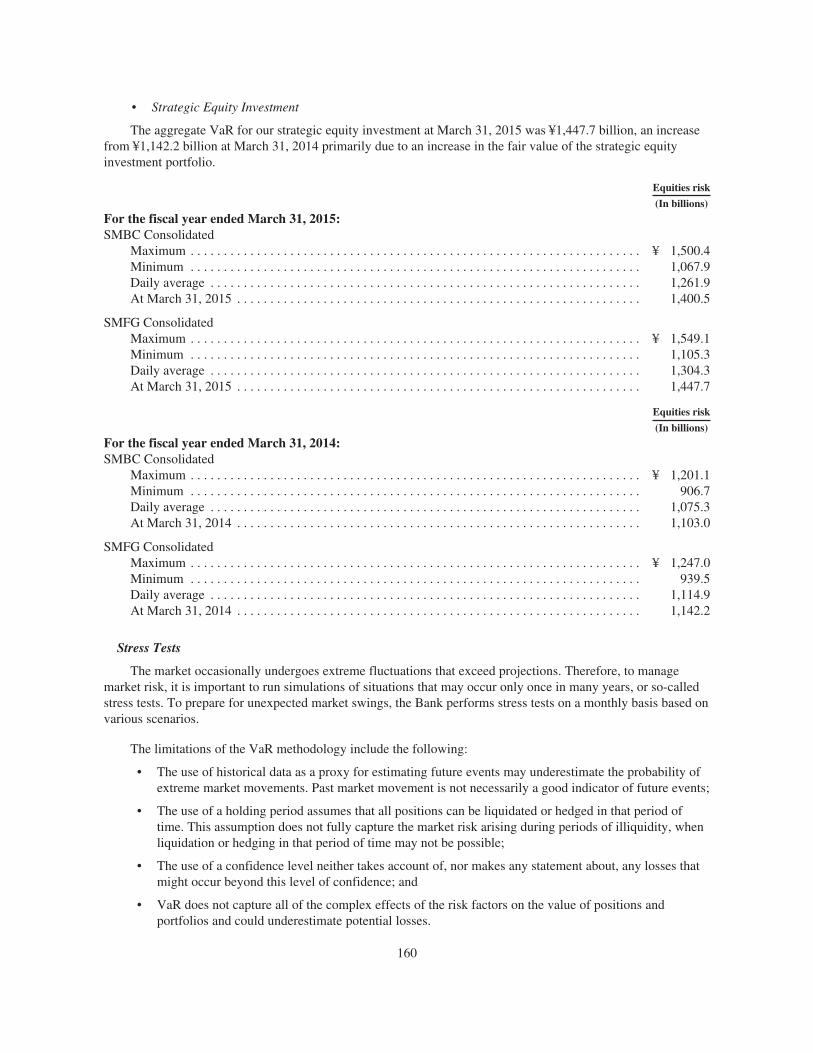
• Strategic Equity Investment
The aggregate VaR for our strategic equity investment at March 31, 2015 was ¥1,447.7 billion, an increasefrom ¥1,142.2 billion at March 31, 2014 primarily due to an increase in the fair value of the strategic equityinvestment portfolio.
Equities risk
(In billions)
For the fiscal year ended March 31, 2015:SMBC Consolidated
Maximum . . . . . . . . . . . . . . . . . . . . . . . . . . . . . . . . . . . . . . . . . . . . . . . . . . . . . . . . . . . . . . . . . . . . ¥ 1,500.4Minimum . . . . . . . . . . . . . . . . . . . . . . . . . . . . . . . . . . . . . . . . . . . . . . . . . . . . . . . . . . . . . . . . . . . . 1,067.9Daily average . . . . . . . . . . . . . . . . . . . . . . . . . . . . . . . . . . . . . . . . . . . . . . . . . . . . . . . . . . . . . . . . . 1,261.9At March 31, 2015 . . . . . . . . . . . . . . . . . . . . . . . . . . . . . . . . . . . . . . . . . . . . . . . . . . . . . . . . . . . . . 1,400.5
SMFG ConsolidatedMaximum . . . . . . . . . . . . . . . . . . . . . . . . . . . . . . . . . . . . . . . . . . . . . . . . . . . . . . . . . . . . . . . . . . . . ¥ 1,549.1Minimum . . . . . . . . . . . . . . . . . . . . . . . . . . . . . . . . . . . . . . . . . . . . . . . . . . . . . . . . . . . . . . . . . . . . 1,105.3Daily average . . . . . . . . . . . . . . . . . . . . . . . . . . . . . . . . . . . . . . . . . . . . . . . . . . . . . . . . . . . . . . . . . 1,304.3At March 31, 2015 . . . . . . . . . . . . . . . . . . . . . . . . . . . . . . . . . . . . . . . . . . . . . . . . . . . . . . . . . . . . . 1,447.7
Equities risk
(In billions)
For the fiscal year ended March 31, 2014:SMBC Consolidated
Maximum . . . . . . . . . . . . . . . . . . . . . . . . . . . . . . . . . . . . . . . . . . . . . . . . . . . . . . . . . . . . . . . . . . . . ¥ 1,201.1Minimum . . . . . . . . . . . . . . . . . . . . . . . . . . . . . . . . . . . . . . . . . . . . . . . . . . . . . . . . . . . . . . . . . . . . 906.7Daily average . . . . . . . . . . . . . . . . . . . . . . . . . . . . . . . . . . . . . . . . . . . . . . . . . . . . . . . . . . . . . . . . . 1,075.3At March 31, 2014 . . . . . . . . . . . . . . . . . . . . . . . . . . . . . . . . . . . . . . . . . . . . . . . . . . . . . . . . . . . . . 1,103.0
SMFG ConsolidatedMaximum . . . . . . . . . . . . . . . . . . . . . . . . . . . . . . . . . . . . . . . . . . . . . . . . . . . . . . . . . . . . . . . . . . . . ¥ 1,247.0Minimum . . . . . . . . . . . . . . . . . . . . . . . . . . . . . . . . . . . . . . . . . . . . . . . . . . . . . . . . . . . . . . . . . . . . 939.5Daily average . . . . . . . . . . . . . . . . . . . . . . . . . . . . . . . . . . . . . . . . . . . . . . . . . . . . . . . . . . . . . . . . . 1,114.9At March 31, 2014 . . . . . . . . . . . . . . . . . . . . . . . . . . . . . . . . . . . . . . . . . . . . . . . . . . . . . . . . . . . . . 1,142.2
Stress Tests
The market occasionally undergoes extreme fluctuations that exceed projections. Therefore, to managemarket risk, it is important to run simulations of situations that may occur only once in many years, or so-calledstress tests. To prepare for unexpected market swings, the Bank performs stress tests on a monthly basis based onvarious scenarios.
The limitations of the VaR methodology include the following:
• The use of historical data as a proxy for estimating future events may underestimate the probability ofextreme market movements. Past market movement is not necessarily a good indicator of future events;
• The use of a holding period assumes that all positions can be liquidated or hedged in that period oftime. This assumption does not fully capture the market risk arising during periods of illiquidity, whenliquidation or hedging in that period of time may not be possible;
• The use of a confidence level neither takes account of, nor makes any statement about, any losses thatmight occur beyond this level of confidence; and
• VaR does not capture all of the complex effects of the risk factors on the value of positions andportfolios and could underestimate potential losses.
160

Additional Information for Certain Risks
Interest Rate Risk
To supplement the above limitations of VaR methodologies, the Group adopts various indices to measureand monitor the sensitivity of interest rates, including delta, gamma and vega risks. The Group considers BPV asone of the most significant indices to manage interest rate risk. BPV is the amount of change in the value to thebanking and trading book as a result of a one-basis-point (0.01%) movement in interest rates. The principalGroup companies use BPV to monitor interest rate risk, not only on a net basis, but also by term to prevent theconcentration of interest rate risk in a specific period. The table “Outlier Ratio” presented below is one of thesensitivity analyses for interest rate risk concerning the banking book using the BPV approach. In addition, aspreviously addressed, the Group enhances the risk management methods of VaR and BPV by using them incombination with back-testing and stress tests.
Interest rate risk substantially changes depending on the method used for recognizing the expected maturitydates of demand deposits that can be withdrawn at any time or the method used for estimating the timing ofcancellation prior to maturity of time deposits and consumer housing loans. At the Bank, the maturity of demanddeposits that are expected to be left with the Bank for a prolonged period is regarded to be at the longest fiveyears (2.5 years on average), and the cancellation prior to maturity of time deposits and consumer housing loansis estimated based on historical data.
Outlier Ratio
In the event the economic value of a bank declines by more than 20% of total capital as a result of interestrate shocks, that bank would fall into the category of “outlier bank,” as stipulated under Pillar 2 of the BaselCapital Accord. This ratio, known as the outlier ratio, was 1.3% for the Bank on a consolidated basis atMarch 31, 2015, substantially below the 20% criterion. The decline in economic value based on outlierframework of the Bank on a consolidated basis is shown in the following table.
At March 31,
2015 2014
(In billions, except percentages)
SMBC ConsolidatedTotal . . . . . . . . . . . . . . . . . . . . . . . . . . . . . . . . . . . . . . . . . . . . . . . . . . . . . . . . ¥ 132.6 ¥ 83.0Impact of yen interest rates . . . . . . . . . . . . . . . . . . . . . . . . . . . . . . . . . . . . . . . 21.2 31.1Impact of U.S. dollar interest rates . . . . . . . . . . . . . . . . . . . . . . . . . . . . . . . . . 57.4 25.7Impact of euro interest rates . . . . . . . . . . . . . . . . . . . . . . . . . . . . . . . . . . . . . . 25.5 18.6Percentage of total capital . . . . . . . . . . . . . . . . . . . . . . . . . . . . . . . . . . . . . . . . 1.3% 0.9%
Note: Decline in economic value is the decline of the present value of a banking portfolio after interest rate shocks (1st and 99th percentileof observed interest rate changes using a one-year holding period and an observation period of five years).
Foreign Exchange Risk
The principal Group companies set risk limits for each currency to manage the concentration of the foreigncurrency position. The foreign exchange risk is immaterial as shown above in VaR by risk category.
Strategic Equity Investment Risk
We establish limits on allowable risk for strategic equity investments, and monitor the observance of thoselimits to keep stock price fluctuation risk within acceptable parameters. We have been reducing our strategicequity investments, and the balance is within a permitted level, which is less than 100% of our consolidatedTier 1 Capital. See “Item 4.B. Business Overview—Regulations in Japan—Regulations for Stabilizing theFinancial System—Restriction on Aggregate Shareholdings by a Bank.”
161

Liquidity Risk Management Methods
We and the Bank regard liquidity risk as one of the major risks and we identify our Group companies whichhave significant liquidity risk. Each of our identified Group companies, including the Bank, establishes afundamental risk management framework. For example, the Bank manages liquidity risk based on a frameworkconsisting of setting upper limits for “funding gaps,” maintaining highly liquid supplementary funding sourcesand establishing contingency plans.
A funding gap is defined as a maturity mismatch between a source of funds and the use of funds. The Bankactively manages this funding gap by setting limits on the size of gaps over a given time horizon and limitingreliance on short-term funding. These limits are established on both a Bank-wide basis and individual branchbasis, taking into account cash management planning, systemic factors and funding status, among other factors.Additionally, funding gap limits are set for individual currencies if necessary. The Bank actively monitorsfunding gaps on a daily basis. Further, stress tests are regularly carried out by simulating the impact triggered, forexample, by the outflow of deposits or having difficulties in funding from money markets, in order to thoroughlycomprehend the amount required to fund when the liquidity risk is realized. Additionally, funding liquidity ismaintained by holding assets, such as U.S. government bonds, which can be immediately converted to cash, orestablishing borrowing facilities to be used as supplementary funding sources in an emergency, in order tosmoothly raise the required funds even during market disruption.
Furthermore, contingency plans are developed to respond to the liquidity risk when being realized, bycreating detailed action plans such as lowering the upper limit for the funding gap, depending on the existingsituation (i.e. normal, concerned, or critical) and the respective circumstances.
Operational Risk, Processing Risk and System Risk
Operational risk is the possibility of losses arising from inadequate or failed internal processes, people andsystems or from external events. We have prepared operational risk management regulations to define the basicrules to be observed across our Group. Under these regulations, we are working to raise the level ofsophistication of our management of operational risk across the group by providing an effective framework forthe identification, assessment, control and monitoring of significant risk factors and by establishing a system forexecuting contingency and business continuity plans.
Processing risk is the possibility of losses arising from negligent processing by employees, accidents, orunauthorized activities. We recognize that all operations entail processing risk. We are, therefore, working toraise the level of sophistication of our management of processing risk across the whole Group by ensuring thateach branch conducts its own regular investigations of processing risk; minimizing losses in the event ofprocessing errors or negligence by drafting exhaustive contingency plans; and carrying out thoroughquantification of the risk under management.
System risk is the possibility of a loss arising from the failure, malfunction or unauthorized use of computersystems. We recognize that reliable computer systems are essential for the effective implementation ofmanagement strategy. We strive to minimize system risk by adopting and implementing risk managementregulations and specific management standards, including a security policy. We also have contingency plans withthe goal of minimizing losses in the event of a system failure. To prevent computer system breakdowns, we havealso implemented numerous measures, including the duplication of various systems and infrastructures,maintaining the Bank’s computer system to facilitate steady, uninterrupted operation, and establishing a disaster-prevention system consisting of computer centers in eastern and western Japan.
Other Risk
Settlement risk is the possibility of a loss arising from a transaction that cannot be settled as planned. As thisrisk crosses over numerous categories of risk, including credit, liquidity, processing and system risks, it isrequired to appropriately manage according to characteristics of such risks.
162
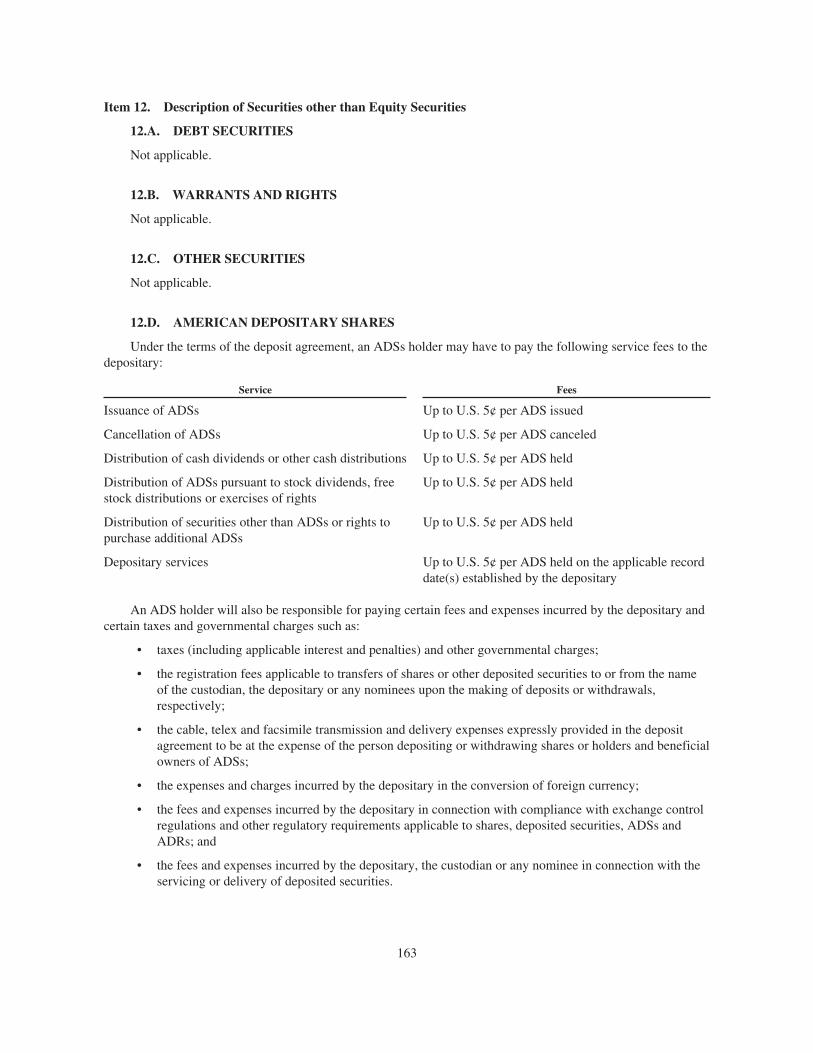
Item 12. Description of Securities other than Equity Securities
12.A. DEBT SECURITIES
Not applicable.
12.B. WARRANTS AND RIGHTS
Not applicable.
12.C. OTHER SECURITIES
Not applicable.
12.D. AMERICAN DEPOSITARY SHARES
Under the terms of the deposit agreement, an ADSs holder may have to pay the following service fees to thedepositary:
Service Fees
Issuance of ADSs Up to U.S. 5¢ per ADS issued
Cancellation of ADSs Up to U.S. 5¢ per ADS canceled
Distribution of cash dividends or other cash distributions Up to U.S. 5¢ per ADS held
Distribution of ADSs pursuant to stock dividends, freestock distributions or exercises of rights
Up to U.S. 5¢ per ADS held
Distribution of securities other than ADSs or rights topurchase additional ADSs
Up to U.S. 5¢ per ADS held
Depositary services Up to U.S. 5¢ per ADS held on the applicable recorddate(s) established by the depositary
An ADS holder will also be responsible for paying certain fees and expenses incurred by the depositary andcertain taxes and governmental charges such as:
• taxes (including applicable interest and penalties) and other governmental charges;
• the registration fees applicable to transfers of shares or other deposited securities to or from the nameof the custodian, the depositary or any nominees upon the making of deposits or withdrawals,respectively;
• the cable, telex and facsimile transmission and delivery expenses expressly provided in the depositagreement to be at the expense of the person depositing or withdrawing shares or holders and beneficialowners of ADSs;
• the expenses and charges incurred by the depositary in the conversion of foreign currency;
• the fees and expenses incurred by the depositary in connection with compliance with exchange controlregulations and other regulatory requirements applicable to shares, deposited securities, ADSs andADRs; and
• the fees and expenses incurred by the depositary, the custodian or any nominee in connection with theservicing or delivery of deposited securities.
163

Depositary fees payable upon the issuance and cancellation of ADSs are typically paid to the depositary bythe brokers (on behalf of their clients) receiving the newly issued ADSs from the depositary and by the brokers(on behalf of their clients) delivering the ADSs to the depositary for cancellation. The brokers in turn chargethese transaction fees to their clients.
Citibank, N.A., as depositary, has agreed to reimburse us annually for expenses related to the administrationand maintenance of the depositary receipt facility, subject to certain criteria. We did not receive anyreimbursements from Citibank, N.A. in the fiscal year ended March 31, 2015.
164

PART II
Item 13. Defaults, Dividend Arrearages and Delinquencies
None.
Item 14. Material Modifications to the Rights of Security Holders and Use of Proceeds
None.
Item 15. Controls and Procedures
Disclosure Controls and Procedures
We carried out an evaluation under the supervision and with the participation of our management, includingKoichi Miyata, our President and Representative Director, and Jun Ohta, our Director, of the effectiveness of thedesign and operation of our disclosure controls and procedures (as defined in Rule 13a-15(e) under the SecuritiesExchange Act of 1934) at March 31, 2015. There are inherent limitations to the effectiveness of any system ofdisclosure controls and procedures, including the possibility of human error and the circumvention or overridingof the controls and procedures. Accordingly, even effective disclosure controls and procedures can only providereasonable, not absolute, assurance of achieving their control objectives. Also, projections of any evaluation ofeffectiveness to future periods are subject to the risk that controls may become inadequate because of changes inconditions, or that the degree of compliance with the policies or procedures may deteriorate. Based upon theevaluation referred to above, Mr. Miyata and Mr. Ohta concluded that the design and operation of our disclosurecontrols and procedures at March 31, 2015 were effective to provide reasonable assurance that informationrequired to be disclosed in the reports that we file or submit under the Securities Exchange Act of 1934 isrecorded, processed, summarized and reported within the time periods specified in the SEC’s rules and forms.
Management’s Annual Report on Internal Control Over Financial Reporting
Our management is responsible for establishing and maintaining adequate internal control over financialreporting, as defined in Rule 13a-15(f) under the Securities Exchange Act of 1934. Our internal control overfinancial reporting is a process designed to provide reasonable assurance regarding the reliability of financialreporting and the preparation of financial statements for external purposes in accordance with IFRS. Our internalcontrol over financial reporting includes those policies and procedures that:
(i) pertain to the maintenance of records that, in reasonable detail, accurately and fairly reflect thetransactions and dispositions of our assets;
(ii) provide reasonable assurance that transactions are recorded as necessary to permit preparation offinancial statements in accordance with IFRS, and that our receipts and expenditures are being madeonly in accordance with authorizations of our management and directors; and
(iii) provide reasonable assurance regarding prevention or timely detection of unauthorized acquisition, useor disposition of our assets that could have a material effect on the financial statements.
Because of its inherent limitations, internal control over financial reporting may not prevent or detectmisstatements. Also, projections of any evaluation of effectiveness to future periods are subject to the risk thatcontrols may become inadequate because of changes in conditions, or that the degree of compliance with thepolicies or procedures may deteriorate.
Our management evaluated the effectiveness of our internal control over financial reporting at March 31,2015 based on the criteria established in “Internal Control—Integrated Framework (2013)” issued by theCommittee of Sponsoring Organizations of the Treadway Commission. Based on the evaluation, managementhas concluded that we maintained effective internal control over financial reporting at March 31, 2015.
165

The effectiveness of our internal control over financial reporting at March 31, 2015 has been audited byKPMG AZSA, our independent registered public accounting firm, as stated in their report appearing on page F-4.
Changes in Internal Control Over Financial Reporting
There have been no changes in our internal control over financial reporting that occurred during the periodcovered by this annual report that have materially affected, or are reasonably likely to materially affect, ourinternal control over financial reporting.
Item 16A. Audit Committee Financial Expert
Our board of corporate auditors has determined that Mr. Satoshi Itoh is an “audit committee financialexpert” as defined in Item 16A. of Form 20-F and is “independent” as defined in the listing standards of theNYSE. Mr. Itoh, an outside corporate auditor under the Companies Act, has spent most of his career auditingJapanese corporations as a certified public accountant and was a special professor at Chuo University GraduateSchool of International Accounting from April 2002 to March 2007.
Item 16B. Code of Ethics
We have adopted a code of ethics, which is comprised of internal rules included in our business ethics andcompliance manual, each of which applies to all our directors, officers and other employees.
Our business ethics are commonly applicable principles of Corporate Social Responsibility (“CSR”) inwhich observance of the compliance system is regarded as very important. Our compliance manual sets forth thenecessity of adherence to our management philosophy and code of conduct by our directors, officers and otheremployees, and the roles and responsibilities of our employees, compliance officers, Compliance Division andothers in the event of a breach of the compliance rules.
This manual was created to identify, and to promote compliance by our directors, officers and otheremployees with relevant laws and regulations in conjunction with our management philosophy and code ofconduct and compliance rules. This manual also sets forth the procedures regarding the handling of conflicts ofinterest for our directors and the promotion of conduct that meets our management philosophy and code ofconduct and compliance rules for employees. For a detailed discussion of our management philosophy and codeof conduct, see “Item 4.B. Business Overview—Management Philosophy.”
A copy of the sections of our business ethics and compliance manual equivalent to the “code of ethics” (asdefined in paragraph (b) of Item 16B. of Form 20-F) is attached as Exhibit 11 to this annual report.
There were no material changes to the code of ethics during the fiscal year ended March 31, 2015. Nowaivers of the business ethics and compliance manual have been granted to any of our directors, officers or otheremployees, during the fiscal year ended March 31, 2015.
166

Item 16C. Principal Accountant Fees and Services
Fees for Services Provided by KPMG AZSA and its Affiliates
The aggregate fees billed by KPMG AZSA, our independent registered public accounting firm, and itsaffiliates, for the fiscal years ended March 31, 2015 and 2014 are presented in the following table:
For the fiscal year endedMarch 31,
2015 2014
(In millions)
Audit fees(1) . . . . . . . . . . . . . . . . . . . . . . . . . . . . . . . . . . . . . . . . . . . . . . . . . . . . . . . ¥ 4,087 ¥ 4,012Audit-related fees(2) . . . . . . . . . . . . . . . . . . . . . . . . . . . . . . . . . . . . . . . . . . . . . . . . 160 119Tax fees(3) . . . . . . . . . . . . . . . . . . . . . . . . . . . . . . . . . . . . . . . . . . . . . . . . . . . . . . . . 151 184All other fees(4) . . . . . . . . . . . . . . . . . . . . . . . . . . . . . . . . . . . . . . . . . . . . . . . . . . . . 12 34
Total . . . . . . . . . . . . . . . . . . . . . . . . . . . . . . . . . . . . . . . . . . . . . . . . . . . . . . . . ¥ 4,410 ¥ 4,349
(1) Audit fees primarily include fees for the audit of our and our subsidiaries’ annual financial statements and fees for the services that arenormally provided in connection with our statutory and regulatory filings.
(2) Audit-related fees primarily include fees for attestation and related services that are not reported under audit fees.(3) Tax fees primarily include fees for tax compliance, assistance with preparation of tax return filings and tax advisory services.(4) All other fees primarily include fees for advisory services in relation to existing accounting policies of our subsidiaries.
Pre-Approval Policies and Procedures
Pursuant to Rule 2-01(c)(7) of Regulation S-X, our board of corporate auditors pre-approves allengagements with KPMG AZSA and its affiliates. Under the policies and procedures established by our board ofcorporate auditors, SMFG and its subsidiaries must apply to our board of corporate auditors for pre-approval oneither a periodic basis twice a year for services expected to be performed in the coming months or case-by-casebasis before entering into the engagement with KPMG AZSA and its affiliates to perform audit and permittednon-audit services.
Pre-approval is granted by our board of corporate auditors prior to entering into the engagement.Additionally, if necessary, full-time corporate auditors may consider any case-by-case application for pre-approval on behalf of our board of corporate auditors prior to the next scheduled board meeting. Such pre-approvals made by full-time corporate auditors are reported to our board of corporate auditors at the nextscheduled board meeting.
Fees approved pursuant to the procedures described in paragraph 2-01(c)(7)(i)(C) of Regulation S-X, whichprovides for an exception to the general requirement for pre-approval in certain circumstances, were none for thefiscal years ended March 31, 2015 and 2014.
Item 16D. Exemptions from the Listing Standards for the Audit Committee
We do not have an audit committee defined under the Securities Exchange Act of 1934. We are relying onthe general exemption contained in Rule 10A-3(c)(3) under the Securities Exchange Act of 1934, which providesan exemption from the NYSE’s listing standards relating to audit committees for foreign companies that have aboard of corporate auditors that meets the requirements set forth in Rule 10A-3(c)(3). Our reliance onRule 10A-3(c)(3) does not, in our opinion, materially adversely affect the ability of our board of corporateauditors to act independently and to satisfy the other requirements of Rule 10A-3.
167
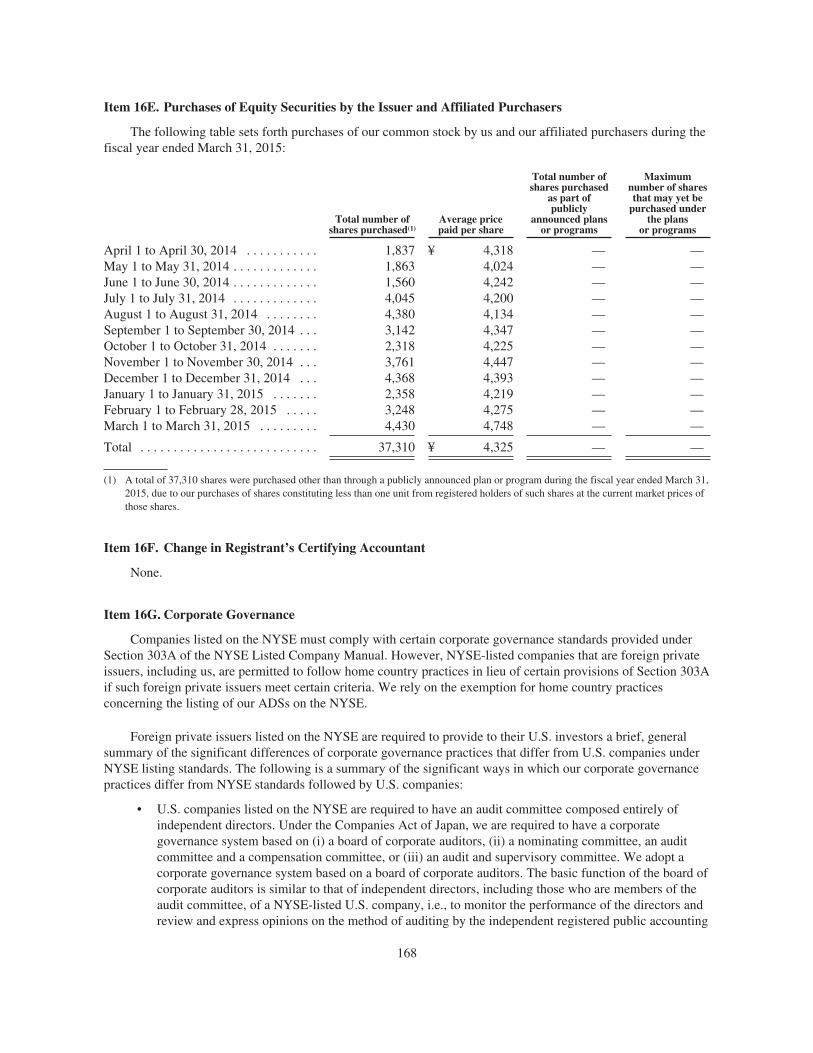
Item 16E. Purchases of Equity Securities by the Issuer and Affiliated Purchasers
The following table sets forth purchases of our common stock by us and our affiliated purchasers during thefiscal year ended March 31, 2015:
Total number ofshares purchased(1)
Average pricepaid per share
Total number ofshares purchased
as part ofpublicly
announced plansor programs
Maximumnumber of sharesthat may yet be
purchased underthe plans
or programs
April 1 to April 30, 2014 . . . . . . . . . . . 1,837 ¥ 4,318 — —May 1 to May 31, 2014 . . . . . . . . . . . . . 1,863 4,024 — —June 1 to June 30, 2014 . . . . . . . . . . . . . 1,560 4,242 — —July 1 to July 31, 2014 . . . . . . . . . . . . . 4,045 4,200 — —August 1 to August 31, 2014 . . . . . . . . 4,380 4,134 — —September 1 to September 30, 2014 . . . 3,142 4,347 — —October 1 to October 31, 2014 . . . . . . . 2,318 4,225 — —November 1 to November 30, 2014 . . . 3,761 4,447 — —December 1 to December 31, 2014 . . . 4,368 4,393 — —January 1 to January 31, 2015 . . . . . . . 2,358 4,219 — —February 1 to February 28, 2015 . . . . . 3,248 4,275 — —March 1 to March 31, 2015 . . . . . . . . . 4,430 4,748 — —
Total . . . . . . . . . . . . . . . . . . . . . . . . . . . 37,310 ¥ 4,325 — —
(1) A total of 37,310 shares were purchased other than through a publicly announced plan or program during the fiscal year ended March 31,2015, due to our purchases of shares constituting less than one unit from registered holders of such shares at the current market prices ofthose shares.
Item 16F. Change in Registrant’s Certifying Accountant
None.
Item 16G. Corporate Governance
Companies listed on the NYSE must comply with certain corporate governance standards provided underSection 303A of the NYSE Listed Company Manual. However, NYSE-listed companies that are foreign privateissuers, including us, are permitted to follow home country practices in lieu of certain provisions of Section 303Aif such foreign private issuers meet certain criteria. We rely on the exemption for home country practicesconcerning the listing of our ADSs on the NYSE.
Foreign private issuers listed on the NYSE are required to provide to their U.S. investors a brief, generalsummary of the significant differences of corporate governance practices that differ from U.S. companies underNYSE listing standards. The following is a summary of the significant ways in which our corporate governancepractices differ from NYSE standards followed by U.S. companies:
• U.S. companies listed on the NYSE are required to have an audit committee composed entirely ofindependent directors. Under the Companies Act of Japan, we are required to have a corporategovernance system based on (i) a board of corporate auditors, (ii) a nominating committee, an auditcommittee and a compensation committee, or (iii) an audit and supervisory committee. We adopt acorporate governance system based on a board of corporate auditors. The basic function of the board ofcorporate auditors is similar to that of independent directors, including those who are members of theaudit committee, of a NYSE-listed U.S. company, i.e., to monitor the performance of the directors andreview and express opinions on the method of auditing by the independent registered public accounting
168

firm and on such accounting firm’s audit reports for the protection of the company’s shareholders.Under the Companies Act, we are required to have at least half of our corporate auditors be outsidecorporate auditors who meet the independence requirements under the Companies Act. Currently, threeof our six corporate auditors are outside corporate auditors that meet such independence requirements.In addition, none of the corporate auditors may at the same time be directors, managers or employeesof the company or any of its subsidiaries, or accounting advisors or executive officers (shikkoyaku) ofsuch subsidiaries. While the Companies Act does not require corporate auditors to have expertise inaccounting or other special knowledge and experience, one of our corporate auditors is a certifiedpublic accountant in Japan. We rely on an exemption from the audit committee requirements imposedby Rule 10A-3 of the Securities Exchange Act of 1934, which is available to foreign private issuerswith a board of auditors (or similar body) meeting specified criteria. With respect to our board ofcorporate auditors, the criteria that we meet include the following:
• responsible, to the extent permitted by law, for the appointment, retention and supervision of thework of an independent registered public accounting firm engaged for the purpose of preparing orissuing an audit report or performing other audit, review or attestation services for us;
• subject to procedures for the receipt, retention and treatment of complaints and the confidential,anonymous submission of concerns by employees regarding the status of our internal controlsystem on accounting and financial reporting and internal and external audits;
• each corporate auditor has the authority to engage independent counsel and other advisers if suchengagement is necessary to carry out his or her duties; and
• each corporate auditor has the ability to require us to pay any and all expenses necessary forcarrying out his or her duties.
Under the Companies Act, companies that adopt a corporate governance system based on a board ofcorporate auditors, such as us, are not required to maintain directors that are outside directors who meet theindependence requirements under the Companies Act. However, five of our thirteen directors are outsidedirectors who meet such requirements.
• A NYSE-listed U.S. company is required to have a nominating/corporate governance committee and acompensation committee, all of which must be composed entirely of independent directors. The membersof the compensation committee must satisfy additional requirements set forth in Section 303A.02(a)(ii) ofthe NYSE Listed Company Manual. A compensation committee must also have the authority to, in itssole discretion, retain or obtain the advice of a compensation consultant, independent legal counsel orother adviser. This authority is subject to the committee’s consideration of certain criteria set forth inSection 303A.05(c) of the NYSE Listed Company Manual regarding the independence of the adviser.While we, a company which has corporate auditors, are not required to establish a nominating committeeor a compensation committee under the Companies Act, we voluntarily established similar committees,each with eight members, five of whom are outside directors, to advise the board of directors on thesematters in order to ensure transparency and impartiality in matters of personnel decisions affecting theboard of directors and directors’ compensation.
• A NYSE-listed U.S. company must hold regularly scheduled executive sessions where participants arelimited to non-management directors. Under the Companies Act, Japanese corporations are not obligedto hold executive sessions where participants are limited to non-management directors.
• The Companies Act requires that the aggregate amount of remuneration to be paid to all directors andthe aggregate amount of remuneration to be paid to all corporate auditors to be determined by aresolution of a general meeting of shareholders, unless their remuneration is provided for in the articlesof incorporation. Based on the above resolution, the distribution of remuneration among directors isbroadly delegated to our board of directors, which takes into consideration the advisory opinion by thecompensation committee, and the distribution of remuneration among corporate auditors is determinedby consultation among our corporate auditors.
169

• A NYSE-listed U.S. company must adopt a code of business conduct and ethics and must post the codeon its website. While we are not required to adopt such code under Japanese law or the rules of stockexchanges in Japan on which we are listed, we maintain our code of conduct as our standard forcorporate conduct to be observed by our directors, officers and employees.
• A NYSE-listed U.S. company must adopt corporate governance guidelines and must post theguidelines on its website. While we are not required to adopt such guidelines under Japanese law, therules of the stock exchanges in Japan on which we are listed, including the Tokyo Stock Exchange,require listed companies, including us, to comply with the principles of the Corporate GovernanceCode established by those stock exchanges and, in cases of noncompliance with some or all of theprinciples, to disclose the reasons for such noncompliance. In May 2015, we established the SMFGCorporate Governance Guideline, in consideration of the Corporate Governance Code, to present ourbasic views and guidelines on corporate governance and improve our corporate governance system.Our Corporate Governance Guideline is available on our website at http://www.smfg.co.jp.
• A NYSE-listed U.S. company must generally obtain shareholder approval with respect to any equitycompensation plan, subject to limited exemptions. Under the Companies Act of Japan, the adoption ofan equity compensation plan including stock option-based plans for directors and corporate auditorsrequires shareholder approval. In order to issue stock options, a public company such as us must obtainthe approval of its board of directors, unless stock options are granted on preferential terms to therecipient, in which case it must obtain shareholder approval by a “special resolution” of a generalmeeting of shareholders. Under our articles of incorporation, the quorum for such a special resolutionof our shareholders is at least one-third of the total number of voting rights of all of shareholders, andapproval by at least two-thirds of the number of voting rights represented at the meeting is required.
We obtained shareholder approval at our June 2010 general meeting of shareholders to introduce stockcompensation-type stock options to our directors and corporate auditors. Under the terms resolved at the meetingwe may issue stock options to our directors and corporate auditors as part of their remuneration upon theapproval of our board of directors unless stock options are issued on preferential terms to the recipient. Foradditional information, see “Item 6.E. Share Ownership.”
Item 16H. Mine Safety Disclosure
Not applicable.
170

PART III
Item 17. Financial Statements
We have responded to Item 18 in lieu of this item.
Item 18. Financial Statements
The information required by this item is set forth in our consolidated financial statements starting onpage F-1 of this annual report.
Item 19. Exhibits
We have filed the following documents as exhibits to this document:
Exhibit 1.1 Articles of Incorporation of Sumitomo Mitsui Financial Group, Inc., as amended on June 26,2015
Exhibit 1.2 Regulations of Board of Directors of Sumitomo Mitsui Financial Group, Inc., as amended onMay 1, 2015
Exhibit 1.3 Share Handling Regulations of Sumitomo Mitsui Financial Group, Inc., as amended on April 1,2012, incorporated by reference from our annual report on Form 20-F (Commission file number001-34919) filed on July 23, 2012
Exhibit 2.1 Form of Deposit Agreement among the registrant, Citibank, N.A., as Depositary, and all ownersand holders from time to time of American Depositary Shares issued thereunder, incorporatedby reference from our registration statement on Form 20-F (Commission file number 001-34919) filed on October 20, 2010
Exhibit 8 List of subsidiaries of Sumitomo Mitsui Financial Group, Inc., at March 31, 2015
Exhibit 11 Code of Ethics of Sumitomo Mitsui Financial Group, Inc., incorporated by reference from ourannual report on Form 20-F (File No. 001-34919) filed on July 29, 2011
Exhibit 12.1 CEO Certification Required by Rule 13a-14(a) (17 CFR 240.13a-14(a))
Exhibit 12.2 CFO Certification Required by Rule 13a-14(a) (17 CFR 240.13a-14(a))
Exhibit 13.1 Certification Required by Rule 13a-14(b) (17 CFR 240.13a-14(b)) and Section 1350 ofChapter 63 of Title 18 of the United States Code (18 U.S.C. 1350)
Exhibit 13.2 Certification Required by Rule 13a-14(b) (17 CFR 240.13a-14(b)) and Section 1350 ofChapter 63 of Title 18 of the United States Code (18 U.S.C. 1350)
We have not included as exhibits certain instruments with respect to our long-term debt. The total amount ofour long-term debt securities or that of our subsidiaries, authorized under any instrument does not exceed 10% ofour total assets. We hereby agree to furnish to the SEC, upon its request, a copy of any instrument defining therights of holders of our long-term debt or that of our subsidiaries for which consolidated or unconsolidatedfinancial statements are required to be filed.
171

SIGNATURES
The registrant hereby certifies that it meets all of the requirements for filing on Form 20-F and that it hasduly caused and authorized the undersigned to sign this annual report on its behalf.
Sumitomo Mitsui Financial Group, Inc.
By: /s/ Koichi Miyata
Name: Koichi MiyataTitle: President and Representative Director
Date: July 22, 2015
172

SELECTED STATISTICAL DATA
I. Distribution of Assets, Liabilities and Equity; Interest Rates and Interest Differential
Average Statements of Financial Positions, Interest and Average Rates
The following tables show the average balances of our statement of financial positions items and relatedinterest and average interest rates for the fiscal years ended March 31, 2015, 2014 and 2013. Average balancesare generally based on a daily average. Weekly, month-end or quarter-end averages are used for certain averagebalances where it is not practical to obtain the applicable daily averages. The average balances determined bysuch methods are considered to be representative of our operations. The allocation of amounts between domesticand foreign is based on the location of the office.
For the fiscal year ended March 31,
2015 2014(5) 2013(5)
Averagebalance
Interestincome
Averagerate
Averagebalance
Interestincome
Averagerate
Averagebalance
Interestincome
Averagerate
(In millions, except percentages)Interest-earning assets:
Interest-earning deposits with otherbanks:
Domestic offices . . . . . . . . . . . . . . . ¥ 741,738 ¥ 4,548 0.61% ¥ 609,023 ¥ 2,807 0.46% ¥ 351,808 ¥ 1,185 0.34%Foreign offices . . . . . . . . . . . . . . . . 5,892,983 37,348 0.63% 6,027,100 34,521 0.57% 4,491,108 28,285 0.63%
Total . . . . . . . . . . . . . . . . . . . . 6,634,721 41,896 0.63% 6,636,123 37,328 0.56% 4,842,916 29,470 0.61%
Call loans and bills bought:Domestic offices . . . . . . . . . . . . . . . 226,409 1,177 0.52% 273,903 1,583 0.58% 304,331 1,519 0.50%Foreign offices . . . . . . . . . . . . . . . . 972,643 17,429 1.79% 1,154,049 16,559 1.43% 1,076,378 11,347 1.05%
Total . . . . . . . . . . . . . . . . . . . . 1,199,052 18,606 1.55% 1,427,952 18,142 1.27% 1,380,709 12,866 0.93%
Reverse repurchase agreements and cashcollateral on securities borrowed:
Domestic offices . . . . . . . . . . . . . . . 4,766,205 7,875 0.17% 3,749,260 7,339 0.20% 3,922,361 7,535 0.19%Foreign offices . . . . . . . . . . . . . . . . 726,427 9,146 1.26% 419,274 7,631 1.82% 283,262 5,465 1.93%
Total . . . . . . . . . . . . . . . . . . . . 5,492,632 17,021 0.31% 4,168,534 14,970 0.36% 4,205,623 13,000 0.31%
Trading assets(1):Domestic offices . . . . . . . . . . . . . . . 3,284,505 24,313 0.74% 2,967,303 25,770 0.87% 4,232,218 35,507 0.84%Foreign offices . . . . . . . . . . . . . . . . 84,006 1,661 1.98% 43,857 525 1.20% 38,889 565 1.45%
Total . . . . . . . . . . . . . . . . . . . . 3,368,511 25,974 0.77% 3,011,160 26,295 0.87% 4,271,107 36,072 0.84%
Financial assets at fair value throughprofit or loss(2):
Domestic offices . . . . . . . . . . . . . . . 1,672,433 (4,373) (0.26%) 1,788,442 16,534 0.92% 1,979,187 1,112 0.06%
Held-to-maturity investments(3):Domestic offices . . . . . . . . . . . . . . . 4,086,502 20,509 0.50% 5,238,921 30,303 0.58% 5,659,267 39,786 0.70%
Available-for-sale financial assets(3):Domestic offices . . . . . . . . . . . . . . . 10,385,945 32,703 0.31% 12,119,698 35,539 0.29% 23,444,037 65,814 0.28%Foreign offices . . . . . . . . . . . . . . . . 2,250,294 29,282 1.30% 1,780,684 19,956 1.12% 1,687,202 21,572 1.28%
Total . . . . . . . . . . . . . . . . . . . . 12,636,239 61,985 0.49% 13,900,382 55,495 0.40% 25,131,239 87,386 0.35%
Loans and advances(4):Domestic offices . . . . . . . . . . . . . . . 62,005,587 1,099,119 1.77% 61,524,516 1,138,102 1.85% 60,183,531 1,200,792 2.00%Foreign offices . . . . . . . . . . . . . . . . 23,292,666 523,485 2.25% 19,553,229 419,704 2.15% 15,301,802 342,423 2.24%
Total . . . . . . . . . . . . . . . . . . . . 85,298,253 1,622,604 1.90% 81,077,745 1,557,806 1.92% 75,485,333 1,543,215 2.04%
Total interest-earning assets:Domestic offices . . . . . . . . . . . . . . . 87,169,324 1,185,871 1.36% 88,271,066 1,257,977 1.43% 100,076,740 1,353,250 1.35%Foreign offices . . . . . . . . . . . . . . . . 33,219,019 618,351 1.86% 28,978,193 498,896 1.72% 22,878,641 409,657 1.79%
Total . . . . . . . . . . . . . . . . . . . . 120,388,343 ¥1,804,222 1.50% 117,249,259 ¥1,756,873 1.50% 122,955,381 ¥1,762,907 1.43%
Non-interest-earning assets:Cash and due from banks . . . . . . . . . . . . 24,523,995 13,653,126 2,953,149Other non-interest-earning assets . . . . . . 19,075,392 15,647,012 16,561,418Allowance for loan losses . . . . . . . . . . . . (873,853) (1,157,839) (1,343,024)
Total non-interest-earning assets . . 42,725,534 28,142,299 18,171,543
Total assets . . . . . . . . . . . . . . . . . . . . . . . . . . ¥163,113,877 ¥145,391,558 ¥141,126,924
Total assets attributable to foreign offices . . . 23.6% 22.3% 18.7%
A-1
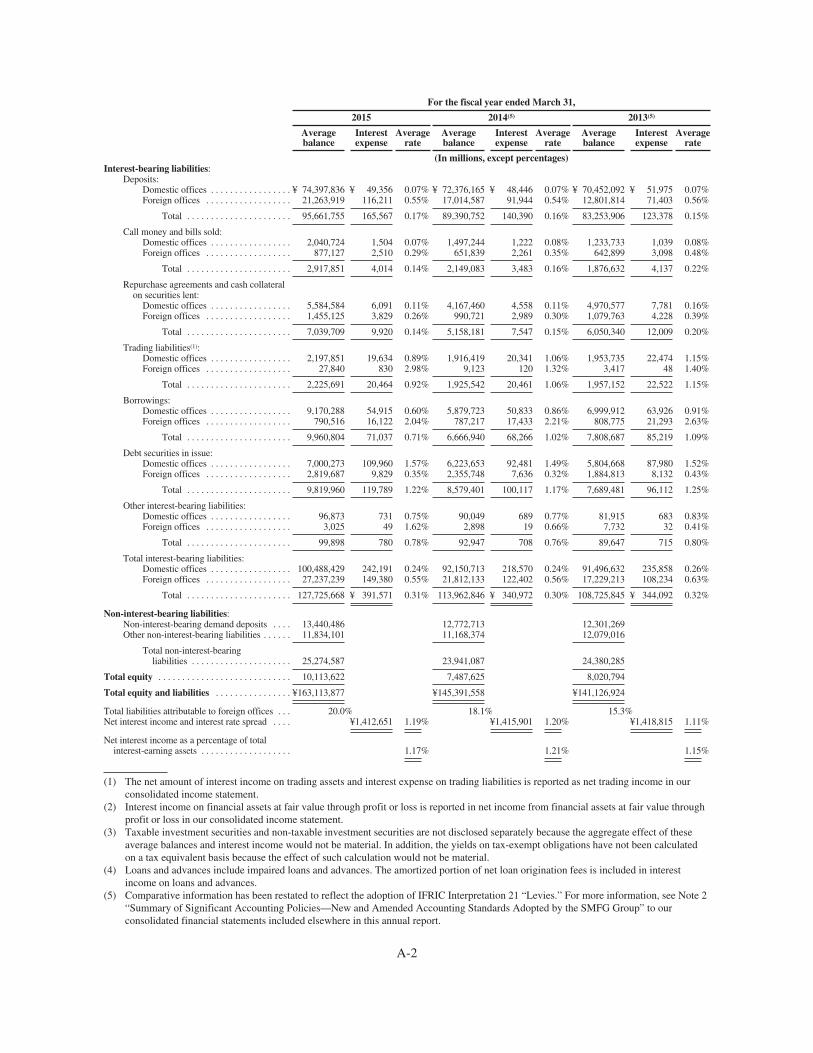
For the fiscal year ended March 31,
2015 2014(5) 2013(5)
Averagebalance
Interestexpense
Averagerate
Averagebalance
Interestexpense
Averagerate
Averagebalance
Interestexpense
Averagerate
(In millions, except percentages)Interest-bearing liabilities:
Deposits:Domestic offices . . . . . . . . . . . . . . . . . ¥ 74,397,836 ¥ 49,356 0.07% ¥ 72,376,165 ¥ 48,446 0.07% ¥ 70,452,092 ¥ 51,975 0.07%Foreign offices . . . . . . . . . . . . . . . . . . 21,263,919 116,211 0.55% 17,014,587 91,944 0.54% 12,801,814 71,403 0.56%
Total . . . . . . . . . . . . . . . . . . . . . . 95,661,755 165,567 0.17% 89,390,752 140,390 0.16% 83,253,906 123,378 0.15%
Call money and bills sold:Domestic offices . . . . . . . . . . . . . . . . . 2,040,724 1,504 0.07% 1,497,244 1,222 0.08% 1,233,733 1,039 0.08%Foreign offices . . . . . . . . . . . . . . . . . . 877,127 2,510 0.29% 651,839 2,261 0.35% 642,899 3,098 0.48%
Total . . . . . . . . . . . . . . . . . . . . . . 2,917,851 4,014 0.14% 2,149,083 3,483 0.16% 1,876,632 4,137 0.22%
Repurchase agreements and cash collateralon securities lent:
Domestic offices . . . . . . . . . . . . . . . . . 5,584,584 6,091 0.11% 4,167,460 4,558 0.11% 4,970,577 7,781 0.16%Foreign offices . . . . . . . . . . . . . . . . . . 1,455,125 3,829 0.26% 990,721 2,989 0.30% 1,079,763 4,228 0.39%
Total . . . . . . . . . . . . . . . . . . . . . . 7,039,709 9,920 0.14% 5,158,181 7,547 0.15% 6,050,340 12,009 0.20%
Trading liabilities(1):Domestic offices . . . . . . . . . . . . . . . . . 2,197,851 19,634 0.89% 1,916,419 20,341 1.06% 1,953,735 22,474 1.15%Foreign offices . . . . . . . . . . . . . . . . . . 27,840 830 2.98% 9,123 120 1.32% 3,417 48 1.40%
Total . . . . . . . . . . . . . . . . . . . . . . 2,225,691 20,464 0.92% 1,925,542 20,461 1.06% 1,957,152 22,522 1.15%
Borrowings:Domestic offices . . . . . . . . . . . . . . . . . 9,170,288 54,915 0.60% 5,879,723 50,833 0.86% 6,999,912 63,926 0.91%Foreign offices . . . . . . . . . . . . . . . . . . 790,516 16,122 2.04% 787,217 17,433 2.21% 808,775 21,293 2.63%
Total . . . . . . . . . . . . . . . . . . . . . . 9,960,804 71,037 0.71% 6,666,940 68,266 1.02% 7,808,687 85,219 1.09%
Debt securities in issue:Domestic offices . . . . . . . . . . . . . . . . . 7,000,273 109,960 1.57% 6,223,653 92,481 1.49% 5,804,668 87,980 1.52%Foreign offices . . . . . . . . . . . . . . . . . . 2,819,687 9,829 0.35% 2,355,748 7,636 0.32% 1,884,813 8,132 0.43%
Total . . . . . . . . . . . . . . . . . . . . . . 9,819,960 119,789 1.22% 8,579,401 100,117 1.17% 7,689,481 96,112 1.25%
Other interest-bearing liabilities:Domestic offices . . . . . . . . . . . . . . . . . 96,873 731 0.75% 90,049 689 0.77% 81,915 683 0.83%Foreign offices . . . . . . . . . . . . . . . . . . 3,025 49 1.62% 2,898 19 0.66% 7,732 32 0.41%
Total . . . . . . . . . . . . . . . . . . . . . . 99,898 780 0.78% 92,947 708 0.76% 89,647 715 0.80%
Total interest-bearing liabilities:Domestic offices . . . . . . . . . . . . . . . . . 100,488,429 242,191 0.24% 92,150,713 218,570 0.24% 91,496,632 235,858 0.26%Foreign offices . . . . . . . . . . . . . . . . . . 27,237,239 149,380 0.55% 21,812,133 122,402 0.56% 17,229,213 108,234 0.63%
Total . . . . . . . . . . . . . . . . . . . . . . 127,725,668 ¥ 391,571 0.31% 113,962,846 ¥ 340,972 0.30% 108,725,845 ¥ 344,092 0.32%
Non-interest-bearing liabilities:Non-interest-bearing demand deposits . . . . 13,440,486 12,772,713 12,301,269Other non-interest-bearing liabilities . . . . . . 11,834,101 11,168,374 12,079,016
Total non-interest-bearingliabilities . . . . . . . . . . . . . . . . . . . . . 25,274,587 23,941,087 24,380,285
Total equity . . . . . . . . . . . . . . . . . . . . . . . . . . . . 10,113,622 7,487,625 8,020,794
Total equity and liabilities . . . . . . . . . . . . . . . . ¥163,113,877 ¥145,391,558 ¥141,126,924
Total liabilities attributable to foreign offices . . . 20.0% 18.1% 15.3%Net interest income and interest rate spread . . . . ¥1,412,651 1.19% ¥1,415,901 1.20% ¥1,418,815 1.11%
Net interest income as a percentage of totalinterest-earning assets . . . . . . . . . . . . . . . . . . . 1.17% 1.21% 1.15%
(1) The net amount of interest income on trading assets and interest expense on trading liabilities is reported as net trading income in ourconsolidated income statement.
(2) Interest income on financial assets at fair value through profit or loss is reported in net income from financial assets at fair value throughprofit or loss in our consolidated income statement.
(3) Taxable investment securities and non-taxable investment securities are not disclosed separately because the aggregate effect of theseaverage balances and interest income would not be material. In addition, the yields on tax-exempt obligations have not been calculatedon a tax equivalent basis because the effect of such calculation would not be material.
(4) Loans and advances include impaired loans and advances. The amortized portion of net loan origination fees is included in interestincome on loans and advances.
(5) Comparative information has been restated to reflect the adoption of IFRIC Interpretation 21 “Levies.” For more information, see Note 2“Summary of Significant Accounting Policies—New and Amended Accounting Standards Adopted by the SMFG Group” to ourconsolidated financial statements included elsewhere in this annual report.
A-2

Analysis of Net Interest Income
The following tables show the changes to our net interest income attributable to changes in the volume andchanges in the rates for the fiscal year ended March 31, 2015 compared to the fiscal year ended March 31, 2014and for the fiscal year ended March 31, 2014 compared to the fiscal year ended March 31, 2013.
Changes attributable to the combined impact of changes in the rates and the volume have been allocatedproportionately to the changes in the volume and changes in the rates.
Fiscal year ended March 31, 2015compared to
fiscal year ended March 31, 2014Increase / (decrease)
Fiscal year ended March 31, 2014compared to
fiscal year ended March 31, 2013Increase / (decrease)(3)
Volume Rate Net change Volume Rate Net change
(In millions)Interest income:
Interest-earning deposits with other banks:Domestic offices . . . . . . . . . . . . . . . . . . . . . . . . ¥ 690 ¥ 1,051 ¥ 1,741 ¥ 1,083 ¥ 539 ¥ 1,622Foreign offices . . . . . . . . . . . . . . . . . . . . . . . . . (779) 3,606 2,827 8,956 (2,720) 6,236
Total . . . . . . . . . . . . . . . . . . . . . . . . . . . . . (89) 4,657 4,568 10,039 (2,181) 7,858
Call loans and bills bought:Domestic offices . . . . . . . . . . . . . . . . . . . . . . . . (258) (148) (406) (162) 226 64Foreign offices . . . . . . . . . . . . . . . . . . . . . . . . . (2,845) 3,715 870 865 4,347 5,212
Total . . . . . . . . . . . . . . . . . . . . . . . . . . . . . (3,103) 3,567 464 703 4,573 5,276
Reverse repurchase agreements and cash collateralon securities borrowed:
Domestic offices . . . . . . . . . . . . . . . . . . . . . . . . 1,837 (1,301) 536 (337) 141 (196)Foreign offices . . . . . . . . . . . . . . . . . . . . . . . . . 4,379 (2,864) 1,515 2,491 (325) 2,166
Total . . . . . . . . . . . . . . . . . . . . . . . . . . . . . 6,216 (4,165) 2,051 2,154 (184) 1,970
Trading assets(1):Domestic offices . . . . . . . . . . . . . . . . . . . . . . . . 2,588 (4,045) (1,457) (10,964) 1,227 (9,737)Foreign offices . . . . . . . . . . . . . . . . . . . . . . . . . 665 471 1,136 67 (107) (40)
Total . . . . . . . . . . . . . . . . . . . . . . . . . . . . . 3,253 (3,574) (321) (10,897) 1,120 (9,777)
Financial assets at fair value through profitor loss(2):
Domestic offices . . . . . . . . . . . . . . . . . . . . . . . . (1,001) (19,906) (20,907) (125) 15,547 15,422
Held-to-maturity investments:Domestic offices . . . . . . . . . . . . . . . . . . . . . . . . (6,117) (3,677) (9,794) (2,790) (6,693) (9,483)
Available-for-sale financial assets:Domestic offices . . . . . . . . . . . . . . . . . . . . . . . . (5,262) 2,426 (2,836) (32,763) 2,488 (30,275)Foreign offices . . . . . . . . . . . . . . . . . . . . . . . . . 5,785 3,541 9,326 1,151 (2,767) (1,616)
Total . . . . . . . . . . . . . . . . . . . . . . . . . . . . . 523 5,967 6,490 (31,612) (279) (31,891)
Loans and advances:Domestic offices . . . . . . . . . . . . . . . . . . . . . . . . 8,841 (47,824) (38,983) 26,359 (89,049) (62,690)Foreign offices . . . . . . . . . . . . . . . . . . . . . . . . . 83,406 20,375 103,781 91,889 (14,608) 77,281
Total . . . . . . . . . . . . . . . . . . . . . . . . . . . . . 92,247 (27,449) 64,798 118,248 (103,657) 14,591
Total interest income:Domestic offices . . . . . . . . . . . . . . . . . . . . . . . . 1,318 (73,424) (72,106) (19,699) (75,574) (95,273)Foreign offices . . . . . . . . . . . . . . . . . . . . . . . . . 90,611 28,844 119,455 105,419 (16,180) 89,239
Total . . . . . . . . . . . . . . . . . . . . . . . . . . . . . ¥ 91,929 ¥(44,580) ¥ 47,349 ¥ 85,720 ¥ (91,754) ¥ (6,034)
A-3

Fiscal year ended March 31, 2015compared to
fiscal year ended March 31, 2014Increase / (decrease)
Fiscal year ended March 31, 2014compared to
fiscal year ended March 31, 2013Increase / (decrease)(3)
Volume Rate Net change Volume Rate Net change
(In millions)Interest expense:
Deposits:Domestic offices . . . . . . . . . . . . . . . . . . . . . . . . ¥ 1,415 ¥ (505) ¥ 910 ¥ 1,347 ¥ (4,876)¥ (3,529)Foreign offices . . . . . . . . . . . . . . . . . . . . . . . . . 23,342 925 24,267 22,831 (2,290) 20,541
Total . . . . . . . . . . . . . . . . . . . . . . . . . . . . . 24,757 420 25,177 24,178 (7,166) 17,012
Call money and bills sold:Domestic offices . . . . . . . . . . . . . . . . . . . . . . . . 394 (112) 282 211 (28) 183Foreign offices . . . . . . . . . . . . . . . . . . . . . . . . . 698 (449) 249 42 (879) (837)
Total . . . . . . . . . . . . . . . . . . . . . . . . . . . . . 1,092 (561) 531 253 (907) (654)
Repurchase agreements and cash collateral onsecurities lent:
Domestic offices . . . . . . . . . . . . . . . . . . . . . . . . 1,559 (26) 1,533 (1,148) (2,075) (3,223)Foreign offices . . . . . . . . . . . . . . . . . . . . . . . . . 1,249 (409) 840 (326) (913) (1,239)
Total . . . . . . . . . . . . . . . . . . . . . . . . . . . . . 2,808 (435) 2,373 (1,474) (2,988) (4,462)
Trading liabilities(1):Domestic offices . . . . . . . . . . . . . . . . . . . . . . . . 2,754 (3,461) (707) (423) (1,710) (2,133)Foreign offices . . . . . . . . . . . . . . . . . . . . . . . . . 440 270 710 75 (3) 72
Total . . . . . . . . . . . . . . . . . . . . . . . . . . . . . 3,194 (3,191) 3 (348) (1,713) (2,061)
Borrowings:Domestic offices . . . . . . . . . . . . . . . . . . . . . . . . 22,744 (18,662) 4,082 (9,777) (3,316) (13,093)Foreign offices . . . . . . . . . . . . . . . . . . . . . . . . . 73 (1,384) (1,311) (554) (3,306) (3,860)
Total . . . . . . . . . . . . . . . . . . . . . . . . . . . . . 22,817 (20,046) 2,771 (10,331) (6,622) (16,953)
Debt securities in issue:Domestic offices . . . . . . . . . . . . . . . . . . . . . . . . 12,006 5,473 17,479 6,270 (1,769) 4,501Foreign offices . . . . . . . . . . . . . . . . . . . . . . . . . 1,579 614 2,193 1,769 (2,265) (496)
Total . . . . . . . . . . . . . . . . . . . . . . . . . . . . . 13,585 6,087 19,672 8,039 (4,034) 4,005
Other interest-bearing liabilities:Domestic offices . . . . . . . . . . . . . . . . . . . . . . . . 52 (10) 42 65 (59) 6Foreign offices . . . . . . . . . . . . . . . . . . . . . . . . . 1 29 30 (26) 13 (13)
Total . . . . . . . . . . . . . . . . . . . . . . . . . . . . . 53 19 72 39 (46) (7)
Total interest expense:Domestic offices . . . . . . . . . . . . . . . . . . . . . . . . 40,924 (17,303) 23,621 (3,455) (13,833) (17,288)Foreign offices . . . . . . . . . . . . . . . . . . . . . . . . . 27,382 (404) 26,978 23,811 (9,643) 14,168
Total . . . . . . . . . . . . . . . . . . . . . . . . . . . . . ¥ 68,306 ¥(17,707) ¥ 50,599 ¥ 20,356 ¥ (23,476)¥ (3,120)
Net interest income:Domestic offices . . . . . . . . . . . . . . . . . . . . . . . . ¥(39,606) ¥(56,121) ¥ (95,727) ¥ (16,244)¥ (61,741)¥ (77,985)Foreign offices . . . . . . . . . . . . . . . . . . . . . . . . . 63,229 29,248 92,477 81,608 (6,537) 75,071
Total . . . . . . . . . . . . . . . . . . . . . . . . . . . . . ¥ 23,623 ¥(26,873) ¥ (3,250) ¥ 65,364 ¥ (68,278)¥ (2,914)
(1) The net amount of interest income on trading assets and interest expense on trading liabilities is reported as net trading income in ourconsolidated income statement.
(2) Interest income on financial assets at fair value through profit or loss is reported in net income from financial assets at fair value throughprofit or loss in our consolidated income statement.
(3) Comparative information has been restated to reflect the adoption of IFRIC Interpretation 21 “Levies.” For more information, see Note 2“Summary of Significant Accounting Policies—New and Amended Accounting Standards Adopted by the SMFG Group” to ourconsolidated financial statements included elsewhere in this annual report.
A-4
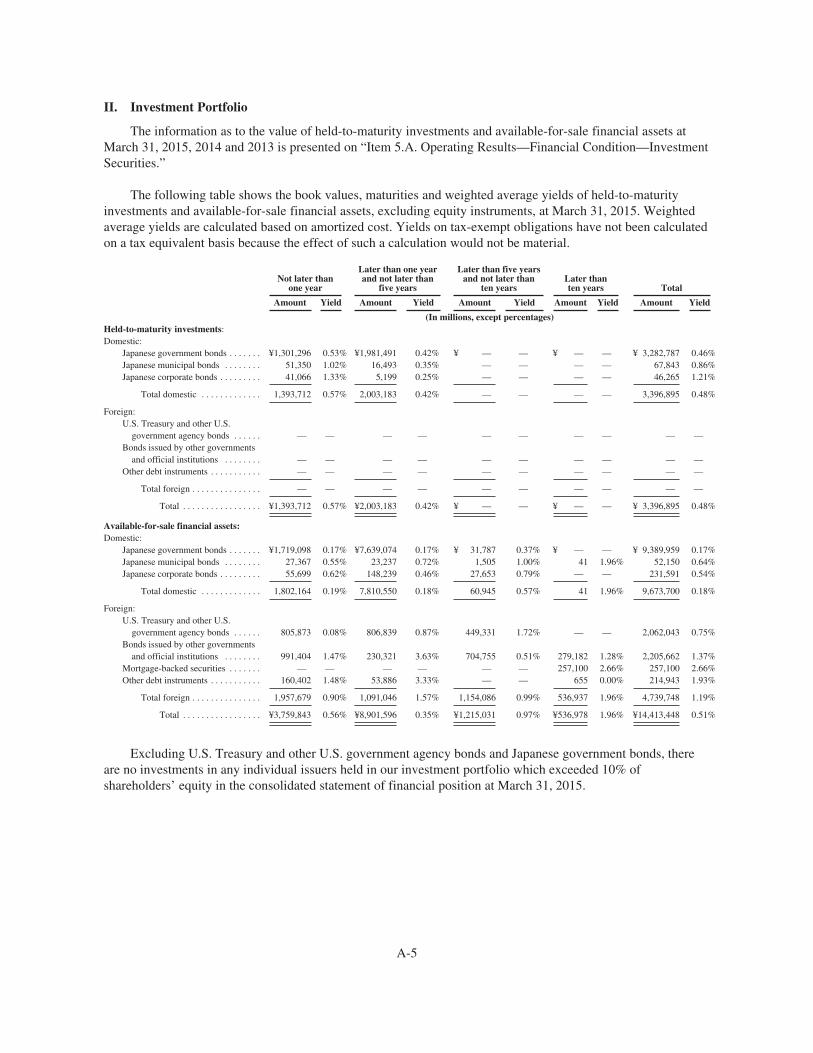
II. Investment Portfolio
The information as to the value of held-to-maturity investments and available-for-sale financial assets atMarch 31, 2015, 2014 and 2013 is presented on “Item 5.A. Operating Results—Financial Condition—InvestmentSecurities.”
The following table shows the book values, maturities and weighted average yields of held-to-maturityinvestments and available-for-sale financial assets, excluding equity instruments, at March 31, 2015. Weightedaverage yields are calculated based on amortized cost. Yields on tax-exempt obligations have not been calculatedon a tax equivalent basis because the effect of such a calculation would not be material.
Not later thanone year
Later than one yearand not later than
five years
Later than five yearsand not later than
ten yearsLater thanten years Total
Amount Yield Amount Yield Amount Yield Amount Yield Amount Yield
(In millions, except percentages)Held-to-maturity investments:Domestic:
Japanese government bonds . . . . . . . ¥1,301,296 0.53% ¥1,981,491 0.42% ¥ — — ¥ — — ¥ 3,282,787 0.46%Japanese municipal bonds . . . . . . . . 51,350 1.02% 16,493 0.35% — — — — 67,843 0.86%Japanese corporate bonds . . . . . . . . . 41,066 1.33% 5,199 0.25% — — — — 46,265 1.21%
Total domestic . . . . . . . . . . . . . 1,393,712 0.57% 2,003,183 0.42% — — — — 3,396,895 0.48%
Foreign:U.S. Treasury and other U.S.
government agency bonds . . . . . . — — — — — — — — — —Bonds issued by other governments
and official institutions . . . . . . . . — — — — — — — — — —Other debt instruments . . . . . . . . . . . — — — — — — — — — —
Total foreign . . . . . . . . . . . . . . . — — — — — — — — — —
Total . . . . . . . . . . . . . . . . . ¥1,393,712 0.57% ¥2,003,183 0.42% ¥ — — ¥ — — ¥ 3,396,895 0.48%
Available-for-sale financial assets:Domestic:
Japanese government bonds . . . . . . . ¥1,719,098 0.17% ¥7,639,074 0.17% ¥ 31,787 0.37% ¥ — — ¥ 9,389,959 0.17%Japanese municipal bonds . . . . . . . . 27,367 0.55% 23,237 0.72% 1,505 1.00% 41 1.96% 52,150 0.64%Japanese corporate bonds . . . . . . . . . 55,699 0.62% 148,239 0.46% 27,653 0.79% — — 231,591 0.54%
Total domestic . . . . . . . . . . . . . 1,802,164 0.19% 7,810,550 0.18% 60,945 0.57% 41 1.96% 9,673,700 0.18%
Foreign:U.S. Treasury and other U.S.
government agency bonds . . . . . . 805,873 0.08% 806,839 0.87% 449,331 1.72% — — 2,062,043 0.75%Bonds issued by other governments
and official institutions . . . . . . . . 991,404 1.47% 230,321 3.63% 704,755 0.51% 279,182 1.28% 2,205,662 1.37%Mortgage-backed securities . . . . . . . — — — — — — 257,100 2.66% 257,100 2.66%Other debt instruments . . . . . . . . . . . 160,402 1.48% 53,886 3.33% — — 655 0.00% 214,943 1.93%
Total foreign . . . . . . . . . . . . . . . 1,957,679 0.90% 1,091,046 1.57% 1,154,086 0.99% 536,937 1.96% 4,739,748 1.19%
Total . . . . . . . . . . . . . . . . . ¥3,759,843 0.56% ¥8,901,596 0.35% ¥1,215,031 0.97% ¥536,978 1.96% ¥14,413,448 0.51%
Excluding U.S. Treasury and other U.S. government agency bonds and Japanese government bonds, thereare no investments in any individual issuers held in our investment portfolio which exceeded 10% ofshareholders’ equity in the consolidated statement of financial position at March 31, 2015.
A-5

III. Loan Portfolio
The following table shows our outstanding loans and advances by the domicile and industry type of theborrowers at March 31, 2015, 2014, 2013, 2012 and 2011. The classification of loans and advances by industry isbased on the industry segment loan classification as defined by the Bank of Japan (“BOJ”) for regulatoryreporting purposes.
At March 31,
2015 2014 2013 2012 2011
(In millions)
Domestic:Manufacturing . . . . . . . . . . . . . . . . . . . ¥ 8,061,654 ¥ 8,018,568 ¥ 8,071,044 ¥ 8,462,004 ¥ 8,344,261Agriculture, forestry, fisheries and
mining . . . . . . . . . . . . . . . . . . . . . . . 171,855 177,012 164,420 152,128 162,727Construction . . . . . . . . . . . . . . . . . . . . 1,150,616 1,152,388 1,167,115 1,284,882 1,327,475Transportation, communications and
public enterprises . . . . . . . . . . . . . . . 5,175,949 5,086,361 4,708,870 4,414,102 4,036,780Wholesale and retail . . . . . . . . . . . . . . 5,664,385 5,505,570 5,388,032 5,480,393 5,616,084Finance and insurance . . . . . . . . . . . . . 2,869,967 2,537,347 2,715,862 2,170,776 2,568,670Real estate and goods rental and
leasing . . . . . . . . . . . . . . . . . . . . . . . 8,766,724 8,117,000 8,145,769 7,982,741 8,281,048Services . . . . . . . . . . . . . . . . . . . . . . . . 4,776,706 4,855,536 4,404,359 4,076,818 4,316,724Municipalities . . . . . . . . . . . . . . . . . . . 1,353,949 1,279,010 1,270,981 1,234,355 1,440,167Lease financing . . . . . . . . . . . . . . . . . . 2,211,773 2,133,760 2,058,284 2,056,972 2,205,451Consumer(1) . . . . . . . . . . . . . . . . . . . . . 18,817,259 19,086,241 18,834,079 19,185,574 18,552,987Others . . . . . . . . . . . . . . . . . . . . . . . . . 3,211,240 3,159,438 3,341,636 4,155,960 4,378,791
Total domestic . . . . . . . . . . . . . . . 62,232,077 61,108,231 60,270,451 60,656,705 61,231,165
Foreign:Public sector . . . . . . . . . . . . . . . . . . . . 164,495 163,685 121,611 130,426 83,109Financial institutions . . . . . . . . . . . . . . 3,880,655 3,450,482 2,500,624 2,012,751 1,794,794Commerce and industry . . . . . . . . . . . 20,010,729 16,435,047 13,502,283 10,364,685 8,949,629Lease financing . . . . . . . . . . . . . . . . . . 308,128 267,394 208,099 191,966 172,361Others . . . . . . . . . . . . . . . . . . . . . . . . . 1,375,624 947,826 793,653 706,175 528,847
Total foreign . . . . . . . . . . . . . . . . 25,739,631 21,264,434 17,126,270 13,406,003 11,528,740
Gross loans and advances . . . . . . . . . . 87,971,708 82,372,665 77,396,721 74,062,708 72,759,905Adjust: Unearned income,
unamortized premiums-net anddeferred loan fees-net . . . . . . . . . . . (206,440) (177,018) (147,186) (144,731) (152,443)
Less: Allowance for loan losses . . . . . (793,552) (950,665) (1,262,478) (1,381,164) (1,587,133)
Net loans and advances . . . . . . . . . . . . ¥86,971,716 ¥81,244,982 ¥75,987,057 ¥72,536,813 ¥71,020,329
(1) The balance in Consumer mainly consists of housing loans. The housing loan balances amounted to ¥14,087,453 million,¥14,420,225 million, ¥14,520,154 million, ¥14,574,702 million and ¥14,577,945 million at March 31, 2015, 2014, 2013, 2012 and 2011,respectively.
A-6
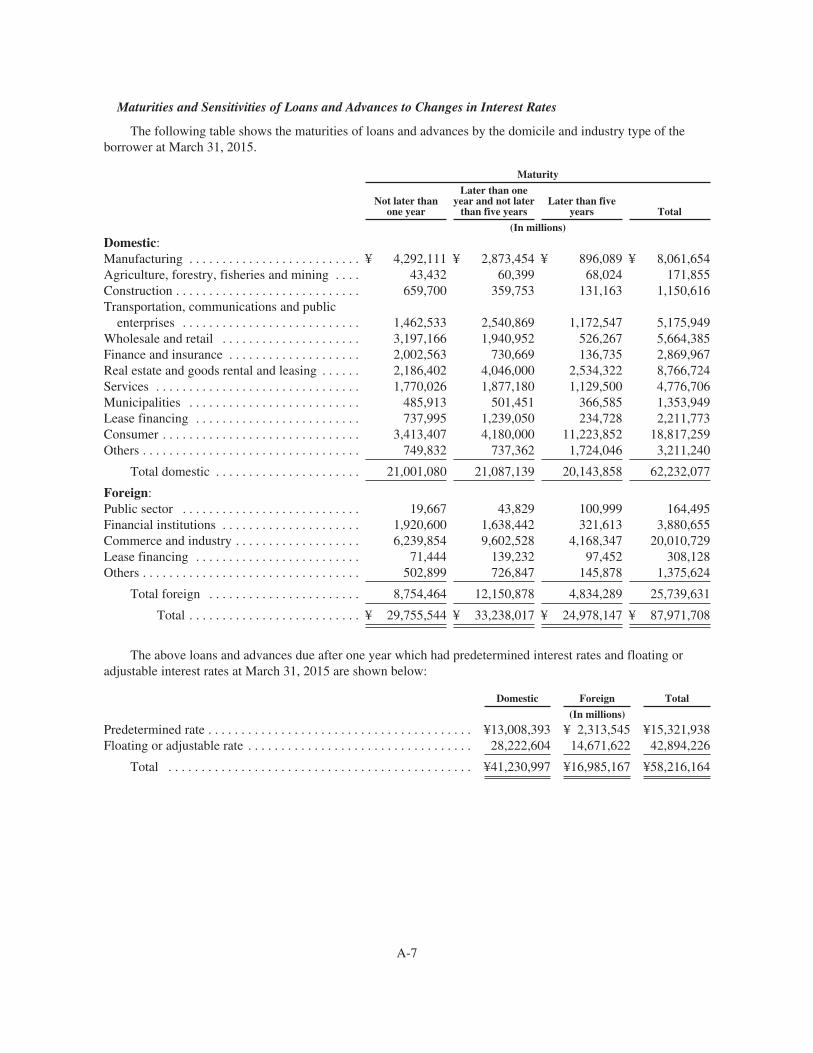
Maturities and Sensitivities of Loans and Advances to Changes in Interest Rates
The following table shows the maturities of loans and advances by the domicile and industry type of theborrower at March 31, 2015.
Maturity
Not later thanone year
Later than oneyear and not later
than five yearsLater than five
years Total
(In millions)
Domestic:Manufacturing . . . . . . . . . . . . . . . . . . . . . . . . . . ¥ 4,292,111 ¥ 2,873,454 ¥ 896,089 ¥ 8,061,654Agriculture, forestry, fisheries and mining . . . . 43,432 60,399 68,024 171,855Construction . . . . . . . . . . . . . . . . . . . . . . . . . . . . 659,700 359,753 131,163 1,150,616Transportation, communications and public
enterprises . . . . . . . . . . . . . . . . . . . . . . . . . . . 1,462,533 2,540,869 1,172,547 5,175,949Wholesale and retail . . . . . . . . . . . . . . . . . . . . . 3,197,166 1,940,952 526,267 5,664,385Finance and insurance . . . . . . . . . . . . . . . . . . . . 2,002,563 730,669 136,735 2,869,967Real estate and goods rental and leasing . . . . . . 2,186,402 4,046,000 2,534,322 8,766,724Services . . . . . . . . . . . . . . . . . . . . . . . . . . . . . . . 1,770,026 1,877,180 1,129,500 4,776,706Municipalities . . . . . . . . . . . . . . . . . . . . . . . . . . 485,913 501,451 366,585 1,353,949Lease financing . . . . . . . . . . . . . . . . . . . . . . . . . 737,995 1,239,050 234,728 2,211,773Consumer . . . . . . . . . . . . . . . . . . . . . . . . . . . . . . 3,413,407 4,180,000 11,223,852 18,817,259Others . . . . . . . . . . . . . . . . . . . . . . . . . . . . . . . . . 749,832 737,362 1,724,046 3,211,240
Total domestic . . . . . . . . . . . . . . . . . . . . . . 21,001,080 21,087,139 20,143,858 62,232,077
Foreign:Public sector . . . . . . . . . . . . . . . . . . . . . . . . . . . 19,667 43,829 100,999 164,495Financial institutions . . . . . . . . . . . . . . . . . . . . . 1,920,600 1,638,442 321,613 3,880,655Commerce and industry . . . . . . . . . . . . . . . . . . . 6,239,854 9,602,528 4,168,347 20,010,729Lease financing . . . . . . . . . . . . . . . . . . . . . . . . . 71,444 139,232 97,452 308,128Others . . . . . . . . . . . . . . . . . . . . . . . . . . . . . . . . . 502,899 726,847 145,878 1,375,624
Total foreign . . . . . . . . . . . . . . . . . . . . . . . 8,754,464 12,150,878 4,834,289 25,739,631
Total . . . . . . . . . . . . . . . . . . . . . . . . . . ¥ 29,755,544 ¥ 33,238,017 ¥ 24,978,147 ¥ 87,971,708
The above loans and advances due after one year which had predetermined interest rates and floating oradjustable interest rates at March 31, 2015 are shown below:
Domestic Foreign Total
(In millions)
Predetermined rate . . . . . . . . . . . . . . . . . . . . . . . . . . . . . . . . . . . . . . . . ¥13,008,393 ¥ 2,313,545 ¥15,321,938Floating or adjustable rate . . . . . . . . . . . . . . . . . . . . . . . . . . . . . . . . . . 28,222,604 14,671,622 42,894,226
Total . . . . . . . . . . . . . . . . . . . . . . . . . . . . . . . . . . . . . . . . . . . . . . ¥41,230,997 ¥16,985,167 ¥58,216,164
A-7
Impaired Loans and Advances
Our credit risk elements analyzed by categories for loans and advances differ from those required by theU.S. Securities and Exchange Commission. Our impaired loans and advances are comprised of “potentiallybankrupt, effectively bankrupt and bankrupt (loans and advances),” “past due three months or more (loans),”“restructured (loans)” and “other impaired (loans and advances).” “Potentially bankrupt, effectively bankrupt andbankrupt (loans and advances)” comprises of loans and advances to the borrowers that are perceived to have ahigh risk of falling into bankruptcy, may not have been legally or formally declared bankrupt but are essentiallybankrupt, or have been legally or formally declared bankrupt. Loans classified as “past due three months or more(loans)” represent those loans that are three months or more past due as to principal or interest, which are notincluded in “potentially bankrupt, effectively bankrupt and bankrupt (loans and advances).” The category“restructured (loans)” comprises of loans not included above for which the terms of the loans have been modifiedto grant concessions because of problems with the borrower. Examples of modifications to grant concessionsinclude reductions of the original interest rate, deferrals of interest payments, deductions of the contractualrepayment amounts and extensions of principal repayments such as the extension of the repayment date and thesuspension of contracted repayments. “Other impaired (loans and advances)” represent impaired loans andadvances, which are not included in “potentially bankrupt, effectively bankrupt and bankrupt (loans andadvances),” “past due three months or more (loans),” or “restructured (loans),” but for which information aboutcredit problems cause management to classify them as impaired loans and advances. All loans and advances forwhich management has serious doubts about the ability of the borrowers to comply in the near future with therepayment terms are included in impaired loans and advances.
An allowance is recorded if there is objective evidence of impairment and the carrying value of the loansand advances exceeds the present value of their estimated future cash flows discounted at the original effectiveinterest rate. Cash receipts on impaired loans and advances are recorded as a credit to the balance of loans andadvances on the statement of financial position. To the extent that cash receipts are different from expectationsbuilt into the calculation of the recoverable amount of the loans and advances, the amount of allowance for loanlosses is revised. In accordance with IFRS, the accrual of interest as per the contractual terms is discontinuedwhen loans and advances are determined to be impaired. Interest income recognized in the consolidated incomestatement on impaired loans and advances represents the accretion of the net present value of the written downamount due to the passage of time based on the original effective interest rate of the loans and advances.
A-8

The following table shows the distribution of impaired loans and advances by “potentially bankrupt,effectively bankrupt and bankrupt (loans and advances),” “past due three months or more (loans),” “restructured(loans),” and “other impaired (loans and advances)” at March 31, 2015, 2014, 2013, 2012 and 2011 by thedomicile and industry type of the borrowers.
At March 31,
2015 2014 2013 2012 2011
(In millions)Potentially bankrupt, effectively bankrupt
and bankrupt (loans and advances):Domestic:
Manufacturing . . . . . . . . . . . . . . . . . . ¥ 149,686 ¥ 183,257 ¥ 215,600 ¥ 187,982 ¥ 211,597Agriculture, forestry, fisheries and
mining . . . . . . . . . . . . . . . . . . . . . . 7,146 3,251 5,210 5,295 6,635Construction . . . . . . . . . . . . . . . . . . . . 36,903 69,144 101,255 118,413 120,696Transportation, communications and
public enterprises . . . . . . . . . . . . . . 52,168 56,782 109,449 68,768 59,775Wholesale and retail . . . . . . . . . . . . . . 156,753 208,491 232,779 225,399 243,346Finance and insurance . . . . . . . . . . . . 9,551 13,378 15,822 13,350 11,496Real estate and goods rental and
leasing . . . . . . . . . . . . . . . . . . . . . . 198,714 291,665 449,163 499,485 534,596Services . . . . . . . . . . . . . . . . . . . . . . . 161,384 192,191 203,197 213,142 249,093Lease financing . . . . . . . . . . . . . . . . . 18,522 21,079 17,030 10,742 27,716Consumer . . . . . . . . . . . . . . . . . . . . . . 223,464 238,563 270,060 312,181 297,732Others . . . . . . . . . . . . . . . . . . . . . . . . . 43,443 59,812 69,859 67,174 55,909
Total domestic . . . . . . . . . . . . . . . . 1,057,734 1,337,613 1,689,424 1,721,931 1,818,591
Foreign:Public sector . . . . . . . . . . . . . . . . . . . . 14 14 14 14 14Financial institutions . . . . . . . . . . . . . 19,720 2,647 6,191 19,383 42,350Commerce and industry . . . . . . . . . . . 146,821 131,254 178,022 162,509 128,534Lease financing . . . . . . . . . . . . . . . . . 8,969 8,623 7,522 4,140 5,037Others . . . . . . . . . . . . . . . . . . . . . . . . . 6,152 4,566 2,271 3,019 3,831
Total foreign . . . . . . . . . . . . . . . . . . 181,676 147,104 194,020 189,065 179,766
Total . . . . . . . . . . . . . . . . . . . . . . 1,239,410 1,484,717 1,883,444 1,910,996 1,998,357
Past due three months or more (loans):Domestic . . . . . . . . . . . . . . . . . . . . . . . . . . 23,586 25,959 27,102 32,069 40,699Foreign . . . . . . . . . . . . . . . . . . . . . . . . . . . . 398 437 557 1,130 1,336
Total . . . . . . . . . . . . . . . . . . . . . . 23,984 26,396 27,659 33,199 42,035
Restructured (loans):Domestic . . . . . . . . . . . . . . . . . . . . . . . . . . 144,628 247,351 337,494 390,060 296,751Foreign . . . . . . . . . . . . . . . . . . . . . . . . . . . . 43,330 37,475 29,650 24,644 59,296
Total . . . . . . . . . . . . . . . . . . . . . . 187,958 284,826 367,144 414,704 356,047
Other impaired (loans and advances):Domestic . . . . . . . . . . . . . . . . . . . . . . . . . . 140,858 152,873 204,775 255,615 252,457Foreign . . . . . . . . . . . . . . . . . . . . . . . . . . . . 5,892 1 119 2,588 527
Total . . . . . . . . . . . . . . . . . . . . . . 146,750 152,874 204,894 258,203 252,984
Gross impaired loans andadvances . . . . . . . . . . . . . 1,598,102 1,948,813 2,483,141 2,617,102 2,649,423
Less: Allowance for loanlosses for impaired loansand advances . . . . . . . . . (699,207) (857,095) (1,144,130) (1,234,299) (1,395,659)
Net impaired loans andadvances . . . . . . . . . . . . . ¥ 898,895 ¥1,091,718 ¥ 1,339,011 ¥ 1,382,803 ¥ 1,253,764
A-9

Interest Foregone on Impaired Loans and Advances
Interest income which would have been accrued at the original terms on domestic impaired loans andadvances during the fiscal year ended March 31, 2015 was ¥42.6 billion, of which ¥23.1 billion was included inprofit or loss for the fiscal year then ended. Interest income which would have been accrued at the original termson foreign impaired loans and advances during the fiscal year ended March 31, 2015 was ¥0.8 billion, of which¥0.4 billion was included in profit or loss for the fiscal year then ended.
Cross-border Outstanding
Cross-border outstandings are defined as loans, acceptances, interest-earning deposits with other banks,other interest-earning investments and any other monetary assets denominated in Japanese yen or other non-localcurrencies. Local currency outstandings are netted out from cross-border outstandings. This cross-borderdisclosure is based on the reports to the BOJ required under Japanese foreign exchange-related laws. Thefollowing table lists the country for which cross-border outstandings exceeded 0.75% of consolidated total assetsat March 31, 2015. There were no cross-border outstandings to borrowers in any foreign country which in totalexceeded 0.75% of consolidated total assets at March 31, 2014 and 2013.
At March 31, 2015
Publicinstitutions Banks Others Total
% of totalassets
Undrawncommitments
(In millions, except percentages)
United Kingdom . . . . . . . . . . . . . . . . ¥7,483 ¥775,915 ¥1,007,531 ¥1,790,929 0.99% ¥1,155,306
Loan Concentrations
At March 31, 2015, there were no concentrations of loans and advances to a single industry group ofborrowers, as defined by the BOJ industry segment loan and advance classifications, which exceeded 10% of ourconsolidated total loans and advances, except for loans and advances in a category disclosed in the table ofoutstanding loans and advances above.
A-10

IV. Summary of Loan Loss Experience
The following table shows an analysis of our loan loss experience by the borrowers’ domicile and industrytype for the fiscal years ended March 31, 2015, 2014, 2013, 2012 and 2011.
For the fiscal year ended March 31,
2015 2014 2013 2012 2011
(In millions, except percentages)
Allowance for loan losses at beginning of period . . . . . . . . . . . . . . . . . . . ¥950,665 ¥1,262,478 ¥1,381,164 ¥1,587,133 ¥1,533,555Provision (credit) for loan losses . . . . . . . . . . . . . . . . . . . . . . . . . . . . . . . 79,552 (25,806) 138,375 144,022 259,292Charge-offs:Domestic:
Manufacturing . . . . . . . . . . . . . . . . . . . . . . . . . . . . . . . . . . . . . . . . . . 26,516 25,610 16,037 46,229 27,355Agriculture, forestry, fisheries and mining . . . . . . . . . . . . . . . . . . . . 112 187 553 173 372Construction . . . . . . . . . . . . . . . . . . . . . . . . . . . . . . . . . . . . . . . . . . . 8,593 20,958 7,848 14,204 12,190Transportation, communications and public enterprises . . . . . . . . . . 8,662 5,309 7,062 11,296 26,126Wholesale and retail . . . . . . . . . . . . . . . . . . . . . . . . . . . . . . . . . . . . . 27,357 27,944 18,062 64,492 29,602Finance and insurance . . . . . . . . . . . . . . . . . . . . . . . . . . . . . . . . . . . . 1,117 533 354 679 172Real estate and goods rental and leasing . . . . . . . . . . . . . . . . . . . . . . 54,003 73,025 36,003 61,683 33,371Services . . . . . . . . . . . . . . . . . . . . . . . . . . . . . . . . . . . . . . . . . . . . . . . 21,143 30,970 17,325 35,498 13,078Lease financing . . . . . . . . . . . . . . . . . . . . . . . . . . . . . . . . . . . . . . . . . 1,433 1,582 3,689 3,319 1,364Consumer . . . . . . . . . . . . . . . . . . . . . . . . . . . . . . . . . . . . . . . . . . . . . 88,795 93,616 127,804 64,329 29,481Others . . . . . . . . . . . . . . . . . . . . . . . . . . . . . . . . . . . . . . . . . . . . . . . . 2,932 3,300 6,400 4,705 2,606
Total domestic . . . . . . . . . . . . . . . . . . . . . . . . . . . . . . . . . . . . . . 240,663 283,034 241,137 306,607 175,717
Foreign:Public sector . . . . . . . . . . . . . . . . . . . . . . . . . . . . . . . . . . . . . . . . . . . — — — — 600Financial institutions . . . . . . . . . . . . . . . . . . . . . . . . . . . . . . . . . . . . . 1,017 599 4,063 14,784 9,332Commerce and industry . . . . . . . . . . . . . . . . . . . . . . . . . . . . . . . . . . 4,571 14,959 13,735 33,173 13,087Lease financing . . . . . . . . . . . . . . . . . . . . . . . . . . . . . . . . . . . . . . . . . 167 1,292 2,060 38 15Others . . . . . . . . . . . . . . . . . . . . . . . . . . . . . . . . . . . . . . . . . . . . . . . . 3,478 2,797 3,203 623 1,010
Total foreign . . . . . . . . . . . . . . . . . . . . . . . . . . . . . . . . . . . . . . . 9,233 19,647 23,061 48,618 24,044
Total . . . . . . . . . . . . . . . . . . . . . . . . . . . . . . . . . . . . . . . . . 249,896 302,681 264,198 355,225 199,761
Recoveries:Domestic:
Manufacturing . . . . . . . . . . . . . . . . . . . . . . . . . . . . . . . . . . . . . . . . . . 62 12 14 252 195Agriculture, forestry, fisheries and mining . . . . . . . . . . . . . . . . . . . . — — — — 3Construction . . . . . . . . . . . . . . . . . . . . . . . . . . . . . . . . . . . . . . . . . . . 17 16 21 64 64Transportation, communications and public enterprises . . . . . . . . . . 14 3 12 52 241Wholesale and retail . . . . . . . . . . . . . . . . . . . . . . . . . . . . . . . . . . . . . 72 19 22 328 266Finance and insurance . . . . . . . . . . . . . . . . . . . . . . . . . . . . . . . . . . . . 1 — 19 3 1Real estate and goods rental and leasing . . . . . . . . . . . . . . . . . . . . . . 47 20 19 283 97Services . . . . . . . . . . . . . . . . . . . . . . . . . . . . . . . . . . . . . . . . . . . . . . . 63 33 16 142 65Consumer . . . . . . . . . . . . . . . . . . . . . . . . . . . . . . . . . . . . . . . . . . . . . 9,234 9,186 9,976 3,453 1,648Others . . . . . . . . . . . . . . . . . . . . . . . . . . . . . . . . . . . . . . . . . . . . . . . . 7 4 4 18 44
Total domestic . . . . . . . . . . . . . . . . . . . . . . . . . . . . . . . . . . . . . . 9,517 9,293 10,103 4,595 2,624
Foreign:Public sector . . . . . . . . . . . . . . . . . . . . . . . . . . . . . . . . . . . . . . . . . . . — — — — 6Financial institutions . . . . . . . . . . . . . . . . . . . . . . . . . . . . . . . . . . . . . — 25 2 3 —Commerce and industry . . . . . . . . . . . . . . . . . . . . . . . . . . . . . . . . . . 14 3 18 187 117Others . . . . . . . . . . . . . . . . . . . . . . . . . . . . . . . . . . . . . . . . . . . . . . . . 366 334 313 17 67
Total foreign . . . . . . . . . . . . . . . . . . . . . . . . . . . . . . . . . . . . . . . 380 362 333 207 190
Total . . . . . . . . . . . . . . . . . . . . . . . . . . . . . . . . . . . . . . . . . 9,897 9,655 10,436 4,802 2,814
Net charge-offs . . . . . . . . . . . . . . . . . . . . . . . . . . . . . . . . . . . . . . . . . . . . . 239,999 293,026 253,762 350,423 196,947Others(1) . . . . . . . . . . . . . . . . . . . . . . . . . . . . . . . . . . . . . . . . . . . . . . . . . . . 3,334 7,019 (3,299) 432 (8,767)
Allowance for loan losses at end of period . . . . . . . . . . . . . . . . . . . . . . . . ¥793,552 ¥ 950,665 ¥1,262,478 ¥1,381,164 ¥1,587,133
Allowance for loan losses applicable to foreign activities:Balance at beginning of period . . . . . . . . . . . . . . . . . . . . . . . . . . . . . ¥ 73,030 ¥ 74,868 ¥ 87,344 ¥ 108,612 ¥ 121,797
Balance at end of period . . . . . . . . . . . . . . . . . . . . . . . . . . . . . . . . . . ¥100,783 ¥ 73,030 ¥ 74,868 ¥ 87,344 ¥ 108,612
Provision for loan losses . . . . . . . . . . . . . . . . . . . . . . . . . . . . . . . . . . ¥ 32,712 ¥ 10,462 ¥ 1,692 ¥ 30,675 ¥ 19,501
Ratio of net charge-offs to average loans outstanding duringthe period . . . . . . . . . . . . . . . . . . . . . . . . . . . . . . . . . . . . . . . . . . . . . . . 0.28% 0.36% 0.34% 0.47% 0.27%
(1) Others mainly include foreign exchange translations for the fiscal years ended March 31, 2015 and 2014 and 2011, whereas the amount for thefiscal year ended March 31, 2013 mainly includes foreign exchange translations as well as the exclusion of the allowance for loan losses relatedto ORIX Credit Corporation, as the Bank transferred all of its shares of ORIX Credit Corporation to ORIX Corporation in June 2012.
A-11
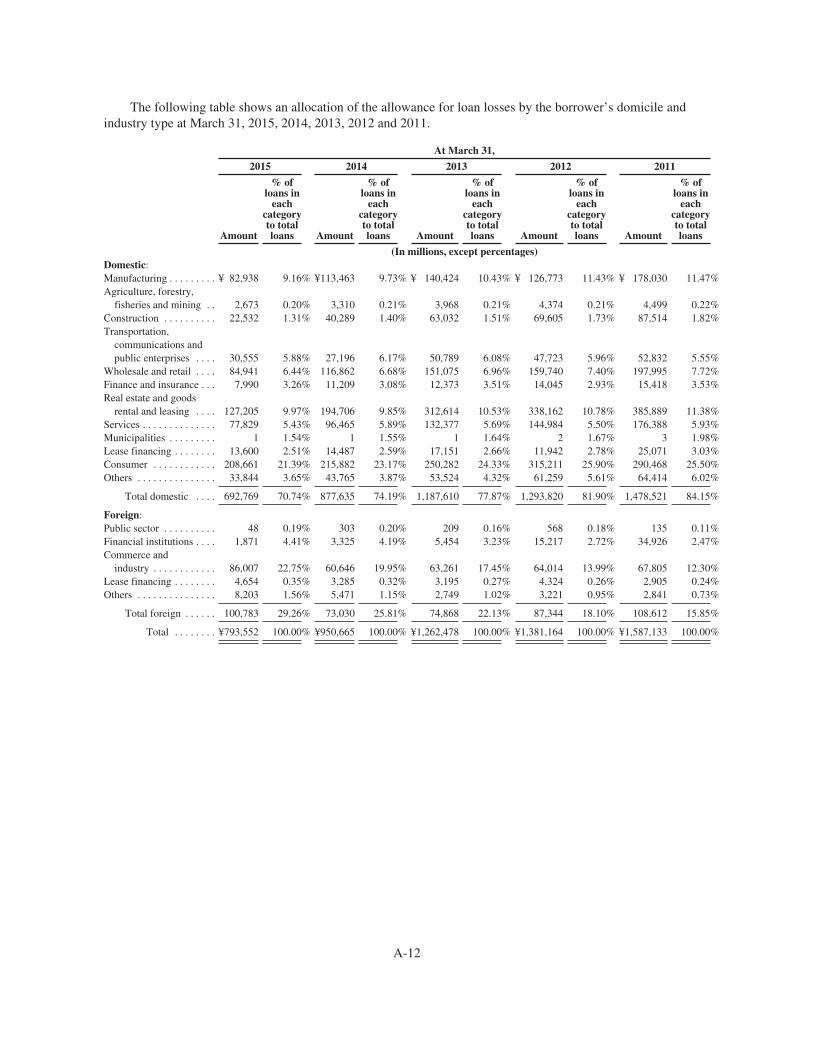
The following table shows an allocation of the allowance for loan losses by the borrower’s domicile andindustry type at March 31, 2015, 2014, 2013, 2012 and 2011.
At March 31,
2015 2014 2013 2012 2011
Amount
% ofloans in
eachcategoryto totalloans Amount
% ofloans in
eachcategoryto totalloans Amount
% ofloans in
eachcategoryto totalloans Amount
% ofloans in
eachcategoryto totalloans Amount
% ofloans in
eachcategoryto totalloans
(In millions, except percentages)Domestic:Manufacturing . . . . . . . . . ¥ 82,938 9.16% ¥113,463 9.73% ¥ 140,424 10.43% ¥ 126,773 11.43% ¥ 178,030 11.47%Agriculture, forestry,
fisheries and mining . . 2,673 0.20% 3,310 0.21% 3,968 0.21% 4,374 0.21% 4,499 0.22%Construction . . . . . . . . . . 22,532 1.31% 40,289 1.40% 63,032 1.51% 69,605 1.73% 87,514 1.82%Transportation,
communications andpublic enterprises . . . . 30,555 5.88% 27,196 6.17% 50,789 6.08% 47,723 5.96% 52,832 5.55%
Wholesale and retail . . . . 84,941 6.44% 116,862 6.68% 151,075 6.96% 159,740 7.40% 197,995 7.72%Finance and insurance . . . 7,990 3.26% 11,209 3.08% 12,373 3.51% 14,045 2.93% 15,418 3.53%Real estate and goods
rental and leasing . . . . 127,205 9.97% 194,706 9.85% 312,614 10.53% 338,162 10.78% 385,889 11.38%Services . . . . . . . . . . . . . . 77,829 5.43% 96,465 5.89% 132,377 5.69% 144,984 5.50% 176,388 5.93%Municipalities . . . . . . . . . 1 1.54% 1 1.55% 1 1.64% 2 1.67% 3 1.98%Lease financing . . . . . . . . 13,600 2.51% 14,487 2.59% 17,151 2.66% 11,942 2.78% 25,071 3.03%Consumer . . . . . . . . . . . . 208,661 21.39% 215,882 23.17% 250,282 24.33% 315,211 25.90% 290,468 25.50%Others . . . . . . . . . . . . . . . 33,844 3.65% 43,765 3.87% 53,524 4.32% 61,259 5.61% 64,414 6.02%
Total domestic . . . . 692,769 70.74% 877,635 74.19% 1,187,610 77.87% 1,293,820 81.90% 1,478,521 84.15%
Foreign:Public sector . . . . . . . . . . 48 0.19% 303 0.20% 209 0.16% 568 0.18% 135 0.11%Financial institutions . . . . 1,871 4.41% 3,325 4.19% 5,454 3.23% 15,217 2.72% 34,926 2.47%Commerce and
industry . . . . . . . . . . . . 86,007 22.75% 60,646 19.95% 63,261 17.45% 64,014 13.99% 67,805 12.30%Lease financing . . . . . . . . 4,654 0.35% 3,285 0.32% 3,195 0.27% 4,324 0.26% 2,905 0.24%Others . . . . . . . . . . . . . . . 8,203 1.56% 5,471 1.15% 2,749 1.02% 3,221 0.95% 2,841 0.73%
Total foreign . . . . . . 100,783 29.26% 73,030 25.81% 74,868 22.13% 87,344 18.10% 108,612 15.85%
Total . . . . . . . . ¥793,552 100.00% ¥950,665 100.00% ¥1,262,478 100.00% ¥1,381,164 100.00% ¥1,587,133 100.00%
A-12

V. Deposits
The following table shows the average amount of, and the average rate paid on, the following depositcategories for the fiscal years ended March 31, 2015, 2014 and 2013.
For the fiscal year ended March 31,
2015 2014 2013
Averageamount
Averagerate
Averageamount
Averagerate
Averageamount
Averagerate
(In millions, except percentages)
Domestic offices:Non-interest-bearing demand
deposits . . . . . . . . . . . . . . . . . . . . ¥ 12,747,566 — ¥ 12,258,970 — ¥11,878,091 —Interest-bearing demand deposits . . 38,953,418 0.02% 37,248,316 0.02% 34,555,344 0.02%Deposits at notice . . . . . . . . . . . . . . 747,898 0.03% 809,233 0.03% 852,078 0.02%Time deposits . . . . . . . . . . . . . . . . . . 24,202,595 0.10% 24,962,120 0.10% 25,333,058 0.11%Negotiable certificates of deposit . . 5,969,374 0.09% 5,385,616 0.11% 6,279,012 0.14%Others . . . . . . . . . . . . . . . . . . . . . . . 4,524,551 0.24% 3,970,880 0.22% 3,432,600 0.23%
Total domestic offices . . . . . . . 87,145,402 84,635,135 82,330,183
Foreign offices:Non-interest-bearing demand
deposits . . . . . . . . . . . . . . . . . . . . 692,920 — 513,743 — 423,178 —Interest-bearing demand deposits . . 1,277,325 0.26% 1,062,723 0.16% 986,801 0.21%Deposits at notice . . . . . . . . . . . . . . 7,285,133 0.29% 5,896,158 0.30% 4,426,059 0.31%Time deposits . . . . . . . . . . . . . . . . . . 3,672,870 1.46% 2,730,564 1.42% 2,041,210 1.24%Negotiable certificates of deposit . . 8,922,100 0.42% 7,210,274 0.45% 5,231,609 0.55%Others . . . . . . . . . . . . . . . . . . . . . . . 106,491 1.09% 114,868 1.04% 116,135 1.44%
Total foreign offices . . . . . . . . 21,956,839 17,528,330 13,224,992
Total . . . . . . . . . . . . . . . . . ¥109,102,241 ¥102,163,465 ¥95,555,175
Deposits at notice represent interest-bearing demand deposits which require the depositor to give two ormore days notice in advance of withdrawal.
The total amount of deposits by foreign depositors included in domestic offices for the fiscal years endedMarch 31, 2015, 2014 and 2013 were ¥1,748,689 million, ¥1,318,749 million and ¥992,016 million, respectively.
A-13

At March 31, 2015, the balances and remaining maturities of time deposits and negotiable certificates ofdeposit issued by domestic offices in amounts of ¥10 million (approximately $83,229 at the median exchangerate for buying and selling spot dollars for yen by telegraphic transfer as determined by the Bank at the end of thecurrent fiscal year) or more and total foreign deposits issued in amounts of $100,000 or more are shown in thefollowing table.
Time deposits
Negotiablecertificates of
deposit Total
(In millions)
Domestic offices:Not later than three months . . . . . . . . . . . . . . . . . . . . . . . . . . . . . . . . . . ¥ 3,199,893 ¥4,445,072 ¥ 7,644,965Later than three months and not later than six months . . . . . . . . . . . . . 1,716,574 468,175 2,184,749Later than six months and not later than one year . . . . . . . . . . . . . . . . 4,953,456 713,331 5,666,787Later than one year . . . . . . . . . . . . . . . . . . . . . . . . . . . . . . . . . . . . . . . . 2,744,076 79,284 2,823,360
Total . . . . . . . . . . . . . . . . . . . . . . . . . . . . . . . . . . . . . . . . . . . . . . . ¥12,613,999 ¥5,705,862 ¥18,319,861
Foreign offices . . . . . . . . . . . . . . . . . . . . . . . . . . . . . . . . . . . . . . . . . . . ¥ 4,902,880 ¥8,120,026 ¥13,022,906
VI. Return on Equity and Assets
The following table shows the ratio of return on equity and assets for the fiscal years ended March 31, 2015,2014 and 2013.
For the fiscal year ended March 31,
2015 2014(2) 2013(2)
Return on average total assets . . . . . . . . . . . . . . . . . . . . . . . . . . . . . . . . . . . . . . . . 0.4% 0.5% 0.4%Return on average shareholders’ equity . . . . . . . . . . . . . . . . . . . . . . . . . . . . . . . . 7.3% 14.0% 9.0%Dividends payout ratio(1):
Basic . . . . . . . . . . . . . . . . . . . . . . . . . . . . . . . . . . . . . . . . . . . . . . . . . . . . . . . 27.8% 22.3% 25.3%Diluted . . . . . . . . . . . . . . . . . . . . . . . . . . . . . . . . . . . . . . . . . . . . . . . . . . . . . . 27.8% 22.3% 25.3%
Average shareholders’ equity to average total assets . . . . . . . . . . . . . . . . . . . . . . 5.1% 3.8% 4.2%
(1) Dividends declared per common share as a percentage of net profit per share.(2) Comparative information has been restated to reflect the adoption of IFRIC Interpretation 21 “Levies.” For more information, see Note 2
“Summary of Significant Accounting Policies—New and Amended Accounting Standards Adopted by the SMFG Group” to ourconsolidated financial statements included elsewhere in this annual report.
A-14

VII. Short-Term Borrowings
The following table shows certain additional information with respect to our short-term borrowings for thefiscal years ended March 31, 2015, 2014 and 2013.
For the fiscal year ended March 31,
2015 2014 2013
(In millions, except percentages)
Call money, and payables under repurchase agreements andsecurities lending transactions:
Average balance outstanding during the period . . . . . . . . . . . . . ¥ 9,957,560 ¥ 7,307,264 ¥7,926,972Maximum balance outstanding at any month-end during the
period . . . . . . . . . . . . . . . . . . . . . . . . . . . . . . . . . . . . . . . . . . . . 14,693,207 11,153,504 9,935,203Balance at end of period . . . . . . . . . . . . . . . . . . . . . . . . . . . . . . . 14,693,207 11,153,504 9,464,679Weighted average interest rate during the period . . . . . . . . . . . . 0.14% 0.15% 0.20%Weighted average interest rate on balance at end of period . . . . 0.11% 0.10% 0.19%
Commercial paper:Average balance outstanding during the period . . . . . . . . . . . . . 4,223,418 3,659,627 3,087,708Maximum balance outstanding at any month-end during the
period . . . . . . . . . . . . . . . . . . . . . . . . . . . . . . . . . . . . . . . . . . . . 4,839,788 3,843,285 3,190,675Balance at end of period . . . . . . . . . . . . . . . . . . . . . . . . . . . . . . . 4,813,902 3,669,912 3,190,675Weighted average interest rate during the period . . . . . . . . . . . . 0.21% 0.21% 0.25%Weighted average interest rate on balance at end of period . . . . 0.24% 0.22% 0.21%
Short-term borrowings:Average balance outstanding during the period . . . . . . . . . . . . . 5,342,390 1,945,575 4,136,273Maximum balance outstanding at any month-end during the
period . . . . . . . . . . . . . . . . . . . . . . . . . . . . . . . . . . . . . . . . . . . . 6,802,740 3,092,892 6,056,549Balance at end of period . . . . . . . . . . . . . . . . . . . . . . . . . . . . . . . 6,746,249 3,092,892 2,467,661Weighted average interest rate during the period . . . . . . . . . . . . 0.18% 0.38% 0.32%Weighted average interest rate on balance at end of period . . . . 0.14% 0.22% 0.40%
A-15

INDEX TO CONSOLIDATED FINANCIAL STATEMENTS
The following consolidated financial statements and the reports thereon by its independent registered publicaccounting firm are filed as part of this annual report:
Page
Report of Independent Registered Public Accounting Firm . . . . . . . . . . . . . . . . . . . . . . . . . . . . . . . . . . . . . . F-3Consolidated Financial Statements
Consolidated Statement of Financial Position at March 31, 2015, 2014 and April 1, 2013 . . . . . . . . . . F-5Consolidated Income Statement for the Fiscal Years Ended March 31, 2015, 2014 and 2013 . . . . . . . F-6Consolidated Statement of Comprehensive Income
for the Fiscal Years Ended March 31, 2015, 2014 and 2013 . . . . . . . . . . . . . . . . . . . . . . . . . . . . . . . F-7Consolidated Statement of Changes in Equity
for the Fiscal Years Ended March 31, 2015, 2014 and 2013 . . . . . . . . . . . . . . . . . . . . . . . . . . . . . . . F-8Consolidated Statement of Cash Flows
for the Fiscal Years Ended March 31, 2015, 2014 and 2013 . . . . . . . . . . . . . . . . . . . . . . . . . . . . . . . F-9Notes to Consolidated Financial Statements . . . . . . . . . . . . . . . . . . . . . . . . . . . . . . . . . . . . . . . . . . . . . . F-10
1 General Information . . . . . . . . . . . . . . . . . . . . . . . . . . . . . . . . . . . . . . . . . . . . . . . . . . . . . . . . . . F-102 Summary of Significant Accounting Policies . . . . . . . . . . . . . . . . . . . . . . . . . . . . . . . . . . . . . . F-103 Critical Accounting Estimates and Judgments . . . . . . . . . . . . . . . . . . . . . . . . . . . . . . . . . . . . . F-294 Segment Analysis . . . . . . . . . . . . . . . . . . . . . . . . . . . . . . . . . . . . . . . . . . . . . . . . . . . . . . . . . . . F-325 Cash and Deposits with Banks . . . . . . . . . . . . . . . . . . . . . . . . . . . . . . . . . . . . . . . . . . . . . . . . . F-396 Trading Assets . . . . . . . . . . . . . . . . . . . . . . . . . . . . . . . . . . . . . . . . . . . . . . . . . . . . . . . . . . . . . . F-407 Derivative Financial Instruments . . . . . . . . . . . . . . . . . . . . . . . . . . . . . . . . . . . . . . . . . . . . . . . . F-408 Financial Assets at Fair Value Through Profit or Loss . . . . . . . . . . . . . . . . . . . . . . . . . . . . . . . F-439 Investment Securities . . . . . . . . . . . . . . . . . . . . . . . . . . . . . . . . . . . . . . . . . . . . . . . . . . . . . . . . . F-4410 Loans and Advances . . . . . . . . . . . . . . . . . . . . . . . . . . . . . . . . . . . . . . . . . . . . . . . . . . . . . . . . . F-4511 Investments in Associates and Joint Ventures . . . . . . . . . . . . . . . . . . . . . . . . . . . . . . . . . . . . . . F-4712 Property, Plant and Equipment . . . . . . . . . . . . . . . . . . . . . . . . . . . . . . . . . . . . . . . . . . . . . . . . . F-4813 Leases . . . . . . . . . . . . . . . . . . . . . . . . . . . . . . . . . . . . . . . . . . . . . . . . . . . . . . . . . . . . . . . . . . . . F-4914 Intangible Assets . . . . . . . . . . . . . . . . . . . . . . . . . . . . . . . . . . . . . . . . . . . . . . . . . . . . . . . . . . . . F-5115 Other Assets . . . . . . . . . . . . . . . . . . . . . . . . . . . . . . . . . . . . . . . . . . . . . . . . . . . . . . . . . . . . . . . . F-5416 Deposits . . . . . . . . . . . . . . . . . . . . . . . . . . . . . . . . . . . . . . . . . . . . . . . . . . . . . . . . . . . . . . . . . . . F-5417 Trading Liabilities . . . . . . . . . . . . . . . . . . . . . . . . . . . . . . . . . . . . . . . . . . . . . . . . . . . . . . . . . . . F-5518 Borrowings . . . . . . . . . . . . . . . . . . . . . . . . . . . . . . . . . . . . . . . . . . . . . . . . . . . . . . . . . . . . . . . . F-5619 Debt Securities in Issue . . . . . . . . . . . . . . . . . . . . . . . . . . . . . . . . . . . . . . . . . . . . . . . . . . . . . . . F-5720 Provisions . . . . . . . . . . . . . . . . . . . . . . . . . . . . . . . . . . . . . . . . . . . . . . . . . . . . . . . . . . . . . . . . . F-5821 Other Liabilities . . . . . . . . . . . . . . . . . . . . . . . . . . . . . . . . . . . . . . . . . . . . . . . . . . . . . . . . . . . . . F-5922 Deferred Income Tax . . . . . . . . . . . . . . . . . . . . . . . . . . . . . . . . . . . . . . . . . . . . . . . . . . . . . . . . . F-5923 Retirement Benefits . . . . . . . . . . . . . . . . . . . . . . . . . . . . . . . . . . . . . . . . . . . . . . . . . . . . . . . . . . F-6224 Shareholders’ Equity . . . . . . . . . . . . . . . . . . . . . . . . . . . . . . . . . . . . . . . . . . . . . . . . . . . . . . . . . F-6725 Non-Controlling Interests . . . . . . . . . . . . . . . . . . . . . . . . . . . . . . . . . . . . . . . . . . . . . . . . . . . . . F-7026 Net Interest Income . . . . . . . . . . . . . . . . . . . . . . . . . . . . . . . . . . . . . . . . . . . . . . . . . . . . . . . . . . F-7127 Net Fee and Commission Income . . . . . . . . . . . . . . . . . . . . . . . . . . . . . . . . . . . . . . . . . . . . . . . F-7228 Net Trading Income . . . . . . . . . . . . . . . . . . . . . . . . . . . . . . . . . . . . . . . . . . . . . . . . . . . . . . . . . . F-7229 Net Income from Financial Assets at Fair Value Through Profit or Loss . . . . . . . . . . . . . . . . . F-7330 Net Investment Income . . . . . . . . . . . . . . . . . . . . . . . . . . . . . . . . . . . . . . . . . . . . . . . . . . . . . . . F-7331 Other Income . . . . . . . . . . . . . . . . . . . . . . . . . . . . . . . . . . . . . . . . . . . . . . . . . . . . . . . . . . . . . . . F-7332 Impairment Charges on Financial Assets . . . . . . . . . . . . . . . . . . . . . . . . . . . . . . . . . . . . . . . . . F-7433 General and Administrative Expenses . . . . . . . . . . . . . . . . . . . . . . . . . . . . . . . . . . . . . . . . . . . . F-7434 Other Expenses . . . . . . . . . . . . . . . . . . . . . . . . . . . . . . . . . . . . . . . . . . . . . . . . . . . . . . . . . . . . . F-7435 Income Tax Expense . . . . . . . . . . . . . . . . . . . . . . . . . . . . . . . . . . . . . . . . . . . . . . . . . . . . . . . . . F-75
F-1
Page
36 Earnings Per Share . . . . . . . . . . . . . . . . . . . . . . . . . . . . . . . . . . . . . . . . . . . . . . . . . . . . . . . . . . . F-7637 Transfers of Financial Assets . . . . . . . . . . . . . . . . . . . . . . . . . . . . . . . . . . . . . . . . . . . . . . . . . . F-7638 Assets Pledged and Received as Collateral . . . . . . . . . . . . . . . . . . . . . . . . . . . . . . . . . . . . . . . . F-7839 Share-Based Payment . . . . . . . . . . . . . . . . . . . . . . . . . . . . . . . . . . . . . . . . . . . . . . . . . . . . . . . . F-7940 Dividends Per Share . . . . . . . . . . . . . . . . . . . . . . . . . . . . . . . . . . . . . . . . . . . . . . . . . . . . . . . . . F-8041 Contingency and Capital Commitments . . . . . . . . . . . . . . . . . . . . . . . . . . . . . . . . . . . . . . . . . . F-8042 Analysis of Financial Assets and Liabilities by Measurement Basis . . . . . . . . . . . . . . . . . . . . F-8243 Fair Value of Financial Assets and Liabilities . . . . . . . . . . . . . . . . . . . . . . . . . . . . . . . . . . . . . . F-8444 Offsetting of Financial Assets and Liabilities . . . . . . . . . . . . . . . . . . . . . . . . . . . . . . . . . . . . . . F-9845 Financial Risk Management . . . . . . . . . . . . . . . . . . . . . . . . . . . . . . . . . . . . . . . . . . . . . . . . . . . F-9946 Related-Party Transactions . . . . . . . . . . . . . . . . . . . . . . . . . . . . . . . . . . . . . . . . . . . . . . . . . . . . F-12547 Principal Subsidiaries . . . . . . . . . . . . . . . . . . . . . . . . . . . . . . . . . . . . . . . . . . . . . . . . . . . . . . . . F-12748 Structured Entities . . . . . . . . . . . . . . . . . . . . . . . . . . . . . . . . . . . . . . . . . . . . . . . . . . . . . . . . . . . F-12849 Acquisitions . . . . . . . . . . . . . . . . . . . . . . . . . . . . . . . . . . . . . . . . . . . . . . . . . . . . . . . . . . . . . . . . F-13150 Current and Non-Current Distinction . . . . . . . . . . . . . . . . . . . . . . . . . . . . . . . . . . . . . . . . . . . . F-13351 Condensed Financial Information of Registrant (SMFG) . . . . . . . . . . . . . . . . . . . . . . . . . . . . . F-134
F-2

Report of Independent Registered Public Accounting Firm
The Board of Directors and ShareholdersSumitomo Mitsui Financial Group, Inc.:
We have audited the accompanying consolidated statement of financial position of Sumitomo MitsuiFinancial Group, Inc. and subsidiaries (the “SMFG Group”) as of March 31, 2015 and 2014, and the relatedconsolidated income statement and consolidated statements of comprehensive income, changes in equity andcash flows for each of the years in the three-year period ended March 31, 2015. These consolidated financialstatements are the responsibility of the Company’s management. Our responsibility is to express an opinion onthese consolidated financial statements based on our audits.
We conducted our audits in accordance with the standards of the Public Company Accounting OversightBoard (United States). Those standards require that we plan and perform the audit to obtain reasonable assuranceabout whether the financial statements are free of material misstatement. An audit includes examining, on a testbasis, evidence supporting the amounts and disclosures in the financial statements. An audit also includesassessing the accounting principles used and significant estimates made by management, as well as evaluatingthe overall financial statement presentation. We believe that our audits provide a reasonable basis for ouropinion.
In our opinion, the consolidated financial statements referred to above present fairly, in all material respects,the financial position of the SMFG Group as of March 31, 2015 and 2014, and the results of their operations andtheir cash flows for each of the years in the three-year period ended March 31, 2015, in conformity withInternational Financial Reporting Standards as issued by the International Accounting Standards Board.
We also have audited, in accordance with the standards of the Public Company Accounting Oversight Board(United States), Sumitomo Mitsui Financial Group, Inc.’s internal control over financial reporting as ofMarch 31, 2015, based on criteria established in Internal Control—Integrated Framework (2013) issued by theCommittee of Sponsoring Organizations of the Treadway Commission (COSO), and our report dated July 22,2015 expressed an unqualified opinion on the effectiveness of the Company’s internal control over financialreporting.
/s/ KPMG AZSA LLC
Tokyo, JapanJuly 22, 2015
F-3

Report of Independent Registered Public Accounting Firm
The Board of Directors and ShareholdersSumitomo Mitsui Financial Group, Inc.:
We have audited Sumitomo Mitsui Financial Group, Inc.’s internal control over financial reporting as ofMarch 31, 2015, based on criteria established in Internal Control—Integrated Framework (2013) issued by theCommittee of Sponsoring Organizations of the Treadway Commission (COSO). The Company’s management isresponsible for maintaining effective internal control over financial reporting and for its assessment of theeffectiveness of internal control over financial reporting, included in the accompanying Management’s AnnualReport on Internal Control over Financial Reporting, included in Item 15 “Controls and Procedures” of theaccompanying Form 20-F. Our responsibility is to express an opinion on Sumitomo Mitsui Financial GroupInc.’s internal control over financial reporting based on our audit.
We conducted our audit in accordance with the standards of the Public Company Accounting OversightBoard (United States). Those standards require that we plan and perform the audit to obtain reasonable assuranceabout whether effective internal control over financial reporting was maintained in all material respects. Ouraudit included obtaining an understanding of internal control over financial reporting, assessing the risk that amaterial weakness exists, and testing and evaluating the design and operating effectiveness of internal controlbased on the assessed risk. Our audit also included performing such other procedures as we considered necessaryin the circumstances. We believe that our audit provides a reasonable basis for our opinion.
A company’s internal control over financial reporting is a process designed to provide reasonable assuranceregarding the reliability of financial reporting and the preparation of financial statements for external purposes inaccordance with generally accepted accounting principles. A company’s internal control over financial reportingincludes those policies and procedures that (1) pertain to the maintenance of records that, in reasonable detail,accurately and fairly reflect the transactions and dispositions of the assets of the company; (2) provide reasonableassurance that transactions are recorded as necessary to permit preparation of financial statements in accordancewith generally accepted accounting principles, and that receipts and expenditures of the company are being madeonly in accordance with authorizations of management and directors of the company; and (3) provide reasonableassurance regarding prevention or timely detection of unauthorized acquisition, use, or disposition of thecompany’s assets that could have a material effect on the financial statements.
Because of its inherent limitations, internal control over financial reporting may not prevent or detectmisstatements. Also, projections of any evaluation of effectiveness to future periods are subject to the risk thatcontrols may become inadequate because of changes in conditions, or that the degree of compliance with thepolicies or procedures may deteriorate.
In our opinion, Sumitomo Mitsui Financial Group, Inc. maintained, in all material respects, effectiveinternal control over financial reporting as of March 31, 2015, based on criteria established in InternalControl—Integrated Framework (2013) issued by the Committee of Sponsoring Organizations of the TreadwayCommission.
We also have audited, in accordance with the standards of the Public Company Accounting Oversight Board(United States), the consolidated statement of financial position of Sumitomo Mitsui Financial Group, Inc. andsubsidiaries as of March 31, 2015 and 2014, and the related consolidated income statement and consolidatedstatements of comprehensive income, changes in equity and cash flows for each of the years in the three-yearperiod ended March 31, 2015, and our report dated July 22, 2015 expressed an unqualified opinion on thoseconsolidated financial statements.
/s/ KPMG AZSA LLC
Tokyo, JapanJuly 22, 2015
F-4

CONSOLIDATED FINANCIAL STATEMENTS
Consolidated Statement of Financial Position
At March 31, At April 1,
Note 2015 2014 2013
(In millions)
Assets:Cash and deposits with banks . . . . . . . . . . . . . . . . . . . 5 ¥ 40,112,783 ¥ 33,208,724 ¥ 11,804,786Call loans and bills bought . . . . . . . . . . . . . . . . . . . . . 1,326,965 1,248,235 1,353,866Reverse repurchase agreements and cash collateral
on securities borrowed . . . . . . . . . . . . . . . . . . . . . . 7,218,498 4,303,121 3,927,126Trading assets . . . . . . . . . . . . . . . . . . . . . . . . . . . . . . . 6 3,243,185 3,557,545 3,481,619Derivative financial instruments . . . . . . . . . . . . . . . . . 7 6,471,203 4,891,382 6,851,729Financial assets at fair value through profit or loss . . 8 1,785,684 1,840,255 2,045,046Investment securities . . . . . . . . . . . . . . . . . . . . . . . . . . 9 24,239,656 22,052,998 36,252,599Loans and advances . . . . . . . . . . . . . . . . . . . . . . . . . . 10 86,971,716 81,244,982 75,987,057Investments in associates and joint ventures . . . . . . . 11 619,814 383,590 260,495Property, plant and equipment . . . . . . . . . . . . . . . . . . 12 2,496,497 2,078,927 1,757,994Intangible assets . . . . . . . . . . . . . . . . . . . . . . . . . . . . . 14 975,995 955,746 903,264Other assets . . . . . . . . . . . . . . . . . . . . . . . . . . . . . . . . . 15 3,485,123 2,655,512 2,610,723Current tax assets . . . . . . . . . . . . . . . . . . . . . . . . . . . . 116,847 62,783 51,449Deferred tax assets . . . . . . . . . . . . . . . . . . . . . . . . . . . 22 117,500 147,241 482,722
Total assets . . . . . . . . . . . . . . . . . . . . . . . . . . . . . . . . . . . . . ¥179,181,466 ¥158,631,041 ¥147,770,475
Liabilities:Deposits . . . . . . . . . . . . . . . . . . . . . . . . . . . . . . . . . . . 16 ¥115,833,980 ¥108,370,494 ¥101,021,413Call money and bills sold . . . . . . . . . . . . . . . . . . . . . . 5,873,124 4,112,429 2,954,052Repurchase agreements and cash collateral on
securities lent . . . . . . . . . . . . . . . . . . . . . . . . . . . . . 8,820,083 7,041,075 6,510,627Trading liabilities . . . . . . . . . . . . . . . . . . . . . . . . . . . . 17 2,193,400 1,865,243 1,910,886Derivative financial instruments . . . . . . . . . . . . . . . . . 7 6,739,787 4,980,991 6,936,356Borrowings . . . . . . . . . . . . . . . . . . . . . . . . . . . . . . . . . 18 11,217,052 8,463,363 6,475,543Debt securities in issue . . . . . . . . . . . . . . . . . . . . . . . . 19 11,051,431 8,769,094 7,950,020Provisions . . . . . . . . . . . . . . . . . . . . . . . . . . . . . . . . . . 20 207,624 225,473 279,131Other liabilities . . . . . . . . . . . . . . . . . . . . . . . . . . . . . . 21 5,548,965 5,143,853 4,858,519Current tax liabilities . . . . . . . . . . . . . . . . . . . . . . . . . 111,365 94,585 206,977Deferred tax liabilities . . . . . . . . . . . . . . . . . . . . . . . . 22 563,805 149,251 107,262
Total liabilities . . . . . . . . . . . . . . . . . . . . . . . . . . . . . . . . . . 168,160,616 149,215,851 139,210,786
Equity:Capital stock . . . . . . . . . . . . . . . . . . . . . . . . . . . . . . . . 24 2,337,896 2,337,896 2,337,896Capital surplus . . . . . . . . . . . . . . . . . . . . . . . . . . . . . . 24 862,971 862,518 862,305Retained earnings . . . . . . . . . . . . . . . . . . . . . . . . . . . . 24 3,554,688 3,112,571 2,515,956Other reserves . . . . . . . . . . . . . . . . . . . . . . . . . . . . . . . 24 2,759,084 1,546,826 971,170Treasury stock . . . . . . . . . . . . . . . . . . . . . . . . . . . . . . . 24 (175,261) (175,115) (227,373)
Equity attributable to shareholders of SumitomoMitsui Financial Group, Inc. . . . . . . . . . . . . . . 9,339,378 7,684,696 6,459,954
Non-controlling interests . . . . . . . . . . . . . . . . . . . . . . 25 1,681,472 1,730,494 2,099,735
Total equity . . . . . . . . . . . . . . . . . . . . . . . . . . . . . . . . . . . . 11,020,850 9,415,190 8,559,689
Total equity and liabilities . . . . . . . . . . . . . . . . . . . . . . . . ¥179,181,466 ¥158,631,041 ¥147,770,475
The accompanying notes are an integral part of the Consolidated Financial Statements.
F-5

Consolidated Income Statement
For the fiscal year ended March 31,
Note 2015 2014 2013
(In millions, except per share data)
Interest income . . . . . . . . . . . . . . . . . . . . . . . . . . . . . . . . . . . . . . . . ¥1,782,621 ¥1,714,044 ¥1,725,723Interest expense . . . . . . . . . . . . . . . . . . . . . . . . . . . . . . . . . . . . . . . . 371,107 320,511 321,570
Net interest income . . . . . . . . . . . . . . . . . . . . . . . . . . . . . . . . . . . . . 26 1,411,514 1,393,533 1,404,153
Fee and commission income . . . . . . . . . . . . . . . . . . . . . . . . . . . . . . 1,002,766 1,003,169 948,685Fee and commission expense . . . . . . . . . . . . . . . . . . . . . . . . . . . . . 129,253 127,959 127,054
Net fee and commission income . . . . . . . . . . . . . . . . . . . . . . . . . . . 27 873,513 875,210 821,631
Net trading income . . . . . . . . . . . . . . . . . . . . . . . . . . . . . . . . . . . . . 28 127,759 135,218 105,302Net income from financial assets at fair value through profit or
loss . . . . . . . . . . . . . . . . . . . . . . . . . . . . . . . . . . . . . . . . . . . . . . . 29 22,678 58,586 15,794Net investment income . . . . . . . . . . . . . . . . . . . . . . . . . . . . . . . . . . 30 371,064 332,265 223,404Other income . . . . . . . . . . . . . . . . . . . . . . . . . . . . . . . . . . . . . . . . . . 31 525,905 429,541 324,403
Total operating income . . . . . . . . . . . . . . . . . . . . . . . . . . . . . . . . . 3,332,433 3,224,353 2,894,687
Impairment charges (reversals) on financial assets . . . . . . . . . . . . 32 90,138 (14,275) 270,145
Net operating income . . . . . . . . . . . . . . . . . . . . . . . . . . . . . . . . . . 3,242,295 3,238,628 2,624,542
General and administrative expenses . . . . . . . . . . . . . . . . . . . . . . . 33 1,621,897 1,522,990 1,447,116Other expenses . . . . . . . . . . . . . . . . . . . . . . . . . . . . . . . . . . . . . . . . 34 505,614 428,780 287,896
Operating expenses . . . . . . . . . . . . . . . . . . . . . . . . . . . . . . . . . . . . 2,127,511 1,951,770 1,735,012
Share of post-tax profit of associates and joint ventures . . . . . . . . 18,124 19,454 19,593
Profit before tax . . . . . . . . . . . . . . . . . . . . . . . . . . . . . . . . . . . . . . 1,132,908 1,306,312 909,123
Income tax expense . . . . . . . . . . . . . . . . . . . . . . . . . . . . . . . . . . . . . 35 409,947 414,076 255,300
Net profit . . . . . . . . . . . . . . . . . . . . . . . . . . . . . . . . . . . . . . . . . . . . ¥ 722,961 ¥ 892,236 ¥ 653,823
Profit attributable to:Shareholders of Sumitomo Mitsui Financial Group, Inc. . . . . ¥ 614,070 ¥ 766,388 ¥ 535,976Non-controlling interests . . . . . . . . . . . . . . . . . . . . . . . . . . . . 108,891 125,848 117,847
Earnings per share:Basic . . . . . . . . . . . . . . . . . . . . . . . . . . . . . . . . . . . . . . . . . . . . 36 ¥ 449.13 ¥ 560.97 ¥ 395.87Diluted . . . . . . . . . . . . . . . . . . . . . . . . . . . . . . . . . . . . . . . . . . 36 448.86 560.68 395.32
The accompanying notes are an integral part of the Consolidated Financial Statements.
F-6

Consolidated Statement of Comprehensive Income
For the fiscal year ended March 31,
2015 2014 2013
(In millions)
Net profit . . . . . . . . . . . . . . . . . . . . . . . . . . . . . . . . . . . . . . . . . . . . . . . . . . . ¥ 722,961 ¥ 892,236 ¥ 653,823
Other comprehensive income:Items that will not be reclassified to profit or loss:
Remeasurements of defined benefit plans:Gains (losses) arising during the period, before tax . . . . . . . 181,638 214,242 31,086
Share of other comprehensive income (loss) of associates andjoint ventures . . . . . . . . . . . . . . . . . . . . . . . . . . . . . . . . . . . . . . . 192 (581) —
Income tax relating to items that will not be reclassified . . . . . . . (58,081) (76,596) (12,613)
Total items that will not be reclassified to profit or loss, net of tax . . . 123,749 137,065 18,473
Items that may be reclassified subsequently to profit or loss:Available-for-sale financial assets:
Gains (losses) arising during the period, before tax . . . . . . . 1,392,139 589,766 816,721Reclassification adjustments for (gains) losses included in
net profit, before tax . . . . . . . . . . . . . . . . . . . . . . . . . . . . . (232,281) (212,001) (3,633)
Exchange differences on translating foreign operations:Gains (losses) arising during the period, before tax . . . . . . . 301,796 271,619 230,764Reclassification adjustments for (gains) losses included in
net profit, before tax . . . . . . . . . . . . . . . . . . . . . . . . . . . . . (2,164) (1,311) 4,579
Share of other comprehensive income (loss) of associates andjoint ventures . . . . . . . . . . . . . . . . . . . . . . . . . . . . . . . . . . . . . . . 5,562 (4,710) 3,354
Income tax relating to items that may be reclassified . . . . . . . . . . (301,129) (151,443) (310,928)
Total items that may be reclassified subsequently to profit or loss, netof tax . . . . . . . . . . . . . . . . . . . . . . . . . . . . . . . . . . . . . . . . . . . . . . . . . 1,163,923 491,920 740,857
Other comprehensive income, net of tax . . . . . . . . . . . . . . . . . . . . . . . . . 1,287,672 628,985 759,330
Total comprehensive income . . . . . . . . . . . . . . . . . . . . . . . . . . . . . . . . . . . ¥2,010,633 ¥1,521,221 ¥1,413,153
Total comprehensive income attributable to:Shareholders of Sumitomo Mitsui Financial Group, Inc. . . . . . . . . . . . ¥1,826,328 ¥1,342,044 ¥1,221,224Non-controlling interests . . . . . . . . . . . . . . . . . . . . . . . . . . . . . . . . . . . 184,305 179,177 191,929
The accompanying notes are an integral part of the Consolidated Financial Statements.
F-7
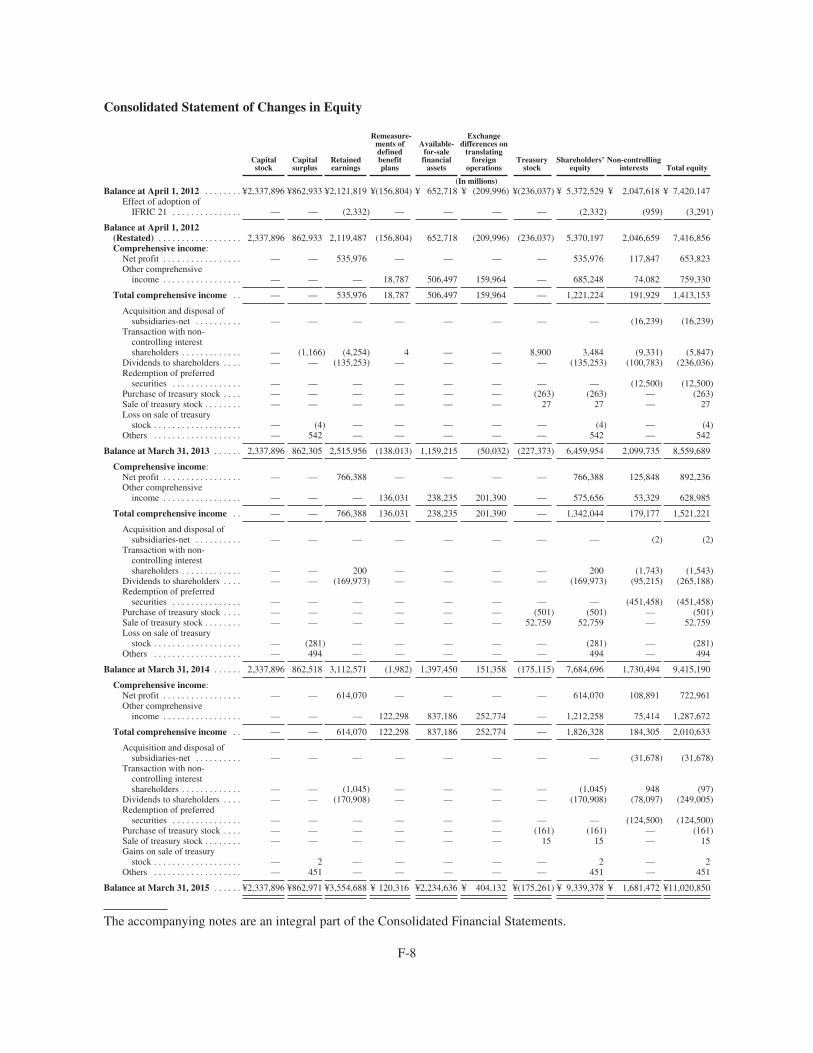
Consolidated Statement of Changes in Equity
Capitalstock
Capitalsurplus
Retainedearnings
Remeasure-ments ofdefinedbenefitplans
Available-for-salefinancial
assets
Exchangedifferences on
translatingforeign
operationsTreasury
stockShareholders’
equityNon-controlling
interests Total equity
(In millions)Balance at April 1, 2012 . . . . . . . . ¥2,337,896 ¥862,933 ¥2,121,819 ¥(156,804) ¥ 652,718 ¥ (209,996) ¥(236,037) ¥ 5,372,529 ¥ 2,047,618 ¥ 7,420,147
Effect of adoption ofIFRIC 21 . . . . . . . . . . . . . . . — — (2,332) — — — — (2,332) (959) (3,291)
Balance at April 1, 2012(Restated) . . . . . . . . . . . . . . . . . . 2,337,896 862,933 2,119,487 (156,804) 652,718 (209,996) (236,037) 5,370,197 2,046,659 7,416,856Comprehensive income:
Net profit . . . . . . . . . . . . . . . . . — — 535,976 — — — — 535,976 117,847 653,823Other comprehensive
income . . . . . . . . . . . . . . . . . — — — 18,787 506,497 159,964 — 685,248 74,082 759,330
Total comprehensive income . . — — 535,976 18,787 506,497 159,964 — 1,221,224 191,929 1,413,153
Acquisition and disposal ofsubsidiaries-net . . . . . . . . . . — — — — — — — — (16,239) (16,239)
Transaction with non-controlling interestshareholders . . . . . . . . . . . . . — (1,166) (4,254) 4 — — 8,900 3,484 (9,331) (5,847)
Dividends to shareholders . . . . — — (135,253) — — — — (135,253) (100,783) (236,036)Redemption of preferred
securities . . . . . . . . . . . . . . . — — — — — — — — (12,500) (12,500)Purchase of treasury stock . . . . — — — — — — (263) (263) — (263)Sale of treasury stock . . . . . . . . — — — — — — 27 27 — 27Loss on sale of treasury
stock . . . . . . . . . . . . . . . . . . . — (4) — — — — — (4) — (4)Others . . . . . . . . . . . . . . . . . . . — 542 — — — — — 542 — 542
Balance at March 31, 2013 . . . . . . 2,337,896 862,305 2,515,956 (138,013) 1,159,215 (50,032) (227,373) 6,459,954 2,099,735 8,559,689
Comprehensive income:Net profit . . . . . . . . . . . . . . . . . — — 766,388 — — — — 766,388 125,848 892,236Other comprehensive
income . . . . . . . . . . . . . . . . . — — — 136,031 238,235 201,390 — 575,656 53,329 628,985
Total comprehensive income . . — — 766,388 136,031 238,235 201,390 — 1,342,044 179,177 1,521,221
Acquisition and disposal ofsubsidiaries-net . . . . . . . . . . — — — — — — — — (2) (2)
Transaction with non-controlling interestshareholders . . . . . . . . . . . . . — — 200 — — — — 200 (1,743) (1,543)
Dividends to shareholders . . . . — — (169,973) — — — — (169,973) (95,215) (265,188)Redemption of preferred
securities . . . . . . . . . . . . . . . — — — — — — — — (451,458) (451,458)Purchase of treasury stock . . . . — — — — — — (501) (501) — (501)Sale of treasury stock . . . . . . . . — — — — — — 52,759 52,759 — 52,759Loss on sale of treasury
stock . . . . . . . . . . . . . . . . . . . — (281) — — — — — (281) — (281)Others . . . . . . . . . . . . . . . . . . . — 494 — — — — — 494 — 494
Balance at March 31, 2014 . . . . . . 2,337,896 862,518 3,112,571 (1,982) 1,397,450 151,358 (175,115) 7,684,696 1,730,494 9,415,190
Comprehensive income:Net profit . . . . . . . . . . . . . . . . . — — 614,070 — — — — 614,070 108,891 722,961Other comprehensive
income . . . . . . . . . . . . . . . . . — — — 122,298 837,186 252,774 — 1,212,258 75,414 1,287,672
Total comprehensive income . . — — 614,070 122,298 837,186 252,774 — 1,826,328 184,305 2,010,633
Acquisition and disposal ofsubsidiaries-net . . . . . . . . . . — — — — — — — — (31,678) (31,678)
Transaction with non-controlling interestshareholders . . . . . . . . . . . . . — — (1,045) — — — — (1,045) 948 (97)
Dividends to shareholders . . . . — — (170,908) — — — — (170,908) (78,097) (249,005)Redemption of preferred
securities . . . . . . . . . . . . . . . — — — — — — — — (124,500) (124,500)Purchase of treasury stock . . . . — — — — — — (161) (161) — (161)Sale of treasury stock . . . . . . . . — — — — — — 15 15 — 15Gains on sale of treasury
stock . . . . . . . . . . . . . . . . . . . — 2 — — — — — 2 — 2Others . . . . . . . . . . . . . . . . . . . — 451 — — — — — 451 — 451
Balance at March 31, 2015 . . . . . . ¥2,337,896 ¥862,971 ¥3,554,688 ¥ 120,316 ¥2,234,636 ¥ 404,132 ¥(175,261) ¥ 9,339,378 ¥ 1,681,472 ¥11,020,850
The accompanying notes are an integral part of the Consolidated Financial Statements.
F-8

Consolidated Statement of Cash Flows
For the fiscal year ended March 31,
2015 2014 2013
(In millions)Operating Activities:
Profit before tax . . . . . . . . . . . . . . . . . . . . . . . . . . . . . . . . . . . . . . . . . . . . . . . . . . . . . . . . . . . . . . . . . . . . . . . . . . . ¥ 1,132,908 ¥ 1,306,312 ¥ 909,123Adjustments for:
Gains on financial assets at fair value through profit or loss and investment securities . . . . . . . . . . . . . . . . (247,825) (270,587) (19,428)Foreign exchange gains . . . . . . . . . . . . . . . . . . . . . . . . . . . . . . . . . . . . . . . . . . . . . . . . . . . . . . . . . . . . . . . . . (726,632) (761,173) (1,098,484)Provision (credit) for loan losses . . . . . . . . . . . . . . . . . . . . . . . . . . . . . . . . . . . . . . . . . . . . . . . . . . . . . . . . . . 79,552 (25,806) 138,375Depreciation and amortization . . . . . . . . . . . . . . . . . . . . . . . . . . . . . . . . . . . . . . . . . . . . . . . . . . . . . . . . . . . 240,760 219,090 198,825Share of post-tax profit of associates and joint ventures . . . . . . . . . . . . . . . . . . . . . . . . . . . . . . . . . . . . . . . . (18,124) (19,454) (19,593)
Net changes in assets and liabilities:Net (increase) decrease of term deposits with original maturities over three months . . . . . . . . . . . . . . . . . . 6,550 112,857 (69,047)Net decrease of call loans and bills bought . . . . . . . . . . . . . . . . . . . . . . . . . . . . . . . . . . . . . . . . . . . . . . . . . . 41,149 227,311 39,491Net (increase) decrease of reverse repurchase agreements and cash collateral on securities borrowed . . . . (2,817,147) (361,364) 1,004,265Net increase of loans and advances . . . . . . . . . . . . . . . . . . . . . . . . . . . . . . . . . . . . . . . . . . . . . . . . . . . . . . . . (5,340,732) (4,769,916) (3,452,294)Net change of trading assets and liabilities and derivative financial instruments . . . . . . . . . . . . . . . . . . . . . 744,344 (110,124) 744,721Net increase of deposits . . . . . . . . . . . . . . . . . . . . . . . . . . . . . . . . . . . . . . . . . . . . . . . . . . . . . . . . . . . . . . . . . 7,334,698 6,867,342 7,677,011Net increase of call money and bills sold . . . . . . . . . . . . . . . . . . . . . . . . . . . . . . . . . . . . . . . . . . . . . . . . . . . 1,657,077 1,084,038 759,135Net increase (decrease) of repurchase agreements and cash collateral on securities lent . . . . . . . . . . . . . . . 1,704,138 516,851 (978,541)Net increase (decrease) of other unsubordinated borrowings and debt securities in issue . . . . . . . . . . . . . . 4,757,098 2,927,607 (3,412,568)
Income taxes paid—net . . . . . . . . . . . . . . . . . . . . . . . . . . . . . . . . . . . . . . . . . . . . . . . . . . . . . . . . . . . . . . . . . . . . . (363,548) (398,612) (126,129)Other operating activities—net . . . . . . . . . . . . . . . . . . . . . . . . . . . . . . . . . . . . . . . . . . . . . . . . . . . . . . . . . . . . . . . (382,082) 439,940 78,816
Net cash and cash equivalents provided by operating activities . . . . . . . . . . . . . . . . . . . . . . . . . . . 7,802,184 6,984,312 2,373,678
Investing Activities:Purchases of financial assets at fair value through profit or loss and available-for-sale financial assets . . . . . . . (34,878,497) (18,538,588) (49,421,717)Proceeds from sale of financial assets at fair value through profit or loss and available-for sale financial
assets . . . . . . . . . . . . . . . . . . . . . . . . . . . . . . . . . . . . . . . . . . . . . . . . . . . . . . . . . . . . . . . . . . . . . . . . . . . . . . . . . 27,710,948 26,780,780 45,573,617Proceeds from maturities of financial assets at fair value through profit or loss and available-for-sale financial
assets . . . . . . . . . . . . . . . . . . . . . . . . . . . . . . . . . . . . . . . . . . . . . . . . . . . . . . . . . . . . . . . . . . . . . . . . . . . . . . . . . 5,429,814 5,870,597 6,114,500Purchases of held-to-maturity investments . . . . . . . . . . . . . . . . . . . . . . . . . . . . . . . . . . . . . . . . . . . . . . . . . . . . . . — (8,185) (880,207)Proceeds from maturities of held-to-maturity investments . . . . . . . . . . . . . . . . . . . . . . . . . . . . . . . . . . . . . . . . . . 1,102,109 1,314,846 314,946Acquisitions of subsidiaries, net of cash and cash equivalents acquired . . . . . . . . . . . . . . . . . . . . . . . . . . . . . . . . (58) 37,600 (949)Investments in associates and joint ventures . . . . . . . . . . . . . . . . . . . . . . . . . . . . . . . . . . . . . . . . . . . . . . . . . . . . . (101,181) (149,182) (34,085)Proceeds from sale of investments in associates and joint ventures . . . . . . . . . . . . . . . . . . . . . . . . . . . . . . . . . . . 5,470 — 4,618Purchases of property, plant and equipment, and investment properties . . . . . . . . . . . . . . . . . . . . . . . . . . . . . . . (572,984) (462,966) (288,533)Purchases of intangible assets . . . . . . . . . . . . . . . . . . . . . . . . . . . . . . . . . . . . . . . . . . . . . . . . . . . . . . . . . . . . . . . . (144,404) (127,567) (105,966)Proceeds from sale of property, plant and equipment, investment properties and intangible assets . . . . . . . . . . 187,463 158,069 97,048Other investing activities—net . . . . . . . . . . . . . . . . . . . . . . . . . . . . . . . . . . . . . . . . . . . . . . . . . . . . . . . . . . . . . . . (66,438) 674 34,629
Net cash and cash equivalents provided by (used in) investing activities . . . . . . . . . . . . . . . . . . . (1,327,758) 14,876,078 1,407,901
Financing Activities:Proceeds from issuance of subordinated borrowings . . . . . . . . . . . . . . . . . . . . . . . . . . . . . . . . . . . . . . . . . . . . . . 40,011 — 33,200Redemption of subordinated borrowings . . . . . . . . . . . . . . . . . . . . . . . . . . . . . . . . . . . . . . . . . . . . . . . . . . . . . . . (5,000) (32,000) (93,000)Proceeds from issuance of subordinated bonds . . . . . . . . . . . . . . . . . . . . . . . . . . . . . . . . . . . . . . . . . . . . . . . . . . . 314,927 2,111 127,095Redemption of subordinated bonds . . . . . . . . . . . . . . . . . . . . . . . . . . . . . . . . . . . . . . . . . . . . . . . . . . . . . . . . . . . . (288,274) (349,884) (552,997)Redemption of preferred securities . . . . . . . . . . . . . . . . . . . . . . . . . . . . . . . . . . . . . . . . . . . . . . . . . . . . . . . . . . . . (124,500) (451,458) (12,500)Dividends paid to shareholders of Sumitomo Mitsui Financial Group, Inc. . . . . . . . . . . . . . . . . . . . . . . . . . . . . . (170,918) (169,984) (135,203)Dividends paid to non-controlling interest shareholders . . . . . . . . . . . . . . . . . . . . . . . . . . . . . . . . . . . . . . . . . . . . (77,970) (95,462) (100,728)Purchase of treasury stock and proceeds from sale of treasury stock—net . . . . . . . . . . . . . . . . . . . . . . . . . . . . . (143) 60,166 (240)Transactions with non-controlling interest shareholders—net . . . . . . . . . . . . . . . . . . . . . . . . . . . . . . . . . . . . . . . (479) (1,566) (5,486)
Net cash and cash equivalents used in financing activities . . . . . . . . . . . . . . . . . . . . . . . . . . . . . . . (312,346) (1,038,077) (739,859)
Effect of exchange rate changes on cash and cash equivalents . . . . . . . . . . . . . . . . . . . . . . . . . . . . . . . . . . . . . . . 748,432 654,346 624,446
Net increase of cash and cash equivalents . . . . . . . . . . . . . . . . . . . . . . . . . . . . . . . . . . . . . . . . . . . . . 6,910,512 21,476,659 3,666,166Effect of adoption of IFRS 10 on opening balance . . . . . . . . . . . . . . . . . . . . . . . . . . . . . . . . . . . . . . — — (250)Cash and cash equivalents at beginning of period . . . . . . . . . . . . . . . . . . . . . . . . . . . . . . . . . . . . . . 32,198,245 10,721,586 7,055,670
Cash and cash equivalents at end of period . . . . . . . . . . . . . . . . . . . . . . . . . . . . . . . . . . . . . . . . . . . ¥ 39,108,757 ¥ 32,198,245 ¥ 10,721,586
Net cash and cash equivalents provided by operating activities includes:Interest and dividends received . . . . . . . . . . . . . . . . . . . . . . . . . . . . . . . . . . . . . . . . . . . . . . . . . . . . . . . . . . . . . . . ¥ 1,913,148 ¥ 1,854,970 ¥ 1,811,647Interest paid . . . . . . . . . . . . . . . . . . . . . . . . . . . . . . . . . . . . . . . . . . . . . . . . . . . . . . . . . . . . . . . . . . . . . . . . . . . . . . 355,253 319,504 326,672
Significant non-cash investing and financing activities:The SMFG Group made SMBC Consumer Finance Co., Ltd. a wholly owned subsidiary of the SMFG Group by share exchange transaction during the
fiscal year ended March 31, 2013. The details of the transactions are described in Note 24 “Shareholders’ Equity.”
The accompanying notes are an integral part of the Consolidated Financial Statements.
F-9

NOTES TO CONSOLIDATED FINANCIAL STATEMENTS
1 GENERAL INFORMATION
Sumitomo Mitsui Financial Group, Inc. (“SMFG”) was established on December 2, 2002, as a holdingcompany for Sumitomo Mitsui Banking Corporation (“SMBC”) and its subsidiaries through a statutory sharetransfer (kabushiki-iten) of all of the outstanding equity securities of SMBC in exchange for SMFG’s newlyissued securities. SMFG is a joint stock corporation with limited liability (Kabushiki Kaisha) incorporated underthe Companies Act of Japan (“Companies Act”). Upon the formation of SMFG and the completion of thestatutory share transfer, SMBC became a direct, wholly owned subsidiary of SMFG. SMFG has a primary listingon the Tokyo Stock Exchange (First Section), with further listing on the Nagoya Stock Exchange (First Section).SMFG’s American Depositary Shares are listed on the New York Stock Exchange.
SMFG and its subsidiaries (the “SMFG Group”) offer a diverse range of financial services, includingcommercial banking, leasing, securities, consumer finance and other services.
The accompanying consolidated financial statements have been authorized for issue by the ManagementCommittee on July 22, 2015.
2 SUMMARY OF SIGNIFICANT ACCOUNTING POLICIES
The principal accounting policies applied in the preparation of the consolidated financial statements are setout below. These policies have been consistently applied to all the fiscal years presented, unless otherwise stated.
Basis of Preparation
Compliance with International Financial Reporting Standards
The consolidated financial statements of the SMFG Group have been prepared in accordance withInternational Financial Reporting Standards (“IFRS”) as issued by the International Accounting Standards Board(“IASB”).
Basis of measurement
The consolidated financial statements have been prepared under the historical cost basis except for thefollowing:
• trading assets and liabilities are measured at fair value;
• derivative financial instruments are measured at fair value;
• financial assets at fair value through profit or loss are measured at fair value;
• available-for-sale financial assets are measured at fair value; and
• liabilities and the assets recognized in consolidated statement of financial position in respect of definedbenefit plans are the present value of the defined benefit obligation less the fair value of plan assets.
Functional and presentation currency
The consolidated financial statements are presented in Japanese yen, which is also SMFG’s functionalcurrency. All financial information presented in Japanese yen has been rounded to the nearest million, except asotherwise indicated.
Critical accounting estimates and judgments
The preparation of the consolidated financial statements in accordance with IFRS requires the use of certaincritical accounting estimates. It also requires management to exercise judgment in the process of applying the
F-10

accounting policies. Actual results may differ from these estimates. The notes to the consolidated financialstatements set out areas involving a higher degree of judgment or complexity, or areas where assumptions aresignificant to the consolidated financial statements, such as allowance for loan losses (Notes 10, 32), fair value offinancial instruments (Note 43), impairment of available-for-sale financial assets (Notes 9, 32), impairment ofgoodwill (Note 14), provision for interest repayment (Note 20), retirement benefits (Note 23) and deferred taxassets (Note 22).
Refer to Note 3 “Critical Accounting Estimates and Judgments” for further information.
New and Amended Accounting Standards Adopted by the SMFG Group
The SMFG Group adopted the following new accounting interpretation during the fiscal year endedMarch 31, 2015.
IFRIC Interpretation 21 “Levies”
IFRIC Interpretation 21 “Levies,” an interpretation of IAS 37 “Provisions, Contingent Liabilities andContingent Assets,” provides guidance on when an entity should recognize liabilities to pay levies imposed bygovernments, government agencies and similar bodies, other than income taxes, in its financial statements. OnApril 1, 2014, the SMFG Group adopted IFRIC 21 retrospectively and comparative information has been restatedaccordingly.
The following tables show the effect of the adoption of IFRIC 21 on the SMFG Group’s consolidatedfinancial statements.
At March 31, 2014 At April 1, 2013
(In millions)
Effect on consolidated statement of financial positionAssets:
Other assets . . . . . . . . . . . . . . . . . . . . . . . . . . . . . . . . . . . . . . . . . . . . . . ¥ 13,772 ¥ 14,168Deferred tax assets . . . . . . . . . . . . . . . . . . . . . . . . . . . . . . . . . . . . . . . . . 1,614 1,694
Total assets . . . . . . . . . . . . . . . . . . . . . . . . . . . . . . . . . . . . . . . . . . . . . . . . . . ¥ 15,386 ¥ 15,862
Liabilities:Other liabilities . . . . . . . . . . . . . . . . . . . . . . . . . . . . . . . . . . . . . . . . . . . ¥ 18,363 ¥ 18,891
Total liabilities . . . . . . . . . . . . . . . . . . . . . . . . . . . . . . . . . . . . . . . . . . . . . . . ¥ 18,363 ¥ 18,891
Equity:Retained earnings . . . . . . . . . . . . . . . . . . . . . . . . . . . . . . . . . . . . . . . . . ¥ (2,145) ¥ (2,165)
Equity attributable to shareholders of Sumitomo MitsuiFinancial Group, Inc. . . . . . . . . . . . . . . . . . . . . . . . . . . . . . . . . . (2,145) (2,165)
Non-controlling interests . . . . . . . . . . . . . . . . . . . . . . . . . . . . . . . . . . . . (832) (864)
Total equity . . . . . . . . . . . . . . . . . . . . . . . . . . . . . . . . . . . . . . . . . . . . . . . . . ¥ (2,977) ¥ (3,029)
F-11
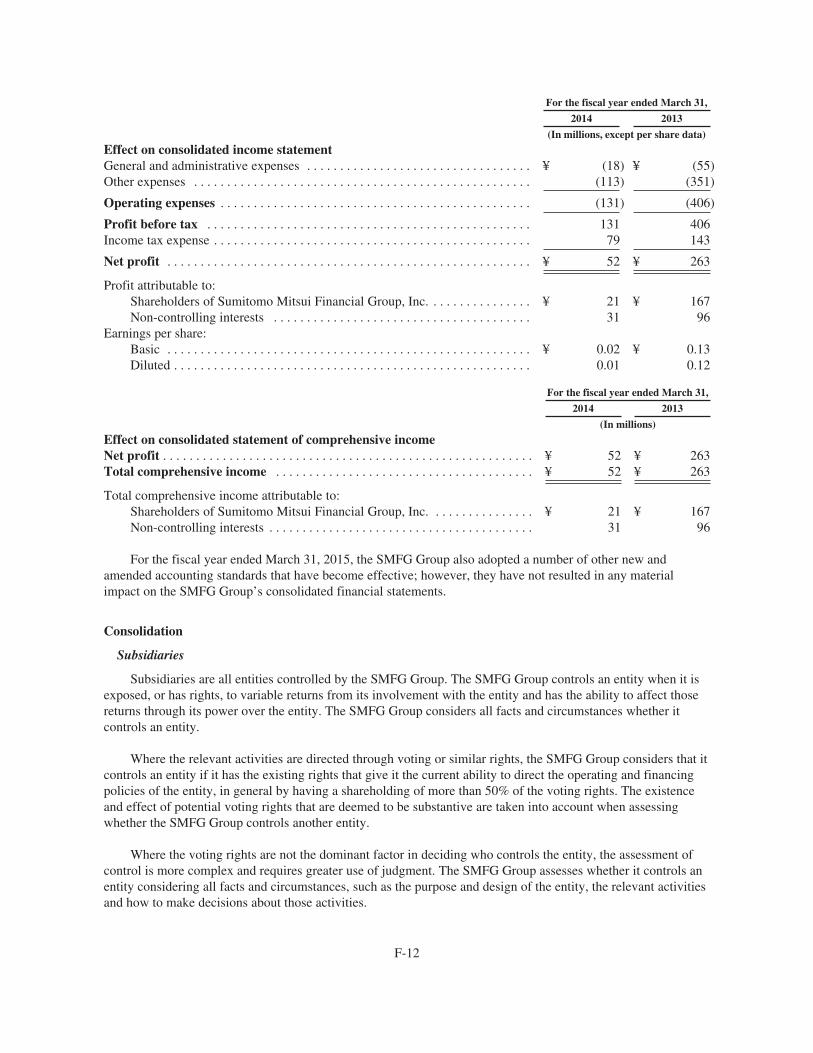
For the fiscal year ended March 31,
2014 2013
(In millions, except per share data)
Effect on consolidated income statementGeneral and administrative expenses . . . . . . . . . . . . . . . . . . . . . . . . . . . . . . . . . . ¥ (18) ¥ (55)Other expenses . . . . . . . . . . . . . . . . . . . . . . . . . . . . . . . . . . . . . . . . . . . . . . . . . . . (113) (351)
Operating expenses . . . . . . . . . . . . . . . . . . . . . . . . . . . . . . . . . . . . . . . . . . . . . . . (131) (406)
Profit before tax . . . . . . . . . . . . . . . . . . . . . . . . . . . . . . . . . . . . . . . . . . . . . . . . . 131 406Income tax expense . . . . . . . . . . . . . . . . . . . . . . . . . . . . . . . . . . . . . . . . . . . . . . . . 79 143
Net profit . . . . . . . . . . . . . . . . . . . . . . . . . . . . . . . . . . . . . . . . . . . . . . . . . . . . . . . ¥ 52 ¥ 263
Profit attributable to:Shareholders of Sumitomo Mitsui Financial Group, Inc. . . . . . . . . . . . . . . . ¥ 21 ¥ 167Non-controlling interests . . . . . . . . . . . . . . . . . . . . . . . . . . . . . . . . . . . . . . . 31 96
Earnings per share:Basic . . . . . . . . . . . . . . . . . . . . . . . . . . . . . . . . . . . . . . . . . . . . . . . . . . . . . . . ¥ 0.02 ¥ 0.13Diluted . . . . . . . . . . . . . . . . . . . . . . . . . . . . . . . . . . . . . . . . . . . . . . . . . . . . . . 0.01 0.12
For the fiscal year ended March 31,
2014 2013
(In millions)
Effect on consolidated statement of comprehensive incomeNet profit . . . . . . . . . . . . . . . . . . . . . . . . . . . . . . . . . . . . . . . . . . . . . . . . . . . . . . . . ¥ 52 ¥ 263Total comprehensive income . . . . . . . . . . . . . . . . . . . . . . . . . . . . . . . . . . . . . . . ¥ 52 ¥ 263
Total comprehensive income attributable to:Shareholders of Sumitomo Mitsui Financial Group, Inc. . . . . . . . . . . . . . . . ¥ 21 ¥ 167Non-controlling interests . . . . . . . . . . . . . . . . . . . . . . . . . . . . . . . . . . . . . . . . 31 96
For the fiscal year ended March 31, 2015, the SMFG Group also adopted a number of other new andamended accounting standards that have become effective; however, they have not resulted in any materialimpact on the SMFG Group’s consolidated financial statements.
Consolidation
Subsidiaries
Subsidiaries are all entities controlled by the SMFG Group. The SMFG Group controls an entity when it isexposed, or has rights, to variable returns from its involvement with the entity and has the ability to affect thosereturns through its power over the entity. The SMFG Group considers all facts and circumstances whether itcontrols an entity.
Where the relevant activities are directed through voting or similar rights, the SMFG Group considers that itcontrols an entity if it has the existing rights that give it the current ability to direct the operating and financingpolicies of the entity, in general by having a shareholding of more than 50% of the voting rights. The existenceand effect of potential voting rights that are deemed to be substantive are taken into account when assessingwhether the SMFG Group controls another entity.
Where the voting rights are not the dominant factor in deciding who controls the entity, the assessment ofcontrol is more complex and requires greater use of judgment. The SMFG Group assesses whether it controls anentity considering all facts and circumstances, such as the purpose and design of the entity, the relevant activitiesand how to make decisions about those activities.
F-12
The SMFG Group also determines whether it is acting as an agent or a principal in assessing whether it hascontrol of another entity. An agent is a party primarily engaged to act on behalf and for the benefit of anotherparty or parties and therefore does not control the entity. To make such judgments, the SMFG Group considersthe overall relationship, especially all of the following factors: the scope of its decision-making authority over theentity, the rights held by other parties, the remuneration to which it is entitled in accordance with theremuneration agreement, and its exposure to variability of returns from other interests that it holds in the entity.
The SMFG Group reassesses whether it controls an entity if facts and circumstances indicate that there arechanges to one or more of the elements of control.
Subsidiaries are fully consolidated from the date on which the SMFG Group obtains control. They aredeconsolidated from the date on which the SMFG Group loses control.
The acquisition method is used to account for the business combinations including the acquisition ofsubsidiaries by the SMFG Group. The consideration transferred in a business combination is measured at fairvalue, which is calculated as the sum of the acquisition-date fair values of the assets transferred, the liabilitiesincurred and the equity interests issued. Identifiable assets acquired and liabilities assumed in a businesscombination are measured initially at their fair values at the acquisition date. The SMFG Group’s previously heldequity interest in the acquiree is remeasured at fair value at the acquisition date and any gain or loss is recognizedin profit or loss. For each business combination, the SMFG Group measures any non-controlling interest in theacquiree either at fair value or at the non-controlling interest’s proportionate share of the acquiree’s identifiablenet assets. The excess of the aggregate of the consideration transferred, the amount of any non-controllinginterest and the acquisition-date fair value of the SMFG Group’s previously held equity interest in the acquireeover the net of the acquisition-date amounts of the identifiable assets acquired and the liabilities assumed isrecorded as goodwill in the consolidated statement of financial position. If the aggregate of the considerationtransferred, the amount of any non-controlling interest and the acquisition-date fair value of the SMFG Group’spreviously held equity interest in the acquiree is less than the net of the acquisition-date amounts of theidentifiable assets acquired and the liabilities assumed, the difference is recognized immediately in theconsolidated income statement.
Inter-company transactions, balances and unrealized gains on transactions between the SMFG Groupcompanies are eliminated on consolidation. Unrealized losses are also eliminated unless the transaction providesevidence of impairment of the asset transferred. The accounting policies of subsidiaries have been adjusted wherenecessary to ensure consistency with the accounting policies adopted by the SMFG Group.
Non-controlling interests
Changes in the SMFG Group’s ownership interest in a subsidiary that do not result in a loss of control areaccounted for as equity transactions.
Interests in the equity of subsidiaries not attributable to the SMFG Group are reported in the consolidatedstatement of financial position as a separate component of equity as non-controlling interests. Profits or lossesattributable to non-controlling interests are separately reported in the consolidated income statement.
Associates and joint ventures
An associate is an entity over which the SMFG Group has significant influence, but does not control thefinancial and operating policy decisions of the entity. Significant influence is generally presumed to exist whenthe SMFG Group holds 20% or more, but less than 50%, of the voting rights.
Entities that are jointly controlled by more than one party, including the SMFG Group, may be determinedto be a joint venture.
F-13
The SMFG Group accounts for investments in associates and joint ventures using the equity method fromthe date on which they become associates or joint ventures. The SMFG Group discontinues the use of the equitymethod from the date on which the SMFG Group ceases to have significant influence or joint control over theinvestees.
Under the equity method, the SMFG Group’s investments in associates and joint ventures are initiallyrecognized at cost. The carrying amount of the investments are subsequently increased or decreased to recognizethe SMFG Group’s share of the post-acquisition profit or loss of the associate or joint venture and othermovements included directly in the equity of the associate or joint venture. The SMFG Group’s share of theresults of associates and joint ventures is based on the financial statements of its associates, adjusted to conformwith the accounting policies of the SMFG Group. Profits on transactions between the SMFG Group and itsassociates and joint ventures are eliminated to the extent of the SMFG Group’s interest in the associates or jointventures. Losses are also eliminated to the extent of the SMFG Group’s interest in the associates or joint venturesunless the transaction provides evidence of impairment in the asset transferred.
The carrying amounts of the investments in associates and joint ventures include goodwill (net of anyaccumulated impairment loss) arising on the acquisition of the interests in the entities. Because goodwill arisingon the acquisition of the interest in an associate or joint venture is not separately recognized, it is not tested forimpairment separately. Instead, the entire carrying amount of the investment in an associate or joint venture istested for impairment as a single asset by comparing its recoverable amount, which is the higher of value in useand fair value less costs to sell, with its carrying amount, whenever there is any objective evidence that theinvestment is impaired. An impairment loss recognized in prior periods for the investment is reversed only ifthere has been a change in the estimates used to determine the recoverable amount of the investment since thelast impairment loss was recognized. If this is the case, the carrying amount of the investment is increased to itsrecoverable amount. That increase is a reversal of an impairment loss.
When the SMFG Group’s share of losses in an associate or joint venture exceeds the SMFG Group’scarrying amount of the investment, the SMFG Group does not recognize further losses, unless it has a bindingobligation or has made payments on behalf of the entity.
Segment Reporting
The SMFG Group determines its operating segments based on the management approach, which requiresoperating segments to be identified on the basis of internal reports about components of the entity that areregularly reviewed by management, in order to allocate resources to a segment and to assess its performance.
Foreign Currency Translation
Items included in the financial statements of each of the SMFG Group companies are measured using thecurrency of the primary economic environment in which the company operates (“the functional currency”). Theconsolidated financial statements are presented in Japanese yen, which is also SMFG’s functional currency.
Transactions and balances
Foreign currency transactions that are denominated or settled in a foreign currency are translated into thefunctional currency using the exchange rates prevailing at the dates of the transactions. Monetary itemsdenominated in foreign currencies are translated using the exchange rate at the end of the reporting period.Foreign exchange gains and losses resulting from the retranslation and settlement of monetary items arerecognized in the consolidated income statement. Non-monetary items that are measured at fair value in a foreigncurrency are translated into the functional currency using the exchange rate at the date the fair value isdetermined. Translation differences on non-monetary items, such as equity instruments classified as available-for-sale financial assets, are not included in the consolidated income statement but are recognized directly inequity. Non-monetary items that are measured at historical cost in a foreign currency are translated into thefunctional currency using the exchange rate at the date of the initial transaction.
F-14

Foreign operations
The assets and liabilities of foreign operations are translated into the presentation currency of the SMFGGroup using the exchange rate at the end of the reporting period, and their income statements are translated usingthe exchange rates at the dates of the transactions or average exchange rates where these approximate to actualrates.
The exchange differences arising on the translation of a foreign operation are included in othercomprehensive income within equity and subsequently included in profit or loss on full or partial disposal of theoperation.
Financial Assets
At initial recognition, the financial assets of the SMFG Group are classified into one of the followingcategories: trading assets, derivative financial instruments, financial assets at fair value through profit or loss,loans and receivables, held-to-maturity investments and available-for-sale financial assets.
Regular way purchases and sales of trading assets, derivative financial instruments, financial assets at fairvalue through profit or loss, held-to-maturity investments and available-for-sale financial assets are recognizedon the trade date—the date on which the SMFG Group commits to purchase or sell the assets.
Financial assets are derecognized when the rights to receive cash flows from the financial assets haveexpired or where the SMFG Group has transferred substantially all the risks and rewards of ownership at aconsolidated level. The SMFG Group consolidates all subsidiaries in accordance with IFRS 10 “ConsolidatedFinancial Statements” before determining derecognition of financial assets under IAS 39 “Financial Instruments:Recognition and Measurement.”
Trading assets
Financial assets are classified as held for trading and included in “Trading assets” in the consolidatedstatement of financial position, if they are acquired or incurred principally for the purpose of selling orrepurchasing in the near term or if they are part of a portfolio of identified financial instruments that are managedtogether and for which there is evidence of a recent actual pattern of short-term profit-taking. Trading assets areinitially recognized at fair value with transaction costs being recognized in the consolidated income statement,and subsequently measured at fair value. Gains and losses arising from changes in the fair values of tradingassets are included in “Net trading income” in the consolidated income statement.
Derivative financial instruments
Derivatives are also classified as held for trading and included in “Derivative financial instruments” in theconsolidated statement of financial position. The SMFG Group does not apply hedge accounting under IFRS. Allderivatives are carried as assets when the fair value is positive and as liabilities when the fair value is negative.Derivatives are initially recognized at fair value with transaction costs being recognized in the consolidatedincome statement, and subsequently measured at fair value. Gains and losses arising from changes in the fairvalues of derivatives are included in “Net trading income” in the consolidated income statement.
The derivative component of a hybrid instrument containing both a derivative and non-derivativecomponent (“host contract”) is referred to as an embedded derivative. Certain embedded derivatives areaccounted for as separate derivatives, when their economic characteristics and risks are not closely related tothose of the host contract and the hybrid instrument is not carried at fair value through profit or loss. Theseembedded derivatives are measured at fair value and are presented in the consolidated statement of financialposition together with the host contract.
F-15

Financial assets at fair value through profit or loss
Financial assets, other than those held for trading, are classified as financial assets at fair value throughprofit or loss and are included in “Financial assets at fair value through profit or loss” in the consolidatedstatement of financial position, if they meet one of the following criteria, and are so designated by management:
• the designation eliminates or significantly reduces a measurement or recognition inconsistency;
• a group of financial assets is managed and its performance is evaluated on a fair value basis inaccordance with a documented risk management or investment strategy; or
• the instrument contains one or more embedded derivatives unless (a) the embedded derivative does notsignificantly modify the cash flows that otherwise would be required by the contract or (b) it is clearwith little or no analysis that separation is prohibited.
In addition, the SMFG Group classifies the entire hybrid instrument at fair value through profit or loss whenthe SMFG Group is required to separate an embedded derivative from its host contract, but is unable to measurethe embedded derivative separately either at acquisition or at the end of a subsequent reporting period. Financialassets at fair value through profit or loss are initially recognized at fair value with transaction costs beingrecognized in the consolidated income statement, and subsequently measured at fair value. Gains and lossesarising from changes in the fair value of such financial assets are included in “Net income from financial assets atfair value through profit or loss” in the consolidated income statement.
Loans and receivables
Loans and receivables are non-derivative financial assets with fixed or determinable payments that are notquoted in an active market, other than:
• those that the SMFG Group intends to sell immediately or in the near term, which are classified as heldfor trading, and those that the SMFG Group upon initial recognition designates as at fair value throughprofit or loss;
• those that the SMFG Group upon initial recognition classifies as available-for-sale; or
• those for which the SMFG Group may not recover substantially all of its initial investment, other thanbecause of credit deterioration.
The financial assets classified as loans and receivables are mainly included in “Loans and advances” in theconsolidated statement of financial position. Loans and receivables are initially recognized at fair value plusdirectly attributable transaction costs, and are subsequently measured at amortized cost using the effectiveinterest method.
When the SMFG Group is the lessor in a lease agreement that transfers substantially all of the risks andrewards incidental to ownership of the asset to the lessee, the arrangement is classified as a finance lease and areceivable equal to the net investment in the lease is recognized and presented within “Loans and advances” inthe consolidated statement of financial position.
Held-to-maturity investments
Held-to-maturity investments are non-derivative financial assets quoted in an active market with fixed ordeterminable payments and fixed maturities that the SMFG Group has the positive intention and ability to hold tomaturity. If the SMFG Group were to sell other than an insignificant amount of held-to-maturity investments, theremaining investments in this category would be reclassified as available-for-sale financial assets. Held-to-maturity investments are initially recognized at fair value plus directly attributable transaction costs, and aresubsequently measured at amortized cost using the effective interest method.
F-16

Available-for-sale financial assets
Available-for-sale financial assets are non-derivative financial assets that are classified as available-for-saleat initial recognition or are not classified into any of the other categories described above. Available-for-salefinancial assets are initially recognized at fair value plus directly attributable transaction costs, and aresubsequently measured at fair value.
Gains and losses arising from changes in the fair value of available-for-sale financial assets are recognizedin other comprehensive income, until they are derecognized or impaired. At that time, the cumulative gain or losspreviously recognized in other comprehensive income is recognized in the consolidated income statement.However, interest income calculated using the effective interest method and foreign currency gains and losses onmonetary assets classified as available-for-sale are recognized in the consolidated income statement. Dividendson available-for-sale equity instruments are recognized in the consolidated income statement when the entity’sright to receive payment is established.
Financial Liabilities
Financial liabilities, except for held for trading and derivatives, are initially recognized at fair value net oftransaction costs incurred, including premiums, discounts and issuance costs, and subsequently measured atamortized cost based on the effective interest method. Financial liabilities carried at amortized cost are mainly“Deposits,” “Borrowings,” and “Debt securities in issue” included in the consolidated statement of financialposition.
Financial liabilities held for trading and derivatives are initially measured at fair value with transaction costsbeing recognized in the consolidated income statement, and subsequently measured at fair value. Financialliabilities held for trading and derivatives are mainly included in “Trading liabilities” and “Derivative financialinstruments,” respectively, in the consolidated statement of financial position.
Financial liabilities are derecognized when they have been redeemed or otherwise extinguished.
Hedge Accounting
The SMFG Group does not apply hedge accounting under IAS 39.
Offsetting Financial Instruments
Financial assets and liabilities are offset and the net amount is reported in the consolidated statement offinancial position, only if the SMFG Group currently has a legally enforceable right to set off the recognizedamounts and intends to settle on a net basis or to realize the asset and settle the liability simultaneously. In allother situations, they are presented on a gross basis.
Fair Value Measurement
Fair value is the price that would be received to sell an asset or paid to transfer a liability in an orderlytransaction between market participants at the measurement date. In determining the fair value, the SMFG Groupgives the highest priority to a quoted price in an active market for identical assets or liabilities. A market isregarded as active if transactions for the asset or liability take place with sufficient frequency and volume toprovide pricing information on an ongoing basis. If there is no active market for the asset or liability, the SMFGGroup uses valuation techniques that are appropriate in the circumstances and for which sufficient data areavailable to measure the fair value, maximizing the use of relevant observable inputs and minimizing the use ofunobservable inputs. In cases where the SMFG Group manages a group of financial assets and financial liabilitieson the basis of its net credit exposure, the fair value of the group of financial assets and financial liabilities ismeasured on the basis of the price that would be received to sell a net long position (i.e., an asset) or paid to
F-17

transfer a net short position (i.e., a liability) for the credit risk exposure provided that certain criteria set forth inIFRS 13 “Fair Value Measurement” are met. Details of fair value measurement are described in Note 43 “FairValue of Financial Assets and Liabilities.”
Recognition of Deferred Day One Profit and Loss
The best evidence of the fair value of a financial instrument at initial recognition is normally the transactionprice (i.e., the fair value of the consideration given or received). However, if the fair value at initial recognition isnot evidenced by a quoted price in an active market for an identical asset or liability nor based on a valuationtechnique that uses only data from observable markets, the difference between the fair value at initial recognitionand the transaction price, commonly referred to as “day one profit and loss,” is not recognized as a gain or lossbut adjusted to be deferred. The SMFG Group did not have any significant deferred day one profit and loss forthe fiscal years ended March 31, 2015 and 2014.
Repurchase and Reverse Repurchase Agreements, and Securities Borrowing and Lending Agreements
In the ordinary course of business, the SMFG Group lends or sells securities under agreements to repurchasethem at a predetermined price on a future date (“repos”). Since substantially all the risks and rewards are retainedby the SMFG Group, the securities remain on the consolidated statement of financial position and a liability isrecorded in respect of the consideration received. On the other hand, the SMFG Group borrows or purchasessecurities under agreements to resell them at a predetermined price on a future date (“reverse repos”). Since theSMFG Group does not retain the risks and rewards of ownership, these transactions are treated as collateralizedloans and the securities are not included in the consolidated statement of financial position.
The difference between the sale and purchase price is accrued over the life of the transactions. Securitieslent to counterparties remain on the consolidated statement of financial position. Securities borrowed are notrecognized in the consolidated statement of financial position, unless these are sold to third parties, at whichpoint the obligation to repurchase the securities is recorded as a trading liability at fair value and any subsequentgain or loss is included in “Net trading income” in the consolidated income statement.
For the fiscal years ended March 31, 2015 and 2014, there were no transactions pursuant to repurchaseagreements, securities lending transactions or other transactions involving the transfer of financial assets with anobligation to repurchase such transferred assets that were treated as sales and hence derecognized for accountingpurposes.
Impairment of Financial Assets
Loans and advances and held-to-maturity investments
At the end of each reporting period, the SMFG Group assesses whether there is any objective evidence thata financial asset or a group of financial assets is impaired.
A financial asset or a group of financial assets is impaired and impairment losses are incurred only if there isobjective evidence of impairment as a result of one or more events that occurred after the initial recognition ofthe asset (a “loss event”) and that loss event (or events) has an impact on the estimated future cash flows of thefinancial asset or group of financial assets that can be reliably estimated.
The criteria that the SMFG Group uses to determine that there is objective evidence of an impairment lossinclude:
• significant financial difficulty of an issuer or an obligor;
• a default or delinquency in interest or principal payments;
• restructuring of a financial asset by the SMFG Group due to the borrower’s financial difficulties onterms that the SMFG Group would not otherwise consider;
F-18

• indications that a borrower or issuer will enter bankruptcy;
• disappearance of an active market for a security because of the borrower’s financial difficulties; and
• other observable data relating to a group of assets, such as adverse changes in the payment status ofborrowers or issuers in the group, or national or local economic conditions that correlate with defaultsin the group.
The SMFG Group first assesses whether objective evidence of impairment exists individually for financialassets that are individually significant, and individually or collectively for financial assets that are notindividually significant. If the SMFG Group determines that no objective evidence of impairment exists for anindividually assessed financial asset, whether significant or not, it includes the asset in a group of financial assetswith similar credit risk characteristics and collectively assesses them for impairment. Assets that are individuallyassessed for impairment and for which an impairment loss is or continues to be recognized are not included in thecollective assessment of impairment.
The allowance for individually significant impaired financial assets is measured by the discounted cash flow(“DCF”) method, which is used to calculate the difference between the asset’s carrying amount and the presentvalue of estimated future cash flows (excluding future credit losses that have not been incurred) discounted at thefinancial asset’s original effective interest rate. If financial assets have a variable interest rate, the discount ratefor measuring any impairment loss is the effective interest rate determined under the contract, for the currentperiod. The estimated future cash flows are individually calculated taking into account factors includinghistorical loss information, the appropriateness of the borrower’s business plan or operational improvement plan,the status of progress of its plan, the overall support from financial institutions, and the realizable value of anycollateral held.
The collective allowance for financial assets is classified into two types: (1) the allowance for impairedfinancial assets that are not individually significant, and (2) the allowance for non-impaired financial assets,which reflects incurred but not yet identified (“IBNI”) losses for the period between the impairment occurringand the loss being identified. The collective allowance is estimated by applying historical loss experience togroups of homogenous loans. The historical loss experience data includes the number of borrowers for whomobjective evidence of impairment has been identified for the most recent rolling one-year period, and the amountultimately recovered from impaired financial assets. The SMFG Group has collected and accumulated historicaldata on amounts ultimately recovered from impaired financial assets. The homogeneous groups are determinedon the basis of similar credit risk characteristics. For every group, the SMFG Group’s grading processes areestablished considering asset type, industry, geographical location, collateral type, past-due status and otherrelevant characteristics (see Note 45 “Financial Risk Management”). These characteristics are relevant to theestimation of future cash flows for groups of such assets as being indicative of the debtors’ ability to pay allamounts due according to the contractual terms of the assets being evaluated. Historical loss experience isadjusted on the basis of current observable data, including bankruptcy trends after the occurrence of significantevents which had a negative effect on the global economy and the economies in which a large portion of theSMFG Group’s assets are located, to reflect the effects of current conditions that did not affect the period onwhich the historical loss experience is based and to remove the effects of conditions in the historical period thatdo not currently exist.
The carrying amount of the asset is reduced by the impairment loss either directly or through the use of anallowance account. Changes in the carrying amount of the allowance account are recognized in the consolidatedincome statement. If, in a subsequent period, the amount of the impairment loss decreases and the decrease canbe related objectively to an event occurring after the impairment was recognized (such as an improvement in thedebtor’s credit rating), the previously recognized impairment loss is reversed by adjusting the allowance account.The amount of the reversal is recognized in “Impairment charges on financial assets” in the consolidated incomestatement.
F-19

If a financial asset is determined to be uncollectible, it is written off against the related allowance account.Uncollectible financial assets are normally written off when there is no expectation of further recovery after anycollateral is foreclosed and the amount of the loss has been determined. Those assets primarily include loans forborrowers that have been legally or formally declared bankrupt and borrowers that may not have been legally orformally declared bankrupt but are essentially bankrupt.
Loans and advances that would otherwise be past due or impaired, but whose terms have been renegotiatedwithout providing any financial concessions, are not classified as impaired loans and advances as the terms of therenegotiated loans and advances do not result in a decrease in the net present value of the loan discounted at itsoriginal effective interest rate. The collective allowance is estimated for these loans and advances by includingthem in homogenous groups on the basis of applying the SMFG Group’s grading process, taking into account therenegotiation and their consequent higher risk status. These loans and advances are continually assessed forimpairment until maturity or derecognition.
In addition, provisions for loan commitments are calculated where it is probable that the SMFG Group willincur a loss and recognized in other provisions (see Note 20 “Provisions”).
Available-for-sale financial assets
At the end of each reporting period, the SMFG Group assesses whether there is objective evidence that afinancial asset or a group of financial assets is impaired. In the case of equity instruments classified as available-for-sale, a significant or prolonged decline in the fair value of the instruments below cost is also considered indetermining whether the assets are impaired. In the case of debt instruments classified as available-for-sale,impairment is assessed based on the same criteria as for loans and advances and held-to-maturity investments. Ifany objective evidence of impairment exists for available-for-sale financial assets, the cumulative loss—measured as the difference between the cost and the current fair value, less any impairment loss on that financialasset previously recognized in profit or loss—is removed from equity and recognized in the consolidated incomestatement.
Impairment losses recognized in the consolidated income statement on equity instruments classified asavailable-for-sale are not reversed through the consolidated income statement. For debt instruments classified asavailable-for-sale, if the fair value recovers in a subsequent period and it can be objectively associated with anevent occurring after the impairment loss was recognized in the consolidated income statement, the impairmentloss is reversed through the consolidated income statement.
Property, Plant and Equipment
All property, plant and equipment are stated at cost less accumulated depreciation and accumulatedimpairment losses, if any. Additions and subsequent expenditures are capitalized only to the extent that theyenhance the future economic benefits expected to be derived from the assets. Repairs and maintenance costs areexpensed as incurred.
Land is not depreciated. Depreciation of other assets is calculated using the straight-line method to allocatetheir cost to their residual values over their estimated useful lives, as follows:
• Buildings: 7–50 years;
• Leased assets: the shorter of the lease term and the estimated useful life, which is principally5–20 years; and
• Assets for rent (including assets for aircraft leasing business) and others: 2–40 years.
The residual values and useful lives are reviewed and adjusted, if appropriate, at the end of each reportingperiod. Gains and losses on disposal are determined by comparing the proceeds with the carrying amount. Theseare included in “Other income” and “Other expenses” in the consolidated income statement.
F-20

Intangible Assets
Goodwill
Goodwill represents the excess of the aggregate of the consideration transferred, the amount of any non-controlling interest and the acquisition-date fair value of the SMFG Group’s previously held equity interest in theacquiree over the net of the acquisition-date amounts of the identifiable assets acquired and the liabilitiesassumed, and is initially recognized at the date of acquisition. Goodwill is allocated to cash-generating units forthe purpose of impairment testing. A cash-generating unit is the smallest identifiable group of assets thatgenerates cash inflows that are largely independent of cash inflows from other assets or groups of assets.Impairment testing is performed at least annually and whenever there is an indication that the cash-generatingunit may be impaired. When the SMFG Group disposes of all or part of a cash-generating unit to which goodwillis allocated, the goodwill associated with the cash-generating unit is included in the carrying amount of the cash-generating unit when determining the gain or loss on disposal.
Software
Purchased software is carried at cost less accumulated amortization and accumulated impairment losses, ifany.
Expenditure on internally generated software is recognized as an asset if the SMFG Group can demonstrateits intention and ability to complete the development and use the software in a manner that will generate futureeconomic benefits and it can reliably measure the costs to complete the development. Internally generatedsoftware is carried at capitalized cost less accumulated amortization and accumulated impairment losses, if any.Costs associated with maintaining software are expensed as incurred.
Software is amortized using the straight-line method over the estimated useful life, which is generally fiveyears.
Contractual customer relationships and trademarks
Contractual customer relationships and trademarks acquired in a business combination are recognized at fairvalue at the acquisition date. Contractual customer relationships and trademarks are carried at cost lessaccumulated amortization or impairment losses, if any. Contractual customer relationships and trademarks areamortized using the straight-line method over their estimated useful lives of 10 to 20 years.
Other intangible assets
Other intangible assets primarily consist of leasehold rights. They are recognized only when the SMFGGroup legally obtains the rights and can reliably measure the fair value. Leasehold rights have an indefiniteuseful life and they are not amortized but are tested for impairment annually.
Impairment of Non-Financial Assets
Non-financial assets are reviewed for impairment at the end of each reporting period and whenever eventsor changes in circumstances indicate that the carrying amount may not be recoverable. If any such indicationexists, the asset’s recoverable amount is estimated. An impairment loss is recognized in the consolidated incomestatement if the asset’s carrying amount is greater than its estimated recoverable amount. The recoverable amountis estimated as the higher of the asset’s fair value less costs to sell and value in use. Value in use is the presentvalue of the future cash flows expected to be derived from the asset. In addition, irrespective of whether there isany indication of impairment, intangible assets that have an indefinite useful life are tested for impairmentannually.
F-21

For the purposes of conducting impairment reviews, assets are grouped into cash-generating units to whichthe assets belong. Non-financial assets other than impaired goodwill are reviewed for possible reversal of theimpairment loss at the end of each reporting period. An impairment loss is reversed only to the extent that theasset’s carrying amount does not exceed the carrying amount that would have been determined, net ofdepreciation or amortization, if no impairment loss had been recognized.
Leases
As lessee
A lease agreement in which the lessor does not transfer to the lessee substantially all the risks and rewardsof ownership of assets is classified as an operating lease. The leases entered into by the SMFG Group as a lesseeare primarily operating leases. Operating lease payments, net of lease incentives received from the lessor, arerecognized in the consolidated income statement on a straight-line basis over the lease term.
A lease agreement in which the lessor transfers to the lessee substantially all the risks and rewards ofownership of assets, with or without ultimate legal title, is classified as a finance lease. For finance leases, theSMFG Group initially recognizes the leased asset at the lower of the fair value of the asset or the present value ofthe minimum lease payments. Subsequent to initial recognition, assets are accounted for in accordance with theaccounting policy applicable to those assets. The corresponding liability to the lessor is recognized as a leaseobligation within “Borrowings” in the consolidated statement of financial position. Interest expense is recognizedover the term of the lease based on the interest rate implicit in the lease so as to give a constant rate of interest onthe remaining balance of the liability.
As lessor
When the SMFG Group acts as a lessor in an operating lease, the assets for rent are included in “Property,plant and equipment” in the consolidated statement of financial position and are depreciated over their expecteduseful lives on a basis consistent with similar assets in property, plant and equipment. Income from operatingleases (net of any incentives given to the lessee) is recognized on a straight-line basis over the lease term andincluded in “Other income” in the consolidated income statement. Initial direct costs incurred in negotiating andarranging an operating lease are added to the carrying amount of the leased assets and recognized as an expenseon a straight-line basis over the lease term.
When the SMFG Group is a lessor in a finance lease, the leased assets are derecognized and the presentvalue of the future lease payments is recognized as a lease receivable within “Loans and advances” in theconsolidated statement of financial position. The difference between the gross receivables, i.e., undiscountedfuture cash flows, and the present value of the receivables is recognized as unearned finance income. Financeincome is recognized over the lease term based on a pattern reflecting a constant periodic rate of return on the netinvestment in the finance lease.
Sale and leaseback
For sale and leaseback transactions leading to an operating lease, and the transaction took place at fair value,any profit or loss is recognized immediately. If the sale price is at or below fair value, any profit or loss isrecognized immediately. However, if the loss is compensated for by future rentals at a below market price, theloss is deferred and amortized over the period that the asset is expected to be used. If the sale price is above fairvalue, any profit is deferred and amortized over the useful life of the asset. If the fair value of the asset is lessthan the carrying value of the asset at the date of transaction, that difference is recognized immediately as a losson the sale.
F-22

Cash and Cash Equivalents
For the purposes of the consolidated statement of cash flows, cash and cash equivalents include cash onhand, demand deposits, and other short-term highly liquid financial assets with original maturities of threemonths or less, which are subject to insignificant risk of changes in their fair value.
Provisions
A provision is recognized if, as a result of a past event, the SMFG Group has a present legal or constructiveobligation that can be estimated reliably and it is probable that an outflow of economic benefits will be requiredto settle the obligation. Provisions are determined by discounting the expected future cash flows at a pre-tax ratethat reflects current market assessments of the time value of money and, where appropriate, the risks specific tothe liability.
Financial Guarantee Contracts
Financial guarantee contracts are contracts that require the issuer to make specified payments to reimbursethe holder for a loss it incurs because a specified debtor fails to make payments when due in accordance with theterms of a debt instrument. Such financial guarantees are given to banks, financial institutions and other bodieson behalf of customers to secure loans, overdrafts and other banking facilities. Financial guarantees are initiallyrecognized at fair value on the date the guarantee is given.
Subsequent to initial recognition, the SMFG Group’s liabilities under such guarantees are measured at thehigher of the initial measurement, less amortization calculated to recognize in the consolidated income statementthe fee income earned over the guarantee period, and the best estimate of the expenditure required to settle anyfinancial obligation arising at the end of the reporting period. These estimates are determined based onexperience of similar transactions and history of past losses, supplemented by the judgment of management.
Any increase in the liability relating to financial guarantee contracts is included in “Other expenses” in theconsolidated income statement.
Employee Benefits
The SMFG Group operates various retirement benefit plans and other employee benefit plans.
Retirement benefits
The SMFG Group has defined benefit plans, such as defined benefit pension plans and lump-sum severanceindemnity plans, and defined contribution plans.
Defined benefit plans
The liabilities and the assets recognized in the consolidated statement of financial position in respect ofdefined benefit plans are the present value of the defined benefit obligation less the fair value of plan assets.
The present value of the defined benefit obligation is calculated annually by qualified actuaries. Incalculating the present value of the defined benefit obligations, the related current service cost, and past servicecost, the SMFG Group attributes the retirement benefits to years of service under the benefit formula. Thepresent value of the defined benefit obligation is determined by discounting the estimated future cash outflowsusing market yields of AA credit-rated corporate bonds that have terms to maturity approximating those of therelated obligations. In cases where there is no deep market in corporate bonds with a sufficiently long maturity tomatch the estimated maturity of the benefit payments, the SMFG Group uses current market rates of theappropriate term to discount shorter term payments and estimates the discount rates for longer maturities byextrapolating current market rates along the yield curve.
F-23

Actuarial gains and losses arising from experience adjustments and changes in actuarial assumptions in theyear, and return on plan assets excluding interest income are recognized in other comprehensive income and arenever reclassified to profit or loss.
Past service costs are recognized immediately in the consolidated income statement.
When the calculations above result in a benefit to the SMFG Group, the recognized asset is limited to thepresent value of any economic benefits available in the form of any refunds from the plan or reductions in futurecontributions to the plan. An economic benefit is available to the SMFG Group if it is realizable during the life ofthe plan or on settlement of the plan obligations.
Defined contribution plans
Contributions to defined contribution plans are recognized as an expense in the consolidated incomestatement when they are due.
Other long-term employee benefits
The SMFG Group’s net obligation with respect to long-term employee benefits other than retirementbenefits is the amount of future benefit that employees have earned in return for their service in the current andprior periods; that benefit is discounted to determine its present value and the fair value of any related assets isdeducted. The discount rates are market yields of AA credit-rated corporate bonds that have terms to maturityapproximating those of the related obligations. The calculation of obligations is performed using the projectedunit credit method. Any actuarial gains or losses and past service costs are recognized in the consolidated incomestatement in the period in which they arise.
Short-term employee benefits
Short-term employee benefits, such as salaries, paid absences and other benefits are accounted for on anaccrual basis over the period in which employees have provided services. Bonuses are recognized to the extentthat the SMFG Group has a present obligation to its employees that can be measured reliably.
Income Tax
Income tax expense comprises current and deferred taxes. Income tax expense is recognized in theconsolidated income statement except for that related to items recognized directly in equity. In such case, theincome tax expense is recognized in equity.
Current tax is the expected tax payable or receivable on the taxable profit or loss for the fiscal year.
Deferred taxes are provided in full, using the balance sheet liability method, on temporary differencesarising between the tax bases of assets and liabilities and their carrying amounts in the consolidated financialstatements. Deferred taxes are determined using tax rates (and laws) that have been enacted or substantiallyenacted by the end of the reporting period and are expected to apply when the related deferred tax assets arerealized or the deferred tax liabilities are settled.
Deferred tax assets principally arise from tax losses carried forward, impairment of investment securitiesand loans, and the allowance for loan losses.
Deferred taxes are not recognized for the following temporary differences: (a) the initial recognition ofgoodwill; (b) the initial recognition of assets or liabilities in a transaction that is not a business combination andthat affects neither accounting nor taxable profit or loss; and (c) the temporary differences associated withinvestments in subsidiaries, associates, and joint ventures, when the parent investor is able to control the timingof the reversal of the temporary difference and it is probable that the temporary difference will not reverse in theforeseeable future.
F-24

Deferred tax assets relating to tax losses carried forward and deductible temporary differences arerecognized, only to the extent that it is probable that future taxable profit will be available against which the taxlosses carried forward and the deductible temporary differences can be utilized.
Debt and equity securities in issue
On initial recognition, financial instruments issued by the SMFG Group are classified in accordance withthe substance of the contractual agreement as financial liabilities where the contractual arrangement results in theSMFG Group having a present obligation to either deliver cash or another financial asset to the holder, or tosatisfy the obligation other than by delivering a fixed number of equity shares in exchange for a fixed amount ofcash or another financial asset. The instruments or their components are classified as equity where they do notmeet the definition of a liability and show evidence of a residual interest in the entity’s assets after deducting allof its liabilities. Compound financial instruments that contain both liability and equity elements are accounted forseparately with the equity component being assigned the residual amount after deducting from the entire value ofthe compound financial instrument the fair value of the liability component which has been determinedseparately.
Shareholders’ Equity
Stock issuance costs
Incremental costs directly attributable to the issuance of new shares or options including those issued as aresult of a business combination transaction are deducted from the proceeds and shown in equity, net of tax.
Dividends on common stock and preferred stock
Dividends on common stock and preferred stock are recognized in equity in the period in which they areapproved by the shareholders. Dividends for the fiscal year that are declared after the reporting period aredescribed in Note 40 “Dividends Per Share.”
Treasury stock
Where SMFG or any other member of the Group companies purchase SMFG’s common or preferred stock,the consideration paid is deducted from equity as treasury stock until they are cancelled or sold. No gain or lossis recognized on the purchase, sale, or cancellation of SMFG’s own equity instruments and the consideration paidor received is recognized in equity.
Interest Income and Expense
Interest income and expense for all financial instruments, except for those classified as held for trading andfinancial assets at fair value through profit or loss, are recognized in “Interest income” and “Interest expense” inthe consolidated income statement using the effective interest method.
The effective interest method is a method of calculating the amortized cost of a financial asset or a financialliability and of allocating the interest income or interest expense over the relevant period.
The effective interest rate is the rate that discounts the estimated future cash payments or receipts throughthe expected life of the financial instrument or, when appropriate, a shorter period to the net carrying amount ofthe financial asset or financial liability. When calculating the effective interest rate, the SMFG Group estimatescash flows, considering the contractual terms of the financial instrument but not including future credit losses.The calculation includes fees and points paid or received between parties to the contract that are an integral partof the effective interest rate of the financial instrument, transaction costs and other premiums or discounts.
F-25
Once a financial asset or a group of similar financial assets has been written down as a result of animpairment loss, interest income is thereafter recognized using the rate of interest used to discount the future cashflows for the purpose of measuring the impairment loss. For financial assets measured at amortized cost, theinterest rate is the original effective interest rate.
Fee and Commission Income
Fee and commission income includes fee and commission income arising from a diverse range of servicesthat the SMFG Group provides to its customers. Fee and commission income can be divided into two categories:fee and commission income from providing transaction services, and fee and commission income earned fromservices that are provided over a certain period of time. Fee and commission income earned from providingtransaction services is recognized when the service has been completed or the event has occurred. This fee andcommission income includes fees on funds transfer and collection services, service charges from depositaccounts, fees and commissions on the securities business, underwriting fees, brokerage fees, and fee andcommission income from other services. Fee and commission income earned from services over a period of timeis recognized over that service period. This fee and commission income includes fees on credit-relatedbusinesses, investment fund businesses, and fee and commission income from other services. Loan commitmentfees, together with the related direct cost, for loans that are likely to be drawn down are deferred and recognizedas an adjustment to the effective interest rate on the loan. Loan commitment fees are recognized over the term ofthe commitment period when it is unlikely that a loan will be drawn down.
Net Trading Income
Net trading income consists of margins made on market-making and customer business, as well as changesin fair value of trading assets and liabilities and derivative financial instruments, caused by movements in interestrates, exchange rates, equity prices and other market variables. It also includes net interest and dividend incomeon trading assets and liabilities.
Net Income from Financial Assets at Fair Value through Profit or Loss
Net income from financial assets at fair value through profit or loss includes all gains and losses arisingfrom changes in the fair value of these financial assets and sales of such assets, and interest and dividend incomeon these financial assets.
Net Investment Income
Net investment income includes gains and losses on the disposal of available-for-sale financial assets, anddividends from available-for-sale equity instruments.
Earnings Per Share
The SMFG Group presents basic and diluted earnings per share (“EPS”) data for its common stock. BasicEPS is calculated by dividing the profit or loss attributable to common shareholders of the SMFG Group by theweighted average number of common stock outstanding during the period. Diluted EPS is determined byadjusting the profit or loss attributable to common shareholders and the weighted average number of commonstock outstanding for the effects of all dilutive potential common stock including share options and otherconvertible instruments.
F-26

Recent Accounting Pronouncements
The SMFG Group is currently assessing the impact of the following standards, amendments to standards,and interpretations that are not yet effective and have not been early adopted:
Defined Benefit Plan: Employee Contributions (Amendments to IAS 19)
In November 2013, the IASB issued narrow-scope amendments to IAS 19 “Employee Benefits,” whichapplies to contributions from employees or third parties to defined benefit plans. The amendments permit anentity to recognize the amount of the contributions as a reduction in the service cost in the period in which therelated service is rendered if the amounts of such contributions are independent of the number of years of service.The amendments are effective for annual periods beginning on or after July 1, 2014 and are not expected to havea material impact on the SMFG Group’s consolidated financial statements.
Annual Improvements to IFRSs 2010-2012 Cycle/Annual Improvements to IFRSs 2011-2013 Cycle
In December 2013, the IASB issued Annual Improvements to IFRSs 2010-2012 Cycle and AnnualImprovements to IFRSs 2011-2013 Cycle, which are collections of amendments to seven and four IFRSs,respectively. The IASB uses the annual improvements process to make necessary, but non-urgent, amendmentsto IFRSs that will not be included as part of any other project. The amendments are generally effective for annualperiods beginning on or after July 1, 2014 and are not expected to have a material impact on the SMFG Group’sconsolidated financial statements.
Accounting for Acquisitions of Interests in Joint Operations (Amendments to IFRS 11)
In May 2014, the IASB published amendments to IFRS 11 “Joint Arrangements,” which provides newguidance on how to account for the acquisition of an interest in a joint operation that constitutes a business. Theamendments require the acquirer in such acquisitions to apply all of the principles on business combinationsaccounting in IFRS 3 “Business Combinations” and other IFRSs except for those principles that conflict with theguidance in IFRS 11. The amendments are effective for annual periods beginning on or after January 1, 2016.The SMFG Group is currently evaluating the potential impact that the adoption of the amendments will have onits consolidated financial statements.
Clarification of Acceptable Methods of Depreciation and Amortisation (Amendments to IAS 16 and IAS 38)
In May 2014, the IASB published amendments to IAS 16 “Property, Plant and Equipment” and IAS 38“Intangible Assets” to clarify that the use of revenue-based methods to calculate the depreciation of an asset isnot appropriate because revenue generated by an activity that includes the use of an asset generally reflectsfactors other than the consumption of the economic benefits embodied in the asset. The amendments are effectivefor annual periods beginning on or after January 1, 2016. The SMFG Group is currently evaluating the potentialimpact that the adoption of the amendments will have on its consolidated financial statements.
Agriculture: Bearer Plants (Amendments to IAS 16 and IAS 41)
In June 2014, the IASB published amendments to IAS 16 and IAS 41 “Agriculture” to change the financialreporting for bearer plants, such as grape vines, rubber trees and oil palms. The amendments require bearer plantsto be accounted for in the same way as property, plant and equipment, and include them within the scope ofIAS 16 instead of IAS 41. The amendments are effective for annual periods beginning on or after January 1,2016. The SMFG Group is currently evaluating the potential impact that the adoption of the amendments willhave on its consolidated financial statements.
F-27
Equity Method in Separate Financial Statements (Amendments to IAS 27)
In August 2014, the IASB published the narrow-scope amendments to IAS 27 “Separate FinancialStatements” to allow an entity to use the equity method to account for investments in subsidiaries, joint venturesand associates in its separate financial statements. The amendments are effective for annual periods beginning onor after January 1, 2016 and are not expected to have a material impact on the SMFG Group’s consolidatedfinancial statements.
Sale or Contribution of Assets between an Investor and its Associate or Joint Venture (Amendments toIFRS 10 and IAS 28)
In September 2014, the IASB issued the narrow-scope amendments to IFRS 10 and IAS 28 “Investments inAssociates and Joint Ventures” to address an acknowledged inconsistency between the requirements in IFRS 10and those in IAS 28, in dealing with the sale or contribution of assets between an investor and its associate orjoint venture. The amendments are effective for annual periods beginning on or after January 1, 2016. The SMFGGroup is currently evaluating the potential impact that the adoption of the amendments will have on itsconsolidated financial statements.
Annual Improvements to IFRSs 2012-2014 Cycle
In September 2014, the IASB issued Annual Improvements to IFRSs 2012-2014 Cycle, which is a collectionof amendments to four IFRSs. The IASB uses the annual improvements process to make necessary, but non-urgent, amendments to IFRSs that will not be included as part of any other project. The amendments are effectivefor annual periods beginning on or after January 1, 2016. The SMFG Group is currently evaluating the potentialimpact that the adoption of the amendments will have on its consolidated financial statements.
Disclosure Initiative (Amendments to IAS 1)
In December 2014, the IASB issued amendments to IAS 1 “Presentation of Financial Statements” as part ofits major initiative to improve presentation and disclosure in financial reports. The amendments are designed toencourage entities to apply professional judgment in determining what information to disclose in their financialstatements. The amendments are effective for annual periods beginning on or after January 1, 2016.
Investment Entities: Applying the Consolidated Exception (Amendments to IFRS 10, IFRS 12 and IAS 28)
In December 2014, the IASB issued narrow-scope amendments to IFRS 10, IFRS 12 “Disclosure ofInterests in Other Entities” and IAS 28 to introduce minor clarifications to the requirements when accounting forinvestment entities. The amendments also provide relief in particular circumstances, which will reduce the costsof applying the standards. The amendments are effective for annual periods beginning on or after January 1,2016. The SMFG Group is currently evaluating the potential impact that the adoption of the amendments willhave on its consolidated financial statements.
IFRS 15 “Revenue from Contracts with Customers”
In May 2014, the IASB published IFRS 15 “Revenue from Contracts with Customers” to establishprinciples for reporting useful information to users of financial statements about the nature, amount, timing anduncertainty of revenue and cash flows arising from an entity’s contract with customers. The core principle ofIFRS 15 is to recognize revenue to depict the transfer of goods or services to customers in amounts that reflectthe consideration (that is, payment) to which the entity expects to be entitled in exchange for those goods orservices. IFRS 15 also requires enhanced disclosures about revenue, provides guidance for transactions that werenot previously addressed comprehensively and improves guidance for multiple-element arrangements. Thestandard is effective for annual periods beginning on or after January 1, 2017. The SMFG Group is currentlyevaluating the potential impact that the adoption of the standard will have on its consolidated financialstatements.
F-28
IFRS 9 “Financial Instruments”
In July 2014, the IASB published IFRS 9 “Financial Instruments,” which is the comprehensive standard toreplace IAS 39. The standard contains the following new requirements for classification and measurement offinancial assets and liabilities, impairment of financial assets and hedge accounting:
Classification and measurement. The standard requires all financial assets to be classified into threecategories, namely, amortized cost, fair value through other comprehensive income (“FVOCI”) and fair valuethrough profit or loss (“FVPL”), based on the business model within which they are held and their contractualcash flow characteristics. A financial asset is measured at amortized cost if the asset is held within a businessmodel whose objective is to hold the asset in order to collect contractual cash flows, and the asset’s contractualterms give rise on specified dates to cash flows that are solely payments of principal and interest (“SPPI”) on theprincipal amount outstanding. Financial assets are measured at FVOCI if they are held within a business modelwhose objective is achieved by both collecting contractual cash flows and selling financial assets, and SPPIrequirements are met. Any financial assets that do not meet the criteria of amortized cost or FVOCI should beclassified as FVPL. The standard also requires financial assets that contain embedded derivatives to be classifiedin their entirety rather than being subject to bifurcation requirements. The standard maintains most of therequirements in IAS 39 regarding the classification and measurement of financial liabilities. However, with thenew requirements, if an entity chooses to measure a financial liability at fair value, the amount of change in itsfair value that is attributable to changes in the credit risk of that liability will be presented in other comprehensiveincome, rather than in profit or loss.
Impairment. The standard introduces the expected credit loss model, which is a new model for therecognition of impairment losses, to replace the incurred credit loss model in IAS 39. Under the expected creditloss model, an entity is required to account for expected credit losses from when financial instruments are firstrecognized and to recognize full lifetime expected losses on more timely basis. An expected credit loss modelwill result in the recognition of impairment losses earlier than an incurred loss model.
Hedge Accounting. The standard introduces a new hedge accounting model, together with correspondingdisclosures about risk management activity for those applying hedge accounting. The hedge accountingrequirements in IFRS 9 align hedge accounting more closely with risk management and establish a moreprinciple-based approach to hedge accounting.
The standard is effective for annual periods beginning on or after January 1, 2018. The SMFG Group iscurrently evaluating the potential impact that the adoption of the standard will have on its consolidated financialstatements.
3 CRITICAL ACCOUNTING ESTIMATES AND JUDGMENTS
The consolidated financial statements are influenced by estimates and management judgment, whichnecessarily have to be made in the course of preparation of the consolidated financial statements. Estimates andjudgments are based on historical experience and other factors, including expectations of future events that arebelieved to be reasonable under the circumstances, and which are continually evaluated.
Allowance for Loan Losses
Allowance for loan losses represents management’s estimate of the losses incurred in the loan portfolios atthe end of each reporting period. Management exercises judgment in making assumptions and estimations whencalculating the allowance for loan losses on both individually and collectively assessed loans.
The allowance for loan losses for individually significant impaired loans is estimated by management basedon the expected future cash flows, taking into account factors such as historical loss information, theappropriateness of the borrower’s business plan or operational improvement plan, the status of progress of its
F-29
plan, the overall support from financial institutions, and the realizable value of any collateral held. The allowancefor loan losses for the remaining loans is collectively estimated by grouping financial assets into portfolios on thebasis of similar credit risk characteristics and using the historical loss experience for these portfolios adjusted forthe effect of the current economic environment. To assess the losses on the loan portfolios where loss eventshave occurred but not yet been identified, management develops assumptions and methodologies to estimate theloss identification period.
Management estimates and judgments may change from time to time as the economic environment changesor new information becomes available. Changes in these estimates and judgments will result in a differentallowance for loan losses and may have a direct impact on impairment charges. Impairment charges on loans andadvances amounting to ¥79,552 million and ¥138,375 million were recognized for the fiscal years endedMarch 31, 2015 and 2013, respectively, whereas previously recognized impairment charges on loans andadvances amounting to ¥25,806 million were reversed for the fiscal year ended March 31, 2014. For additionalinformation, refer to Note 10 “Loans and Advances” and Note 32 “Impairment Charges on Financial Assets.”
Fair Value of Financial Instruments
The fair values of financial instruments where no active market exists or where quoted prices are nototherwise available are determined by using valuation techniques. In these cases, inputs to valuation techniquesare based on observable data with respect to similar financial instruments or by using models. Where observableinputs are not available, the fair value is estimated based on appropriate assumptions that a market participantwould take into account. Where valuation techniques (for example, models) are used to determine fair values,they are validated and periodically reviewed. The SMFG Group certifies significant valuation models before theyare used, and calibrates them to ensure that outputs reflect actual data and comparative market prices. To theextent practical, models use only observable data; however, inputs such as credit risk (both own andcounterparty), volatilities and correlations require management to make estimates. Changes in assumptions aboutthese factors could affect the fair values of these financial instruments. More details about the SMFG Group’svaluation techniques, significant unobservable inputs used in determining fair values and sensitivity analyses aregiven in Note 43 “Fair Value of Financial Assets and Liabilities.”
Impairment of Available-for-sale Financial Assets
Available-for-sale financial assets are impaired if there is objective evidence of impairment as a result ofloss events. The SMFG Group exercises judgment in determining whether there is objective evidence ofoccurrence of loss events, which result in a decrease in estimated future cash flows of the financial assets. Theestimation of future cash flows also requires judgment. In the assessment of impairment of available-for-saleequity instruments, the SMFG Group also considers whether there has been a significant or prolonged decline infair value below their cost. The determination of what is a significant or prolonged decline requires managementjudgment.
Impairment may occur when there is objective evidence of deterioration in the financial conditions of theinvestee, industry and sector performance, or changes in operating and financing cash flows. The determinationof impairment in this respect also includes significant management judgment.
Management estimates and judgments may change from time to time based upon future events that may ormay not occur and changes in these estimates and judgments could adversely affect the carrying amounts ofavailable-for-sale financial assets. Impairment charges on available-for-sale financial assets totaled¥10,586 million, ¥11,531 million and ¥131,770 million for the fiscal years ended March 31, 2015, 2014 and2013, respectively. For additional information, refer to Note 9 “Investment Securities” and Note 32 “ImpairmentCharges on Financial Assets.”
F-30

Impairment of Goodwill
Goodwill is tested for impairment on an annual basis or more frequently if events or changes incircumstances indicate that it may not be recoverable. If any such indication exists, then its recoverable amount isestimated. The process to determine the recoverable amount is inherently uncertain because such recoverableamount is determined based on a number of management estimates and judgments. The SMFG Group determinesthe recoverable amount using the estimated future cash flows, pre-tax discount rates, growth rates, and otherfactors. The estimation of future cash flows inherently reflects management judgments, even though suchforecasts are prepared taking into account actual performance and external economic data. The pre-tax discountrates and growth rates may be significantly affected by market interest rates or other market conditions, whichare beyond management’s control, and therefore significant management judgments are made to determine theseassumptions. These management judgments are made based on the facts and circumstances at the time of theimpairment test, and may vary depending on the situation and the time. Changes in management judgments mayresult in different impairment test results and different impairment amounts recognized. There were noimpairment losses recognized on goodwill for the fiscal years ended March 31, 2015, 2014 and 2013. Foradditional information, refer to Note 14 “Intangible Assets.”
Provision for Interest Repayment
Provision for interest repayment represents management’s estimate of future claims for the refund ofso-called “gray zone interest” (interest on loans in excess of the maximum rate prescribed by the Interest RateRestriction Act (ranging from 15% to 20%) up to the 29.2% maximum rate permitted under the Act Regulatingthe Receipt of Contributions, Receipt of Deposits and Interest Rates), taking into account historical experiencesuch as the number of customer claims for a refund, the amount of repayments and the characteristics ofcustomers, and the length of the period during which claims are expected to be received in the future.
Management estimates and judgments may change from time to time as the legal environment and marketconditions change or new information becomes available. Changes in these estimates and judgments could affectthe balance of provision for interest repayment. Provision for interest repayment is recorded in provisions as aliability, and it totaled ¥166,715 million and ¥189,993 million at March 31, 2015 and 2014, respectively. Foradditional information, refer to Note 20 “Provisions.”
Retirement Benefits
The SMFG Group has defined benefit plans such as defined benefit pension plans and lump-sum severanceindemnity plans. The present value of the defined benefit obligation is calculated based on actuarial valuationsthat are dependent upon a number of assumptions, including discount rates, mortality rates and future salary(benefit) increases. The discount rates are equivalent to market yields of AA credit-rated corporate bonds thathave terms to maturity approximating those of the related obligations. Future mortality rates are based on theofficial mortality table generally used for actuarial assumptions in Japan. Other assumptions used for thecalculation of the defined benefit obligation are based on historical records. Due to the long-term nature of theseplans, such estimates are subject to significant uncertainty. Any change in these assumptions will impactactuarial gains and losses, as well as the present value of the defined benefit obligations and the net retirementbenefit expense for each period. Actuarial gains and losses arising from experience adjustments and changes inactuarial assumptions in the year, and return on plan assets excluding interest income are recognized in othercomprehensive income and are never reclassified to profit or loss.
The difference between the fair value of the plan assets and the present value of the defined benefitobligation at the end of the reporting period is recognized as assets and liabilities in the consolidated statement offinancial position. When this calculation for each plan results in a benefit to the SMFG Group, the recognizedasset is limited to the present value of any economic benefits available in the form of refunds from the plan orreductions in future contributions to the plan. An economic benefit is available to the SMFG Group, if it isrealizable during the life of the plan or on settlement of the plan obligation. The net total of assets and liabilities
F-31

in the consolidated statement of financial position amounted to net assets of ¥332,674 million and¥122,118 million at March 31, 2015 and 2014, respectively. For additional information, refer to Note 23“Retirement Benefits.”
Deferred Tax Assets
Deferred tax assets relating to tax losses carried forward and deductible temporary differences arerecognized, only to the extent that it is probable that future taxable profit will be available against which the taxlosses carried forward and the deductible temporary differences can be utilized. This assessment requiressignificant management estimates and judgments. Future taxable profit is estimated based on, among otherrelevant factors, forecasted results of operations, which are based on historical financial performance and thebusiness plans that management believes to be prudent and feasible. While the SMFG Group carefully assessesthe realization of tax losses carried forward and deductible temporary differences, the actual taxable profit in thefuture may be less than the forecast. The deferred tax assets amounted to ¥117,500 million and ¥147,241 millionat March 31, 2015 and 2014, respectively, while the net total of deferred tax assets and liabilities amounted to netliabilities of ¥446,305 million and ¥2,010 million in the consolidated statement of financial position at March 31,2015 and 2014, respectively. For additional information, refer to Note 22 “Deferred Income Tax.”
4 SEGMENT ANALYSIS
Business Segments
The SMFG Group’s business segment information is prepared based on the internal reporting systemutilized by management to assess the performance of its business segments.
The SMFG Group has four main business segments: Commercial Banking, Leasing, Securities, andConsumer Finance, with the remaining operations recorded in Others. The business segment information coversSMBC, which accounts for the major portion of the SMFG Group’s total assets and revenue, in CommercialBanking, Sumitomo Mitsui Finance and Leasing Company, Limited (“SMFL”) in Leasing, SMBC NikkoSecurities Inc. (“SMBC Nikko Securities”) and SMBC Friend Securities Co., Ltd. (“SMBC Friend Securities”) inSecurities, and Sumitomo Mitsui Card Company, Limited (“Sumitomo Mitsui Card”), Cedyna FinancialCorporation (“Cedyna”) and SMBC Consumer Finance Co., Ltd. (“SMBC Consumer Finance”) in ConsumerFinance.
Commercial Banking
SMBC represents the majority of the Commercial Banking segment, and the remainder includes domesticbanking subsidiaries, such as Kansai Urban Banking Corporation (“KUBC”), THE MINATO BANK, LTD.(“The Minato Bank”) and SMBC Trust Bank Ltd. (“SMBC Trust Bank”), as well as foreign subsidiaries, such asSumitomo Mitsui Banking Corporation Europe Limited (“SMBC Europe”), Sumitomo Mitsui BankingCorporation (China) Limited (“SMBC (China)”) and Manufacturers Bank. Since SMBC has a significant impacton the overall performance of the SMFG Group, its performance is reported to management in more detail byeach business unit based on customer market.
Until March 31, 2014, SMBC conducted its primary banking business through five business units: theConsumer Banking Unit, the Middle Market Banking Unit, the Corporate Banking Unit, the InternationalBanking Unit and the Treasury Unit. On April 1, 2014, SMBC restructured its domestic business operations andreorganized its domestic business units, in order to further enhance its capability to meet the needs of the SMFGGroup’s clients and deliver higher value-added products and services. Under the new structure, the ConsumerBanking Unit, the Middle Market Banking Unit and the Corporate Banking Unit were reorganized into twobusiness units: the Wholesale Banking Unit and the Retail Banking Unit. Accordingly, SMBC operates itsprimary banking business through four business units. Comparative information has been restated to reflect thischange. In addition to the four business units, SMBC also has several cross-sectional units and divisions,
F-32

including the Investment Banking Unit, the Corporate Advisory Division, the Private Advisory Division and theTransaction Business Division. The revenues and expenses of these units and divisions are generally allocated toeach business unit.
SMBC’s Wholesale Banking Unit
SMBC’s Wholesale Banking Unit aims to offer business solutions for the increasingly complex and diversemanagement issues that are faced by large Japanese corporations, including listed companies and mid-sizedcompanies, and, together with certain of our Group companies, provides a wide range of financial products andservices targeting those corporations and companies, through its sales channels. The financial products andservices that this business unit provides include deposits, loans including syndicated loans, commitment lines,structured finance and nonrecourse loans, settlement services, cash management, leasing, factoring, managementinformation systems consulting, collection and investment banking services.
SMBC’s Retail Banking Unit
SMBC’s Retail Banking Unit provides financial services to both consumers residing in Japan and domesticsmall-sized companies. For consumers, this business unit offers a wide range of financial services includingpersonal bank accounts, housing loans, investment trusts, pension-type insurance products and life insuranceproducts. For small-sized companies, this business unit provides a wide array of financial products and servicesto comprehensively address in the same place business owners’ needs as both corporate managers and individualssuch as business and asset succession.
SMBC’s International Banking Unit
SMBC’s International Banking Unit mainly supports companies, financial institutions, sovereign/quasi-sovereign entities outside Japan, and multinational companies operating in Japan. This business unit has branchesin the Americas, Europe and Middle East, and Asia and Oceania regions, forming a global network. Thisbusiness unit provides a variety of tailored products and services including loans, deposits, clearing services,trade finance, project finance, loan syndication and global cash management services.
SMBC’s Treasury Unit
SMBC’s Treasury Unit operates in the domestic and international money, foreign exchange, securities andderivatives markets to serve customer needs and SMBC’s own asset liability management requirements. Tofurther expand SMBC’s customer base, this business unit also seeks to provide specialized solutions and enhancecustomer service capabilities in market transactions through providing a variety of products from traditionalmoney and foreign exchange transactions to derivative transactions.
SMBC’s Others
SMBC’s Others represents the difference between the aggregate of SMBC’s four business units and SMBCas a whole. SMBC’s Others includes the profit and loss amounts related to the Corporate Staff Unit, theCorporate Services Unit, the Compliance Unit, the Risk Management Unit and the Internal Audit Unit, which donot belong to any of the four business units. Those amounts mainly consist of administrative expenses related tothe headquarters operations and profit or loss on the activities related to capital management.
Leasing
Leasing mainly consists of SMFL, SMBC Leasing and Finance, Inc., a U.S. subsidiary, and SumitomoMitsui Auto Service Company Limited, an associate of the SMFG Group. SMFL is one of the major leasingcompanies in Japan and provides a variety of leasing services such as equipment leases, operating leases,leveraged leases and aircraft operating leases. The aircraft leasing business commenced in June 2012 as SMBCAviation Capital is included in SMFL.
F-33

Securities
Securities mainly consists of SMBC Nikko Securities and SMBC Friend Securities. SMBC Nikko Securitiesis one of the major Japanese securities brokers and offers a wide range of financial products, investmentconsultation and administration services to its individual and corporate customers in Japan. For individualcustomers, SMBC Nikko Securities provides consulting services to meet diversified asset management needs,and an online trading tool. For corporate customers, it offers trading capabilities and financial products, debt andequity underwriting, and M&A advisory services, mainly in Japan. SMBC Friend Securities is a full-linesecurities company focusing on retail business in Japan.
Consumer Finance
Consumer Finance mainly consists of Sumitomo Mitsui Card, Cedyna and SMBC Consumer Finance.Sumitomo Mitsui Card is a leading company in the domestic credit card industry, having introduced the Visabrand into the Japanese market. Sumitomo Mitsui Card conducts a comprehensive credit card business and offersa variety of settlement and financing services. Cedyna conducts credit card, installment (such as shopping creditand automobile loan), and solution (such as collection and factoring) businesses. SMBC Consumer Finance,which became the SMFG Group’s wholly owned subsidiary in April 2012, provides consumer loans that consistmainly of unsecured loans to individuals, and engages in other business including a loan guarantee business. Itchanged its company name from Promise Co., Ltd. (“Promise”) in July 2012.
SMFG’s Others
SMFG’s Others represents the difference between the aggregate of Commercial Banking, Leasing,Securities, and Consumer Finance segments, and the SMFG Group as a whole. It mainly consists of profit or lossfrom SMFG on a stand-alone basis, other subsidiaries and equity-method associates, including The JapanResearch Institute, Limited. It also includes internal transactions between the SMFG Group companies, which areeliminated in the consolidated financial statements.
Measurement of Segment Profit or Loss
The business segment information is prepared under the management approach. Consolidated net businessprofit is used as a profit indicator of banks in Japan. Consolidated net business profit is calculated by deductinggeneral and administrative expenses (i.e., the total of personnel expense, non-personnel expense and tax,excluding nonrecurring factors) from gross profits (i.e., the total of net interest income, trust fees, net fee andcommission income, net trading income and net other operating income). While the SMFG Group’s disclosurecomplies with the requirements on segment information in accordance with IFRS, the figures reported tomanagement and disclosed herein are prepared under accounting principles generally accepted in Japan(“Japanese GAAP”). Consequently, the business segment information does not agree with the figures in theconsolidated financial statements under IFRS. These differences are addressed in the “Reconciliation ofSegmental Results of Operation to Consolidated Income Statement.”
Information regarding the total assets of each segment is not used by management in deciding how toallocate resources and assess performance. Accordingly, total assets are not included in the business segmentinformation.
F-34
Segmental Results of Operation
For the fiscal year ended March 31, 2015:
Commercial Banking
SMBC Others(2) Total
WholesaleBanking Unit
RetailBanking Unit
InternationalBanking Unit
TreasuryUnit Others SMBC Total
(In billions)Gross profit . . . . . . . . . . . . . . . . . ¥ 555.4 ¥ 386.8 ¥ 345.3 ¥ 354.0 ¥ (7.2)¥ 1,634.3 ¥ 289.4 ¥ 1,923.7
Net interest income . . . . . . . 315.8 313.2 227.8 212.4 52.2 1,121.4 171.3 1,292.7Net non-interest income . . . . 239.6 73.6 117.5 141.6 (59.4) 512.9 118.1 631.0
General and administrativeexpenses and others . . . . . . . . . (206.8) (350.1) (106.6) (25.9) (101.8) (791.2) (203.0) (994.2)
Consolidated net businessprofit(1)(7) . . . . . . . . . . . . . . . . . ¥ 348.6 ¥ 36.7 ¥ 238.7 ¥ 328.1 ¥ (109.0)¥ 843.1 ¥ 86.4 ¥ 929.5
Leasing Securities Consumer Finance Others Total
SMFL(3) Total(4)
SMBCNikko
Securities(5)
SMBCFriend
Securities Total(4)
SumitomoMitsuiCard Cedyna(6)
SMBCConsumerFinance(3) Total(4)
(In billions)Gross profit . . . . . . . . . . . . . . . . ¥ 137.0 ¥149.3 ¥ 346.3 ¥ 50.4 ¥ 393.9 ¥ 196.4 ¥ 164.2 ¥ 215.5 ¥ 576.9 ¥(63.4) ¥ 2,980.4
Net interest income . . . . . . 19.3 24.4 1.5 1.2 3.8 13.6 25.9 149.0 178.7 5.6 1,505.2Net non-interest income . . 117.7 124.9 344.8 49.2 390.1 182.8 138.3 66.5 398.2 (69.0) 1,475.2
General and administrativeexpenses and others . . . . . . . . (56.5) (60.8) (248.7) (40.0) (301.9) (146.0) (121.7) (96.1) (381.9) 68.9 (1,669.9)
Consolidated net businessprofit(1)(7) . . . . . . . . . . . . . . . . ¥ 80.5 ¥ 88.5 ¥ 97.6 ¥ 10.4 ¥ 92.0 ¥ 50.4 ¥ 42.5 ¥ 119.4 ¥ 195.0 ¥ 5.5 ¥ 1,310.5
F-35

For the fiscal year ended March 31, 2014:
Commercial Banking
SMBC Others(2) Total
WholesaleBanking Unit
RetailBanking Unit
InternationalBanking Unit
TreasuryUnit Others SMBC Total
(In billions)Gross profit . . . . . . . . . . . . . . . . . ¥ 558.5 ¥ 405.4 ¥ 296.0 ¥ 325.5 ¥ (27.3) ¥ 1,558.1 ¥ 249.1 ¥ 1,807.2
Net interest income . . . . . . . 323.4 321.3 174.6 225.2 20.4 1,064.9 171.1 1,236.0Net non-interest income . . . . 235.1 84.1 121.4 100.3 (47.7) 493.2 78.0 571.2
General and administrativeexpenses and others . . . . . . . . . (200.7) (336.4) (89.1) (22.9) (96.6) (745.7) (195.6) (941.3)
Consolidated net businessprofit(1)(7) . . . . . . . . . . . . . . . . . ¥ 357.8 ¥ 69.0 ¥ 206.9 ¥ 302.6 ¥ (123.9) ¥ 812.4 ¥ 53.5 ¥ 865.9
Leasing Securities Consumer Finance Others Total
SMFL(3) Total(4)
SMBCNikko
Securities(5)
SMBCFriend
Securities Total(4)
SumitomoMitsuiCard Cedyna(6)
SMBCConsumerFinance(3) Total(4)
(In billions)Gross profit . . . . . . . . . . . . . . . . ¥ 127.9 ¥138.4 ¥ 339.3 ¥ 58.2 ¥ 397.8 ¥ 189.9 ¥ 167.6 ¥ 181.8 ¥ 540.1 ¥ 14.7 ¥ 2,898.2
Net interest income . . . . . . 29.1 35.2 0.2 1.4 2.7 13.9 28.3 124.4 156.6 53.7 1,484.2Net non-interest income . . 98.8 103.2 339.1 56.8 395.1 176.0 139.3 57.4 383.5 (39.0) 1,414.0
General and administrativeexpenses and others . . . . . . . . (52.9) (54.4) (235.3) (42.5) (292.0) (139.6) (123.6) (73.0) (352.8) 80.8 (1,559.7)
Consolidated net businessprofit(1)(7) . . . . . . . . . . . . . . . . ¥ 75.0 ¥ 84.0 ¥ 104.0 ¥ 15.7 ¥ 105.8 ¥ 50.3 ¥ 44.0 ¥ 108.8 ¥ 187.3 ¥ 95.5 ¥ 1,338.5
F-36
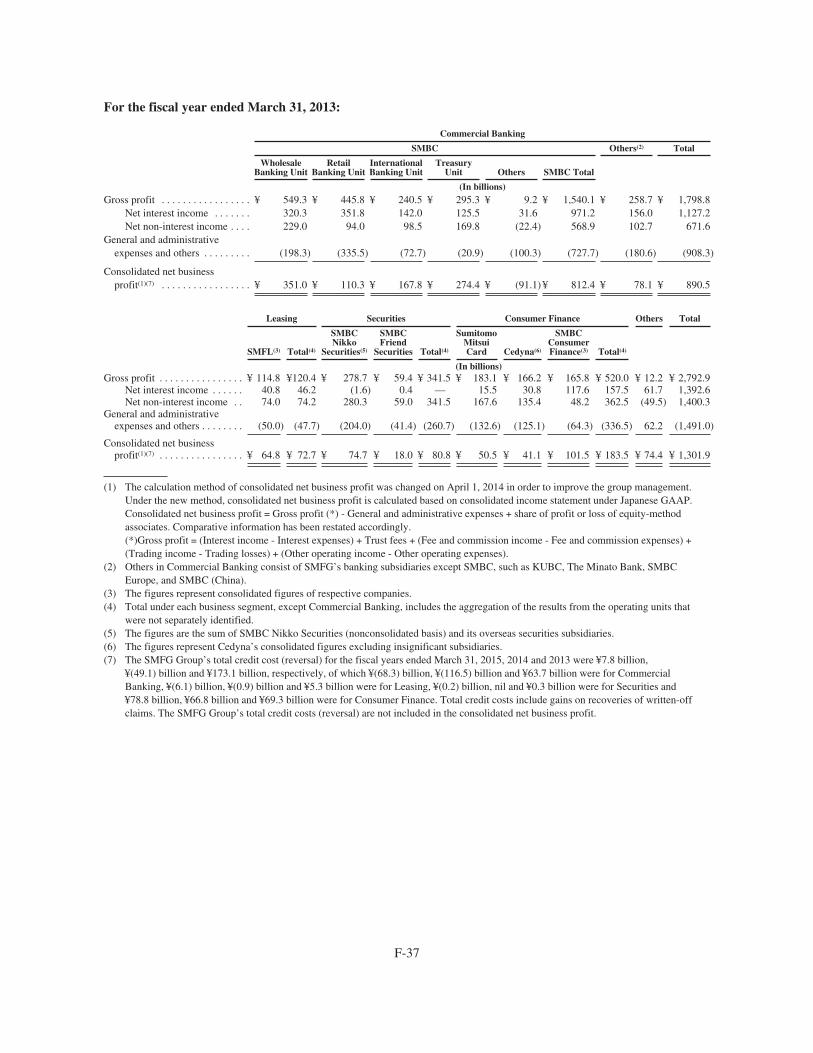
For the fiscal year ended March 31, 2013:
Commercial Banking
SMBC Others(2) Total
WholesaleBanking Unit
RetailBanking Unit
InternationalBanking Unit
TreasuryUnit Others SMBC Total
(In billions)Gross profit . . . . . . . . . . . . . . . . . ¥ 549.3 ¥ 445.8 ¥ 240.5 ¥ 295.3 ¥ 9.2 ¥ 1,540.1 ¥ 258.7 ¥ 1,798.8
Net interest income . . . . . . . 320.3 351.8 142.0 125.5 31.6 971.2 156.0 1,127.2Net non-interest income . . . . 229.0 94.0 98.5 169.8 (22.4) 568.9 102.7 671.6
General and administrativeexpenses and others . . . . . . . . . (198.3) (335.5) (72.7) (20.9) (100.3) (727.7) (180.6) (908.3)
Consolidated net businessprofit(1)(7) . . . . . . . . . . . . . . . . . ¥ 351.0 ¥ 110.3 ¥ 167.8 ¥ 274.4 ¥ (91.1) ¥ 812.4 ¥ 78.1 ¥ 890.5
Leasing Securities Consumer Finance Others Total
SMFL(3) Total(4)
SMBCNikko
Securities(5)
SMBCFriend
Securities Total(4)
SumitomoMitsuiCard Cedyna(6)
SMBCConsumerFinance(3) Total(4)
(In billions)Gross profit . . . . . . . . . . . . . . . . ¥ 114.8 ¥120.4 ¥ 278.7 ¥ 59.4 ¥ 341.5 ¥ 183.1 ¥ 166.2 ¥ 165.8 ¥ 520.0 ¥ 12.2 ¥ 2,792.9
Net interest income . . . . . . 40.8 46.2 (1.6) 0.4 — 15.5 30.8 117.6 157.5 61.7 1,392.6Net non-interest income . . 74.0 74.2 280.3 59.0 341.5 167.6 135.4 48.2 362.5 (49.5) 1,400.3
General and administrativeexpenses and others . . . . . . . . (50.0) (47.7) (204.0) (41.4) (260.7) (132.6) (125.1) (64.3) (336.5) 62.2 (1,491.0)
Consolidated net businessprofit(1)(7) . . . . . . . . . . . . . . . . ¥ 64.8 ¥ 72.7 ¥ 74.7 ¥ 18.0 ¥ 80.8 ¥ 50.5 ¥ 41.1 ¥ 101.5 ¥ 183.5 ¥ 74.4 ¥ 1,301.9
(1) The calculation method of consolidated net business profit was changed on April 1, 2014 in order to improve the group management.Under the new method, consolidated net business profit is calculated based on consolidated income statement under Japanese GAAP.Consolidated net business profit = Gross profit (*) - General and administrative expenses + share of profit or loss of equity-methodassociates. Comparative information has been restated accordingly.(*)Gross profit = (Interest income - Interest expenses) + Trust fees + (Fee and commission income - Fee and commission expenses) +(Trading income - Trading losses) + (Other operating income - Other operating expenses).
(2) Others in Commercial Banking consist of SMFG’s banking subsidiaries except SMBC, such as KUBC, The Minato Bank, SMBCEurope, and SMBC (China).
(3) The figures represent consolidated figures of respective companies.(4) Total under each business segment, except Commercial Banking, includes the aggregation of the results from the operating units that
were not separately identified.(5) The figures are the sum of SMBC Nikko Securities (nonconsolidated basis) and its overseas securities subsidiaries.(6) The figures represent Cedyna’s consolidated figures excluding insignificant subsidiaries.(7) The SMFG Group’s total credit cost (reversal) for the fiscal years ended March 31, 2015, 2014 and 2013 were ¥7.8 billion,
¥(49.1) billion and ¥173.1 billion, respectively, of which ¥(68.3) billion, ¥(116.5) billion and ¥63.7 billion were for CommercialBanking, ¥(6.1) billion, ¥(0.9) billion and ¥5.3 billion were for Leasing, ¥(0.2) billion, nil and ¥0.3 billion were for Securities and¥78.8 billion, ¥66.8 billion and ¥69.3 billion were for Consumer Finance. Total credit costs include gains on recoveries of written-offclaims. The SMFG Group’s total credit costs (reversal) are not included in the consolidated net business profit.
F-37

Reconciliation of Segmental Results of Operation to Consolidated Income Statement
The figures provided in the tables above are calculated by aggregating the figures used for managementreporting under Japanese GAAP for each segment. The total amount of consolidated net business profit that iscalculated by each segment based on the internal managerial data is reconciled to profit before tax reported in theconsolidated financial statements under IFRS as shown in the following table:
For the fiscal year ended March 31,
2015 2014 2013
(In billions)
Consolidated net business profit . . . . . . . . . . . . . . . . . . . . . . . . . . . . . . . . . . . . . . ¥1,310.5 ¥1,338.5 ¥1,301.9Differences between management reporting and Japanese GAAP(1):
Total credit costs(2) . . . . . . . . . . . . . . . . . . . . . . . . . . . . . . . . . . . . . . . . (7.8) 49.1 (173.1)Gains (losses) on equity instruments . . . . . . . . . . . . . . . . . . . . . . . . . . . 66.7 89.2 (21.0)Others . . . . . . . . . . . . . . . . . . . . . . . . . . . . . . . . . . . . . . . . . . . . . . . . . . (60.0) (54.1) (43.7)
Profit before tax under Japanese GAAP . . . . . . . . . . . . . . . . . . . . . . . . . . . . 1,309.4 1,422.7 1,064.1
Differences between IFRS and Japanese GAAP:Scope of consolidation . . . . . . . . . . . . . . . . . . . . . . . . . . . . . . . . . . . . . (3.9) (10.8) (5.7)Derivative financial instruments . . . . . . . . . . . . . . . . . . . . . . . . . . . . . . (84.5) (70.8) (53.3)Investment securities . . . . . . . . . . . . . . . . . . . . . . . . . . . . . . . . . . . . . . . 10.2 6.2 (123.7)Loans and advances . . . . . . . . . . . . . . . . . . . . . . . . . . . . . . . . . . . . . . . . (116.3) (36.7) 44.2Investments in associates and joint ventures . . . . . . . . . . . . . . . . . . . . . 23.6 4.9 22.4Property, plant and equipment . . . . . . . . . . . . . . . . . . . . . . . . . . . . . . . (1.0) 3.1 0.4Lease accounting . . . . . . . . . . . . . . . . . . . . . . . . . . . . . . . . . . . . . . . . . . (2.0) (3.1) (7.7)Defined benefit plans . . . . . . . . . . . . . . . . . . . . . . . . . . . . . . . . . . . . . . 3.1 19.8 15.4Foreign currency translation . . . . . . . . . . . . . . . . . . . . . . . . . . . . . . . . . (23.1) (45.9) (56.9)Others . . . . . . . . . . . . . . . . . . . . . . . . . . . . . . . . . . . . . . . . . . . . . . . . . . 17.4 16.9 9.9
Profit before tax under IFRS . . . . . . . . . . . . . . . . . . . . . . . . . . . . . . . . . . . . . . . . . ¥1,132.9 ¥1,306.3 ¥ 909.1
(1) Reconciling items for differences between management reporting and Japanese GAAP have been changed following the change in thecalculation method of the consolidated net business profit. Comparative information has been restated accordingly.
(2) A positive figure indicates net reversal of credit costs.
F-38

Information about Geographical Areas
The following table shows the total operating income in accordance with IFRS by the main geographicalareas. The SMFG Group’s services are provided to domestic and foreign clients on a worldwide basis. Theseinclude transactions where SMBC’s branches in Japan may deal with customers located in foreign countries andwhere SMBC’s overseas branches may provide services to Japanese companies.
To identify income attributed to each geographical area for the purposes of this disclosure, they areaggregated based on the geographical location of the booking entity, with the assumption that transactionsbooked in booking entities are deemed to have occurred in their respective geographical areas.
For the fiscal year ended March 31,
2015 2014 2013
(In millions)Domestic(1):
Japan . . . . . . . . . . . . . . . . . . . . . . . . . . . . . . . . . . . . . . . . . . . . . . ¥ 2,536,539 ¥ 2,525,836 ¥ 2,376,515
Total domestic . . . . . . . . . . . . . . . . . . . . . . . . . . . . . . . . . . . 2,536,539 2,525,836 2,376,515
Foreign(1)(2):Americas . . . . . . . . . . . . . . . . . . . . . . . . . . . . . . . . . . . . . . . . . . . 172,050 187,435 131,830Europe and Middle East . . . . . . . . . . . . . . . . . . . . . . . . . . . . . . . 350,105 280,187 194,887Asia and Oceania . . . . . . . . . . . . . . . . . . . . . . . . . . . . . . . . . . . . . 273,739 230,895 191,455
Total foreign . . . . . . . . . . . . . . . . . . . . . . . . . . . . . . . . . . . . 795,894 698,517 518,172
Total operating income(3) . . . . . . . . . . . . . . . . . . . . . . ¥ 3,332,433 ¥ 3,224,353 ¥ 2,894,687
(1) The geographical segmentation is determined based on the degrees of the following factors: geographic proximity, similarity ofeconomic activities and relationship of business activities among regions.
(2) Americas includes the United States, Brazil, Canada and others; Europe and Middle East include the United Kingdom, Germany, Franceand others; Asia and Oceania include China, Singapore, Australia and others except Japan.
(3) Total operating income comprises net interest income, net fee and commission income, net trading income, net income from financialassets at fair value through profit or loss, net investment income and other income.
5 CASH AND DEPOSITS WITH BANKS
Cash and deposits with banks at March 31, 2015 and 2014 consisted of the following:
At March 31,
2015 2014
(In millions)
Cash . . . . . . . . . . . . . . . . . . . . . . . . . . . . . . . . . . . . . . . . . . . . . . . . . . . . . . . . . . . . . . . ¥ 1,173,880 ¥ 1,238,416Deposits with banks . . . . . . . . . . . . . . . . . . . . . . . . . . . . . . . . . . . . . . . . . . . . . . . . . . 38,938,903 31,970,308
Total cash and deposits with banks . . . . . . . . . . . . . . . . . . . . . . . . . . . . . . . . . . . ¥40,112,783 ¥33,208,724
The reconciliation of cash and cash equivalents used for the purposes of the consolidated statement of cashflows at March 31, 2015, 2014 and 2013 is shown as follows:
At March 31,
2015 2014 2013
(In millions)
Cash and deposits with banks . . . . . . . . . . . . . . . . . . . . . . . . . . . . . . . ¥40,112,783 ¥33,208,724 ¥11,804,786Less: term deposits with original maturities over three months . . . . . (581,743) (609,503) (711,081)Less: cash segregated as deposits and others . . . . . . . . . . . . . . . . . . . (422,283) (400,976) (372,119)
Cash and cash equivalents . . . . . . . . . . . . . . . . . . . . . . . . . . . . . . ¥39,108,757 ¥32,198,245 ¥10,721,586
F-39

Private depository institutions in Japan are required to maintain certain minimum reserve funds with theBank of Japan, based on average deposit balances and certain other factors. There are similar reserve depositrequirements for the SMFG Group’s foreign offices engaged in banking businesses in foreign countries. AtMarch 31, 2015, 2014 and 2013, the reserves at the central banks, including those minimum reserve funds, whichwere included in cash and cash equivalents, amounted to ¥31,593,178 million, ¥25,737,152 million and¥5,400,547 million, respectively.
6 TRADING ASSETS
Trading assets at March 31, 2015 and 2014 consisted of the following:
At March 31,
2015 2014
(In millions)
Debt instruments . . . . . . . . . . . . . . . . . . . . . . . . . . . . . . . . . . . . . . . . . . . . . . . . . . . . . . . ¥2,618,593 ¥3,263,085Equity instruments . . . . . . . . . . . . . . . . . . . . . . . . . . . . . . . . . . . . . . . . . . . . . . . . . . . . . . 624,592 294,460
Total trading assets . . . . . . . . . . . . . . . . . . . . . . . . . . . . . . . . . . . . . . . . . . . . . . . . . ¥3,243,185 ¥3,557,545
Trading debt instruments mainly consist of Japanese government bonds. Trading equity instruments mainlyconsist of publicly traded Japanese stocks and investment funds.
7 DERIVATIVE FINANCIAL INSTRUMENTS
Derivative financial instruments include futures, forwards, swaps, options and other types of derivativecontracts, which are transactions listed on exchanges or over-the-counter (“OTC”) transactions. In the normalcourse of business, the SMFG Group enters into a variety of derivatives for trading and risk managementpurposes. The SMFG Group uses derivatives for trading activities, which include facilitating customertransactions, market-making and arbitrage activities. The SMFG Group also uses derivatives to reduce itsexposures to market and credit risks as part of its asset and liability management, but does not apply hedgeaccounting.
Derivatives are financial instruments that derive their value from the price of underlying items such asinterest rates, foreign exchange rates, equities, bonds, commodities, credit spreads and other indices. The SMFGGroup’s derivative financial instruments mainly consist of interest rate derivatives and currency derivatives.Interest rate derivatives include interest rate swaps, interest rate futures and interest rate swaptions. Currencyderivatives include foreign exchange forward transactions, currency swaps and currency options.
F-40

The tables below represent the derivative financial instruments by type and purpose of derivatives atMarch 31, 2015 and 2014.
At March 31, 2015
Trading Risk Management(1)
Notionalamounts Assets Liabilities
Notionalamounts Assets Liabilities
(In millions)
Interest rate derivatives . . . . . . ¥687,138,214 ¥3,619,256 ¥3,692,925 ¥58,945,067 ¥758,978 ¥ 722,234Futures . . . . . . . . . . . . . . 149,155,836 79,448 91,667 10,731,918 — 5,071Listed Options . . . . . . . . . 36,729,312 7,097 151 — — —Forwards . . . . . . . . . . . . . 13,617,468 3 139 — — —Swaps . . . . . . . . . . . . . . . 448,821,964 3,446,290 3,490,754 48,070,491 758,745 717,017OTC Options . . . . . . . . . . 38,813,634 86,418 110,214 142,658 233 146
Currency derivatives . . . . . . . . 95,450,773 1,840,958 1,739,303 7,661,419 173,920 491,857Futures . . . . . . . . . . . . . . 81,429 181 — — — —Listed Options . . . . . . . . . — — — — — —Forwards . . . . . . . . . . . . . 62,599,181 1,266,650 1,399,095 822,103 12,714 8,327Swaps . . . . . . . . . . . . . . . 26,890,783 444,330 150,459 6,839,316 161,206 483,530OTC Options . . . . . . . . . . 5,879,380 129,797 189,749 — — —
Equity derivatives . . . . . . . . . . 2,139,981 44,862 53,864 184,354 1,687 15,010Futures . . . . . . . . . . . . . . 1,274,309 7,649 12,272 118,376 1,687 —Listed Options . . . . . . . . . 323,588 11,546 16,412 — — —Forwards . . . . . . . . . . . . . 50,198 908 281 — — —Swaps . . . . . . . . . . . . . . . 32,130 67 1,341 65,978 — 15,010OTC Options . . . . . . . . . . 459,756 24,692 23,558 — — —
Commodity derivatives . . . . . . 247,769 19,580 19,465 — — —Futures . . . . . . . . . . . . . . 29,706 1,829 2,466 — — —Listed Options . . . . . . . . . — — — — — —Forwards . . . . . . . . . . . . . — — — — — —Swaps . . . . . . . . . . . . . . . 193,438 17,481 16,128 — — —OTC Options . . . . . . . . . . 24,625 270 871 — — —
Credit derivatives . . . . . . . . . . 1,271,457 11,962 5,129 — — —
Total derivative financialinstruments . . . . . . . . . . . . . ¥786,248,194 ¥5,536,618 ¥5,510,686 ¥66,790,840 ¥934,585 ¥1,229,101
F-41

At March 31, 2014
Trading Risk Management(1)
Notionalamounts Assets Liabilities
Notionalamounts Assets Liabilities
(In millions)Interest rate derivatives . . . . . . ¥556,364,929 ¥3,321,845 ¥3,351,307 ¥46,375,105 ¥523,564 ¥510,239
Futures . . . . . . . . . . . . . . . 60,037,460 20,280 21,092 823,040 38 13Listed Options . . . . . . . . . 27,637,310 4,257 86 — — —Forwards . . . . . . . . . . . . . 9,867,210 4 45 — — —Swaps . . . . . . . . . . . . . . . 429,433,691 3,224,168 3,246,043 45,493,987 522,927 509,779OTC Options . . . . . . . . . . 29,389,258 73,136 84,041 58,078 599 447
Currency derivatives . . . . . . . . 78,485,136 922,695 869,140 5,371,395 54,923 188,911Futures . . . . . . . . . . . . . . . 70,453 32 — — — —Listed Options . . . . . . . . . — — — — — —Forwards . . . . . . . . . . . . . 50,921,507 479,577 535,702 333,924 1,119 —Swaps . . . . . . . . . . . . . . . 21,998,144 318,491 166,867 5,037,471 53,804 188,911OTC Options . . . . . . . . . . 5,495,032 124,595 166,571 — — —
Equity derivatives . . . . . . . . . . 1,315,207 31,536 35,521 115,245 4,174 708Futures . . . . . . . . . . . . . . . 693,031 1,987 3,886 — — —Listed Options . . . . . . . . . 149,355 3,108 4,733 — — —Forwards . . . . . . . . . . . . . 14,996 — 262 — — —Swaps . . . . . . . . . . . . . . . 10,304 — 983 115,245 4,174 708OTC Options . . . . . . . . . . 447,521 26,441 25,657 — — —
Commodity derivatives . . . . . . 203,071 26,816 17,810 — — —Futures . . . . . . . . . . . . . . . 13,766 122 121 — — —Listed Options . . . . . . . . . — — — — — —Forwards . . . . . . . . . . . . . — — — — — —Swaps . . . . . . . . . . . . . . . 178,251 26,300 17,146 — — —OTC Options . . . . . . . . . . 11,054 394 543 — — —
Credit derivatives . . . . . . . . . . 1,834,065 5,829 7,355 — — —
Total derivative financialinstruments . . . . . . . . . . . . . ¥638,202,408 ¥4,308,721 ¥4,281,133 ¥51,861,745 ¥582,661 ¥699,858
(1) Derivative financial instruments categorized as “Risk Management” are used for economic hedging, such as managing the exposure tochanges in fair value of the loan portfolio, and are identified as hedges under Japanese GAAP, but the SMFG Group does not applyhedge accounting under IFRS.
Credit derivatives
The SMFG Group enters into credit derivatives to manage the risk of its commercial banking creditportfolio containing loans by hedging, as well as diversifying the credit exposure in the portfolio, and toundertake credit loss protection transactions based on the needs from customers as financial intermediation. Thetables below provide information regarding the notional amounts and the fair value of credit derivatives bypurpose at March 31, 2015 and 2014.
At March 31, 2015
Protection purchased Protection sold
Notionalamounts Assets Liabilities
Notionalamounts Assets Liabilities
(In millions)Managing the SMFG Group’s credit
risk portfolio . . . . . . . . . . . . . . . . . . . . . ¥414,093 ¥ 60 ¥ 3,387 ¥519,772 ¥ 7,732 ¥ 62Facilitating client transactions . . . . . . . . . 115,759 117 1,508 221,833 4,053 172
Total . . . . . . . . . . . . . . . . . . . . . . . . . ¥529,852 ¥ 177 ¥ 4,895 ¥741,605 ¥ 11,785 ¥ 234
F-42

At March 31, 2014
Protection purchased Protection sold
Notionalamounts Assets Liabilities
Notionalamounts Assets Liabilities
(In millions)
Managing the SMFG Group’s creditrisk portfolio . . . . . . . . . . . . . . . . . . . ¥322,423 ¥ 82 ¥ 2,258 ¥ 426,751 ¥ 1,200 ¥ 2,500
Facilitating client transactions . . . . . . . . 487,096 738 1,326 597,795 3,809 1,271
Total . . . . . . . . . . . . . . . . . . . . . . . ¥809,519 ¥ 820 ¥ 3,584 ¥1,024,546 ¥ 5,009 ¥ 3,771
The following table summarizes the notional amounts of the SMFG Group’s credit derivative portfolio bytype of counterparty at March 31, 2015 and 2014.
At March 31, 2015 At March 31, 2014
Protectionpurchased
Protectionsold
Protectionpurchased
Protectionsold
(In millions)
Banks and broker-dealers . . . . . . . . . . . . . . . . . . . . . . . . . . . . ¥ 499,569 ¥741,605 ¥ 616,350 ¥1,024,546Insurance and other financial guaranty firms . . . . . . . . . . . . . 30,283 — 193,169 —
Total . . . . . . . . . . . . . . . . . . . . . . . . . . . . . . . . . . . . . . . . ¥ 529,852 ¥741,605 ¥ 809,519 ¥1,024,546
8 FINANCIAL ASSETS AT FAIR VALUE THROUGH PROFIT OR LOSS
Financial assets at fair value through profit or loss at March 31, 2015 and 2014 consisted of the following:
At March 31,
2015 2014
(In millions)
Debt instruments . . . . . . . . . . . . . . . . . . . . . . . . . . . . . . . . . . . . . . . . . . . . . . . . . . . . . . . ¥1,654,259 ¥1,697,872Equity instruments . . . . . . . . . . . . . . . . . . . . . . . . . . . . . . . . . . . . . . . . . . . . . . . . . . . . . . 131,425 142,383
Total financial assets at fair value through profit or loss . . . . . . . . . . . . . . . . . . . . ¥1,785,684 ¥1,840,255
The SMFG Group classifies the entire hybrid instrument as financial assets at fair value through profit orloss when the SMFG Group is required to separate an embedded derivative from its host contract, but is unable tomeasure the embedded derivative separately either at acquisition or at the end of a subsequent reporting period.
The SMFG Group also classifies certain financial assets held by a venture capital investment subsidiary asfinancial assets at fair value through profit or loss. These financial assets are managed and their performance isevaluated on a fair value basis in accordance with a documented risk management or investment strategy.
F-43

9 INVESTMENT SECURITIES
Investment securities at March 31, 2015 and 2014 consisted of the following:
At March 31,
2015 2014
(In millions)
Held-to-maturity investments:Domestic:Japanese government bonds . . . . . . . . . . . . . . . . . . . . . . . . . . . . . . . . . . . . . . . . . . . . ¥ 3,282,787 ¥ 4,330,877Japanese municipal bonds . . . . . . . . . . . . . . . . . . . . . . . . . . . . . . . . . . . . . . . . . . . . . . 67,843 102,580Japanese corporate bonds . . . . . . . . . . . . . . . . . . . . . . . . . . . . . . . . . . . . . . . . . . . . . . 46,265 94,797
Total domestic . . . . . . . . . . . . . . . . . . . . . . . . . . . . . . . . . . . . . . . . . . . . . . . . . . . 3,396,895 4,528,254
Total held-to-maturity investments . . . . . . . . . . . . . . . . . . . . . . . . . . . . . . . ¥ 3,396,895 ¥ 4,528,254
Available-for-sale financial assets:Domestic:Japanese government bonds . . . . . . . . . . . . . . . . . . . . . . . . . . . . . . . . . . . . . . . . . . . . ¥ 9,389,959 ¥ 8,261,809Japanese municipal bonds . . . . . . . . . . . . . . . . . . . . . . . . . . . . . . . . . . . . . . . . . . . . . . 52,150 125,804Japanese corporate bonds . . . . . . . . . . . . . . . . . . . . . . . . . . . . . . . . . . . . . . . . . . . . . . 231,591 515,280
Total domestic debt instruments . . . . . . . . . . . . . . . . . . . . . . . . . . . . . . . . . . . . . 9,673,700 8,902,893Equity instruments . . . . . . . . . . . . . . . . . . . . . . . . . . . . . . . . . . . . . . . . . . . . . . . . . . . . 5,676,371 4,470,247
Total domestic . . . . . . . . . . . . . . . . . . . . . . . . . . . . . . . . . . . . . . . . . . . . . . . . . . . 15,350,071 13,373,140
Foreign:U.S. Treasury and other U.S. government agency bonds . . . . . . . . . . . . . . . . . . . . . . 2,062,043 1,871,757Bonds issued by other governments and official institutions . . . . . . . . . . . . . . . . . . . 2,205,662 1,216,197Mortgage-backed securities . . . . . . . . . . . . . . . . . . . . . . . . . . . . . . . . . . . . . . . . . . . . 257,100 241,649Other debt instruments . . . . . . . . . . . . . . . . . . . . . . . . . . . . . . . . . . . . . . . . . . . . . . . . 214,943 241,800
Total foreign debt instruments . . . . . . . . . . . . . . . . . . . . . . . . . . . . . . . . . . . . . . 4,739,748 3,571,403Equity instruments . . . . . . . . . . . . . . . . . . . . . . . . . . . . . . . . . . . . . . . . . . . . . . . . . . . . 752,942 580,201
Total foreign . . . . . . . . . . . . . . . . . . . . . . . . . . . . . . . . . . . . . . . . . . . . . . . . . . . . 5,492,690 4,151,604
Total available-for-sale financial assets . . . . . . . . . . . . . . . . . . . . . . . . . . . ¥20,842,761 ¥17,524,744
Total investment securities . . . . . . . . . . . . . . . . . . . . . . . . . . . . . . . . . ¥24,239,656 ¥22,052,998
F-44

10 LOANS AND ADVANCES
The following are the principal components of loans and advances at March 31, 2015 and 2014 by industryclassification.
At March 31,
2015 2014
(In millions)Domestic:Manufacturing . . . . . . . . . . . . . . . . . . . . . . . . . . . . . . . . . . . . . . . . . . . . . . . . . . . . . . . ¥ 8,061,654 ¥ 8,018,568Agriculture, forestry, fisheries and mining . . . . . . . . . . . . . . . . . . . . . . . . . . . . . . . . . 171,855 177,012Construction . . . . . . . . . . . . . . . . . . . . . . . . . . . . . . . . . . . . . . . . . . . . . . . . . . . . . . . . 1,150,616 1,152,388Transportation, communications and public enterprises . . . . . . . . . . . . . . . . . . . . . . . 5,175,949 5,086,361Wholesale and retail . . . . . . . . . . . . . . . . . . . . . . . . . . . . . . . . . . . . . . . . . . . . . . . . . . 5,664,385 5,505,570Finance and insurance . . . . . . . . . . . . . . . . . . . . . . . . . . . . . . . . . . . . . . . . . . . . . . . . . 2,869,967 2,537,347Real estate and goods rental and leasing . . . . . . . . . . . . . . . . . . . . . . . . . . . . . . . . . . . 8,766,724 8,117,000Services . . . . . . . . . . . . . . . . . . . . . . . . . . . . . . . . . . . . . . . . . . . . . . . . . . . . . . . . . . . . 4,776,706 4,855,536Municipalities . . . . . . . . . . . . . . . . . . . . . . . . . . . . . . . . . . . . . . . . . . . . . . . . . . . . . . . 1,353,949 1,279,010Lease financing . . . . . . . . . . . . . . . . . . . . . . . . . . . . . . . . . . . . . . . . . . . . . . . . . . . . . . 2,211,773 2,133,760Consumer(1) . . . . . . . . . . . . . . . . . . . . . . . . . . . . . . . . . . . . . . . . . . . . . . . . . . . . . . . . . 18,817,259 19,086,241Others . . . . . . . . . . . . . . . . . . . . . . . . . . . . . . . . . . . . . . . . . . . . . . . . . . . . . . . . . . . . . 3,211,240 3,159,438
Total domestic . . . . . . . . . . . . . . . . . . . . . . . . . . . . . . . . . . . . . . . . . . . . . . . . . . . 62,232,077 61,108,231
Foreign:Public sector . . . . . . . . . . . . . . . . . . . . . . . . . . . . . . . . . . . . . . . . . . . . . . . . . . . . . . . . 164,495 163,685Financial institutions . . . . . . . . . . . . . . . . . . . . . . . . . . . . . . . . . . . . . . . . . . . . . . . . . . 3,880,655 3,450,482Commerce and industry . . . . . . . . . . . . . . . . . . . . . . . . . . . . . . . . . . . . . . . . . . . . . . . 20,010,729 16,435,047Lease financing . . . . . . . . . . . . . . . . . . . . . . . . . . . . . . . . . . . . . . . . . . . . . . . . . . . . . . 308,128 267,394Others . . . . . . . . . . . . . . . . . . . . . . . . . . . . . . . . . . . . . . . . . . . . . . . . . . . . . . . . . . . . . 1,375,624 947,826
Total foreign . . . . . . . . . . . . . . . . . . . . . . . . . . . . . . . . . . . . . . . . . . . . . . . . . . . . 25,739,631 21,264,434
Gross loans and advances . . . . . . . . . . . . . . . . . . . . . . . . . . . . . . . . . . . . . . . . . . . . . . 87,971,708 82,372,665Adjust: Unearned income, unamortized premiums—net and deferred loan
fees—net . . . . . . . . . . . . . . . . . . . . . . . . . . . . . . . . . . . . . . . . . . . . . . . . . . . . . . . . . (206,440) (177,018)Less: Allowance for loan losses . . . . . . . . . . . . . . . . . . . . . . . . . . . . . . . . . . . . . . . . . (793,552) (950,665)
Net loans and advances . . . . . . . . . . . . . . . . . . . . . . . . . . . . . . . . . . . . . . . . . . . . ¥86,971,716 ¥81,244,982
(1) The balance in Consumer mainly consists of housing loans. The housing loan balances amounted to ¥14,087,453 million and¥14,420,225 million at March 31, 2015 and 2014, respectively.
F-45

Reconciliation of allowance for loan losses is as follows:
For the fiscal year ended March 31,
2015 2014 2013
(In millions, except percentages)
Allowance for loan losses at beginning of period . . . . . . . . . . . . . . . . . . . . ¥950,665 ¥1,262,478 ¥1,381,164Provision (credit) for loan losses . . . . . . . . . . . . . . . . . . . . . . . . . . . . . . . . . 79,552 (25,806) 138,375
Charge-offs:Domestic . . . . . . . . . . . . . . . . . . . . . . . . . . . . . . . . . . . . . . . . . . . 240,663 283,034 241,137Foreign . . . . . . . . . . . . . . . . . . . . . . . . . . . . . . . . . . . . . . . . . . . . . 9,233 19,647 23,061
Total . . . . . . . . . . . . . . . . . . . . . . . . . . . . . . . . . . . . . . . . . . . 249,896 302,681 264,198
Recoveries:Domestic . . . . . . . . . . . . . . . . . . . . . . . . . . . . . . . . . . . . . . . . . . . 9,517 9,293 10,103Foreign . . . . . . . . . . . . . . . . . . . . . . . . . . . . . . . . . . . . . . . . . . . . . 380 362 333
Total . . . . . . . . . . . . . . . . . . . . . . . . . . . . . . . . . . . . . . . . . . . 9,897 9,655 10,436
Net charge-offs . . . . . . . . . . . . . . . . . . . . . . . . . . . . . . . . . . . . . . . . . . . . . . . 239,999 293,026 253,762Others(1) . . . . . . . . . . . . . . . . . . . . . . . . . . . . . . . . . . . . . . . . . . . . . . . . . . . . 3,334 7,019 (3,299)
Allowance for loan losses at end of period . . . . . . . . . . . . . . . . . . . . . . . . . ¥793,552 ¥ 950,665 ¥1,262,478
Allowance for loan losses applicable to foreign activities:Balance at beginning of period . . . . . . . . . . . . . . . . . . . . . . . . . . . . . . ¥ 73,030 ¥ 74,868 ¥ 87,344
Balance at end of period . . . . . . . . . . . . . . . . . . . . . . . . . . . . . . . . . . . . ¥100,783 ¥ 73,030 ¥ 74,868
Provision for loan losses . . . . . . . . . . . . . . . . . . . . . . . . . . . . . . . . . . . ¥ 32,712 ¥ 10,462 ¥ 1,692
Ratio of net charge-offs to average loans outstanding during the period . . 0.28% 0.36% 0.34%
(1) Others mainly include foreign exchange translations for the fiscal years ended March 31, 2015 and 2014, whereas the amount for thefiscal year ended March 31, 2013 mainly includes foreign exchange translations as well as the exclusion of the allowance for loan lossesrelated to ORIX Credit Corporation, as SMBC transferred all of its shares of ORIX Credit Corporation to ORIX Corporation inJune 2012.
F-46

11 INVESTMENTS IN ASSOCIATES AND JOINT VENTURES
The following table presents the SMFG Group’s principal associates and joint venture at March 31, 2015.Investments in associates and joint ventures of the SMFG Group are accounted for using the equity methodunless they are held for sale.
Company NameCountry of
Incorporation
Proportionof Ownership
Interest(1)
Proportionof VotingRights(1) Main Business
(%) (%)
Principal AssociatesThe Japan Net Bank, Limited . . . . . . . . . . Japan 41.1 41.1 Internet bankingPT Bank Tabungan Pensiunan Nasional
Tbk . . . . . . . . . . . . . . . . . . . . . . . . . . . . Indonesia 40.0 40.0 Commercial bankingThe Bank of East Asia, Limited . . . . . . . . China 17.4 17.4 Commercial bankingVietnam Export Import Commercial Joint
Stock Bank . . . . . . . . . . . . . . . . . . . . . . Vietnam 15.0 15.0 Commercial bankingSumitomo Mitsui Auto Service
Company, Limited . . . . . . . . . . . . . . . . Japan 33.9 33.9 LeasingNEC Capital Solutions Limited . . . . . . . . Japan 25.0 25.0 LeasingPOCKET CARD CO., LTD. . . . . . . . . . . Japan 35.5 35.5 Credit cardJSOL Corporation . . . . . . . . . . . . . . . . . . . Japan 50.0 50.0 System development and
data processingSakura Information Systems Co., Ltd. . . . Japan 49.0 49.0 System engineering and
data processingDaiwa SB Investments Ltd. . . . . . . . . . . . Japan 43.9 43.9 Investment advisory and
investment trustmanagement
Sumitomo Mitsui Asset ManagementCompany, Limited . . . . . . . . . . . . . . . . Japan 40.0 40.0 Investment advisory and
investment trustmanagement
China Post & Capital Fund ManagementCo., Ltd. . . . . . . . . . . . . . . . . . . . . . . . . China 24.0 24.0 Investment advisory and
investment trustmanagement
Principal Joint VentureDaiwa Securities SMBC Principal
Investments Co., Ltd. . . . . . . . . . . . . . . Japan 40.0 40.0 Investments, fundmanagement
(1) Percentages of proportion of ownership interest and proportion of voting rights have been truncated.
The SMFG Group accounts for certain investees, including Vietnam Export Import Commercial Joint StockBank and The Bank of East Asia, Limited, as associates regardless of its below 20% holdings of the voting rightsto these investees, since the SMFG Group has the ability to exercise significant influence over these investeesthrough participation in the policy making process at the meeting of the board of directors, the provision ofessential technical information, or other relevant agreements or relationships.
On the other hand, the SMFG Group accounts for certain investees as available-for-sale financial assetsregardless of its 20% or more holdings of the voting rights to these investees because the SMFG Group hascontracts or arrangements with other investors by which the SMFG Group loses the power to exert significantinfluence over such investees.
F-47

The SMFG Group has interests in a number of associates and joint ventures, none of which are regarded asindividually material. The following table summarizes, in aggregate, the financial information of all individuallyimmaterial associates and joint ventures that are accounted for using the equity method:
At and for the fiscal year endedMarch 31,
2015 2014
(In millions)Carrying amount of investments in associates and joint ventures . . . . . . . . . . . . . . ¥ 619,814 ¥ 383,590Share of:
Profit from continuing operations . . . . . . . . . . . . . . . . . . . . . . . . . . . . . . . . . . . 18,124 19,454Other comprehensive income (loss) . . . . . . . . . . . . . . . . . . . . . . . . . . . . . . . . . 5,754 (5,291)Total comprehensive income . . . . . . . . . . . . . . . . . . . . . . . . . . . . . . . . . . . . . . 23,878 14,163
There are no significant restrictions on the ability of associates or joint ventures to transfer funds to theSMFG Group in the form of cash dividends, repayment of loans and advances.
12 PROPERTY, PLANT AND EQUIPMENT
The table below shows the changes in property, plant and equipment for the fiscal years ended March 31,2015 and 2014.
Assets forrent Land Buildings
Leasedassets Others Total
(In millions)Cost . . . . . . . . . . . . . . . . . . . . . . . . . . . . . . . . . . . . . . ¥1,003,315 ¥484,186 ¥ 628,293 ¥16,114 ¥ 383,819 ¥2,515,727Accumulated depreciation and impairment losses . . (137,490) (6,259) (340,845) (7,049) (266,090) (757,733)
Net carrying amount at April 1, 2013 . . . . . . . . . . . . 865,825 477,927 287,448 9,065 117,729 1,757,994
Additions . . . . . . . . . . . . . . . . . . . . . . . . . . . . . . 271,427 685 20,966 1,510 82,078 376,666Acquisition of subsidiaries . . . . . . . . . . . . . . . . 103,187 — 135 — 425 103,747Disposals . . . . . . . . . . . . . . . . . . . . . . . . . . . . . . (104,944) (11,572) (2,894) (31) (1,615) (121,056)Depreciation . . . . . . . . . . . . . . . . . . . . . . . . . . . . (53,679) — (20,802) (2,000) (28,585) (105,066)Impairment losses . . . . . . . . . . . . . . . . . . . . . . . — (659) (2,409) — (89) (3,157)Exchange differences . . . . . . . . . . . . . . . . . . . . . 74,434 6 575 4 1,186 76,205Others . . . . . . . . . . . . . . . . . . . . . . . . . . . . . . . . . 2,168 1,419 7,455 (18) (17,430) (6,406)
Net carrying amount . . . . . . . . . . . . . . . . . . . . . 1,158,418 467,806 290,474 8,530 153,699 2,078,927
Cost . . . . . . . . . . . . . . . . . . . . . . . . . . . . . . . . . . . . . . 1,338,742 473,454 644,824 16,205 421,569 2,894,794Accumulated depreciation and impairment losses . . (180,324) (5,648) (354,350) (7,675) (267,870) (815,867)
Net carrying amount at March 31, 2014 . . . . . . . . . . 1,158,418 467,806 290,474 8,530 153,699 2,078,927
Additions . . . . . . . . . . . . . . . . . . . . . . . . . . . . . . 357,920 27,162 34,459 1,809 71,179 492,529Acquisition of subsidiaries . . . . . . . . . . . . . . . . — — — — — —Disposals . . . . . . . . . . . . . . . . . . . . . . . . . . . . . . (106,934) (2,021) (1,618) (48) (1,260) (111,881)Depreciation . . . . . . . . . . . . . . . . . . . . . . . . . . . . (64,380) — (21,879) (1,940) (30,939) (119,138)Impairment losses . . . . . . . . . . . . . . . . . . . . . . . — (228) (4,867) — (13) (5,108)Exchange differences . . . . . . . . . . . . . . . . . . . . . 173,251 13 909 11 2,032 176,216Others . . . . . . . . . . . . . . . . . . . . . . . . . . . . . . . . . (11,566) — 5,163 6 (8,651) (15,048)
Net carrying amount . . . . . . . . . . . . . . . . . . . . . 1,506,709 492,732 302,641 8,368 186,047 2,496,497
Cost . . . . . . . . . . . . . . . . . . . . . . . . . . . . . . . . . . . . . . 1,747,839 497,772 679,567 16,693 466,584 3,408,455Accumulated depreciation and impairment losses . . (241,130) (5,040) (376,926) (8,325) (280,537) (911,958)
Net carrying amount at March 31, 2015 . . . . . . . . . . ¥1,506,709 ¥492,732 ¥ 302,641 ¥ 8,368 ¥ 186,047 ¥2,496,497
The impairment losses on property, plant and equipment are included in “Other expenses” in theconsolidated income statement.
F-48
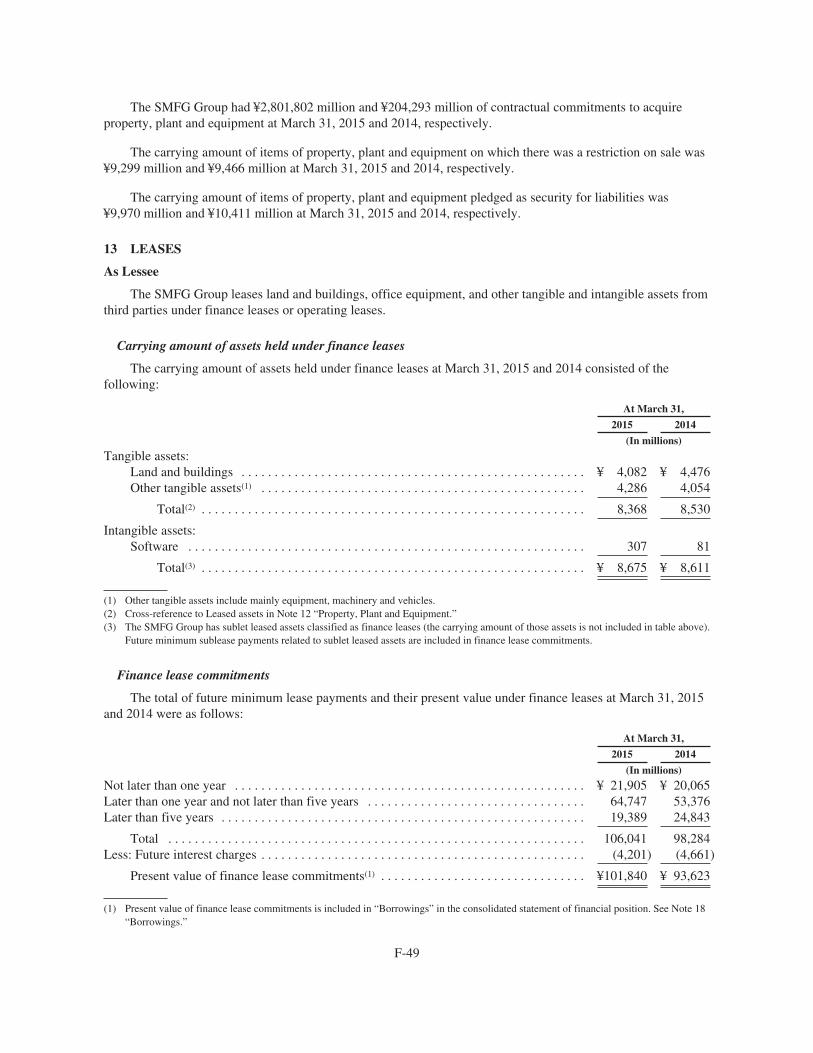
The SMFG Group had ¥2,801,802 million and ¥204,293 million of contractual commitments to acquireproperty, plant and equipment at March 31, 2015 and 2014, respectively.
The carrying amount of items of property, plant and equipment on which there was a restriction on sale was¥9,299 million and ¥9,466 million at March 31, 2015 and 2014, respectively.
The carrying amount of items of property, plant and equipment pledged as security for liabilities was¥9,970 million and ¥10,411 million at March 31, 2015 and 2014, respectively.
13 LEASES
As Lessee
The SMFG Group leases land and buildings, office equipment, and other tangible and intangible assets fromthird parties under finance leases or operating leases.
Carrying amount of assets held under finance leases
The carrying amount of assets held under finance leases at March 31, 2015 and 2014 consisted of thefollowing:
At March 31,
2015 2014
(In millions)
Tangible assets:Land and buildings . . . . . . . . . . . . . . . . . . . . . . . . . . . . . . . . . . . . . . . . . . . . . . . . . . . . ¥ 4,082 ¥ 4,476Other tangible assets(1) . . . . . . . . . . . . . . . . . . . . . . . . . . . . . . . . . . . . . . . . . . . . . . . . . 4,286 4,054
Total(2) . . . . . . . . . . . . . . . . . . . . . . . . . . . . . . . . . . . . . . . . . . . . . . . . . . . . . . . . . . 8,368 8,530
Intangible assets:Software . . . . . . . . . . . . . . . . . . . . . . . . . . . . . . . . . . . . . . . . . . . . . . . . . . . . . . . . . . . . 307 81
Total(3) . . . . . . . . . . . . . . . . . . . . . . . . . . . . . . . . . . . . . . . . . . . . . . . . . . . . . . . . . . ¥ 8,675 ¥ 8,611
(1) Other tangible assets include mainly equipment, machinery and vehicles.(2) Cross-reference to Leased assets in Note 12 “Property, Plant and Equipment.”(3) The SMFG Group has sublet leased assets classified as finance leases (the carrying amount of those assets is not included in table above).
Future minimum sublease payments related to sublet leased assets are included in finance lease commitments.
Finance lease commitments
The total of future minimum lease payments and their present value under finance leases at March 31, 2015and 2014 were as follows:
At March 31,
2015 2014
(In millions)
Not later than one year . . . . . . . . . . . . . . . . . . . . . . . . . . . . . . . . . . . . . . . . . . . . . . . . . . . . . ¥ 21,905 ¥ 20,065Later than one year and not later than five years . . . . . . . . . . . . . . . . . . . . . . . . . . . . . . . . . 64,747 53,376Later than five years . . . . . . . . . . . . . . . . . . . . . . . . . . . . . . . . . . . . . . . . . . . . . . . . . . . . . . . 19,389 24,843
Total . . . . . . . . . . . . . . . . . . . . . . . . . . . . . . . . . . . . . . . . . . . . . . . . . . . . . . . . . . . . . . . 106,041 98,284Less: Future interest charges . . . . . . . . . . . . . . . . . . . . . . . . . . . . . . . . . . . . . . . . . . . . . . . . . (4,201) (4,661)
Present value of finance lease commitments(1) . . . . . . . . . . . . . . . . . . . . . . . . . . . . . . . ¥101,840 ¥ 93,623
(1) Present value of finance lease commitments is included in “Borrowings” in the consolidated statement of financial position. See Note 18“Borrowings.”
F-49

At March 31, 2015 and 2014, the total amounts of future minimum sublease payments to be received undernon-cancellable subleases were ¥66,400 million and ¥53,965 million, respectively.
Operating lease commitments
The total amounts of future minimum lease payments under non-cancellable operating leases at March 31,2015 and 2014 were as follows:
At March 31,
2015 2014
(In millions)Not later than one year . . . . . . . . . . . . . . . . . . . . . . . . . . . . . . . . . . . . . . . . . . . . . . . . . . . . . ¥ 44,637 ¥ 43,499Later than one year and not later than five years . . . . . . . . . . . . . . . . . . . . . . . . . . . . . . . . . 113,256 117,461Later than five years . . . . . . . . . . . . . . . . . . . . . . . . . . . . . . . . . . . . . . . . . . . . . . . . . . . . . . . 126,404 147,721
Total future minimum lease payments under non-cancellable operating leases . . . . . . ¥284,297 ¥308,681
For the fiscal years ended March 31, 2015, 2014 and 2013, ¥46,591 million, ¥45,572 million and ¥41,709 millionwere recognized as expenses in respect of operating lease and sublease agreements, of which ¥46,328 million,¥45,508 million and ¥41,660 million related to minimum lease payments, and ¥263 million, ¥64 million and¥49 million related to sublease payments, respectively. Lease expenses recognized in respect of lease and subleaseagreements are included in “General and administrative expenses” in the consolidated income statement.
As Lessor
The SMFG Group leases assets to third parties under finance leases or operating leases, includingmachinery, equipment, aircraft, vessel and property.
Finance lease receivable
The gross investment in the lease, unearned finance income, present value of the minimum lease paymentsreceivable and unguaranteed residual values under finance leases at March 31, 2015 and 2014 were as follows:
At March 31, 2015
Gross investmentin the lease
Unearnedfinanceincome
Present value ofthe minimum
lease paymentsreceivable(1)
Unguaranteedresidual values(1)
(In millions)Not later than one year . . . . . . . . . . . . . . . . . . . . . . . ¥ 846,429 ¥ 76,587 ¥ 769,842 ¥ 39,597Later than one year and not later than five years . . . 1,402,363 112,891 1,289,472 88,810Later than five years . . . . . . . . . . . . . . . . . . . . . . . . . 295,901 34,213 261,688 70,492
Total . . . . . . . . . . . . . . . . . . . . . . . . . . . . . . . . . ¥ 2,544,693 ¥ 223,691 ¥ 2,321,002 ¥ 198,899
At March 31, 2014
Gross investmentin the lease
Unearnedfinanceincome
Present value ofthe minimum
lease paymentsreceivable(1)
Unguaranteedresidual values(1)
(In millions)Not later than one year . . . . . . . . . . . . . . . . . . . . . . . ¥ 766,062 ¥ 72,739 ¥ 693,323 ¥ 30,393Later than one year and not later than five years . . . 1,359,686 106,924 1,252,762 89,493Later than five years . . . . . . . . . . . . . . . . . . . . . . . . . 299,862 35,143 264,719 70,464
Total . . . . . . . . . . . . . . . . . . . . . . . . . . . . . . . . . ¥ 2,425,610 ¥ 214,806 ¥ 2,210,804 ¥ 190,350
(1) Present value of the minimum lease payments receivable and unguaranteed residual values are included in “Loans and advances” in theconsolidated statement of financial position.
F-50
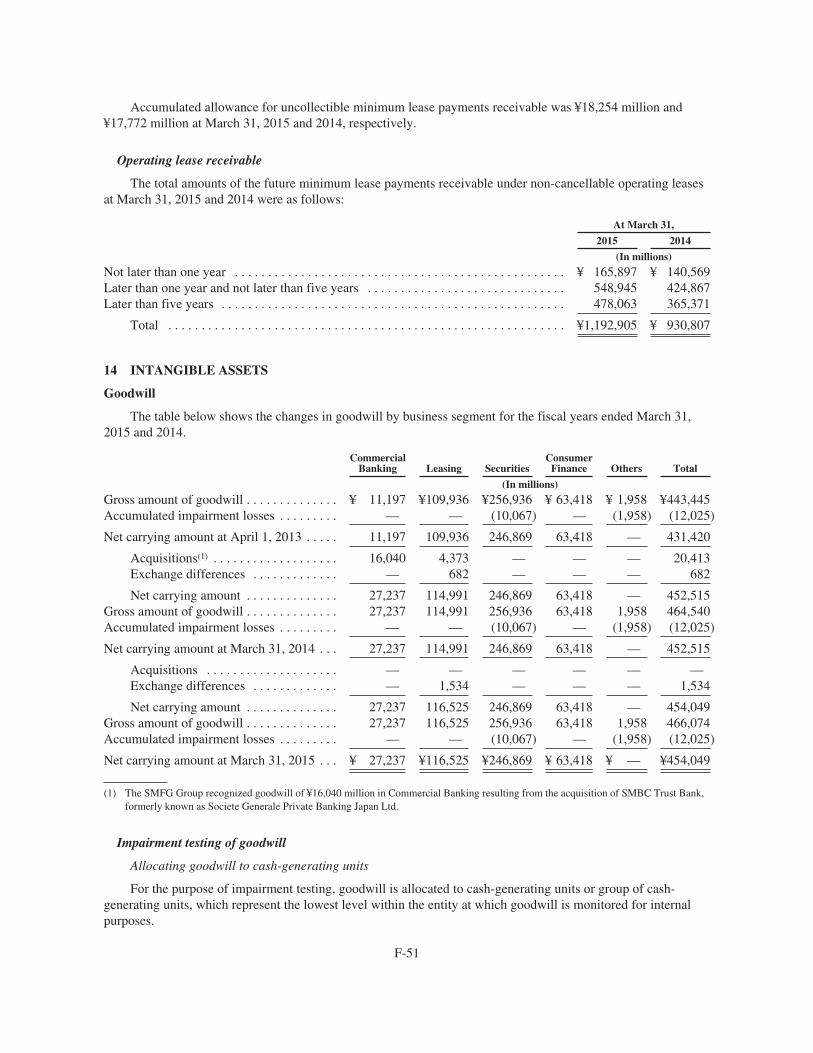
Accumulated allowance for uncollectible minimum lease payments receivable was ¥18,254 million and¥17,772 million at March 31, 2015 and 2014, respectively.
Operating lease receivable
The total amounts of the future minimum lease payments receivable under non-cancellable operating leasesat March 31, 2015 and 2014 were as follows:
At March 31,
2015 2014
(In millions)
Not later than one year . . . . . . . . . . . . . . . . . . . . . . . . . . . . . . . . . . . . . . . . . . . . . . . . . . ¥ 165,897 ¥ 140,569Later than one year and not later than five years . . . . . . . . . . . . . . . . . . . . . . . . . . . . . . 548,945 424,867Later than five years . . . . . . . . . . . . . . . . . . . . . . . . . . . . . . . . . . . . . . . . . . . . . . . . . . . . 478,063 365,371
Total . . . . . . . . . . . . . . . . . . . . . . . . . . . . . . . . . . . . . . . . . . . . . . . . . . . . . . . . . . . . ¥1,192,905 ¥ 930,807
14 INTANGIBLE ASSETS
Goodwill
The table below shows the changes in goodwill by business segment for the fiscal years ended March 31,2015 and 2014.
CommercialBanking Leasing Securities
ConsumerFinance Others Total
(In millions)
Gross amount of goodwill . . . . . . . . . . . . . . ¥ 11,197 ¥109,936 ¥256,936 ¥ 63,418 ¥ 1,958 ¥443,445Accumulated impairment losses . . . . . . . . . — — (10,067) — (1,958) (12,025)
Net carrying amount at April 1, 2013 . . . . . 11,197 109,936 246,869 63,418 — 431,420
Acquisitions(1) . . . . . . . . . . . . . . . . . . . 16,040 4,373 — — — 20,413Exchange differences . . . . . . . . . . . . . — 682 — — — 682
Net carrying amount . . . . . . . . . . . . . . 27,237 114,991 246,869 63,418 — 452,515Gross amount of goodwill . . . . . . . . . . . . . . 27,237 114,991 256,936 63,418 1,958 464,540Accumulated impairment losses . . . . . . . . . — — (10,067) — (1,958) (12,025)
Net carrying amount at March 31, 2014 . . . 27,237 114,991 246,869 63,418 — 452,515
Acquisitions . . . . . . . . . . . . . . . . . . . . — — — — — —Exchange differences . . . . . . . . . . . . . — 1,534 — — — 1,534
Net carrying amount . . . . . . . . . . . . . . 27,237 116,525 246,869 63,418 — 454,049Gross amount of goodwill . . . . . . . . . . . . . . 27,237 116,525 256,936 63,418 1,958 466,074Accumulated impairment losses . . . . . . . . . — — (10,067) — (1,958) (12,025)
Net carrying amount at March 31, 2015 . . . ¥ 27,237 ¥116,525 ¥246,869 ¥ 63,418 ¥ — ¥454,049
(1) The SMFG Group recognized goodwill of ¥16,040 million in Commercial Banking resulting from the acquisition of SMBC Trust Bank,formerly known as Societe Generale Private Banking Japan Ltd.
Impairment testing of goodwill
Allocating goodwill to cash-generating units
For the purpose of impairment testing, goodwill is allocated to cash-generating units or group of cash-generating units, which represent the lowest level within the entity at which goodwill is monitored for internalpurposes.
F-51

At March 31, 2015 and 2014, the SMFG Group allocated goodwill to KUBC and SMBC Trust Bank withinCommercial Banking amounting to ¥11,197 million and ¥16,040 million, respectively, to SMFL within Leasingamounting to ¥102,710 million, to SMBC Nikko Securities and SMBC Friend Securities within Securitiesamounting to ¥172,253 million and ¥74,616 million, respectively, and to SMBC Consumer Finance withinConsumer Finance amounting to ¥56,692 million.
The aggregate amounts of other goodwill were ¥20,541 million and ¥19,007 million at March 31, 2015 and2014, respectively, and they were not considered individually significant.
Timing of impairment tests
The SMFG Group performs impairment tests at least annually and whenever there is an indication that thecash-generating unit may be impaired.
Recoverable amount of cash-generating units
To determine whether an impairment loss shall be recognized, the carrying amount of a cash-generating unitis compared to its recoverable amount. The recoverable amount of a cash-generating unit is the higher of its fairvalue less costs to sell and its value in use.
Fair value less costs to sell: The fair value less costs to sell is determined using an observable market pricefor the cash-generating unit in the active market at the date of the impairment test.
Value in use: The value in use is determined based on discounted future cash flows, which are based on thefinancial plans which have been approved by management and which are valid when the impairment test isperformed. The financial plans are prepared taking into account the current economic and regulatoryenvironment, direction of the regulation and business forecasts of the individual cash-generating units.
The SMFG Group determined the recoverable amounts of the primary cash-generating units based on thevalue in use.
The financial plans, which are used to estimate the cash flow projections of the cash-generating units, coverthree to five years. The cash flow projections beyond the period covered by the financial plans are extrapolatedby applying the appropriate growth rates in perpetuity.
Key assumptions used in impairment testing
The key assumptions used for the value in use calculations for the fiscal years ended March 31, 2015 and2014 were as follows:
KUBC
SMBCTrustBank SMFL
SMBCNikko
Securities
SMBCFriend
Securities
SMBCConsumer
Finance
For the fiscal year ended March 31, 2015:Pre-tax discount rate . . . . . . . . . . . . . . . . . . . . . . . . 6.62% 8.48% 7.53% 9.73% 8.36% 11.01%Growth rate . . . . . . . . . . . . . . . . . . . . . . . . . . . . . . . 1.00% 1.00% 1.00% 1.00% 1.00% 1.00%
For the fiscal year ended March 31, 2014:Pre-tax discount rate . . . . . . . . . . . . . . . . . . . . . . . . 7.54% 8.94% 7.68% 11.16% 9.84% 9.55%Growth rate . . . . . . . . . . . . . . . . . . . . . . . . . . . . . . . 1.00% 1.00% 1.00% 1.00% 1.00% 1.00%
Management considers that the pre-tax discount rates and the growth rates are the most sensitive keyassumptions to determine the value in use of the cash-generating units.
F-52

Pre-tax discount rate: The pre-tax discount rates used to estimate the discounted cash flow of the primarycash-generating units are determined based on the Capital Asset Pricing Model (“CAPM”). The risk-free interestrate, the market risk premium and the beta factor that are used in the CAPM are determined based on market dataand other external sources of information. The beta factor is determined based on a respective group of peercompanies of the cash-generating units.
Growth rate: The growth rates used to estimate the cash flow projections beyond the period covered by thefinancial plans, which shall cover a maximum period of five years, are determined based on the expectedlong-term inflation rate and long-term average growth rates for the industries. The growth rate does not exceedthe long-term growth rate for the industry in which the cash-generating unit operates.
Management believes that there were no reasonably possible changes in any of the key assumptions thatwould lead to the recoverable amounts of the cash-generating units being below these carrying amounts for thefiscal years ended March 31, 2015 and 2014.
Other intangible assets
The table below shows the changes in other intangible assets for the fiscal years ended March 31, 2015 and2014.
Internallygeneratedsoftware
Purchasedsoftware
Contractualcustomer
relationships TrademarksOther
intangibles Total
(In millions)Cost . . . . . . . . . . . . . . . . . . . . . . . . . . . . . . . ¥ 519,174 ¥186,470 ¥ 155,162 ¥ 41,156 ¥ 22,263 ¥ 924,225Accumulated amortization and impairment
losses . . . . . . . . . . . . . . . . . . . . . . . . . . . . (342,024) (66,850) (26,299) (13,520) (3,688) (452,381)
Net carrying amount at April 1, 2013 . . . . . 177,150 119,620 128,863 27,636 18,575 471,844
Additions . . . . . . . . . . . . . . . . . . . . . . 78,558 46,503 — — 2,543 127,604Acquisition of subsidiaries . . . . . . . . . 82 3,057 8,468 672 6,912 19,191Disposals . . . . . . . . . . . . . . . . . . . . . . . (253) (4,156) — — (1,172) (5,581)Amortization . . . . . . . . . . . . . . . . . . . . (56,818) (38,559) (10,175) (4,121) (1,399) (111,072)Impairment losses . . . . . . . . . . . . . . . . (108) (23) — — (62) (193)Exchange differences . . . . . . . . . . . . . 44 636 — — 476 1,156Others . . . . . . . . . . . . . . . . . . . . . . . . . 490 2,028 — — (2,236) 282
Net carrying amount . . . . . . . . . . . . . . 199,145 129,106 127,156 24,187 23,637 503,231
Cost . . . . . . . . . . . . . . . . . . . . . . . . . . . . . . . 589,779 206,158 163,630 41,828 28,318 1,029,713Accumulated amortization and impairment
losses . . . . . . . . . . . . . . . . . . . . . . . . . . . . (390,634) (77,052) (36,474) (17,641) (4,681) (526,482)
Net carrying amount at March 31, 2014 . . . 199,145 129,106 127,156 24,187 23,637 503,231
Additions . . . . . . . . . . . . . . . . . . . . . . 92,210 47,242 — — 8,487 147,939Acquisition of subsidiaries . . . . . . . . . — — — — — —Disposals . . . . . . . . . . . . . . . . . . . . . . . (277) (3,941) — — (5,237) (9,455)Amortization . . . . . . . . . . . . . . . . . . . . (62,027) (38,072) (10,826) (4,183) (2,770) (117,878)Impairment losses . . . . . . . . . . . . . . . . — — — — (4) (4)Exchange differences . . . . . . . . . . . . . 968 270 — — 966 2,204Others . . . . . . . . . . . . . . . . . . . . . . . . . 3,704 (9,112) — — 1,317 (4,091)
Net carrying amount . . . . . . . . . . . . . . 233,723 125,493 116,330 20,004 26,396 521,946
Cost . . . . . . . . . . . . . . . . . . . . . . . . . . . . . . . 638,644 212,731 163,630 41,828 33,678 1,090,511Accumulated amortization and impairment
losses . . . . . . . . . . . . . . . . . . . . . . . . . . . . (404,921) (87,238) (47,300) (21,824) (7,282) (568,565)
Net carrying amount at March 31, 2015 . . . ¥ 233,723 ¥125,493 ¥ 116,330 ¥ 20,004 ¥ 26,396 ¥ 521,946
F-53

The impairment losses on other intangible assets are included in “Other expenses” and the amortizationexpenses of other intangible assets are included in “General and administrative expenses” in the consolidatedincome statement.
The SMFG Group had ¥2,770 million and ¥1,867 million of contractual commitments to acquire intangibleassets at March 31, 2015 and 2014, respectively.
The amounts of research and development expenditure recognized as expenses for the fiscal years endedMarch 31, 2015, 2014 and 2013 were ¥171 million, ¥160 million and ¥141 million, respectively, and they wereincluded in “General and administrative expenses” in the consolidated income statement.
Other intangibles at March 31, 2015 and 2014 include leasehold rights, amounting to ¥7,434 million and¥7,449 million, respectively, which are rights to use land for the purpose of owning the buildings. Since theSMFG Group has a long history of renewal, these contracts are not expected to be terminated in the foreseeablefuture. Leasehold rights are expected to generate cash flows for an indefinite period of time. They are notamortized but are tested for impairment annually, irrespective of whether there is any indication of impairment.
15 OTHER ASSETS
Other assets at March 31, 2015 and 2014 consisted of the following:
At March 31,
2015 2014
(In millions)Prepaid expenses . . . . . . . . . . . . . . . . . . . . . . . . . . . . . . . . . . . . . . . . . . . . . . . . . . . . . . . ¥ 54,519 ¥ 48,966Accrued income . . . . . . . . . . . . . . . . . . . . . . . . . . . . . . . . . . . . . . . . . . . . . . . . . . . . . . . . 370,625 319,957Receivables from brokers, dealers and customers for securities transactions . . . . . . . . 1,367,720 1,191,736Retirement benefit assets . . . . . . . . . . . . . . . . . . . . . . . . . . . . . . . . . . . . . . . . . . . . . . . . . 379,188 171,966Security deposits . . . . . . . . . . . . . . . . . . . . . . . . . . . . . . . . . . . . . . . . . . . . . . . . . . . . . . . 120,303 121,194Investment properties(1) . . . . . . . . . . . . . . . . . . . . . . . . . . . . . . . . . . . . . . . . . . . . . . . . . . 293,554 288,925Others . . . . . . . . . . . . . . . . . . . . . . . . . . . . . . . . . . . . . . . . . . . . . . . . . . . . . . . . . . . . . . . 899,214 512,768
Total other assets . . . . . . . . . . . . . . . . . . . . . . . . . . . . . . . . . . . . . . . . . . . . . . . . . . . ¥3,485,123 ¥2,655,512
(1) Investment properties are carried at cost less accumulated depreciation and accumulated impairment losses. The fair values of investmentproperties were ¥306,720 million and ¥297,042 million at March 31, 2015 and 2014, respectively. The fair values were mainlydetermined based on market values provided by independent valuation appraisers having the appropriate recognized professionalqualifications and recent experience in the locations and categories of properties being valued. Rental income from investment propertieswas ¥19,076 million, ¥15,195 million and ¥11,198 million for the fiscal years ended March 31, 2015, 2014 and 2013, respectively.
16 DEPOSITS
Deposits at March 31, 2015 and 2014 consisted of the following:
At March 31,
2015 2014
(In millions)Non-interest-bearing demand deposits . . . . . . . . . . . . . . . . . . . . . . . . . . . . . . . . . . ¥ 16,250,493 ¥ 15,073,311Interest-bearing demand deposits . . . . . . . . . . . . . . . . . . . . . . . . . . . . . . . . . . . . . . 42,041,777 39,782,147Deposits at notice . . . . . . . . . . . . . . . . . . . . . . . . . . . . . . . . . . . . . . . . . . . . . . . . . . 8,790,017 7,370,775Time deposits . . . . . . . . . . . . . . . . . . . . . . . . . . . . . . . . . . . . . . . . . . . . . . . . . . . . . 29,084,465 27,337,325Negotiable certificates of deposit . . . . . . . . . . . . . . . . . . . . . . . . . . . . . . . . . . . . . . 13,825,898 13,713,540Others(1) . . . . . . . . . . . . . . . . . . . . . . . . . . . . . . . . . . . . . . . . . . . . . . . . . . . . . . . . . . 5,841,330 5,093,396
Total deposits . . . . . . . . . . . . . . . . . . . . . . . . . . . . . . . . . . . . . . . . . . . . . . . . . ¥115,833,980 ¥108,370,494
(1) Others include, among other items, foreign currency deposits in domestic offices and Japanese yen accounts held by foreign depositors indomestic offices.
F-54

17 TRADING LIABILITIES
Trading liabilities at March 31, 2015 and 2014 consisted of the following:
At March 31,
2015 2014
(In millions)
Debt instruments “short position” . . . . . . . . . . . . . . . . . . . . . . . . . . . . . . . . . . . . . . . . . . ¥2,175,313 ¥1,859,146Equity instruments “short position” . . . . . . . . . . . . . . . . . . . . . . . . . . . . . . . . . . . . . . . . 18,087 6,097
Total trading liabilities . . . . . . . . . . . . . . . . . . . . . . . . . . . . . . . . . . . . . . . . . . . . . . ¥2,193,400 ¥1,865,243
Trading liabilities include the instruments classified as held for trading. Trading debt instruments mainlyconsist of Japanese government bonds. Trading equity instruments mainly consist of publicly traded Japanesestocks.
F-55

18 BORROWINGS
Short-term borrowings and long-term borrowings (with original maturities of more than one year) atMarch 31, 2015 and 2014 consisted of the following:
At March 31,
Interest rate 2015 2014
(In millions)SMFG:
Long-term borrowings:Subordinated
Fixed rate borrowing, payable in Japanese yen,due 2024-2030 . . . . . . . . . . . . . . . . . . . . . . . . . . . . . . . . . . . . . . . . . . . . . . . . . . . . . . . . . . . 0.56%-1.27% ¥ 31,000 ¥ —
SMBC:Short-term borrowings . . . . . . . . . . . . . . . . . . . . . . . . . . . . . . . . . . . . . . . . . . . . . . . . . . . . . . . . . . . . . . . 0.10%-0.38% 5,652,752 1,888,339Long-term borrowings:
UnsubordinatedFixed rate borrowing, payable in Japanese yen,
due 2014-2028 . . . . . . . . . . . . . . . . . . . . . . . . . . . . . . . . . . . . . . . . . . . . . . . . . . . . . . . . . . . 0.10%-6.10% 15,893 1,220,310Fixed rate borrowing, payable in United States dollars,
due 2019-2024 . . . . . . . . . . . . . . . . . . . . . . . . . . . . . . . . . . . . . . . . . . . . . . . . . . . . . . . . . . . 2.36%-3.30% 36,045 —Floating rate borrowing, payable in Japanese yen,
due 2014-2035 . . . . . . . . . . . . . . . . . . . . . . . . . . . . . . . . . . . . . . . . . . . . . . . . . . . . . . . . . . . 0.06%-0.22% 158,403 152,494Floating rate borrowing, payable in United States dollars,
due 2014-2032 . . . . . . . . . . . . . . . . . . . . . . . . . . . . . . . . . . . . . . . . . . . . . . . . . . . . . . . . . . . 0.33%-1.54% 683,049 660,761Other fixed or floating rate borrowing,
due 2014-2035 . . . . . . . . . . . . . . . . . . . . . . . . . . . . . . . . . . . . . . . . . . . . . . . . . . . . . . . . . . . 0.01%-3.50% 89,053 94,859Subordinated
Fixed rate borrowing, payable in Japanese yen,due 2014-2027 . . . . . . . . . . . . . . . . . . . . . . . . . . . . . . . . . . . . . . . . . . . . . . . . . . . . . . . . . . . 1.28%-4.50% 261,000 266,000
Total SMBC . . . . . . . . . . . . . . . . . . . . . . . . . . . . . . . . . . . . . . . . . . . . . . . . . . . . . . . . . . . 6,896,195 4,282,763
Other subsidiaries:Short-term borrowings . . . . . . . . . . . . . . . . . . . . . . . . . . . . . . . . . . . . . . . . . . . . . . . . . . . . . . . . . . . . . . . 0.15%-8.80% 1,093,497 1,204,553Long-term borrowings:
UnsubordinatedFixed rate borrowing, payable in Japanese yen,
due 2014-2035 . . . . . . . . . . . . . . . . . . . . . . . . . . . . . . . . . . . . . . . . . . . . . . . . . . . . . . . . . . . 0.10%-2.67% 477,201 438,325Fixed rate borrowing, payable in United States dollars,
due 2014-2023 . . . . . . . . . . . . . . . . . . . . . . . . . . . . . . . . . . . . . . . . . . . . . . . . . . . . . . . . . . . 0.06%-7.72% 136,380 145,972Fixed rate borrowing, payable in Thai baht,
due 2014-2021 . . . . . . . . . . . . . . . . . . . . . . . . . . . . . . . . . . . . . . . . . . . . . . . . . . . . . . . . . . . 2.72%-4.45% 24,173 19,263Fixed rate borrowing, payable in Chinese yuan,
due 2014-2019 . . . . . . . . . . . . . . . . . . . . . . . . . . . . . . . . . . . . . . . . . . . . . . . . . . . . . . . . . . . 2.40%-6.15% 21,852 16,725Floating rate borrowing, payable in Japanese yen,
due 2014-2040 . . . . . . . . . . . . . . . . . . . . . . . . . . . . . . . . . . . . . . . . . . . . . . . . . . . . . . . . . . . 0.10%-2.57% 712,734 627,690Floating rate borrowing, payable in United States dollars,
due 2014-2027 . . . . . . . . . . . . . . . . . . . . . . . . . . . . . . . . . . . . . . . . . . . . . . . . . . . . . . . . . . . 0.25%-3.15% 519,842 436,995Floating rate borrowing, payable in euros,
due 2015-2018 . . . . . . . . . . . . . . . . . . . . . . . . . . . . . . . . . . . . . . . . . . . . . . . . . . . . . . . . . . . 1.00% 28,252 36,904Floating rate borrowing, payable in Chinese yuan,
due 2014-2019 . . . . . . . . . . . . . . . . . . . . . . . . . . . . . . . . . . . . . . . . . . . . . . . . . . . . . . . . . . . 2.50%-6.77% 26,585 27,823Other fixed or floating rate borrowing,
due 2014-2043 . . . . . . . . . . . . . . . . . . . . . . . . . . . . . . . . . . . . . . . . . . . . . . . . . . . . . . . . . . . 0.47%-11.20% 18,111 7,557Subordinated
Fixed rate borrowing, payable in Japanese yen,due 2021 . . . . . . . . . . . . . . . . . . . . . . . . . . . . . . . . . . . . . . . . . . . . . . . . . . . . . . . . . . . . . . . . 1.35% 5,200 5,200
Fixed rate borrowing, payable in United States dollars,due 2018 . . . . . . . . . . . . . . . . . . . . . . . . . . . . . . . . . . . . . . . . . . . . . . . . . . . . . . . . . . . . . . . . 7.62%-7.72% 9,011 —
Floating rate borrowing, payable in Japanese yen,due 2015-2025 . . . . . . . . . . . . . . . . . . . . . . . . . . . . . . . . . . . . . . . . . . . . . . . . . . . . . . . . . . . 2.04%-2.70% 11,250 11,250
Total other subsidiaries . . . . . . . . . . . . . . . . . . . . . . . . . . . . . . . . . . . . . . . . . . . . . . . . . . 3,084,088 2,978,257
Liabilities associated with securitization transactions:Fixed rate borrowing, payable in Japanese yen,
due 2016-2049 . . . . . . . . . . . . . . . . . . . . . . . . . . . . . . . . . . . . . . . . . . . . . . . . . . . . . . . . . . . 0.14%-2.70% 1,006,806 1,013,846Floating rate borrowing, payable in Japanese yen,
due 2014-2033 . . . . . . . . . . . . . . . . . . . . . . . . . . . . . . . . . . . . . . . . . . . . . . . . . . . . . . . . . . . 0.30%-1.81% 86,647 94,874Floating rate borrowing, payable in United States dollars,
due 2019-2020 . . . . . . . . . . . . . . . . . . . . . . . . . . . . . . . . . . . . . . . . . . . . . . . . . . . . . . . . . . . 0.99%-1.05% 10,476 —
Total liabilities associated with securitization transactions . . . . . . . . . . . . . . . . . . . . . . . 1,103,929 1,108,720
Lease obligations . . . . . . . . . . . . . . . . . . . . . . . . . . . . . . . . . . . . . . . . . . . . . . . . . . . . . . . . . . . . . . . . . . . . . . . — 101,840 93,623
Total borrowings . . . . . . . . . . . . . . . . . . . . . . . . . . . . . . . . . . . . . . . . . . . . . . . . . . . . . . . ¥11,217,052 ¥8,463,363
F-56

The interest rates shown in the above table are the contractual rates in effect at March 31, 2015 and 2014,and thus do not represent the actual effective interest rates. Maturity information for certain subordinatedborrowings is based on the date of callable options.
19 DEBT SECURITIES IN ISSUE
Debt securities in issue at March 31, 2015 and 2014 consisted of the following:
At March 31,
Interest rate 2015 2014
(In millions)SMFG:
Subordinated bonds:Subordinated bonds, payable in Japanese yen,
due 2024 . . . . . . . . . . . . . . . . . . . . . . . . . . . . . . . . . . . . . 0.61%-0.85% ¥ 134,200 ¥ —Subordinated bonds, payable in United States dollars,
due 2024 . . . . . . . . . . . . . . . . . . . . . . . . . . . . . . . . . . . . . 4.44% 209,789 —
Total SMFG . . . . . . . . . . . . . . . . . . . . . . . . . . . . . . . . . . 343,989 —
SMBC:Commercial paper . . . . . . . . . . . . . . . . . . . . . . . . . . . . . . . . . . . . . 0.00%-0.75% 2,575,587 1,831,866Bonds:
Bonds, payable in Japanese yen,due 2014-2037 . . . . . . . . . . . . . . . . . . . . . . . . . . . . . . . . 0.01%-3.40% 766,307 941,784
Bonds, payable in United States dollars,due 2014-2030 . . . . . . . . . . . . . . . . . . . . . . . . . . . . . . . . 0.57%-4.13% 2,558,292 1,614,470
Bonds, payable in euros,due 2020-2023 . . . . . . . . . . . . . . . . . . . . . . . . . . . . . . . . 1.00%-2.75% 258,533 175,291
Bonds, payable in Australian dollars,due 2014-2025 . . . . . . . . . . . . . . . . . . . . . . . . . . . . . . . . 2.97%-4.28% 137,981 139,961
Bonds, payable in British pounds sterling,due 2016 . . . . . . . . . . . . . . . . . . . . . . . . . . . . . . . . . . . . . 1.07%-1.11% 44,503 42,805
Bonds, payable in Hong Kong dollars,due 2022 . . . . . . . . . . . . . . . . . . . . . . . . . . . . . . . . . . . . . 2.55% 13,392 —
Subordinated bonds:Subordinated bonds, payable in Japanese yen,
due 2014-2035 . . . . . . . . . . . . . . . . . . . . . . . . . . . . . . . . 0.81%-2.97% 949,438 1,224,867Subordinated bonds, payable in United States dollars,
due 2022-Perpetual . . . . . . . . . . . . . . . . . . . . . . . . . . . . 4.85%-5.63% 217,208 186,667Subordinated bonds, payable in euros,
due 2020-Perpetual . . . . . . . . . . . . . . . . . . . . . . . . . . . . 4.00%-4.38% 139,269 151,776
Total SMBC . . . . . . . . . . . . . . . . . . . . . . . . . . . . . . . . . . 7,660,510 6,309,487
Other subsidiaries:Commercial paper . . . . . . . . . . . . . . . . . . . . . . . . . . . . . . . . . . . . . 0.09%-0.33% 2,238,315 1,838,046Bonds:
Bonds, payable in Japanese yen,due 2014-2045 . . . . . . . . . . . . . . . . . . . . . . . . . . . . . . . . 0.01%-17.00% 650,056 470,430
Bonds, payable in United States dollars,due 2015-2020 . . . . . . . . . . . . . . . . . . . . . . . . . . . . . . . . 0.01%-3.80% 1,458 —
Bonds, payable in Chinese yuan,due 2014-2016 . . . . . . . . . . . . . . . . . . . . . . . . . . . . . . . . 3.00%-5.80% 30,903 14,931
Subordinated bonds:Subordinated bonds, payable in Japanese yen,
due 2016-Perpetual . . . . . . . . . . . . . . . . . . . . . . . . . . . . 2.19%-4.50% 126,200 136,200
Total other subsidiaries . . . . . . . . . . . . . . . . . . . . . . . . . 3,046,932 2,459,607
Total debt securities in issue . . . . . . . . . . . . . . . . . ¥11,051,431 ¥8,769,094
F-57

Interest rates represent the contractual interest rates that were applied at March 31, 2015 and 2014, and thusdo not represent the actual effective interest rates.
20 PROVISIONS
The following table presents movements by class of provisions for the fiscal years ended March 31, 2015and 2014.
Provision forinterest repayment Other provisions Total
(In millions)
Balance at April 1, 2013 . . . . . . . . . . . . . . . . . . . . . . . . . . . . ¥ 245,129 ¥ 34,002 ¥ 279,131Additional provisions . . . . . . . . . . . . . . . . . . . . . . . . . . 50,201 12,390 62,591Amounts used . . . . . . . . . . . . . . . . . . . . . . . . . . . . . . . . (104,900) (9,680) (114,580)Unused amounts reversed . . . . . . . . . . . . . . . . . . . . . . . (543) (1,486) (2,029)Amortization of discount and effect of change in
discount rate . . . . . . . . . . . . . . . . . . . . . . . . . . . . . . . 106 214 320Others . . . . . . . . . . . . . . . . . . . . . . . . . . . . . . . . . . . . . . — 40 40
Balance at March 31, 2014 . . . . . . . . . . . . . . . . . . . . . . . . . . 189,993 35,480 225,473
Additional provisions . . . . . . . . . . . . . . . . . . . . . . . . . . 64,837 17,121 81,958Amounts used . . . . . . . . . . . . . . . . . . . . . . . . . . . . . . . . (87,473) (11,310) (98,783)Unused amounts reversed . . . . . . . . . . . . . . . . . . . . . . . (752) (514) (1,266)Amortization of discount and effect of change in
discount rate . . . . . . . . . . . . . . . . . . . . . . . . . . . . . . . 110 246 356Others . . . . . . . . . . . . . . . . . . . . . . . . . . . . . . . . . . . . . . — (114) (114)
Balance at March 31, 2015 . . . . . . . . . . . . . . . . . . . . . . . . . . ¥ 166,715 ¥ 40,909 ¥ 207,624
Provision for Interest Repayment
Japan has two laws restricting interest rates on loans. The Interest Rate Restriction Act sets the maximuminterest rates on loans ranging from 15% to 20%. The Act Regulating the Receipt of Contributions, Receipt ofDeposits and Interest Rates capped the interest rate on loans at 29.2% up to June 2010. Interest rates on loansgreater than the range of 15-20% but below the maximum allowable of 29.2% were called “gray zone interest,”and many consumer lending and credit card companies were charging interest in this zone.
In January 2006, judicial decisions strictly interpreted the conditions under which consumer financecompanies may retain gray zone interest. As a result, claims for refunds of gray zone interest have increased, andconsumer lending and credit card companies have recorded a provision for claims for refunds of gray zoneinterest.
In December 2006, the Government of Japan made amendments to laws regulating money lenders toimplement regulatory reforms affecting the consumer finance industry. As a result, in June 2010, the maximumlegal interest rates on loans were reduced to the range of 15-20%, and gray zone interest was abolished.
The provision for interest repayment is calculated by estimating the future claims for the refund of grayzone interest, taking into account historical experience such as the number of customer claims for a refund, theamount of repayments and the characteristics of customers, and the length of the period during which claims areexpected to be received in the future. Of these historical experiences, the number of customer claims for therefund has a significant effect on the amount of the provision, and the historical number of customer claims to theSMFG Group was 139 thousand, 132 thousand and 139 thousand for the fiscal years ended March 31, 2015, 2014and 2013, respectively. The timing of the settlement of these claims is uncertain.
F-58

The decrease in the provision for interest repayment for the fiscal year ended March 31, 2015 was primarilydue to the use of the provision during the year, which was partially offset by additional provisions as a result ofthe estimation of the future claims for the refund.
Other Provisions
Other provisions include asset retirement obligations and provisions for reimbursement of deposits, loancommitments, product warranties and litigation claims. Most of these provisions occurred in the normal course ofbusiness and none of them were individually significant at March 31, 2015 and 2014.
21 OTHER LIABILITIES
Other liabilities at March 31, 2015 and 2014 consisted of the following:
At March 31,
2015 2014
(In millions)
Accrued expenses . . . . . . . . . . . . . . . . . . . . . . . . . . . . . . . . . . . . . . . . . . . . . . . . . . . . . . ¥ 252,420 ¥ 239,664Unearned income . . . . . . . . . . . . . . . . . . . . . . . . . . . . . . . . . . . . . . . . . . . . . . . . . . . . . . . 161,355 165,825Financial guarantees and other credit-related contingent liabilities . . . . . . . . . . . . . . . . 149,609 107,561Due to trust account . . . . . . . . . . . . . . . . . . . . . . . . . . . . . . . . . . . . . . . . . . . . . . . . . . . . . 718,134 699,330Payables to brokers, dealers and customers for securities transactions . . . . . . . . . . . . . 1,605,743 1,672,819Payables related to credit card services . . . . . . . . . . . . . . . . . . . . . . . . . . . . . . . . . . . . . . 503,811 543,624Obligations from factoring transactions . . . . . . . . . . . . . . . . . . . . . . . . . . . . . . . . . . . . . 411,146 265,848Retirement benefit liabilities . . . . . . . . . . . . . . . . . . . . . . . . . . . . . . . . . . . . . . . . . . . . . . 46,514 49,848Guarantee deposits received . . . . . . . . . . . . . . . . . . . . . . . . . . . . . . . . . . . . . . . . . . . . . . 240,765 214,223Others . . . . . . . . . . . . . . . . . . . . . . . . . . . . . . . . . . . . . . . . . . . . . . . . . . . . . . . . . . . . . . . 1,459,468 1,185,111
Total other liabilities . . . . . . . . . . . . . . . . . . . . . . . . . . . . . . . . . . . . . . . . . . . . . . . . ¥5,548,965 ¥5,143,853
22 DEFERRED INCOME TAX
The changes of net deferred tax assets and liabilities for the fiscal years ended March 31, 2015 and 2014were as follows:
For the fiscal year endedMarch 31,
2015 2014
(In millions)
At beginning of period . . . . . . . . . . . . . . . . . . . . . . . . . . . . . . . . . . . . . . . . . . . . . . . . . . . . ¥ (2,010) ¥ 375,460Deferred tax expense . . . . . . . . . . . . . . . . . . . . . . . . . . . . . . . . . . . . . . . . . . . . . . . . . . . . . (87,109) (125,807)Deferred tax relating to other comprehensive income:
Remeasurements of defined benefit plans reserve . . . . . . . . . . . . . . . . . . . . . . . . . . . (58,081) (76,596)Available-for-sale financial assets reserve . . . . . . . . . . . . . . . . . . . . . . . . . . . . . . . . . (298,884) (134,272)Exchange differences on translating foreign operations reserve . . . . . . . . . . . . . . . . (2,245) (17,171)
Acquisition and disposal of subsidiaries . . . . . . . . . . . . . . . . . . . . . . . . . . . . . . . . . . . . . . (216) (6,492)Exchange differences and others . . . . . . . . . . . . . . . . . . . . . . . . . . . . . . . . . . . . . . . . . . . . 2,240 (17,132)
At end of period . . . . . . . . . . . . . . . . . . . . . . . . . . . . . . . . . . . . . . . . . . . . . . . . . . . . . . . . . ¥(446,305) ¥ (2,010)
F-59

The deferred tax assets and liabilities at March 31, 2015 and 2014 were attributable to the following items:
At March 31,
2015 2014
(In millions)
Deferred tax assets:Loans and advances . . . . . . . . . . . . . . . . . . . . . . . . . . . . . . . . . . . . . . . . . . . . . . . . . . . . ¥ 270,981 ¥ 318,557Derivative financial instruments . . . . . . . . . . . . . . . . . . . . . . . . . . . . . . . . . . . . . . . . . . . 38,252 58,211Tax losses carried forward . . . . . . . . . . . . . . . . . . . . . . . . . . . . . . . . . . . . . . . . . . . . . . . 28,755 44,742Retirement benefits . . . . . . . . . . . . . . . . . . . . . . . . . . . . . . . . . . . . . . . . . . . . . . . . . . . . . 14,228 42,992Investment securities . . . . . . . . . . . . . . . . . . . . . . . . . . . . . . . . . . . . . . . . . . . . . . . . . . . . 849 2,205Other deductible temporary differences . . . . . . . . . . . . . . . . . . . . . . . . . . . . . . . . . . . . . 199,394 158,827
Total deferred tax assets . . . . . . . . . . . . . . . . . . . . . . . . . . . . . . . . . . . . . . . . . . . . . 552,459 625,534
Deferred tax liabilities:Investment securities . . . . . . . . . . . . . . . . . . . . . . . . . . . . . . . . . . . . . . . . . . . . . . . . . . . . 747,533 409,690Goodwill and intangible assets . . . . . . . . . . . . . . . . . . . . . . . . . . . . . . . . . . . . . . . . . . . . 90,012 95,035Property, plant and equipment . . . . . . . . . . . . . . . . . . . . . . . . . . . . . . . . . . . . . . . . . . . . 52,919 49,903Retirement benefits . . . . . . . . . . . . . . . . . . . . . . . . . . . . . . . . . . . . . . . . . . . . . . . . . . . . . 38,012 —Lease transactions . . . . . . . . . . . . . . . . . . . . . . . . . . . . . . . . . . . . . . . . . . . . . . . . . . . . . . 23,000 21,790Other taxable temporary differences . . . . . . . . . . . . . . . . . . . . . . . . . . . . . . . . . . . . . . . . 47,288 51,126
Total deferred tax liabilities . . . . . . . . . . . . . . . . . . . . . . . . . . . . . . . . . . . . . . . . . . 998,764 627,544
Net deferred tax liabilities(1) . . . . . . . . . . . . . . . . . . . . . . . . . . . . . . . . . . . . . . ¥(446,305) ¥ (2,010)
(1) Deferred tax assets and deferred tax liabilities are offset in the consolidated statement of financial position if the entity has a legallyenforceable right to set off current tax assets against current tax liabilities, and the deferred tax assets and the deferred tax liabilities relateto income taxes levied by the same taxation authority on the same taxable entity.
On March 31, 2014, the Government of Japan promulgated to repeal the Act on Special MeasuresConcerning Securing Necessary Financial Resources for Funding the Restoration from the Great East JapanEarthquake, which initially imposed a 10% of corporation surtax, one year earlier than its initial plan. In addition,on March 31, 2014, the Government of Japan promulgated (i) an amendment to the Local Tax Act and (ii) theLocal Corporate Tax Law. Those laws (i) reduce local inhabitant tax by 4.4%, but adversely (ii) impose newlyenacted 4.4% local corporation tax. As a result, the effective statutory tax rate (including local taxes) of SMFGwas reduced to 35.6% for the fiscal year beginning April 1, 2014.
On March 31, 2015, the Government of Japan promulgated (i) an amendment to the Corporation Tax Actand (ii) the Local Tax Act. Those laws (i) reduce the Japanese national corporation tax rate by 1.6 percentagepoints from the fiscal year beginning April 1, 2015 and (ii) reduce the enterprise tax rate by 1.2 percentage pointsfrom the fiscal year beginning April 1, 2015 and additionally reduce it by 1.2 percentage points from the fiscalyear beginning April 1, 2016. As a result, the effective statutory tax rate of SMFG is 33.1% during the fiscal yearbeginning April 1, 2015 and will be 32.3% for the fiscal years beginning April 1, 2016. The SMFG Groupmeasured deferred tax assets and liabilities at the rates that were expected to apply to the period when the assetsare realized or the liabilities are settled, based on the tax rate that had been enacted or substantively enacted atMarch 31, 2015. Accordingly, the tax rate changes in Japan increased deferred tax expense by ¥75 billion for thefiscal year ended March 31, 2015.
The deferred tax assets of the SMFG Group consist mainly of the deferred tax assets of SMBC. The deferredtax assets of SMBC mainly consisted of deferred tax assets for loans and advances or derivative financialinstruments, which were generally related to the accumulated losses from the fair value change or the impairmentof these assets which would be deductible for tax purposes in future periods. SMBC considers that it will be ableto use most of the deductible temporary differences based mainly on future taxable profit estimated based on,
F-60

among other relevant factors, forecasted results of operations, which are based on historical financialperformance and the business plans that management believes to be prudent and feasible. In SMFG’s othersubsidiaries, deferred tax assets relating to tax losses carried forward and deductible temporary differences arerecognized only to the extent that it is probable that future taxable profit will be available against which the taxlosses carried forward and the deductible temporary differences can be utilized. No deferred tax assets wererecognized in SMFG and certain SMFG subsidiaries for the tax losses carried forward projected to expire, or forthe deductible temporary differences estimated not to be realized due to the uncertainty of sufficient futuretaxable profit.
The following table shows the amounts of deductible temporary differences and tax losses carried forwardby expiration date at March 31, 2015 and 2014 for which no deferred tax assets were recognized.
At March 31,
2015 2014
(In millions)
Deductible temporary differences . . . . . . . . . . . . . . . . . . . . . . . . . . . . . . . . . . . . . . . . . . ¥ 576,614 ¥ 617,492Tax losses carried forward which will expire in 1 year . . . . . . . . . . . . . . . . . . . . . . . . . — 71,711
2 years . . . . . . . . . . . . . . . . . . . . . . . . 5,588 —3 years . . . . . . . . . . . . . . . . . . . . . . . . 115,155 2,2574 years . . . . . . . . . . . . . . . . . . . . . . . . 200,938 115,6035 years . . . . . . . . . . . . . . . . . . . . . . . . 154,326 217,4706 years . . . . . . . . . . . . . . . . . . . . . . . . 251,319 161,4687 years . . . . . . . . . . . . . . . . . . . . . . . . 70,870 251,8838 years . . . . . . . . . . . . . . . . . . . . . . . . 60,710 70,2019 years and thereafter . . . . . . . . . . . . . 40,823 52,100
Total deductible temporary differences and tax losses carried forward . . . . . . . . . . . . . ¥1,476,343 ¥1,560,185
In addition to the above table, the SMFG Group does not recognize deferred tax assets for deductibletemporary differences related to investments in subsidiaries, associates and joint ventures where SMFG has nointention to reverse these differences in the foreseeable future. The amount of those deductible temporarydifferences was approximately ¥894 billion and ¥1,732 billion at March 31, 2015 and 2014, respectively. AtMarch 31, 2014, most of the deductible temporary differences were associated with investments in SMBC, whichresulted from a statutory share transfer made at the establishment of SMFG in December 2002. Since thecarrying amount of the investments in SMBC exceeded the tax base, resulting from an increase in SMBC’s netassets, there were no deductible temporary differences associated with the investments in SMBC at March 31,2015.
At March 31, 2015 and 2014, the amount of taxable temporary differences associated with investments insubsidiaries, associates and joint ventures for which deferred tax liabilities had not been recognized wasapproximately ¥1,583 billion and ¥906 billion, respectively. SMFG can control the timing of reversal of thetemporary differences and it is probable that they will not be reversed in the foreseeable future.
F-61

Deferred tax expense for the fiscal years ended March 31, 2015 and 2014 was attributable to the followingtemporary differences and tax losses carried forward:
For the fiscal year endedMarch 31,
2015 2014
(In millions)
Loans and advances . . . . . . . . . . . . . . . . . . . . . . . . . . . . . . . . . . . . . . . . . . . . . . . . . . . . ¥ (50,374) ¥ (122,094)Investment securities . . . . . . . . . . . . . . . . . . . . . . . . . . . . . . . . . . . . . . . . . . . . . . . . . . . (41,035) (52,621)Derivative financial instruments . . . . . . . . . . . . . . . . . . . . . . . . . . . . . . . . . . . . . . . . . . . (21,193) 5,649Tax losses carried forward . . . . . . . . . . . . . . . . . . . . . . . . . . . . . . . . . . . . . . . . . . . . . . . (16,282) 17,522Retirement benefits . . . . . . . . . . . . . . . . . . . . . . . . . . . . . . . . . . . . . . . . . . . . . . . . . . . . . (8,653) (10,950)Goodwill and intangible assets . . . . . . . . . . . . . . . . . . . . . . . . . . . . . . . . . . . . . . . . . . . . 5,023 (13,228)Property, plant and equipment . . . . . . . . . . . . . . . . . . . . . . . . . . . . . . . . . . . . . . . . . . . . (3,638) (19,514)Lease transactions . . . . . . . . . . . . . . . . . . . . . . . . . . . . . . . . . . . . . . . . . . . . . . . . . . . . . . 1,537 3,326Deposits . . . . . . . . . . . . . . . . . . . . . . . . . . . . . . . . . . . . . . . . . . . . . . . . . . . . . . . . . . . . . — 14,243Other temporary differences—net . . . . . . . . . . . . . . . . . . . . . . . . . . . . . . . . . . . . . . . . . 47,506 51,860
Total deferred tax expense . . . . . . . . . . . . . . . . . . . . . . . . . . . . . . . . . . . . . . . . . . . ¥ (87,109) ¥ (125,807)
23 RETIREMENT BENEFITS
Defined Benefit Plans
SMBC and some of SMFG’s other subsidiaries have various defined benefit plans such as defined benefitpension plans and lump-sum severance indemnity plans, which define the amount of benefits that an employeewill receive on or after retirement, usually based on one or more factors, such as age, years of service,compensation, classes and earned points based on service.
SMBC’s defined benefit plans account for the vast majority of the defined benefit obligations and planassets in the SMFG Group. SMBC has a corporate defined benefit pension plan and a lump-sum severanceindemnity plan.
Defined benefit pension plans
SMBC’s corporate defined benefit pension plan is a funded defined benefit pension plan, which is regulatedby the Corporate Defined Benefit Pension Plan Law, one of the Japanese pension laws. Benefits are paid inexchange for services rendered by employees who worked for more than a specified period considering theiryears of service and the degree of their contribution to SMBC.
SMBC’s pension fund is a special entity established in accordance with the pension laws, and SMBC has anobligation to make contributions to it. It has a board of directors which consists of an equal number of memberselected from both the management and employees of SMBC. These board members have a fiduciary duty toadminister and manage the pension fund.
The objective of SMBC’s pension fund is to earn a return which is sufficient to pay future benefits toparticipants of the corporate defined benefit pension plan, including pension benefit plans, lump-sum indemnityplans for bereaved families, and other lump sum indemnity plans. To achieve this, SMBC’s pension fund setsinvestment guidelines to target a mix of assets which can generate a return over the medium and long term, andinvestment decisions for its assets are made in accordance with these guidelines.
The Corporate Defined Benefit Pension Plan Law requires a pension fund to review the assumptions andremeasure the required contribution at least every fifth fiscal year, in order to ensure that it maintains sufficient
F-62

assets for future benefit payments. On the other hand, the present value of the defined benefit obligation iscalculated annually based on actuarial valuations that are dependent upon a number of assumptions, includingdiscount rates, mortality rates and future salary (benefit) increases, in accordance with IAS 19. Other types ofdefined benefit pension plans operated by the SMFG Group are generally established and operated in the samemanner as described above.
Lump-sum severance indemnity plans
SMBC and some of SMFG’s other subsidiaries have lump-sum severance indemnity plans under which theiremployees are provided with lump-sum cash payments upon leaving the company. While funding of these plansis not required under Japanese pension laws, some of these plans are funded with assets held by retirementbenefit trusts.
SMBC and a number of SMFG’s other subsidiaries in Japan established retirement benefit trusts andcontributed some of their marketable securities to these trusts in order to isolate these assets for retirementbenefits by entering into contracts with trust banks. Retirement benefit trusts are voluntary funds that are usedeither to contribute assets to the pension funds or to directly settle retirement benefits. Among the SMFG Group,retirement benefit trusts are set up for the defined benefit pension plans, as well as for the lump-sum severanceindemnity plans.
The assets belonging to the retirement benefit trusts are available to be used only to pay or fund retirementbenefits, and practically held by an entity that is legally separated from the SMFG Group. Therefore, they are notavailable to the SMFG Group’s creditors even in bankruptcy and cannot be returned to the SMFG Group, unlesseither the remaining assets are sufficient to meet all the related obligations or the entities (funds) reimburse to theSMFG Group the retirement benefits which are already paid by the SMFG Group. Therefore, these assets areaccounted for as plan assets.
The following tables provide detailed information for the defined benefit plans.
The amounts of the retirement benefit liabilities and the retirement benefit assets recognized in theconsolidated statement of financial position at March 31, 2015 and 2014 were determined as follows:
At March 31,
2015 2014
(In millions)
Present value of unfunded obligations . . . . . . . . . . . . . . . . . . . . . . . . . . . . . . . . . . . . . . ¥ (42,004) ¥ (40,886)Present value of funded obligations . . . . . . . . . . . . . . . . . . . . . . . . . . . . . . . . . . . . . . . . (1,043,532) (997,729)Fair value of plan assets . . . . . . . . . . . . . . . . . . . . . . . . . . . . . . . . . . . . . . . . . . . . . . . . . 1,418,210 1,160,733
Net retirement benefit assets (liabilities) . . . . . . . . . . . . . . . . . . . . . . . . . . . . . . . . . . . . ¥ 332,674 ¥ 122,118
Of which retirement benefit liabilities included in “Other liabilities” . . . . . . . . . ¥ (46,514) ¥ (49,848)Of which retirement benefit assets included in “Other assets” . . . . . . . . . . . . . . . ¥ 379,188 ¥ 171,966
F-63

The movements in the defined benefit obligations for the fiscal years ended March 31, 2015 and 2014 wereas follows:
For the fiscal year endedMarch 31,
2015 2014
(In millions)
At beginning of period . . . . . . . . . . . . . . . . . . . . . . . . . . . . . . . . . . . . . . . . . . . . . . . . . . ¥1,038,615 ¥1,155,477Current service cost . . . . . . . . . . . . . . . . . . . . . . . . . . . . . . . . . . . . . . . . . . . . . . . . . . . . . 31,921 32,150Interest cost . . . . . . . . . . . . . . . . . . . . . . . . . . . . . . . . . . . . . . . . . . . . . . . . . . . . . . . . . . . 14,067 15,348Actuarial losses (gains)—demographic assumptions . . . . . . . . . . . . . . . . . . . . . . . . . . . 8,893 (335)Actuarial losses (gains)—financial assumptions . . . . . . . . . . . . . . . . . . . . . . . . . . . . . . 33,154 (115,380)Actuarial losses—experience . . . . . . . . . . . . . . . . . . . . . . . . . . . . . . . . . . . . . . . . . . . . . 9,083 8,187Benefits paid . . . . . . . . . . . . . . . . . . . . . . . . . . . . . . . . . . . . . . . . . . . . . . . . . . . . . . . . . . (40,949) (40,851)Lump-sum payments . . . . . . . . . . . . . . . . . . . . . . . . . . . . . . . . . . . . . . . . . . . . . . . . . . . . (10,250) (15,118)Past service cost . . . . . . . . . . . . . . . . . . . . . . . . . . . . . . . . . . . . . . . . . . . . . . . . . . . . . . . 60 (345)Acquisition and disposal of subsidiaries . . . . . . . . . . . . . . . . . . . . . . . . . . . . . . . . . . . . . (157) 524Settlements . . . . . . . . . . . . . . . . . . . . . . . . . . . . . . . . . . . . . . . . . . . . . . . . . . . . . . . . . . . — (3,332)Others . . . . . . . . . . . . . . . . . . . . . . . . . . . . . . . . . . . . . . . . . . . . . . . . . . . . . . . . . . . . . . . 1,099 2,290
At end of period . . . . . . . . . . . . . . . . . . . . . . . . . . . . . . . . . . . . . . . . . . . . . . . . . . . . . . . . ¥1,085,536 ¥1,038,615
The movements in the fair value of plan assets for the fiscal years ended March 31, 2015 and 2014 were asfollows:
For the fiscal year endedMarch 31,
2015 2014
(In millions)
At beginning of period . . . . . . . . . . . . . . . . . . . . . . . . . . . . . . . . . . . . . . . . . . . . . . . . . . ¥1,160,733 ¥1,033,030Interest income . . . . . . . . . . . . . . . . . . . . . . . . . . . . . . . . . . . . . . . . . . . . . . . . . . . . . . . . 15,816 14,022Return on plan assets excluding interest income . . . . . . . . . . . . . . . . . . . . . . . . . . . . . . 232,768 106,714Contributions by employer . . . . . . . . . . . . . . . . . . . . . . . . . . . . . . . . . . . . . . . . . . . . . . . 48,963 47,983Benefits paid . . . . . . . . . . . . . . . . . . . . . . . . . . . . . . . . . . . . . . . . . . . . . . . . . . . . . . . . . . (40,949) (40,851)Acquisition and disposal of subsidiaries . . . . . . . . . . . . . . . . . . . . . . . . . . . . . . . . . . . . . — 493Settlements . . . . . . . . . . . . . . . . . . . . . . . . . . . . . . . . . . . . . . . . . . . . . . . . . . . . . . . . . . . — (3,063)Others . . . . . . . . . . . . . . . . . . . . . . . . . . . . . . . . . . . . . . . . . . . . . . . . . . . . . . . . . . . . . . . 879 2,405
At end of period . . . . . . . . . . . . . . . . . . . . . . . . . . . . . . . . . . . . . . . . . . . . . . . . . . . . . . . . ¥1,418,210 ¥1,160,733
The amounts recognized in “General and administrative expenses” in the consolidated income statement forthe fiscal years ended March 31, 2015, 2014 and 2013 were as follows:
For the fiscal year ended March 31,
2015 2014 2013
(In millions)
Current service cost . . . . . . . . . . . . . . . . . . . . . . . . . . . . . . . . . . . . . . . . . . . . . . . . ¥31,921 ¥32,150 ¥28,655Net interest cost . . . . . . . . . . . . . . . . . . . . . . . . . . . . . . . . . . . . . . . . . . . . . . . . . . . (1,749) 1,326 3,101Past service cost . . . . . . . . . . . . . . . . . . . . . . . . . . . . . . . . . . . . . . . . . . . . . . . . . . . 60 (345) —
Total . . . . . . . . . . . . . . . . . . . . . . . . . . . . . . . . . . . . . . . . . . . . . . . . . . . . . . . . ¥30,232 ¥33,131 ¥31,756
F-64
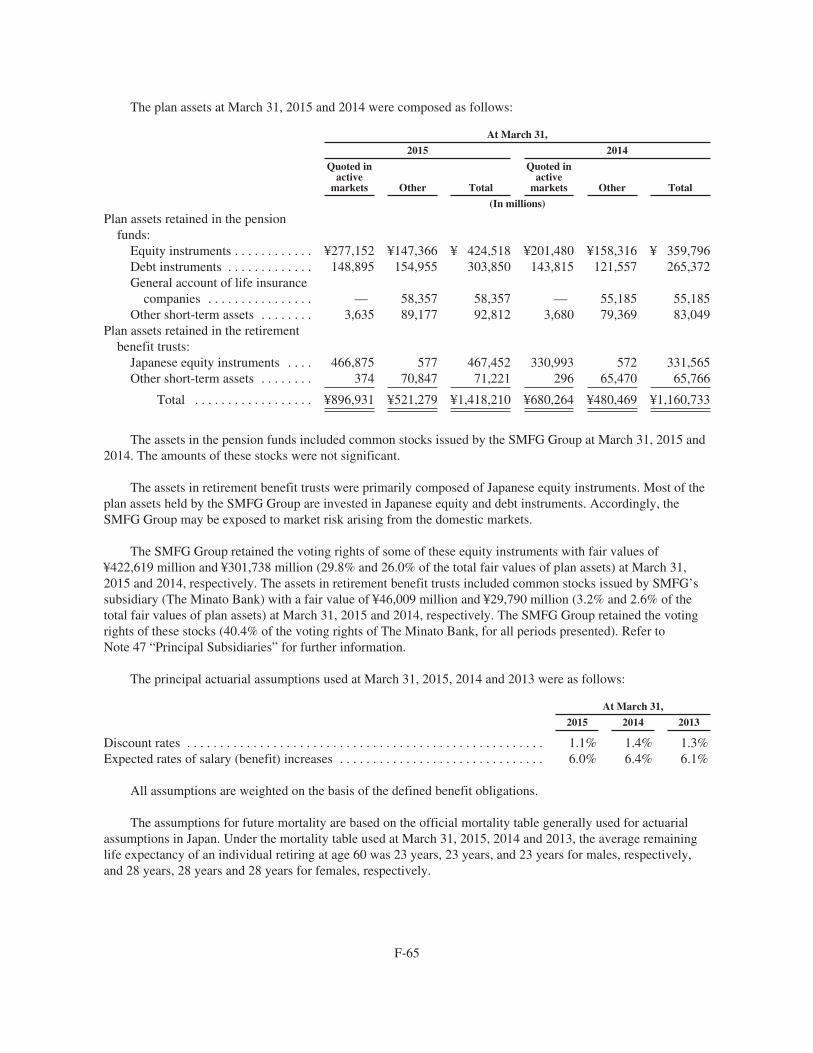
The plan assets at March 31, 2015 and 2014 were composed as follows:
At March 31,
2015 2014
Quoted inactive
markets Other Total
Quoted inactive
markets Other Total
(In millions)
Plan assets retained in the pensionfunds:
Equity instruments . . . . . . . . . . . . ¥277,152 ¥147,366 ¥ 424,518 ¥201,480 ¥158,316 ¥ 359,796Debt instruments . . . . . . . . . . . . . 148,895 154,955 303,850 143,815 121,557 265,372General account of life insurance
companies . . . . . . . . . . . . . . . . — 58,357 58,357 — 55,185 55,185Other short-term assets . . . . . . . . 3,635 89,177 92,812 3,680 79,369 83,049
Plan assets retained in the retirementbenefit trusts:
Japanese equity instruments . . . . 466,875 577 467,452 330,993 572 331,565Other short-term assets . . . . . . . . 374 70,847 71,221 296 65,470 65,766
Total . . . . . . . . . . . . . . . . . . ¥896,931 ¥521,279 ¥1,418,210 ¥680,264 ¥480,469 ¥1,160,733
The assets in the pension funds included common stocks issued by the SMFG Group at March 31, 2015 and2014. The amounts of these stocks were not significant.
The assets in retirement benefit trusts were primarily composed of Japanese equity instruments. Most of theplan assets held by the SMFG Group are invested in Japanese equity and debt instruments. Accordingly, theSMFG Group may be exposed to market risk arising from the domestic markets.
The SMFG Group retained the voting rights of some of these equity instruments with fair values of¥422,619 million and ¥301,738 million (29.8% and 26.0% of the total fair values of plan assets) at March 31,2015 and 2014, respectively. The assets in retirement benefit trusts included common stocks issued by SMFG’ssubsidiary (The Minato Bank) with a fair value of ¥46,009 million and ¥29,790 million (3.2% and 2.6% of thetotal fair values of plan assets) at March 31, 2015 and 2014, respectively. The SMFG Group retained the votingrights of these stocks (40.4% of the voting rights of The Minato Bank, for all periods presented). Refer toNote 47 “Principal Subsidiaries” for further information.
The principal actuarial assumptions used at March 31, 2015, 2014 and 2013 were as follows:
At March 31,
2015 2014 2013
Discount rates . . . . . . . . . . . . . . . . . . . . . . . . . . . . . . . . . . . . . . . . . . . . . . . . . . . . . . 1.1% 1.4% 1.3%Expected rates of salary (benefit) increases . . . . . . . . . . . . . . . . . . . . . . . . . . . . . . . 6.0% 6.4% 6.1%
All assumptions are weighted on the basis of the defined benefit obligations.
The assumptions for future mortality are based on the official mortality table generally used for actuarialassumptions in Japan. Under the mortality table used at March 31, 2015, 2014 and 2013, the average remaininglife expectancy of an individual retiring at age 60 was 23 years, 23 years, and 23 years for males, respectively,and 28 years, 28 years and 28 years for females, respectively.
F-65

The sensitivity analyses of the effect of changes in key assumptions on the defined benefit obligations atMarch 31, 2015 and 2014 were as follows:
At March 31,
2015 2014
Increase/(decrease) Increase/(decrease)
(In millions)
Discount rates:Increase by 50 bps . . . . . . . . . . . . . . . . . . . . . . . . . . . . . . . . . . . . . . . . . ¥ (57,955) ¥ (53,526)Decrease by 50 bps . . . . . . . . . . . . . . . . . . . . . . . . . . . . . . . . . . . . . . . . . 65,095 59,886
Expected rates of salary (benefit) increases:Increase by 50 bps . . . . . . . . . . . . . . . . . . . . . . . . . . . . . . . . . . . . . . . . . ¥ 82 ¥ 76Decrease by 50 bps . . . . . . . . . . . . . . . . . . . . . . . . . . . . . . . . . . . . . . . . . (80) (74)
Each increase and decrease in the table above assumes that only one assumption is changed, with all otherassumptions remaining unchanged. In practice, however, changes in multiple assumptions may occur in amutually interrelated manner.
The weighted average durations of defined benefit plans for the fiscal years ended March 31, 2015, 2014and 2013 were as follows:
At March 31,
2015 2014 2013
(Years)
Lump-sum severance indemnity plans . . . . . . . . . . . . . . . . . . . . . . . . . . . . . . . . . . . 12.0 12.1 15.1Defined benefit pension plans . . . . . . . . . . . . . . . . . . . . . . . . . . . . . . . . . . . . . . . . . . 17.2 16.6 15.7
Funding Policy for Plan Assets
The pension funds review the funding status of plan assets every year. If any funding deficit is identified, ameasure to cover such deficit will be implemented, for example, by increasing the amount of contributions by theemployer.
Expected contribution
Expected contributions to the defined benefit plans for the fiscal year ending March 31, 2016 are¥45,356 million.
Defined Contribution Plans
Some of SMFG’s subsidiaries provide defined contribution plans. The amounts recognized as expenses forthe defined contribution plans were ¥6,463 million, ¥5,936 million and ¥5,071 million for the fiscal years endedMarch 31, 2015, 2014 and 2013, respectively, which were included in “General and administrative expenses” inthe consolidated income statement.
Employees’ Pension Insurance Plan
In Japan, the Government of Japan operates the Employees’ Pension Insurance Plan which covers most ofthe private entities’ employees. The amounts of contributions charged to expense for the Employees’ PensionInsurance Plan were ¥37,574 million, ¥33,849 million and ¥30,922 million for the fiscal years ended March 31,2015, 2014 and 2013, respectively, which were included in “General and administrative expenses” in theconsolidated income statement.
F-66
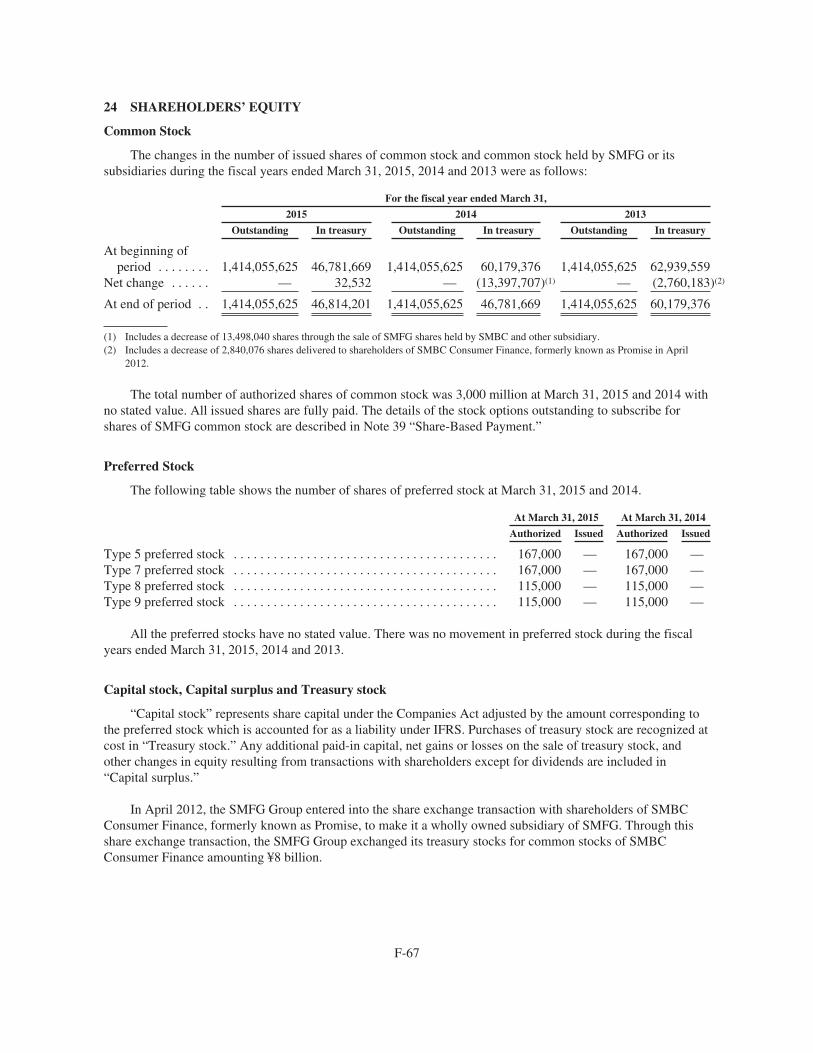
24 SHAREHOLDERS’ EQUITY
Common Stock
The changes in the number of issued shares of common stock and common stock held by SMFG or itssubsidiaries during the fiscal years ended March 31, 2015, 2014 and 2013 were as follows:
For the fiscal year ended March 31,
2015 2014 2013
Outstanding In treasury Outstanding In treasury Outstanding In treasury
At beginning ofperiod . . . . . . . . 1,414,055,625 46,781,669 1,414,055,625 60,179,376 1,414,055,625 62,939,559
Net change . . . . . . — 32,532 — (13,397,707)(1) — (2,760,183)(2)
At end of period . . 1,414,055,625 46,814,201 1,414,055,625 46,781,669 1,414,055,625 60,179,376
(1) Includes a decrease of 13,498,040 shares through the sale of SMFG shares held by SMBC and other subsidiary.(2) Includes a decrease of 2,840,076 shares delivered to shareholders of SMBC Consumer Finance, formerly known as Promise in April
2012.
The total number of authorized shares of common stock was 3,000 million at March 31, 2015 and 2014 withno stated value. All issued shares are fully paid. The details of the stock options outstanding to subscribe forshares of SMFG common stock are described in Note 39 “Share-Based Payment.”
Preferred Stock
The following table shows the number of shares of preferred stock at March 31, 2015 and 2014.
At March 31, 2015 At March 31, 2014
Authorized Issued Authorized Issued
Type 5 preferred stock . . . . . . . . . . . . . . . . . . . . . . . . . . . . . . . . . . . . . . . . 167,000 — 167,000 —Type 7 preferred stock . . . . . . . . . . . . . . . . . . . . . . . . . . . . . . . . . . . . . . . . 167,000 — 167,000 —Type 8 preferred stock . . . . . . . . . . . . . . . . . . . . . . . . . . . . . . . . . . . . . . . . 115,000 — 115,000 —Type 9 preferred stock . . . . . . . . . . . . . . . . . . . . . . . . . . . . . . . . . . . . . . . . 115,000 — 115,000 —
All the preferred stocks have no stated value. There was no movement in preferred stock during the fiscalyears ended March 31, 2015, 2014 and 2013.
Capital stock, Capital surplus and Treasury stock
“Capital stock” represents share capital under the Companies Act adjusted by the amount corresponding tothe preferred stock which is accounted for as a liability under IFRS. Purchases of treasury stock are recognized atcost in “Treasury stock.” Any additional paid-in capital, net gains or losses on the sale of treasury stock, andother changes in equity resulting from transactions with shareholders except for dividends are included in“Capital surplus.”
In April 2012, the SMFG Group entered into the share exchange transaction with shareholders of SMBCConsumer Finance, formerly known as Promise, to make it a wholly owned subsidiary of SMFG. Through thisshare exchange transaction, the SMFG Group exchanged its treasury stocks for common stocks of SMBCConsumer Finance amounting ¥8 billion.
F-67

Restriction on the Payment of Dividends
The amount of the capital surplus and retained earnings of SMFG that can be paid out as dividends issubject to restrictions under the Companies Act. These amounts are calculated based on SMFG’snonconsolidated statement of financial position prepared in accordance with Japanese GAAP. Therefore, theadjustments made to prepare the IFRS consolidated financial statements have no impact on the calculation. Thetotal amount that SMFG can pay out as a dividend was ¥1,064 billion at March 31, 2015.
Other than the restriction by the Companies Act, SMFG is required to maintain a risk-weighted capital ratioas per the Banking Act of Japan (“Banking Act”). The detail of the restriction is described in Note 45 “FinancialRisk Management.” Therefore, SMFG would not be able to pay a dividend if the ratio were to fall below theminimum amount as a result of the payment of the dividends.
Since SMFG is a holding company, its earnings rely mostly on dividend income from SMBC, and SMFG’sother subsidiaries and associates. SMBC is subject to some restrictions on its dividend payment by theCompanies Act and the Banking Act, similar to those applied to SMFG.
Other Reserves
Remeasurements of defined benefit plans reserve
Remeasurements of the defined benefit plans reserve includes the accumulated actuarial gains and lossesarising from experience adjustments and changes in actuarial assumptions, and return on plan assets excludinginterest income.
The movements of remeasurements of the defined benefit plans reserve for the fiscal years ended March 31,2015, 2014 and 2013 were as follows:
For the fiscal year ended March 31,
2015 2014 2013
(In millions)
At beginning of period . . . . . . . . . . . . . . . . . . . . . . . . . . . . . . . . . . . . . . . . . . . ¥ (1,982) ¥(138,013) ¥(156,804)Gains (losses) arising during the period, before tax . . . . . . . . . . . . . . . . . . . . 181,638 214,242 31,086Income tax (expense) benefit for changes arising during the period . . . . . . . (58,081) (76,596) (12,613)Amount attributable to non-controlling interests . . . . . . . . . . . . . . . . . . . . . . (1,451) (1,034) 318Share of other comprehensive income (loss) of associates and joint
ventures . . . . . . . . . . . . . . . . . . . . . . . . . . . . . . . . . . . . . . . . . . . . . . . . . . . . 192 (581) —
At end of period . . . . . . . . . . . . . . . . . . . . . . . . . . . . . . . . . . . . . . . . . . . . . . . . ¥120,316 ¥ (1,982) ¥(138,013)
Available-for-sale financial assets reserve
The available-for-sale financial assets reserve includes the accumulated gains and losses of available-for-sale financial assets excluding the amount reclassified to profit or loss when the assets are derecognized orimpaired.
F-68

The movements of the available-for-sale financial assets reserve for the fiscal years ended March 31, 2015,2014 and 2013 were as follows:
For the fiscal year ended March 31,
2015 2014 2013
(In millions)
At beginning of period . . . . . . . . . . . . . . . . . . . . . . . . . . . . . . . . . . . . . . . ¥1,397,450 ¥1,159,215 ¥ 652,718Gains (losses) arising during the period, before tax . . . . . . . . . . . . . . . . . 1,392,139 589,766 816,721Income tax (expense) benefit for changes arising during the period . . . . (381,512) (214,636) (290,344)Reclassification adjustments for (gains) losses included in net profit,
before tax . . . . . . . . . . . . . . . . . . . . . . . . . . . . . . . . . . . . . . . . . . . . . . . . (232,281) (212,001) (3,633)Income tax benefit for reclassification adjustments . . . . . . . . . . . . . . . . . 82,628 80,364 1,491Amount attributable to non-controlling interests . . . . . . . . . . . . . . . . . . . (25,297) (5,507) (17,564)Share of other comprehensive income (loss) of associates and joint
ventures . . . . . . . . . . . . . . . . . . . . . . . . . . . . . . . . . . . . . . . . . . . . . . . . . 1,509 249 (174)
At end of period . . . . . . . . . . . . . . . . . . . . . . . . . . . . . . . . . . . . . . . . . . . . . ¥2,234,636 ¥1,397,450 ¥1,159,215
Exchange differences on translating foreign operations reserve
Exchange differences on translating the foreign operations reserve includes foreign exchange differencesarising from the translation of the net assets of foreign operations from their functional currencies to the SMFGGroup’s presentation currency, Japanese yen.
The movements of exchange differences on translating the foreign operations reserve for the fiscal yearsended March 31, 2015, 2014 and 2013 were as follows:
For the fiscal year ended March 31,
2015 2014 2013
(In millions)
At beginning of period . . . . . . . . . . . . . . . . . . . . . . . . . . . . . . . . . . . . . . . ¥ 151,358 ¥ (50,032) ¥ (209,996)Gains (losses) arising during the period, before tax . . . . . . . . . . . . . . . . . 301,796 271,619 230,764Income tax (expense) benefit for changes arising during the period . . . . (3,015) (17,967) (20,338)Reclassification adjustments for (gains) losses included in net profit,
before tax . . . . . . . . . . . . . . . . . . . . . . . . . . . . . . . . . . . . . . . . . . . . . . . . (2,164) (1,311) 4,579Income tax (expense) benefit for reclassification adjustments . . . . . . . . . 770 796 (1,737)Amount attributable to non-controlling interests . . . . . . . . . . . . . . . . . . . (48,666) (46,788) (56,832)Share of other comprehensive income (loss) of associates and joint
ventures . . . . . . . . . . . . . . . . . . . . . . . . . . . . . . . . . . . . . . . . . . . . . . . . . 4,053 (4,959) 3,528
At end of period . . . . . . . . . . . . . . . . . . . . . . . . . . . . . . . . . . . . . . . . . . . . . ¥ 404,132 ¥ 151,358 ¥ (50,032)
F-69
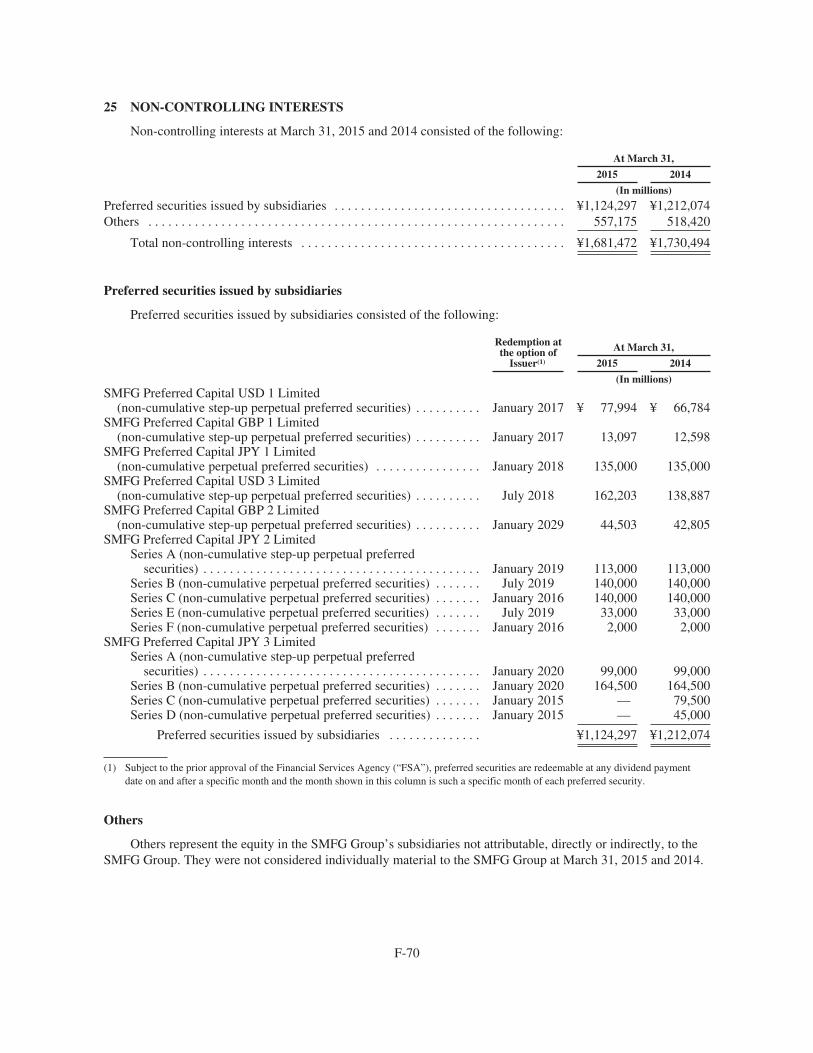
25 NON-CONTROLLING INTERESTS
Non-controlling interests at March 31, 2015 and 2014 consisted of the following:
At March 31,
2015 2014
(In millions)
Preferred securities issued by subsidiaries . . . . . . . . . . . . . . . . . . . . . . . . . . . . . . . . . . . ¥1,124,297 ¥1,212,074Others . . . . . . . . . . . . . . . . . . . . . . . . . . . . . . . . . . . . . . . . . . . . . . . . . . . . . . . . . . . . . . . 557,175 518,420
Total non-controlling interests . . . . . . . . . . . . . . . . . . . . . . . . . . . . . . . . . . . . . . . . ¥1,681,472 ¥1,730,494
Preferred securities issued by subsidiaries
Preferred securities issued by subsidiaries consisted of the following:
Redemption atthe option of
Issuer(1)
At March 31,
2015 2014
(In millions)SMFG Preferred Capital USD 1 Limited
(non-cumulative step-up perpetual preferred securities) . . . . . . . . . . January 2017 ¥ 77,994 ¥ 66,784SMFG Preferred Capital GBP 1 Limited
(non-cumulative step-up perpetual preferred securities) . . . . . . . . . . January 2017 13,097 12,598SMFG Preferred Capital JPY 1 Limited
(non-cumulative perpetual preferred securities) . . . . . . . . . . . . . . . . January 2018 135,000 135,000SMFG Preferred Capital USD 3 Limited
(non-cumulative step-up perpetual preferred securities) . . . . . . . . . . July 2018 162,203 138,887SMFG Preferred Capital GBP 2 Limited
(non-cumulative step-up perpetual preferred securities) . . . . . . . . . . January 2029 44,503 42,805SMFG Preferred Capital JPY 2 Limited
Series A (non-cumulative step-up perpetual preferredsecurities) . . . . . . . . . . . . . . . . . . . . . . . . . . . . . . . . . . . . . . . . . . January 2019 113,000 113,000
Series B (non-cumulative perpetual preferred securities) . . . . . . . July 2019 140,000 140,000Series C (non-cumulative perpetual preferred securities) . . . . . . . January 2016 140,000 140,000Series E (non-cumulative perpetual preferred securities) . . . . . . . July 2019 33,000 33,000Series F (non-cumulative perpetual preferred securities) . . . . . . . January 2016 2,000 2,000
SMFG Preferred Capital JPY 3 LimitedSeries A (non-cumulative step-up perpetual preferred
securities) . . . . . . . . . . . . . . . . . . . . . . . . . . . . . . . . . . . . . . . . . . January 2020 99,000 99,000Series B (non-cumulative perpetual preferred securities) . . . . . . . January 2020 164,500 164,500Series C (non-cumulative perpetual preferred securities) . . . . . . . January 2015 — 79,500Series D (non-cumulative perpetual preferred securities) . . . . . . . January 2015 — 45,000
Preferred securities issued by subsidiaries . . . . . . . . . . . . . . ¥1,124,297 ¥1,212,074
(1) Subject to the prior approval of the Financial Services Agency (“FSA”), preferred securities are redeemable at any dividend paymentdate on and after a specific month and the month shown in this column is such a specific month of each preferred security.
Others
Others represent the equity in the SMFG Group’s subsidiaries not attributable, directly or indirectly, to theSMFG Group. They were not considered individually material to the SMFG Group at March 31, 2015 and 2014.
F-70
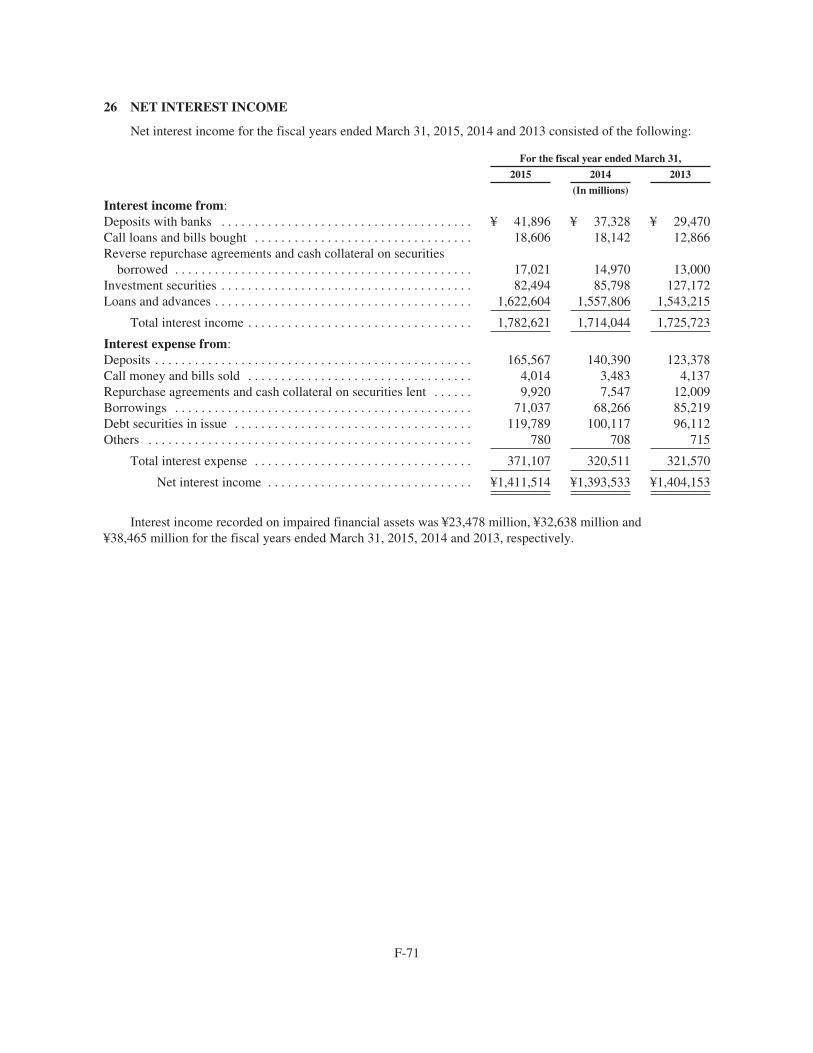
26 NET INTEREST INCOME
Net interest income for the fiscal years ended March 31, 2015, 2014 and 2013 consisted of the following:
For the fiscal year ended March 31,
2015 2014 2013
(In millions)
Interest income from:Deposits with banks . . . . . . . . . . . . . . . . . . . . . . . . . . . . . . . . . . . . . . ¥ 41,896 ¥ 37,328 ¥ 29,470Call loans and bills bought . . . . . . . . . . . . . . . . . . . . . . . . . . . . . . . . . 18,606 18,142 12,866Reverse repurchase agreements and cash collateral on securities
borrowed . . . . . . . . . . . . . . . . . . . . . . . . . . . . . . . . . . . . . . . . . . . . . 17,021 14,970 13,000Investment securities . . . . . . . . . . . . . . . . . . . . . . . . . . . . . . . . . . . . . . 82,494 85,798 127,172Loans and advances . . . . . . . . . . . . . . . . . . . . . . . . . . . . . . . . . . . . . . . 1,622,604 1,557,806 1,543,215
Total interest income . . . . . . . . . . . . . . . . . . . . . . . . . . . . . . . . . . 1,782,621 1,714,044 1,725,723
Interest expense from:Deposits . . . . . . . . . . . . . . . . . . . . . . . . . . . . . . . . . . . . . . . . . . . . . . . . 165,567 140,390 123,378Call money and bills sold . . . . . . . . . . . . . . . . . . . . . . . . . . . . . . . . . . 4,014 3,483 4,137Repurchase agreements and cash collateral on securities lent . . . . . . 9,920 7,547 12,009Borrowings . . . . . . . . . . . . . . . . . . . . . . . . . . . . . . . . . . . . . . . . . . . . . 71,037 68,266 85,219Debt securities in issue . . . . . . . . . . . . . . . . . . . . . . . . . . . . . . . . . . . . 119,789 100,117 96,112Others . . . . . . . . . . . . . . . . . . . . . . . . . . . . . . . . . . . . . . . . . . . . . . . . . 780 708 715
Total interest expense . . . . . . . . . . . . . . . . . . . . . . . . . . . . . . . . . 371,107 320,511 321,570
Net interest income . . . . . . . . . . . . . . . . . . . . . . . . . . . . . . . ¥1,411,514 ¥1,393,533 ¥1,404,153
Interest income recorded on impaired financial assets was ¥23,478 million, ¥32,638 million and¥38,465 million for the fiscal years ended March 31, 2015, 2014 and 2013, respectively.
F-71

27 NET FEE AND COMMISSION INCOME
Net fee and commission income for the fiscal years ended March 31, 2015, 2014 and 2013 consisted of thefollowing:
For the fiscal year ended March 31,
2015 2014 2013
(In millions)
Fee and commission income from:Loans . . . . . . . . . . . . . . . . . . . . . . . . . . . . . . . . . . . . . . . . . . . . . . . . . . . ¥ 103,486 ¥ 109,788 ¥111,153Credit card business . . . . . . . . . . . . . . . . . . . . . . . . . . . . . . . . . . . . . . . . 245,133 234,060 225,071Guarantees . . . . . . . . . . . . . . . . . . . . . . . . . . . . . . . . . . . . . . . . . . . . . . . 51,794 45,229 54,067Securities-related business . . . . . . . . . . . . . . . . . . . . . . . . . . . . . . . . . . . 130,164 137,184 80,076Deposits . . . . . . . . . . . . . . . . . . . . . . . . . . . . . . . . . . . . . . . . . . . . . . . . . 14,976 18,234 17,622Remittances and transfers . . . . . . . . . . . . . . . . . . . . . . . . . . . . . . . . . . . 129,465 130,864 128,647Safe deposits . . . . . . . . . . . . . . . . . . . . . . . . . . . . . . . . . . . . . . . . . . . . . . 5,748 5,832 5,989Trust fees . . . . . . . . . . . . . . . . . . . . . . . . . . . . . . . . . . . . . . . . . . . . . . . . 2,833 2,421 1,488Investment trusts . . . . . . . . . . . . . . . . . . . . . . . . . . . . . . . . . . . . . . . . . . 147,021 159,424 162,950Agency . . . . . . . . . . . . . . . . . . . . . . . . . . . . . . . . . . . . . . . . . . . . . . . . . . 16,854 17,966 18,146Others . . . . . . . . . . . . . . . . . . . . . . . . . . . . . . . . . . . . . . . . . . . . . . . . . . . 155,292 142,167 143,476
Total fee and commission income . . . . . . . . . . . . . . . . . . . . . . . . . 1,002,766 1,003,169 948,685
Fee and commission expense from:Remittances and transfers . . . . . . . . . . . . . . . . . . . . . . . . . . . . . . . . . . . 36,669 36,413 42,192Guarantees . . . . . . . . . . . . . . . . . . . . . . . . . . . . . . . . . . . . . . . . . . . . . . . 3,012 1,607 1,843Others . . . . . . . . . . . . . . . . . . . . . . . . . . . . . . . . . . . . . . . . . . . . . . . . . . . 89,572 89,939 83,019
Total fee and commission expense . . . . . . . . . . . . . . . . . . . . . . . . 129,253 127,959 127,054
Net fee and commission income . . . . . . . . . . . . . . . . . . . . . . ¥ 873,513 ¥ 875,210 ¥821,631
28 NET TRADING INCOME
Net trading income for the fiscal years ended March 31, 2015, 2014 and 2013 consisted of the following:
For the fiscal year ended March 31,
2015 2014 2013
(In millions)
Interest rate . . . . . . . . . . . . . . . . . . . . . . . . . . . . . . . . . . . . . . . . . . . . . . . . ¥ 248,372 ¥184,859 ¥ 269,030Foreign exchange . . . . . . . . . . . . . . . . . . . . . . . . . . . . . . . . . . . . . . . . . . . . (136,708) (81,154) (141,025)Equity . . . . . . . . . . . . . . . . . . . . . . . . . . . . . . . . . . . . . . . . . . . . . . . . . . . . . 499 10,496 (32,987)Credit . . . . . . . . . . . . . . . . . . . . . . . . . . . . . . . . . . . . . . . . . . . . . . . . . . . . . 16,970 20,983 9,955Others . . . . . . . . . . . . . . . . . . . . . . . . . . . . . . . . . . . . . . . . . . . . . . . . . . . . . (1,374) 34 329
Total net trading income . . . . . . . . . . . . . . . . . . . . . . . . . . . . . . . . . . ¥ 127,759 ¥135,218 ¥ 105,302
Net trading income includes income and losses from trading assets and liabilities, and derivative financialinstruments.
F-72
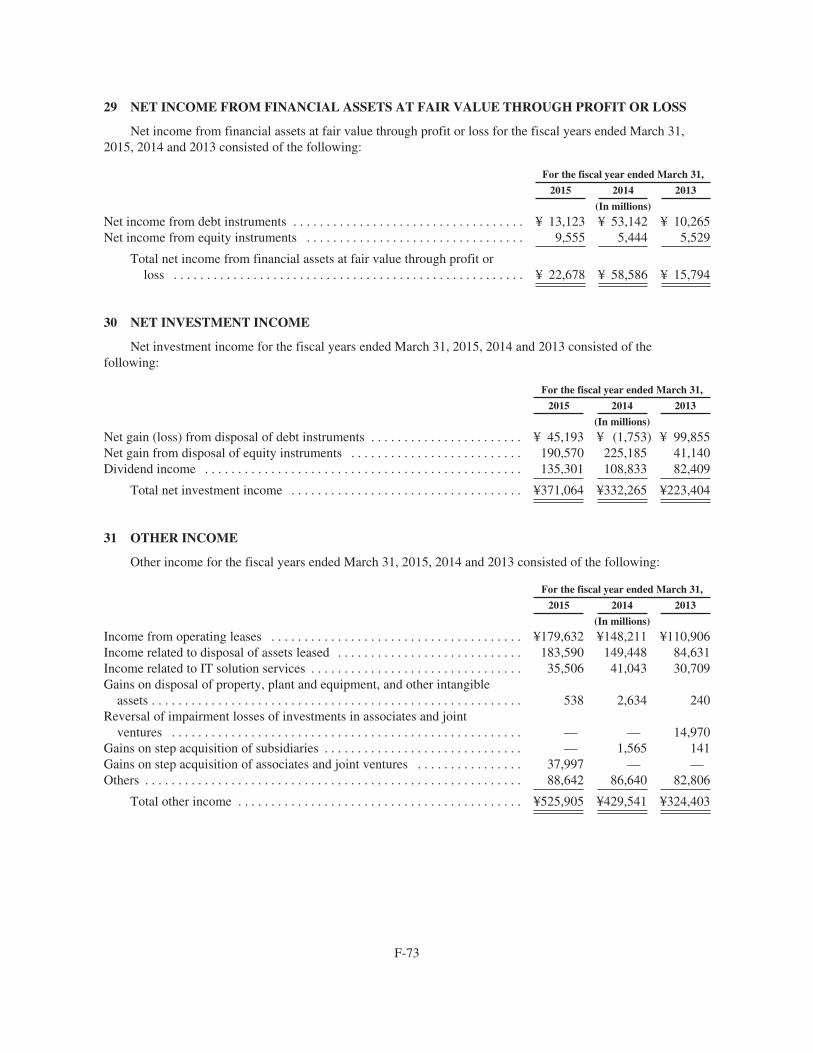
29 NET INCOME FROM FINANCIAL ASSETS AT FAIR VALUE THROUGH PROFIT OR LOSS
Net income from financial assets at fair value through profit or loss for the fiscal years ended March 31,2015, 2014 and 2013 consisted of the following:
For the fiscal year ended March 31,
2015 2014 2013
(In millions)
Net income from debt instruments . . . . . . . . . . . . . . . . . . . . . . . . . . . . . . . . . . . ¥ 13,123 ¥ 53,142 ¥ 10,265Net income from equity instruments . . . . . . . . . . . . . . . . . . . . . . . . . . . . . . . . . 9,555 5,444 5,529
Total net income from financial assets at fair value through profit orloss . . . . . . . . . . . . . . . . . . . . . . . . . . . . . . . . . . . . . . . . . . . . . . . . . . . . . ¥ 22,678 ¥ 58,586 ¥ 15,794
30 NET INVESTMENT INCOME
Net investment income for the fiscal years ended March 31, 2015, 2014 and 2013 consisted of thefollowing:
For the fiscal year ended March 31,
2015 2014 2013
(In millions)
Net gain (loss) from disposal of debt instruments . . . . . . . . . . . . . . . . . . . . . . . ¥ 45,193 ¥ (1,753) ¥ 99,855Net gain from disposal of equity instruments . . . . . . . . . . . . . . . . . . . . . . . . . . 190,570 225,185 41,140Dividend income . . . . . . . . . . . . . . . . . . . . . . . . . . . . . . . . . . . . . . . . . . . . . . . . 135,301 108,833 82,409
Total net investment income . . . . . . . . . . . . . . . . . . . . . . . . . . . . . . . . . . . ¥371,064 ¥332,265 ¥223,404
31 OTHER INCOME
Other income for the fiscal years ended March 31, 2015, 2014 and 2013 consisted of the following:
For the fiscal year ended March 31,
2015 2014 2013
(In millions)
Income from operating leases . . . . . . . . . . . . . . . . . . . . . . . . . . . . . . . . . . . . . . ¥179,632 ¥148,211 ¥110,906Income related to disposal of assets leased . . . . . . . . . . . . . . . . . . . . . . . . . . . . 183,590 149,448 84,631Income related to IT solution services . . . . . . . . . . . . . . . . . . . . . . . . . . . . . . . . 35,506 41,043 30,709Gains on disposal of property, plant and equipment, and other intangible
assets . . . . . . . . . . . . . . . . . . . . . . . . . . . . . . . . . . . . . . . . . . . . . . . . . . . . . . . . 538 2,634 240Reversal of impairment losses of investments in associates and joint
ventures . . . . . . . . . . . . . . . . . . . . . . . . . . . . . . . . . . . . . . . . . . . . . . . . . . . . . — — 14,970Gains on step acquisition of subsidiaries . . . . . . . . . . . . . . . . . . . . . . . . . . . . . . — 1,565 141Gains on step acquisition of associates and joint ventures . . . . . . . . . . . . . . . . 37,997 — —Others . . . . . . . . . . . . . . . . . . . . . . . . . . . . . . . . . . . . . . . . . . . . . . . . . . . . . . . . . 88,642 86,640 82,806
Total other income . . . . . . . . . . . . . . . . . . . . . . . . . . . . . . . . . . . . . . . . . . . ¥525,905 ¥429,541 ¥324,403
F-73

32 IMPAIRMENT CHARGES ON FINANCIAL ASSETS
Impairment charges on financial assets for the fiscal years ended March 31, 2015, 2014 and 2013 consistedof the following:
For the fiscal year ended March 31,
2015 2014 2013
(In millions)Loans and advances(1) . . . . . . . . . . . . . . . . . . . . . . . . . . . . . . . . . . . . . . . . ¥79,552 ¥(25,806) ¥138,375Available-for-sale financial assets . . . . . . . . . . . . . . . . . . . . . . . . . . . . . . 10,586 11,531 131,770
Total impairment charges (reversals) on financial assets . . . . . . . . . ¥90,138 ¥(14,275) ¥270,145
(1) Cross-reference to provision (credit) for loan losses in the table of reconciliation of allowance for loan losses in Note 10 “Loans andAdvances.”
33 GENERAL AND ADMINISTRATIVE EXPENSES
General and administrative expenses for the fiscal years ended March 31, 2015, 2014 and 2013 consisted ofthe following:
For the fiscal year ended March 31,
2015 2014 2013
(In millions)Personnel expenses . . . . . . . . . . . . . . . . . . . . . . . . . . . . . . . . . . . . . . . . . . ¥ 749,480 ¥ 706,376 ¥ 666,073Depreciation and amortization . . . . . . . . . . . . . . . . . . . . . . . . . . . . . . . . . 146,233 137,742 130,382Rent and lease expenses . . . . . . . . . . . . . . . . . . . . . . . . . . . . . . . . . . . . . . 116,745 113,314 111,327Building and maintenance expenses . . . . . . . . . . . . . . . . . . . . . . . . . . . . . 10,068 8,886 7,926Supplies expenses . . . . . . . . . . . . . . . . . . . . . . . . . . . . . . . . . . . . . . . . . . . 14,865 15,482 14,267Communication expenses . . . . . . . . . . . . . . . . . . . . . . . . . . . . . . . . . . . . . 35,126 35,017 33,099Publicity and advertising expenses . . . . . . . . . . . . . . . . . . . . . . . . . . . . . . 68,481 56,791 48,979Taxes and dues . . . . . . . . . . . . . . . . . . . . . . . . . . . . . . . . . . . . . . . . . . . . . 67,913 57,782 57,617Outsourcing expenses . . . . . . . . . . . . . . . . . . . . . . . . . . . . . . . . . . . . . . . . 91,189 88,072 87,583Premiums for deposit insurance . . . . . . . . . . . . . . . . . . . . . . . . . . . . . . . . 56,789 54,532 53,687Office equipment expenses . . . . . . . . . . . . . . . . . . . . . . . . . . . . . . . . . . . . 47,318 40,388 35,749Others . . . . . . . . . . . . . . . . . . . . . . . . . . . . . . . . . . . . . . . . . . . . . . . . . . . . 217,690 208,608 200,427
Total general and administrative expenses . . . . . . . . . . . . . . . . . . . . ¥1,621,897 ¥1,522,990 ¥1,447,116
34 OTHER EXPENSES
Other expenses for the fiscal years ended March 31, 2015, 2014 and 2013 consisted of the following:
For the fiscal year ended March 31,
2015 2014 2013
(In millions)Cost of operating leases . . . . . . . . . . . . . . . . . . . . . . . . . . . . . . . . . . . . . . . ¥ 87,206 ¥ 72,268 ¥ 58,252Cost related to disposal of assets leased . . . . . . . . . . . . . . . . . . . . . . . . . . 171,707 146,196 81,083Cost related to IT solution services and IT systems . . . . . . . . . . . . . . . . . 84,300 75,173 69,636Provision for interest repayment . . . . . . . . . . . . . . . . . . . . . . . . . . . . . . . . 64,195 49,764 416Losses on disposal of property, plant and equipment, and other
intangible assets . . . . . . . . . . . . . . . . . . . . . . . . . . . . . . . . . . . . . . . . . . . 6,703 6,763 5,432Impairment losses of property, plant and equipment . . . . . . . . . . . . . . . . 5,108 3,157 4,333Impairment losses of intangible assets . . . . . . . . . . . . . . . . . . . . . . . . . . . 4 193 35Losses on sale of investments in subsidiaries and associates . . . . . . . . . . 2,221 — 8Impairment losses of investments in associates and joint ventures . . . . . 4,631 4,686 7,347Others . . . . . . . . . . . . . . . . . . . . . . . . . . . . . . . . . . . . . . . . . . . . . . . . . . . . 79,539 70,580 61,354
Total other expenses . . . . . . . . . . . . . . . . . . . . . . . . . . . . . . . . . . . . . ¥ 505,614 ¥ 428,780 ¥ 287,896
F-74

35 INCOME TAX EXPENSE
The detail of income tax expense for the fiscal years ended March 31, 2015, 2014 and 2013 was as follows:
For the fiscal year ended March 31,
2015 2014 2013
(In millions)
Current tax:Charge for period . . . . . . . . . . . . . . . . . . . . . . . . . . . . . . . . . . . . . . . . . . . ¥ 322,838 ¥ 288,269 ¥ 271,936Deferred tax:Origination and reversal of temporary differences . . . . . . . . . . . . . . . . . . 19,378 134,121 6,386Change in the write-down of deferred tax assets on the current fiscal
year income tax expense . . . . . . . . . . . . . . . . . . . . . . . . . . . . . . . . . . . . (7,240) (21,246) (23,022)Changes in Japanese corporation tax rates(1) . . . . . . . . . . . . . . . . . . . . . . . 74,971 12,932 —
Total deferred tax expense (benefit) . . . . . . . . . . . . . . . . . . . . . . . . . 87,109 125,807 (16,636)
Total income tax expense . . . . . . . . . . . . . . . . . . . . . . . . . . . . . ¥ 409,947 ¥ 414,076 ¥ 255,300
(1) See Note 22 “Deferred Income Tax” for further information on changes in Japanese corporation tax rates.
The following table shows the reconciliations of the effective income tax rates for the fiscal years endedMarch 31, 2015, 2014 and 2013.
For the fiscal year ended March 31,
2015 2014 2013
(In millions, except percentages)
Profit before tax . . . . . . . . . . . . . . . . . . . . . . . . . . . . . . . . . . . . . . . . . . . . . . ¥1,132,908 ¥1,306,312 ¥909,123Income tax expense . . . . . . . . . . . . . . . . . . . . . . . . . . . . . . . . . . . . . . . . . . . 409,947 414,076 255,300
Effective income tax rate . . . . . . . . . . . . . . . . . . . . . . . . . . . . . . . . . . . 36.2% 31.7% 28.1%
Statutory tax rate in Japan(1) . . . . . . . . . . . . . . . . . . . . . . . . . . . . . . . . . . . . . 35.6% 38.0% 38.0%Changes in Japanese corporation tax rates . . . . . . . . . . . . . . . . . . . . . . . . . . 6.6% 1.0% —Non-Japanese earnings . . . . . . . . . . . . . . . . . . . . . . . . . . . . . . . . . . . . . . . . . (3.8%) (3.6%) (4.8%)Nontaxable dividends received . . . . . . . . . . . . . . . . . . . . . . . . . . . . . . . . . . (2.4%) (1.6%) (1.2%)Effect of the change in the write-down of deferred tax assets on the
current fiscal year income tax expense . . . . . . . . . . . . . . . . . . . . . . . . . . (0.6%) (1.6%) (2.5%)Tax impact of share of post-tax (profit) loss in associates and joint
ventures . . . . . . . . . . . . . . . . . . . . . . . . . . . . . . . . . . . . . . . . . . . . . . . . . . (0.5%) (0.6%) (0.8%)Tax impact of impairment losses and reversal of impairment losses for
investments in associates and joint ventures—net . . . . . . . . . . . . . . . . . . 0.2% 0.1% (0.3%)Gains on step acquisition of subsidiaries which were not taxable . . . . . . . . (0.1%) — —Others—net . . . . . . . . . . . . . . . . . . . . . . . . . . . . . . . . . . . . . . . . . . . . . . . . . 1.2% — (0.3%)
Effective income tax rate . . . . . . . . . . . . . . . . . . . . . . . . . . . . . . . . . . . 36.2% 31.7% 28.1%
(1) The statutory tax rate in Japan for the fiscal year ended March 31, 2015 is the aggregate of the effective corporation tax rate of 23.7%,the effective inhabitant tax rate of 4.9% and the effective enterprise tax rate of 7.0%, which is payable by corporate entities on taxableprofits under the tax laws in Japan. The effective corporation tax rate was changed from 26.1% which was applied to the fiscal yearsended March 31, 2014 and 2013. The statutory tax rate in Japan has been changed from the fiscal year beginning April 1, 2015 reflectingthe changes in Japanese corporation tax rates as mentioned in Note 22 “Deferred Income Tax.”
F-75

36 EARNINGS PER SHARE
The following table shows the income and share data used in the basic and diluted earnings per sharecalculations for the fiscal years ended March 31, 2015, 2014 and 2013.
For the fiscal year ended March 31,
2015 2014 2013
(In millions, except number of shares andper share data)
Basic:Profit attributable to shareholders of SMFG . . . . . . . . . . . . . . . . . . . . . . . ¥ 614,070 ¥ 766,388 ¥ 535,976Weighted average number of common stock in issue (in thousands of
shares) . . . . . . . . . . . . . . . . . . . . . . . . . . . . . . . . . . . . . . . . . . . . . . . . . . 1,367,258 1,366,186 1,353,926
Basic earnings per share . . . . . . . . . . . . . . . . . . . . . . . . . . . . . . . . . . ¥ 449.13 ¥ 560.97 ¥ 395.87
Diluted:Profit attributable to the common shareholders of SMFG . . . . . . . . . . . . ¥ 614,070 ¥ 766,388 ¥ 535,976Impact of dilutive potential ordinary shares issued by subsidiaries . . . . . (1) (1) (531)
Net profit used to determine diluted earnings per share . . . . . . . . . . ¥ 614,069 ¥ 766,387 ¥ 535,445
Weighted average number of common stock in issue (in thousands ofshares) . . . . . . . . . . . . . . . . . . . . . . . . . . . . . . . . . . . . . . . . . . . . . . . . . . 1,367,258 1,366,186 1,353,926
Adjustments for stock options (in thousands of shares) . . . . . . . . . . . . . . 816 699 519
Weighted average number of common stock for diluted earningsper share (in thousands of shares) . . . . . . . . . . . . . . . . . . . . . . . . . 1,368,074 1,366,885 1,354,445
Diluted earnings per share . . . . . . . . . . . . . . . . . . . . . . . . . . . . . ¥ 448.86 ¥ 560.68 ¥ 395.32
37 TRANSFERS OF FINANCIAL ASSETS
In the normal course of business, the SMFG Group transfers financial assets mainly through repurchaseagreements, securities lending transactions and securitizations. Depending on the nature of the transactions, thetransfers may either result in financial assets being derecognized or continuing to be recognized on theconsolidated statement of financial position.
Full derecognition occurs when the SMFG Group transfers its contractual rights to receive cash flows fromfinancial assets, or retains the contractual rights to receive the cash flows, but assumes a contractual obligation topay the cash flows to another party, and transfers substantially all the risks and rewards of ownership, includingcredit risk, prepayment risk and interest rate risk. Derecognition does not occur when the SMFG Group retainssubstantially all the risks and rewards of ownership of the financial assets, where the contractual rights to receivecash flows from the financial assets are transferred, or the rights are retained but obligations to pay the cash flowsare assumed.
F-76

The following tables show the carrying amounts and fair values of transferred financial assets that did notqualify for derecognition and their associated financial liabilities at March 31, 2015 and 2014:
At March 31, 2015
Repurchaseagreements and
securities lendingtransactions
Loans and advances
Residentialmortgages
Corporateloans Others
(In millions)
Carrying amount of assets . . . . . . . . . . . . . . . . . . . ¥ 5,692,247 ¥ 1,277,623 ¥ 967,408 ¥ 59,776Carrying amount of associated liabilities . . . . . . . 4,525,235 1,038,648 964,022 47,105
For those liabilities that have recourse only to thetransferred assets:
Fair value of assets . . . . . . . . . . . . . . . . . . . . . . . . ¥ — ¥ 1,465,851 ¥ 971,374 ¥ 60,323Fair value of associated liabilities . . . . . . . . . . . . . — 1,116,452 964,989 47,364
Net position . . . . . . . . . . . . . . . . . . . . . . . . . . ¥ — ¥ 349,399 ¥ 6,385 ¥ 12,959
At March 31, 2014
Repurchaseagreements and
securities lendingtransactions
Loans and advances
Residentialmortgages
Corporateloans Others
(In millions)
Carrying amount of assets . . . . . . . . . . . . . . . . . . . ¥ 5,950,034 ¥ 1,259,549 ¥ 791,286 ¥ 66,890Carrying amount of associated liabilities . . . . . . . 6,981,796 1,035,451 787,087 55,879
For those liabilities that have recourse only to thetransferred assets:
Fair value of assets . . . . . . . . . . . . . . . . . . . . . . . . ¥ — ¥ 1,399,594 ¥ 795,081 ¥ 67,155Fair value of associated liabilities . . . . . . . . . . . . . — 1,099,013 788,102 56,088
Net position . . . . . . . . . . . . . . . . . . . . . . . . . . ¥ — ¥ 300,581 ¥ 6,979 ¥ 11,067
Repurchase Agreements and Securities Lending Transactions
The SMFG Group lends or sells securities under agreements to repurchase them at a predetermined price ona future date. Since substantially all the risks and rewards of the securities are retained by the SMFG Group, thesecurities remain on the consolidated statement of financial position and their associated financial liabilities arerecorded. The recourse of the counterparties to their associated financial liabilities is not limited to the underlyingsecurities.
Loans and Advances
The SMFG Group transfers its loans and advances, including residential mortgages and corporate loans,mainly to bankruptcy-remote structured entities for securitizations whereby the structured entities issue debtsecurities to the SMFG Group for subordinated tranches and to investors for senior tranches. The investors haveonly recourse to the underlying financial assets due to their bankruptcy-remoteness. Since the SMFG Groupretains substantially all the risks and rewards of ownership, the transferred financial assets do not qualify forderecognition. The SMFG Group therefore continues to recognize these transferred financial assets as loans andadvances, and recognizes their associated financial liabilities arising from issuing debt securities to investors onthe consolidated statement of financial position.
F-77

38 ASSETS PLEDGED AND RECEIVED AS COLLATERAL
Assets Pledged
The carrying amounts of assets pledged as collateral at March 31, 2015 and 2014 were as follows:
At March 31,
2015 2014
(In millions)
Cash and deposits with banks . . . . . . . . . . . . . . . . . . . . . . . . . . . . . . . . . . . . . . . . . . . ¥ 75,678 ¥ 113,573Call loans and bills bought . . . . . . . . . . . . . . . . . . . . . . . . . . . . . . . . . . . . . . . . . . . . . 478,457 347,681Trading assets . . . . . . . . . . . . . . . . . . . . . . . . . . . . . . . . . . . . . . . . . . . . . . . . . . . . . . . 1,715,157 2,267,466Financial assets at fair value through profit or loss . . . . . . . . . . . . . . . . . . . . . . . . . . . 1,615,640 1,648,262Held-to-maturity investments . . . . . . . . . . . . . . . . . . . . . . . . . . . . . . . . . . . . . . . . . . . 3,359,911 4,393,057Available-for-sale financial assets . . . . . . . . . . . . . . . . . . . . . . . . . . . . . . . . . . . . . . . 11,307,019 9,248,443Loans and advances . . . . . . . . . . . . . . . . . . . . . . . . . . . . . . . . . . . . . . . . . . . . . . . . . . . 3,088,983 2,547,250Property, plant and equipment . . . . . . . . . . . . . . . . . . . . . . . . . . . . . . . . . . . . . . . . . . 9,970 10,411Other assets . . . . . . . . . . . . . . . . . . . . . . . . . . . . . . . . . . . . . . . . . . . . . . . . . . . . . . . . . 622,583 299,243
Total . . . . . . . . . . . . . . . . . . . . . . . . . . . . . . . . . . . . . . . . . . . . . . . . . . . . . . . . . . ¥22,273,398 ¥20,875,386
The SMFG Group pledges assets as collateral to secure payables under repurchase agreements, securitieslending transactions and securitizations, borrowings or for cash settlements, margins on derivative transactionsand certain other purposes. These transactions are conducted under terms that are usual and customary tostandard contracts.
Unsecured loaned securities for which the borrowers have the right to sell or repledge were¥5,921,103 million and ¥6,037,722 million at March 31, 2015 and 2014, respectively.
For the reserve funds with the Bank of Japan and other reserve deposits for foreign offices maintained bythe SMFG Group, refer to Note 5 “Cash and Deposits with Banks.”
Assets Received as Collateral
Under certain transactions, including reverse repurchase agreements, securities borrowing, and discountingof bills, the SMFG Group is permitted to resell or repledge the collateral held in the absence of default by theowner of the collateral. These transactions are conducted under terms that are usual and customary for standardcontracts. The fair values of securities and bills accepted as collateral were ¥10,152,888 million and¥6,990,025 million at March 31, 2015 and 2014, respectively. As to the securities received in the reverserepurchase agreements and securities borrowing transactions, the SMFG Group has the obligation to returnequivalent securities upon completion of the transactions. The fair value of securities sold or repledged to otherswas ¥5,084,579 million and ¥2,987,613 million at March 31, 2015 and 2014, respectively.
F-78

39 SHARE-BASED PAYMENT
SMFG has introduced compensation-type stock options to directors, corporate auditors, and executiveofficers of SMFG and SMBC (“SMFG Stock Acquisition Rights”). This serves as an incentive for them tofurther contribute to the equity appreciation and achieve better corporate performance through sharing thebenefits and risks of the share price performance with the shareholders. The following table provides an overviewof the significant terms and conditions of the stock option plan.
Title of grantees Exercise periodRequisite service
period Method of settlement
SMFG StockAcquisitionRights . . . . . . . . . . .
Directors, corporateauditors andexecutive officers ofSMFG and SMBC
Not exceeding30 years from thedate of allocation ofstock acquisitionrights(1)
One year from thedate of the ordinarygeneral meeting ofshareholders ofSMFG to the closingof the next ordinarygeneral meeting ofshareholders of SMFG
Common stock ofSMFG
(1) A stock acquisition rights holder can exercise the rights from the day they are relieved of their positions either as a director, a corporateauditor or an executive officer (“Start of Exercise Date”) to 20 years from the Start of Exercise Date.
The number and the weighted average exercise prices of stock options for the fiscal years ended onMarch 31, 2015 and 2014 were as follows:
For the fiscal year ended March 31,
2015 2014
Number ofoptions(1)
Weightedaverage
exercise priceNumber ofoptions(1)
Weightedaverage
exercise price
Outstanding at beginning of period . . . . . . . . . . . . . . . . . . . . . 752,800 ¥ 1 641,100 ¥ 1Granted . . . . . . . . . . . . . . . . . . . . . . . . . . . . . . . . . . . . . . . . . . . 121,900 1 115,700 1Exercised . . . . . . . . . . . . . . . . . . . . . . . . . . . . . . . . . . . . . . . . . (1,200) 1 (1,500) 1Forfeited or expired . . . . . . . . . . . . . . . . . . . . . . . . . . . . . . . . . (300) 1 (2,500) 1
Outstanding at end of period . . . . . . . . . . . . . . . . . . . . . . . . . . 873,200 ¥ 1 752,800 ¥ 1
Exercisable at end of period . . . . . . . . . . . . . . . . . . . . . . . . . . . 217,800 ¥ 1 154,200 ¥ 1
(1) Number of options is the number of SMFG’s common stock granted by the exercise of stock options.
The weighted average stock price at the date of exercise was ¥4,084 and ¥5,050 for the fiscal years endedMarch 31, 2015 and 2014, respectively.
Summarized information about stock options outstanding at March 31, 2015 and 2014 was as follows:
At March 31,
2015 2014
Exerciseprice
Number ofoptions
Remainingcontractual lives
in yearsNumber of
options
Remainingcontractual lives
in years
SMFG Stock Acquisition Rights . . . . . . . . . . . . ¥ 1 873,200 27.3 752,800 27.9
The amounts of stock options recognized as expenses were measured based on the fair value of stockoptions granted, which were ¥451 million and ¥494 million for the fiscal years ended March 31, 2015 and 2014,respectively, and included in “General and administrative expenses” in the consolidated income statement. Thefair value of stock options was measured using Black-Scholes option-pricing model.
F-79

The following table represents the fair value of stock options and the assumptions used to measure the fairvalue.
For the fiscal year ended March 31,
2015 2014
Fair value at measurement date . . . . . . . . . . . . . . . . . . . . . . . . . . . . . . . . . . . . . . . ¥ 3,661 ¥ 4,159Stock price . . . . . . . . . . . . . . . . . . . . . . . . . . . . . . . . . . . . . . . . . . . . . . . . . . . . . . . ¥ 4,115 ¥ 4,580Exercise price . . . . . . . . . . . . . . . . . . . . . . . . . . . . . . . . . . . . . . . . . . . . . . . . . . . . . ¥ 1 ¥ 1Expected volatility(1) . . . . . . . . . . . . . . . . . . . . . . . . . . . . . . . . . . . . . . . . . . . . . . . . 28.16% 31.24%Expected remaining lives (in years)(2) . . . . . . . . . . . . . . . . . . . . . . . . . . . . . . . . . . 4 4Expected dividends per share(3) . . . . . . . . . . . . . . . . . . . . . . . . . . . . . . . . . . . . . . . ¥ 120 ¥ 110Risk free interest rate(4) . . . . . . . . . . . . . . . . . . . . . . . . . . . . . . . . . . . . . . . . . . . . . . 0.11% 0.23%
(1) Calculated based on the actual stock prices during the 4 years from August 16, 2010 to August 15, 2014 and August 15, 2009 toAugust 14, 2013 for the fiscal years ended March 31, 2015 and 2014, respectively.
(2) The average expected remaining life could not be estimated rationally due to insufficient amount of data. Therefore, it was estimatedbased on average remaining service life of directors of SMFG and its subsidiaries.
(3) Expected dividends are based on the estimated dividends to be paid in next twelve months from the date of grant.(4) Japanese government bond yield corresponding to the average expected remaining life.
40 DIVIDENDS PER SHARE
The dividends recognized by the SMFG Group for the fiscal years ended March 31, 2015, 2014 and 2013were as follows:
Dividends per share Aggregate amount
(In yen) (In millions)
For the fiscal year ended March 31, 2015:Common stock . . . . . . . . . . . . . . . . . . . . . . . . . . . . . . . . . . . . . . . . . . . . ¥125 ¥170,908
For the fiscal year ended March 31, 2014:Common stock . . . . . . . . . . . . . . . . . . . . . . . . . . . . . . . . . . . . . . . . . . . . ¥125 ¥169,973
For the fiscal year ended March 31, 2013:Common stock . . . . . . . . . . . . . . . . . . . . . . . . . . . . . . . . . . . . . . . . . . . . ¥100 ¥135,253
On June 26, 2015, the general meeting of shareholders approved a dividend of ¥80 per share of commonstock totaling ¥112,805 million in respect of the fiscal year ended March 31, 2015. The amount included¥3,426 million of dividends distributed to SMFG’s subsidiary. The consolidated financial statements for thefiscal year ended March 31, 2015 do not include this dividend payable.
41 CONTINGENCY AND CAPITAL COMMITMENTS
Legal Proceedings
The SMFG Group is engaged in various legal proceedings in Japan and a number of overseas jurisdictions,involving claims by and against it, which arise in the normal course of business. The SMFG Group does notexpect that the outcome of these proceedings will have a significant adverse effect on the consolidated financialstatements of the SMFG Group. The SMFG Group has recorded adequate provisions with respect to litigationarising out of normal business operations. The SMFG Group has not disclosed any contingent liability associatedwith these legal actions because it cannot reliably be estimated.
Capital Commitments
At March 31, 2015 and 2014, the SMFG Group had ¥2,801,802 million and ¥204,293 million of contractualcommitments to acquire property, plant and equipment including aircraft for leasing business. The contractual
F-80
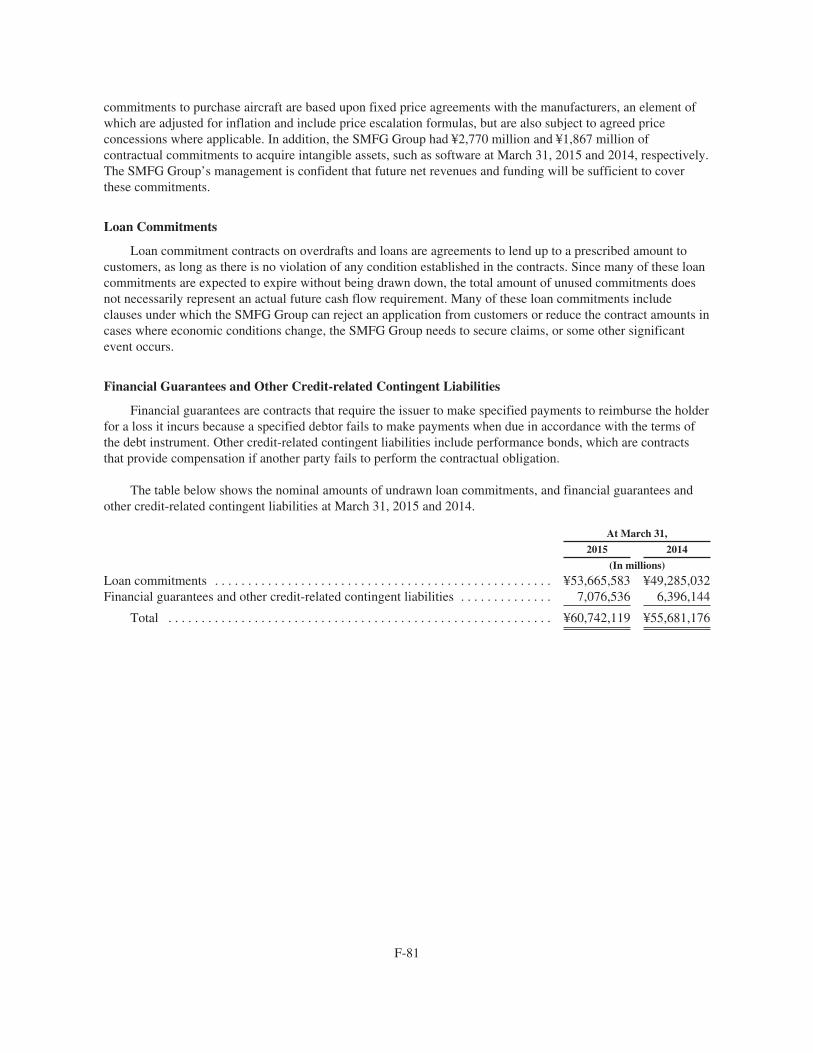
commitments to purchase aircraft are based upon fixed price agreements with the manufacturers, an element ofwhich are adjusted for inflation and include price escalation formulas, but are also subject to agreed priceconcessions where applicable. In addition, the SMFG Group had ¥2,770 million and ¥1,867 million ofcontractual commitments to acquire intangible assets, such as software at March 31, 2015 and 2014, respectively.The SMFG Group’s management is confident that future net revenues and funding will be sufficient to coverthese commitments.
Loan Commitments
Loan commitment contracts on overdrafts and loans are agreements to lend up to a prescribed amount tocustomers, as long as there is no violation of any condition established in the contracts. Since many of these loancommitments are expected to expire without being drawn down, the total amount of unused commitments doesnot necessarily represent an actual future cash flow requirement. Many of these loan commitments includeclauses under which the SMFG Group can reject an application from customers or reduce the contract amounts incases where economic conditions change, the SMFG Group needs to secure claims, or some other significantevent occurs.
Financial Guarantees and Other Credit-related Contingent Liabilities
Financial guarantees are contracts that require the issuer to make specified payments to reimburse the holderfor a loss it incurs because a specified debtor fails to make payments when due in accordance with the terms ofthe debt instrument. Other credit-related contingent liabilities include performance bonds, which are contractsthat provide compensation if another party fails to perform the contractual obligation.
The table below shows the nominal amounts of undrawn loan commitments, and financial guarantees andother credit-related contingent liabilities at March 31, 2015 and 2014.
At March 31,
2015 2014
(In millions)
Loan commitments . . . . . . . . . . . . . . . . . . . . . . . . . . . . . . . . . . . . . . . . . . . . . . . . . . . ¥53,665,583 ¥49,285,032Financial guarantees and other credit-related contingent liabilities . . . . . . . . . . . . . . 7,076,536 6,396,144
Total . . . . . . . . . . . . . . . . . . . . . . . . . . . . . . . . . . . . . . . . . . . . . . . . . . . . . . . . . . ¥60,742,119 ¥55,681,176
F-81
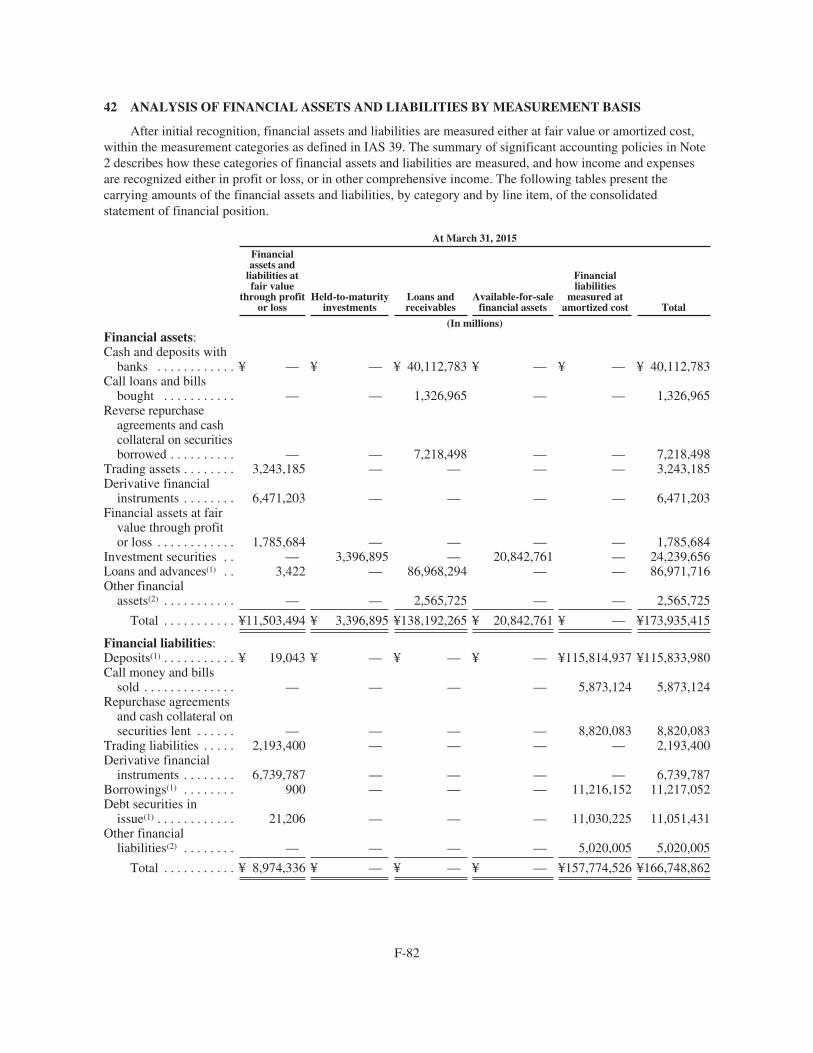
42 ANALYSIS OF FINANCIAL ASSETS AND LIABILITIES BY MEASUREMENT BASIS
After initial recognition, financial assets and liabilities are measured either at fair value or amortized cost,within the measurement categories as defined in IAS 39. The summary of significant accounting policies in Note2 describes how these categories of financial assets and liabilities are measured, and how income and expensesare recognized either in profit or loss, or in other comprehensive income. The following tables present thecarrying amounts of the financial assets and liabilities, by category and by line item, of the consolidatedstatement of financial position.
At March 31, 2015
Financialassets and
liabilities atfair value
through profitor loss
Held-to-maturityinvestments
Loans andreceivables
Available-for-salefinancial assets
Financialliabilities
measured atamortized cost Total
(In millions)Financial assets:Cash and deposits with
banks . . . . . . . . . . . . ¥ — ¥ — ¥ 40,112,783 ¥ — ¥ — ¥ 40,112,783Call loans and bills
bought . . . . . . . . . . . — — 1,326,965 — — 1,326,965Reverse repurchase
agreements and cashcollateral on securitiesborrowed . . . . . . . . . . — — 7,218,498 — — 7,218,498
Trading assets . . . . . . . . 3,243,185 — — — — 3,243,185Derivative financial
instruments . . . . . . . . 6,471,203 — — — — 6,471,203Financial assets at fair
value through profitor loss . . . . . . . . . . . . 1,785,684 — — — — 1,785,684
Investment securities . . — 3,396,895 — 20,842,761 — 24,239,656Loans and advances(1) . . 3,422 — 86,968,294 — — 86,971,716Other financial
assets(2) . . . . . . . . . . . — — 2,565,725 — — 2,565,725
Total . . . . . . . . . . . ¥11,503,494 ¥ 3,396,895 ¥138,192,265 ¥ 20,842,761 ¥ — ¥173,935,415
Financial liabilities:Deposits(1) . . . . . . . . . . . ¥ 19,043 ¥ — ¥ — ¥ — ¥115,814,937 ¥115,833,980Call money and bills
sold . . . . . . . . . . . . . . — — — — 5,873,124 5,873,124Repurchase agreements
and cash collateral onsecurities lent . . . . . . — — — — 8,820,083 8,820,083
Trading liabilities . . . . . 2,193,400 — — — — 2,193,400Derivative financial
instruments . . . . . . . . 6,739,787 — — — — 6,739,787Borrowings(1) . . . . . . . . 900 — — — 11,216,152 11,217,052Debt securities in
issue(1) . . . . . . . . . . . . 21,206 — — — 11,030,225 11,051,431Other financial
liabilities(2) . . . . . . . . — — — — 5,020,005 5,020,005
Total . . . . . . . . . . . ¥ 8,974,336 ¥ — ¥ — ¥ — ¥157,774,526 ¥166,748,862
F-82

At March 31, 2014
Financialassets and
liabilities atfair value
through profitor loss
Held-to-maturityinvestments
Loans andreceivables
Available-for-salefinancial assets
Financialliabilities
measured atamortized cost Total
(In millions)
Financial assets:Cash and deposits with
banks . . . . . . . . . . . . . . ¥ — ¥ — ¥ 33,208,724 ¥ — ¥ — ¥ 33,208,724Call loans and bills
bought . . . . . . . . . . . . . — — 1,248,235 — — 1,248,235Reverse repurchase
agreements and cashcollateral on securitiesborrowed . . . . . . . . . . . — — 4,303,121 — — 4,303,121
Trading assets . . . . . . . . . 3,557,545 — — — — 3,557,545Derivative financial
instruments . . . . . . . . . 4,891,382 — — — — 4,891,382Financial assets at fair
value through profit orloss . . . . . . . . . . . . . . . 1,840,255 — — — — 1,840,255
Investment securities . . . — 4,528,254 — 17,524,744 — 22,052,998Loans and advances(1) . . . 5,653 — 81,239,329 — — 81,244,982Other financial
assets(2) . . . . . . . . . . . . — — 1,995,524 — — 1,995,524
Total . . . . . . . . . . . . ¥10,294,835 ¥ 4,528,254 ¥121,994,933 ¥ 17,524,744 ¥ — ¥154,342,766
Financial liabilities:Deposits(1) . . . . . . . . . . . . ¥ 12,686 ¥ — ¥ — ¥ — ¥108,357,808 ¥108,370,494Call money and bills
sold . . . . . . . . . . . . . . . — — — — 4,112,429 4,112,429Repurchase agreements
and cash collateral onsecurities lent . . . . . . . — — — — 7,041,075 7,041,075
Trading liabilities . . . . . . 1,865,243 — — — — 1,865,243Derivative financial
instruments . . . . . . . . . 4,980,991 — — — — 4,980,991Borrowings(1) . . . . . . . . . 1,221 — — — 8,462,142 8,463,363Debt securities in
issue(1) . . . . . . . . . . . . . 14,303 — — — 8,754,791 8,769,094Other financial
liabilities(2) . . . . . . . . . — — — — 4,703,784 4,703,784
Total . . . . . . . . . . . . ¥ 6,874,444 ¥ — ¥ — ¥ — ¥141,432,029 ¥148,306,473
(1) Embedded derivatives, which are separately accounted for, but presented together with the host contract in the consolidated statement offinancial position, are disclosed in this table within the category of “Financial assets and liabilities at fair value through profit or loss.”Although the separated embedded derivatives may have a positive or a negative fair value, they have been presented in this table asassets or liabilities to be consistent with the line of the host contract.
(2) Other financial assets and liabilities comprise of those included in other assets and liabilities, which meet the definition of a financialasset and liability.
F-83

43 FAIR VALUE OF FINANCIAL ASSETS AND LIABILITIES
Fair value is the price that would be received to sell an asset or paid to transfer a liability in an orderlytransaction between market participants at the measurement date. The fair values stated below represent the bestestimates based on a range of methods and assumptions. In determining the fair value of financial assets andliabilities, the SMFG Group gives the highest priority to a quoted market price in an active market. If such pricesare not available, it establishes fair value using valuation techniques. The valuation techniques, if used, makemaximum use of observable inputs, and rely as little as possible on unobservable inputs.
Financial Assets and Liabilities Carried at Fair Value
Valuation Process
The SMFG Group undertakes a valuation process based on its valuation control framework, which governsinternal control standards, methodologies and procedures to ensure that the fair values are determined orvalidated independently of the front office.
The SMFG Group uses valuation techniques commonly used by market participants to price the financialinstruments and that have been demonstrated to provide reliable estimates of prices obtained in actual markettransactions. The valuation techniques include the DCF method, option pricing models and reference to thecurrent fair value of another instrument that is substantially the same. Key adjustments, such as liquidity risk andcredit risk adjustments are also taken into account to derive fair values.
Where valuation techniques are used to determine fair values, they are validated and reviewed. In principalsubsidiaries, their risk management departments, which are independent from the business units, reviewsignificant valuation methodologies at least once a year, and recalibrate model parameters and inputs bycomparing fair values derived from the valuation techniques to the external market data such as broker quotes.Where the data obtained from third party sources such as brokers and pricing service providers are utilized indetermining fair values, those departments also examine those data, taking into account the consistency amongthe different sources, the aging of the data and other factors. In addition, accounting departments in thoseprincipal subsidiaries are responsible for ensuring that the accounting policies and procedures to determine fairvalues are in compliance with relevant accounting standards.
Fair Value Hierarchy
Financial assets and liabilities measured at fair value are classified into one of three levels within a fairvalue hierarchy based on the inputs used in the fair value measurement. The three levels of the fair valuehierarchy are as follows:
• quoted prices (unadjusted) in active markets for identical assets or liabilities that the entity can accessat the measurement date (Level 1);
• inputs other than quoted prices included within Level 1 that are observable for the asset or liability,either directly or indirectly (Level 2); and
• significant unobservable inputs for the asset or liability (Level 3).
F-84

The following tables present the carrying amounts of financial assets and liabilities carried at fair valuebased on the three levels of the fair value hierarchy at March 31, 2015 and 2014.
At March 31, 2015
Level 1(2) Level 2(2) Level 3 Total
(In millions)
Financial assets:Trading assets:
Debt instruments . . . . . . . . . . . . . . . . . . . . . . . . . ¥ 1,701,872 ¥ 916,721 ¥ — ¥ 2,618,593Equity instruments . . . . . . . . . . . . . . . . . . . . . . . . 624,300 292 — 624,592
Total trading assets . . . . . . . . . . . . . . . . . . . 2,326,172 917,013 — 3,243,185
Derivative financial instruments:Interest rate derivatives . . . . . . . . . . . . . . . . . . . . 86,545 4,291,689 — 4,378,234Currency derivatives . . . . . . . . . . . . . . . . . . . . . . 181 2,014,697 — 2,014,878Equity derivatives . . . . . . . . . . . . . . . . . . . . . . . . 20,882 25,494 173 46,549Commodity derivatives . . . . . . . . . . . . . . . . . . . . 1,829 17,751 — 19,580Credit derivatives . . . . . . . . . . . . . . . . . . . . . . . . — 5,606 6,356 11,962
Total derivative financial instruments . . . . . 109,437 6,355,237 6,529 6,471,203
Financial assets at fair value through profit or loss:Debt instruments . . . . . . . . . . . . . . . . . . . . . . . . . — 1,615,741 38,518 1,654,259Equity instruments . . . . . . . . . . . . . . . . . . . . . . . . 3,455 1,056 126,914 131,425
Total financial assets at fair value throughprofit or loss . . . . . . . . . . . . . . . . . . . . . . 3,455 1,616,797 165,432 1,785,684
Available-for-sale financial assets:Japanese government bonds . . . . . . . . . . . . . . . . 9,389,959 — — 9,389,959U.S. Treasury and other U.S. government
agency bonds . . . . . . . . . . . . . . . . . . . . . . . . . . 2,062,043 — — 2,062,043Other debt instruments . . . . . . . . . . . . . . . . . . . . 1,088,733 1,865,627 7,086 2,961,446Equity instruments . . . . . . . . . . . . . . . . . . . . . . . . 4,365,355 1,149,156 914,802 6,429,313
Total available-for-sale financial assets . . . 16,906,090 3,014,783 921,888 20,842,761
Others(1) . . . . . . . . . . . . . . . . . . . . . . . . . . . . . . . . . . . . — 3,422 — 3,422
Total . . . . . . . . . . . . . . . . . . . . . . . . . . ¥ 19,345,154 ¥ 11,907,252 ¥ 1,093,849 ¥ 32,346,255
Financial liabilities:Trading liabilities:
Debt instruments . . . . . . . . . . . . . . . . . . . . . . . . . ¥ 2,124,548 ¥ 50,765 ¥ — ¥ 2,175,313Equity instruments . . . . . . . . . . . . . . . . . . . . . . . . 18,087 — — 18,087
Total trading liabilities . . . . . . . . . . . . . . . . 2,142,635 50,765 — 2,193,400
Derivative financial instruments:Interest rate derivatives . . . . . . . . . . . . . . . . . . . . 96,889 4,318,270 — 4,415,159Currency derivatives . . . . . . . . . . . . . . . . . . . . . . — 2,231,160 — 2,231,160Equity derivatives . . . . . . . . . . . . . . . . . . . . . . . . 28,684 40,190 — 68,874Commodity derivatives . . . . . . . . . . . . . . . . . . . . 2,466 16,999 — 19,465Credit derivatives . . . . . . . . . . . . . . . . . . . . . . . . — 5,129 — 5,129
Total derivative financial instruments . . . . . 128,039 6,611,748 — 6,739,787
Others(1) . . . . . . . . . . . . . . . . . . . . . . . . . . . . . . . . . . . . — 39,937 1,212 41,149
Total . . . . . . . . . . . . . . . . . . . . . . . . . . ¥ 2,270,674 ¥ 6,702,450 ¥ 1,212 ¥ 8,974,336
F-85

At March 31, 2014
Level 1(2) Level 2(2) Level 3 Total
(In millions)Financial assets:Trading assets:
Debt instruments . . . . . . . . . . . . . . . . . . . . . . . . . ¥ 2,549,647 ¥ 713,438 ¥ — ¥ 3,263,085Equity instruments . . . . . . . . . . . . . . . . . . . . . . . . 207,782 205 86,473 294,460
Total trading assets . . . . . . . . . . . . . . . . . . . 2,757,429 713,643 86,473 3,557,545
Derivative financial instruments:Interest rate derivatives . . . . . . . . . . . . . . . . . . . . 24,575 3,820,205 629 3,845,409Currency derivatives . . . . . . . . . . . . . . . . . . . . . . 32 977,586 — 977,618Equity derivatives . . . . . . . . . . . . . . . . . . . . . . . . 5,095 30,497 118 35,710Commodity derivatives . . . . . . . . . . . . . . . . . . . . 122 26,694 — 26,816Credit derivatives . . . . . . . . . . . . . . . . . . . . . . . . — 5,829 — 5,829
Total derivative financial instruments . . . . . 29,824 4,860,811 747 4,891,382
Financial assets at fair value through profit or loss:Debt instruments . . . . . . . . . . . . . . . . . . . . . . . . . — 1,648,261 49,611 1,697,872Equity instruments . . . . . . . . . . . . . . . . . . . . . . . . 2,029 283 140,071 142,383
Total financial assets at fair value throughprofit or loss . . . . . . . . . . . . . . . . . . . . . . 2,029 1,648,544 189,682 1,840,255
Available-for-sale financial assets:Japanese government bonds . . . . . . . . . . . . . . . . 8,261,809 — — 8,261,809U.S. Treasury and other U.S. government
agency bonds . . . . . . . . . . . . . . . . . . . . . . . . . . 1,871,757 — — 1,871,757Other debt instruments . . . . . . . . . . . . . . . . . . . . 634,925 1,696,360 9,445 2,340,730Equity instruments . . . . . . . . . . . . . . . . . . . . . . . . 3,500,457 831,367 718,624 5,050,448
Total available-for-sale financial assets . . . 14,268,948 2,527,727 728,069 17,524,744
Others(1) . . . . . . . . . . . . . . . . . . . . . . . . . . . . . . . . . . . . — 5,653 — 5,653
Total . . . . . . . . . . . . . . . . . . . . . . . . . . ¥ 17,058,230 ¥ 9,756,378 ¥ 1,004,971 ¥ 27,819,579
Financial liabilities:Trading liabilities:
Debt instruments . . . . . . . . . . . . . . . . . . . . . . . . . ¥ 1,826,969 ¥ 32,177 ¥ — ¥ 1,859,146Equity instruments . . . . . . . . . . . . . . . . . . . . . . . . 6,097 — — 6,097
Total trading liabilities . . . . . . . . . . . . . . . . 1,833,066 32,177 — 1,865,243
Derivative financial instruments:Interest rate derivatives . . . . . . . . . . . . . . . . . . . . 21,191 3,840,355 — 3,861,546Currency derivatives . . . . . . . . . . . . . . . . . . . . . . — 1,058,051 — 1,058,051Equity derivatives . . . . . . . . . . . . . . . . . . . . . . . . 8,619 27,610 — 36,229Commodity derivatives . . . . . . . . . . . . . . . . . . . . 121 17,689 — 17,810Credit derivatives . . . . . . . . . . . . . . . . . . . . . . . . — 4,949 2,406 7,355
Total derivative financial instruments . . . . . 29,931 4,948,654 2,406 4,980,991
Others(1) . . . . . . . . . . . . . . . . . . . . . . . . . . . . . . . . . . . . — 28,210 — 28,210
Total . . . . . . . . . . . . . . . . . . . . . . . . . . ¥ 1,862,997 ¥ 5,009,041 ¥ 2,406 ¥ 6,874,444
(1) Embedded derivatives, which are separately accounted for, but presented together with the host contract in the consolidated statement offinancial position, are disclosed in this table within Others. Although the separated embedded derivatives may have a positive or anegative fair value, they have been presented in this table as assets or liabilities to be consistent with the host contract. The separatedembedded derivatives are measured at fair value using the valuation techniques described in “Derivative financial instruments” below.
(2) Transfers between levels of the fair value hierarchy are deemed to have occurred at the beginning of the period. There were nosignificant transfers between Level 1 and Level 2 for the fiscal years ended March 31, 2015 and 2014.
F-86
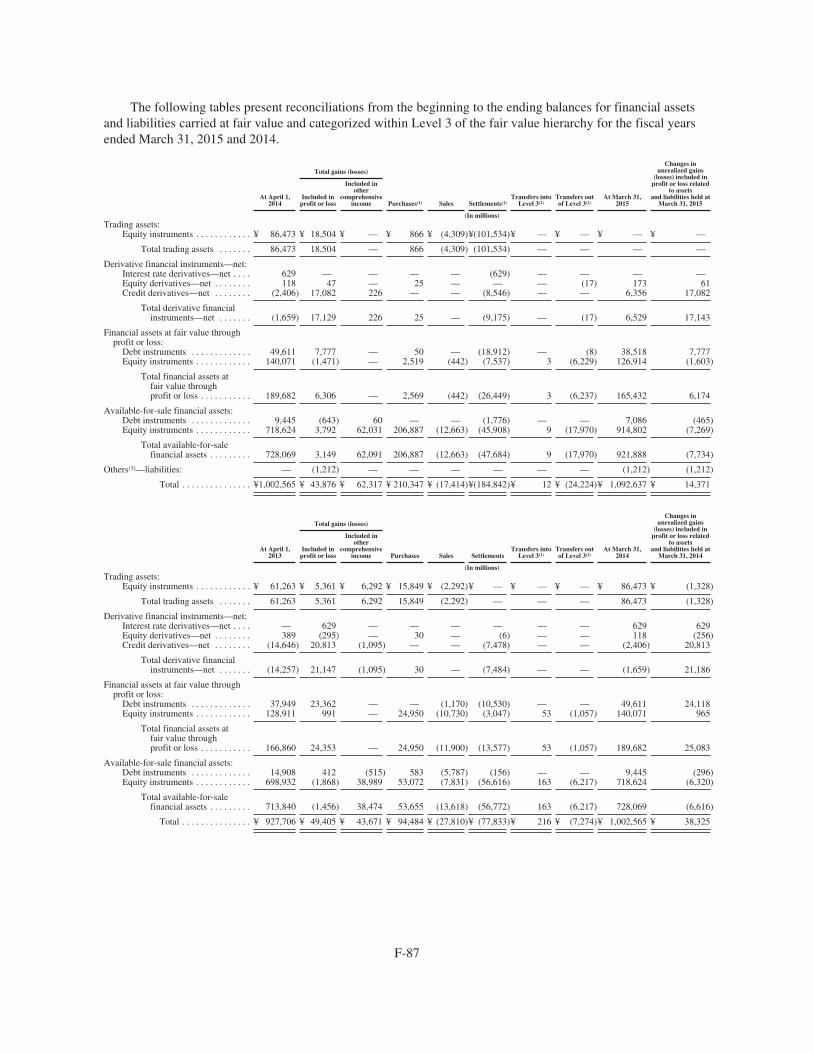
The following tables present reconciliations from the beginning to the ending balances for financial assetsand liabilities carried at fair value and categorized within Level 3 of the fair value hierarchy for the fiscal yearsended March 31, 2015 and 2014.
At April 1,2014
Total gains (losses)
Purchases(1) Sales Settlements(1)Transfers into
Level 3(2)Transfers outof Level 3(2)
At March 31,2015
Changes inunrealized gains
(losses) included inprofit or loss related
to assetsand liabilities held at
March 31, 2015Included in
profit or loss
Included inother
comprehensiveincome
(In millions)
Trading assets:Equity instruments . . . . . . . . . . . . ¥ 86,473 ¥ 18,504 ¥ — ¥ 866 ¥ (4,309)¥(101,534)¥ — ¥ — ¥ — ¥ —
Total trading assets . . . . . . . 86,473 18,504 — 866 (4,309) (101,534) — — — —
Derivative financial instruments—net:Interest rate derivatives—net . . . . 629 — — — — (629) — — — —Equity derivatives—net . . . . . . . . 118 47 — 25 — — — (17) 173 61Credit derivatives—net . . . . . . . . (2,406) 17,082 226 — — (8,546) — — 6,356 17,082
Total derivative financialinstruments—net . . . . . . . (1,659) 17,129 226 25 — (9,175) — (17) 6,529 17,143
Financial assets at fair value throughprofit or loss:
Debt instruments . . . . . . . . . . . . . 49,611 7,777 — 50 — (18,912) — (8) 38,518 7,777Equity instruments . . . . . . . . . . . . 140,071 (1,471) — 2,519 (442) (7,537) 3 (6,229) 126,914 (1,603)
Total financial assets atfair value throughprofit or loss . . . . . . . . . . . 189,682 6,306 — 2,569 (442) (26,449) 3 (6,237) 165,432 6,174
Available-for-sale financial assets:Debt instruments . . . . . . . . . . . . . 9,445 (643) 60 — — (1,776) — — 7,086 (465)Equity instruments . . . . . . . . . . . . 718,624 3,792 62,031 206,887 (12,663) (45,908) 9 (17,970) 914,802 (7,269)
Total available-for-salefinancial assets . . . . . . . . . 728,069 3,149 62,091 206,887 (12,663) (47,684) 9 (17,970) 921,888 (7,734)
Others(3)—liabilities: — (1,212) — — — — — — (1,212) (1,212)
Total . . . . . . . . . . . . . . . ¥1,002,565 ¥ 43,876 ¥ 62,317 ¥ 210,347 ¥ (17,414)¥(184,842)¥ 12 ¥ (24,224)¥ 1,092,637 ¥ 14,371
At April 1,2013
Total gains (losses)
Purchases Sales SettlementsTransfers into
Level 3(2)Transfers outof Level 3(2)
At March 31,2014
Changes inunrealized gains
(losses) included inprofit or loss related
to assetsand liabilities held at
March 31, 2014Included in
profit or loss
Included inother
comprehensiveincome
(In millions)
Trading assets:Equity instruments . . . . . . . . . . . . ¥ 61,263 ¥ 5,361 ¥ 6,292 ¥ 15,849 ¥ (2,292)¥ — ¥ — ¥ — ¥ 86,473 ¥ (1,328)
Total trading assets . . . . . . . 61,263 5,361 6,292 15,849 (2,292) — — — 86,473 (1,328)
Derivative financial instruments—net:Interest rate derivatives—net . . . . — 629 — — — — — — 629 629Equity derivatives—net . . . . . . . . 389 (295) — 30 — (6) — — 118 (256)Credit derivatives—net . . . . . . . . (14,646) 20,813 (1,095) — — (7,478) — — (2,406) 20,813
Total derivative financialinstruments—net . . . . . . . (14,257) 21,147 (1,095) 30 — (7,484) — — (1,659) 21,186
Financial assets at fair value throughprofit or loss:
Debt instruments . . . . . . . . . . . . . 37,949 23,362 — — (1,170) (10,530) — — 49,611 24,118Equity instruments . . . . . . . . . . . . 128,911 991 — 24,950 (10,730) (3,047) 53 (1,057) 140,071 965
Total financial assets atfair value throughprofit or loss . . . . . . . . . . . 166,860 24,353 — 24,950 (11,900) (13,577) 53 (1,057) 189,682 25,083
Available-for-sale financial assets:Debt instruments . . . . . . . . . . . . . 14,908 412 (515) 583 (5,787) (156) — — 9,445 (296)Equity instruments . . . . . . . . . . . . 698,932 (1,868) 38,989 53,072 (7,831) (56,616) 163 (6,217) 718,624 (6,320)
Total available-for-salefinancial assets . . . . . . . . . 713,840 (1,456) 38,474 53,655 (13,618) (56,772) 163 (6,217) 728,069 (6,616)
Total . . . . . . . . . . . . . . . ¥ 927,706 ¥ 49,405 ¥ 43,671 ¥ 94,484 ¥ (27,810)¥ (77,833)¥ 216 ¥ (7,274)¥ 1,002,565 ¥ 38,325
F-87

(1) Financial instruments held by certain consolidated investment funds had been classified as trading assets and categorized within Level 3until March 31, 2015. These funds were deconsolidated at March 31, 2015 and investments in the funds are classified as available-for-sale equity instruments categorized within Level 3. The effects of these events are included in settlements of trading assets and purchasesof available-for-sale equity instruments.
(2) Transfers between levels of the fair value hierarchy are deemed to have occurred at the beginning of the period. For the fiscal year endedMarch 31, 2015, transfers out of Level 3 amounted to ¥24,224 million, primarily due to an increase in observability of certain privateequity investments.
(3) Embedded derivatives, which are separately accounted for, but presented together with the host contract in the consolidated statement offinancial position, are disclosed in this table within Others. Although the separated embedded derivatives may have a positive or anegative fair value, they have been presented in this table as assets or liabilities to be consistent with the host contract.
The following table presents total gains or losses included in profit or loss for the Level 3 financial assetsand liabilities, and changes in unrealized gains or losses included in profit or loss related to those financial assetsand liabilities held at March 31, 2015 and 2014 by line item of the consolidated income statement.
Total gains (losses)included in profit or
loss for the fiscal yearended March 31,
Changes inunrealized gains
(losses) included inprofit or loss related
to assets andliabilities held at
March 31,
2015 2014 2015 2014
(In millions)
Net interest income . . . . . . . . . . . . . . . . . . . . . . . . . . . . . . . . . . . . . . . . . ¥ 78 ¥ — ¥ — ¥ —Net trading income . . . . . . . . . . . . . . . . . . . . . . . . . . . . . . . . . . . . . . . . . 33,878 26,212 15,466 19,562Net income from financial assets at fair value through profit or loss . . . 6,306 24,353 6,174 25,083Net investment income . . . . . . . . . . . . . . . . . . . . . . . . . . . . . . . . . . . . . . 11,201 5,375 — —Impairment charges on financial assets . . . . . . . . . . . . . . . . . . . . . . . . . . (7,587) (6,535) (7,269) (6,320)
Total . . . . . . . . . . . . . . . . . . . . . . . . . . . . . . . . . . . . . . . . . . . . . . . . ¥43,876 ¥49,405 ¥14,371 ¥38,325
Valuation Techniques
Financial instruments which are classified as trading assets and liabilities, derivative financial instruments,financial assets at fair value through profit or loss, and available-for-sale financial assets are measured at fairvalue in the consolidated statement of financial position. These instruments are measured at fair value using aquoted market price, if they are traded in an active market, or, for others, using the fair value measurementtechniques as discussed below.
Trading assets and trading liabilities
Debt and equity instruments traded in an active market are measured at fair value using a quoted marketprice in such a market and they are categorized within Level 1. If a quoted market price is not available, they aremeasured by using a price quoted by a third party, such as a pricing service or broker, or by reference to thecurrent fair value of another instrument that is substantially the same, based on inputs such as prices obtainedfrom brokers, observable interest rates and spreads. These financial instruments are categorized within Level 2.
Commercial paper is measured at fair value using the DCF method, where primary inputs are observableinterest rates and credit spreads, inferred from the prevailing market rates. Therefore, commercial paper iscategorized within Level 2.
Until March 31, 2015, financial instruments held by certain consolidated investment funds classified astrading assets had been measured at fair value determined based on net asset value per share, which includedsignificant unobservable inputs, and categorized within Level 3. These funds were deconsolidated at March 31,2015 and investments in the funds are classified as available-for-sale equity instruments categorized withinLevel 3.
F-88

Derivative financial instruments (including embedded derivatives)
Listed derivatives (including interest rates, bonds, currencies, stocks and commodities) are measured at fairvalue using the settlement price announced by the major exchange on which transactions are traded because thesettlement price in the exchange reflects the most current transaction price, and is readily and regularly availablefrom the exchange. Listed derivatives are categorized within Level 1.
OTC derivatives (non-exchange-traded derivatives), including embedded derivatives that are separatelyaccounted for from the host contracts, are measured at fair value using valuation techniques such as the presentvalue of estimated future cash flows and option pricing models, generally based on observable interest rates,foreign exchange, commodities, stock prices and other factors as inputs. The valuation models for sometransactions, such as yield curve spread options and equity options, use inputs which are not directly observablein the market, including historical correlation coefficients and historical volatilities. However, as the impact ofthese unobservable inputs is insignificant to the fair value for most of the transactions, the SMFG Groupcategorizes the majority of those transactions within Level 2.
The credit loss protection scheme which the SMFG Group offers to Goldman Sachs (“GS”) is considered tobe a credit derivative, where the underlying reference entities are the American and European corporate entitiescovered in the commitment line portfolio of the GS group. The fair value of this derivative is determined usingan ordinary collateralized debt obligation (“CDO”) pricing model, commonly used in the financial markets. TheSMFG Group takes some portions of the positions in subordinated and mezzanine tranches, which covers the firstand second credit losses from the portfolio. The major inputs for this derivative are credit default swap (“CDS”)spread rates, correlation ratios of CDS indices for similar portfolios, and the expected additional commitmentwithdrawal ratio. Although CDS spread rates and correlation ratios are observable in an active market oravailable from brokers, this whole scheme is categorized within Level 3 as the expected additional withdrawalratio, which is considered to be a significant input, is not observable in the market.
In addition, the fair value of OTC derivatives incorporates both counterparty credit risk in relation to OTCderivative assets and own credit risk in relation to OTC derivative liabilities. The SMFG Group calculates thecredit risk adjustments by applying the probability of default that reflects the counterparty’s or its own credit riskto the OTC derivative exposures and multiplying the result by the loss expected in the event of default. For theprobability of default, the SMFG Group uses observable market data, where possible. The OTC derivativeexposures used are determined taking into consideration the effect of master netting agreements and collateral.As the SMFG Group manages the OTC derivatives on the basis of its net credit risk exposure, the credit riskadjustments of those OTC derivatives are measured on a portfolio basis in accordance with the exception setforth in IFRS 13.
Financial assets at fair value through profit or loss
The majority of instruments in this category are debt instruments measured at fair value, using a valuationtechnique based on the observable prices in the market and they are categorized within Level 2.
Some equity and debt instruments in this category are hybrid instruments which have both equity and debtfeatures. These include preferred stocks which are measured at fair value using various valuation models, such asthe Monte Carlo Simulation, if they are indexed to the market prices in a stock exchange. These valuation modelsuse the historical volatility of the listed stocks as an input, which are not observable in the market, resulting inthese instruments being categorized within Level 3. Other types of preferred stocks and other non-hybrid equityinstruments are evaluated using valuation techniques for unlisted stocks, which are normally used for privateequity investments. The SMFG Group calculates the fair values of these instruments based on the incomeapproach, market approach using market multiples or others, which are not usually observable in the market.These instruments are categorized within Level 3.
F-89

Available-for-sale financial assets
(a) Debt instruments
Debt instruments are measured at fair value using a quoted market price and categorized within Level 1 ifthey are traded in an active market. Debt instruments are categorized within Level 2 if they are measured at fairvalue using a price quoted by a third party, such as a pricing service or broker, or by reference to the current fairvalue of another bond that is substantially the same based on inputs such as prices obtained from brokers,observable interest rates and spreads. Some debt instruments are measured at fair value using the DCF method inwhich significant unobservable inputs are used, and categorized within Level 3.
(b) Equity instruments
Listed stocks are measured at fair value based on the market price at a stock exchange and categorizedwithin Level 1.
Unlisted common and preferred stocks in this category are measured at fair value using valuationtechniques, similar to those described in “Financial assets at fair value through profit or loss” above.
Publicly offered investment trusts and funds are measured at fair value using a unit price or the market priceon which such instruments are listed, and they are categorized within Level 1. Instruments whose prices are notavailable in the market, such as privately offered investment trusts, are measured at fair value based on the unitprice, which is usually regarded as an exit price, obtained from the fund administrator or investment managementfirm. In such a case, these investment trusts and funds are categorized within Level 2. Other investment funds,such as private equity and real estate investment funds, are generally measured at fair value based on net assetvalue, which includes significant unobservable inputs. These funds are categorized within Level 3.
F-90
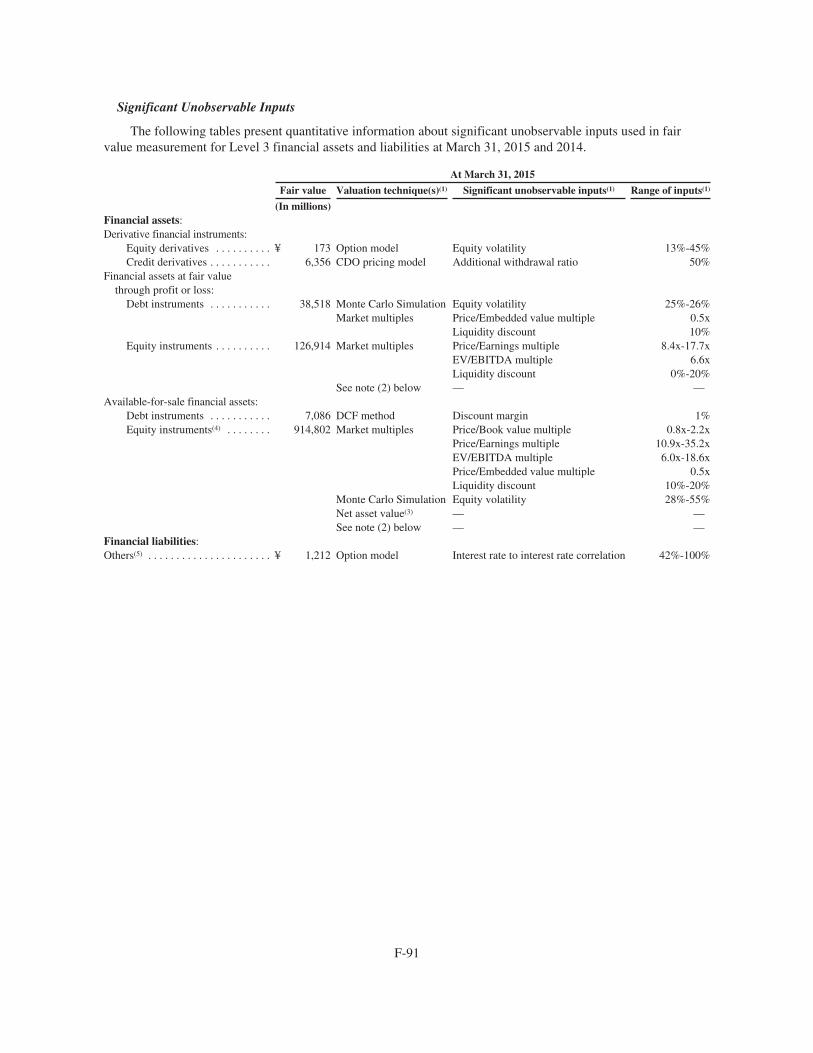
Significant Unobservable Inputs
The following tables present quantitative information about significant unobservable inputs used in fairvalue measurement for Level 3 financial assets and liabilities at March 31, 2015 and 2014.
At March 31, 2015
Fair value Valuation technique(s)(1) Significant unobservable inputs(1) Range of inputs(1)
(In millions)Financial assets:Derivative financial instruments:
Equity derivatives . . . . . . . . . . ¥ 173 Option model Equity volatility 13%-45%Credit derivatives . . . . . . . . . . . 6,356 CDO pricing model Additional withdrawal ratio 50%
Financial assets at fair valuethrough profit or loss:
Debt instruments . . . . . . . . . . . 38,518 Monte Carlo Simulation Equity volatility 25%-26%Market multiples Price/Embedded value multiple 0.5x
Liquidity discount 10%Equity instruments . . . . . . . . . . 126,914 Market multiples Price/Earnings multiple 8.4x-17.7x
EV/EBITDA multiple 6.6xLiquidity discount 0%-20%
See note (2) below — —Available-for-sale financial assets:
Debt instruments . . . . . . . . . . . 7,086 DCF method Discount margin 1%Equity instruments(4) . . . . . . . . 914,802 Market multiples Price/Book value multiple 0.8x-2.2x
Price/Earnings multiple 10.9x-35.2xEV/EBITDA multiple 6.0x-18.6xPrice/Embedded value multiple 0.5xLiquidity discount 10%-20%
Monte Carlo Simulation Equity volatility 28%-55%Net asset value(3) — —See note (2) below — —
Financial liabilities:Others(5) . . . . . . . . . . . . . . . . . . . . . . ¥ 1,212 Option model Interest rate to interest rate correlation 42%-100%
F-91
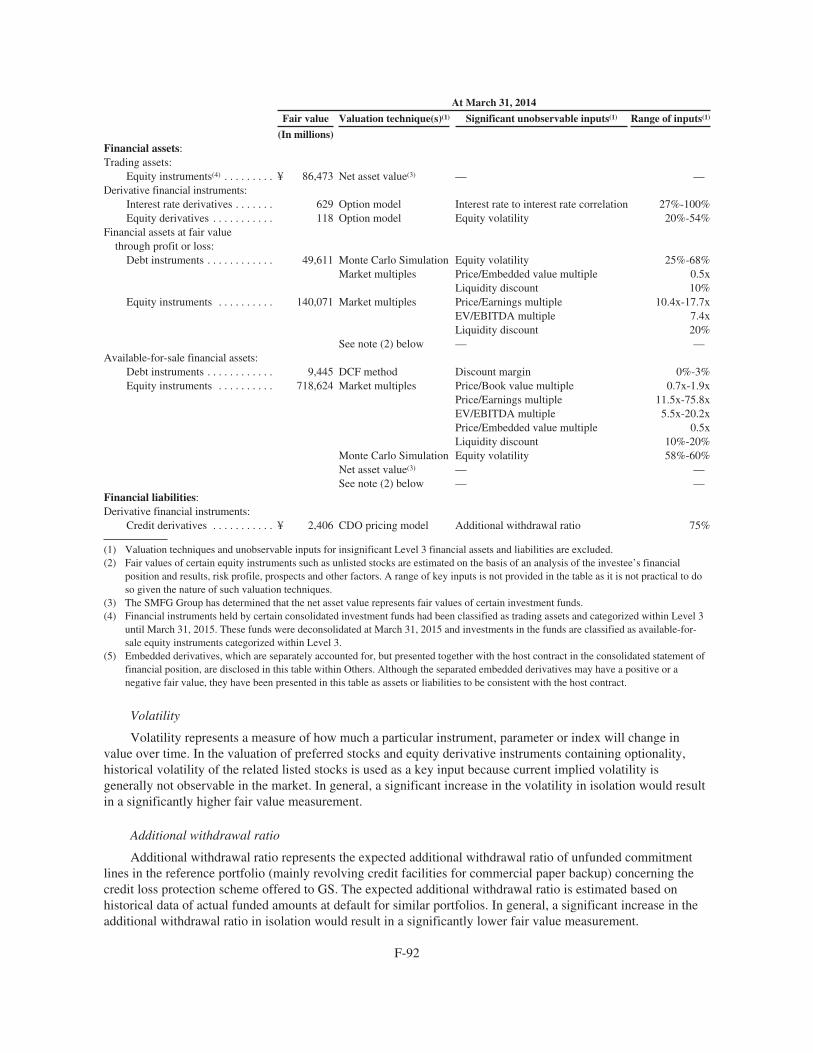
At March 31, 2014
Fair value Valuation technique(s)(1) Significant unobservable inputs(1) Range of inputs(1)
(In millions)Financial assets:Trading assets:
Equity instruments(4) . . . . . . . . . ¥ 86,473 Net asset value(3) — —Derivative financial instruments:
Interest rate derivatives . . . . . . . 629 Option model Interest rate to interest rate correlation 27%-100%Equity derivatives . . . . . . . . . . . 118 Option model Equity volatility 20%-54%
Financial assets at fair valuethrough profit or loss:
Debt instruments . . . . . . . . . . . . 49,611 Monte Carlo Simulation Equity volatility 25%-68%Market multiples Price/Embedded value multiple 0.5x
Liquidity discount 10%Equity instruments . . . . . . . . . . 140,071 Market multiples Price/Earnings multiple 10.4x-17.7x
EV/EBITDA multiple 7.4xLiquidity discount 20%
See note (2) below — —Available-for-sale financial assets:
Debt instruments . . . . . . . . . . . . 9,445 DCF method Discount margin 0%-3%Equity instruments . . . . . . . . . . 718,624 Market multiples Price/Book value multiple 0.7x-1.9x
Price/Earnings multiple 11.5x-75.8xEV/EBITDA multiple 5.5x-20.2xPrice/Embedded value multiple 0.5xLiquidity discount 10%-20%
Monte Carlo Simulation Equity volatility 58%-60%Net asset value(3) — —See note (2) below — —
Financial liabilities:Derivative financial instruments:
Credit derivatives . . . . . . . . . . . ¥ 2,406 CDO pricing model Additional withdrawal ratio 75%
(1) Valuation techniques and unobservable inputs for insignificant Level 3 financial assets and liabilities are excluded.(2) Fair values of certain equity instruments such as unlisted stocks are estimated on the basis of an analysis of the investee’s financial
position and results, risk profile, prospects and other factors. A range of key inputs is not provided in the table as it is not practical to doso given the nature of such valuation techniques.
(3) The SMFG Group has determined that the net asset value represents fair values of certain investment funds.(4) Financial instruments held by certain consolidated investment funds had been classified as trading assets and categorized within Level 3
until March 31, 2015. These funds were deconsolidated at March 31, 2015 and investments in the funds are classified as available-for-sale equity instruments categorized within Level 3.
(5) Embedded derivatives, which are separately accounted for, but presented together with the host contract in the consolidated statement offinancial position, are disclosed in this table within Others. Although the separated embedded derivatives may have a positive or anegative fair value, they have been presented in this table as assets or liabilities to be consistent with the host contract.
Volatility
Volatility represents a measure of how much a particular instrument, parameter or index will change invalue over time. In the valuation of preferred stocks and equity derivative instruments containing optionality,historical volatility of the related listed stocks is used as a key input because current implied volatility isgenerally not observable in the market. In general, a significant increase in the volatility in isolation would resultin a significantly higher fair value measurement.
Additional withdrawal ratio
Additional withdrawal ratio represents the expected additional withdrawal ratio of unfunded commitmentlines in the reference portfolio (mainly revolving credit facilities for commercial paper backup) concerning thecredit loss protection scheme offered to GS. The expected additional withdrawal ratio is estimated based onhistorical data of actual funded amounts at default for similar portfolios. In general, a significant increase in theadditional withdrawal ratio in isolation would result in a significantly lower fair value measurement.
F-92
Price/Earnings, price/book value and price/embedded value multiples
Price/Earnings (“P/E”) multiple represents the ratio of the equity value to the net income, while price/bookvalue (“P/B”) multiple represents the ratio of the equity value to the book value. Embedded value, which takesinto account the future cash flows in addition to the net asset value, is applied instead of the book value for acertain unlisted company. These multiples are estimated based on comparable listed companies. In general, asignificant increase in the P/E multiple, P/B multiple or price/embedded value multiple in isolation would resultin a significantly higher fair value measurement.
EV/EBITDA multiple
EV/EBITDA multiple represents the ratio of the enterprise value (“EV”) to earnings before interest, taxes,depreciation and amortization (“EBITDA”), where the EV is the aggregate value of equity and debt minus cashand cash equivalents. The multiple is estimated based on comparable listed companies. In general, a significantincrease in the EV/EBITDA multiple in isolation would result in a significantly higher fair value measurement.
Liquidity discount
A liquidity discount is primarily applied in the valuation techniques for unlisted stocks to reflect the fact thatthese stocks are not actively traded. In general, a significant increase in the liquidity discount in isolation wouldresult in a significantly lower fair value measurement.
Discount margin
Discount margin represents a spread used in estimating future cash flows in a DCF method to reflect theuncertainty of the cash flows that market participants would consider. In general, a significant increase in thediscount margin in isolation would result in a significantly lower fair value measurement.
Correlation
Correlation represents a measure of the relationship between the movements of two variables, which isexpressed as a number between plus and minus one. A positive correlation indicates that two variables move inthe same direction while a negative correlation indicates that they move in opposite directions. Interest ratecorrelation used in the valuation techniques of complex interest rate derivatives, which refers to the correlationbetween two interest rates of different tenors, is estimated based on historical data. In general, a significantincrease in the correlation in isolation would result in either a significantly higher or lower fair valuemeasurement, depending on the terms of the instruments.
F-93

Sensitivity Analysis
The fair value of certain financial assets and liabilities are measured using valuation techniques based oninputs such as prices and rates that are not observable in the market. The following tables present the impact ofthe valuation sensitivity, if these inputs fluctuate to the extent deemed reasonable and the volatility of such inputshas a significant impact on the fair value.
At March 31, 2015
Total fair valuemeasured using
valuationtechniques
Effect recordedin profit or loss
Effect recordeddirectly in equity
Favorablechanges
Unfavorablechanges
Favorablechanges
Unfavorablechanges
(In millions)
Financial assets:Derivative financial instruments:
Equity derivatives . . . . . . . . . . . . . . . . . . . . . . . ¥ 173 ¥ 147 ¥ 42 ¥ — ¥ —Credit derivatives . . . . . . . . . . . . . . . . . . . . . . . . 6,356 2,971 14,594 — —
Financial assets at fair value through profit or loss:Debt instruments . . . . . . . . . . . . . . . . . . . . . . . . 38,518 2,877 2,877 — —Equity instruments . . . . . . . . . . . . . . . . . . . . . . . 126,914 171 171 — —
Available-for-sale financial assets:Debt instruments . . . . . . . . . . . . . . . . . . . . . . . . 7,086 — — 148 122Equity instruments(1) . . . . . . . . . . . . . . . . . . . . . 914,802 — — 30,461 30,143
Financial liabilities:Others(2) . . . . . . . . . . . . . . . . . . . . . . . . . . . . . . . . . . . ¥ 1,212 ¥ 370 ¥ 1,651 ¥ — ¥ —
At March 31, 2014
Total fair valuemeasured using
valuationtechniques
Effect recordedin profit or loss
Effect recordeddirectly in equity
Favorablechanges
Unfavorablechanges
Favorablechanges
Unfavorablechanges
(In millions)
Financial assets:Trading assets:
Equity instruments(1) . . . . . . . . . . . . . . . . . . . . . ¥ 86,473 ¥ 895 ¥ 895 ¥ — ¥ —Derivative financial instruments:
Interest rate derivatives . . . . . . . . . . . . . . . . . . . 629 230 989 — —Equity derivatives . . . . . . . . . . . . . . . . . . . . . . . 118 208 82 — —
Financial assets at fair value through profit or loss:Debt instruments . . . . . . . . . . . . . . . . . . . . . . . . 49,611 2,784 2,179 — —Equity instruments . . . . . . . . . . . . . . . . . . . . . . . 140,071 593 589 — —
Available-for-sale financial assets:Debt instruments . . . . . . . . . . . . . . . . . . . . . . . . 9,445 — — 251 385Equity instruments . . . . . . . . . . . . . . . . . . . . . . . 718,624 — — 24,026 22,801
Financial liabilities:Derivative financial instruments:
Credit derivatives . . . . . . . . . . . . . . . . . . . . . . . . ¥ 2,406 ¥6,874 ¥ 5,754 ¥ — ¥ —
(1) Financial instruments held by certain consolidated investment funds had been classified as trading assets and categorized within Level 3until March 31, 2015. These funds were deconsolidated at March 31, 2015 and investments in the funds are classified as available-for-sale equity instruments categorized within Level 3.
(2) Embedded derivatives, which are separately accounted for, but presented together with the host contract in the consolidated statement offinancial position, are disclosed in this table within Others. Although the separated embedded derivatives may have a positive or anegative fair value, they have been presented in this table as assets or liabilities to be consistent with the host contract.
F-94

Trading assets
Financial instruments held by certain consolidated investment funds and classified as trading assets hadbeen measured at fair value determined based on net asset value per share, which included significantunobservable inputs. Since those financial instruments were managed by value at risk (“VaR”) based onhistorical gain or loss data, the impact of the valuation sensitivity was estimated using a one-day VaR of theportfolio.
Derivative financial instruments (including embedded derivatives)
With respect to the credit loss protection scheme offered to GS, the anticipated losses will vary significantlydepending on the expected additional withdrawal ratio of unfunded commitment lines in the reference portfolio.The tables above present the estimates of the impact of changing the expected additional withdrawal ratio froman optimistic (favorable) scenario to a pessimistic (unfavorable) scenario. For the other derivative instruments,including embedded derivatives that are separately accounted for from host contracts, that use interest ratecorrelation or historical volatilities in the valuation techniques, the impact resulting from using a reasonablerange of those inputs is estimated where it is expected to be significant.
Financial assets at fair value through profit or loss / Available-for-sale financial assets
With respect to preferred stocks convertible into listed stocks, for which historical volatilities of relatedlisted stocks are used in the valuation techniques, the impact resulting from using a reasonable range for thevolatility is statistically estimated where it is expected to be significant. With respect to unlisted stocks which aremeasured at fair value based on a market approach, the impact of changing the market multiples within areasonable range (±10%) is estimated. Certain investment funds classified as available-for-sale equityinstruments are measured at fair value determined based on net asset value per share, which includes significantunobservable inputs. Since those funds are managed by VaR based on historical gain or loss data, the impact ofthe valuation sensitivity is estimated using a one-day VaR of the portfolio.
F-95

Financial Assets and Liabilities Not Carried at Fair Value
The tables below present the carrying amounts and fair values by level within the fair value hierarchy, asdescribed in “Financial Assets and Liabilities Carried at Fair Value—Fair Value Hierarchy,” of financial assetsand liabilities not carried at fair value on the SMFG Group’s consolidated statement of financial position atMarch 31, 2015 and 2014.
At March 31, 2015
Carryingamount
Fair value
Notes Total Level 1 Level 2 Level 3
(In millions)
Financial assets:Cash and deposits with banks . . . a ¥ 40,112,783 ¥ 40,112,558 ¥ 39,108,757 ¥ 1,003,801 ¥ —Call loans and bills bought:
Call loans . . . . . . . . . . . . . . . a 1,301,680 1,301,817 — 1,301,817 —Bills bought . . . . . . . . . . . . . a 25,285 25,263 — 25,263 —
Reverse repurchase agreementsand cash collateral onsecurities borrowed . . . . . . . . . a 7,218,498 7,220,169 — 7,220,169 —
Investment securities:Held-to-maturity
investments . . . . . . . . . . . b 3,396,895 3,417,732 3,417,732 — —Loans and advances . . . . . . . . . . . a 86,971,716 89,506,551 — 328,670 89,177,881Other financial assets . . . . . . . . . a 2,565,725 2,561,487 — 2,391,088 170,399
Financial liabilities:Deposits:
Non-interest-bearingdeposits, demand depositsand deposits at notice . . . c ¥ 67,082,287 ¥ 67,085,473 ¥ — ¥67,085,473 ¥ —
Other deposits . . . . . . . . . . . c 48,751,693 48,757,109 — 48,757,109 —Call money and bills sold:
Call money . . . . . . . . . . . . . c 5,873,124 5,873,118 — 5,873,118 —Bills sold . . . . . . . . . . . . . . . — — — — —
Repurchase agreements and cashcollateral on securities lent . . . c 8,820,083 8,820,083 — 8,820,083 —
Borrowings . . . . . . . . . . . . . . . . . c 11,217,052 11,350,636 — 11,345,162 5,474Debt securities in issue . . . . . . . . c 11,051,431 11,272,771 — 11,114,139 158,632Other financial liabilities . . . . . . . c 5,020,005 5,018,766 — 4,869,157 149,609
F-96
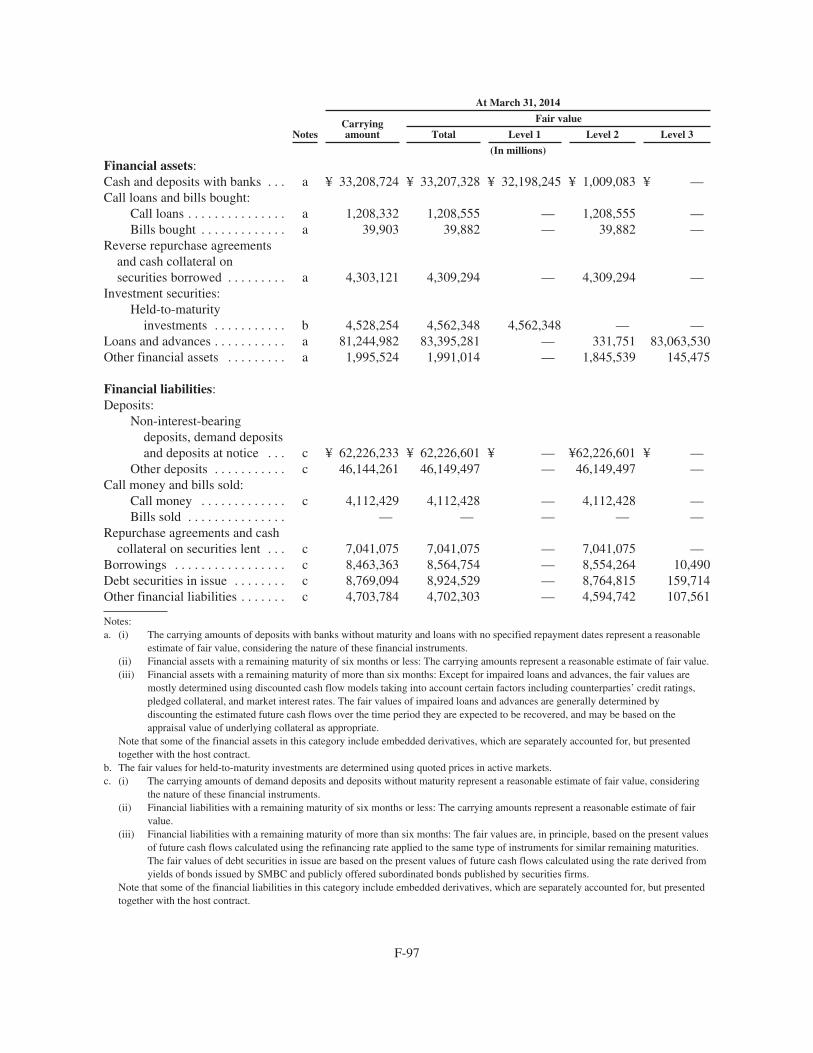
At March 31, 2014
Carryingamount
Fair value
Notes Total Level 1 Level 2 Level 3
(In millions)
Financial assets:Cash and deposits with banks . . . a ¥ 33,208,724 ¥ 33,207,328 ¥ 32,198,245 ¥ 1,009,083 ¥ —Call loans and bills bought:
Call loans . . . . . . . . . . . . . . . a 1,208,332 1,208,555 — 1,208,555 —Bills bought . . . . . . . . . . . . . a 39,903 39,882 — 39,882 —
Reverse repurchase agreementsand cash collateral onsecurities borrowed . . . . . . . . . a 4,303,121 4,309,294 — 4,309,294 —
Investment securities:Held-to-maturity
investments . . . . . . . . . . . b 4,528,254 4,562,348 4,562,348 — —Loans and advances . . . . . . . . . . . a 81,244,982 83,395,281 — 331,751 83,063,530Other financial assets . . . . . . . . . a 1,995,524 1,991,014 — 1,845,539 145,475
Financial liabilities:Deposits:
Non-interest-bearingdeposits, demand depositsand deposits at notice . . . c ¥ 62,226,233 ¥ 62,226,601 ¥ — ¥62,226,601 ¥ —
Other deposits . . . . . . . . . . . c 46,144,261 46,149,497 — 46,149,497 —Call money and bills sold:
Call money . . . . . . . . . . . . . c 4,112,429 4,112,428 — 4,112,428 —Bills sold . . . . . . . . . . . . . . . — — — — —
Repurchase agreements and cashcollateral on securities lent . . . c 7,041,075 7,041,075 — 7,041,075 —
Borrowings . . . . . . . . . . . . . . . . . c 8,463,363 8,564,754 — 8,554,264 10,490Debt securities in issue . . . . . . . . c 8,769,094 8,924,529 — 8,764,815 159,714Other financial liabilities . . . . . . . c 4,703,784 4,702,303 — 4,594,742 107,561
Notes:a. (i) The carrying amounts of deposits with banks without maturity and loans with no specified repayment dates represent a reasonable
estimate of fair value, considering the nature of these financial instruments.(ii) Financial assets with a remaining maturity of six months or less: The carrying amounts represent a reasonable estimate of fair value.(iii) Financial assets with a remaining maturity of more than six months: Except for impaired loans and advances, the fair values are
mostly determined using discounted cash flow models taking into account certain factors including counterparties’ credit ratings,pledged collateral, and market interest rates. The fair values of impaired loans and advances are generally determined bydiscounting the estimated future cash flows over the time period they are expected to be recovered, and may be based on theappraisal value of underlying collateral as appropriate.
Note that some of the financial assets in this category include embedded derivatives, which are separately accounted for, but presentedtogether with the host contract.
b. The fair values for held-to-maturity investments are determined using quoted prices in active markets.c. (i) The carrying amounts of demand deposits and deposits without maturity represent a reasonable estimate of fair value, considering
the nature of these financial instruments.(ii) Financial liabilities with a remaining maturity of six months or less: The carrying amounts represent a reasonable estimate of fair
value.(iii) Financial liabilities with a remaining maturity of more than six months: The fair values are, in principle, based on the present values
of future cash flows calculated using the refinancing rate applied to the same type of instruments for similar remaining maturities.The fair values of debt securities in issue are based on the present values of future cash flows calculated using the rate derived fromyields of bonds issued by SMBC and publicly offered subordinated bonds published by securities firms.
Note that some of the financial liabilities in this category include embedded derivatives, which are separately accounted for, but presentedtogether with the host contract.
F-97
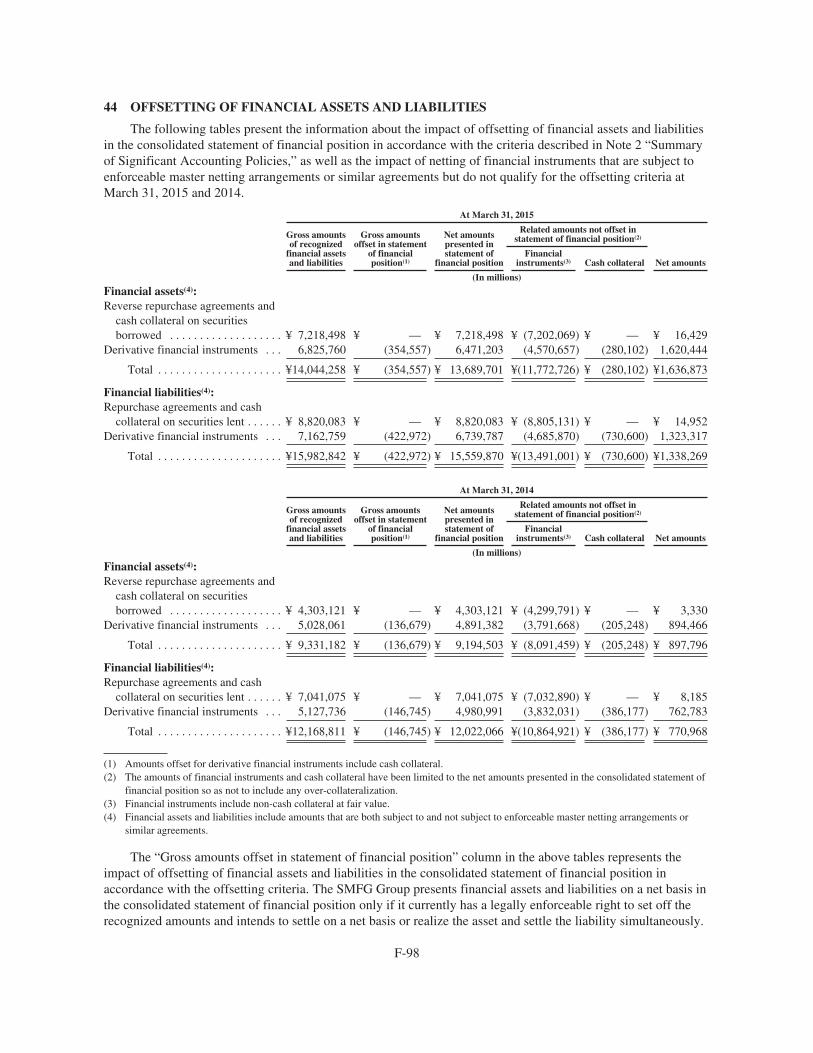
44 OFFSETTING OF FINANCIAL ASSETS AND LIABILITIES
The following tables present the information about the impact of offsetting of financial assets and liabilitiesin the consolidated statement of financial position in accordance with the criteria described in Note 2 “Summaryof Significant Accounting Policies,” as well as the impact of netting of financial instruments that are subject toenforceable master netting arrangements or similar agreements but do not qualify for the offsetting criteria atMarch 31, 2015 and 2014.
At March 31, 2015
Gross amountsof recognized
financial assetsand liabilities
Gross amountsoffset in statement
of financialposition(1)
Net amountspresented instatement of
financial position
Related amounts not offset instatement of financial position(2)
Net amountsFinancial
instruments(3) Cash collateral
(In millions)
Financial assets(4):Reverse repurchase agreements and
cash collateral on securitiesborrowed . . . . . . . . . . . . . . . . . . . ¥ 7,218,498 ¥ — ¥ 7,218,498 ¥ (7,202,069) ¥ — ¥ 16,429
Derivative financial instruments . . . 6,825,760 (354,557) 6,471,203 (4,570,657) (280,102) 1,620,444
Total . . . . . . . . . . . . . . . . . . . . . ¥14,044,258 ¥ (354,557) ¥ 13,689,701 ¥(11,772,726) ¥ (280,102) ¥1,636,873
Financial liabilities(4):Repurchase agreements and cash
collateral on securities lent . . . . . . ¥ 8,820,083 ¥ — ¥ 8,820,083 ¥ (8,805,131) ¥ — ¥ 14,952Derivative financial instruments . . . 7,162,759 (422,972) 6,739,787 (4,685,870) (730,600) 1,323,317
Total . . . . . . . . . . . . . . . . . . . . . ¥15,982,842 ¥ (422,972) ¥ 15,559,870 ¥(13,491,001) ¥ (730,600) ¥1,338,269
At March 31, 2014
Gross amountsof recognized
financial assetsand liabilities
Gross amountsoffset in statement
of financialposition(1)
Net amountspresented instatement of
financial position
Related amounts not offset instatement of financial position(2)
Net amountsFinancial
instruments(3) Cash collateral
(In millions)
Financial assets(4):Reverse repurchase agreements and
cash collateral on securitiesborrowed . . . . . . . . . . . . . . . . . . . ¥ 4,303,121 ¥ — ¥ 4,303,121 ¥ (4,299,791) ¥ — ¥ 3,330
Derivative financial instruments . . . 5,028,061 (136,679) 4,891,382 (3,791,668) (205,248) 894,466
Total . . . . . . . . . . . . . . . . . . . . . ¥ 9,331,182 ¥ (136,679) ¥ 9,194,503 ¥ (8,091,459) ¥ (205,248) ¥ 897,796
Financial liabilities(4):Repurchase agreements and cash
collateral on securities lent . . . . . . ¥ 7,041,075 ¥ — ¥ 7,041,075 ¥ (7,032,890) ¥ — ¥ 8,185Derivative financial instruments . . . 5,127,736 (146,745) 4,980,991 (3,832,031) (386,177) 762,783
Total . . . . . . . . . . . . . . . . . . . . . ¥12,168,811 ¥ (146,745) ¥ 12,022,066 ¥(10,864,921) ¥ (386,177) ¥ 770,968
(1) Amounts offset for derivative financial instruments include cash collateral.(2) The amounts of financial instruments and cash collateral have been limited to the net amounts presented in the consolidated statement of
financial position so as not to include any over-collateralization.(3) Financial instruments include non-cash collateral at fair value.(4) Financial assets and liabilities include amounts that are both subject to and not subject to enforceable master netting arrangements or
similar agreements.
The “Gross amounts offset in statement of financial position” column in the above tables represents theimpact of offsetting of financial assets and liabilities in the consolidated statement of financial position inaccordance with the offsetting criteria. The SMFG Group presents financial assets and liabilities on a net basis inthe consolidated statement of financial position only if it currently has a legally enforceable right to set off therecognized amounts and intends to settle on a net basis or realize the asset and settle the liability simultaneously.
F-98

The “Related amounts not offset in statement of financial position” column comprises (1) financial assetsand liabilities subject to netting arrangements, such as the International Swaps and Derivatives Association’s(“ISDA”) Master Agreement, master repurchase agreements and master securities lending agreements, whichallow all the outstanding transactions with a particular counterparty to be set off only if the event of default orother predetermined events occur, and (2) cash and non-cash collateral related to those transactions.
45 FINANCIAL RISK MANAGEMENT
The SMFG Group classifies risks into the following categories: credit risk, market risk, liquidity risk andoperational risk (including processing risk and system risk). This note presents information about the SMFGGroup’s exposure to credit risk, market risk, and liquidity risk, and its policies and processes for measuring andmanaging these risks.
Risk Management System
The SMFG Group has established a basic approach for risk management. This basic approach includesestablishing Group-wide basic policies for risk management, providing all necessary implementation guidance tothe SMFG Group companies and monitoring the risk management procedures implemented by all Groupcompanies to ensure their practices meet the relevant standards.
The Group-wide basic policies for risk management are determined by the Management Committee, whichconsists of designated Board Members, and such policies are authorized by the Board of Directors. The policiesinclude the following:
• Risk management on a Group-wide basis. Various risks taken at the SMFG Group companies aremanaged on a consolidated basis according to the nature of their business and significance inconformity with the relevant laws and regulations.
• Risk management based on quantification. The risks are quantitatively managed according to therelevant risk characteristics after specifying the scope of quantification.
• Ensuring consistency with the business strategy. Risk management is consistent with the businessstrategy.
• System for check and balance. The risk management framework is developed to ensure effective checkand balance function for business operations.
• Measures for emergencies and critical situations. Necessary measures are developed by assumingsituations and scenarios as to materialization of risk which would have a significant impact on thebusiness and financial management of the SMFG Group.
• Verification of the actual situation. The actual risk management process is verified by the InternalAudit Unit.
The policies also include fundamental principles for each risk category, which each SMFG Group companyhas to follow when establishing its own risk management system. The Corporate Risk Management Department,in cooperation with the Corporate Planning Department, performs risk management according to the abovepolicies. In addition, the Internal Audit Department is responsible for the independent review of risk managementwithin the SMFG Group.
Risk management systems are in place at the individual SMFG Group companies, and have been establishedin accordance with the Group-wide basic policies for risk management and implementation guidance provided bySMFG. Based on these policies and guidance, each SMFG Group company implements guidelines andestablishes processes for risk management. On an ongoing basis, these processes and risks are monitored bySMFG.
F-99

For example, at SMBC, specific departments have been appointed to oversee the handling of the four riskcategories listed above, in addition to the risks associated with settlement. Each risk category is managed takinginto account, the particular characteristics of that category. In addition, the Risk Management Unit has beenestablished—independent of the business units—and the risk management system has been strengthened byconsolidating the functions for managing risks—credit, market, liquidity, operational and settlement—into theRisk Management Unit and enhancing SMBC’s across-the-board risk monitoring ability. One board member isassigned to oversee the Risk Management Unit comprising the Corporate Risk Management Department andCredit & Investment Planning Department. The Corporate Risk Management Department—the unit’s planningdepartment—seeks to manage all categories of risk in cooperation with the Corporate Planning Department.Moreover, the Internal Audit Unit—independent of all business units—conducts periodic audits to ensure that themanagement system is functioning properly.
The decision-making process for addressing the risks at the operating level is also strengthened by theCredit Risk Management Committee and the Market Risk Management Committee, which are subcommittees ofthe Management Committee of SMBC.
The diagram below represents the risk management system of the SMFG Group and SMBC.
DesignatedBoard Members
IT Planning Dept.
Operations Planning Dept.
SMBCNikko
Securities
RiskManage-ment Unit
SMFG
Board of Directors
Management Committee
Designated Board Members
Corporate RiskManagementDept.
Credit Risk
Market Risk
Liquidity Risk
Corporate-wideRisk Management
Corporate PlanningDept./
Corporate RiskManagement Dept.
Internal Audit Dept.
SMBC Board of Directors
ManagementCommittee
Credit RiskManagementCommittee
Board Member in Charge of RiskManagement Unit
Internal AuditUnit
Bank-wideRisk Management
Report
IT Planning Dept.Other Departments Other Risks
General Affairs Dept.
Operational Risk
System Risk
Processing Risk
Credit & InvestmentPlanning Dept.
Corporate Auditors*
Corporate Auditors*
Market RiskManagementCommittee
Corporate PlanningDept./
Corporate RiskManagement Dept.
Credit Risk
Market Risk
Liquidity Risk
Corporate RiskManagementDept.
Implementationguidance for riskmanagement
Monitoring riskmanagementsystem
SumitomoMitsui Finance
& Leasing
SMBCFriend
Securities
SMFGCard & Credit
SumitomoMitsuiCard
CedynaFinancial
SMBCConsumerFinance
JapanResearchInstitute
Processing Risk
Operational Risk
System Risk
Settle-mentRisk
* Under the Companies Act, the SMFG Group has corporate auditors who have a statutory duty to examine the financial statements and business reports submitted by the Board of Directors to the general shareholders' meeting. Corporate auditors also have the duty to supervise the administration of the SMFG Group's affairs by the directors in accordance with the auditing policy and rules prescribed by resolutions of the Board of Corporate Auditors.
Risk Capital-Based Management
In order to maintain a balance between risk and return, the SMFG Group employs a risk capital-basedmanagement method. The SMFG Group measures “risk capital” based on VaR and other specific measures suchas uniform basic measures of credit, market and operational risks, taking into account the special characteristicsof each type of risk, and the business activities of each SMFG Group company.
The SMFG Group then allocates risk capital to each unit to keep the total exposure to various risks withinthe scope of the SMFG Group’s resources, i.e., capital. The allocation to each unit is determined by theManagement Committee and authorized by the Board of Directors. In this framework, risk capital includes creditconcentration risk and interest rate risk in the banking book, which are taken into account under Pillar 2 of theBasel Capital Accord. In addition, the SMFG Group conducts risk capital management activities on aconsolidated basis, including each SMFG Group company.
F-100
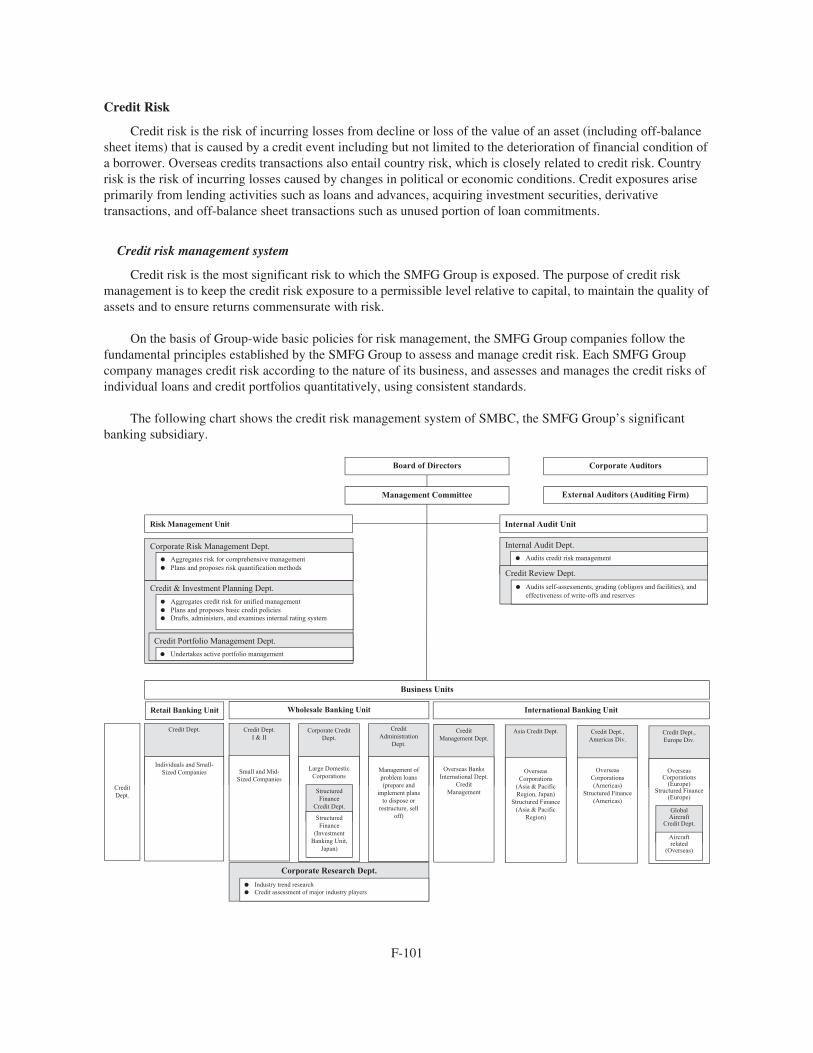
Credit Risk
Credit risk is the risk of incurring losses from decline or loss of the value of an asset (including off-balancesheet items) that is caused by a credit event including but not limited to the deterioration of financial condition ofa borrower. Overseas credits transactions also entail country risk, which is closely related to credit risk. Countryrisk is the risk of incurring losses caused by changes in political or economic conditions. Credit exposures ariseprimarily from lending activities such as loans and advances, acquiring investment securities, derivativetransactions, and off-balance sheet transactions such as unused portion of loan commitments.
Credit risk management system
Credit risk is the most significant risk to which the SMFG Group is exposed. The purpose of credit riskmanagement is to keep the credit risk exposure to a permissible level relative to capital, to maintain the quality ofassets and to ensure returns commensurate with risk.
On the basis of Group-wide basic policies for risk management, the SMFG Group companies follow thefundamental principles established by the SMFG Group to assess and manage credit risk. Each SMFG Groupcompany manages credit risk according to the nature of its business, and assesses and manages the credit risks ofindividual loans and credit portfolios quantitatively, using consistent standards.
The following chart shows the credit risk management system of SMBC, the SMFG Group’s significantbanking subsidiary.
Board of Directors
Management Committee
Corporate Auditors
Internal Audit UnitRisk Management Unit
Corporate Risk Management Dept.Aggregates risk for comprehensive managementPlans and proposes risk quantification methods
Credit & Investment Planning Dept.Aggregates credit risk for unified management Plans and proposes basic credit policiesDrafts, administers, and examines internal rating system
Credit Portfolio Management Dept.Undertakes active portfolio management
Internal Audit Dept.Audits credit risk management
Credit Review Dept.Audits self-assessments, grading (obligors and facilities), and effectiveness of write-offs and reserves
Business Units
Retail Banking Unit Wholesale Banking Unit International Banking Unit
Credit Dept. Credit Dept.I & II
Small and Mid-Sized Companies
Individuals and Small-Sized Companies
CreditDept.
Corporate Research Dept.Industry trend researchCredit assessment of major industry players
External Auditors (Auditing Firm)
Corporate CreditDept.
Large DomesticCorporations
StructuredFinance
Credit Dept.
StructuredFinance
(InvestmentBanking Unit,
Japan)
CreditAdministration
Dept.
Management ofproblem loans(prepare and
implement plansto dispose or
restructure, selloff)
CreditManagement Dept.
Overseas BanksInternational Dept.
CreditManagement
Asia Credit Dept.
OverseasCorporations
(Asia & PacificRegion, Japan)
Structured Finance(Asia & Pacific
Region)
Credit Dept.,Americas Div.
OverseasCorporations(Americas)
Structured Finance(Americas)
Credit Dept.,Europe Div.
OverseasCorporations
(Europe)Structured Finance
(Europe)
GlobalAircraft
Credit Dept.
Aircraftrelated
(Overseas)
F-101

At SMBC, the Credit & Investment Planning Department within the Risk Management Unit is responsiblefor the comprehensive management of credit risk. This department drafts and administers credit policies, theinternal rating system, credit authority guidelines and credit application guidelines, and manages non-performingloans (“NPLs”), including impaired loans, and other aspects of credit portfolio management. The department alsocooperates with the Corporate Risk Management Department in quantifying credit risk (risk capital and risk-weighted assets) and controls SMBC’s entire credit risk. Further, the Credit Portfolio Management Departmentwithin the Credit & Investment Planning Department strives to stabilize the credit portfolio and manage the riskthrough credit derivatives, loan asset sales and other instruments.
The credit departments within each business unit conduct credit risk management for loans handled by theirunits and manage their units’ portfolios. The credit limits they use are based on the baseline amounts that theCredit & Investment Planning Department establishes for each grading category, with particular attention paid toevaluating and managing customers or loans perceived to have particularly high credit risk. The CorporateResearch Department engages in research on industries and analyzes the business and financial conditions ofborrower enterprises to detect early signs of problems or growth potential.
The Credit Administration Department is responsible for handling NPLs of borrowers classified aspotentially bankrupt or lower, and formulates plans for workouts, including write-offs, and corporaterehabilitation. The department closely liaises with SMBC Servicer Co., Ltd., an SMFG Group company, whichengages in related services to efficiently reduce the amount of NPLs, including through the sale of loans.
The Internal Audit Unit, operating independently of the business units, audits asset quality, accuracy ofgrading and state of credit risk management, and reports the results directly to the board of directors and theManagement Committee.
SMBC has established the Credit Risk Committee to undertake control of credit risk and to ensure theoverall soundness of the loan operations.
Credit risk management methods
To effectively manage the risk involved in individual loans as well as the credit portfolio as a whole, SMBCfirst acknowledges that every loan entails credit risk, assesses the credit risk posed by each borrower and loanusing an internal rating system, and quantifies that risk for control purposes.
Credit risk evaluation
The Credit & Investment Planning Department manages an internal rating system for each asset controlcategory set according to portfolio characteristics. For example, credits to commercial and industrial (“C&I”)companies, individuals for business purposes (domestic only), sovereigns, public sector entities, and financialinstitutions are assigned an “obligor grade,” which indicates the borrower’s creditworthiness, and/or “facilitygrade,” which indicates the collectability of assets taking into account the transaction conditions such asguarantee/collateral, and tenor. The business units determine an obligor grade by first assigning a financial gradeusing a financial strength grading model and data obtained from the obligor’s financial statements, including networth and cash flows. The financial grade is then adjusted taking into account the actual state of the obligor’sfinancial position and qualitative factors to derive the obligor grade. The qualitative factors mainly include theexpected future cash flows taking into account factors such as historical loss information, the appropriateness ofthe borrower’s business plan or operational improvement plan, the status of progress of its plan, and the overallsupport from financial institutions. In the event that the borrower is domiciled overseas, internal ratings for creditare made after taking into consideration the country rank, which represents an assessment of the credit quality ofeach country based on its political and economic situation, as well as its current account balance and externaldebt. Obligor grades and facility grades are reviewed once a year and as otherwise necessary, such as when thereare changes in the credit situation. The SMFG Group’s subsidiaries carry out credit risk evaluations in line withSMBC.
F-102

The table below shows the corporate obligor grading system of SMBC.
Obligor GradeDefinition Borrower Category
Domestic(C&I), etc.
Overseas(C&I), etc.
J1 G1 Very high certainty of debt repayment
NormalBorrowers
J2 G2 High certainty of debt repayment
J3 G3 Satisfactory certainty of debt repayment
J4 G4 Debt repayment is likely, but this could change in cases ofsignificant changes in economic trends or business environment
J5 G5
No problem with debt repayment over the short term, but notsatisfactory over the mid to long term, and the situation couldchange in cases of significant changes in economic trends orbusiness environment
J6 G6Currently no problem with debt repayment, but there are unstablebusiness and financial factors that could lead to debt repaymentproblems
J7 G7Close monitoring is required due to problems in meeting loan termsand conditions, sluggish/unstable business, or financial problems
BorrowersRequiring Caution
J7R G7RObligors with loans that are more than three months past due orwith restructured loans within the “Borrowers Requiring Caution”category
SubstandardBorrowers
J8 G8Currently not bankrupt, but experiencing business difficulties,making insufficient progress in restructuring and highly likely togo bankrupt
PotentiallyBankruptBorrowers
J9 G9Though not yet legally or formally bankrupt, has serious businessdifficulties and rehabilitation is unlikely; thus, effectively bankrupt
EffectivelyBankruptBorrowers
J10 G10 Legally or formally bankrupt BankruptBorrowers
There are also grading systems for loans to individuals such as housing loans and structured financeincluding project finance, where the repayment source is limited to the cash flows generated by a particularbusiness or asset. For example, the obligor grade of housing loans is determined taking into account variousrelevant factors such as proportion of the repayment to revenue, proportion of down payment to the value andpast due information.
The Credit & Investment Planning Department centrally manages the internal rating systems, and designs,operates, supervises and validates the grading models. It validates the grading models (including statisticalvalidation) of main assets following the procedure manual once a year to ensure their effectiveness andsuitability.
Quantification of credit risk
Credit risk quantification refers to the process of estimating the degree of credit risk of a portfolio orindividual loan taking into account not just the obligor’s probability of default (“PD”), but also the concentrationof risk in a specific customer or industry, and the loss impact of fluctuations in the value of collateral, such asreal estate and securities.
F-103

Specifically, the PD by grade, loss given default (“LGD”), credit quality correlation among obligors, andother parameter values are estimated using the historical data of obligors and facilities stored in a database tocalculate the credit risk. Then, based on these parameters, SMBC runs a simulation of simultaneous default usingthe Monte Carlo Simulation to calculate SMBC’s maximum loss exposure to the estimated amount of themaximum losses/expected shortfall that may be incurred. Based on these quantitative results, SMBC allocatesrisk capital.
Risk quantification is also executed for purposes such as to determine the portfolio’s risk concentration or tosimulate economic movements (stress tests), and the results are used for making optimal decisions across thewhole range of business operations, including formulating business plans and providing a standard against whichindividual credit applications are assessed.
Credit assessment
At SMBC, the credit assessment of corporate loans involves a variety of financial analyses, including cashflows, to predict an enterprise’s capability of loan repayment and its growth prospects. These quantitativemeasures, when combined with qualitative analyses of industrial trends, the enterprise’s research anddevelopment capabilities, the competitiveness of its products or services, and its management caliber, result in acomprehensive credit assessment. The loan application is analyzed in terms of the intended utilization of thefunds and the repayment schedule. In the assessment of housing loans for individuals, SMBC employs a creditassessment model based on credit data amassed and analyzed by SMBC over many years, taking into accountvarious relevant factors including proportion of the repayment to revenue, proportion of down payment to thevalue and past due information.
Credit monitoring
At SMBC, in addition to analyzing loans at the application stage, the Credit Monitoring System is utilized toreassess obligor grades, and review credit policies for each obligor so that problems can be detected at an earlystage, and quick and effective action can be taken. The system includes annual monitoring that is carried out eachtime the financial results of the obligor enterprise are obtained, as well as ad-hoc monitoring that is performedeach time credit conditions change.
Credit portfolio management
Risk-taking within the scope of capital
To keep the credit risk exposure to a permissible level relative to capital, SMBC’s Corporate RiskManagement Department sets a credit risk capital limit for internal control purposes. Under this limit, sub-limitsare set for each business unit. The Corporate Risk Management Department conducts monthly monitoring tomake sure that these limits are being followed.
Controlling concentration risk
Once the credit concentration risk is realized, the equity capital of SMBC may be materially impaired.SMBC’s Credit & Investment Planning Department therefore takes measures to manage concentration risks, suchas introducing large exposure limits and conducting intensive loan reviews for obligors with large exposures,with an increased focus on industrial sectors with an excessive concentration of credit risk. Further, to managecountry risk, the Credit Management Department of the International Banking Unit has credit limit guidelinesbased on each country’s creditworthiness.
Toward active portfolio management
SMBC’s Credit Portfolio Management Department makes use of credit derivatives, loan asset sales, andother instruments to proactively and flexibly manage its portfolio to stabilize credit risk.
F-104

Maximum exposure to credit risk before collateral held or other credit enhancements
The following table shows the maximum exposure to credit risk before taking into account any collateralheld or other credit enhancements at March 31, 2015 and 2014.
At March 31,
2015 2014
(In millions)
Credit risk exposures relating to assets on the consolidated statement offinancial position:
Deposits with banks . . . . . . . . . . . . . . . . . . . . . . . . . . . . . . . . . . . . . . . . . . . . ¥ 38,938,903 ¥ 31,970,308Call loans and bills bought . . . . . . . . . . . . . . . . . . . . . . . . . . . . . . . . . . . . . . . 1,326,965 1,248,235Reverse repurchase agreements and cash collateral on securities
borrowed . . . . . . . . . . . . . . . . . . . . . . . . . . . . . . . . . . . . . . . . . . . . . . . . . . . 7,218,498 4,303,121Trading assets . . . . . . . . . . . . . . . . . . . . . . . . . . . . . . . . . . . . . . . . . . . . . . . . . 2,618,593 3,263,085Derivative financial instruments . . . . . . . . . . . . . . . . . . . . . . . . . . . . . . . . . . . 6,471,203 4,891,382Financial assets at fair value through profit or loss . . . . . . . . . . . . . . . . . . . . . 1,654,259 1,697,872Investment securities:
Held-to-maturity investments . . . . . . . . . . . . . . . . . . . . . . . . . . . . . . . . . 3,396,895 4,528,254Available-for-sale financial assets . . . . . . . . . . . . . . . . . . . . . . . . . . . . . 14,413,448 12,474,296
Loans and advances . . . . . . . . . . . . . . . . . . . . . . . . . . . . . . . . . . . . . . . . . . . . . 86,971,716 81,244,982Other financial assets . . . . . . . . . . . . . . . . . . . . . . . . . . . . . . . . . . . . . . . . . . . 2,565,725 1,995,524
Credit risk exposures relating to off-balance sheet items(1):Loan commitments . . . . . . . . . . . . . . . . . . . . . . . . . . . . . . . . . . . . . . . . . . . . . 53,665,583 49,285,032Financial guarantees and other credit-related contingent liabilities . . . . . . . . 7,076,536 6,396,144
Total . . . . . . . . . . . . . . . . . . . . . . . . . . . . . . . . . . . . . . . . . . . . . . . . . . . . ¥226,318,324 ¥203,298,235
(1) The off-balance sheet items represent the nominal amounts of undrawn loan commitments, financial guarantees and other credit-relatedcontingent liabilities.
Based on the table above, excluding loan commitments (refer to Note 41 “Contingency and CapitalCommitments”), the majority of the total exposure to credit risk is derived from “Loans and advances” and“Available-for-sale financial assets.”
Collateral and other credit enhancements
The SMFG Group considers the acquisition of collateral and guarantees as a secondary repayment source tofurther enhance loan recovery and minimize credit risk. Based on the assessment of a borrower’s real financialcondition and potential future cash flows, the SMFG Group shall analyze the borrower’s repayment ability andrequire sufficient collateral in the form of an asset or third-party obligation. This serves to mitigate the inherentcredit risk in the exposure, by either improving recoveries in the event of a default or transferring the borrower’sobligation to guarantors. Collateral received is mainly segregated into (1) financial collateral such as cash,deposits and securities, (2) real estate collateral such as land and buildings, and (3) guarantees received fromsovereigns, municipal corporations, credit guarantee corporations and other public entities, financial institutions,and other companies.
The SMFG Group’s credit risk management is mainly based on an analysis of the repayment ability fromthe cash flows of the borrower’s business performance, and the collateral and other credit enhancements areconsidered as secondary repayment sources in the SMFG Group’s business practice. At the time of the primarylending decision, the SMFG Group evaluates the collateral on an individual borrower basis to consider itsfinancial effect for mitigating credit risk. The frequency of subsequent collateral reviews is dependent on theborrower’s creditworthiness. In case there is a significant change in the borrower’s repayment ability due to a
F-105
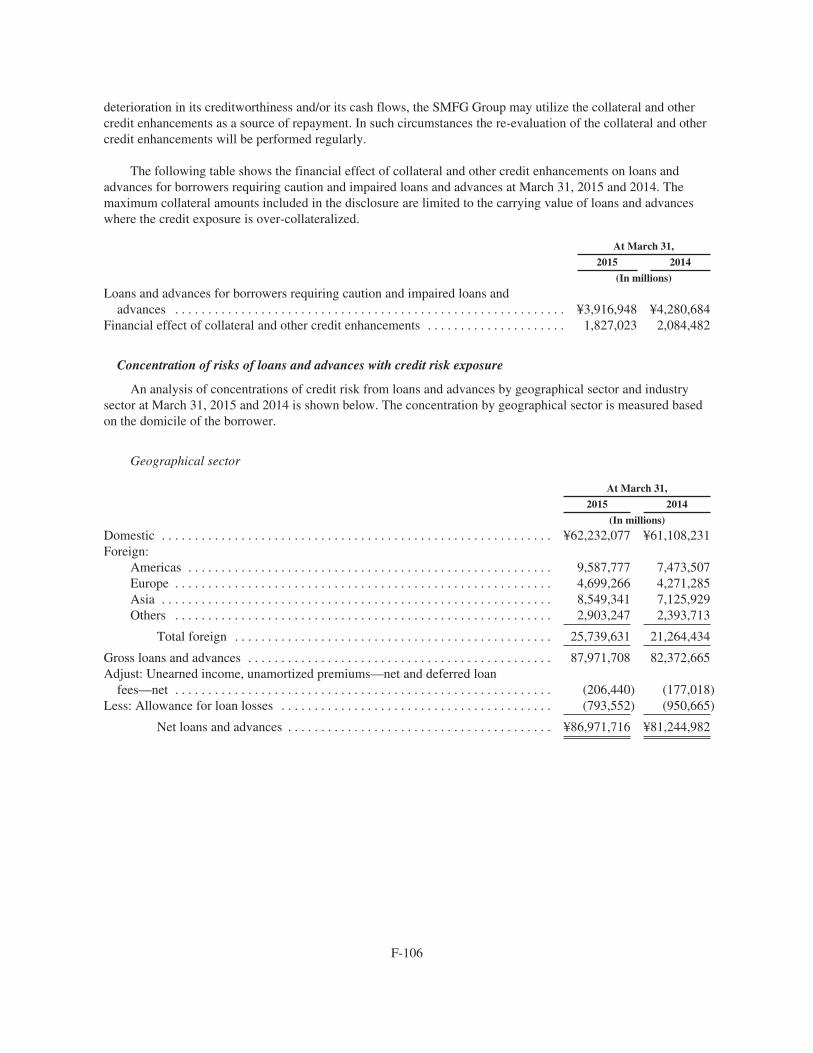
deterioration in its creditworthiness and/or its cash flows, the SMFG Group may utilize the collateral and othercredit enhancements as a source of repayment. In such circumstances the re-evaluation of the collateral and othercredit enhancements will be performed regularly.
The following table shows the financial effect of collateral and other credit enhancements on loans andadvances for borrowers requiring caution and impaired loans and advances at March 31, 2015 and 2014. Themaximum collateral amounts included in the disclosure are limited to the carrying value of loans and advanceswhere the credit exposure is over-collateralized.
At March 31,
2015 2014
(In millions)
Loans and advances for borrowers requiring caution and impaired loans andadvances . . . . . . . . . . . . . . . . . . . . . . . . . . . . . . . . . . . . . . . . . . . . . . . . . . . . . . . . . . . ¥3,916,948 ¥4,280,684
Financial effect of collateral and other credit enhancements . . . . . . . . . . . . . . . . . . . . . 1,827,023 2,084,482
Concentration of risks of loans and advances with credit risk exposure
An analysis of concentrations of credit risk from loans and advances by geographical sector and industrysector at March 31, 2015 and 2014 is shown below. The concentration by geographical sector is measured basedon the domicile of the borrower.
Geographical sector
At March 31,
2015 2014
(In millions)
Domestic . . . . . . . . . . . . . . . . . . . . . . . . . . . . . . . . . . . . . . . . . . . . . . . . . . . . . . . . . . . ¥62,232,077 ¥61,108,231Foreign:
Americas . . . . . . . . . . . . . . . . . . . . . . . . . . . . . . . . . . . . . . . . . . . . . . . . . . . . . . . 9,587,777 7,473,507Europe . . . . . . . . . . . . . . . . . . . . . . . . . . . . . . . . . . . . . . . . . . . . . . . . . . . . . . . . . 4,699,266 4,271,285Asia . . . . . . . . . . . . . . . . . . . . . . . . . . . . . . . . . . . . . . . . . . . . . . . . . . . . . . . . . . . 8,549,341 7,125,929Others . . . . . . . . . . . . . . . . . . . . . . . . . . . . . . . . . . . . . . . . . . . . . . . . . . . . . . . . . 2,903,247 2,393,713
Total foreign . . . . . . . . . . . . . . . . . . . . . . . . . . . . . . . . . . . . . . . . . . . . . . . . 25,739,631 21,264,434
Gross loans and advances . . . . . . . . . . . . . . . . . . . . . . . . . . . . . . . . . . . . . . . . . . . . . . 87,971,708 82,372,665Adjust: Unearned income, unamortized premiums—net and deferred loan
fees—net . . . . . . . . . . . . . . . . . . . . . . . . . . . . . . . . . . . . . . . . . . . . . . . . . . . . . . . . . (206,440) (177,018)Less: Allowance for loan losses . . . . . . . . . . . . . . . . . . . . . . . . . . . . . . . . . . . . . . . . . (793,552) (950,665)
Net loans and advances . . . . . . . . . . . . . . . . . . . . . . . . . . . . . . . . . . . . . . . . ¥86,971,716 ¥81,244,982
F-106

Industry sector
At March 31,
2015 2014
(In millions)
Domestic:Manufacturing . . . . . . . . . . . . . . . . . . . . . . . . . . . . . . . . . . . . . . . . . . . . . . . . . . . . . . . ¥ 8,061,654 ¥ 8,018,568Agriculture, forestry, fisheries and mining . . . . . . . . . . . . . . . . . . . . . . . . . . . . . . . . . 171,855 177,012Construction . . . . . . . . . . . . . . . . . . . . . . . . . . . . . . . . . . . . . . . . . . . . . . . . . . . . . . . . 1,150,616 1,152,388Transportation, communications and public enterprises . . . . . . . . . . . . . . . . . . . . . . . 5,175,949 5,086,361Wholesale and retail . . . . . . . . . . . . . . . . . . . . . . . . . . . . . . . . . . . . . . . . . . . . . . . . . . 5,664,385 5,505,570Finance and insurance . . . . . . . . . . . . . . . . . . . . . . . . . . . . . . . . . . . . . . . . . . . . . . . . . 2,869,967 2,537,347Real estate and goods rental and leasing . . . . . . . . . . . . . . . . . . . . . . . . . . . . . . . . . . . 8,766,724 8,117,000Services . . . . . . . . . . . . . . . . . . . . . . . . . . . . . . . . . . . . . . . . . . . . . . . . . . . . . . . . . . . . 4,776,706 4,855,536Municipalities . . . . . . . . . . . . . . . . . . . . . . . . . . . . . . . . . . . . . . . . . . . . . . . . . . . . . . . 1,353,949 1,279,010Lease financing . . . . . . . . . . . . . . . . . . . . . . . . . . . . . . . . . . . . . . . . . . . . . . . . . . . . . . 2,211,773 2,133,760Consumer(1) . . . . . . . . . . . . . . . . . . . . . . . . . . . . . . . . . . . . . . . . . . . . . . . . . . . . . . . . . 18,817,259 19,086,241Others . . . . . . . . . . . . . . . . . . . . . . . . . . . . . . . . . . . . . . . . . . . . . . . . . . . . . . . . . . . . . 3,211,240 3,159,438
Total domestic . . . . . . . . . . . . . . . . . . . . . . . . . . . . . . . . . . . . . . . . . . . . . . . . . . . 62,232,077 61,108,231
Foreign:Public sector . . . . . . . . . . . . . . . . . . . . . . . . . . . . . . . . . . . . . . . . . . . . . . . . . . . . . . . . 164,495 163,685Financial institutions . . . . . . . . . . . . . . . . . . . . . . . . . . . . . . . . . . . . . . . . . . . . . . . . . . 3,880,655 3,450,482Commerce and industry . . . . . . . . . . . . . . . . . . . . . . . . . . . . . . . . . . . . . . . . . . . . . . . 20,010,729 16,435,047Lease financing . . . . . . . . . . . . . . . . . . . . . . . . . . . . . . . . . . . . . . . . . . . . . . . . . . . . . . 308,128 267,394Others . . . . . . . . . . . . . . . . . . . . . . . . . . . . . . . . . . . . . . . . . . . . . . . . . . . . . . . . . . . . . 1,375,624 947,826
Total foreign . . . . . . . . . . . . . . . . . . . . . . . . . . . . . . . . . . . . . . . . . . . . . . . . . . . . 25,739,631 21,264,434
Gross loans and advances . . . . . . . . . . . . . . . . . . . . . . . . . . . . . . . . . . . . . . . . . . . . . . 87,971,708 82,372,665Adjust: Unearned income, unamortized premiums—net and deferred loan
fees—net . . . . . . . . . . . . . . . . . . . . . . . . . . . . . . . . . . . . . . . . . . . . . . . . . . . . . . . . . (206,440) (177,018)Less: Allowance for loan losses . . . . . . . . . . . . . . . . . . . . . . . . . . . . . . . . . . . . . . . . . (793,552) (950,665)
Net loans and advances . . . . . . . . . . . . . . . . . . . . . . . . . . . . . . . . . . . . . . . . . . . . ¥86,971,716 ¥81,244,982
(1) The balance in Consumer mainly consists of housing loans. The housing loan balances amounted to ¥14,087,453 million and¥14,420,225 million at March 31, 2015 and 2014, respectively.
The following tables show a disaggregation of the structured finance loans and advances balances, wherethe repayment source is limited to the cash flows generated by a particular business or asset, and the balances ofsecured or unsecured consumer loans at March 31, 2015 and 2014. These loans and advances are included in thepreceding tables.
Structured finance:
At March 31,
2015 2014
(In millions)
Real estate finance . . . . . . . . . . . . . . . . . . . . . . . . . . . . . . . . . . . . . . . . . . . . . . . . . . . . . . ¥1,896,194 ¥1,671,049Project finance . . . . . . . . . . . . . . . . . . . . . . . . . . . . . . . . . . . . . . . . . . . . . . . . . . . . . . . . . 2,988,040 2,308,908Other structured finance . . . . . . . . . . . . . . . . . . . . . . . . . . . . . . . . . . . . . . . . . . . . . . . . . 332,132 273,863
Total structured finance . . . . . . . . . . . . . . . . . . . . . . . . . . . . . . . . . . . . . . . . . . . . . . ¥5,216,366 ¥4,253,820
F-107

Consumer:
At March 31,
2015 2014
(In millions)
Secured loans(1) . . . . . . . . . . . . . . . . . . . . . . . . . . . . . . . . . . . . . . . . . . . . . . . . . . . . . . ¥15,193,732 ¥15,544,637Unsecured loans . . . . . . . . . . . . . . . . . . . . . . . . . . . . . . . . . . . . . . . . . . . . . . . . . . . . . 3,623,527 3,541,604
Total consumer . . . . . . . . . . . . . . . . . . . . . . . . . . . . . . . . . . . . . . . . . . . . . . . . . . ¥18,817,259 ¥19,086,241
(1) The secured loans and advances mainly represent housing loans. The housing loan balances amounted to ¥14,087,453 million and¥14,420,225 million at March 31, 2015 and 2014, respectively.
Loans and advances by credit quality category
Loans and advances are summarized as follows:
At March 31,
2015 2014
(In millions)
Neither past due nor impaired . . . . . . . . . . . . . . . . . . . . . . . . . . . . . . . . . . . . . . . . . . . ¥86,206,087 ¥80,255,699Past due but not impaired . . . . . . . . . . . . . . . . . . . . . . . . . . . . . . . . . . . . . . . . . . . . . . 167,519 168,153Impaired(1) . . . . . . . . . . . . . . . . . . . . . . . . . . . . . . . . . . . . . . . . . . . . . . . . . . . . . . . . . . 1,598,102 1,948,813
Gross loans and advances . . . . . . . . . . . . . . . . . . . . . . . . . . . . . . . . . . . . . . . . . . 87,971,708 82,372,665Adjust: Unearned income, unamortized premiums—net and deferred loan
fees—net . . . . . . . . . . . . . . . . . . . . . . . . . . . . . . . . . . . . . . . . . . . . . . . . . . . . . . . . . (206,440) (177,018)Less: Allowance for loan losses . . . . . . . . . . . . . . . . . . . . . . . . . . . . . . . . . . . . . . . . . (793,552) (950,665)
Net loans and advances . . . . . . . . . . . . . . . . . . . . . . . . . . . . . . . . . . . . . . . . . . . . ¥86,971,716 ¥81,244,982
(1) Loans and advances to borrowers who are classified in the borrower categories of substandard borrowers, potentially bankruptborrowers, effectively bankrupt borrowers, and bankrupt borrowers described in the obligor grading system represent impaired loans andadvances.
F-108

Loans and advances neither past due nor impaired
The following tables show the credit quality of the portfolio of loans and advances that were neither pastdue nor impaired, by geography and by industry based on the corporate obligor grading system of SMBC atMarch 31, 2015 and 2014. Since the internal rating system of SMBC’s consumer portfolio differs from thecorporate obligor grading system, the balances of loans and advances to consumers are included in the gradecategory of “Other.” Additionally, as the SMFG Group’s subsidiaries are adopting various internal rating systemswhich differ from SMBC, the grade category of “Other” also includes some balances of loans and advances heldby those subsidiaries.
At March 31, 2015
Normal Requiring Caution
J 1-3 J 4-6
Japanesegovernment
and localmunicipal
corporations Other J 7 Other Total
(In millions)Domestic:Manufacturing . . . . . . . . . . . ¥ 3,843,395 ¥ 2,265,065 ¥ — ¥ 1,493,017 ¥ 250,386 ¥ 40,969 ¥ 7,892,832Agriculture, forestry,
fisheries and mining . . . . 124,546 30,655 1,336 5,509 2,101 529 164,676Construction . . . . . . . . . . . . 177,536 504,951 — 333,352 71,238 19,556 1,106,633Transportation,
communications andpublic enterprises . . . . . . 2,560,712 1,981,485 128,491 343,328 80,017 21,401 5,115,434
Wholesale and retail . . . . . . 2,052,654 2,478,098 — 735,796 170,310 38,242 5,475,100Finance and insurance . . . . . 1,848,302 414,844 4,317 574,410 1,541 14,368 2,857,782Real estate and goods rental
and leasing . . . . . . . . . . . 3,660,159 3,293,563 73,853 1,240,569 163,554 106,891 8,538,589Services . . . . . . . . . . . . . . . . 1,101,414 2,135,296 491,781 629,407 184,536 49,106 4,591,540Municipalities . . . . . . . . . . . — — 1,181,671 155,528 — 16,750 1,353,949Lease financing . . . . . . . . . . — — — 2,172,824 — 19,841 2,192,665Consumer(1) . . . . . . . . . . . . . — 30 — 18,100,141 3,245 233,405 18,336,821Others . . . . . . . . . . . . . . . . . 20,437 2,031,238 506,805 410,493 172,733 3,517 3,145,223
Total domestic . . . . . . 15,389,155 15,135,225 2,388,254 26,194,374 1,099,661 564,575 60,771,244
G 1-3 G 4-6 — Other G 7 Other Total
Foreign:Public sector . . . . . . . . . . . . 86,490 42,137 — 34,310 — 1,544 164,481Financial institutions . . . . . . 2,461,053 210,771 — 1,124,623 5,054 23,504 3,825,005Commerce and industry . . . 13,364,752 2,369,304 — 3,457,416 455,691 134,666 19,781,829Lease financing . . . . . . . . . . — — — 286,219 — 12,839 299,058Others . . . . . . . . . . . . . . . . . 872,088 136,065 — 342,176 394 13,747 1,364,470
Total foreign . . . . . . . . 16,784,383 2,758,277 — 5,244,744 461,139 186,300 25,434,843
Total . . . . . . . . . . ¥32,173,538 ¥17,893,502 ¥2,388,254 ¥31,439,118 ¥1,560,800 ¥ 750,875 ¥86,206,087
(1) The balance in the grade category of “Other” in Consumer includes housing loans, which amounted to ¥13,756,579 million and¥94,374 million for the borrower category of Normal and Requiring Caution, respectively.
F-109
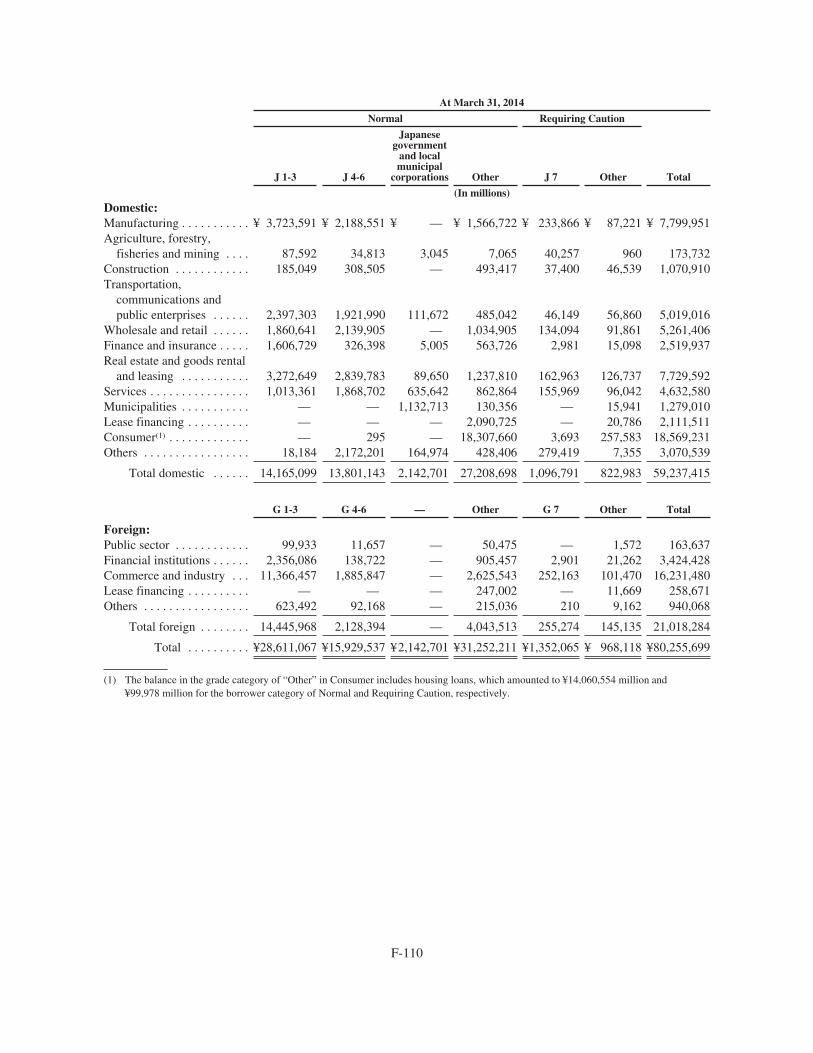
At March 31, 2014
Normal Requiring Caution
J 1-3 J 4-6
Japanesegovernment
and localmunicipal
corporations Other J 7 Other Total
(In millions)Domestic:Manufacturing . . . . . . . . . . . ¥ 3,723,591 ¥ 2,188,551 ¥ — ¥ 1,566,722 ¥ 233,866 ¥ 87,221 ¥ 7,799,951Agriculture, forestry,
fisheries and mining . . . . 87,592 34,813 3,045 7,065 40,257 960 173,732Construction . . . . . . . . . . . . 185,049 308,505 — 493,417 37,400 46,539 1,070,910Transportation,
communications andpublic enterprises . . . . . . 2,397,303 1,921,990 111,672 485,042 46,149 56,860 5,019,016
Wholesale and retail . . . . . . 1,860,641 2,139,905 — 1,034,905 134,094 91,861 5,261,406Finance and insurance . . . . . 1,606,729 326,398 5,005 563,726 2,981 15,098 2,519,937Real estate and goods rental
and leasing . . . . . . . . . . . 3,272,649 2,839,783 89,650 1,237,810 162,963 126,737 7,729,592Services . . . . . . . . . . . . . . . . 1,013,361 1,868,702 635,642 862,864 155,969 96,042 4,632,580Municipalities . . . . . . . . . . . — — 1,132,713 130,356 — 15,941 1,279,010Lease financing . . . . . . . . . . — — — 2,090,725 — 20,786 2,111,511Consumer(1) . . . . . . . . . . . . . — 295 — 18,307,660 3,693 257,583 18,569,231Others . . . . . . . . . . . . . . . . . 18,184 2,172,201 164,974 428,406 279,419 7,355 3,070,539
Total domestic . . . . . . 14,165,099 13,801,143 2,142,701 27,208,698 1,096,791 822,983 59,237,415
G 1-3 G 4-6 — Other G 7 Other Total
Foreign:Public sector . . . . . . . . . . . . 99,933 11,657 — 50,475 — 1,572 163,637Financial institutions . . . . . . 2,356,086 138,722 — 905,457 2,901 21,262 3,424,428Commerce and industry . . . 11,366,457 1,885,847 — 2,625,543 252,163 101,470 16,231,480Lease financing . . . . . . . . . . — — — 247,002 — 11,669 258,671Others . . . . . . . . . . . . . . . . . 623,492 92,168 — 215,036 210 9,162 940,068
Total foreign . . . . . . . . 14,445,968 2,128,394 — 4,043,513 255,274 145,135 21,018,284
Total . . . . . . . . . . ¥28,611,067 ¥15,929,537 ¥2,142,701 ¥31,252,211 ¥1,352,065 ¥ 968,118 ¥80,255,699
(1) The balance in the grade category of “Other” in Consumer includes housing loans, which amounted to ¥14,060,554 million and¥99,978 million for the borrower category of Normal and Requiring Caution, respectively.
F-110

Loans and advances past due but not impaired
The SMFG Group assesses the credit quality of loans and advances taking into account past due informationon a borrower basis, and does not comprehensively collate the data related to the age analysis of loans andadvances that were past due but not impaired on an individual basis. The aggregate balances of loans andadvances of borrowers with one or more facilities, where any of the facilities are past due for less than threemonths but not impaired as at March 31, 2015 and 2014 were ¥196,804 million and ¥201,904 million,respectively. Those aggregate balances therefore include individual loans and advances which are not past due.Thus, in the tables below, the SMFG Group provides the amount of loans and advances where the final paymentat contractual maturity is past due, by geography and by industry, at March 31, 2015 and 2014. For reference,since all the loans and advances that are past due over three months are treated as impaired, those loans andadvances are not included in the tables below.
At March 31, 2015
Past due up to1 month
Past due1-2 months
Past due2-3 months Total
(In millions)
Domestic:Manufacturing . . . . . . . . . . . . . . . . . . . . . . . . . . . . . . . . . . . ¥ 1,617 ¥ 41 ¥ 56 ¥ 1,714Agriculture, forestry, fisheries and mining . . . . . . . . . . . . . 13 — 20 33Construction . . . . . . . . . . . . . . . . . . . . . . . . . . . . . . . . . . . . 630 118 74 822Transportation, communications and public enterprises . . . 480 42 9 531Wholesale and retail . . . . . . . . . . . . . . . . . . . . . . . . . . . . . . 4,262 351 138 4,751Finance and insurance . . . . . . . . . . . . . . . . . . . . . . . . . . . . . 597 73 1,957 2,627Real estate and goods rental and leasing . . . . . . . . . . . . . . . 679 49 248 976Services . . . . . . . . . . . . . . . . . . . . . . . . . . . . . . . . . . . . . . . . 1,771 234 140 2,145Lease financing . . . . . . . . . . . . . . . . . . . . . . . . . . . . . . . . . . 359 19 92 470Consumer . . . . . . . . . . . . . . . . . . . . . . . . . . . . . . . . . . . . . . 43,124 19,926 16,890 79,940Others . . . . . . . . . . . . . . . . . . . . . . . . . . . . . . . . . . . . . . . . . 4 13 1 18
Total domestic . . . . . . . . . . . . . . . . . . . . . . . . . . . . . . . 53,536 20,866 19,625 94,027
Foreign:Public sector . . . . . . . . . . . . . . . . . . . . . . . . . . . . . . . . . . . . — — — —Financial institutions . . . . . . . . . . . . . . . . . . . . . . . . . . . . . . 1,266 1,058 32,911 35,235Commerce and industry . . . . . . . . . . . . . . . . . . . . . . . . . . . 7,428 4,538 21,289 33,255Others . . . . . . . . . . . . . . . . . . . . . . . . . . . . . . . . . . . . . . . . . 3,620 1,112 270 5,002
Total foreign . . . . . . . . . . . . . . . . . . . . . . . . . . . . . . . . 12,314 6,708 54,470 73,492
Total . . . . . . . . . . . . . . . . . . . . . . . . . . . . . . . . . . ¥ 65,850 ¥ 27,574 ¥ 74,095 ¥ 167,519
F-111

At March 31, 2014
Past due up to1 month
Past due1-2 months
Past due2-3 months Total
(In millions)
Domestic:Manufacturing . . . . . . . . . . . . . . . . . . . . . . . . . . . . . . . . . . . . ¥ 2,150 ¥ 221 ¥ 87 ¥ 2,458Agriculture, forestry, fisheries and mining . . . . . . . . . . . . . . — — 22 22Construction . . . . . . . . . . . . . . . . . . . . . . . . . . . . . . . . . . . . . 1,077 212 112 1,401Transportation, communications and public enterprises . . . . 599 112 98 809Wholesale and retail . . . . . . . . . . . . . . . . . . . . . . . . . . . . . . . 9,957 366 252 10,575Finance and insurance . . . . . . . . . . . . . . . . . . . . . . . . . . . . . . 3,447 34 543 4,024Real estate and goods rental and leasing . . . . . . . . . . . . . . . . 1,239 642 135 2,016Services . . . . . . . . . . . . . . . . . . . . . . . . . . . . . . . . . . . . . . . . . 2,357 448 118 2,923Lease financing . . . . . . . . . . . . . . . . . . . . . . . . . . . . . . . . . . . 794 35 29 858Consumer . . . . . . . . . . . . . . . . . . . . . . . . . . . . . . . . . . . . . . . . 54,827 16,348 10,629 81,804Others . . . . . . . . . . . . . . . . . . . . . . . . . . . . . . . . . . . . . . . . . . 127 2 1 130
Total domestic . . . . . . . . . . . . . . . . . . . . . . . . . . . . . . . . 76,574 18,420 12,026 107,020
Foreign:Public sector . . . . . . . . . . . . . . . . . . . . . . . . . . . . . . . . . . . . . — — 34 34Financial institutions . . . . . . . . . . . . . . . . . . . . . . . . . . . . . . . 13,180 119 10,108 23,407Commerce and industry . . . . . . . . . . . . . . . . . . . . . . . . . . . . . 22,504 8,028 3,969 34,501Others . . . . . . . . . . . . . . . . . . . . . . . . . . . . . . . . . . . . . . . . . . 2,298 632 261 3,191
Total foreign . . . . . . . . . . . . . . . . . . . . . . . . . . . . . . . . . 37,982 8,779 14,372 61,133
Total . . . . . . . . . . . . . . . . . . . . . . . . . . . . . . . . . . . . ¥ 114,556 ¥ 27,199 ¥ 26,398 ¥ 168,153
F-112

Impaired loans and advances
The following table shows the impaired loans and advances, by geography and by industry, at March 31,2015 and 2014.
At March 31,
2015 2014
(In millions)
Domestic:Manufacturing . . . . . . . . . . . . . . . . . . . . . . . . . . . . . . . . . . . . . . . . . . . . . . . . . . . . . . . . . ¥ 167,108 ¥ 216,159Agriculture, forestry, fisheries and mining . . . . . . . . . . . . . . . . . . . . . . . . . . . . . . . . . . . 7,146 3,258Construction . . . . . . . . . . . . . . . . . . . . . . . . . . . . . . . . . . . . . . . . . . . . . . . . . . . . . . . . . . 43,161 80,077Transportation, communications and public enterprises . . . . . . . . . . . . . . . . . . . . . . . . . 59,984 66,536Wholesale and retail . . . . . . . . . . . . . . . . . . . . . . . . . . . . . . . . . . . . . . . . . . . . . . . . . . . . 184,534 233,589Finance and insurance . . . . . . . . . . . . . . . . . . . . . . . . . . . . . . . . . . . . . . . . . . . . . . . . . . . 9,558 13,386Real estate and goods rental and leasing . . . . . . . . . . . . . . . . . . . . . . . . . . . . . . . . . . . . . 227,159 385,392Services . . . . . . . . . . . . . . . . . . . . . . . . . . . . . . . . . . . . . . . . . . . . . . . . . . . . . . . . . . . . . . 183,021 220,033Lease financing . . . . . . . . . . . . . . . . . . . . . . . . . . . . . . . . . . . . . . . . . . . . . . . . . . . . . . . . 18,638 21,391Consumer . . . . . . . . . . . . . . . . . . . . . . . . . . . . . . . . . . . . . . . . . . . . . . . . . . . . . . . . . . . . 400,498 435,206Others . . . . . . . . . . . . . . . . . . . . . . . . . . . . . . . . . . . . . . . . . . . . . . . . . . . . . . . . . . . . . . . 65,999 88,769
Total domestic . . . . . . . . . . . . . . . . . . . . . . . . . . . . . . . . . . . . . . . . . . . . . . . . . . . . . 1,366,806 1,763,796
Foreign:Public sector . . . . . . . . . . . . . . . . . . . . . . . . . . . . . . . . . . . . . . . . . . . . . . . . . . . . . . . . . . 14 14Financial institutions . . . . . . . . . . . . . . . . . . . . . . . . . . . . . . . . . . . . . . . . . . . . . . . . . . . . 20,415 2,647Commerce and industry . . . . . . . . . . . . . . . . . . . . . . . . . . . . . . . . . . . . . . . . . . . . . . . . . 195,645 169,066Lease financing . . . . . . . . . . . . . . . . . . . . . . . . . . . . . . . . . . . . . . . . . . . . . . . . . . . . . . . . 9,070 8,723Others . . . . . . . . . . . . . . . . . . . . . . . . . . . . . . . . . . . . . . . . . . . . . . . . . . . . . . . . . . . . . . . 6,152 4,567
Total foreign . . . . . . . . . . . . . . . . . . . . . . . . . . . . . . . . . . . . . . . . . . . . . . . . . . . . . . 231,296 185,017
Total impaired loans and advances before allowance for loan losses . . . . . . . . . . . . . . . 1,598,102 1,948,813
Less: Allowance for loan losses for impaired loans and advances . . . . . . . . . . . . . . . . . (699,207) (857,095)
Net impaired loans and advances . . . . . . . . . . . . . . . . . . . . . . . . . . . . . . . . . . . . . . ¥ 898,895 ¥1,091,718
Renegotiated loans and advances
The following table shows loans and advances at March 31, 2015 and 2014 that would otherwise be past dueor impaired, but whose terms have been renegotiated without providing any financial concessions. These loansand advances are mainly classified as requiring caution in the table of “Loans and advances neither past due norimpaired” in the section “Loans and advances by credit quality category.”
The SMFG Group continually assesses the creditworthiness of a borrower for whom terms of the loans andadvances have been renegotiated, taking into account the actual state of the borrower’s financial position andqualitative factors. Further details are described in “Credit risk evaluation” in the section “Credit riskmanagement methods.” Loans and advances whose terms have been renegotiated and financial concessions havebeen provided are reported as impaired and included in the table of “Impaired loans and advances” in the section“Loans and advances by credit quality category.”
At March 31,
2015 2014
(In millions)
Renegotiated loans and advances . . . . . . . . . . . . . . . . . . . . . . . . . . . . . . . . . . . . . . . . . . . . . ¥664,973 ¥793,165
F-113
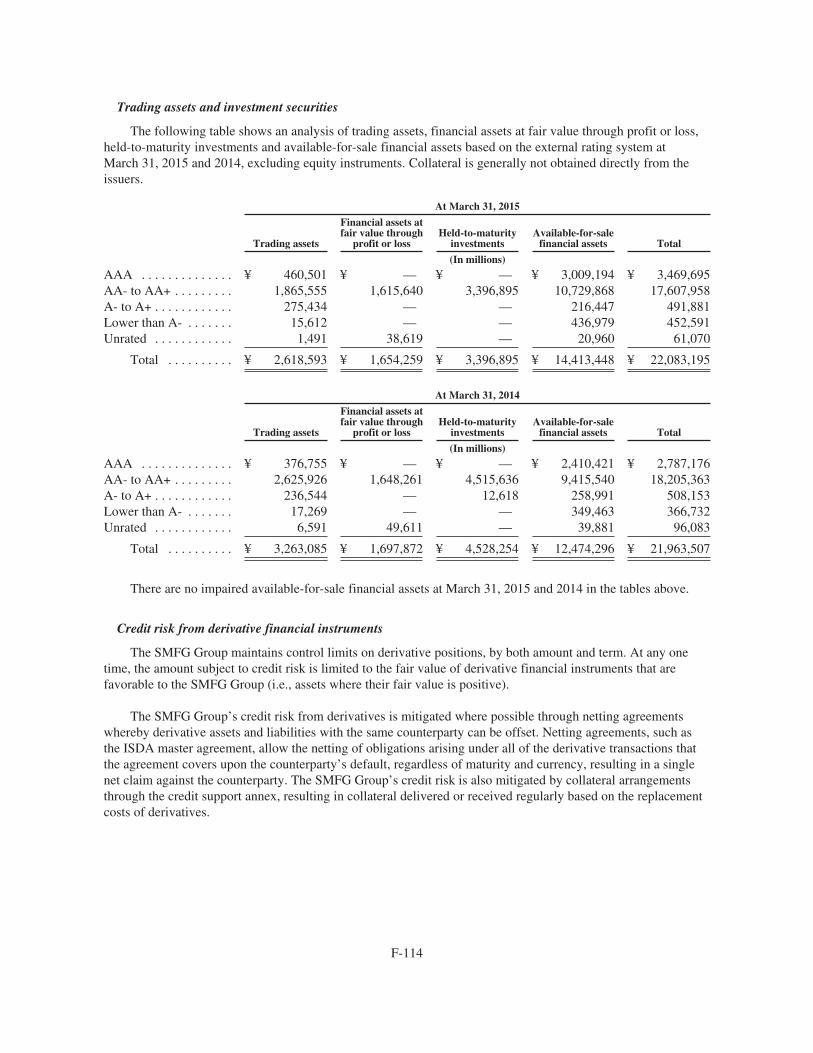
Trading assets and investment securities
The following table shows an analysis of trading assets, financial assets at fair value through profit or loss,held-to-maturity investments and available-for-sale financial assets based on the external rating system atMarch 31, 2015 and 2014, excluding equity instruments. Collateral is generally not obtained directly from theissuers.
At March 31, 2015
Trading assets
Financial assets atfair value through
profit or lossHeld-to-maturity
investmentsAvailable-for-sale
financial assets Total
(In millions)
AAA . . . . . . . . . . . . . . ¥ 460,501 ¥ — ¥ — ¥ 3,009,194 ¥ 3,469,695AA- to AA+ . . . . . . . . . 1,865,555 1,615,640 3,396,895 10,729,868 17,607,958A- to A+ . . . . . . . . . . . . 275,434 — — 216,447 491,881Lower than A- . . . . . . . 15,612 — — 436,979 452,591Unrated . . . . . . . . . . . . 1,491 38,619 — 20,960 61,070
Total . . . . . . . . . . ¥ 2,618,593 ¥ 1,654,259 ¥ 3,396,895 ¥ 14,413,448 ¥ 22,083,195
At March 31, 2014
Trading assets
Financial assets atfair value through
profit or lossHeld-to-maturity
investmentsAvailable-for-sale
financial assets Total
(In millions)
AAA . . . . . . . . . . . . . . ¥ 376,755 ¥ — ¥ — ¥ 2,410,421 ¥ 2,787,176AA- to AA+ . . . . . . . . . 2,625,926 1,648,261 4,515,636 9,415,540 18,205,363A- to A+ . . . . . . . . . . . . 236,544 — 12,618 258,991 508,153Lower than A- . . . . . . . 17,269 — — 349,463 366,732Unrated . . . . . . . . . . . . 6,591 49,611 — 39,881 96,083
Total . . . . . . . . . . ¥ 3,263,085 ¥ 1,697,872 ¥ 4,528,254 ¥ 12,474,296 ¥ 21,963,507
There are no impaired available-for-sale financial assets at March 31, 2015 and 2014 in the tables above.
Credit risk from derivative financial instruments
The SMFG Group maintains control limits on derivative positions, by both amount and term. At any onetime, the amount subject to credit risk is limited to the fair value of derivative financial instruments that arefavorable to the SMFG Group (i.e., assets where their fair value is positive).
The SMFG Group’s credit risk from derivatives is mitigated where possible through netting agreementswhereby derivative assets and liabilities with the same counterparty can be offset. Netting agreements, such asthe ISDA master agreement, allow the netting of obligations arising under all of the derivative transactions thatthe agreement covers upon the counterparty’s default, regardless of maturity and currency, resulting in a singlenet claim against the counterparty. The SMFG Group’s credit risk is also mitigated by collateral arrangementsthrough the credit support annex, resulting in collateral delivered or received regularly based on the replacementcosts of derivatives.
F-114
Market Risk and Liquidity Risk
Market risk is the possibility that fluctuations in interest rates, foreign exchange rates, stock prices or othermarket prices will change the market value of financial products, leading to a loss. The purpose of market riskmanagement is to keep the market risk exposure to a permissible level relative to capital.
Liquidity risk is defined as the uncertainty around the ability to meet debt obligations without incurringunacceptably large losses. An example of such risk is the possible inability to meet current and future cashflow/collateral needs, both expected and unexpected. In such cases, the SMFG Group may be required to raisefunds at less than favorable rates or be unable to raise sufficient funds for settlement. The purpose of liquidityrisk management is to ensure that the SMFG Group is in a position to address its liquidity obligations throughmonitoring the liquidity gap between assets and liabilities, and maintaining highly liquid supplementary fundingresources.
On the basis of the Group-wide basic policies for risk management, the SMFG Group has a quantitativemanagement process to control market and liquidity risks on a Group-wide basis by setting allowable risk limitsby company. The SMFG Group at least annually reviews and identifies which companies primarily carry themarket and liquidity risks within the Group. The SMFG Group sets permissible levels and upper limits of risk foreach identified company in consideration of those companies’ business plans. The SMFG Group ensures thateach identified company establishes a risk management system that is appropriate to the risks it faces, and hasbuilt-in transparent risk management processes, clearly separating front office, middle office and back officeoperations, and establishing a control system of mutual checks and balances.
Framework for market and liquidity risk management
The Board of Directors authorizes important matters relating to the management of market and liquidityrisks, such as the basic policies and risk limits, which are decided by the Management Committee.
Additionally, at SMBC, the Corporate Risk Management Department manages market and liquidity risks inan integrated manner. The Corporate Risk Management Department is the planning department of the RiskManagement Unit, which is independent of the business units that directly handle market transactions, and notonly monitors the current risk situations but also reports regularly to the Management Committee and the Boardof Directors. Furthermore, SMBC’s Asset Liability Management (“ALM”) Committee meets on a monthly basisto examine reports on the state of observance of SMBC’s limits on market and liquidity risks, and to review anddiscuss SMBC’s ALM operations.
To prevent unforeseen processing errors as well as fraudulent transactions, it is important to establish asystem of checks on the business units (front office). At SMBC, both the processing departments (back office)and the administrative departments (middle office) conduct the checks. In addition, the Internal Audit Unit ofSMBC periodically performs internal audits to verify that the risk management framework is functioningproperly.
F-115

The following chart shows the market and liquidity risk management system of SMBC.
Board of Directors
Management Committee
ALM Committee
Board Member in Charge of Risk Management Unit
Policy Reporting
Back Office(Back offices of Japan and overseas branches)
Middle Office(Corporate Risk Management Dept.)
Inspection and verification of transactions Model and new products approval, Final approval, Management
Managing Dept.s
Other market-related operationsMarket operations
(Treasury Unit)Market operations
(International Banking Unit)Market operations(Group companies)
Front Office Front/Back/Middle Offices
Internal Audit Dept.
Market Risk Management Committee
SMBC’s Market Risk andLiquidity Risk Management
Corporate Auditors
Market risk management methods
The SMFG Group manages market risk from trading activities and non-trading activities, including strategicequity investment and other transactions within the risk capital limit which is determined taking into accountSMFG’s shareholders’ equity and other principal indicators of the financial position. The SMFG Group alsoestablishes an upper limit on VaR and losses within the risk capital limits.
The SMFG Group’s market risk can be divided into various factors: interest rates, foreign exchange rates,equity prices and option risks. The SMFG Group manages each of these risks by employing the VaR method aswell as supplemental indicators suitable for managing each risk, such as the basis point value (“BPV”).
VaR is the largest predicted loss that is possible given a fixed confidence interval. For example, the SMFGGroup’s VaR indicates the largest loss that is possible for a holding period of one day and a confidence intervalof 99.0%. BPV is the amount of change in assessed value as a result of a one-basis-point (0.01%) movement ininterest rates.
Value at risk
The principal SMFG Group companies’ internal VaR model makes use of historical data to preparescenarios for market fluctuations and, by conducting simulations of gains and losses on a net position basis, themodel estimates the maximum losses that may occur. The VaR calculation method the SMFG Group employs forboth trading and non-trading activities is based mainly on the following:
• the historical simulation method;
• a one-sided confidence interval of 99.0%;
• a one-day holding period (a one-year holding period for the strategic equity investment portfolio); and
• an observation period of four years (ten years for the strategic equity investment portfolio).
F-116

The relationship between the VaR calculated with the model and the actual profit and loss data isback-tested periodically. There were no significant excess losses in the back-testing results including the tradingaccounts. The back-testing results are reviewed by management, which also monitors the ongoing suitability ofthe VaR model.
The following tables show the SMFG Group’s VaR by risk category and these figures are prepared based onthe internal reporting provided to management. The SMFG Group’s material market risk exposure categoriesconsist of interest rate risk, foreign exchange risk, equities and commodities risk and others. The section headed“VaR for Trading Activity” shows VaR for instruments entered into for trading purposes and the VaR model forthe trading book includes principal consolidated subsidiaries. The section headed “VaR for Non-TradingActivity” shows VaR for instruments entered into for purposes other than trading purposes. “Strategic EquityInvestment” in the “VaR for Non-Trading Activity” section is a portfolio that consists principally of publiclytraded Japanese equities. This portfolio, like that of other financial institutions in Japan, has historically includedshares of the SMFG Group’s customers.
(a) VaR for Trading Activity
The aggregate VaR for the SMFG Group’s total trading activities at March 31, 2015 was ¥14.5 billion, anincrease from ¥9.5 billion at March 31, 2014 primarily due to an increase in the net risk exposure of equities.
Interest raterisk
Foreignexchange risk
Equities andcommodities
risk Others Total(1)
(In billions)
For the fiscal year ended March 31, 2015:SMBC Consolidated
Maximum . . . . . . . . . . . . . . . . . . . . . . . . . . ¥ 11.9 ¥ 3.6 ¥ 9.6 ¥ 1.1 ¥ 19.0Minimum . . . . . . . . . . . . . . . . . . . . . . . . . . . 4.6 0.7 3.1 0.6 8.9Daily average . . . . . . . . . . . . . . . . . . . . . . . . 6.7 1.7 5.9 0.8 13.9At March 31, 2015 . . . . . . . . . . . . . . . . . . . 6.5 1.3 5.9 1.0 13.8
SMFG ConsolidatedMaximum . . . . . . . . . . . . . . . . . . . . . . . . . . ¥ 12.5 ¥ 3.6 ¥ 9.9 ¥ 1.1 ¥ 20.2Minimum . . . . . . . . . . . . . . . . . . . . . . . . . . . 5.4 0.7 3.2 0.6 9.9Daily average . . . . . . . . . . . . . . . . . . . . . . . . 7.4 1.7 6.2 0.8 14.8At March 31, 2015 . . . . . . . . . . . . . . . . . . . 7.2 1.3 6.0 1.0 14.5
Interest raterisk
Foreignexchange risk
Equities andcommodities
risk Others Total(1)
(In billions)
For the fiscal year ended March 31, 2014:SMBC Consolidated
Maximum . . . . . . . . . . . . . . . . . . . . . . . . . . ¥ 7.7 ¥ 4.6 ¥ 19.0 ¥ 1.1 ¥ 27.9Minimum . . . . . . . . . . . . . . . . . . . . . . . . . . . 3.6 0.5 2.8 0.2 7.6Daily average . . . . . . . . . . . . . . . . . . . . . . . . 5.0 2.0 7.3 0.6 13.7At March 31, 2014 . . . . . . . . . . . . . . . . . . . 4.3 0.6 3.2 0.9 8.5
SMFG ConsolidatedMaximum . . . . . . . . . . . . . . . . . . . . . . . . . . ¥ 8.3 ¥ 4.6 ¥ 19.3 ¥ 1.1 ¥ 28.8Minimum . . . . . . . . . . . . . . . . . . . . . . . . . . . 4.2 0.5 3.0 0.2 8.2Daily average . . . . . . . . . . . . . . . . . . . . . . . . 5.7 2.0 7.5 0.6 14.6At March 31, 2014 . . . . . . . . . . . . . . . . . . . 5.2 0.6 3.3 0.9 9.5
(1) Total for “Maximum,” “Minimum,” and “Daily average” represent the maximum, minimum and daily average of the total of the tradingbook. For certain subsidiaries, the SMFG Group employs the standardized method and/or the historical simulation method for the VaRcalculation method.
F-117

(b) VaR for Non-Trading Activity
(i) Banking
The aggregate VaR for the SMFG Group’s total banking activities at March 31, 2015 was ¥39.0 billion, adecrease from ¥41.5 billion at March 31, 2014 primarily due to a decrease in the net risk exposure of equities.
Interest raterisk
Foreignexchange risk
Equities andcommodities
risk Others Total(1)
(In billions)
For the fiscal year ended March 31, 2015:SMBC Consolidated
Maximum . . . . . . . . . . . . . . . . . . . . . . . . . . ¥ 23.7 ¥ 0.0 ¥ 40.3 ¥ 0.0 ¥ 45.1Minimum . . . . . . . . . . . . . . . . . . . . . . . . . . . 13.6 0.0 28.4 0.0 35.6Daily average . . . . . . . . . . . . . . . . . . . . . . . . 18.2 0.0 33.7 0.0 40.7At March 31, 2015 . . . . . . . . . . . . . . . . . . . 16.8 0.0 31.0 0.0 37.8
SMFG ConsolidatedMaximum . . . . . . . . . . . . . . . . . . . . . . . . . . ¥ 24.6 ¥ 0.0 ¥ 40.4 ¥ 0.0 ¥ 46.1Minimum . . . . . . . . . . . . . . . . . . . . . . . . . . . 14.4 0.0 28.5 0.0 36.6Daily average . . . . . . . . . . . . . . . . . . . . . . . . 19.2 0.0 33.8 0.0 41.7At March 31, 2015 . . . . . . . . . . . . . . . . . . . 18.0 0.0 31.1 0.0 39.0
Interest raterisk
Foreignexchange risk
Equities andcommodities
risk Others Total(1)
(In billions)
For the fiscal year ended March 31, 2014:SMBC Consolidated
Maximum . . . . . . . . . . . . . . . . . . . . . . . . . . ¥ 27.9 ¥ 0.0 ¥ 39.9 ¥ 0.0 ¥ 48.0Minimum . . . . . . . . . . . . . . . . . . . . . . . . . . . 13.3 0.0 21.0 0.0 29.3Daily average . . . . . . . . . . . . . . . . . . . . . . . . 18.9 0.0 30.6 0.0 39.1At March 31, 2014 . . . . . . . . . . . . . . . . . . . 17.6 0.0 32.7 0.0 40.3
SMFG ConsolidatedMaximum . . . . . . . . . . . . . . . . . . . . . . . . . . ¥ 29.0 ¥ 0.0 ¥ 40.0 ¥ 0.0 ¥ 49.2Minimum . . . . . . . . . . . . . . . . . . . . . . . . . . . 13.9 0.0 21.0 0.0 29.9Daily average . . . . . . . . . . . . . . . . . . . . . . . . 20.0 0.0 30.6 0.0 40.2At March 31, 2014 . . . . . . . . . . . . . . . . . . . 18.6 0.0 32.8 0.0 41.5
(1) Total for “Maximum,” “Minimum,” and “Daily average” represent the maximum, minimum and daily average of the total of the bankingbook.
F-118

(ii) Strategic Equity Investment
The aggregate VaR for the SMFG Group’s strategic equity investment at March 31, 2015 was ¥1,447.7billion, an increase from ¥1,142.2 billion at March 31, 2014 primarily due to an increase in the fair value of thestrategic equity investment portfolio.
Equities risk
(In billions)
For the fiscal year ended March 31, 2015:SMBC Consolidated
Maximum . . . . . . . . . . . . . . . . . . . . . . . . . . . . . . . . . . . . . . . . . . . . . . . . . . . . . . . . . . . . . . . . . . . . ¥ 1,500.4Minimum . . . . . . . . . . . . . . . . . . . . . . . . . . . . . . . . . . . . . . . . . . . . . . . . . . . . . . . . . . . . . . . . . . . . 1,067.9Daily average . . . . . . . . . . . . . . . . . . . . . . . . . . . . . . . . . . . . . . . . . . . . . . . . . . . . . . . . . . . . . . . . . 1,261.9At March 31, 2015 . . . . . . . . . . . . . . . . . . . . . . . . . . . . . . . . . . . . . . . . . . . . . . . . . . . . . . . . . . . . . 1,400.5
SMFG ConsolidatedMaximum . . . . . . . . . . . . . . . . . . . . . . . . . . . . . . . . . . . . . . . . . . . . . . . . . . . . . . . . . . . . . . . . . . . . ¥ 1,549.1Minimum . . . . . . . . . . . . . . . . . . . . . . . . . . . . . . . . . . . . . . . . . . . . . . . . . . . . . . . . . . . . . . . . . . . . 1,105.3Daily average . . . . . . . . . . . . . . . . . . . . . . . . . . . . . . . . . . . . . . . . . . . . . . . . . . . . . . . . . . . . . . . . . 1,304.3At March 31, 2015 . . . . . . . . . . . . . . . . . . . . . . . . . . . . . . . . . . . . . . . . . . . . . . . . . . . . . . . . . . . . . 1,447.7
Equities risk
(In billions)
For the fiscal year ended March 31, 2014:SMBC Consolidated
Maximum . . . . . . . . . . . . . . . . . . . . . . . . . . . . . . . . . . . . . . . . . . . . . . . . . . . . . . . . . . . . . . . . . . . . ¥ 1,201.1Minimum . . . . . . . . . . . . . . . . . . . . . . . . . . . . . . . . . . . . . . . . . . . . . . . . . . . . . . . . . . . . . . . . . . . . 906.7Daily average . . . . . . . . . . . . . . . . . . . . . . . . . . . . . . . . . . . . . . . . . . . . . . . . . . . . . . . . . . . . . . . . . 1,075.3At March 31, 2014 . . . . . . . . . . . . . . . . . . . . . . . . . . . . . . . . . . . . . . . . . . . . . . . . . . . . . . . . . . . . . 1,103.0
SMFG ConsolidatedMaximum . . . . . . . . . . . . . . . . . . . . . . . . . . . . . . . . . . . . . . . . . . . . . . . . . . . . . . . . . . . . . . . . . . . . ¥ 1,247.0Minimum . . . . . . . . . . . . . . . . . . . . . . . . . . . . . . . . . . . . . . . . . . . . . . . . . . . . . . . . . . . . . . . . . . . . 939.5Daily average . . . . . . . . . . . . . . . . . . . . . . . . . . . . . . . . . . . . . . . . . . . . . . . . . . . . . . . . . . . . . . . . . 1,114.9At March 31, 2014 . . . . . . . . . . . . . . . . . . . . . . . . . . . . . . . . . . . . . . . . . . . . . . . . . . . . . . . . . . . . . 1,142.2
Stress tests
The market occasionally undergoes extreme fluctuations that exceed projections. Therefore, to managemarket risk, it is important to run simulations of situations that may occur only once in many years, or so-calledstress tests. To prepare for unexpected market swings, SMBC performs stress tests on a monthly basis based onvarious scenarios.
The limitations of the VaR methodology include the following:
• The use of historical data as a proxy for estimating future events may underestimate the probability ofextreme market movements. Past market movement is not necessarily a good indicator of future events;
• The use of a holding period assumes that all positions can be liquidated or hedged in that period oftime. This assumption does not fully capture the market risk arising during periods of illiquidity, whenliquidation or hedging in that period of time may not be possible;
• The use of a confidence level neither takes account of, nor makes any statement about, any losses thatmight occur beyond this level of confidence; and
• VaR does not capture all of the complex effects of the risk factors on the value of positions andportfolios and could underestimate potential losses.
F-119

Additional information for the certain risks
(a) Interest rate risk
To supplement the above limitations of VaR methodologies, the SMFG Group adopts various indices tomeasure and monitor the sensitivity of interest rates, including delta, gamma and vega risks. The SMFG Groupconsiders BPV as one of the most significant indices to manage interest rate risk. BPV is the amount of change inthe value to the banking and trading book as a result of a one-basis-point (0.01%) movement in interest rates. Theprincipal SMFG Group companies use BPV to monitor interest rate risk, not only on a net basis, but also by termto prevent the concentration of interest rate risk in a specific period. The table “Outlier ratio” presented below isone of the sensitivity analyses for interest rate risk concerning the banking book using the BPV approach. Inaddition, as previously addressed, the SMFG Group enhances the risk management methods of VaR and BPV byusing them in combination with back-testing and stress tests.
Interest rate risk substantially changes depending on the method used for recognizing the expected maturitydates of demand deposits that can be withdrawn at any time, or the method used for estimating the timing ofcancellation prior to maturity of time deposits and consumer housing loans. At SMBC, the maturity of demanddeposits that are expected to be left with the bank for a prolonged period is regarded to be, at the longest, fiveyears (2.5 years on average), and the cancellation prior to maturity of time deposits and consumer housing loansis estimated based on historical data.
• Outlier ratio
In the event the economic value of a bank declines by more than 20% of total capital as a result of interestrate shocks, that bank would fall into the category of “outlier bank,” as stipulated under Pillar 2 of the BaselCapital Accord. This ratio, known as the outlier ratio, was 1.3% for SMBC on a consolidated basis at March 31,2015, substantially below the 20% criterion. The decline in economic value based on outlier framework ofSMBC on a consolidated basis is shown in the following table.
At March 31,
2015 2014
(In billions, except percentages)
SMBC ConsolidatedTotal . . . . . . . . . . . . . . . . . . . . . . . . . . . . . . . . . . . . . . . . . . . . . . . . . . . . . . . . . . ¥ 132.6 ¥ 83.0Impact of yen interest rates . . . . . . . . . . . . . . . . . . . . . . . . . . . . . . . . . . . . . . . . . 21.2 31.1Impact of U.S. dollar interest rates . . . . . . . . . . . . . . . . . . . . . . . . . . . . . . . . . . . 57.4 25.7Impact of euro interest rates . . . . . . . . . . . . . . . . . . . . . . . . . . . . . . . . . . . . . . . . 25.5 18.6Percentage of total capital . . . . . . . . . . . . . . . . . . . . . . . . . . . . . . . . . . . . . . . . . . 1.3% 0.9%
Note: Decline in economic value is the decline of the present value of a banking portfolio after interest rate shocks (1st and 99th percentile ofobserved interest rate changes using a one-year holding period and an observation period of five years).
(b) Foreign exchange risk
The principal SMFG Group companies set risk limits for each currency to manage the concentration of theforeign currency position. The foreign exchange risk is immaterial as shown above in VaR by risk category.
(c) Strategic equity investment risk
The SMFG Group establishes limits on allowable risk for strategic equity investments and monitors theobservance of those limits to keep stock price fluctuation risk within acceptable parameters. The SMFG Grouphas been reducing its strategic equity investments, and the balance is within a permitted level, which is less than100% of the SMFG Group’s Tier 1 Capital.
F-120

Liquidity risk management methods
The SMFG Group and SMBC regard liquidity risk as one of the major risks, and the SMFG Group identifiesgroup companies which have significant liquidity risk. Each of the identified group companies, including SMBC,establishes a fundamental risk management framework. For example, SMBC manages liquidity risk based on aframework consisting of setting upper limits for “funding gaps,” maintaining highly liquid supplementaryfunding sources and establishing contingency plans.
A funding gap is defined as a maturity mismatch between a source of funds and the use of funds. SMBCactively manages this funding gap by setting limits on the size of gaps over a given time horizon and limitingreliance on short-term funding. These limits are established on both a SMBC-wide basis and individual branchbasis, taking into account cash management planning, systemic factors, and funding status, among other factors.Additionally, funding gap limits are set for individual currencies if necessary. SMBC actively monitors fundinggaps on a daily basis. Further, stress tests are regularly carried out by simulating the impact triggered, forexample, by the outflow of deposits or having difficulties in funding from money markets, in order to thoroughlycomprehend the amount required to fund when the liquidity risk is realized. Additionally, funding liquidity ismaintained by holding assets, such as U.S. government bonds, which can be immediately converted to cash, orestablishing borrowing facilities to be used as supplementary funding sources in an emergency, in order tosmoothly raise the required funds even during market disruption.
Furthermore, contingency plans are developed to respond to the liquidity risk when being realized, bycreating detailed action plans such as lowering the upper limit for the funding gap, depending on the existingsituation (i.e. normal, concerned, or critical) and the respective circumstances.
Maturity analysis of financial liabilities at March 31, 2015 and 2014
The following tables show a maturity analysis of the contractual undiscounted cash flows for financialliabilities at March 31, 2015 and 2014. The amount of interest on debt instruments is not included in the maturitytables below due to its insignificance.
At March 31, 2015
On demandNot later thanthree months
Later thanthree monthsand not laterthan one year
Later thanone year andnot later than
three years
Later thanthree years andnot later than
five yearsLater thanfive years Total
(In millions)Non-derivative financial
instruments:Deposits . . . . . . . . . . . . . . . . . . . ¥ 62,276,711 ¥ 32,080,713 ¥ 15,994,708 ¥ 3,961,005 ¥ 653,803 ¥ 847,997 ¥115,814,937Call money and bills sold . . . . . . 19,926 5,843,087 10,111 — — — 5,873,124Repurchase agreements and cash
collateral on securities lent . . . 1,458 8,818,625 — — — — 8,820,083Trading liabilities . . . . . . . . . . . . 2,193,400 — — — — — 2,193,400Borrowings . . . . . . . . . . . . . . . . . 87,714 3,577,107 3,691,319 665,327 926,245 2,166,598 11,114,310Debt securities in issue . . . . . . . . — 4,434,310 1,402,856 1,799,923 942,988 2,461,070 11,041,147Lease payable . . . . . . . . . . . . . . . — 5,614 16,291 35,407 29,340 19,389 106,041Other financial liabilities . . . . . . 1,370,975 3,315,104 203,328 20,163 15,119 95,316 5,020,005
Off balance sheet items:Loan commitments . . . . . . . . . . . 53,665,583 — — — — — 53,665,583Financial guarantee contracts . . . 7,076,536 — — — — — 7,076,536
Total non-derivativefinancial instruments . . . . ¥126,692,303 ¥ 58,074,560 ¥ 21,318,613 ¥ 6,481,825 ¥ 2,567,495 ¥5,590,370 ¥220,725,166
Derivative financial instruments . . . ¥ 6,739,787 ¥ — ¥ — ¥ — ¥ — ¥ — ¥ 6,739,787
F-121

At March 31, 2014
On demandNot later thanthree months
Later thanthree monthsand not laterthan one year
Later thanone year andnot later than
three years
Later thanthree years andnot later than
five yearsLater thanfive years Total
(In millions)Non-derivative financial
instruments:Deposits . . . . . . . . . . . . . . . . . . . ¥ 58,635,610 ¥ 27,677,012 ¥ 16,359,547 ¥ 4,264,294 ¥ 644,332 ¥ 777,013 ¥108,357,808Call money and bills sold . . . . . . 2,536 4,109,688 205 — — — 4,112,429Repurchase agreements and cash
collateral on securities lent . . . 723 7,040,352 — — — — 7,041,075Trading liabilities . . . . . . . . . . . . 1,865,243 — — — — — 1,865,243Borrowings . . . . . . . . . . . . . . . . . 80,352 1,415,383 3,521,522 909,808 446,887 1,994,568 8,368,520Debt securities in issue . . . . . . . . — 3,152,557 1,034,959 1,736,751 737,363 2,102,788 8,764,418Lease payable . . . . . . . . . . . . . . . — 5,002 15,063 31,109 22,267 24,843 98,284Other financial liabilities . . . . . . 1,477,708 3,113,458 15,268 25,233 18,605 53,512 4,703,784
Off balance sheet items:Loan commitments . . . . . . . . . . . 49,285,032 — — — — — 49,285,032Financial guarantee contracts . . . 6,396,144 — — — — — 6,396,144
Total non-derivativefinancial instruments . . . . ¥117,743,348 ¥ 46,513,452 ¥ 20,946,564 ¥ 6,967,195 ¥ 1,869,454 ¥4,952,724 ¥198,992,737
Derivative financial instruments . . . ¥ 4,980,991 ¥ — ¥ — ¥ — ¥ — ¥ — ¥ 4,980,991
Notes:1. Embedded derivatives which are separately accounted for, but presented together with the host contract in the consolidated statement of
financial position are not included in the contractual tables above as they relate to the interest cash flow of the host contract, which arealso not included in the tables above.
2. Derivative financial instruments are recorded at fair value and included in the column “On demand.” These instruments are not used forhedging under IAS 39 and the fair value represents the cash flow on demand.
Balance of loans and advances, and deposits at March 31, 2015 and 2014
The following table presents the balance of loans and advances, and deposits at March 31, 2015 and 2014.The balance of deposits, which was mainly composed of individual customer deposits at March 31, 2015 and2014, exceeded the balance of loans and advances at the same time due to the stable deposit base in Japan.
At March 31,
2015 2014
(In millions)
Loans and advances . . . . . . . . . . . . . . . . . . . . . . . . . . . . . . . . . . . . . . . . . . . . . . . . . ¥ 86,971,716 ¥ 81,244,982Deposits . . . . . . . . . . . . . . . . . . . . . . . . . . . . . . . . . . . . . . . . . . . . . . . . . . . . . . . . . . 115,833,980 108,370,494
F-122

The following table presents a breakdown of deposits by domestic and foreign offices. Domestic inter-bankmoney was classified as “Call money and bills sold” and not included in “Deposits” in the consolidated statementof financial position. Over half of domestic deposits was composed of individual customer deposits.
At March 31,
2015 2014
(In millions)
Domestic offices:Non-interest-bearing demand deposits . . . . . . . . . . . . . . . . . . . . . . . . . . . . . . ¥ 15,387,795 ¥ 14,465,654Interest-bearing demand deposits . . . . . . . . . . . . . . . . . . . . . . . . . . . . . . . . . . 40,593,134 38,652,993Deposits at notice . . . . . . . . . . . . . . . . . . . . . . . . . . . . . . . . . . . . . . . . . . . . . . 821,717 871,081Time deposits . . . . . . . . . . . . . . . . . . . . . . . . . . . . . . . . . . . . . . . . . . . . . . . . . 24,186,585 24,136,904Negotiable certificates of deposit . . . . . . . . . . . . . . . . . . . . . . . . . . . . . . . . . . 5,705,862 5,458,722Others . . . . . . . . . . . . . . . . . . . . . . . . . . . . . . . . . . . . . . . . . . . . . . . . . . . . . . . 5,736,495 4,977,829
Total domestic offices . . . . . . . . . . . . . . . . . . . . . . . . . . . . . . . . . . . . . . . 92,431,588 88,563,183
Foreign offices:Non-interest-bearing demand deposits . . . . . . . . . . . . . . . . . . . . . . . . . . . . . . 862,698 607,657Interest-bearing demand deposits . . . . . . . . . . . . . . . . . . . . . . . . . . . . . . . . . . 1,448,643 1,129,154Deposits at notice . . . . . . . . . . . . . . . . . . . . . . . . . . . . . . . . . . . . . . . . . . . . . . 7,968,300 6,499,694Time deposits . . . . . . . . . . . . . . . . . . . . . . . . . . . . . . . . . . . . . . . . . . . . . . . . . 4,897,880 3,200,421Negotiable certificates of deposit . . . . . . . . . . . . . . . . . . . . . . . . . . . . . . . . . . 8,120,036 8,254,818Others . . . . . . . . . . . . . . . . . . . . . . . . . . . . . . . . . . . . . . . . . . . . . . . . . . . . . . . 104,835 115,567
Total foreign offices . . . . . . . . . . . . . . . . . . . . . . . . . . . . . . . . . . . . . . . . 23,402,392 19,807,311
Total deposits . . . . . . . . . . . . . . . . . . . . . . . . . . . . . . . . . . . . . . . . . ¥115,833,980 ¥108,370,494
Capital Management
The SMFG Group manages its capital by taking into consideration regulatory compliance and businessdevelopment.
The SMFG Group’s capital management objectives are to maintain sufficient capital resources to meet thecapital adequacy requirements and to maintain a strong capital base to support the development of its business.
External regulatory capital requirement
The SMFG Group, SMFG and its principal banking subsidiaries in Japan rigidly abide by the capitaladequacy guidelines set by the FSA in managing its capital. Japan’s capital adequacy guidelines are based on theBasel Capital Accord, which was proposed by the Basel Committee on Banking Supervision (“BCBS”) foruniform application to all banks which have international operations in industrialized countries. Japan’s capitaladequacy guidelines may be different from those of central banks or supervisory bodies of other countriesbecause the FSA designed them to suit the Japanese banking environment. The SMFG Group’s bankingsubsidiaries outside of Japan are also subject to the local capital ratio requirements.
In December 2010, the BCBS published the new Basel III rules text to implement the Basel III framework,which sets out higher and better-quality capital, better risk coverage, the introduction of a leverage ratio as abackstop to the risk-based requirement, measures to promote the build-up of capital that can be drawn down inperiods of stress, and the introduction of two global liquidity standards. The main measures of the minimumcapital requirements in the Basel III framework began on January 1, 2013 and will be fully applied fromJanuary 1, 2019.
F-123

These capital reforms increase the minimum common equity requirement from 2% to 4.5% and requirebanks to hold a capital conservation buffer of 2.5% to withstand future periods of stress, bringing the totalcommon equity requirement to 7%. The Tier 1 capital requirement will also be increased from 4% to 6%,resulting in a total requirement of 8.5% when combined with the above-mentioned conservation buffer. The totalcapital requirement remains at the existing level of 8% but also increases to 10.5% due to the capitalconservation buffer. In addition, a countercyclical buffer within a range of 0% to 2.5% of common equity orother fully loss-absorbing capital will be implemented according to national circumstances. The Group of CentralBank Governors and Heads of Supervision also agreed on transitional arrangements for implementing the newrequirements.
To reflect the Basel III framework the FSA changed its capital adequacy guidelines. Under the FSA capitaladequacy guidelines, the new capital requirements are being phased in from March 31, 2013 through March 31,2019. On March 31, 2013, the minimum Common Equity Tier 1 capital requirement and Tier 1 capitalrequirement were raised to 3.5% and 4.5%, respectively. The minimum Common Equity Tier 1 capitalrequirement and Tier 1 capital requirement rose to 4% and 5.5%, respectively on March 31, 2014, and rose to4.5% and 6%, respectively on March 31, 2015. Meanwhile the capital conservation buffer and countercyclicalbuffer, which will be phased in from January 1, 2016 under the Basel III accord, have not yet been incorporatedinto the FSA capital adequacy guidelines.
In accordance with the changes of the FSA capital adequacy guidelines, the SMFG Group changed itsclassification of capital into three tiers, referred to as Common Equity Tier 1 capital, Additional Tier 1 capitaland Tier 2 capital as follows:
Common Equity Tier 1 capital consists primarily of capital stock, capital surplus and retained earningsrelating to common shares, and minority interests that meet the criteria for inclusion in Common Equity Tier 1capital.
Additional Tier 1 capital consists primarily of preferred securities.
Tier 2 capital consists primarily of subordinated debt securities.
The capital adequacy guidelines permit Japanese banks to choose from the standardized approach (“SA”),the foundation Internal Ratings-Based (“IRB”) approach and the advanced IRB approach for credit risk, and thebasic indicator approach (“BIA”), the standardized approach (“TSA”) and the Advanced Measurement Approach(“AMA”) for operational risk. To be eligible to adopt the foundation IRB approach or the advanced IRBapproach for credit risk, and TSA or AMA for operational risk, a Japanese bank must establish advanced riskmanagement systems and receive prior approval from the FSA.
Adopting these approved approaches, the SMFG Group sets a target minimum total capital ratio of 8.0% onthe SMFG Group’s consolidated basis, and both SMBC consolidated and nonconsolidated basis, and hascomplied with all externally imposed capital requirements throughout the period.
Failure of a Japanese bank, bank holding company or other financial institution to maintain the requiredrisk-weighted capital ratios, may result in administrative actions or sanctions imposed by the FSA.
F-124

Regulatory capital
The table below presents the SMFG Group’s total capital ratio, total capital and risk-weighted assets underJapanese GAAP at March 31, 2015 and 2014 based on the Basel III rules.
At March 31,
2015 2014
(In billions, except percentages)
Total risk-weighted capital ratio (consolidated) . . . . . . . . . . . . . . . . . . . . . . . . . . . . 16.58% 15.51%Tier 1 risk-weighted capital ratio (consolidated) . . . . . . . . . . . . . . . . . . . . . . . . . . . . 12.89% 12.19%Common Equity Tier 1 risk-weighted capital ratio (consolidated) . . . . . . . . . . . . . . 11.30% 10.63%Total capital (Common Equity Tier 1 capital + Additional Tier 1 capital + Tier 2
capital) . . . . . . . . . . . . . . . . . . . . . . . . . . . . . . . . . . . . . . . . . . . . . . . . . . . . . . . . . . ¥ 10,965.9 ¥ 9,561.4Tier 1 capital (Common Equity Tier 1 capital + Additional Tier 1 capital) . . . . . . . 8,528.6 7,514.3Common Equity Tier 1 capital . . . . . . . . . . . . . . . . . . . . . . . . . . . . . . . . . . . . . . . . . 7,476.5 6,550.8Risk-weighted assets . . . . . . . . . . . . . . . . . . . . . . . . . . . . . . . . . . . . . . . . . . . . . . . . . 66,136.8 61,623.3The amount of minimum capital requirements . . . . . . . . . . . . . . . . . . . . . . . . . . . . . 5,290.9 4,929.9
46 RELATED-PARTY TRANSACTIONS
Transactions with Related Parties
The SMFG Group considers that its related parties include subsidiaries, associates, joint ventures, keymanagement personnel and close family members of key management personnel. Any transactions between theSMFG Group and its subsidiaries meet the definition of related-party transactions. However, because thesetransactions are eliminated on consolidation, they are not disclosed as related-party transactions. Transactionsbetween the SMFG Group and its associates and joint ventures qualify as related-party transactions, and all ofthese transactions are conducted on substantially the same terms as third-party transactions.
The transaction amounts included in the accounts, in aggregate, by category of related party were asfollows:
Transactions with associates and joint ventures
At March 31,
2015 2014
(In millions)
Assets:Loans and advances . . . . . . . . . . . . . . . . . . . . . . . . . . . . . . . . . . . . . . . . . . . . . . . . . . . . . . . . ¥244,620 ¥192,460Others . . . . . . . . . . . . . . . . . . . . . . . . . . . . . . . . . . . . . . . . . . . . . . . . . . . . . . . . . . . . . . . . . . 12,954 1,855
Liabilities:Deposits . . . . . . . . . . . . . . . . . . . . . . . . . . . . . . . . . . . . . . . . . . . . . . . . . . . . . . . . . . . . . . . . . ¥161,595 ¥147,181Others . . . . . . . . . . . . . . . . . . . . . . . . . . . . . . . . . . . . . . . . . . . . . . . . . . . . . . . . . . . . . . . . . . 30,036 4,972
For the fiscal year ended March 31,
2015 2014 2013
(In millions)
Income statement:Income (interest income, and fee and commission income) . . . . . . . . . . . . . . . . ¥ 23,952 ¥ 19,608 ¥ 21,016Expense (interest expense and other expenses) . . . . . . . . . . . . . . . . . . . . . . . . . 20,322 19,124 18,415
F-125

Financial guarantees issued by the SMFG Group for its associates at March 31, 2015 and 2014 were¥42,361 million and nil, respectively.
Loan commitments to associates and joint ventures at March 31, 2015 and 2014 were ¥148,494 million and¥200,165 million, respectively.
Transactions with key management personnel and their close family members
Key management personnel are those persons having authority and responsibility for planning, directing andcontrolling the activities of the SMFG Group, directly or indirectly. The SMFG Group considers the members ofthe Board of Directors of SMFG and SMBC to constitute key management personnel for the purpose of thisdisclosure required under IAS 24 “Related Party Disclosures.”
At March 31,
2015 2014
(In millions)
Assets:Loans and advances . . . . . . . . . . . . . . . . . . . . . . . . . . . . . . . . . . . . . . . . . . . . . . . . . . . . . . . ¥ 1 ¥ —
Liabilities:Deposits . . . . . . . . . . . . . . . . . . . . . . . . . . . . . . . . . . . . . . . . . . . . . . . . . . . . . . . . . . . . . . . . ¥ 2,195 ¥ 1,782Others . . . . . . . . . . . . . . . . . . . . . . . . . . . . . . . . . . . . . . . . . . . . . . . . . . . . . . . . . . . . . . . . . . 73 73
Compensation of Key Management Personnel
The following table presents the compensation expenses of key management personnel.
For the fiscal year ended March 31,
2015 2014 2013
(In millions)
Short-term employee benefits . . . . . . . . . . . . . . . . . . . . . . . . . . . . . . . . . . . . . . . ¥ 1,463 ¥ 1,232 ¥ 1,296Share-based compensation . . . . . . . . . . . . . . . . . . . . . . . . . . . . . . . . . . . . . . . . . . 251 206 229
The details of the share-based compensation plan are described in Note 39 “Share-Based Payment.”
There were no post-employment benefits, other long-term benefits and termination benefits for the fiscalyears ended March 31, 2015, 2014 and 2013.
F-126

47 PRINCIPAL SUBSIDIARIES
Principal Subsidiaries
The SMFG Group’s principal subsidiaries at March 31, 2015 are shown in the list below. The SMFG Groupconsolidates all entities that the SMFG Group controls. The SMFG Group controls an entity when the SMFGGroup is exposed, or has rights, to variable returns from its involvement with the entity and has the ability toaffect those returns through its power over the entity.
Principal domestic subsidiaries
Company Name
Proportion ofOwnershipInterest(1)
Proportion ofVoting Rights(1) Main Business
(%) (%)
Sumitomo Mitsui Banking Corporation . . . . . . 100.0 100.0 Commercial bankingTHE MINATO BANK, LTD. . . . . . . . . . . . . . . 6.0 46.4(2) Commercial bankingKansai Urban Banking Corporation . . . . . . . . . 59.8 60.1 Commercial bankingSMBC Trust Bank Ltd. . . . . . . . . . . . . . . . . . . . 100.0 100.0 Trust bankingSMBC Guarantee Co., Ltd. . . . . . . . . . . . . . . . . 100.0 100.0 Credit guaranteeSumitomo Mitsui Finance and Leasing
Company, Limited . . . . . . . . . . . . . . . . . . . . . 60.0 60.0 LeasingSMBC Nikko Securities Inc. . . . . . . . . . . . . . . . 100.0 100.0 SecuritiesSMBC Friend Securities Co., Ltd. . . . . . . . . . . . 100.0 100.0 SecuritiesSumitomo Mitsui Card Company, Limited . . . . 65.9 65.9 Credit cardCedyna Financial Corporation . . . . . . . . . . . . . . 100.0 100.0 Credit card and consumer creditSMBC Consumer Finance Co., Ltd. . . . . . . . . . 100.0 100.0 Consumer lendingSAKURA CARD CO., LTD. . . . . . . . . . . . . . . . 100.0 100.0 Credit cardMobit Co., LTD. . . . . . . . . . . . . . . . . . . . . . . . . 100.0 100.0 Consumer lendingSMM Auto Finance, Inc. . . . . . . . . . . . . . . . . . . 51.0 51.0 Automobile sales financingSMBC Finance Service Co., Ltd. . . . . . . . . . . . 100.0 100.0 Collecting agent and factoringThe Japan Research Institute, Limited . . . . . . . 100.0 100.0 System development, data
processing, managementconsulting and economicresearch
SAKURA KCS Corporation . . . . . . . . . . . . . . . 50.2 50.2 System engineering and dataprocessing
Financial Link Co., Ltd. . . . . . . . . . . . . . . . . . . . 100.0 100.0 Data processing service andconsulting
SMBC Venture Capital Co., Ltd. . . . . . . . . . . . . 40.0 40.0 Venture capitalSMBC Consulting Co., Ltd. . . . . . . . . . . . . . . . 100.0 100.0 Management consulting and
information servicesJapan Pension Navigator Co., Ltd. . . . . . . . . . . 69.7 69.7 Operational management of
defined contribution pensionplans
(1) Percentages of proportion of ownership interest and proportion of voting rights have been truncated.(2) The SMFG Group has a 6.0% direct holding in THE MINATO BANK, LTD., and can control a further 40.4% of the voting rights held
by SMBC’s retirement benefit trust under contractual agreements between SMBC and the retirement benefit trust.
F-127
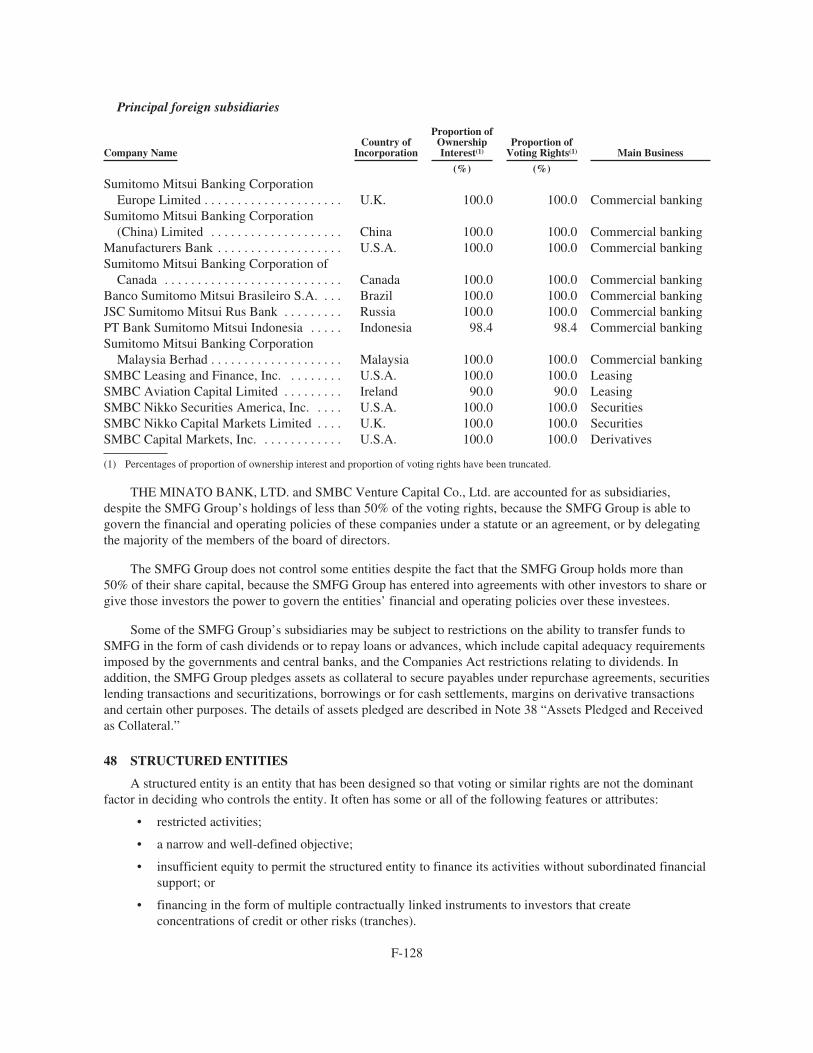
Principal foreign subsidiaries
Company NameCountry of
Incorporation
Proportion ofOwnershipInterest(1)
Proportion ofVoting Rights(1) Main Business
(%) (%)
Sumitomo Mitsui Banking CorporationEurope Limited . . . . . . . . . . . . . . . . . . . . . U.K. 100.0 100.0 Commercial banking
Sumitomo Mitsui Banking Corporation(China) Limited . . . . . . . . . . . . . . . . . . . . China 100.0 100.0 Commercial banking
Manufacturers Bank . . . . . . . . . . . . . . . . . . . U.S.A. 100.0 100.0 Commercial bankingSumitomo Mitsui Banking Corporation of
Canada . . . . . . . . . . . . . . . . . . . . . . . . . . . Canada 100.0 100.0 Commercial bankingBanco Sumitomo Mitsui Brasileiro S.A. . . . Brazil 100.0 100.0 Commercial bankingJSC Sumitomo Mitsui Rus Bank . . . . . . . . . Russia 100.0 100.0 Commercial bankingPT Bank Sumitomo Mitsui Indonesia . . . . . Indonesia 98.4 98.4 Commercial bankingSumitomo Mitsui Banking Corporation
Malaysia Berhad . . . . . . . . . . . . . . . . . . . . Malaysia 100.0 100.0 Commercial bankingSMBC Leasing and Finance, Inc. . . . . . . . . U.S.A. 100.0 100.0 LeasingSMBC Aviation Capital Limited . . . . . . . . . Ireland 90.0 90.0 LeasingSMBC Nikko Securities America, Inc. . . . . U.S.A. 100.0 100.0 SecuritiesSMBC Nikko Capital Markets Limited . . . . U.K. 100.0 100.0 SecuritiesSMBC Capital Markets, Inc. . . . . . . . . . . . . U.S.A. 100.0 100.0 Derivatives
(1) Percentages of proportion of ownership interest and proportion of voting rights have been truncated.
THE MINATO BANK, LTD. and SMBC Venture Capital Co., Ltd. are accounted for as subsidiaries,despite the SMFG Group’s holdings of less than 50% of the voting rights, because the SMFG Group is able togovern the financial and operating policies of these companies under a statute or an agreement, or by delegatingthe majority of the members of the board of directors.
The SMFG Group does not control some entities despite the fact that the SMFG Group holds more than50% of their share capital, because the SMFG Group has entered into agreements with other investors to share orgive those investors the power to govern the entities’ financial and operating policies over these investees.
Some of the SMFG Group’s subsidiaries may be subject to restrictions on the ability to transfer funds toSMFG in the form of cash dividends or to repay loans or advances, which include capital adequacy requirementsimposed by the governments and central banks, and the Companies Act restrictions relating to dividends. Inaddition, the SMFG Group pledges assets as collateral to secure payables under repurchase agreements, securitieslending transactions and securitizations, borrowings or for cash settlements, margins on derivative transactionsand certain other purposes. The details of assets pledged are described in Note 38 “Assets Pledged and Receivedas Collateral.”
48 STRUCTURED ENTITIES
A structured entity is an entity that has been designed so that voting or similar rights are not the dominantfactor in deciding who controls the entity. It often has some or all of the following features or attributes:
• restricted activities;
• a narrow and well-defined objective;
• insufficient equity to permit the structured entity to finance its activities without subordinated financialsupport; or
• financing in the form of multiple contractually linked instruments to investors that createconcentrations of credit or other risks (tranches).
F-128

During the normal course of business, the SMFG Group engages in numerous transactions involvingstructured entities. These structured entities are primarily used to provide the SMFG Group and its clients withefficient access to funds or investment opportunities, mainly through securitizations, investment funds andstructured finance.
Consolidated Structured Entities
Structured entities are consolidated if they are controlled by the SMFG Group in accordance with theaccounting policy as described in Note 2 “Summary of Significant Accounting Policies.”
The consolidated structured entities include asset backed commercial paper (“ABCP”) conduits whichpurchase financial assets such as trade accounts receivable and lease receivables by issuing commercial paper tothird party investors. The SMFG Group has contractual agreements to provide liquidity and credit enhancementfacilities which can be utilized by those structured entities upon their request.
At March 31, 2015 and 2014, the consolidated ABCP conduits had total assets of ¥910,023 million and¥721,996 million, respectively. The total notional amounts of the liquidity and credit enhancement facilitiesprovided by the SMFG Group to the consolidated ABCP conduits at March 31, 2015 and 2014 were¥1,101,988 million and ¥846,298 million, respectively, all of which were undrawn.
The SMFG Group did not provide any financial or other support, without having a contractual obligation todo so, to consolidated structured entities during the fiscal years ended March 31, 2015 and 2014.
Unconsolidated Structured Entities
The following tables represent the carrying amounts of the SMFG Group’s interests in unconsolidatedstructured entities recognized in its consolidated statement of financial position by line item and the maximumexposure to loss from its interests at March 31, 2015 and 2014.
At March 31, 2015
SecuritizationsInvestment
fundsStructured
finance Others Total
(In millions)
Interests in unconsolidated structuredentities recognized in:
Trading assets . . . . . . . . . . . . . . . . . ¥ — ¥ 192,057 ¥ — ¥ — ¥ 192,057Financial assets at fair value
through profit or loss . . . . . . . . . — — — 100,000 100,000Investment securities . . . . . . . . . . . 5,996 1,457,674 59,190 5,485 1,528,345Loans and advances . . . . . . . . . . . . 1,351,933 — 4,078,942 367,706 5,798,581
Total . . . . . . . . . . . . . . . . . . . . ¥ 1,357,929 ¥ 1,649,731 ¥ 4,138,132 ¥ 473,191 ¥ 7,618,983
Maximum exposure to loss frominterests in unconsolidatedstructured entities . . . . . . . . . . . . . . . ¥ 1,586,349 ¥ 1,649,731 ¥ 4,831,148 ¥ 604,315 ¥ 8,671,543
F-129

At March 31, 2014
SecuritizationsInvestment
fundsStructured
finance Others Total
(In millions)
Interests in unconsolidated structuredentities recognized in:
Trading assets . . . . . . . . . . . . . . . . . ¥ — ¥ 103,105 ¥ — ¥ — ¥ 103,105Financial assets at fair value
through profit or loss . . . . . . . . . — — — 101,030 101,030Investment securities . . . . . . . . . . . 3,421 1,053,715 60,984 5,610 1,123,730Loans and advances . . . . . . . . . . . . 779,586 — 3,643,803 294,237 4,717,626
Total . . . . . . . . . . . . . . . . . . . . ¥ 783,007 ¥ 1,156,820 ¥ 3,704,787 ¥ 400,877 ¥ 6,045,491
Maximum exposure to loss frominterests in unconsolidatedstructured entities . . . . . . . . . . . . . . . ¥ 1,010,451 ¥ 1,158,027 ¥ 4,111,431 ¥ 432,236 ¥ 6,712,145
An interest in a structured entity refers to contractual and non-contractual involvement that exposes theSMFG Group to variability of returns from the performance of the structured entity. Such interests include theholding of equity or debt instruments as well as the provision of loans, loan commitments and guarantees.Interest rate and currency derivatives that expose the SMFG Group mainly to market risk, or CDS that aredesigned to transfer risk from the SMFG Group to a structured entity are not regarded as an interest in astructured entity since they do not expose the SMFG Group to variability of returns from the performance of thestructured entity. These derivatives are therefore not included in the tables above.
The maximum exposure to loss from the SMFG Group’s interests in unconsolidated structured entitiesrepresents the maximum amount of potential loss to which the SMFG Group is exposed through its involvementwith unconsolidated structured entities. It is determined by the SMFG Group’s carrying amounts and the notionalamounts of loan commitments and guarantees, without considering the probability of loss being incurred, oreffects of collateral or other credit protection.
The SMFG Group did not provide any financial or other support, without having a contractual obligation todo so, to unconsolidated structured entities during the fiscal years ended March 31, 2015 and 2014.
Securitizations
Securitization entities are established to securitize third parties’ assets which mainly consist of auto loanreceivables, residential and commercial mortgage loans and trade accounts receivable. These entities purchasethose assets through loans or notes issued with multiple tranches. The SMFG Group provides loans and loancommitments to these entities or holds senior notes issued by them, in some cases with credit loss protectionthrough guarantees or other credit enhancements provided by the sellers.
Investment Funds
Investment funds are established for providing investment opportunities to investors by pooling money fromthem and investing mainly in equity and debt instruments based on a predetermined investment policy. TheSMFG Group has invested in a number of these funds.
Structured Finance
Project finance
In project finance, structured entities are established to raise funds for projects such as the development ofelectric power plants and transportation infrastructure and the production of natural resources. The SMFG Groupprovides loans and loan commitments, which are secured by the cash flows generated by the projects, to theseentities as part of a syndication of lenders.
F-130

Real estate finance
Real estate financing entities are established to raise funds in connection with the development andacquisition of real estate properties such as office buildings and logistics facilities. The SMFG Group providesfinancing to these structured entities mainly in the form of senior loans and loan commitments or notes, whichare secured by the entities’ assets.
Lease finance
Lease financing entities are established to purchase or build certain equipment such as a vessel or an aircraftwhich is subsequently leased to lessees to be used in their core business. The SMFG Group provides loans tothese entities, which are secured by lease receivables from the lessees and in some cases guaranteed by the equityholders.
Acquisition finance
In acquisition finance, structured entities are established by either third party companies or management oftarget companies to acquire the equity shares of the target companies. The purchase of the target companies’shares is financed by debt provided mainly by financial institutions and equity raised by the acquirer. The SMFGGroup provides loans to these entities, which are secured by the cash flows from the target companies.
Others
The SMFG Group provides financing to other types of structured entities such as third party structuredentities and repackaging vehicles to facilitate its clients’ funding requirements. The SMFG Group’s interests insuch entities consist of loans and loan commitments as well as notes issued by these entities.
Sponsored Unconsolidated Structured Entities
In addition to the unconsolidated structured entities in which the SMFG Group has an interest, the SMFGGroup also sponsors certain structured entities in which it has no interest. The SMFG Group is deemed to be asponsor of a structured entity when the SMFG Group takes a leading role in determining its purpose and designand has been providing operational support to ensure its continued operation.
The carrying amount of assets transferred to and income received from sponsored unconsolidated structuredentities, where the SMFG Group did not have an interest at the end of the reporting periods, were not significantfor the fiscal years ended March 31, 2015 and 2014.
49 ACQUISITIONS
Fiscal Years Ended March 31, 2015 and 2014
There were no material acquisitions that were accounted for as business combinations during the fiscal yearsended March 31, 2015 and 2014.
Fiscal Year Ended March 31, 2013
SMBC Aviation Capital
On June 1, 2012, the SMFG Group acquired the aircraft leasing business of The Royal Bank of ScotlandGroup plc, and commenced its operation as SMBC Aviation Capital, in order to further expand and develop thebusiness in Asia and other emerging markets together with the existing aircraft leasing unit which was intendedto be integrated into the acquired business.
F-131

As a result of the acquisition of this business, which comprises companies including SMBC AviationCapital Limited (former RBS Aerospace Limited), SMBC Aviation Capital (UK) Limited (former RBSAerospace (UK) Limited), and SMBC Aviation Capital Australia Leasing Pty Limited (former RBS AustraliaLeasing Pty Limited), the SMFG Group obtained 90%, 90%, and 100% of the voting rights of these respectivecompanies. With regard to SMBC Aviation Capital Australia Leasing Pty Limited, the SMFG Group obtained thevoting rights through the newly established subsidiaries of which the SMFG Group has 90% voting rights.
The fair values of assets and liabilities of SMBC Aviation Capital at the date of acquisition and theconsideration paid were as follows:
At June 1, 2012
(In millions)
Assets:Property, plant and equipment . . . . . . . . . . . . . . . . . . . . . . . . . . . . . . . . . . . . . . . . . . . . . . . . . . . . . . ¥ 568,480All other assets . . . . . . . . . . . . . . . . . . . . . . . . . . . . . . . . . . . . . . . . . . . . . . . . . . . . . . . . . . . . . . . . . . 99,611
Total assets . . . . . . . . . . . . . . . . . . . . . . . . . . . . . . . . . . . . . . . . . . . . . . . . . . . . . . . . . . . . . . . . . . . . . ¥ 668,091
Liabilities:Borrowings . . . . . . . . . . . . . . . . . . . . . . . . . . . . . . . . . . . . . . . . . . . . . . . . . . . . . . . . . . . . . . . . . . . . . ¥ 535,272All other liabilities . . . . . . . . . . . . . . . . . . . . . . . . . . . . . . . . . . . . . . . . . . . . . . . . . . . . . . . . . . . . . . . 36,105
Total liabilities . . . . . . . . . . . . . . . . . . . . . . . . . . . . . . . . . . . . . . . . . . . . . . . . . . . . . . . . . . . . . . . . . . ¥ 571,377
Net assets . . . . . . . . . . . . . . . . . . . . . . . . . . . . . . . . . . . . . . . . . . . . . . . . . . . . . . . . . . . . . . . . . . . . . . ¥ 96,714Non-controlling interests measured at their proportionate share of the identifiable net assets . . . . . (9,453)
Net assets acquired . . . . . . . . . . . . . . . . . . . . . . . . . . . . . . . . . . . . . . . . . . . . . . . . . . . . . . . . . . . . . . . 87,261Goodwill . . . . . . . . . . . . . . . . . . . . . . . . . . . . . . . . . . . . . . . . . . . . . . . . . . . . . . . . . . . . . . . . . . . . . . . 6,064
Consideration . . . . . . . . . . . . . . . . . . . . . . . . . . . . . . . . . . . . . . . . . . . . . . . . . . . . . . . . . . . . . . . . . . . ¥ 93,325
Consideration:Cash . . . . . . . . . . . . . . . . . . . . . . . . . . . . . . . . . . . . . . . . . . . . . . . . . . . . . . . . . . . . . . . . . . . . . . . . . . ¥ 93,325
Total . . . . . . . . . . . . . . . . . . . . . . . . . . . . . . . . . . . . . . . . . . . . . . . . . . . . . . . . . . . . . . . . . . . . . . . . . . ¥ 93,325
Acquisition related costs recognized as an expense in “General and administrative expenses” inthe consolidated income statement . . . . . . . . . . . . . . . . . . . . . . . . . . . . . . . . . . . . . . . . . . . . . . . . ¥ 1,420
The goodwill was attributable to the profitability of the acquired business and the synergies expected toarise after the acquisition. None of the goodwill recognized is expected to be deductible for income tax purposes.
Net profit of SMBC Aviation Capital since the acquisition date to March 31, 2013 was ¥3,172 million.
Pro forma financial information
It is estimated that the SMFG Group would have reported total operating income of ¥2,904,052 million andnet profit of ¥655,715 million for the fiscal year ended March 31, 2013 if the acquisition of SMBC AviationCapital had occurred on April 1, 2012.
F-132

Cash consideration paid and cash acquired by obtaining control of the subsidiaries
The total amount of cash consideration paid and cash acquired by obtaining control of subsidiaries duringthe fiscal year ended March 31, 2013 were as follows:
For the fiscal year endedMarch 31, 2013
(In millions)
Cash consideration paid . . . . . . . . . . . . . . . . . . . . . . . . . . . . . . . . . . . . . . . . . . . . . . . . . . . . . ¥ (94,852)Cash and cash equivalents transferred as a result of the acquisitions . . . . . . . . . . . . . . . . . . 93,903
Cash consideration paid, net of cash and cash equivalents acquired by obtainingcontrol of the subsidiaries . . . . . . . . . . . . . . . . . . . . . . . . . . . . . . . . . . . . . . . . . . . . . ¥ (949)
The amounts of assets and liabilities other than cash or cash equivalents in these subsidiaries were¥605,510 million and ¥597,838 million, respectively.
50 CURRENT AND NON-CURRENT DISTINCTION
The following tables present an analysis of financial assets and liabilities, excluding cash and deposits withbanks, trading assets and liabilities, and derivative financial instruments, by amounts recovered or settled, notmore than twelve months or more than twelve months, at March 31, 2015 and 2014.
At March 31, 2015
Amounts recovered or settled
Not more thantwelve months
More thantwelve months Total
(In millions)
Assets:Call loans and bills bought . . . . . . . . . . . . . . . . . . . . . . . . . . . . . . ¥ 1,272,267 ¥ 54,698 ¥ 1,326,965Reverse repurchase agreements and cash collateral on securities
borrowed . . . . . . . . . . . . . . . . . . . . . . . . . . . . . . . . . . . . . . . . . . 7,096,618 121,880 7,218,498Financial assets at fair value through profit or loss . . . . . . . . . . . . — 1,785,684 1,785,684Investment securities:
Held-to-maturity investments . . . . . . . . . . . . . . . . . . . . . . . . 1,393,712 2,003,183 3,396,895Available-for-sale financial assets . . . . . . . . . . . . . . . . . . . . 3,759,843 17,082,918 20,842,761
Loans and advances . . . . . . . . . . . . . . . . . . . . . . . . . . . . . . . . . . . . 29,400,474 57,571,242 86,971,716Other financial assets . . . . . . . . . . . . . . . . . . . . . . . . . . . . . . . . . . 2,434,897 130,828 2,565,725
Liabilities:Deposits . . . . . . . . . . . . . . . . . . . . . . . . . . . . . . . . . . . . . . . . . . . . . ¥110,352,284 ¥ 5,481,696 ¥115,833,980Call money and bills sold . . . . . . . . . . . . . . . . . . . . . . . . . . . . . . . 5,873,124 — 5,873,124Repurchase agreements and cash collateral on securities lent . . . 8,820,083 — 8,820,083Borrowings . . . . . . . . . . . . . . . . . . . . . . . . . . . . . . . . . . . . . . . . . . 7,377,283 3,839,769 11,217,052Debt securities in issue . . . . . . . . . . . . . . . . . . . . . . . . . . . . . . . . . 5,837,235 5,214,196 11,051,431Other financial liabilities . . . . . . . . . . . . . . . . . . . . . . . . . . . . . . . . 4,889,407 130,598 5,020,005
F-133

At March 31, 2014
Amounts recovered or settled
Not more thantwelve months
More thantwelve months Total
(In millions)
Assets:Call loans and bills bought . . . . . . . . . . . . . . . . . . . . . . . . . . . . . . ¥ 1,189,457 ¥ 58,778 ¥ 1,248,235Reverse repurchase agreements and cash collateral on securities
borrowed . . . . . . . . . . . . . . . . . . . . . . . . . . . . . . . . . . . . . . . . . . 4,087,075 216,046 4,303,121Financial assets at fair value through profit or loss . . . . . . . . . . . . — 1,840,255 1,840,255Investment securities:
Held-to-maturity investments . . . . . . . . . . . . . . . . . . . . . . . . 1,105,160 3,423,094 4,528,254Available-for-sale financial assets . . . . . . . . . . . . . . . . . . . . 5,146,067 12,378,677 17,524,744
Loans and advances . . . . . . . . . . . . . . . . . . . . . . . . . . . . . . . . . . . . 26,922,999 54,321,983 81,244,982Other financial assets . . . . . . . . . . . . . . . . . . . . . . . . . . . . . . . . . . 1,862,837 132,687 1,995,524
Liabilities:Deposits . . . . . . . . . . . . . . . . . . . . . . . . . . . . . . . . . . . . . . . . . . . . . ¥102,672,615 ¥ 5,697,879 ¥108,370,494Call money and bills sold . . . . . . . . . . . . . . . . . . . . . . . . . . . . . . . 4,112,429 — 4,112,429Repurchase agreements and cash collateral on securities lent . . . 7,041,075 — 7,041,075Borrowings . . . . . . . . . . . . . . . . . . . . . . . . . . . . . . . . . . . . . . . . . . 5,036,607 3,426,756 8,463,363Debt securities in issue . . . . . . . . . . . . . . . . . . . . . . . . . . . . . . . . . 4,187,806 4,581,288 8,769,094Other financial liabilities . . . . . . . . . . . . . . . . . . . . . . . . . . . . . . . . 4,606,434 97,350 4,703,784
51 CONDENSED FINANCIAL INFORMATION OF REGISTRANT (SMFG)
Condensed Statement of Financial Position
At March 31,
2015 2014
(In millions)
Assets:Deposits with SMBC . . . . . . . . . . . . . . . . . . . . . . . . . . . . . . . . . . . . . . . . . . . . . . . . ¥ 201,862 ¥ 79,901Investments in SMBC . . . . . . . . . . . . . . . . . . . . . . . . . . . . . . . . . . . . . . . . . . . . . . . 5,175,789 5,175,789Loans to SMBC . . . . . . . . . . . . . . . . . . . . . . . . . . . . . . . . . . . . . . . . . . . . . . . . . . . . 376,263 —Investments in other subsidiaries and associates . . . . . . . . . . . . . . . . . . . . . . . . . . 985,374 985,374Other assets . . . . . . . . . . . . . . . . . . . . . . . . . . . . . . . . . . . . . . . . . . . . . . . . . . . . . . . 7,418 2,165Current tax assets . . . . . . . . . . . . . . . . . . . . . . . . . . . . . . . . . . . . . . . . . . . . . . . . . . 102,967 42,245
Total assets . . . . . . . . . . . . . . . . . . . . . . . . . . . . . . . . . . . . . . . . . . . . . . . . . . . ¥6,849,673 ¥6,285,474
Liabilities and equity:Short-term borrowings from SMBC . . . . . . . . . . . . . . . . . . . . . . . . . . . . . . . . . . . . ¥1,228,030 ¥1,228,030Long-term borrowings . . . . . . . . . . . . . . . . . . . . . . . . . . . . . . . . . . . . . . . . . . . . . . . 31,000 —Debt securities in issue due to other subsidiaries . . . . . . . . . . . . . . . . . . . . . . . . . . 267,974 392,900Debt securities in issue . . . . . . . . . . . . . . . . . . . . . . . . . . . . . . . . . . . . . . . . . . . . . . 343,989 —Other liabilities . . . . . . . . . . . . . . . . . . . . . . . . . . . . . . . . . . . . . . . . . . . . . . . . . . . . 9,223 5,104
Total liabilities . . . . . . . . . . . . . . . . . . . . . . . . . . . . . . . . . . . . . . . . . . . . . . . . 1,880,216 1,626,034
Shareholders’ equity . . . . . . . . . . . . . . . . . . . . . . . . . . . . . . . . . . . . . . . . . . . . . . . . 4,969,457 4,659,440
Total liabilities and shareholders’ equity . . . . . . . . . . . . . . . . . . . . . . . . . . . . ¥6,849,673 ¥6,285,474
F-134

Condensed Income Statement
For the fiscal year ended March 31,
2015 2014 2013
(In millions)Income:
Interest income from SMBC(1) . . . . . . . . . . . . . . . . . . . . . . . . . . . . . . . . . . ¥ 9,641 ¥ 46 ¥ 63Dividends from SMBC . . . . . . . . . . . . . . . . . . . . . . . . . . . . . . . . . . . . . . . . 485,449 190,397 152,148Dividends from other subsidiaries and associates . . . . . . . . . . . . . . . . . . . 18,649 16,436 13,294Fees and commission income from subsidiaries . . . . . . . . . . . . . . . . . . . . 13,800 13,476 14,120Other income(1) . . . . . . . . . . . . . . . . . . . . . . . . . . . . . . . . . . . . . . . . . . . . . . 98 96 4,473
Total income . . . . . . . . . . . . . . . . . . . . . . . . . . . . . . . . . . . . . . . . . . . . 527,637 220,451 184,098
Expense:Interest expense to SMBC . . . . . . . . . . . . . . . . . . . . . . . . . . . . . . . . . . . . . 5,895 6,171 7,362Interest expense to other subsidiaries . . . . . . . . . . . . . . . . . . . . . . . . . . . . . 16,170 16,468 16,468Interest expense . . . . . . . . . . . . . . . . . . . . . . . . . . . . . . . . . . . . . . . . . . . . . 8,886 — —Operating and other expense . . . . . . . . . . . . . . . . . . . . . . . . . . . . . . . . . . . 10,712 8,790 7,889
Total expense . . . . . . . . . . . . . . . . . . . . . . . . . . . . . . . . . . . . . . . . . . . 41,663 31,429 31,719
Profit before tax . . . . . . . . . . . . . . . . . . . . . . . . . . . . . . . . . . . . . 485,974 189,022 152,379Income tax expense . . . . . . . . . . . . . . . . . . . . . . . . . . . . . . . . . . 4 4 4
Net profit . . . . . . . . . . . . . . . . . . . . . . . . . . . . . . . . . . . . . . ¥485,970 ¥189,018 ¥152,375
(1) Prior period amounts have been reclassified to conform to the current presentation.
Condensed Statement of Cash Flows
For the fiscal year ended March 31,
2015 2014 2013
(In millions)Operating Activities:
Profit before tax . . . . . . . . . . . . . . . . . . . . . . . . . . . . . . . . . . . . . . . . . . . ¥ 485,974 ¥ 189,022 ¥ 152,379Income taxes refund (paid)—net . . . . . . . . . . . . . . . . . . . . . . . . . . . . . . (60,722) (9,146) 160Other operating activities—net . . . . . . . . . . . . . . . . . . . . . . . . . . . . . . . (641) 286 (4,160)
Net cash and cash equivalents provided by operating activities . . 424,611 180,162 148,379
Investing Activities:Loans provided to SMBC . . . . . . . . . . . . . . . . . . . . . . . . . . . . . . . . . . . . (346,268) — —Other investing activities—net . . . . . . . . . . . . . . . . . . . . . . . . . . . . . . . . (35) (191) (76)
Net cash and cash equivalents used in investing activities . . . . . . (346,303) (191) (76)
Financing Activities:Proceeds from issuance of Long-term borrowings . . . . . . . . . . . . . . . . 31,000 — —Proceeds from issuance of debt securities . . . . . . . . . . . . . . . . . . . . . . . 315,268 — —Redemption of debt securities . . . . . . . . . . . . . . . . . . . . . . . . . . . . . . . . (126,200) — —Dividends paid . . . . . . . . . . . . . . . . . . . . . . . . . . . . . . . . . . . . . . . . . . . . (176,271) (176,281) (138,694)Purchases of treasury stock and proceeds from sale of treasury
stock—net . . . . . . . . . . . . . . . . . . . . . . . . . . . . . . . . . . . . . . . . . . . . . . (144) (481) (240)
Net cash and cash equivalents provided by (used in) financingactivities . . . . . . . . . . . . . . . . . . . . . . . . . . . . . . . . . . . . . . . . . . . 43,653 (176,762) (138,934)
Net increase of cash and cash equivalents . . . . . . . . . . . . . . . . . . . 121,961 3,209 9,369Cash and cash equivalents at beginning of period . . . . . . . . . . . . . 79,901 76,692 67,323
Cash and cash equivalents at end of period . . . . . . . . . . . . . . . . . . ¥ 201,862 ¥ 79,901 ¥ 76,692
F-135

Investments in subsidiaries and associates
Investments in subsidiaries and associates are stated at cost. SMFG recognizes dividend income fromsubsidiaries and associates when its right to receive payment is established.
Investments in other subsidiaries and associates include equity investments in SMFL, SMBC FriendSecurities, SMFG Card & Credit, Inc., SMBC Consumer Finance and others at March 31, 2015 and 2014. Thesecompanies are incorporated in Japan, and the proportion of ownership interest of SMFG in these companies wasthe same as described in Note 11 “Investments in Associates and Joint Ventures,” and Note 47 “PrincipalSubsidiaries.”
Long-term obligations
SMFG had perpetual subordinated bonds of ¥267 billion outstanding to its subsidiary, SMFG PreferredCapital JPY 3 Limited, at March 31, 2015. The interest rates of these bonds are fixed until January 2020, whichrange from 4.0% to 4.5% per annum, and will be floating thereafter. SMFG Preferred Capital JPY 3 Limitedissued preferred securities to purchase these bonds.
During the fiscal year ended March 31, 2015, SMFG issued subordinated long-term borrowings amountingto ¥31 billion and subordinated bonds amounting to ¥345 billion including ¥1 billion outstanding to itssubsidiary. For additional information, refer to Note 18 “Borrowings” and Note 19 “Debt Securities in Issue.”
Guarantees
SMFG provided guarantee of ¥259 billion and ¥230 billion at March 31, 2015 and 2014, respectively, to theDeposit Protection Fund of the Association of German Banks with regard to the deposits of the SMBCDusseldorf branch.
F-136

EXHIBIT INDEX
Exhibit number Description of Exhibit
Exhibit 1.1 Articles of Incorporation of Sumitomo Mitsui Financial Group, Inc., as amended on June 26,2015 (English translation)
Exhibit 1.2 Regulations of Board of Directors of Sumitomo Mitsui Financial Group, Inc., as amended onMay 1, 2015 (English translation)
Exhibit 1.3 Share Handling Regulations of Sumitomo Mitsui Financial Group, Inc., as amended onApril 1, 2012 (English translation)*
Exhibit 2.1 Form of Deposit Agreement among the registrant, Citibank, N.A., as Depositary, and allowners and holders from time to time of American Depositary Shares issued thereunder**
Exhibit 8 List of subsidiaries of Sumitomo Mitsui Financial Group, Inc., at March 31, 2015
Exhibit 11 Code of Ethics of Sumitomo Mitsui Financial Group, Inc.***
Exhibit 12.1 CEO Certification Required by Rule 13a-14(a) (17 CFR 240.13a-14(a))
Exhibit 12.2 CFO Certification Required by Rule 13a-14(a) (17 CFR 240.13a-14(a))
Exhibit 13.1 Certification Required by Rule 13a-14(b) (17 CFR 240.13a-14(b)) and Section 1350 ofChapter 63 of Title 18 of the United States Code (18 U.S.C. 1350)
Exhibit 13.2 Certification Required by Rule 13a-14(b) (17 CFR 240.13a-14(b)) and Section 1350 ofChapter 63 of Title 18 of the United States Code (18 U.S.C. 1350)
* Incorporated by reference to our annual report on Form 20-F (File No. 001-34919) filed on July 23, 2012.** Incorporated by reference to our registration statement on Form 20-F (File No. 001-34919) filed on October 20, 2010.*** Incorporated by reference to our annual report on Form 20-F (File No. 001-34919) filed on July 29, 2011.
Exhibit 1.1
(Translation)
This document has been translated from the Japanese original for reference purposes only.
ARTICLES OF INCORPORATIONOF
KABUSHIKI KAISHA MITSUI SUMITOMO FINANSHARU GURUHPU
(SUMITOMO MITSUI FINANCIAL GROUP, INC.)
(as amended on June 26, 2015)
Chapter I. General Provisions
(Corporate Name)
Article 1.
The name of the Corporation shall be Kabushiki Kaisha Mitsui Sumitomo Finansharu Guruhpu, which, inEnglish, shall be “Sumitomo Mitsui Financial Group, Inc.”.
(Purposes)
Article 2.
The purposes of the Corporation shall be to engage in the following businesses as a bank holding company:
(1) Management of banks and other corporations which are permitted to become, or to be established as,subsidiaries under the Banking Act.
(2) Any business incidental to the business mentioned in the foregoing Item.
(Location of Head Office)
Article 3.
The head office of the Corporation shall be located in Chiyoda-ku, Tokyo.
(Governing Bodies)
Article 4.
The Corporation shall have the following governing bodies in addition to meetings of shareholders anddirectors:
(1) board of directors;
(2) corporate auditors;
(3) board of corporate auditors; and
(4) accounting auditor
(Method of Public Notice)
Article 5.
Public notices given by the Corporation shall be electronic public notices; provided, however, that if theCorporation is unable to issue an electronic public notice due to an accident or any other unavoidable reason,public notices of the Corporation shall be made by placing them in the Nihon Keizai Shimbun.
Chapter II. Shares
(Total Number of Authorized Shares)
Article 6.
The total number of shares the Corporation is authorized to issue shall be three billion five hundred sixtyfour thousand (3,000,564,000) shares.
(Total Number of Authorized Shares of Each Particular Class of Shares)
Article 7.
The total number of shares the Corporation is authorized to issue shall consist of three billion(3,000,000,000) common stocks, one hundred sixty seven thousand (167,000) type 5 preferred stocks, onehundred sixty seven thousand (167,000) type 7 preferred stocks, one hundred fifteen thousand (115,000) type 8preferred stocks and one hundred fifteen thousand (115,000) type 9 preferred stocks.
(Acquisition of Corporation’s Own Shares)
Article 8.
The Corporation may, by resolution of the board of directors, acquire its own shares through markettransactions as well as by other means pursuant to Paragraph 2 of Article 165 of the Companies Act.
(Number of Shares Constituting One Unit of Share)
Article 9.
The number of shares constituting one unit of share shall be one hundred (100) with respect to commonstocks.
(Rights with respect to Shares Constituting Less Than One Unit)
Article 10.
A shareholder may not exercise rights with respect to shares constituting less than one unit other than thosespecified in the following sections:
(1) Rights specified in each item of Paragraph 2 of Article 189 of the Companies Act;
(2) Right to make requests provided for in Paragraph 1 of Article 166 of the Companies Act;
(3) Right to receive an allotment of shares for subscription or share options for subscription in accordancewith the number of shares held by the shareholder; and
(4) Right to make a request provided for in the following article.
(Purchase of Shares Constituting Less Than One Unit)
Article 11.
A shareholder of shares constituting less than one unit may request the Corporation to sell to the shareholdersuch number of shares which will, when combined with the shares less than one unit already held by suchshareholder, constitute one unit pursuant to the Share-Handling Rules.
(Record Date)
Article 12.
1. The Corporation shall treat the shareholders entitled to vote and appearing or recorded on the register ofshareholders at the close of March 31 of each year as the shareholders entitled to exercise their rights at theordinary general meeting of shareholders to be held for the fiscal year ending on that date.
2. In addition to the foregoing Paragraph, the Corporation may, upon giving prior public notice, fix a recorddate whenever necessary.

(Share Register Agent)
Article 13.
1. The Corporation shall have a share register agent.
2. The share register agent and its place of business shall be decided by resolution of the board of directors anda public notice thereof shall be given.
3. Preparation, keeping and other administrative matters of, or relating to, the register of shareholders and theregister of share purchase warrants of the Corporation shall be entrusted to the share register agent, and theCorporation shall not handle any such matters.
(Share-Handling Rules)
Article 14.
The entry and recording on the register of shareholders and all other matters pertaining to the handling ofshares of the Corporation and the fees therefor shall be governed by the Share-Handling Rules to be enacted bythe board of directors.
CHAPTER III. Preferred Stocks
(Preferred Dividends)
Article 15.
1. In the event that the Corporation distributes dividends of surplus pursuant to Article 44 hereof, theCorporation shall distribute to the holders of preferred stocks (hereinafter referred to as the “PreferredShareholders”) or the registered pledgees of preferred stocks (hereinafter referred to as the “RegisteredPreferred Stock Pledgees”), in preference to the holders of common stocks (hereinafter referred to as the“Common Shareholders”) or the registered pledgees of common stocks (hereinafter referred to as the“Registered Common Stock Pledgees”), cash dividends of surplus in the amounts set forth below (such cashdividends being hereinafter referred to as the “Preferred Dividends”), respectively; provided, however, thatif Preferred Interim Dividends stipulated in Article 16 hereof were paid during the relevant fiscal year, theamount of such Preferred Interim Dividends shall be subtracted from the amount of Preferred Dividends.
The type 5 preferred stocks: amount not exceeding 200,000 yen per share anddetermined by resolution of the board of directors relatingto the issuance of the shares
The type 7 preferred stocks: amount not exceeding 200,000 yen per share anddetermined by resolution of the board of directors relatingto the issuance of the shares
The type 8 preferred stocks: amount not exceeding 300,000 yen per share anddetermined by resolution of the board of directors relatingto the issuance of the shares
The type 9 preferred stocks: amount not exceeding 300,000 yen per share anddetermined by resolution of the board of directors relatingto the issuance of the shares
2. If the amount of cash dividends of surplus paid to the Preferred Shareholders or the Registered PreferredStock Pledgees is less than the amount of the Preferred Dividends in any fiscal year, such deficiency shallnot be carried over for accumulation to the subsequent fiscal years.
3. The Corporation shall not pay dividends in excess of the amount of the Preferred Dividends to the PreferredShareholders or the Registered Preferred Stock Pledgees.

(Preferred Interim Dividends)
Article 16.
In the event that the Corporation pays Interim Dividends pursuant to Article 45 hereof, the Corporation shallpay to the Preferred Shareholders or the Registered Preferred Stock Pledgees, in preference to the CommonShareholders or the Registered Common Stock Pledgees, Interim Dividends (hereinafter referred to as the“Preferred Interim Dividends”) in the amount not exceeding one-half of the amount of the Preferred Dividendsper preferred stock and determined by resolution of the board of directors relating to the issuance of the shares.
(Liquidation Distributions of Residual Assets)
Article 17.
1. In the event that the Corporation makes a liquidation distribution of residual assets, the Corporation shallmake to the Preferred Shareholders or the Registered Preferred Stock Pledgees, in preference to theCommon Shareholders or the Registered Common Stock Pledgees, a distribution of 3,000,000 yen perpreferred stock.
2. Other than a distribution mentioned in the foregoing Paragraph, no liquidation distribution shall be made tothe Preferred Shareholders or the Registered Preferred Stock Pledgees.
(Provisions for Acquisition)
Article 18.
1. The Corporation may acquire a part or the whole of the type 5 preferred stocks, the type 8 preferred stocksor the type 9 preferred stocks (i) on a day as shall be determined by resolution of the board of directors,(ii) in exchange for cash payment in the amount regarded to be appropriate in light of market price, theamount of liquidation distributions of residual assets relating to such preferred stocks, etc. as shall bedetermined by resolution of the board of directors by the time such preferred stocks are first issued. In theevent that a part of such preferred stocks are acquired, the preferred stocks to be acquired shall be decidedby lottery or by proportional allotment.
2. The Corporation shall acquire the whole of the type 5 preferred stocks, the type 7 preferred stocks, thetype 8 preferred stocks and the type 9 preferred stocks without consideration or in exchange for commonstocks (i) on the day (hereinafter referred to as the “Acquisition Event Occurrence Date”) on which theevents relating to a state of non-viability under the capital adequacy requirements applicable to theCorporation (hereinafter referred to as the “State of Non-Viability”), as shall be determined by resolution ofthe board of directors by the time such preferred stocks are first issued, have occurred or (ii) on a day priorto the Acquisition Event Occurrence Date, as shall be determined by resolution of the board of directorsafter the occurrence of the State of Non-Viability. The calculation method for the number of common stocksin cases where common stocks are to be delivered in exchange for acquisition of the relevant preferredstocks and other terms of acquisition shall be reasonably determined by a resolution of the board of directorsby the time such preferred stocks are first issued, in light of the capital adequacy requirements applicable tothe Corporation, market price, the amount of liquidation distributions of residual assets relating to suchpreferred stocks, etc.
(Voting Rights)
Article 19.
No Preferred Shareholder shall have any voting rights at a general meeting of shareholders; provided that ifa proposal to pay the Preferred Dividends is not submitted to an ordinary general meeting of shareholders, or ifsuch a proposal is submitted but rejected at an ordinary general meeting of shareholders, the PreferredShareholders shall have voting rights from the time of the ordinary general meeting of shareholders to whichsuch proposal is not submitted, or from the time of conclusion of the ordinary general meeting of shareholders atwhich such proposal is rejected, as the case may be, until a resolution to pay the Preferred Dividends is made byan ordinary general meeting of shareholders.

(Consolidation or Splits of Shares; Rights to Receive Allotment of Offered Shares, etc.)
Article 20.
1. Except as otherwise provided by applicable law, no consolidation or splits of shares shall be made withrespect to preferred stocks.
2. The Corporation shall not give the Preferred Shareholders any rights to receive allotment of offered sharesor share purchase warrants with respect to offered shares.
3. The Corporation shall not allot free of charge any shares of stock or share purchase warrants to the PreferredShareholders.
(Request for Acquisition of Shares)
Article 21.
A Preferred Shareholder of the type 5 preferred stocks or the type 7 preferred stocks may request theCorporation to acquire his or her preferred stocks in exchange for common stocks. The period during which theacquisition may be requested (hereinafter referred to as the “Acquisition Request Period”) in such case shall bereasonably determined by a resolution of the board of directors by the time of the first issuance of the relevantpreferred stocks, provided that the last day of such Acquisition Request Period shall fall within twenty five(25) years after the date of issuance of the relevant preferred stocks. The number of common stocks to bedelivered in exchange for acquisition of the relevant preferred stocks shall be obtained by dividing the amount ofthe subscription price of the relevant preferred stocks by the amount fixed in a manner as reasonably determinedby a resolution of the board of directors by the time of the first issuance of the relevant preferred stocks(hereinafter referred to as the “Acquisition Rights Exercise Price”). Provided, however, that the initialAcquisition Rights Exercise Price shall be determined by reference to the amount regarded to be appropriate inlight of market price, etc., and provided further that any fraction of less than one share arising as a result ofcalculation of the number of common stocks to be delivered pursuant to the foregoing shall be treated inaccordance with the provisions of Article 167 of the Companies Act. Other terms and conditions of acquisitionshall be reasonably determined by a resolution of the board of directors by the time of the first issuance of therelevant preferred stocks.
(Mandatory Acquisition)
Article 22.
1. Any type 5 preferred stock or type 7 preferred stock with respect to which acquisition has not beenrequested during the Acquisition Request Period shall be mandatorily acquired by the Corporation, as of thedate immediately following the last day of the Acquisition Request Period (hereinafter referred to as the“Mandatory Acquisition Date”), in exchange for such number of common stocks as is obtained by dividingthe amount of subscription price per share paid for the preferred stock by the average of the daily closingprices (including quoted prices (kehai hyoji) if no closing prices are reported) per share of the Corporation’scommon stocks by regular transactions at the Tokyo Stock Exchange for the thirty (30) trading days(disregarding trading days on which no such closing prices are available) commencing on the day forty-five(45) trading days prior to the Mandatory Acquisition Date. The average price shall be calculated in yen androunded down to one decimal place and thereafter rounded to the nearest yen (0.5 being rounded upwards).Provided, however, that if such average price is less than the amount not less than five thousand yen(¥5,000) determined by resolution of the board of directors relating to the issuance of the relevant preferredstocks, then a preferred stock shall be acquired by the Corporation in exchange for such number of commonstocks as is obtained by dividing the amount of subscription price per share paid for the preferred stock bysuch amount determined by such resolution.
2. Any fraction of less than one share arising as a result of calculation of the number of common stockspursuant to the foregoing Paragraph shall be treated in accordance with the provisions of Article 234 of theCompanies Act.
(Preference Order)
Article 23.
The preference order of payment of Preferred Dividends, Preferred Interim Dividends and liquidationdistributions of residual assets for preferred stocks issued by the Corporation shall be the same among the varioustypes of preferred stocks.
Chapter IV. General Meetings of Shareholders
(Convocation)
Article 24.
1. An ordinary general meeting of shareholders shall be convened within three months after the close of eachfiscal year and an extraordinary general meeting of shareholders may be convened whenever necessary.
2. Except as otherwise provided by applicable law, a general meeting of shareholders shall be convened by thedirector-president pursuant to a resolution of the board of directors. Should the office of the director-president be vacant, or should the director-president fail or be unable to act, another of the directors shall actin his or her place in accordance with the seniority established in advance by the board of directors.
(Disclosure by Internet of Reference Documents, etc. for Shareholders Meeting and Deemed Provision)
Article 25.
In connection with convocation of a general meeting of shareholders the Corporation may deem that theinformation relating to the matters to be described or shown in the reference documents for the shareholdersmeeting, the business report, financial statements and the consolidated financial statements, is provided to theshareholders by disclosing such information by internet as provided in the relevant Ministerial Ordinance of theMinistry of Justice.
(Chairman)
Article 26.
The director-chairman or the director-president shall act as chairman at all general meetings of shareholders.Should both the director-chairman and the director-president fail or be unable to act, another of the directors shallact in their place in accordance with the seniority established in advance by the board of directors.
(Requirement for Resolutions)
Article 27.
1. Except as otherwise provided by applicable law or by these Articles of Incorporation, all resolutions at ageneral meeting of shareholders shall be adopted by a majority of all the voting rights held by theshareholders present thereat who are entitled to exercise the voting rights.
2. A resolution under Paragraph 2 of Article 309, of the Companies Act shall be adopted by two thirds or moreof the voting rights held by the shareholders present at a general meeting of shareholders, who hold at leastone third of the voting rights held by all the shareholders of the Corporation who are entitled to exercise thevoting rights.
(Exercise of Voting Rights by Proxy)
Article 28.
1. A shareholder may exercise his or her voting rights by one proxy; provided, however, that the proxy must bea shareholder entitled to vote at the relevant general meeting of shareholders of the Corporation.
2. Either a shareholder or his or her proxy shall submit a power of attorney to the Corporation.

(Shareholders’ Meeting of a Particular Class of Shares)
Article 29.
The provisions of Paragraph 2 of Article 24, Article 25, Article 26 and Article 28 hereof shall be appliedmutatis mutandis to a shareholders’ meeting of a particular class of shares.
Chapter V. Directors and Board of Directors
(Number of Directors)
Article 30.
The Corporation shall have three or more directors.
(Election)
Article 31.
1. A resolution for the election of directors shall be adopted at a general meeting of shareholders by a majorityof the voting rights held by the shareholders present at the general meeting of shareholders and who hold notless than one third of voting rights of all the shareholders who are entitled to exercise the voting rights.
2. Such resolution may not be adopted by cumulative voting.
(Term of Office)
Article 32.
The term of office of a director shall expire upon conclusion of the ordinary general meeting of shareholdersto be held for the last fiscal year ending within two years after the election of the director.
(Board of Directors)
Article 33.
1. The board of directors shall consist of all the directors of the Corporation currently in office.
2. Except as otherwise provided by applicable law, the director-chairman shall convene, and act as chairmanat, all meetings of the board of directors. Should the office of the director-chairman be vacant, or should thedirector-chairman fail or be unable to act, the director-president shall act in his or her place. Should theoffice of the director-president be vacant, or should the director-president also fail or be unable to act,another of the directors shall act as chairman in accordance with the seniority established in advance by theboard of directors.
3. Notice of a meeting of the board of directors shall be given to each director and each corporate auditor atleast three days prior to the day set for such meeting; provided, however, that in case of emergency, suchperiod of notice may be shortened.
4. Except as otherwise provided by applicable law, all resolutions of the board of directors shall be adopted ata meeting of the board of directors at which a majority of all of the directors entitled to vote at the meetingare present, by a majority of such directors present at such meeting.
5. In the event that a director made a proposal with respect to a matter to be resolved at a meeting of the boardof directors and all directors who are entitled to vote on such matter agree affirmatively in writing or byelectronic means, it shall be deemed that a resolution of a meeting of the board of directors has been madeto approve such proposal unless any corporate auditor objects to the resolution.

(Representative Directors, Titled Directors and President and Executive Officer)
Article 34.
1. The board of directors shall by its resolution elect one or more representative directors.
2. The board of directors may by its resolution appoint from among its members, one director-chairman, onedirector-president and one or more director-deputy chairmen, director-deputy presidents, senior managingdirectors and managing directors.
3. Should the office of the director-president be vacant, the board of directors may by its resolution appointone president and executive officer.
(Powers and Duties of Directors and President and Executive Officer)
Article 35.
1. The director-chairman shall preside over the board of directors.
2. The director-deputy chairmen shall assist the director-chairman.
3. The director-president or the president and executive officer shall carry out and implement resolutions of theboard of directors and shall generally supervise the entire operation of the Corporation. Should the director-president or the president and executive officer fail or be unable to act, a director-deputy president, a seniormanaging director or a managing director shall, in such order of seniority, act in his or her place.
4. The director-deputy presidents, the senior managing directors and the managing directors shall assist thedirector-president or the president and executive officer and shall carry on the day-to-day businesses of theCorporation.
(Limitation of Liability Agreement with Non-executive Directors)
Article 36.
Pursuant to Paragraph 1 of Article 427 of the Companies Act, the Corporation may conclude with a non-executive director an agreement to limit the liability of the non-executive director under Paragraph 1 ofArticle 423 of the Companies Act, provided, however, that the limit of liability under such agreement shall be thehigher of (i) the amount specified in advance which is not less than 10,000,000 yen or (ii) the amount specifiedby law.
Chapter VI. Corporate Auditors and Board of Corporate Auditors
(Number of Corporate Auditors)
Article 37.
The Corporation shall have three or more corporate auditors.
(Election)
Article 38.
A resolution for the election of corporate auditors shall be adopted at a general meeting of shareholders by amajority of the voting rights held by the shareholders who are present at the general meeting and who hold notless than one third of voting rights of all the shareholders who are entitled to exercise the voting rights.
(Effectiveness of Resolution on Election of Substitute Corporate Auditor)
Article 38-2.
A resolution for the election of a substitute corporate auditor shall be effective until the commencement ofthe ordinary general meeting of shareholders to be held for the last fiscal year ending within four years after theelection of the substitute corporate auditor, unless otherwise stipulated in the relevant resolution.
(Term of Office)
Article 39.
The term of office of a corporate auditor shall expire upon conclusion of the ordinary general meeting ofshareholders to be held for the last fiscal year ending within four years after the election of the corporate auditor.
(Board of Corporate Auditors)
Article 40.
1. The board of corporate auditors shall consist of all the corporate auditors of the Corporation currently inoffice.
2. Notice of a meeting of the board of corporate auditors shall be given to each corporate auditor at least threedays prior to the day set for such meeting; provided, however, that in case of emergency, such period ofnotice may be shortened.
3. Except as otherwise provided by applicable law, all resolutions of the board of corporate auditors shall beadopted at a meeting of the board of corporate auditors, by a majority of the corporate auditors.
(Standing Corporate Auditors)
Article 41.
The board of corporate auditors shall elect by its resolution one or more standing corporate auditors. Thestanding corporate auditor(s) shall serve on a full-time basis.
(Limitation of Liability Agreement with Corporate Auditors)
Article 42.
Pursuant to Paragraph 1 of Article 427 of the Companies Act, the Corporation may conclude with acorporate auditor an agreement to limit the liability of the corporate auditor under Paragraph 1 of Article 423 ofthe Companies Act, provided, however, that the limit of liability under such agreement shall be the higher of(i) the amount specified in advance which is not less than 10,000,000 yen or (ii) the amount specified by law.
Chapter VII. Accounts
(Fiscal Year)
Article 43.
The fiscal year of the Corporation shall commence on April 1 of each year and shall end on March 31 of thefollowing year.
(Dividends of Surplus)
Article 44.
Cash dividends of surplus shall be made by the Corporation pursuant to a resolution of a general meeting ofshareholders to the shareholders or the registered share pledgees appearing or recorded on the final register ofshareholders as of the last day of a fiscal year.
(Interim Dividends)
Article 45.
The Corporation may, by resolution of a meeting of the board of directors, distribute interim dividends tothe shareholders or the registered share pledgees appearing or recorded on the final register of shareholders at theclose of September 30 of each year.

(Period of Limitations for Dividends)
Article 46.
If any cash dividends shall remain unreceived after expiration of five years from the day on which suchdividends shall have become due and payable, the Corporation shall be relieved of its obligation to pay suchdividends.
(End)

Exhibit 1.2
(Translation)
This document has been translated from the Japanese original for reference purposes only.
Regulations of the Board of Directorsof
Sumitomo Mitsui Financial Group, Inc.
(Amended as of May 1, 2015)
(Composition)
Article 1
1. The board of directors of the corporation shall consist of all the directors of the corporation currently inoffice.
2. The corporate auditors shall attend the meeting of the board of directors and state their opinions thereatwhenever necessary.
(Authority)
Article 2
The board of directors shall make decisions by its resolution on the execution of corporation’s business andsupervise the execution of the duties of the directors and executive officers.
(Meeting of the Board of Directors)
Article 3
Regular meetings shall be held once every month and special meetings shall be held from time to timewhenever necessary; provided, however, that the board of directors may adjourn any regular meeting.
(Persons Entitled to Convene a Meeting and the Chairman)
Article 4
Except as otherwise provided by applicable law, the director-chairman shall convene, and act as chairmanat, all meetings of the board of directors. Should the office of the director-chairman be vacant, or should thedirector-chairman fail or be unable to act, the director-president shall act in his or her place. Should the director-president also fail or be unable to act, another of the representative directors shall act as chairman in accordancewith the seniority established in advance by the board of directors.
(Convocation Notice)
Article 5
Notice of a meeting of the board of directors shall be given to each director and each corporate auditor atleast three days prior to the day set for such meeting; provided, however, that in case of emergency, such periodof notice may be shortened.
(Requirement for Board Resolutions)
Article 6
1. Except as otherwise provided by applicable law, all resolutions of the board of directors shall be adopted ata meeting of the board of directors at which a majority of all of the directors entitled to vote at the meetingare present, by a majority of such directors present at such meeting.

2. In the event that a director made a proposal with respect to a matter to be resolved at a meeting of the boardof directors and all directors who are entitled to vote on such matter agree affirmatively in writing or byelectronic means, it shall be deemed that a resolution of a meeting of the board of directors has been madeto approve such proposal unless any corporate auditor objects to the resolution.
(Matters Subject to Board Resolutions)
Article 7
The board of directors shall resolve the following matters:
(1) Matters relating to convocation of a general meeting of shareholders and the proposals to be submittedthereto;
(2) Approval of the financial documents, business reports and schedules thereto;
(3) Election of representative directors;
(4) Election of directors with titles and executive officers with titles;
(5) Changes to the assignments and designation of the duties of the directors and executive officers;
(6) Election and/or removal of executive officers and other important employees;
(7) Authorization of the directors to engage in transactions competitive with those engaged in by thecorporation;
(8) Approval of transaction between the the corporation and directors, corporate auditors, or majorshareholders;
(9) Matters relating to interim dividends;
(10) Matters relating to the issuance of new shares and the corporation’s own shares;
(11) Issuance of bonds;
(12) Disposal and acquisition of important assets;
(13) Borrowing and guarantee of a large amount of money;
(14) Establishment, change, or elimination of important organizations;
(15) Establishment of a system to ensure that the execution of the directors’ duties shall conform to laws orregulations or the Articles of Incorporation and other systems necessary in order to ensure theappropriateness of the corporation’s business;
(16) Important matters relating to internal control over financial reporting;
(17) Matters relating to the establishment, amendment and repeal of any important regulations;
(18) Exercise of particularly important rights of shareholders, with respect to the corporation’s subsidiariesand direct investment companies;
(19) Matters relating to the compensation of the executive directors;
(20) Important matters relating to compliance throughout the SMFG Group;
(21) Important matters relating to risk management throughout the SMFG Group;
(22) Important matters relating to internal audits throughout the SMFG Group; and
(23) Any other matters required by laws or regulations, and matters considered important in the execution ofthe corporation’s business.
(Internal Committees)
Article 8
1. An Auditing Committee, a Risk Management Committee, a Compensation Committee and a NominatingCommittee shall be formed, consisting of some of the directors, respectively.
2. The board of directors may request each of the Committees prescribed in the preceding Paragraph to discusssome of the matters to be resolved by the board of directors and give reports thereupon.
(Matters to be Reported)
Article 9
1. The directors shall report to the board of directors on the following matters, as well as the status of theexecution of their duties:
(1) Status of operations of the SMFG Group in whole;
(2) Status of risk management throughout the SMFG Group;
(3) Results of self-assessments, depreciation and reserves;
(4) Results of important internal audits;
(5) Important matters relating to the management of subsidiaries;
(6) Status of improvement regarding the matters noticed as a result of the inspections conducted by theauthorities;
(7) Existence or occurrence of any other event that is considered to have a material effect on management;and
(8) Matters relating to strategic shareholdings.
2. Any director who has engaged in a transaction competitive with the Corporation’s business, shall report tothe board of directors on the important facts relating to such transaction.
3. If the corporation engages in a transaction with any director, corporate auditor, or major shareholder, shallreport to the board of directors on the important facts relating to such transaction.
4. If a director, a corporate auditor or an accounting auditor notifies to all the directors and corporate auditorson the matters to be reported at a meeting of the board of directors, such matters need not be reported atsuch meeting.
(Minutes)
Article 10
The proceedings at each meeting of the board of directors shall be recorded in the minutes of the meeting,and the directors and the corporate auditors present thereat shall affix their names and seals thereto.
(Amendment and Repeal)
Article 11
Any amendment or repeal of these Regulations shall be made by a resolution of the board of directors.
(End)

Exhibit 8
LIST OF SUBSIDIARIES OF SUMITOMO MITSUI FINANCIAL GROUP, INC.
List of Subsidiaries at March 31, 2015
Company Name Jurisdiction
Sumitomo Mitsui Banking Corporation JapanBanco Sumitomo Mitsui Brasileiro S.A. BrazilCedyna Financial Corporation JapanFinancial Link Co., Ltd. JapanJapan Pension Navigator Co., Ltd. JapanJSC Sumitomo Mitsui Rus Bank RussiaKansai Urban Banking Corporation JapanManufacturers Bank U.S.A.Mobit Co., LTD. JapanPT Bank Sumitomo Mitsui Indonesia IndonesiaSAKURA CARD CO., Ltd. JapanSakura Finance Asia Limited Hong KongSAKURA KCS Corporation JapanSFVI Limited British Virgin IslandsSMBC Aviation Capital Limited IrelandSMBC Capital India Private Limited IndiaSMBC Capital Markets, Inc. U.S.A.SMBC Cayman LC Limited Cayman IslandsSMBC Consulting Co., Ltd. JapanSMBC Consumer Finance Co., Ltd. JapanSMBC DIP Limited Cayman IslandsSMBC Electronic Monetary Claims Recording Co., Ltd. JapanSMBC Finance Service Co., Ltd. JapanSMBC Financial Services, Inc. U.S.A.SMBC Friend Securities Co., Ltd. JapanSMBC Guarantee Co., Ltd. JapanSMBC International Finance N.V. Netherlands AntillesSMBC Leasing and Finance, Inc. U.S.A.SMBC Loan Business Planning Co., Ltd. JapanSMBC MVI SPC Cayman IslandsSMBC Nikko Capital Markets Limited U.K.SMBC Nikko Securities America, Inc. U.S.A.SMBC Nikko Securities Inc. JapanSMBC Preferred Capital GBP 1 Limited Cayman IslandsSMBC Preferred Capital GBP 2 Limited Cayman IslandsSMBC Preferred Capital JPY 1 Limited Cayman IslandsSMBC Preferred Capital JPY 2 Limited Cayman IslandsSMBC Preferred Capital USD 1 Limited Cayman IslandsSMBC Preferred Capital USD 3 Limited Cayman IslandsSMBC Principal Finance Co., Ltd. JapanSMBC Servicer Co., Ltd. JapanSMBC Trust Bank Ltd. JapanSMBC Venture Capital Co., Ltd. JapanSMFG Card & Credit, Inc. JapanSMFG Preferred Capital GBP 1 Limited Cayman IslandsSMFG Preferred Capital GBP 2 Limited Cayman IslandsSMFG Preferred Capital JPY 1 Limited Cayman Islands

Company Name Jurisdiction
SMFG Preferred Capital JPY 2 Limited Cayman IslandsSMFG Preferred Capital JPY 3 Limited Cayman IslandsSMFG Preferred Capital USD 1 Limited Cayman IslandsSMFG Preferred Capital USD 3 Limited Cayman IslandsSMM Auto Finance, Inc. JapanSumitomo Mitsui Banking Corporation Europe Limited U.K.Sumitomo Mitsui Banking Corporation Malaysia Berhad MalaysiaSumitomo Mitsui Banking Corporation of Canada CanadaSumitomo Mitsui Banking Corporation (China) Limited ChinaSumitomo Mitsui Card Company, Limited JapanSumitomo Mitsui Finance and Leasing Company, Limited JapanSumitomo Mitsui Finance Dublin Limited IrelandThe Japan Research Institute, Limited JapanTHE MINATO BANK, LTD. Japan

Exhibit 12.1
CERTIFICATIONS PURSUANT TO SECTION 302 OF THE SARBANES-OXLEY ACT OF 2002
I, Koichi Miyata, certify that:
1. I have reviewed this annual report on Form 20-F of Sumitomo Mitsui Financial Group, Inc.;
2. Based on my knowledge, this report does not contain any untrue statement of a material fact or omit tostate a material fact necessary to make the statements made, in light of the circumstances under which suchstatements were made, not misleading with respect to the period covered by this report;
3. Based on my knowledge, the financial statements, and other financial information included in this report,fairly present in all material respects the financial condition, results of operations and cash flows of the companyas of, and for, the periods presented in this report;
4. The company’s other certifying officer(s) and I are responsible for establishing and maintainingdisclosure controls and procedures (as defined in Exchange Act Rules 13a-15(e) and 15d-15(e)) and internalcontrol over financial reporting (as defined in Exchange Act Rules 13a-15(f) and 15d-15(f)) for the company andhave:
(a) Designed such disclosure controls and procedures, or caused such disclosure controls and procedures tobe designed under our supervision, to ensure that material information relating to the company,including its consolidated subsidiaries, is made known to us by others within those entities, particularlyduring the period in which this report is being prepared;
(b) Designed such internal control over financial reporting, or caused such internal control over financialreporting to be designed under our supervision, to provide reasonable assurance regarding thereliability of financial reporting and the preparation of financial statements for external purposes inaccordance with generally accepted accounting principles;
(c) Evaluated the effectiveness of the company’s disclosure controls and procedures and presented in thisreport our conclusions about the effectiveness of the disclosure controls and procedures, as of the endof the period covered by this report based on such evaluation; and
(d) Disclosed in this report any change in the company’s internal control over financial reporting thatoccurred during the period covered by the annual report that has materially affected, or is reasonablylikely to materially affect, the company’s internal control over financial reporting; and
5. The company’s other certifying officer(s) and I have disclosed, based on our most recent evaluation ofinternal control over financial reporting, to the company’s auditors and the audit committee of the company’sboard of directors (or persons performing the equivalent functions):
(a) All significant deficiencies and material weaknesses in the design or operation of internal control overfinancial reporting which are reasonably likely to adversely affect the company’s ability to record,process, summarize and report financial information; and
(b) Any fraud, whether or not material, that involves management or other employees who have asignificant role in the company’s internal control over financial reporting.
Date: July 22, 2015
/s/ Koichi Miyata
Name: Koichi MiyataTitle: President and Representative Director

Exhibit 12.2
CERTIFICATIONS PURSUANT TO SECTION 302 OF THE SARBANES-OXLEY ACT OF 2002
I, Jun Ohta, certify that:
1. I have reviewed this annual report on Form 20-F of Sumitomo Mitsui Financial Group, Inc.;
2. Based on my knowledge, this report does not contain any untrue statement of a material fact or omit tostate a material fact necessary to make the statements made, in light of the circumstances under which suchstatements were made, not misleading with respect to the period covered by this report;
3. Based on my knowledge, the financial statements, and other financial information included in this report,fairly present in all material respects the financial condition, results of operations and cash flows of the companyas of, and for, the periods presented in this report;
4. The company’s other certifying officer(s) and I are responsible for establishing and maintainingdisclosure controls and procedures (as defined in Exchange Act Rules 13a-15(e) and 15d-15(e)) and internalcontrol over financial reporting (as defined in Exchange Act Rules 13a-15(f) and 15d-15(f)) for the company andhave:
(a) Designed such disclosure controls and procedures, or caused such disclosure controls and procedures tobe designed under our supervision, to ensure that material information relating to the company,including its consolidated subsidiaries, is made known to us by others within those entities, particularlyduring the period in which this report is being prepared;
(b) Designed such internal control over financial reporting, or caused such internal control over financialreporting to be designed under our supervision, to provide reasonable assurance regarding thereliability of financial reporting and the preparation of financial statements for external purposes inaccordance with generally accepted accounting principles;
(c) Evaluated the effectiveness of the company’s disclosure controls and procedures and presented in thisreport our conclusions about the effectiveness of the disclosure controls and procedures, as of the endof the period covered by this report based on such evaluation; and
(d) Disclosed in this report any change in the company’s internal control over financial reporting thatoccurred during the period covered by the annual report that has materially affected, or is reasonablylikely to materially affect, the company’s internal control over financial reporting; and
5. The company’s other certifying officer(s) and I have disclosed, based on our most recent evaluation ofinternal control over financial reporting, to the company’s auditors and the audit committee of the company’sboard of directors (or persons performing the equivalent functions):
(a) All significant deficiencies and material weaknesses in the design or operation of internal control overfinancial reporting which are reasonably likely to adversely affect the company’s ability to record,process, summarize and report financial information; and
(b) Any fraud, whether or not material, that involves management or other employees who have asignificant role in the company’s internal control over financial reporting.
Date: July 22, 2015
/s/ Jun Ohta
Name: Jun OhtaTitle: Director

Exhibit 13.1
CERTIFICATION PURSUANT TO SECTION 906 OF THE SARBANES-OXLEY ACT OF 2002
The certification set forth below is being submitted in connection with the annual report of SumitomoMitsui Financial Group, Inc. on Form 20-F for the year ended March 31, 2015 (the “Report”) for the purpose ofcomplying with Rule 13a-14(b) or Rule 15d-14(b) of the Securities Exchange Act of 1934 (the “Exchange Act”)and Section 1350 of Chapter 63 of Title 18 of the United States Code.
I, Koichi Miyata, President and Representative Director of Sumitomo Mitsui Financial Group, Inc., certifythat, to the best of my knowledge:
1. The Report fully complies with the requirements of Section 13(a) or 15(d) of the Exchange Act; and
2. The information contained in the Report fairly presents, in all material respects, the financial conditionand results of operations of Sumitomo Mitsui Financial Group, Inc. and its subsidiaries.
Date: July 22, 2015
/s/ Koichi Miyata
Name: Koichi MiyataTitle: President and Representative Director
Exhibit 13.2
CERTIFICATION PURSUANT TO SECTION 906 OF THE SARBANES-OXLEY ACT OF 2002
The certification set forth below is being submitted in connection with the annual report of SumitomoMitsui Financial Group, Inc. on Form 20-F for the year ended March 31, 2015 (the “Report”) for the purpose ofcomplying with Rule 13a-14(b) or Rule 15d-14(b) of the Securities Exchange Act of 1934 (the “Exchange Act”)and Section 1350 of Chapter 63 of Title 18 of the United States Code.
I, Jun Ohta, Director of Sumitomo Mitsui Financial Group, Inc., certify that, to the best of my knowledge:
1. The Report fully complies with the requirements of Section 13(a) or 15(d) of the Exchange Act; and
2. The information contained in the Report fairly presents, in all material respects, the financial conditionand results of operations of Sumitomo Mitsui Financial Group, Inc. and its subsidiaries.
Date: July 22, 2015
/s/ Jun Ohta
Name: Jun OhtaTitle: Director