washington, d.c. 20549 form 10-k - annualreports.com
TRANSCRIPT

UNITED STATESSECURITIES AND EXCHANGE COMMISSION
WASHINGTON, D.C. 20549
FORM 10-KÈ Annual Report Pursuant to Section 13 or 15(d) of the Securities Exchange Act of 1934
For the fiscal year ended December 31, 2007OR
‘ Transition Report Pursuant to Section 13 or 15(d) of the Securities Exchange Act of 1934For the transition period from to
Commission File Number 1-183Registrant, State of Incorporation, Address and Telephone Number
THE HERSHEY COMPANY(a Delaware corporation)
100 Crystal A DriveHershey, Pennsylvania 17033
(717) 534-4200I.R.S. Employer Identification Number 23-0691590
Securities registered pursuant to Section 12(b) of the Act:Title of each class: Name of each exchange on which registered:
Common Stock, one dollar par value New York Stock ExchangeSecurities registered pursuant to Section 12(g) of the Act: Class B Common Stock, one dollar par value
(Title of class)
Indicate by check mark if the registrant is a well-known seasoned issuer, as defined in Rule 405 of the SecuritiesAct. Yes È No ‘
Indicate by check mark if the registrant is not required to file reports pursuant to Section 13 or Section 15(d) of theAct. Yes ‘ No È
Indicate by check mark whether the registrant (1) has filed all reports required to be filed by Section 13 or 15(d) of theSecurities Exchange Act of 1934 during the preceding 12 months (or for such shorter period that the registrant wasrequired to file such reports), and (2) has been subject to such filing requirements for the past 90 days. Yes È No ‘
Indicate by check mark if disclosure of delinquent filers pursuant to Item 405 of Regulation S-K is not containedherein, and will not be contained, to the best of registrant’s knowledge, in definitive proxy or information statementsincorporated by reference in Part III of this Form 10-K or any amendment to this Form 10-K. È
Indicate by check mark whether the registrant is a large accelerated filer, an accelerated filer, or a non-accelerated filer.See definition of “accelerated filer and large accelerated filer” in Rule 12b-2 of the Exchange Act. (Check one)
Large accelerated filer È Accelerated filer ‘ Non-accelerated filer ‘
Indicate by check mark whether the registrant is a shell company (as defined in Rule 12b-2 of the ExchangeAct). Yes ‘ No È
State the aggregate market value of the voting and non-voting common equity held by non-affiliates computed by referenceto the price at which the common equity was last sold, or the average bid and asked price of such common equity, as of the lastbusiness day of the registrant’s most recently completed second fiscal quarter.
Common Stock, one dollar par value—$7,787,097,379 as of July 1, 2007.Class B Common Stock, one dollar par value—$10,275,759 as of July 1, 2007. While the Class B Common Stock is notlisted for public trading on any exchange or market system, shares of that class are convertible into shares of CommonStock at any time on a share-for-share basis. The market value indicated is calculated based on the closing price of theCommon Stock on the New York Stock Exchange on July 1, 2007.
Indicate the number of shares outstanding of each of the registrant’s classes of common stock as of the latest practicable date.Common Stock, one dollar par value—166,508,449 shares, as of February 12, 2008.Class B Common Stock, one dollar par value—60,805,727 shares, as of February 12, 2008.
DOCUMENTS INCORPORATED BY REFERENCEPortions of the Company’s Proxy Statement for the Company’s 2008 Annual Meeting of Stockholders are incorporated by
reference into Part III of this report.

PART I
Item 1. BUSINESS
Company Overview
The Hershey Company was incorporated under the laws of the State of Delaware on October 24, 1927 as asuccessor to a business founded in 1894 by Milton S. Hershey. In this report, the terms “Company,” “we,” “us,”or “our” mean The Hershey Company and its wholly-owned subsidiaries and entities in which it has a controllingfinancial interest, unless the context indicates otherwise.
We are the largest North American manufacturer of quality chocolate and sugar confectionery products. Ourprincipal product groups include confectionery and snack products; gum and mint refreshment products; andfood and beverage enhancers such as baking ingredients, toppings and beverages. In addition to our traditionalconfectionery products, we offer a range of products specifically developed to address the health and well-beingneeds of health-conscious consumers.
Reportable Segment
We operate as a single reportable segment in manufacturing, marketing, selling and distributing variouspackage types of chocolate candy, sugar confectionery, refreshment and snack products, and food and beverageenhancers under more than 60 brand names. Our five operating segments comprise geographic regions includingthe United States, Canada, Mexico, Brazil and other international locations, such as Japan, Korea, thePhilippines, India and China. We market confectionery products in approximately 50 countries worldwide.
For segment reporting purposes, we aggregate our operations in the Americas, which comprise the UnitedStates, Canada, Mexico and Brazil. We base this aggregation on similar economic characteristics, and similarproducts and services, production processes, types or classes of customers, distribution methods, and the similarnature of the regulatory environment in each location. We aggregate our other international operations with theAmericas to form one reportable segment. When combined, our other international operations share most of theaggregation criteria and represent less than 10% of consolidated revenues, operating profits and assets.
Selling and Marketing Organization
Our selling and marketing organization is comprised of Hershey North America, Hershey International andthe Global Marketing Group. This organization is designed to:
• Leverage our marketing and sales leadership in the United States and Canada;
• Focus on key strategic growth areas in global markets; and
• Build capabilities that capitalize on unique consumer and customer trends.
Hershey North America
Hershey North America has responsibility for continuing to build our confectionery leadership, whilecapitalizing on our scale in the U.S. and Canada. This organization leverages our ability to capitalize on theunique consumer and customer trends within each country. This includes developing and growing ourbusiness in our chocolate, sugar confectionery, snacks, refreshment, food and beverage enhancers, and foodservice product lines.
Hershey International
Hershey International markets confectionery products, and food and beverage enhancers worldwide and hasresponsibility for pursuing profitable growth opportunities in key markets, primarily in Latin America and
1

Asia. This organization is responsible for international subsidiaries that manufacture, import, market, selland distribute chocolate, confectionery and beverage products in Mexico and Brazil. Hershey Internationalmanufactures and distributes confectionery products, snacks and beverages in India through Godrej HersheyFoods and Beverages Company under an agreement entered into in May 2007 with Godrej Beverages andFoods, Ltd., one of India’s largest consumer goods, confectionery and food companies.
Global Marketing Group
Our Global Marketing Group has responsibility for building global brands, developing transformationalgrowth platforms and ensuring collaborative marketing excellence across the Company. This organizationalso develops market-specific insights, strategies and platform innovation for Hershey International, helpingto build our brands globally and drive growth in high-potential emerging markets. This organizationdevelops consumer and customer insights, new products and innovative marketing communications. TheGlobal Marketing Group is also responsible for brand positioning, portfolio strategy, pricing strategy andcorporate social responsibility.
A component of the Global Marketing Group, The Hershey Experience, manages our catalog sales and ourretail operations within the United States that include Hershey’s Chocolate World in Hershey, Pennsylvania,Hershey’s Times Square in New York, New York and Hershey’s Chicago in Chicago, Illinois.
Products
United States
The primary chocolate and confectionery products we sell in the United States include the following:
Under the HERSHEY’S brand franchise:HERSHEY’S milk chocolate bar HERSHEY’S COOKIES ‘N’ CRÈME candy barHERSHEY’S milk chocolate bar with almonds HERSHEY’S POT OF GOLD boxed chocolatesHERSHEY’S Extra Dark chocolates HERSHEY’S SUGAR FREE chocolate candyHERSHEY’S MINIATURES chocolate candy HERSHEY’S S’MORES candy barHERSHEY’S NUGGETS chocolates HERSHEY’S HUGS candiesHERSHEY’S STICKS chocolates HERSHEY’S organic chocolates
Under the REESE’S brand franchise:REESE’S peanut butter cups REESE’S SUGAR FREE peanut butter cupsREESE’S PIECES candy REESE’S crispy crunchy barREESE’S BIG CUP peanut butter cups REESE’S WHIPPS nougat barREESE’S NUTRAGEOUS candy bar REESESTICKS wafer bars
FAST BREAK candy bar
Under the KISSES brand franchise:HERSHEY’S KISSES brand milk chocolatesHERSHEY’S KISSES brand milk chocolates filledwith peanut butterHERSHEY’S KISSES brand milk chocolates withalmonds
HERSHEY’S KISSES brand milk chocolatesfilled with caramelHERSHEY’S KISSES brand chocolates filledwith chocolate truffleHERSHEY’S KISSABLES brand chocolatecandies
Our other chocolate and confectionery products in the United States include the following:
5th AVENUE candy barALMOND JOY candy barCADBURY chocolates
MILK DUDS candyMOUNDS candy barMR. GOODBAR candy bar
TAKE5 candy barTWIZZLERS candyWHATCHAMACALLITcandy bar
2
CARAMELLO candy barGOOD & PLENTY candyHEATH toffee barJOLLY RANCHER candyJOLLY RANCHER sugar freehard candyKIT KAT wafer bar
PAYDAY peanut caramel barROLO caramels in milkchocolateSKOR toffee barSPECIAL DARK chocolatebarSYMPHONY milk chocolatebarSYMPHONY milk chocolatebar with almonds and toffee
WHOPPERS malted milkballsYORK peppermint pattieYORK sugar freepeppermint pattieZAGNUT candy barZERO candy bar
We also sell products in the United States under the following product lines:
Premium products
Our line of premium chocolate and confectionery offerings includes CACAO RESERVE BY HERSHEY’Schocolate bars and drinking cocoa mixes. Artisan Confections Company, a wholly-owned subsidiary of TheHershey Company, markets SCHARFFEN BERGER high-cacao dark chocolate products, JOSEPHSCHMIDT handcrafted chocolate gifts and DAGOBA natural and organic chocolate products.
Snack products
Our snack products include HERSHEY’S SNACKSTERS snack mix; HERSHEY’S, ALMOND JOY,REESE’S, and YORK cookies; HERSHEY’S and REESE’S granola bars; and MAUNA LOA macadamia snacknuts and cookies in several varieties.
Refreshment products
Our line of refreshment products includes ICE BREAKERS mints and chewing gum, BREATH SAVERSmints, BUBBLE YUM bubble gum and YORK mints.
Food and beverage enhancers
Food and beverage enhancers include HERSHEY’S BAKE SHOPPE, HERSHEY’S, REESE’S, HEATH, andSCHARFFEN BERGER baking products. Our toppings and sundae syrups include HEATH andHERSHEY’S. We sell hot cocoa mix under the HERSHEY’S, HERSHEY’S GOODNIGHT HUGS andHERSHEY’S GOODNIGHT KISSES brand names.
Canada
Principal products we manufacture and sell in Canada are HERSHEY’S milk chocolate bars and milkchocolate bars with almonds; OH HENRY! candy bars; REESE PEANUT BUTTER CUPS candy;HERSHEY’S KISSES candy bar; KISSABLES brand chocolate candies; TWIZZLERS candy; GLOSETTEchocolate-covered raisins, peanuts and almonds; JOLLY RANCHER candy; WHOPPERS malted milk balls;SKOR toffee bars; EAT MORE candy bars; POT OF GOLD boxed chocolates; and CHIPITS chocolatechips.
Mexico
We manufacture, import, market, sell and distribute chocolate and confectionery products in Mexicoincluding HERSHEY’S, KISSES, JOLLY RANCHER, and PELÓN PELO RICO chocolate, confectionery andbeverage items.
3

Brazil
We manufacture, import and market chocolate and confectionery products in Brazil including HERSHEY’Schocolate and confectionery items and IO-IO items.
India
We manufacture, market, sell and distribute confectionery, snack and beverage products in India includingNUTRINE and GODREJ confectionery and beverage products.
Customers
Full-time sales representatives and food brokers sell our products to our customers. Our customers aremainly wholesale distributors, chain grocery stores, mass merchandisers, chain drug stores, vending companies,wholesale clubs, convenience stores, dollar stores, concessionaires, department stores and natural food stores.Our customers then resell our products to end-consumers in over 2 million retail outlets in North America andother locations worldwide. In 2007, sales to McLane Company, Inc., one of the largest wholesale distributors inthe United States to convenience stores, drug stores, wholesale clubs and mass merchandisers, amounted toapproximately 26% of our total net sales. McLane Company, Inc. is the primary distributor of our products toWal-Mart Stores, Inc.
Marketing Strategy and Seasonality
The foundation of our marketing strategy is our strong brand equities, product innovation, the consistentlysuperior quality of our products, our manufacturing expertise and mass distribution capabilities. We also devoteconsiderable resources to the identification, development, testing, manufacturing and marketing of new products.We have a variety of promotional programs for our customers as well as advertising and promotional programsfor consumers of our products. We stimulate sales of certain products with promotional programs at varioustimes throughout the year. Our sales are typically higher during the third and fourth quarters of the year,representing seasonal and holiday-related sales patterns.
Product Distribution
In conjunction with our sales and marketing efforts, our efficient product distribution network helps usmaintain sales growth and provide superior customer service. We plan optimum stock levels and work with ourcustomers to set reasonable delivery times. Our distribution network provides for the efficient shipment of ourproducts from our manufacturing plants to distribution centers strategically located throughout the United States,Canada and Mexico. We primarily use common carriers to deliver our products from these distribution points toour customers.
Price Changes
We change prices and weights of our products when necessary to accommodate changes in manufacturingcosts, the competitive environment and profit objectives, while at the same time maintaining consumer value.Price increases and weight changes help to offset increases in our input costs, including raw and packagingmaterials, fuel, utilities, transportation, and employee benefits.
In April 2007, we announced an increase of approximately four percent to five percent in the wholesaleprices of our domestic confectionery line, effective immediately. The price increase applied to our standard bar,king-size bar, 6-pack and vending lines. These products represent approximately one-third of our U.S.confectionery portfolio. This action was implemented to help partially offset increases in input costs, includingraw and packaging materials, fuel, utilities and transportation.
4
We announced a combination of price increases and weight changes on certain JOLLY RANCHER andTWIZZLERS candy and chocolate packaged candy items in November 2005. These changes went into effect inDecember 2005 and early 2006 and represented a weighted-average price increase of approximately one percentover the entire domestic product line when fully effective in the second quarter of 2006.
In December 2004, we announced an increase in the wholesale prices of approximately half of our domesticconfectionery line. Changes that were effective in January 2005 represented a weighted-average increase ofapproximately six percent on our standard bar, king-size bar, 6-pack and vending lines. Changes that wereeffective in February 2005 represented a weighted-average price increase of approximately four percent onpackaged candy. The price increases announced in December 2004 represented an average increase of threepercent over the entire domestic product line.
Raw Materials
Cocoa is the most significant raw material we use to produce our chocolate products. We buy a mix ofcocoa beans and cocoa products, including cocoa liquor, cocoa butter and cocoa powder, to meet manufacturingrequirements. Cocoa beans and cocoa products are purchased directly from third party suppliers. Cocoa beans aregrown principally in Far Eastern, West African and South American equatorial regions. West Africa accounts forapproximately 70 percent of the world’s supply of cocoa beans. Cocoa beans are not uniform, and the variousgrades and varieties reflect the diverse agricultural practices and natural conditions found in many growing areas.
Historically there have been instances of weather catastrophes, crop disease, civil disruptions, embargoesand other problems in cocoa-producing countries that have caused price fluctuations, but have never resulted intotal loss of a particular producing country’s cocoa crop and/or exports. In the event that such a disruption wouldoccur in any given country, we believe cocoa from other producing countries and from current physical cocoastocks in consuming countries would provide a significant supply buffer.
Cocoa beans are processed to produce cocoa liquor, cocoa butter and cocoa powder. Beginning in 2008, wewill predominately purchase cocoa products to meet our manufacturing requirements rather than processingcocoa beans. This change to our manufacturing process is the result of a comprehensive, supply chaintransformation program to enhance manufacturing, sourcing and customer service capabilities that we initiated in2007, along with ingredient sourcing arrangements entered into during 2007.
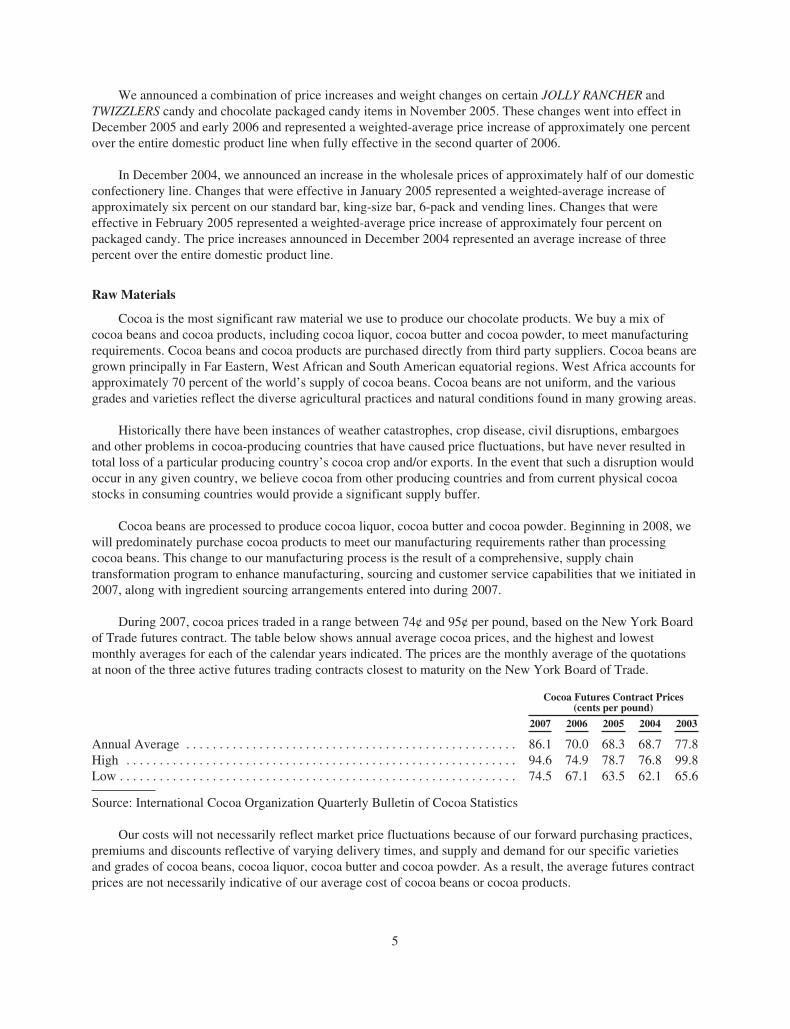
During 2007, cocoa prices traded in a range between 74¢ and 95¢ per pound, based on the New York Boardof Trade futures contract. The table below shows annual average cocoa prices, and the highest and lowestmonthly averages for each of the calendar years indicated. The prices are the monthly average of the quotationsat noon of the three active futures trading contracts closest to maturity on the New York Board of Trade.
Cocoa Futures Contract Prices(cents per pound)
2007 2006 2005 2004 2003
Annual Average . . . . . . . . . . . . . . . . . . . . . . . . . . . . . . . . . . . . . . . . . . . . . . . . . . 86.1 70.0 68.3 68.7 77.8High . . . . . . . . . . . . . . . . . . . . . . . . . . . . . . . . . . . . . . . . . . . . . . . . . . . . . . . . . . . 94.6 74.9 78.7 76.8 99.8Low . . . . . . . . . . . . . . . . . . . . . . . . . . . . . . . . . . . . . . . . . . . . . . . . . . . . . . . . . . . . 74.5 67.1 63.5 62.1 65.6
Source: International Cocoa Organization Quarterly Bulletin of Cocoa Statistics
Our costs will not necessarily reflect market price fluctuations because of our forward purchasing practices,premiums and discounts reflective of varying delivery times, and supply and demand for our specific varietiesand grades of cocoa beans, cocoa liquor, cocoa butter and cocoa powder. As a result, the average futures contractprices are not necessarily indicative of our average cost of cocoa beans or cocoa products.
5

The Farm Security and Rural Investment Act of 2002, which is a six-year farm bill, impacts the prices ofsugar, corn, peanuts and dairy products because it sets price support levels for these commodities.
During 2007, dairy prices were significantly higher, starting the year at nearly 13¢ per pound and rising to22¢ per pound on a class II fluid milk basis. Tight global supplies were driven by drought in Australia as well asreduced exports from the European Union due to the elimination of subsidies. Also, input costs for U.S.producers were up due to heightened grain prices impacting feed costs. Additionally, the United StatesDepartment of Agriculture adjusted their mechanism for establishing market prices of nonfat dry milk, furtherescalating costs.
The price of sugar is subject to price supports under U.S. farm legislation. This legislation establishesimport quotas and duties to support the price of sugar. As a result, sugar prices paid by users in the U.S. arecurrently substantially higher than prices on the world sugar market. In 2007, sugar supplies in the U.S. improveddue to larger sugar beet and sugar cane crops. As a result, refined sugar prices declined from 31¢ to 29¢ perpound. Our costs for sugar will not necessarily reflect market price fluctuations primarily because of our forwardpurchasing and hedging practices.
Peanut prices in the U.S. began the year around 42¢ per pound but gradually increased during the year to53¢ per pound due to supply tightness driven by lower planted acreage and dry conditions during the growingseason. Almond prices began the year at $2.50 per pound and declined to $2.20 per pound during the year drivenby supply increases due to a record crop which produced 19% more volume than the prior year.
We attempt to minimize the effect of future price fluctuations related to the purchase of major raw materialsand certain energy requirements primarily through forward purchasing to cover our future requirements,generally for periods from 3 to 24 months. We enter into futures contracts to manage price risks for cocoa beansand cocoa products, sugar, corn sweeteners, natural gas, fuel oil and certain dairy products. However, the dairymarkets are not as developed as many of the other commodities markets and, therefore, it is not possible to hedgeour costs for dairy products by taking forward positions to extend coverage for longer periods of time. Currently,active futures contracts are not available for use in pricing our other major raw material requirements. For moreinformation on price risks associated with our major raw material requirements, see Commodities—Price RiskManagement and Futures Contracts on page 39.
Competition
Many of our brands enjoy wide consumer acceptance and are among the leading brands sold in themarketplace. We sell our brands in a highly competitive market with many other multinational, national, regionaland local firms. Some of our competitors are much larger firms that have greater resources and more substantialinternational operations.
6

Trademarks, Service Marks and License Agreements
We own various registered and unregistered trademarks and service marks and have rights under licenses touse various trademarks that are of material importance to our business.
We have license agreements with several companies to manufacture and/or sell certain products. Our rightsunder these agreements are extendible on a long-term basis at our option. Our most significant licensingagreements are as follows:
Company Type Brand Location Requirements
Cadbury Schweppes p.l.c.and affiliates
License tomanufacture and/orsell and distributeconfectioneryproducts
YORKPETER PAUL
ALMOND JOYPETER PAUL
MOUNDS
Worldwide None
CADBURYCARAMELLO
United StatesMinimum salesrequirementexceeded in 2007
Société desProduits Nestlé SA
License tomanufacture anddistributeconfectioneryproducts
KIT KATROLO
United StatesMinimum unitvolume salesexceeded in 2007
Huhtamäki Oy affiliate
Certain trademarklicenses forconfectioneryproducts
GOOD & PLENTYHEATHJOLLY RANCHERMILK DUDSPAYDAYWHOPPERS
Worldwide None
Various dairies throughout the United States produce and sell HERSHEY’S chocolate and strawberryflavored milks under license. We also grant trademark licenses to third parties to produce and sell baking andvarious other products primarily under the HERSHEY’S and REESE’S brand names.
Backlog of Orders
We manufacture primarily for stock and fill customer orders from finished goods inventories. While at anygiven time there may be some backlog of orders, this backlog is not material in respect to our total annual sales,nor are the changes from time to time significant.
Research and Development
We engage in a variety of research and development activities. We develop new products, improve thequality of existing products, improve and modernize production processes, and develop and implement newtechnologies to enhance the quality and value of both current and proposed product lines. Information concerningour research and development expense is contained in Note 1 of the Notes to the Consolidated FinancialStatements (Item 8. Financial Statements and Supplementary Data).
7
Food Quality and Safety Regulation
The manufacture and sale of consumer food products is highly regulated. In the United States, our activitiesare subject to regulation by various government agencies, including the Food and Drug Administration, theDepartment of Agriculture, the Federal Trade Commission, the Department of Commerce and the EnvironmentalProtection Agency, as well as various state and local agencies. Similar agencies also regulate our businessesoutside of the United States.
Environmental Considerations
Investments were made in 2007 to comply with environmental laws and regulations. These investmentswere not material with respect to our capital expenditures, earnings or competitive position.
Employees
As of December 31, 2007, we employed approximately 11,000 full-time and 1,800 part-time employeesworldwide. Collective bargaining agreements covered approximately 4,200 employees for which agreementscovering approximately 25% of these employees, primarily outside of the United States, will expire during 2008.We believe that our employee relations are good.
Financial Information by Geographic Area
Our principal operations and markets are located in the United States. The percentage of total consolidatednet sales for our businesses outside of the United States was 13.8% for 2007, 10.9% for 2006 and 10.9% for2005. The percentage of total consolidated assets outside of the United States as of December 31, 2007 was16.2% and as of December 31, 2006 was 13.8%. Operating profit margins vary among individual products andproduct groups.
Available Information
We are subject to the reporting requirements of the Securities Exchange Act of 1934, as amended. We fileor furnish annual, quarterly and current reports, proxy statements and other information with the United StatesSecurities and Exchange Commission (“SEC”). You may obtain a copy of any of these reports, free of charge,from the Investor Relations section of our website, www.hersheys.com shortly after we file or furnish theinformation to the SEC.
You may also obtain a copy of any of these reports directly from the SEC. You may read and copy anymaterial we file or furnish with the SEC at their Office of Investor Education and Advocacy, located at 100 FStreet N.E., Washington, D.C. 20549. The phone number for information about the operation of the SEC Officeof Investor Education and Advocacy is 1-800-732-0330 (if you are calling from within the United States), or202-551-8090. Because we electronically file our reports, you may also obtain this information from the SECinternet website at www.sec.gov. You can obtain additional contact information for the SEC on their website.
Our Company has a Code of Ethical Business Conduct that applies to our Board of Directors, all companyofficers and employees, including, without limitation, our Chief Executive Officer and “senior financial officers”(including the Chief Financial Officer, Chief Accounting Officer and persons performing similar functions). Youcan obtain a copy of our Code of Ethical Business Conduct from the Investor Relations section of our website,www.hersheys.com. If we change or waive any portion of the Code of Ethical Business Conduct that applies toany of our directors, executive officers or senior financial officers, we will post that information on our websitewithin four business days. In the case of a waiver, such information will include the name of the person to whomthe waiver applied, along with the date and type of waiver.
8

We also post our Corporate Governance Guidelines and Charters for each of the Board’s standingcommittees in the Investor Relations section of our website, www.hersheys.com. The Board of Directors adoptedeach of these guidelines and charters. If you are a beneficial owner of Common Stock or Class B Common Stock(“Class B Stock”), we will provide you with a free copy of the Code of Ethical Business Conduct, the CorporateGovernance Guidelines or the Charter of any standing committee of the Board of Directors, upon request. Wewill also give any stockholder a copy of one or more of the Exhibits listed in Part IV of this report, upon request.We charge a small copying fee for these exhibits to cover our costs. To request a copy of any of these documents,you can contact us at—The Hershey Company, Attn: Investor Relations Department, 100 Crystal A Drive,Hershey, Pennsylvania 17033-0810.
Item 1A. RISK FACTORS
We are subject to changing economic, competitive, regulatory and technological risks and uncertaintiesbecause of the nature of our operations. In connection with the “safe harbor” provisions of the Private SecuritiesLitigation Reform Act of 1995, we note the following factors that, among others, could cause future results todiffer materially from the forward-looking statements, expectations and assumptions expressed or implied in thisreport. Many of the forward-looking statements contained in this document may be identified by the use of wordssuch as “intend,” “believe,” “expect,” “anticipate,” “should,” “planned,” “projected,” “estimated” and“potential,” among others. Among the factors that could cause our actual results to differ materially from theresults projected in our forward-looking statements are the risk factors described below.
Annual savings from initiatives to transform our supply chain and advance our value-enhancing strategy maybe less than we expect.
In February 2007, we announced a comprehensive, supply chain transformation program which includes aphased three-year plan to enhance our manufacturing, sourcing and customer service capabilities. We expectongoing annual savings from this program and previous initiatives to generate significant savings to invest in ourgrowth initiatives and to advance our value-enhancing strategy. If ongoing annual savings do not meet ourexpectations, we may not obtain the anticipated future benefits.
Increases in raw material and energy costs could affect future financial results.
We use many different commodities for our business, including cocoa beans, cocoa products, sugar, dairyproducts, peanuts, almonds, corn sweeteners, natural gas and fuel oil.
Commodities are subject to price volatility and changes in supply caused by:
• Commodity market fluctuations;
• Currency exchange rates;
• Imbalances between supply and demand;
• The effect of weather on crop yield;
• Speculative influences;
• Trade agreements among producing and consuming nations;
• Political unrest in producing countries; and
• Changes in governmental agricultural programs and energy policies.
Although we use forward contracts and commodity futures contracts, where possible, to hedge commodityprices, commodity price increases ultimately result in corresponding increases in our raw material and energycosts. If we are unable to offset cost increases for major raw materials and energy, there could be a negativeimpact on our results of operations and financial condition.
9

Price increases may not be sufficient to offset cost increases and maintain profitability.
We may be able to pass some or all raw material, energy and other input cost increases to customers byincreasing the selling prices of our products or decreasing the size of our products; however, higher productprices or decreased product size may also result in a reduction in sales volume. If we are not able to increase ourselling prices or reduce product sizes sufficiently to offset increased raw material, energy or other input costs,including packaging, direct labor, overhead and employee benefits, or if our sales volume decreases significantly,there could be a negative impact on our results of operations and financial condition.
Implementation of our supply chain transformation program may not occur within the anticipated timeframeand/or may exceed our cost estimates.
We announced a comprehensive supply chain transformation program in February 2007 which is expectedto be completed by December 2009. We estimate that this program will incur pre-tax charges and non-recurringproject implementation costs of $525 million to $575 million over the three-year period. Completion of thisprogram is subject to multiple operating and executional risks, including coordination of manufacturing changes,production line startups, cross-border legal, regulatory and political issues, and foreign currency exchange risks,among others. If we are not able to complete the program initiatives within the anticipated timeframe and withinour cost estimates, our results of operations and financial condition could be negatively impacted.
Issues related to the quality and safety of our products, ingredients or packaging could cause a product recall,resulting in harm to the Company’s reputation and negatively impacting our operating results.
In order to sell our iconic, branded products, we need to maintain a good reputation with our customers andconsumers. Issues related to quality and safety of our products, ingredients or packaging, could jeopardize ourCompany’s image and reputation. Negative publicity related to these types of concerns, or related to productcontamination or product tampering, whether valid or not, might negatively impact demand for our products, orcause production and delivery disruptions. We may need to recall products if any of our products become unfitfor consumption. In addition, we could potentially be subject to litigation or government actions, which couldresult in payments of fines or damages. Costs associated with these potential actions could negatively affect ouroperating results.
A product recall and related temporary plant closure during the fourth quarter of 2006 was caused by acontaminated ingredient purchased from an outside supplier. We have filed a claim for damages and are currentlyin litigation. A receivable was included in prepaid expenses and other current assets related to the anticipatedrecovery of damages. Future developments in this case could impact our ability to recover the costs we incurredfor the recall and temporary plant closure from responsible third-parties.
Future developments related to the investigation by government regulators of alleged pricing practices bymembers of the confectionery industry could impact our reputation, the regulatory environment under whichwe operate, and our operating results.
Government regulators are investigating alleged pricing practices by members of the confectioneryindustries in certain jurisdictions. We are cooperating fully with all relevant authorities. These allegations couldhave a negative impact on our Company’s reputation. We may also be subject to subsequent litigation orgovernment action, including payment of fines or damages. We may incur increased costs associated with thisinvestigation. In addition, our costs could increase if we would be required to pay fines or damages, or instituteadditional, new, government-mandated regulatory controls. These possible actions could negatively impact ourfuture operating results.
10
Pension costs could increase at a higher than anticipated rate.
Changes in interest rates or in the market value of plan assets could affect the funded status of our pensionplans. This could cause volatility in our benefits costs and increase future funding requirements of our pensionplans. Additionally, we could incur pension settlement losses if a significant number of employees who haveretired or have left the company decide to withdraw substantial lump sums from their pension accounts. Pensionsettlement losses of approximately $11.8 million were incurred during 2007 and we anticipate additionalsettlement costs in 2008. The fair value of our pension plan assets exceeded pension benefits obligations as ofDecember 31, 2007. However, a significant increase in future funding requirements could have a negative impacton our results of operations, financial condition and cash flows.
Increases in our stock price could increase expenses.
Changes in the price of our Common Stock expose us to market risks. Expenses for incentive compensationcould increase due to an increase in the price of our Common Stock.
Market demand for new and existing products could decline.
We operate in highly competitive markets and rely on continued demand for our products. To generaterevenues and profits, we must sell products that appeal to our customers and to consumers. Continued success isdependent on product innovation, including maintaining a strong pipeline of new products, effective retailexecution, appropriate advertising campaigns and marketing programs, and the ability to secure adequate shelfspace at retail locations. In addition, success depends on our response to consumer trends, consumer healthconcerns, including obesity and the consumption of certain ingredients, and changes in product categoryconsumption and consumer demographics.
Our largest customer, McLane Company, Inc., accounted for approximately 26% of our total net sales in2007 reflecting the continuing consolidation of our customer base. In this environment, there continue to becompetitive product and pricing pressures, as well as challenges in maintaining profit margins. We must maintainmutually beneficial relationships with our key customers, including retailers and distributors, to competeeffectively. McLane Company, Inc. is one of the largest wholesale distributors in the United States toconvenience stores, drug stores, wholesale clubs and mass merchandisers, including Wal-Mart Stores, Inc.
Increased marketplace competition could hurt our business.
The global confectionery packaged goods industry is intensely competitive, as is the broader snack market.Some of our competitors are much larger firms that have greater resources and more substantial internationaloperations. In order to protect our existing market share or capture increased market share in this highlycompetitive retail environment, we may be required to increase expenditures for promotions and advertising, andcontinue to introduce and establish new products. Due to inherent risks in the marketplace associated withadvertising and new product introductions, including uncertainties about trade and consumer acceptance,increased expenditures may not prove successful in maintaining or enhancing our market share and could resultin lower sales and profits. In addition, we may incur increased credit and other business risks because we operatein a highly competitive retail environment.
Changes in governmental laws and regulations could increase our costs and liabilities or impact demand forour products.
Changes in laws and regulations and the manner in which they are interpreted or applied may alter ourbusiness environment. This could affect our results of operations or increase our liabilities. These negativeimpacts could result from changes in food and drug laws, laws related to advertising and marketing practices,accounting standards, taxation requirements, competition laws, employment laws and environmental laws,
11

among others. It is possible that we could become subject to additional liabilities in the future resulting fromchanges in laws and regulations that could result in an adverse effect on our results of operations and financialcondition.
International operations could fluctuate unexpectedly and adversely impact our business.
In 2007, we derived approximately 13.8% of our net sales from customers located outside the United States.Some of our assets are also located outside of the United States. As part of our global growth strategy, we areincreasing our investments outside of the United States, particularly in India and China. As a result, we aresubject to numerous risks and uncertainties relating to international sales and operations, including:
• Unforeseen global economic and environmental changes resulting in business interruption, supplyconstraints, inflation, deflation or decreased demand;
• Difficulties and costs associated with complying with, and enforcing remedies under a wide variety ofcomplex laws, treaties and regulations;
• Different regulatory structures and unexpected changes in regulatory environments;
• Political and economic instability, including the possibility of civil unrest;
• Nationalization of our properties by foreign governments;
• Tax rates that may exceed those in the United States and earnings that may be subject to withholdingrequirements and incremental taxes upon repatriation;
• Potentially negative consequences from changes in tax laws;
• The imposition of tariffs, quotas, trade barriers, other trade protection measures and import or exportlicensing requirements;
• Increased costs, disruptions in shipping or reduced availability of freight transportation;
• The impact of currency exchange rate fluctuations between the U.S. dollar and foreign currencies; and
• Failure to gain sufficient profitable scale in certain international markets resulting in losses fromimpairment or sale of assets.
Item 1B. UNRESOLVED STAFF COMMENTS
None.
12

Item 2. PROPERTIES
Our principal properties include the following:
Country Location Type
Status(Own/Lease)
United States Hershey, Pennsylvania(3 principal plants)
Manufacturing—confectionery products, and food andbeverage enhancers
Own
Lancaster, Pennsylvania Manufacturing—confectionery products Own
Oakdale, California Manufacturing—confectionery products, and food andbeverage enhancers
Own*
Robinson, Illinois Manufacturing—confectionery and snack products, and foodand beverage enhancers
Own
Stuarts Draft, Virginia Manufacturing—confectionery products, and food andbeverage enhancers
Own
Edwardsville, Illinois Distribution Own
Palmyra, Pennsylvania Distribution Own
Redlands, California Distribution Own**
Canada Smiths Falls, Ontario Manufacturing—confectionery products, and food andbeverage enhancers
Own*
Mississauga, Ontario Distribution Lease
* The Oakdale, California manufacturing facility ceased production in January 2008. The Smiths Falls,Ontario manufacturing facility is currently expected to cease production in the first quarter of 2009.
** We expect to sell the Redlands, California facility in 2008 as part of our global supply chain transformationprogram and enter into a leasing arrangement for the facility for a period necessary to meet our continuedoperating requirements.
In addition to the locations indicated above, we are constructing a manufacturing facility for confectioneryproducts in Monterrey, Mexico which will begin operations in 2008. We also own or lease several otherproperties and buildings worldwide which we use for manufacturing and for sales, distribution and administrativefunctions. Our facilities are well maintained. These facilities generally have adequate capacity and canaccommodate seasonal demands, changing product mixes and certain additional growth. The largest facilities arelocated in Hershey, Pennsylvania. Many additions and improvements have been made to these facilities over theyears and they include equipment of the latest type and technology.
13

Item 3. LEGAL PROCEEDINGS
In connection with its pricing practices, the Company is the subject of an antitrust investigation by theCanadian Competition Bureau, and has received a request for information from the European Commission. Inaddition, the U.S. Department of Justice is conducting an inquiry. The Company is also party to approximately50 related civil antitrust suits in the United States and three in Canada. Each claim contains class actionallegations, instituted on behalf of consumers and, in some cases, by certain companies that purchase chocolatefor resale, that allege conspiracies in restraint of trade and challenge the pricing and/or purchasing practices ofthe Company. Several other chocolate confectionery companies are the subject of investigations and/or inquiriesby the government entities referenced above and have also been named as defendants in the same litigation. OneCanadian wholesaler is also a subject of the Canadian investigation and is a defendant in certain of the lawsuits.While it is not feasible to predict the final outcome of these proceedings, in our opinion they should not have amaterial adverse effect on the financial position, liquidity or results of operations of the Company. The Companyis cooperating with the government investigations and inquiries and intends to defend the lawsuits vigorously.
We have no other material pending legal proceedings, other than ordinary routine litigation incidental to ourbusiness.
Item 4. SUBMISSION OF MATTERS TO A VOTE OF SECURITY HOLDERS
Not applicable.
14
PART II
Item 5. MARKET FOR THE REGISTRANT’S COMMON EQUITY, RELATED STOCKHOLDERMATTERS AND ISSUER PURCHASES OF EQUITY SECURITIES
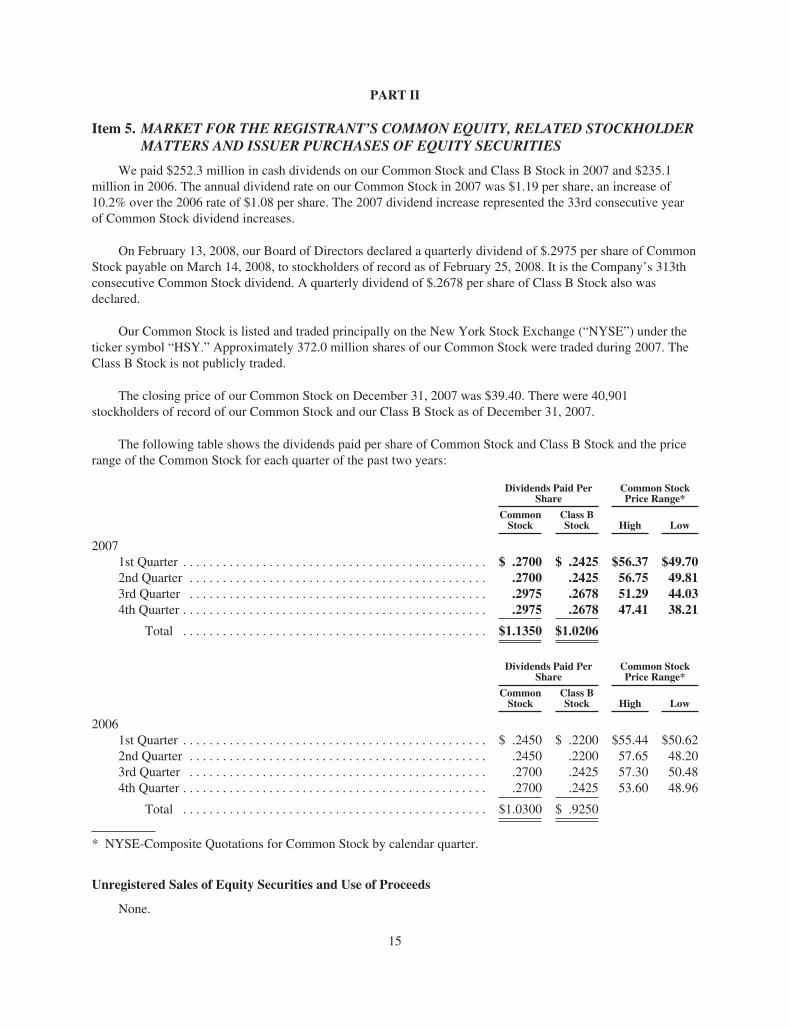
We paid $252.3 million in cash dividends on our Common Stock and Class B Stock in 2007 and $235.1million in 2006. The annual dividend rate on our Common Stock in 2007 was $1.19 per share, an increase of10.2% over the 2006 rate of $1.08 per share. The 2007 dividend increase represented the 33rd consecutive yearof Common Stock dividend increases.
On February 13, 2008, our Board of Directors declared a quarterly dividend of $.2975 per share of CommonStock payable on March 14, 2008, to stockholders of record as of February 25, 2008. It is the Company’s 313thconsecutive Common Stock dividend. A quarterly dividend of $.2678 per share of Class B Stock also wasdeclared.
Our Common Stock is listed and traded principally on the New York Stock Exchange (“NYSE”) under theticker symbol “HSY.” Approximately 372.0 million shares of our Common Stock were traded during 2007. TheClass B Stock is not publicly traded.
The closing price of our Common Stock on December 31, 2007 was $39.40. There were 40,901stockholders of record of our Common Stock and our Class B Stock as of December 31, 2007.
The following table shows the dividends paid per share of Common Stock and Class B Stock and the pricerange of the Common Stock for each quarter of the past two years:
Dividends Paid PerShare
Common StockPrice Range*
CommonStock
Class BStock High Low
20071st Quarter . . . . . . . . . . . . . . . . . . . . . . . . . . . . . . . . . . . . . . . . . . . . . . $ .2700 $ .2425 $56.37 $49.702nd Quarter . . . . . . . . . . . . . . . . . . . . . . . . . . . . . . . . . . . . . . . . . . . . . .2700 .2425 56.75 49.813rd Quarter . . . . . . . . . . . . . . . . . . . . . . . . . . . . . . . . . . . . . . . . . . . . . .2975 .2678 51.29 44.034th Quarter . . . . . . . . . . . . . . . . . . . . . . . . . . . . . . . . . . . . . . . . . . . . . . .2975 .2678 47.41 38.21
Total . . . . . . . . . . . . . . . . . . . . . . . . . . . . . . . . . . . . . . . . . . . . . . $1.1350 $1.0206
Dividends Paid PerShare
Common StockPrice Range*
CommonStock
Class BStock High Low
20061st Quarter . . . . . . . . . . . . . . . . . . . . . . . . . . . . . . . . . . . . . . . . . . . . . . $ .2450 $ .2200 $55.44 $50.622nd Quarter . . . . . . . . . . . . . . . . . . . . . . . . . . . . . . . . . . . . . . . . . . . . . .2450 .2200 57.65 48.203rd Quarter . . . . . . . . . . . . . . . . . . . . . . . . . . . . . . . . . . . . . . . . . . . . . .2700 .2425 57.30 50.484th Quarter . . . . . . . . . . . . . . . . . . . . . . . . . . . . . . . . . . . . . . . . . . . . . . .2700 .2425 53.60 48.96
Total . . . . . . . . . . . . . . . . . . . . . . . . . . . . . . . . . . . . . . . . . . . . . . $1.0300 $ .9250
* NYSE-Composite Quotations for Common Stock by calendar quarter.
Unregistered Sales of Equity Securities and Use of Proceeds
None.
15

Issuer Purchases of Equity Securities
Purchases of equity securities during the fourth quarter of the fiscal year ended December 31, 2007:
Period
(a)Total
Number ofShares
Purchased
(b)Average
Price Paid perShare
(c)Total Number ofShares Purchasedas Part of Publicly
Announced Plans orPrograms
(d)Approximate DollarValue of Shares that
May Yet Be PurchasedUnder the Plans or
Programs(1)
(in thousands of dollars)
October 1 throughOctober 28, 2007 . . . . . . . . . . . . . . . . . . . . . 49,000 $42.04 — $100,017
October 29 throughNovember 25, 2007 . . . . . . . . . . . . . . . . . . . 69,000 $41.69 — $100,017
November 26 throughDecember 31, 2007 . . . . . . . . . . . . . . . . . . . 73,000 $39.59 — $100,017
Total . . . . . . . . . . . . . . . . . . . . . . . . . . . . . . . 191,000 $40.98 —
(1) In December 2006, our Board of Directors approved a $250 million share repurchase program.
16

Performance Graph
The following graph compares our cumulative total stockholder return (Common Stock price appreciationplus dividends, on a reinvested basis) over the last five fiscal years with the Standard & Poor’s 500 Index and theStandard & Poor’s Packaged Foods Index.
Comparison of Five Year Cumulative Total Return*The Hershey Company, S&P 500 Index and
S&P Packaged Foods Index
$0
$20
$40
$60
$80
$100
$120
$140
$160
$180
$200
HERSHEY S&P 500 S&P Packaged Foods
HERSHEY
S&P 500
S&P Packaged Foods
2002
$100
$100
$100
2003
$117
$129
$108
2004
$171
$143
$129
2005
$173
$150
$119
2006
$159
$173
$138
2007
$129
$183
$143
F
F
F FF
F
B
BB
B
BB
HH
HH
H H
* Hypothetical $100 invested on December 31, 2002 in Hershey Common Stock, S&P 500 Index and S&P Packaged FoodsIndex, assuming reinvestment of dividends.
17

Item 6. SELECTED FINANCIAL DATA
SIX-YEAR CONSOLIDATED FINANCIAL SUMMARYAll dollar and share amounts in thousands except market price
and per share statistics
5-YearCompound
Growth Rate 2007 2006 2005 2004 2003 2002
Summary of OperationsNet Sales . . . . . . . . . . . . . . . . . . . . . . . . . . 3.7% $ 4,946,716 4,944,230 4,819,827 4,416,389 4,162,987 4,131,647
Cost of Sales . . . . . . . . . . . . . . . . . . . . . . . 5.2% $ 3,315,147 3,076,718 2,956,682 2,672,716 2,539,469 2,568,017Selling, Marketing and Administrative . . . 1.0% $ 895,874 860,378 912,986 867,104 841,105 853,048Business Realignment and Impairment
Charges, Net . . . . . . . . . . . . . . . . . . . . . $ 276,868 14,576 96,537 — 23,357 27,552Gain on Sale of Business(a) . . . . . . . . . . . . $ — — — — 8,330 —Interest Expense, Net . . . . . . . . . . . . . . . . . 14.3% $ 118,585 116,056 87,985 66,533 63,529 60,722Provision for Income Taxes . . . . . . . . . . . . (11.2)% $ 126,088 317,441 277,090 235,399 257,268 228,427
Income before Cumulative Effect ofAccounting Change . . . . . . . . . . . . . . . . (11.5)% $ 214,154 559,061 488,547 574,637 446,589 393,881
Cumulative Effect of AccountingChange . . . . . . . . . . . . . . . . . . . . . . . . . . $ — — — — 7,368 —
Net Income . . . . . . . . . . . . . . . . . . . . . . . . (11.5)% $ 214,154 559,061 488,547 574,637 439,221 393,881
Net Income Per Share:—Basic—Class B Stock . . . . . . . . . . (8.1)% $ .87 2.19 1.85 2.11 1.55 1.33—Diluted—Class B Stock . . . . . . . . . (8.0)% $ .87 2.17 1.84 2.09 1.54 1.32—Basic—Common Stock . . . . . . . . . (8.2)% $ .96 2.44 2.05 2.31 1.71 1.47—Diluted—Common Stock . . . . . . . (8.2)% $ .93 2.34 1.97 2.24 1.66 1.43
Weighted-Average Shares Outstanding:—Basic—Common Stock . . . . . . . . . 168,050 174,722 183,747 193,037 201,768 212,219—Basic—Class B Stock . . . . . . . . . . 60,813 60,817 60,821 60,844 60,844 60,856—Diluted . . . . . . . . . . . . . . . . . . . . . . 231,449 239,071 248,292 256,934 264,532 275,429
Dividends Paid on Common Stock . . . . . . 7.4% $ 190,199 178,873 170,147 159,658 144,985 133,285Per Share . . . . . . . . . . . . . . . . . . . . . . . . 12.5% $ 1.135 1.03 .93 .835 .7226 .63
Dividends Paid on Class B Stock . . . . . . . 12.4% $ 62,064 56,256 51,088 46,089 39,701 34,536Per Share . . . . . . . . . . . . . . . . . . . . . . . . 12.5% $ 1.0206 .925 .84 .7576 .6526 .5675
Net Income as a Percent of Net Sales,GAAP Basis . . . . . . . . . . . . . . . . . . . . . . 4.3% 11.3% 10.1% 13.0% 10.6% 9.5%
Non-GAAP Income as a Percent of NetSales(b) . . . . . . . . . . . . . . . . . . . . . . . . . 9.7% 11.5% 11.7% 11.6% 11.0% 10.3%
Depreciation . . . . . . . . . . . . . . . . . . . . . . . . 13.5% $ 292,658 181,038 200,132 171,229 158,933 155,384Advertising . . . . . . . . . . . . . . . . . . . . . . . . (4.7)% $ 127,896 108,327 125,023 137,931 145,387 162,874Payroll . . . . . . . . . . . . . . . . . . . . . . . . . . . . 1.7% $ 645,083 645,480 647,825 614,037 585,419 594,372Year-end Position and StatisticsCapital Additions . . . . . . . . . . . . . . . . . . . . 7.4% $ 189,698 183,496 181,069 181,728 218,650 132,736Capitalized Software Additions . . . . . . . . . 3.7% $ 14,194 15,016 13,236 14,158 18,404 11,836Total Assets . . . . . . . . . . . . . . . . . . . . . . . . 4.0% $ 4,247,113 4,157,565 4,262,699 3,794,750 3,577,026 3,483,442Short-term Debt and Current Portion of
Long-term Debt . . . . . . . . . . . . . . . . . . . 98.0% $ 856,392 843,998 819,115 622,320 12,509 28,124Long-term Portion of Debt . . . . . . . . . . . . 8.5% $ 1,279,965 1,248,128 942,755 690,602 968,499 851,800Stockholders’ Equity . . . . . . . . . . . . . . . . . (16.0)% $ 592,922 683,423 1,016,380 1,137,103 1,328,975 1,416,434Full-time Employees . . . . . . . . . . . . . . . . . 11,000 12,800 13,750 13,700 13,100 13,700Return MeasuresOperating Return on Average
Stockholders’ Equity, GAAPBasis(c) . . . . . . . . . . . . . . . . . . . . . . . . . 33.6% 65.8% 45.4% 46.6% 32.0% 30.3%
Non-GAAP Operating Return on AverageStockholders’ Equity(c) . . . . . . . . . . . . . 75.5% 66.7% 52.2% 41.6% 33.2% 32.8%
Operating Return on Average InvestedCapital, GAAP Basis(c) . . . . . . . . . . . . . 12.4% 26.4% 23.6% 25.7% 18.3% 17.6%
Non-GAAP Operating Return on AverageInvested Capital(c) . . . . . . . . . . . . . . . . . 25.0% 26.8% 26.8% 23.2% 18.9% 18.9%
Stockholders’ DataOutstanding Shares of Common Stock and
Class B Stock at Year-end . . . . . . . . . . . 227,050 230,264 240,524 246,588 259,059 268,440Market Price of Common Stock at
Year-end . . . . . . . . . . . . . . . . . . . . . . . . 3.2% $ 39.40 49.80 55.25 55.54 38.50 33.72Range During Year . . . . . . . . . . . . . . . . . . $56.75–38.21 57.65–48.20 67.37–52.49 56.75–37.28 39.33–30.35 39.75–28.23
18

(a) Includes the gain on the sale of gum brands in 2003.(b) Non-GAAP Income as a Percent of Net Sales is calculated by dividing Non-GAAP Income excluding Items Affecting Comparability by
Net Sales. A reconciliation of Net Income presented in accordance with U.S. generally accepted accounting principles (“GAAP”) toNon-GAAP Income excluding items affecting comparability is provided on pages 19 and 20, along with the reasons why we believe thatthe use of Non-GAAP Income provides useful information to investors.
(c) The calculation method for these measures is described on page 48 under RETURN MEASURES. The Non-GAAP Operating Returnmeasures are calculated using Non-GAAP Income excluding items affecting comparability. A reconciliation of Net Income presented inaccordance with GAAP to Non-GAAP Income excluding items affecting comparability is provided on pages 19 and 20, along with thereasons why we believe the use of Non-GAAP Income provides useful information to investors.
Item 7. MANAGEMENT’S DISCUSSION AND ANALYSIS OF FINANCIAL CONDITION ANDRESULTS OF OPERATIONS
EXECUTIVE OVERVIEW
The year ended December 31, 2007 was very difficult. We experienced sharp increases in the cost ofcommodities, particularly costs for dairy products. These cost increases totaled approximately $100 million andreduced gross margin by approximately 240 basis points. We also experienced increased competitive activity andchanging consumer trends toward premium and trade-up product segments that affected our growth andprofitability. In the face of these challenges, we did not have adequate product innovation and sufficient brandsupport or retail execution in our core U.S. market. Additionally, we continued to invest in key internationalmarkets.
Net sales were even with the prior year as increased sales from our international businesses and incrementalsales from the acquisition of the Godrej Hershey Foods and Beverages Company were substantially offset bylower sales in the United States. Net sales declined in the United States primarily as a result of increasedcompetitive activity and reduced retail velocity. Income and earnings per share were significantly lower than2006 primarily as a result of a lower gross margin reflecting substantially higher input costs, principally relatedto higher costs for dairy products and certain other raw materials, and reduced price realization resulting fromincreased promotional costs, partly offset by lower costs associated with our supply chain productivityimprovements. Increased investment spending for advertising and expansion of our international infrastructurealso contributed to the lower income in 2007.
Non-GAAP Financial Measures—Items Affecting Comparability
Our “Management’s Discussion and Analysis of Financial Condition and Results of Operations” sectionincludes certain measures of financial performance that are not defined by U.S. generally accepted accountingprinciples (“GAAP”). For each of these non-GAAP financial measures, we are providing below (1) the mostdirectly comparable GAAP measure; (2) a reconciliation of the differences between the non-GAAP measure andthe most directly comparable GAAP measure; (3) an explanation of why our management believes thesenon-GAAP measures provide useful information to investors; and (4) additional purposes for which we use thesenon-GAAP measures.
We believe that the disclosure of these non-GAAP measures provides investors with a better comparison ofour year-to-year operating results. We exclude the effects of certain items from Income before Interest andIncome Taxes (“EBIT”), Net Income and Income per Share-Diluted-Common Stock (“EPS”) when we evaluatekey measures of our performance internally, and in assessing the impact of known trends and uncertainties on ourbusiness. We also believe that excluding the effects of these items provides a more balanced view of theunderlying dynamics of our business.
Items affecting comparability include the impacts of charges or credits in 2007, 2006, 2005, 2003 and 2002associated with our business realignment initiatives and a reduction of the income tax provision in 2004 resultingfrom adjustments to income tax contingency reserves.
19

For the years ended December 31, 2007 2006
EBITNet
Income EPS EBITNet
Income EPS
In millions of dollars except per share amounts
Results in accordance with GAAP . . . . . . . . . . . . . . . . . . . $458.8 $214.2 $ .93 $ 992.6 $559.1 $2.34Items affecting comparability:
Business realignment charges included in cost ofsales . . . . . . . . . . . . . . . . . . . . . . . . . . . . . . . . . . . . . 123.1 80.9 .35 (3.2) (2.0) (.01)
Business realignment charges included in selling,marketing and administrative (“SM&A”) . . . . . . . . 12.6 7.8 .03 .3 .2 —
Business realignment and impairment charges, net . . 276.9 178.9 .77 14.5 9.3 .04
Non-GAAP results excluding items affectingcomparability . . . . . . . . . . . . . . . . . . . . . . . . . . . . . . . . . $871.4 $481.8 $2.08 $1,004.2 $566.6 $2.37
For the years ended December 31, 2005 2004
EBITNet
Income EPS EBITNet
Income EPS
In millions of dollars except per share amounts
Results in accordance with GAAP . . . . . . . . . . . . . . . . . . . . $853.6 $488.5 $1.97 $876.6 $574.6 $2.24Items affecting comparability:
Business realignment charges included in cost ofsales . . . . . . . . . . . . . . . . . . . . . . . . . . . . . . . . . . . . . . 22.5 13.4 .05 — — —
Business realignment and impairment charges, net . . . 96.5 60.7 .25 — — —Tax provision adjustment . . . . . . . . . . . . . . . . . . . . . . . — — — — (61.1) (.24)
Non-GAAP results excluding items affectingcomparability . . . . . . . . . . . . . . . . . . . . . . . . . . . . . . . . . . . $972.6 $562.6 $2.27 $876.6 $513.5 $2.00
For the years ended December 31, 2003 2002
EBITNet
Income EPS EBITNet
Income EPS
In millions of dollars except per share amounts
Results in accordance with GAAP . . . . . . . . . . . . . . . . . . . . $767.4 $439.2 $1.66 $683.0 $393.9 $1.43Items affecting comparability:
Business realignment charges included in cost ofsales . . . . . . . . . . . . . . . . . . . . . . . . . . . . . . . . . . . . . . 2.1 1.3 — 6.4 4.1 .01
Costs to explore the sale of the Company included inSM&A . . . . . . . . . . . . . . . . . . . . . . . . . . . . . . . . . . . . — — — 17.2 10.9 .04
Business realignment and impairment charges, net . . . 23.4 14.2 .05 27.6 17.4 .06Gain on sale of business . . . . . . . . . . . . . . . . . . . . . . . . (8.3) (5.7) (.02) — — —Cumulative effect of accounting change . . . . . . . . . . . . — 7.4 .03 — — —
Non-GAAP results excluding items affectingcomparability . . . . . . . . . . . . . . . . . . . . . . . . . . . . . . . . . . . $784.6 $456.4 $1.72 $734.2 $426.3 $1.54
Actual Results Excluding ItemsAffecting Comparability
Key Annual Performance Measures 2007 2006 2005
Increase in Net Sales . . . . . . . . . . . . . . . . . . . . . . . . . . . . . . . . . . . . . . . . . . . . . . . . . 0.1% 2.6% 9.1%(Decrease) increase in EBIT . . . . . . . . . . . . . . . . . . . . . . . . . . . . . . . . . . . . . . . . . . . (13.2)% 3.2% 11.0%(Decline) improvement in EBIT Margin in basis points (“bps”) . . . . . . . . . . . . . . . (270)bps 10 bps 40 bps(Decrease) increase in EPS . . . . . . . . . . . . . . . . . . . . . . . . . . . . . . . . . . . . . . . . . . . . (12.2)% 4.4% 13.5%
20
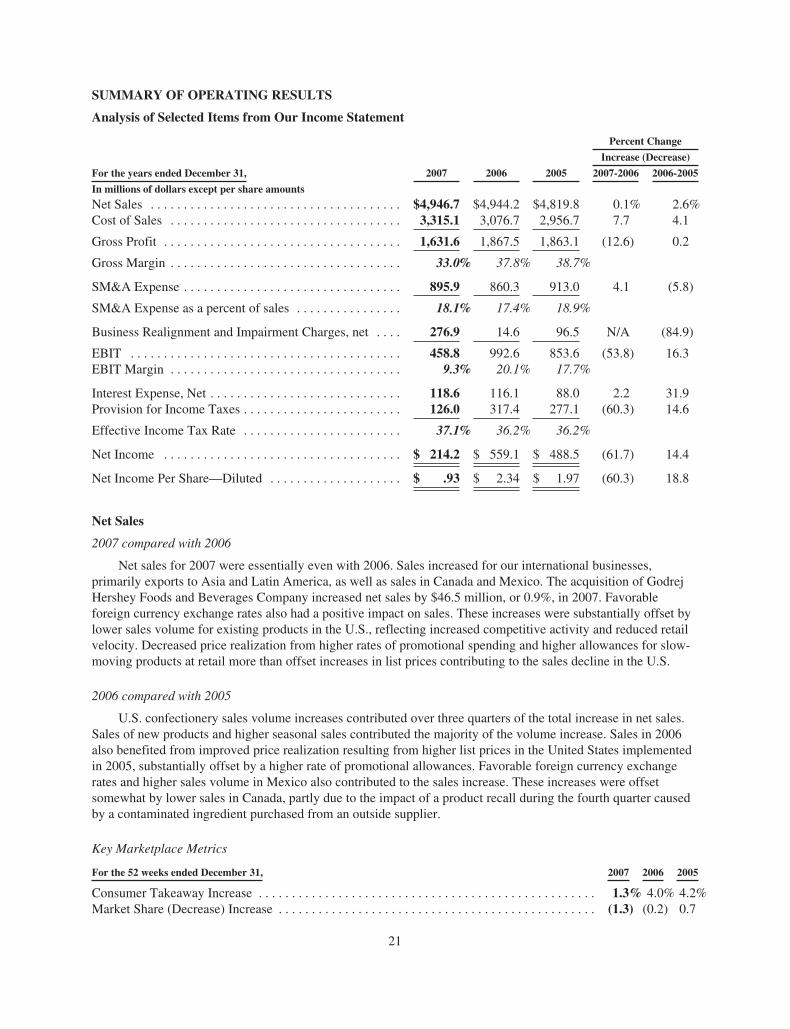
SUMMARY OF OPERATING RESULTS
Analysis of Selected Items from Our Income Statement
Percent Change
Increase (Decrease)
For the years ended December 31, 2007 2006 2005 2007-2006 2006-2005
In millions of dollars except per share amounts
Net Sales . . . . . . . . . . . . . . . . . . . . . . . . . . . . . . . . . . . . . . $4,946.7 $4,944.2 $4,819.8 0.1% 2.6%Cost of Sales . . . . . . . . . . . . . . . . . . . . . . . . . . . . . . . . . . . 3,315.1 3,076.7 2,956.7 7.7 4.1
Gross Profit . . . . . . . . . . . . . . . . . . . . . . . . . . . . . . . . . . . . 1,631.6 1,867.5 1,863.1 (12.6) 0.2
Gross Margin . . . . . . . . . . . . . . . . . . . . . . . . . . . . . . . . . . . 33.0% 37.8% 38.7%
SM&A Expense . . . . . . . . . . . . . . . . . . . . . . . . . . . . . . . . . 895.9 860.3 913.0 4.1 (5.8)
SM&A Expense as a percent of sales . . . . . . . . . . . . . . . . 18.1% 17.4% 18.9%
Business Realignment and Impairment Charges, net . . . . 276.9 14.6 96.5 N/A (84.9)
EBIT . . . . . . . . . . . . . . . . . . . . . . . . . . . . . . . . . . . . . . . . . 458.8 992.6 853.6 (53.8) 16.3EBIT Margin . . . . . . . . . . . . . . . . . . . . . . . . . . . . . . . . . . . 9.3% 20.1% 17.7%
Interest Expense, Net . . . . . . . . . . . . . . . . . . . . . . . . . . . . . 118.6 116.1 88.0 2.2 31.9Provision for Income Taxes . . . . . . . . . . . . . . . . . . . . . . . . 126.0 317.4 277.1 (60.3) 14.6
Effective Income Tax Rate . . . . . . . . . . . . . . . . . . . . . . . . 37.1% 36.2% 36.2%
Net Income . . . . . . . . . . . . . . . . . . . . . . . . . . . . . . . . . . . . $ 214.2 $ 559.1 $ 488.5 (61.7) 14.4
Net Income Per Share—Diluted . . . . . . . . . . . . . . . . . . . . $ .93 $ 2.34 $ 1.97 (60.3) 18.8
Net Sales
2007 compared with 2006
Net sales for 2007 were essentially even with 2006. Sales increased for our international businesses,primarily exports to Asia and Latin America, as well as sales in Canada and Mexico. The acquisition of GodrejHershey Foods and Beverages Company increased net sales by $46.5 million, or 0.9%, in 2007. Favorableforeign currency exchange rates also had a positive impact on sales. These increases were substantially offset bylower sales volume for existing products in the U.S., reflecting increased competitive activity and reduced retailvelocity. Decreased price realization from higher rates of promotional spending and higher allowances for slow-moving products at retail more than offset increases in list prices contributing to the sales decline in the U.S.
2006 compared with 2005
U.S. confectionery sales volume increases contributed over three quarters of the total increase in net sales.Sales of new products and higher seasonal sales contributed the majority of the volume increase. Sales in 2006also benefited from improved price realization resulting from higher list prices in the United States implementedin 2005, substantially offset by a higher rate of promotional allowances. Favorable foreign currency exchangerates and higher sales volume in Mexico also contributed to the sales increase. These increases were offsetsomewhat by lower sales in Canada, partly due to the impact of a product recall during the fourth quarter causedby a contaminated ingredient purchased from an outside supplier.
Key Marketplace Metrics
For the 52 weeks ended December 31, 2007 2006 2005
Consumer Takeaway Increase . . . . . . . . . . . . . . . . . . . . . . . . . . . . . . . . . . . . . . . . . . . . . . . . . . . 1.3% 4.0% 4.2%Market Share (Decrease) Increase . . . . . . . . . . . . . . . . . . . . . . . . . . . . . . . . . . . . . . . . . . . . . . . . (1.3) (0.2) 0.7
21

Consumer takeaway is provided for channels of distribution accounting for approximately 80% of our U.S.confectionery retail business. These channels of distribution include food, drug, mass merchandisers, includingWal-Mart Stores, Inc., and convenience stores. The change in market share is provided for channels measured bysyndicated data which include sales in the food, drug, convenience store and mass merchandiser classes of trade,excluding sales of Wal-Mart Stores, Inc.
Cost of Sales and Gross Margin
2007 compared with 2006
Business realignment charges of $123.1 million were included in cost of sales in 2007, compared with acredit of $3.2 million included in cost of sales in 2006. The remainder of the cost of sales increase was primarilyassociated with significantly higher input costs, particularly for dairy products and certain other raw materials,and the Godrej Hershey Foods and Beverages business acquired in May 2007, offset somewhat by favorablesupply chain productivity.
The gross margin decline was primarily attributable to the impact of business realignment initiativesrecorded in 2007 compared with 2006, resulting in a reduction of 2.6 percentage points. The rest of the declinereflected substantially higher costs for raw materials, offset somewhat by improved supply chain productivity.Also contributing to the decrease was lower net price realization due to higher promotional costs.
2006 compared with 2005
The sales volume increase, higher energy, raw material and other input costs were the primary contributorsto the cost of sales increase for 2006. Higher costs associated with obsolete, aged and unsaleable products alsocontributed to the increase. These increases were offset somewhat by reductions in U.S. manufacturing costs anda decrease in cost of sales of $3.2 million in 2006 resulting from the adjustment of liabilities associated withbusiness realignment initiatives. Business realignment charges of $22.5 million were included in cost of sales in2005 reflecting accelerated depreciation resulting from the closure of a manufacturing facility located in LasPiedras, Puerto Rico.
Gross margin in 2006 was negatively impacted by higher costs for energy and raw materials, increased costsrelated to product obsolescence and an unfavorable sales mix. These were partially offset by improved pricerealization and supply chain productivity. Our business realignment initiatives improved gross margin 0.1percentage point in 2006 and reduced gross margin by 0.4 percentage points in 2005.
Selling, Marketing and Administrative
2007 compared with 2006
Selling, marketing and administrative expenses increased primarily as a result of higher administrative andadvertising expenses, partially offset by lower consumer promotional expenses. Project implementation costsrelated to our 2007 business realignment initiatives contributed $12.6 million to the increase. Higheradministrative costs were principally associated with employee-related expenses from the expansion of ourinternational businesses, including the impact of the acquisition of Godrej Hershey Foods and BeveragesCompany.
2006 compared with 2005
Selling, marketing and administrative expenses decreased primarily due to reduced administrative costsreflecting lower incentive compensation expense and savings resulting from our 2005 business realignmentinitiatives. Reduced advertising expense in 2006 was substantially offset by higher consumer promotionexpenses.
22
Business Realignment Initiatives
In February 2007, we announced a comprehensive, three-year supply chain transformation program (the“global supply chain transformation program”) and, in December 2007, we recorded impairment and businessrealignment charges associated with our business in Brazil (together, “the 2007 business realignmentinitiatives”).
When completed, the global supply chain transformation program will greatly enhance our manufacturing,sourcing and customer service capabilities, reduce inventories resulting in improvements in working capital andgenerate significant resources to invest in our growth initiatives. These initiatives include acceleratedmarketplace momentum within our core U.S. business, creation of innovative new product platforms to meetcustomer needs and disciplined global expansion. Under the program, which will be implemented in stages overthree years, we will significantly increase manufacturing capacity utilization by reducing the number ofproduction lines by more than one-third, outsource production of low value-added items and construct a flexible,cost-effective production facility in Monterrey, Mexico to meet current and emerging marketplace needs. Theprogram will result in a total net reduction of 1,500 positions across our supply chain over the three-yearimplementation period.
The estimated pre-tax cost of the global supply chain transformation program is from $525 million to $575million over three years. The total includes from $475 million to $525 million in business realignment costs andapproximately $50 million in project implementation costs. The costs will be incurred primarily in 2007 and2008. Total costs of $400.0 million were recorded in 2007 for this program.
In 2001, we acquired a small business in Brazil, Hershey do Brasil, which has not gained profitable scale oradequate market distribution. In an effort to improve the performance of this business, in January 2008 Hersheydo Brasil entered into a cooperative agreement with Pandurata Alimentos LTDA (“Bauducco”), a leadingmanufacturer of baked goods in Brazil whose primary brand is Bauducco. The arrangement with Bauducco willleverage Bauducco’s strong sales and distribution capabilities for our products throughout Brazil. Under thisagreement we will manufacture and market, and they will sell and distribute our products. We will maintain a51% controlling interest in Hershey do Brasil. In the fourth quarter of 2007, we recorded a goodwill impairmentcharge and approved a business realignment program associated with initiatives to improve distribution andenhance the financial performance of our business in Brazil.
In July 2005, we announced initiatives intended to advance our value-enhancing strategy (the “2005business realignment initiatives”). Charges (credits) for the 2005 business realignment initiatives were recordedduring 2005 and 2006 and the 2005 business realignment initiatives were completed by December 31, 2006.
23
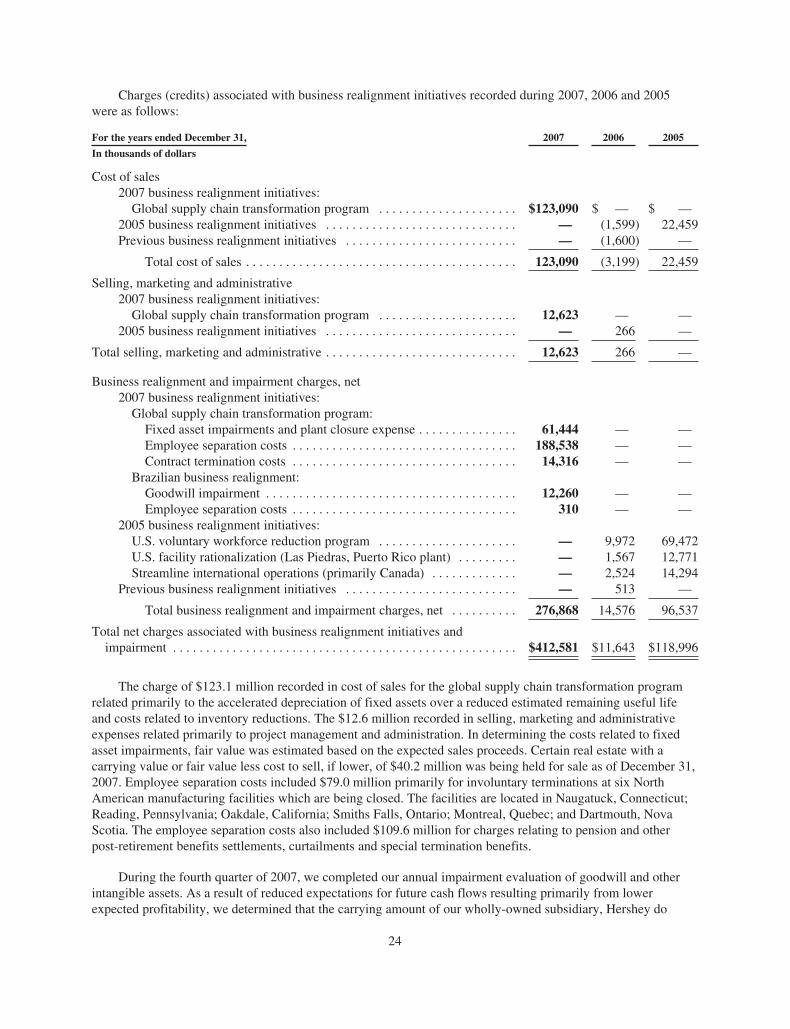
Charges (credits) associated with business realignment initiatives recorded during 2007, 2006 and 2005were as follows:
For the years ended December 31, 2007 2006 2005
In thousands of dollars
Cost of sales2007 business realignment initiatives:
Global supply chain transformation program . . . . . . . . . . . . . . . . . . . . . $123,090 $ — $ —2005 business realignment initiatives . . . . . . . . . . . . . . . . . . . . . . . . . . . . . — (1,599) 22,459Previous business realignment initiatives . . . . . . . . . . . . . . . . . . . . . . . . . . — (1,600) —
Total cost of sales . . . . . . . . . . . . . . . . . . . . . . . . . . . . . . . . . . . . . . . . . 123,090 (3,199) 22,459
Selling, marketing and administrative2007 business realignment initiatives:
Global supply chain transformation program . . . . . . . . . . . . . . . . . . . . . 12,623 — —2005 business realignment initiatives . . . . . . . . . . . . . . . . . . . . . . . . . . . . . — 266 —
Total selling, marketing and administrative . . . . . . . . . . . . . . . . . . . . . . . . . . . . . 12,623 266 —
Business realignment and impairment charges, net2007 business realignment initiatives:
Global supply chain transformation program:Fixed asset impairments and plant closure expense . . . . . . . . . . . . . . . 61,444 — —Employee separation costs . . . . . . . . . . . . . . . . . . . . . . . . . . . . . . . . . . 188,538 — —Contract termination costs . . . . . . . . . . . . . . . . . . . . . . . . . . . . . . . . . . 14,316 — —
Brazilian business realignment:Goodwill impairment . . . . . . . . . . . . . . . . . . . . . . . . . . . . . . . . . . . . . . 12,260 — —Employee separation costs . . . . . . . . . . . . . . . . . . . . . . . . . . . . . . . . . . 310 — —
2005 business realignment initiatives:U.S. voluntary workforce reduction program . . . . . . . . . . . . . . . . . . . . . — 9,972 69,472U.S. facility rationalization (Las Piedras, Puerto Rico plant) . . . . . . . . . — 1,567 12,771Streamline international operations (primarily Canada) . . . . . . . . . . . . . — 2,524 14,294
Previous business realignment initiatives . . . . . . . . . . . . . . . . . . . . . . . . . . — 513 —
Total business realignment and impairment charges, net . . . . . . . . . . 276,868 14,576 96,537
Total net charges associated with business realignment initiatives andimpairment . . . . . . . . . . . . . . . . . . . . . . . . . . . . . . . . . . . . . . . . . . . . . . . . . . . . $412,581 $11,643 $118,996
The charge of $123.1 million recorded in cost of sales for the global supply chain transformation programrelated primarily to the accelerated depreciation of fixed assets over a reduced estimated remaining useful lifeand costs related to inventory reductions. The $12.6 million recorded in selling, marketing and administrativeexpenses related primarily to project management and administration. In determining the costs related to fixedasset impairments, fair value was estimated based on the expected sales proceeds. Certain real estate with acarrying value or fair value less cost to sell, if lower, of $40.2 million was being held for sale as of December 31,2007. Employee separation costs included $79.0 million primarily for involuntary terminations at six NorthAmerican manufacturing facilities which are being closed. The facilities are located in Naugatuck, Connecticut;Reading, Pennsylvania; Oakdale, California; Smiths Falls, Ontario; Montreal, Quebec; and Dartmouth, NovaScotia. The employee separation costs also included $109.6 million for charges relating to pension and otherpost-retirement benefits settlements, curtailments and special termination benefits.
During the fourth quarter of 2007, we completed our annual impairment evaluation of goodwill and otherintangible assets. As a result of reduced expectations for future cash flows resulting primarily from lowerexpected profitability, we determined that the carrying amount of our wholly-owned subsidiary, Hershey do
24

Brasil, exceeded its fair value and recorded a non-cash impairment charge of $12.3 million in December 2007.There was no tax benefit associated with this charge. We discuss the impairment testing results in more detail inNote 1 and Note 16 to the Consolidated Financial Statements. During the fourth quarter of 2007, we alsorecorded a business realignment charge of $.3 million associated with our business in Brazil. This charge wasprincipally associated with employee separation costs. Remaining charges of approximately $5.0 million for thisbusiness realignment program are expected to be recorded in 2008.
The charges (credits) recorded in cost of sales relating to the 2005 business realignment initiatives includeda credit of $1.6 million in 2006 resulting from higher than expected proceeds from the sale of equipment from theLas Piedras plant and a charge of $22.5 million in 2005 resulting from accelerated depreciation related to theclosure of the Las Piedras plant. The charge recorded in selling, marketing and administrative expenses in 2006resulted from accelerated depreciation relating to the termination of an office building lease. The net businessrealignment charges included $7.3 million and $8.3 million for involuntary terminations in 2006 and 2005,respectively.
The charges (credits) recorded in 2006 relating to previous business realignment initiatives which began in2003 and 2001 resulted from the finalization of the sale of certain properties, adjustments to liabilities which hadpreviously been recorded, and the impact of the settlement as to several of the eight former employees who hadfiled a complaint alleging that the Company had discriminated against them on the basis of age in connectionwith the 2003 business realignment initiatives. A settlement was reached with the remaining former employees inSeptember 2007.
The liability balance as of December 31, 2007 relating to the 2007 business realignment initiatives was$68.4 million for employee separation costs to be paid primarily in 2008 and 2009. As of December 31, 2007, theliability balance relating to the 2005 business realignment initiatives was $3.3 million. During 2007 we madepayments against the liabilities recorded for the 2007 business realignment initiatives of $13.2 million principallyrelated to employee separation and project administration. We made payments during 2007 against the liabilitiesrecorded for the 2005 business realignment initiatives of $16.2 million related to the voluntary workforcereduction. During 2006 we made total payments of $28.0 million against the liabilities recorded for the 2005business realignment initiatives primarily associated with the voluntary workforce reduction.
Income Before Interest and Income Taxes and EBIT Margin
2007 compared with 2006
EBIT decreased in 2007 compared with 2006, principally as a result of higher net business realignment andimpairment charges recorded in 2007. Net pre-tax business realignment and impairment charges of $412.6million were recorded in 2007 compared with $11.6 million recorded in 2006, an increase of $400.9 million. Theremainder of the decrease in EBIT was attributable to lower gross profit resulting primarily from higher inputcosts and higher selling, marketing and administrative expenses.
EBIT margin declined from 20.1% in 2006 to 9.3% in 2007. Net business realignment and impairmentcharges reduced EBIT margin by 8.3 percentage points in 2007. Net business realignment charges reduced EBITmargin by 0.2 percentage points in 2006. The remainder of the decrease primarily resulted from the lower grossmargin, in addition to higher selling, marketing and administrative expense as a percentage of sales.
2006 compared with 2005
EBIT increased in 2006 compared with 2005, primarily as a result of lower net business realignment andimpairment charges associated primarily with the 2005 business realignment initiatives. Net pre-tax businessrealignment charges of $11.6 million were recorded in 2006 compared with $119.0 million recorded in 2005, adecrease of $107.4 million. The remainder of the increase in EBIT was attributable to lower selling, marketingand administrative expenses which were partially offset by lower gross profit resulting from higher input costsand the impact of product obsolescence.
25
EBIT margin increased from 17.7% in 2005 to 20.1% in 2006. Net business realignment and impairmentcharges reduced EBIT margin by 0.2 percentage points in 2006 and 2.5 percentage points in 2005. The remainderof the improvement in EBIT margin reflected lower selling, marketing and administrative expenses as apercentage of sales.
Interest Expense, Net
2007 compared with 2006
Net interest expense was higher in 2007 than in 2006, primarily reflecting increased borrowings partiallyoffset by lower interest rates.
2006 compared with 2005
Net interest expense was higher in 2006 than in 2005, primarily reflecting higher interest expense resultingfrom commercial paper borrowings to fund repurchases of Common Stock and working capital requirements,along with significant contributions to our pension plans in late 2005. Higher interest rates in 2006 alsocontributed to the increase in interest expense.
Income Taxes and Effective Tax Rate
2007 compared with 2006
Our effective income tax rate was 37.1% for 2007 and 36.2% for 2006. The impact of tax rates associatedwith business realignment and impairment charges increased the effective income tax rate for 2007 by 1.1percentage points.
2006 compared with 2005
Our effective income tax rate was 36.2% for 2006 and 2005.
Net Income and Net Income Per Share
2007 compared with 2006
Net income in 2007 was reduced by $267.7 million, or $1.15 per share-diluted, and in 2006 was reduced by$7.6 million, or $.03 per share-diluted, as a result of net business realignment and impairment charges. Excludingthe impact of these charges, earnings per share-diluted in 2007 decreased by $.29 as compared with 2006 as aresult of lower EBIT, offset somewhat by reduced interest expense and the impact of lower weighted-averageshares outstanding in 2007.
2006 compared with 2005
Net income in 2006 was reduced by $7.6 million, or $.03 per share-diluted, and in 2005 was reduced by$74.0 million, or $.30 per share-diluted, as a result of net charges associated with our 2005 business realignmentinitiatives which were recorded in each year. In addition to the impact of the business realignment initiatives,earnings per share-diluted in 2006 increased primarily as a result of lower selling, marketing and administrativeexpenses which more than offset the impact of reduced gross profit. The impact of lower weighted-averageshares outstanding, net of higher interest expense, also contributed to the increase in earnings per share-diluted in2006.
26
FINANCIAL CONDITION
Our financial condition remained strong during 2007. Solid cash flow from operations and our liquidity,leverage and capital structure contributed to our continued investment grade credit rating by recognized ratingagencies.
Acquisitions and Divestitures
In May 2007, we entered into an agreement with Godrej Beverages and Foods, Ltd., one of India’s largestconsumer goods, confectionery and food companies, to manufacture and distribute confectionery products,snacks and beverages across India. Under the agreement, we invested $61.5 million during 2007 and own a 51%controlling interest in Godrej Hershey Foods and Beverages Company. Total liabilities assumed were $51.6million. Effective in May 2007, this business acquisition was included in our consolidated results, including therelated minority interest. Annual sales for this business are expected to be approximately $70.0 million.
Also in May 2007, our Company and Lotte Confectionery Co., LTD., entered into a manufacturingagreement in China that will produce Hershey products and certain Lotte products for the market in China. Weinvested $39.0 million in 2007 and own a 44% interest. We are accounting for this investment using the equitymethod.
In October 2006, our wholly-owned subsidiary, Artisan Confections Company, purchased the assets ofDagoba Organic Chocolates, LLC based in Ashland, Oregon, for $17.0 million. Dagoba is known for its high-quality organic chocolate bars, drinking chocolates and baking products that are primarily sold in natural foodand gourmet stores across the United States. Dagoba has annual sales of approximately $8.0 million.
In August 2005, Artisan Confections Company completed the acquisition of Scharffen Berger ChocolateMaker, Inc. Based in San Francisco, California, Scharffen Berger is known for its high-cacao content, signaturedark chocolate bars and baking products sold online and in a broad range of outlets, including specialty retailers,natural food stores and gourmet centers across the United States. Scharffen Berger also owns and operates threespecialty stores located in New York, New York and in Berkeley and San Francisco, California.
Also, in August 2005, Artisan Confections Company acquired the assets of Joseph Schmidt Confections,Inc., a premium chocolate maker located in San Francisco, California. Distinctive products created by JosephSchmidt include artistic and innovative truffles, colorful chocolate mosaics, specialty cookies, and handcraftedchocolates. We sell these products in select department stores and other specialty outlets nationwide as well as inJoseph Schmidt stores located in San Jose and San Francisco, California. The combined purchase price forScharffen Berger and Joseph Schmidt was $47.1 million. Together, these companies have combined annual salesof approximately $25 million.
Results subsequent to the dates of acquisition were included in the consolidated financial statements. Hadthe results of the acquisitions been included in the consolidated financial statements for each of the periodspresented, the effect would not have been material.
In October 2005, our wholly-owned subsidiary, Hershey Canada Inc., completed the sale of its Mr. Freezefreeze pops business for $2.7 million.
27

Assets
A summary of our assets is as follows:
December 31, 2007 2006
In thousands of dollars
Current assets . . . . . . . . . . . . . . . . . . . . . . . . . . . . . . . . . . . . . . . . . . . . . . . $1,426,574 $1,417,812Property, plant and equipment, net . . . . . . . . . . . . . . . . . . . . . . . . . . . . . . . 1,539,715 1,651,300Goodwill and other intangibles . . . . . . . . . . . . . . . . . . . . . . . . . . . . . . . . . . 740,575 642,269Other assets . . . . . . . . . . . . . . . . . . . . . . . . . . . . . . . . . . . . . . . . . . . . . . . . . 540,249 446,184
Total assets . . . . . . . . . . . . . . . . . . . . . . . . . . . . . . . . . . . . . . . . . . . . . $4,247,113 $4,157,565
• The change in current assets from 2006 to 2007 was primarily due to the following:
• Higher cash and cash equivalents in 2007 due to the timing of cash collections;
• A decrease in accounts receivable primarily resulting from lower sales in December 2007 ascompared with December 2006;
• A decrease in inventories in 2007 reflecting lower raw material and goods in process inventoriesresulting from reduced manufacturing requirements and the global supply chain transformationprogram, in addition to lower finished goods inventories as a result of working capital improvementinitiatives, partially offset by an inventory build in anticipation of the relocation of certainmanufacturing processes under the global supply chain transformation program;
• An increase in deferred income taxes primarily associated with the 2007 business realignment andimpairment charges as well as impending executive retirement benefit payments; and
• An increase in prepaid expenses and other current assets primarily reflecting receivables associatedwith certain commodity transactions, and assets acquired through the Godrej Hershey Foods andBeverages Company acquisition.
• Property, plant and equipment was lower in 2007 primarily due to depreciation expense of $292.7million and asset retirements, partially offset by capital additions and assets acquired through the GodrejHershey Foods and Beverages Company acquisition. Accelerated depreciation of facilities designatedfor closure and certain asset retirements resulted primarily from the global supply chain transformationprogram.
• Goodwill and other intangibles increased as a result of the Godrej Hershey Foods and BeveragesCompany acquisition and the effect of currency translation adjustments, offset partially by a reductionresulting from the goodwill impairment charge associated with our business in Brazil. Furtherinformation is included in Note 1 and Note 16 to the Consolidated Financial Statements.
• The increase in other assets was primarily associated with the 2007 business acquisitions, as well as thereclassification of certain tax benefits to other assets in accordance with the adoption of FinancialAccounting Standards Board (“FASB”) Interpretation No. 48, Accounting for Uncertainty in IncomeTaxes, an interpretation of FASB Statement No. 109 (“FIN No. 48”).
28

Liabilities
A summary of our liabilities is as follows:
December 31, 2007 2006
In thousands of dollars
Current liabilities . . . . . . . . . . . . . . . . . . . . . . . . . . . . . . . . . . . . . . . . . . . . . $1,618,770 $1,453,538Long-term debt . . . . . . . . . . . . . . . . . . . . . . . . . . . . . . . . . . . . . . . . . . . . . . 1,279,965 1,248,128Other long-term liabilities . . . . . . . . . . . . . . . . . . . . . . . . . . . . . . . . . . . . . . 544,016 486,473Deferred income taxes . . . . . . . . . . . . . . . . . . . . . . . . . . . . . . . . . . . . . . . . . 180,842 286,003
Total liabilities . . . . . . . . . . . . . . . . . . . . . . . . . . . . . . . . . . . . . . . . . . $3,623,593 $3,474,142
• Changes in current liabilities from 2006 to 2007 were primarily the result of the following:
• Higher accounts payable reflecting the effect of working capital improvement initiatives;
• Higher accrued liabilities primarily associated with the 2007 business realignment initiatives andhigher expected employee benefit payments; and
• An increase in short-term debt reflecting commercial paper borrowings, partially offset by adecrease in the current-portion of long-term debt primarily resulting from the payment of 6.95%Notes due in March 2007.
• The increase in long-term debt in 2007 was primarily associated with debt assumed through the GodrejHershey Foods and Beverages Company acquisition.
• The increase in other long-term liabilities and a corresponding decrease in deferred income taxes of$56.4 million in 2007 were associated with the reclassification of unrecognized tax benefits fromdeferred income taxes to other long-term liabilities in accordance with the adoption of FIN No. 48,discussed further in Note 11 to the Consolidated Financial Statements. The residual decrease in deferredincome taxes is primarily attributable to the effect of the 2007 business realignment initiatives.
Capital Structure
We have two classes of stock outstanding, Common Stock and Class B Stock. Holders of the CommonStock and the Class B Stock generally vote together without regard to class on matters submitted to stockholders,including the election of directors. Holders of the Common Stock have one vote per share. Holders of the Class BStock have ten votes per share. Holders of the Common Stock, voting separately as a class, are entitled to electone-sixth of our Board of Directors. With respect to dividend rights, holders of the Common Stock are entitled tocash dividends 10% higher than those declared and paid on the Class B Stock.
Hershey Trust Company, as trustee for the benefit of Milton Hershey School (the “Milton Hershey SchoolTrust” or the “Trust”) maintains voting control over The Hershey Company. Historically, the Milton HersheySchool Trust had not taken an active role in setting our policy, nor has it exercised influence with regard to theongoing business decisions of our Board of Directors or management. However, in October 2007, the Chairmanof the Board of the Milton Hershey School Trust issued a statement indicating that the Trust continues to beguided by two key principles: first, that, in its role as controlling stockholder of the Company, it intends to retainits controlling interest in The Hershey Company and, second, that the long-term prosperity of the Companyrequires the Board of Directors of the Company and its management to build on its strong U.S. position byaggressively pursuing strategies for domestic and international growth. He further stated that the Milton HersheySchool Trust had communicated to the Company’s Board that the Trust was not satisfied with the Company’sresults and that, as a result, the Trust was “actively engaged in an ongoing process, the goal of which has been toensure vigorous Company Board focus on resolving the Company’s current business challenges and onimplementing new growth strategies.” In that release, the Trust board chairman reiterated the Trust’slongstanding position that the Company Board, and not the Trust board, “is solely responsible and accountablefor the Company’s management and performance.”
29
On November 11, 2007 we announced that all of the members of our Board of Directors had resigned exceptfor Richard H. Lenny, who was at that time our Chairman of the Board and Chief Executive Officer, David J.West, who was at that time President of the Company and currently serves as our President and Chief ExecutiveOfficer, and Robert F. Cavanaugh, who is also a member of the board of directors of Hershey Trust Companyand board of managers (governing body) of Milton Hershey School. In addition, we announced that the MiltonHershey School Trust through stockholder action effected by written consent had amended the By-laws of theCompany to allow the Company’s stockholders to fix the number of directors to serve on our Board of Directorsand from time to time to increase or decrease such number of directors, expanded the size of our Board ofDirectors from 11 directors to 13 directors, and appointed eight new directors, including two who are alsomembers of the board of directors of Hershey Trust Company and board of managers of Milton Hershey School.
The Milton Hershey School Trust decided to explore a sale of The Hershey Company in June 2002, butsubsequently decided to terminate the sale process in September 2002. After terminating the sale process, theTrustee of the Milton Hershey School Trust advised the Pennsylvania Office of Attorney General in September2002 that it would not agree to any sale of its controlling interest in The Hershey Company without approval ofthe court having jurisdiction over the Milton Hershey School Trust following advance notice to the Office ofAttorney General. Subsequently, Pennsylvania enacted legislation that requires that the Office of AttorneyGeneral be provided advance notice of any transaction that would result in the Milton Hershey School Trust nolonger having voting control of the Company. The law provides specific statutory authority for the AttorneyGeneral to intercede, and petition the Court having jurisdiction over the Milton Hershey School Trust to stopsuch a transaction if the Attorney General can prove that the transaction is unnecessary for the future economicviability of the Company and is inconsistent with investment and management considerations under fiduciaryobligations. This legislation could have the effect of making it more difficult for a third party to acquire amajority of our outstanding voting stock and thereby delay or prevent a change in control of the Company.
In December 2000, our Board of Directors unanimously adopted a Stockholder Protection RightsAgreement (“Rights Agreement”). The Milton Hershey School Trust supported the Rights Agreement. Thisaction was not in response to any specific effort to acquire control of The Hershey Company. Under the RightsAgreement, our Board of Directors declared a dividend of one right (“Right”) for each outstanding share ofCommon Stock and Class B Stock payable to stockholders of record at the close of business on December 26,2000. The Rights will at no time have voting power or receive dividends. The issuance of the Rights has nodilutive effect, will not affect reported earnings per share, is not taxable and will not change the manner in whichour Common Stock is traded. We discuss the Rights Agreement in more detail in Note 14 to the ConsolidatedFinancial Statements.
30

LIQUIDITY AND CAPITAL RESOURCES
Our principal source of liquidity is operating cash flows. Our net income and, consequently, our cashprovided from operations are impacted by: sales volume, seasonal sales patterns, timing of new productintroductions, profit margins and price changes. Sales are typically higher during the third and fourth quarters ofthe year due to seasonal and holiday-related sales patterns. Generally, working capital needs peak during thesummer months. We meet these needs primarily by issuing commercial paper.
Cash Flows from Operating Activities
Our cash flows provided from (used by) operating activities were as follows:
For the years ended December 31, 2007 2006 2005
In thousands of dollars
Net income . . . . . . . . . . . . . . . . . . . . . . . . . . . . . . . . . . . . . . . . . $ 214,154 $559,061 $ 488,547Depreciation and amortization . . . . . . . . . . . . . . . . . . . . . . . . . 310,925 199,911 218,032Stock-based compensation and excess tax benefits . . . . . . . . . . 9,526 16,323 14,263Deferred income taxes . . . . . . . . . . . . . . . . . . . . . . . . . . . . . . . . (124,276) 4,173 71,038Business realignment and impairment charges, net of tax . . . . 267,653 7,573 74,021Contributions to pension plans . . . . . . . . . . . . . . . . . . . . . . . . . (15,836) (23,570) (277,492)Working capital . . . . . . . . . . . . . . . . . . . . . . . . . . . . . . . . . . . . . 148,019 (40,553) (174,010)Changes in other assets and liabilities . . . . . . . . . . . . . . . . . . . . (31,329) 275 47,363
Net cash provided from operating activities . . . . . . . . . . . $ 778,836 $723,193 $ 461,762
• Over the past three years, total cash provided from operating activities was approximately $2.0 billion.
• In 2007, depreciation and amortization expenses increased principally as the result of the accelerateddepreciation charges related to the 2007 business realignment initiatives. These amounts representednon-cash items that impacted net income and are reflected in the consolidated statements of cash flowsto reconcile cash flows from operating activities.
• The change in cash used by deferred income taxes in 2007 primarily reflected the deferred tax benefitrelated to the 2007 business realignment and impairment charges.
• We contributed $316.9 million to our pension plans over the past three years to improve the plans’funded status and to pay benefits under the non-funded plans. As of December 31, 2007, the fair valueof our pension plan assets exceeded benefits obligations by $354.0 million.
• Over the three-year period, cash provided from or used by working capital tended to fluctuate due tosales during December and working capital management practices, including initiatives implementedduring 2007 to reduce working capital.
• During the three-year period, cash provided from changes in other assets and liabilities primarilyreflected the impact of business realignment initiatives and the related tax effects, incentivecompensation, and the effect of hedging transactions.
• The decrease in income taxes paid in 2007 compared with 2006 primarily reflected a lower federalextension payment for 2006 income taxes and the impact of lower annualized taxable income for 2007.
31

Cash Flows from Investing Activities
Our cash flows provided from (used by) investing activities were as follows:
For the years ended December 31, 2007 2006 2005
In thousands of dollars
Capital additions . . . . . . . . . . . . . . . . . . . . . . . . . . . . . . . . . . . . $(189,698) $(183,496) $(181,069)Capitalized software additions . . . . . . . . . . . . . . . . . . . . . . . . . (14,194) (15,016) (13,236)Business acquisitions . . . . . . . . . . . . . . . . . . . . . . . . . . . . . . . . (100,461) (17,000) (47,074)Proceeds from divestitures . . . . . . . . . . . . . . . . . . . . . . . . . . . . — — 2,713
Net cash used by investing activities . . . . . . . . . . . . . . . . $(304,353) $(215,512) $(238,666)
• Capital additions were primarily associated with our global supply chain transformation program,modernization of existing facilities and purchases of manufacturing equipment for new products.
• Capitalized software additions were primarily for ongoing enhancement of our information systems.
• We anticipate total capital expenditures of $300 million to $325 million in 2008 of which approximately$150 million to $170 million is associated with our global supply chain transformation program.
• In May 2007, we entered into an agreement with Godrej Beverages and Foods, Ltd. to manufacture anddistribute confectionery products, snacks and beverages across India. Under the agreement, we invested$61.5 million in this business during 2007.
• In May 2007, our Company and Lotte Confectionery Co. LTD. entered into a manufacturing agreementto produce Hershey products and certain Lotte products for markets in China. We invested $39.0 millionin this business during 2007.
• In October 2006, our wholly-owned subsidiary, Artisan Confections Company, acquired the assets ofDagoba Organic Chocolates, LLC for $17.0 million.
• In August 2005, Artisan Confections Company acquired the assets of Joseph Schmidt Confections, Inc.and completed the acquisition of Scharffen Berger Chocolate Maker, Inc. The combined purchase pricefor Joseph Schmidt and Scharffen Berger was $47.1 million.
• In October 2005, our wholly-owned subsidiary, Hershey Canada Inc., sold its Mr. Freeze freeze popsbusiness for $2.7 million.
Cash Flows from Financing Activities
Our cash flows provided from (used by) financing activities were as follows:
For the years ended December 31, 2007 2006 2005
In thousands of dollars
Net change in short-term borrowings . . . . . . . . . . . . . . . . . . . . $ 195,055 $(163,826) $ 475,582Long-term borrowings . . . . . . . . . . . . . . . . . . . . . . . . . . . . . . . — 496,728 248,318Repayment of long-term debt . . . . . . . . . . . . . . . . . . . . . . . . . . (188,891) (234) (278,236)Cash dividends paid . . . . . . . . . . . . . . . . . . . . . . . . . . . . . . . . . (252,263) (235,129) (221,235)Exercise of stock options . . . . . . . . . . . . . . . . . . . . . . . . . . . . . 59,958 46,386 101,818Repurchase of Common Stock . . . . . . . . . . . . . . . . . . . . . . . . . (256,285) (621,648) (536,997)
Net cash used by financing activities . . . . . . . . . . . . . . . . $(442,426) $(477,723) $(210,750)
• We use short-term borrowings (commercial paper and bank borrowings) to fund seasonal workingcapital requirements and ongoing business needs. Additional information on short-term borrowings isincluded under Borrowing Arrangements below.
32

• In January 2007, we exercised our option to purchase a warehouse and distribution facility subject to aconsolidated lease arrangement and refinanced the related obligation of $38.7 million.
• In March 2007, we repaid $150.0 million of 6.95% Notes due in 2007.
• In August 2006, we issued $250 million of 5.3% Notes due in 2011 and $250 million of 5.45% Notesdue in 2016. The Notes were issued under a shelf registration statement on Form S-3 filed in May 2006described under Registration Statements below.
• In August 2005, we issued $250 million of 4.85% Notes due in 2015 under an August 1997 Form S-3Registration Statement.
• We paid cash dividends of $190.2 million on our Common Stock and $62.1 million on our Class BStock in 2007.
• Cash used for the repurchase of Common Stock was partially offset by cash received from the exerciseof stock options.
Repurchases and Issuances of Common Stock
For the years ended December 31, 2007 2006 2005
In thousands Shares Dollars Shares Dollars Shares Dollars
Shares repurchased under pre-approved sharerepurchase programs:
Open market repurchases . . . . . . . . . . . . . . . . 2,916 $149,983 9,912 $524,387 4,085 $238,157Milton Hershey School Trust repurchases . . . — — 689 38,482 69 3,936
Shares repurchased to replace Treasury Stockissued for stock options and employeebenefits . . . . . . . . . . . . . . . . . . . . . . . . . . . . . . . . 2,046 106,302 1,096 58,779 4,859 294,904
Total share repurchases . . . . . . . . . . . . . . . . . . . . . 4,962 256,285 11,697 621,648 9,013 536,997Shares issued for stock options and employee
benefits . . . . . . . . . . . . . . . . . . . . . . . . . . . . . . . . (1,748) (56,670) (1,437) (44,564) (2,949) (74,438)
Net change . . . . . . . . . . . . . . . . . . . . . . . . . . . . . . . 3,214 $199,615 10,260 $577,084 6,064 $462,559
• We intend to continue to repurchase shares of Common Stock in order to replace Treasury Stock sharesissued for exercised stock options. The value of shares purchased in a given period will vary based onstock options exercised over time and market conditions.
• During 2006, we completed share repurchase programs of $250 million approved in April 2005 and$500 million approved in December 2005. In December 2006, our Board of Directors approved anadditional $250 million share repurchase program. As of December 31, 2007, $100.0 million remainedavailable for repurchases of Common Stock under this program.
33

Cumulative Share Repurchases and Issuances
A summary of cumulative share repurchases and issuances is as follows:
Shares Dollars
(In thousands)
Shares repurchased under authorized programs:Open market repurchases . . . . . . . . . . . . . . . . . . . . . . . . . . . . . . . . . . . . . . . . . . . . . . . 57,436 $1,984,431Repurchases from the Milton Hershey School Trust . . . . . . . . . . . . . . . . . . . . . . . . . . 11,918 245,550Shares retired . . . . . . . . . . . . . . . . . . . . . . . . . . . . . . . . . . . . . . . . . . . . . . . . . . . . . . . . (1,056) (12,820)
Total repurchases under authorized programs . . . . . . . . . . . . . . . . . . . . . . . . . . . . . . . . . . . 68,298 2,217,161Privately negotiated purchases from the Milton Hershey School Trust . . . . . . . . . . . . . . . 67,282 1,501,373Shares reissued for stock option obligations, supplemental retirement contributions, and
employee stock ownership trust obligations . . . . . . . . . . . . . . . . . . . . . . . . . . . . . . . . . . (27,495) (710,551)Shares repurchased to replace reissued shares . . . . . . . . . . . . . . . . . . . . . . . . . . . . . . . . . . . 24,767 993,579
Total held as Treasury Stock as of December 31, 2007 . . . . . . . . . . . . . . . . . . . . . . . . . . . . 132,852 $4,001,562
Borrowing Arrangements
We maintain debt levels we consider prudent based on our cash flow, interest coverage ratio and percentageof debt to capital. We use debt financing to lower our overall cost of capital which increases our return onstockholders’ equity.
• In December 2006, we entered into a five-year agreement establishing an unsecured revolving creditfacility to borrow up to $1.1 billion, with an option to increase borrowings to $1.5 billion with theconsent of the lenders. During the fourth quarter of 2007, the lenders approved an extension of thisagreement by one year in accordance with our option under the agreement. The five-year agreement willnow expire in December 2012. We may use these funds for general corporate purposes, includingcommercial paper backstop and business acquisitions. Due to seasonal working capital needs, sharerepurchases and other business activities, we announced in August 2007 that we expected borrowings toexceed $1.1 billion from time to time during the next twelve months. In lieu of increasing the borrowinglimit under the five-year credit agreement, in August 2007, we entered into an additional unsecuredrevolving short-term credit agreement to borrow up to $300 million. Funds borrowed under the newshort-term credit agreement may be used for general corporate purposes, including commercial paperbackstop. The agreement will expire in August 2008. These unsecured revolving credit agreementscontain certain financial and other covenants, customary representations, warranties, and events ofdefault. As of December 31, 2007, we complied with all of these covenants.
• In March 2006, we entered into a short-term credit agreement establishing an unsecured revolving creditfacility to borrow up to $400 million through September 2006. In September 2006, we entered into anagreement amending the short-term facility. The amended agreement reduced the credit limit from $400million to $200 million and expired on December 1, 2006. We used the funds for general corporatepurposes, including commercial paper backstop. We entered into this agreement because we expectedborrowings to exceed the $900 million credit limit available under the revolving credit agreement ineffect at that time.
• In September 2005, we entered into a short-term credit agreement establishing an unsecured revolvingcredit facility to borrow up to $300 million. The agreement expired in December 2005. We used thefunds for general corporate purposes. We entered into this facility because we expected borrowings inlate 2005 to exceed the $900 million credit limit available under the revolving credit agreement in effectat that time. Borrowing increased due to the retirement of $200 million of 6.7% Notes in October 2005,refinancing of certain consolidated lease arrangements, contributions to our pension plans, stockrepurchases and seasonal working capital needs.
34

• In addition to the revolving credit facility, we maintain lines of credit with domestic and internationalcommercial banks. As of December 31, 2007, we could borrow up to approximately $57.0 million invarious currencies under the lines of credit and as of December 31, 2006, we could borrow up to $54.2million.
Registration Statements
• In September 2005, we filed a shelf registration statement on Form S-3 that was declared effective inJanuary 2006. Under this registration statement, we could offer on a delayed or continuous basis up to$750 million aggregate principal amount of additional debt securities (the “$750 Million ShelfRegistration Statement”).
• In May 2006, we filed a new shelf registration statement on Form S-3 that registered an indeterminateamount of debt securities. This registration statement was effective immediately upon filing underSecurities and Exchange Commission regulations governing “well-known seasoned issuers” (the “WKSIRegistration Statement”). The WKSI Registration Statement replaces, and will be used in lieu of, the$750 Million Shelf Registration Statement for offerings of debt securities occurring subsequent to May2006.
• In August 2006, we issued $250 million of 5.3% Notes due September 1, 2011, and $250 million of5.45% Notes due September 1, 2016. These Notes were issued under the WKSI Registration Statement.
• Proceeds from the debt issuances and any other offerings under the WKSI Registration Statement maybe used for general corporate requirements. These may include reducing existing borrowings, financingcapital additions, funding contributions to our pension plans, future business acquisitions and workingcapital requirements.
OFF-BALANCE SHEET ARRANGEMENTS, CONTRACTUAL OBLIGATIONS AND CONTINGENTLIABILITIES AND COMMITMENTS
As of December 31, 2007, our contractual cash obligations by year were as follows:
Payments Due by Year
(In thousands of dollars)
Contractual Obligations 2008 2009 2010 2011 2012 Thereafter Total
Unconditional PurchaseObligations . . . . . . . . . . $1,058,200 $618,000 $277,500 $ 99,300 $ — $ — $2,053,000
Non-cancelable OperatingLeases . . . . . . . . . . . . . . 15,376 11,901 7,458 6,314 5,419 7,937 54,405
Long-term Debt . . . . . . . . 6,104 8,034 8,240 256,596 154,103 852,992 1,286,069
Total Obligations . . . . . . . $1,079,680 $637,935 $293,198 $362,210 $159,522 $860,929 $3,393,474
In entering into contractual obligations, we have assumed the risk that might arise from the possibleinability of counterparties to meet the terms of their contracts. Our risk is limited to replacing the contracts atprevailing market rates. We do not expect any significant losses resulting from counterparty defaults.
Purchase Obligations
We enter into certain obligations for the purchase of raw materials. These obligations were primarily in theform of forward contracts for the purchase of raw materials from third-party brokers and dealers. These contractsminimize the effect of future price fluctuations by fixing the price of part or all of these purchase obligations.Total obligations for each year presented above, consists of fixed price contracts for the purchase of commoditiesand unpriced contracts that were valued using market prices as of December 31, 2007.
35

The cost of commodities associated with the unpriced contracts is variable as market prices change overfuture periods. We mitigate the variability of these costs to the extent we have entered into commodities futurescontracts to hedge our costs for those periods. Increases or decreases in market prices are offset by gains or losseson commodities futures contracts. This applies to the extent that we have hedged the unpriced contracts as ofDecember 31, 2007 and in future periods by entering into commodities futures contracts. Taking delivery of andmaking payments for the specific commodities for use in the manufacture of finished goods satisfies ourobligations under the forward purchase contracts. For each of the three years in the period ended December 31,2007, we satisfied these obligations by taking delivery of and making payment for the specific commodities.
Lease Arrangement with Special Purpose Trust
In January 2003, the FASB issued Interpretation No. 46, Consolidation of Variable Interest Entities, aninterpretation of ARB No. 51 (“Interpretation No. 46”). Interpretation No. 46 addresses consolidation by businessenterprises of special-purpose entities (“SPEs”), such as special-purpose trusts (“SPTs”), to which the usualcondition for consolidation described in Accounting Research Bulletin No. 51, Consolidated FinancialStatements, does not apply because the SPEs have no voting interests or otherwise are not subject to controlthrough ownership of voting interests. We adopted Interpretation No. 46 as of June 30, 2003, resulting in theconsolidation of off-balance sheet arrangements with SPTs. As of December 31, 2007 and 2006, we had nooff-balance sheet arrangements.
In December 2000, we entered into a lease agreement with the owner of a warehouse and distributionfacility in Redlands, California. The lease term was approximately ten years, with occupancy to begin uponcompletion of the facility. The lease agreement contained an option for us to purchase the facility. In January2002, we assigned our right to purchase the facility to an SPT that in turn purchased the completed facility andleased it to us under a new lease agreement. The term of this lease agreement was five years, with up to fourrenewal periods of five years each with the consent of the lessor. The cost incurred by the SPT to acquire thefacility, including land, was $40.1 million. We exercised our option to purchase the facility at the original cost of$40.1 million and refinanced the related obligation at the end of the lease term in January 2007.
Asset Retirement Obligations
Our Company has a number of facilities that contain varying degrees of asbestos in certain locations withinthese facilities. Our asbestos management program is compliant with current regulations. Current regulationsrequire that we handle or dispose of this type of asbestos in a special manner if such facilities undergo majorrenovations or are demolished. We believe we do not have sufficient information to estimate the fair value of anyasset retirement obligations related to these facilities. We cannot specify the settlement date or range of potentialsettlement dates and, therefore, sufficient information is not available to apply an expected present valuetechnique. We expect to maintain the facilities with repairs and maintenance activities that would not involve theremoval of asbestos.
As of December 31, 2007, certain real estate associated with the closure of facilities under the global supplychain transformation program is being held for sale. We are not aware of any significant obligations related to theenvironmental remediation of these facilities which has not been reflected in our current estimates.
Income Tax Obligations
We base our deferred income taxes, accrued income taxes and provision for income taxes upon income,statutory tax rates, the legal structure of our Company and interpretation of tax laws. We are regularly audited byFederal, state and foreign tax authorities. From time to time, these audits result in assessments of additional tax. Wemaintain reserves for such assessments. We adjust the reserves, from time to time, based upon changing facts andcircumstances, such as receiving audit assessments or clearing of an item for which a reserve has been established.Assessments of additional tax require cash payments. We are not aware of any significant income tax assessments.The amount of tax obligations is not included in the table of contractual cash obligations by year on page 35 becausewe are unable to reasonably predict the ultimate amount or timing of settlement of our reserves for income taxes.
36

ACCOUNTING POLICIES AND MARKET RISKS ASSOCIATED WITH DERIVATIVEINSTRUMENTS
We use certain derivative instruments, from time to time, including interest rate swaps, foreign currencyforward exchange contracts and options, and commodities futures contracts, to manage interest rate, foreigncurrency exchange rate and commodity market price risk exposures. We enter into interest rate swap agreementsand foreign currency contracts and options for periods consistent with related underlying exposures. Thesederivative instruments do not constitute positions independent of those exposures. We enter into commoditiesfutures contracts for varying periods. These futures contracts are intended to be, and are effective as hedges ofmarket price risks associated with anticipated raw material purchases, energy requirements and transportationcosts. We do not hold or issue derivative instruments for trading purposes and are not a party to any instrumentswith leverage or prepayment features. In entering into these contracts, we have assumed the risk that might arisefrom the possible inability of counterparties to meet the terms of their contracts. We do not expect any significantlosses from counterparty defaults.
Accounting Under Statement of Financial Accounting Standards No. 133
We account for derivative instruments in accordance with Statement of Financial Accounting StandardsNo. 133, Accounting for Derivative Instruments and Hedging Activities, as amended (“SFAS No. 133”). SFASNo. 133 provides that we report the effective portion of the gain or loss on a derivative instrument designated andqualifying as a cash flow hedging instrument as a component of other comprehensive income. We reclassify theeffective portion of the gain or loss on these derivative instruments into income in the same period or periodsduring which the hedged transaction affects earnings. The remaining gain or loss on the derivative instrumentresulting from hedge ineffectiveness, if any, must be recognized currently in earnings.
Fair value hedges pertain to derivative instruments that qualify as a hedge of exposures to changes in the fairvalue of a firm commitment or assets and liabilities recognized on the balance sheet. For fair value hedges, wereflect the gain or loss on the derivative instrument in earnings in the period of change together with theoffsetting loss or gain on the hedged item. The effect of that accounting is to reflect in earnings the extent towhich the hedge is not effective in achieving offsetting changes in fair value.
As of December 31, 2007, we designated and accounted for all derivative instruments, including foreignexchange forward contracts and commodities futures contracts, as cash flow hedges. Additional informationregarding accounting policies associated with derivative instruments is contained in Note 5 to the ConsolidatedFinancial Statements, Derivative Instruments and Hedging Activities.
The information below summarizes our market risks associated with long-term debt and derivativeinstruments outstanding as of December 31, 2007. Note 1, Note 5 and Note 7 to the Consolidated FinancialStatements provide additional information.
Long-Term Debt
The table below presents the principal cash flows and related interest rates by maturity date for long-termdebt, including the current portion, as of December 31, 2007. We determined the fair value of long-term debtbased upon quoted market prices for the same or similar debt issues.
Maturity Date
2008 2009 2010 2011 2012 Thereafter Total Fair Value
In thousands of dollars except for rates
Long-term Debt . . . . . $6,104 $8,034 $8,240 $256,596 $154,103 $852,992 $1,286,069 $1,331,141Interest Rate . . . . 10.0% 10.1% 9.9% 5.4% 7.0% 6.2% 6.2%
We calculated the interest rates on variable rate obligations using the rates in effect as of December 31, 2007.
37
Interest Rate Swaps
In order to minimize financing costs and to manage interest rate exposure, from time to time, we enter intointerest rate swap agreements.
In December 2005, we entered into forward swap agreements to hedge interest rate exposure related to$500 million of term financing to be executed during 2006. In February 2006, we terminated a forward swapagreement hedging the anticipated execution of $250 million of term financing because the transaction was nolonger expected to occur by the originally specified time period or within an additional two-month period of timethereafter. We recorded a gain of $1.0 million in the first quarter of 2006 as a result of the discontinuance of thiscash flow hedge. In August 2006, a forward swap agreement hedging the anticipated issuance of $250 million of10-year notes matured resulting in cash receipts of $3.7 million. The $3.7 million gain on the swap will beamortized as a reduction to interest expense over the term of the $250 million of 5.45% Notes due September 1,2016.
In October 2003, we entered into swap agreements effectively converting interest payments on long-termdebt from fixed to variable rates. We converted interest payments on $200 million of 6.7% Notes due in October2005 and $150 million of 6.95% Notes due in March 2007 from their respective fixed rates to variable ratesbased on the London Interbank Offered Rate, LIBOR. In March 2004, we terminated these agreements, resultingin cash receipts totaling $5.2 million, with a corresponding increase to the carrying value of the long-term debt.We amortized this increase over the terms of the respective long-term debt as a reduction to interest expense.
As of December 31, 2007, and 2006 we were not a party to any interest rate swap agreements.
Foreign Exchange Forward Contracts
We enter into foreign exchange forward contracts to hedge transactions denominated in foreign currencies.These transactions are primarily purchase commitments or forecasted purchases of equipment, raw materials andfinished goods. We also may hedge payment of forecasted intercompany transactions with our subsidiariesoutside the United States. These contracts reduce currency risk from exchange rate movements. We generallyhedge foreign currency price risks for periods from 3 to 24 months.
Foreign exchange forward contracts are effective as hedges of identifiable, foreign currency commitments.We designate our foreign exchange forward contracts as cash flow hedging derivatives. The fair value of thesecontracts is classified as either an asset or liability on the Consolidated Balance Sheets. We record gains andlosses on these contracts as a component of other comprehensive income and reclassify them into earnings in thesame period during which the hedged transaction affects earnings.
A summary of foreign exchange forward contracts and the corresponding amounts at contracted forwardrates is as follows:
December 31, 2007 2006
ContractAmount
PrimaryCurrencies
ContractAmount
PrimaryCurrencies
In millions of dollars
Foreign exchange forward contracts to purchaseforeign currencies . . . . . . . . . . . . . . . . . . . . . . . . .
$13.8British poundsAustralian dollarsEuros
$29.0Australian dollarsCanadian dollarsEuros
Foreign exchange forward contracts to sell foreigncurrencies . . . . . . . . . . . . . . . . . . . . . . . . . . . . . . . .
$86.7Canadian dollarsBrazilian reaisMexican pesos
38
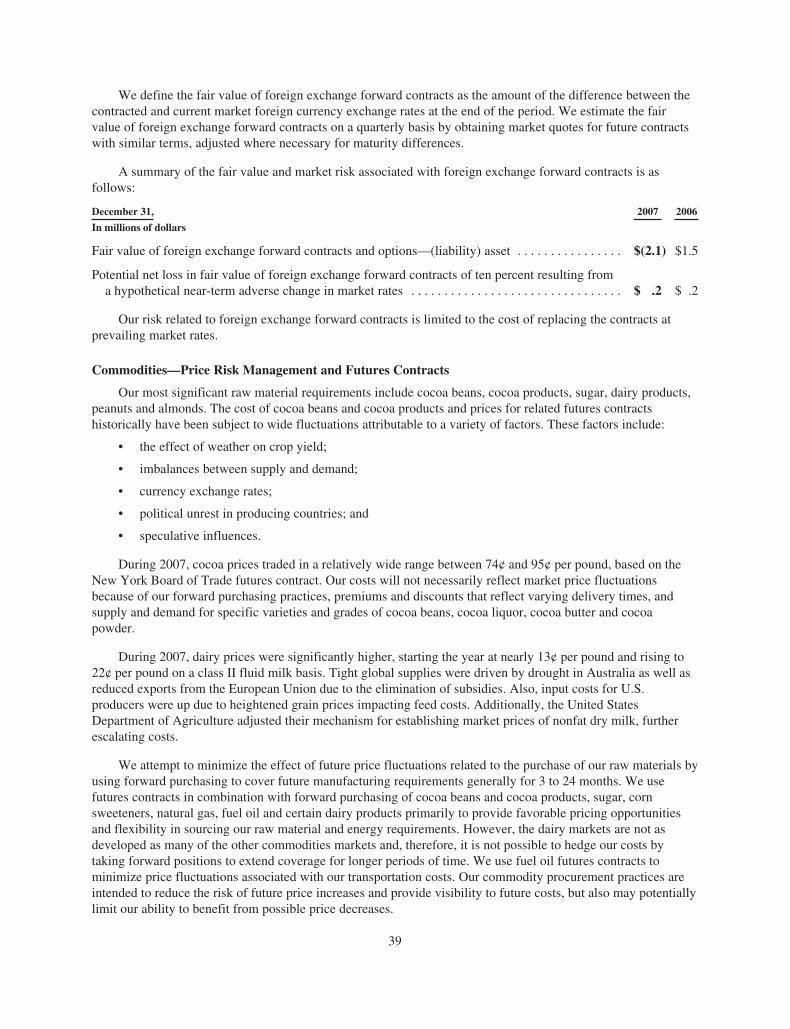
We define the fair value of foreign exchange forward contracts as the amount of the difference between thecontracted and current market foreign currency exchange rates at the end of the period. We estimate the fairvalue of foreign exchange forward contracts on a quarterly basis by obtaining market quotes for future contractswith similar terms, adjusted where necessary for maturity differences.
A summary of the fair value and market risk associated with foreign exchange forward contracts is asfollows:
December 31, 2007 2006
In millions of dollars
Fair value of foreign exchange forward contracts and options—(liability) asset . . . . . . . . . . . . . . . . $(2.1) $1.5
Potential net loss in fair value of foreign exchange forward contracts of ten percent resulting froma hypothetical near-term adverse change in market rates . . . . . . . . . . . . . . . . . . . . . . . . . . . . . . . . $ .2 $ .2
Our risk related to foreign exchange forward contracts is limited to the cost of replacing the contracts atprevailing market rates.
Commodities—Price Risk Management and Futures Contracts
Our most significant raw material requirements include cocoa beans, cocoa products, sugar, dairy products,peanuts and almonds. The cost of cocoa beans and cocoa products and prices for related futures contractshistorically have been subject to wide fluctuations attributable to a variety of factors. These factors include:
• the effect of weather on crop yield;
• imbalances between supply and demand;
• currency exchange rates;
• political unrest in producing countries; and
• speculative influences.
During 2007, cocoa prices traded in a relatively wide range between 74¢ and 95¢ per pound, based on theNew York Board of Trade futures contract. Our costs will not necessarily reflect market price fluctuationsbecause of our forward purchasing practices, premiums and discounts that reflect varying delivery times, andsupply and demand for specific varieties and grades of cocoa beans, cocoa liquor, cocoa butter and cocoapowder.
During 2007, dairy prices were significantly higher, starting the year at nearly 13¢ per pound and rising to22¢ per pound on a class II fluid milk basis. Tight global supplies were driven by drought in Australia as well asreduced exports from the European Union due to the elimination of subsidies. Also, input costs for U.S.producers were up due to heightened grain prices impacting feed costs. Additionally, the United StatesDepartment of Agriculture adjusted their mechanism for establishing market prices of nonfat dry milk, furtherescalating costs.
We attempt to minimize the effect of future price fluctuations related to the purchase of our raw materials byusing forward purchasing to cover future manufacturing requirements generally for 3 to 24 months. We usefutures contracts in combination with forward purchasing of cocoa beans and cocoa products, sugar, cornsweeteners, natural gas, fuel oil and certain dairy products primarily to provide favorable pricing opportunitiesand flexibility in sourcing our raw material and energy requirements. However, the dairy markets are not asdeveloped as many of the other commodities markets and, therefore, it is not possible to hedge our costs bytaking forward positions to extend coverage for longer periods of time. We use fuel oil futures contracts tominimize price fluctuations associated with our transportation costs. Our commodity procurement practices areintended to reduce the risk of future price increases and provide visibility to future costs, but also may potentiallylimit our ability to benefit from possible price decreases.
39

We account for commodities futures contracts in accordance with SFAS No. 133. We make or receive cashtransfers to or from commodity futures brokers on a daily basis reflecting changes in the value of futurescontracts on the New York Board of Trade or various other exchanges. These changes in value representunrealized gains and losses. We report these cash transfers as a component of other comprehensive income. Thecash transfers offset higher or lower cash requirements for the payment of future invoice prices of raw materials,energy requirements and transportation costs. Futures held in excess of the amount required to fix the price ofunpriced physical forward contracts are effective as hedges of anticipated purchases.
Sensitivity Analysis
The following sensitivity analysis reflects our market risk to a hypothetical adverse market price movementof ten percent, based on our net commodity positions at four dates spaced equally throughout the year. Our netcommodity positions consist of the amount of futures contracts we hold over or under the amount of futurescontracts we need to price unpriced physical forward contracts for the same commodities. Inventories, pricedforward contracts and estimated anticipated purchases not yet under contract were not included in the sensitivityanalysis calculations. We define a loss, for purposes of determining market risk, as the potential decrease in fairvalue or the opportunity cost resulting from the hypothetical adverse price movement. The fair values of netcommodity positions reflect quoted market prices or estimated future prices, including estimated carrying costscorresponding with the future delivery period.
For the years ended December 31, 2007 2006
FairValue
Market Risk(Hypothetical10% Change)
FairValue
Market Risk(Hypothetical10% Change)
In millions of dollars
Highest long position . . . . . . . . . . . . . . . . . . . . . . . . . . . . . . . . . . $(112.5) $11.3 $ 138.4 $13.8Lowest long position . . . . . . . . . . . . . . . . . . . . . . . . . . . . . . . . . . . (460.9) 46.1 (147.0) 14.7Average position (long) . . . . . . . . . . . . . . . . . . . . . . . . . . . . . . . . (317.0) 31.7 (37.3) 3.7
The decrease in fair values from 2006 to 2007 primarily reflected a decrease in net commodity positions,which more than offset the impact of higher prices in 2007. The negative positions primarily resulted as unpricedphysical forward contract futures requirements exceeded the amount of commodities futures that we held atcertain points in time during the years.
Sensitivity analysis disclosures represent forward-looking statements which are subject to certain risks anduncertainties that could cause our actual results to differ materially from those presently anticipated or projected.Factors that could affect the sensitivity analysis disclosures include:
• significant increases or decreases in market prices reflecting fluctuations attributable to the effect ofweather on crop yield;
• imbalances between supply and demand;
• currency exchange rates;
• political unrest in producing countries;
• speculative influences; and
• changes in our hedging strategies.
40

USE OF ESTIMATES AND OTHER CRITICAL ACCOUNTING POLICIES
Our consolidated financial statements are prepared in accordance with GAAP. In various instances, GAAPrequires management to make estimates, judgments and assumptions that affect the amounts reported in theconsolidated financial statements and accompanying notes. We believe that our most critical accounting policiesand estimates relate to the following:
• Accounts Receivable—Trade
• Accrued Liabilities
• Pension and Other Post-Retirement Benefit Plans
• Goodwill and Other Intangible Assets
• Commodities Futures Contracts
Management has discussed the development, selection and disclosure of critical accounting policies andestimates with the Audit Committee of our Board of Directors. While we base estimates and assumptions on ourknowledge of current events and actions we may undertake in the future, actual results may ultimately differfrom these estimates and assumptions. For a discussion of our significant accounting policies, refer to Note 1 ofthe Notes to Consolidated Financial Statements.
Accounts Receivable—Trade
In the normal course of business, we extend credit to customers that satisfy pre-defined credit criteria. Ourprimary concentration of credit risk is associated with McLane Company, Inc., one of the largest wholesaledistributors in the United States to convenience stores, drug stores, wholesale clubs and mass merchandisers.McLane Company, Inc. accounted for approximately 25.9% of our total accounts receivable as of December 31,2007. As of December 31, 2007, no other customer accounted for more than 10% of our total accountsreceivable. We believe we have little concentration of credit risk associated with the remainder of our customerbase.
Accounts Receivable—Trade, as shown on the Consolidated Balance Sheets, were net of allowances andanticipated discounts. An allowance for doubtful accounts is determined through analysis of the following:
• Aging of accounts receivable at the date of the financial statements;
• Assessments of collectibility based on historical trends; and
• Evaluation of the impact of current and projected economic conditions.
We monitor the collectibility of our accounts receivable on an ongoing basis by analyzing aged accountsreceivable, assessing the credit worthiness of our customers and evaluating the impact of reasonably likelychanges in economic conditions that may impact credit risks. Estimates with regard to the collectibility ofaccounts receivable are reasonably likely to change in the future.
Information on our Accounts Receivable—Trade, related expenses and assumptions is as follows:
For the three-year period 2005-2007
In millions of dollars, except percents
Average expense for potential uncollectible accounts . . . . . . . . . . . . . . . . . . . . . . . . . . . . . . . . . . . . . . . $.8Average write-offs of uncollectible accounts . . . . . . . . . . . . . . . . . . . . . . . . . . . . . . . . . . . . . . . . . . . . . . $2.0Allowance for doubtful accounts as a percentage of gross accounts receivable . . . . . . . . . . . . . . . . . . . 1% – 2%
• We recognize the provision for uncollectible accounts as selling, marketing and administrative expensein the Consolidated Statements of Income.
41

• If we made reasonably possible near-term changes in the most material assumptions regardingcollectibility of accounts receivable, our annual provision could change within the following range:
• A reduction in expense of approximately $4.7 million; and
• An increase in expense of approximately $4.0 million.
• Changes in estimates for future uncollectible accounts receivable would not have a material impact onour liquidity or capital resources.
Accrued Liabilities
Accrued liabilities requiring the most difficult or subjective judgments include liabilities associated withmarketing promotion programs and potentially unsaleable products.
Liabilities associated with marketing promotion programs
We recognize the costs of marketing promotion programs as a reduction to net sales along with acorresponding accrued liability based on estimates at the time of revenue recognition.
Information on our promotional costs and assumptions is as follows:
For the years ended December 31, 2007 2006 2005
In millions of dollars
Promotional costs . . . . . . . . . . . . . . . . . . . . . . . . . . . . . . . . . . . . . . . . . . . . . . . . . . . . . . $702.1 $631.7 $583.5
• We determine the amount of the accrued liability by:
• Analysis of programs offered;
• Historical trends;
• Expectations regarding customer and consumer participation;
• Sales and payment trends; and
• Experience with payment patterns associated with similar, previously offered programs.
• The estimated costs of these programs are reasonably likely to change in the future due to changes intrends with regard to customer and consumer participation, particularly for new programs and forprograms related to the introduction of new products.
• Reasonably possible near-term changes in the most material assumptions regarding the cost ofpromotional programs could result in changes within the following range:
• A reduction in costs of approximately $16.0 million
• An increase in costs of approximately $3.0 million
• Changes in these assumptions would affect net sales and income before income taxes.
• Over the three-year period ended December 31, 2007, actual promotion costs have not deviated from theestimated amounts by more than 6.0%.
• Changes in estimates related to the cost of promotional programs would not have a material impact onour liquidity or capital resources.
Liabilities associated with potentially unsaleable products
• At the time of sale, we estimate a cost for the possibility that products will become aged or unsaleable inthe future. The estimated cost is included as a reduction to net sales.
• A related accrued liability is determined using statistical analysis that incorporates historical salestrends, seasonal timing and sales patterns, and product movement at retail.
42

• Estimates for costs associated with unsaleable products may change as a result of inventory levels in thedistribution channel, current economic trends, changes in consumer demand, the introduction of newproducts and changes in trends of seasonal sales in response to promotional programs.
• Over the three-year period ended December 31, 2007, costs associated with aged or unsaleable productshave amounted to approximately 2% of gross sales.
• Reasonably possible near-term changes in the most material assumptions regarding the estimates of suchcosts would have increased or decreased net sales and income before income taxes in a range from $.7million to $1.4 million.
• Over the three-year period ended December 31, 2007, actual costs have not deviated from our estimatesby more than 1%.
• Reasonably possible near-term changes in the estimates of costs associated with unsaleable productswould not have a material impact on our liquidity or capital resources.
Pension and Other Post-Retirement Benefit Plans
Overview
We sponsor a number of defined benefit pension plans. The primary plans are The Hershey CompanyRetirement Plan and The Hershey Company Retirement Plan for Hourly Employees. These are cash balanceplans that provide pension benefits for most domestic employees hired prior to January 1, 2007. We monitorlegislative and regulatory developments regarding cash balance plans, as well as recent court cases, for anyimpact on our plans. We also sponsor two primary post-retirement benefit plans. The health care plan iscontributory, with participants’ contributions adjusted annually, and the life insurance plan is non-contributory.
We fund domestic pension liabilities in accordance with the limits imposed by the Employee RetirementIncome Security Act of 1974 and Federal income tax laws. For years beginning after 2007, we will need tocomply with the funding requirements of the Pension Protection Act of 2006. We fund non-domestic pensionliabilities in accordance with laws and regulations applicable to those plans. We broadly diversify our pensionplan assets, consisting primarily of domestic and international common stocks and fixed income securities. Short-term and long-term liabilities associated with benefit plans are primarily determined based on actuarialcalculations. These calculations consider payroll and employee data, including age and years of service, alongwith actuarial assumptions at the date of the financial statements. We take into consideration long-termprojections with regard to economic conditions, including interest rates, return on assets and the rate of increasein compensation levels. With regard to liabilities associated with post-retirement benefit plans that provide healthcare and life insurance, we take into consideration the long-term annual rate of increase in the per capita cost ofthe covered benefits. In compliance with the provisions of Statement of Financial Accounting Standards No. 87,Employers’ Accounting for Pensions, and Statement of Financial Accounting Standards No. 106, Employers’Accounting for Postretirement Benefits Other Than Pensions, we review the discount rate assumptions and mayrevise them annually. The expected long-term rate of return on assets assumption (“asset return assumption”) forfunded plans is by its nature of a longer duration and revised only when long-term asset return projectionsdemonstrate that need.
In September 2006, the FASB issued Statement of Financial Accounting Standards No. 158, Employers’Accounting for Defined Benefit Pension and Other Postretirement Plans, an amendment of FASB StatementsNo. 87, 88, 106, and 132 (R) (“SFAS No. 158”). SFAS No. 158 requires an employer that is a business entity andsponsors one or more single-employer defined benefit plans to:
• Recognize the funded status of a benefit plan—measured as the difference between plan assets at fairvalue and the benefit obligation—in its statement of financial position. For a pension plan, the benefitobligation is the projected benefit obligation; for any other post-retirement benefit plan, such as a retireehealth care plan, the benefit obligation is the accumulated post-retirement benefit obligation.
43

• Recognize as a component of other comprehensive income, net of tax, the gains or losses and priorservice costs or credits that arise during the period but are not recognized as components of net periodicbenefit cost.
• Measure defined benefit plan assets and obligations as of the date of the employer’s fiscal year-endstatement of financial position.
• Disclose in the notes to financial statements additional information about certain effects on net periodicbenefit cost for the next fiscal year that arise from delayed recognition of the gains or losses, priorservice costs or credits, and transition asset or obligation.
We adopted the recognition and related disclosure provisions of SFAS No. 158 as of December 31, 2006.
Pension Plans
Our pension plan costs and related assumptions were as follows:
For the years ended December 31, 2007 2006 2005
In millions of dollars
Net periodic pension benefit (income) costs . . . . . . . . . . . . . . . . . . . . . . . . . . . . . . . . . . . . . $(9.0) $25.3 $29.9
Assumptions:Average discount rate assumptions—net periodic benefit cost calculation . . . . . . . . . . . . . 5.8% 5.4% 5.7%Average discount rate assumptions—benefit obligation calculation . . . . . . . . . . . . . . . . . . 6.2% 5.7% 5.4%Asset return assumptions . . . . . . . . . . . . . . . . . . . . . . . . . . . . . . . . . . . . . . . . . . . . . . . . . . . 8.5% 8.5% 8.5%
Net Periodic Pension Benefit Costs
We recorded net periodic pension benefit income in 2007 primarily due to the modifications announced inOctober 2006 which reduced future benefits under The Hershey Company Retirement Plan, The HersheyCompany Retirement Plan for Hourly Employees and the Supplemental Executive Retirement Plan, the higheractual return on pension assets during 2006, and the impact of a higher discount rate assumption as ofDecember 31, 2006. Pension income is expected to increase somewhat in 2008 due to the impact of the 2007business realignment initiatives and the retirement or departure of certain executives.
Actuarial gains and losses may arise when actual experience differs from assumed experience or when werevise the actuarial assumptions used to value the plans’ obligations. We only amortize the unrecognized netactuarial gains/losses in excess of 10% of a respective plan’s projected benefit obligation, or the fair market valueof assets, if greater. The estimated recognized net actuarial gain component of net periodic pension benefitincome for 2008 is $.2 million. The 2007 recognized net actuarial loss component of net periodic pension benefitincome was $1.1 million. Projections beyond 2008 are dependent on a variety of factors such as changes to thediscount rate and the actual return on pension plan assets.
Average Discount Rate Assumption—Net Periodic Benefit (Income) Costs
The discount rate represents the estimated rate at which we could effectively settle our pension benefitobligations. In order to estimate this rate for 2007 and 2006, a single effective rate of discount was determined byour actuaries after discounting the pension obligation’s cash flows using the spot rate of matching duration fromthe Citigroup Pension Discount Curve. In 2005, we considered the yields of high quality securities in determiningthe average discount rate assumptions. High quality securities are generally considered to be those receiving arating no lower than the second highest given by a recognized rating agency. The duration of such securities isreasonably comparable to the duration of our pension plan liabilities.
44

The use of a different discount rate assumption can significantly affect net periodic benefit (income) cost:
• A one-percentage point decrease in the discount rate assumption would have decreased 2007 netperiodic pension benefit income by $10.9 million.
• A one-percentage point increase in the discount rate assumption would have increased 2007 net periodicpension benefit income by $4.5 million.
Average Discount Rate Assumption—Benefit Obligations
The discount rate assumption to be used in calculating the amount of benefit obligations is determined in thesame manner as the average discount rate assumption used to calculate net periodic benefit (income) cost asdescribed above. We increased our 2007 discount rate assumption due to the increasing interest rate environment.
The use of a different discount rate assumption can significantly affect the amount of benefit obligations:
• A one-percentage point decrease in the discount rate assumption would have increased theDecember 31, 2007 pension benefits obligations by $106.9 million.
• A one-percentage point increase in the discount rate assumption would have decreased theDecember 31, 2007 pension benefits obligations by $89.8 million.
Asset Return Assumptions
We based the expected return on plan assets component of net periodic pension benefit (income) costs onthe fair market value of pension plan assets. To determine the expected return on plan assets, we consider thecurrent and expected asset allocations, as well as historical and expected returns on the categories of plan assets.The historical geometric average return over the 20 years prior to December 31, 2007 was approximately 9.8%.The actual return on assets was as follows:
For the years ended December 31, 2007 2006 2005
Actual return on assets . . . . . . . . . . . . . . . . . . . . . . . . . . . . . . . . . . . . . 7.1% 15.7% 7.8%
The use of a different asset return assumption can significantly affect net periodic benefit (income) cost:
• A one-percentage point decrease in the asset return assumption would have decreased 2007 net periodicpension benefit income by $13.9 million.
• A one-percentage point increase in the asset return assumption would have increased 2007 net periodicpension benefit income by $13.7 million.
Our asset investment policies specify ranges of asset allocation percentages for each asset class. The rangesfor the domestic pension plans were as follows:
Asset Class Allocation Range
Equity securities . . . . . . . . . . . . . . . . . . . . . . . . . . . . . . . . . . . . . . . . . . . . . . . 58% – 85%Debt securities . . . . . . . . . . . . . . . . . . . . . . . . . . . . . . . . . . . . . . . . . . . . . . . . 15% – 42%Cash and certain other investments . . . . . . . . . . . . . . . . . . . . . . . . . . . . . . . . 0% – 5%
As of December 31, 2007, actual allocations were within the specified ranges. We expect the level ofvolatility in pension plan asset returns to be in line with the overall volatility of the markets and weightingswithin the asset classes. As of December 31, 2007, the benefit plan fixed income assets were invested primarilyin conventional instruments benchmarked to the Lehman Aggregate Bond Index and direct exposure to highlyvolatile, risky sectors, such as sub-prime mortgages, was minimal.
45
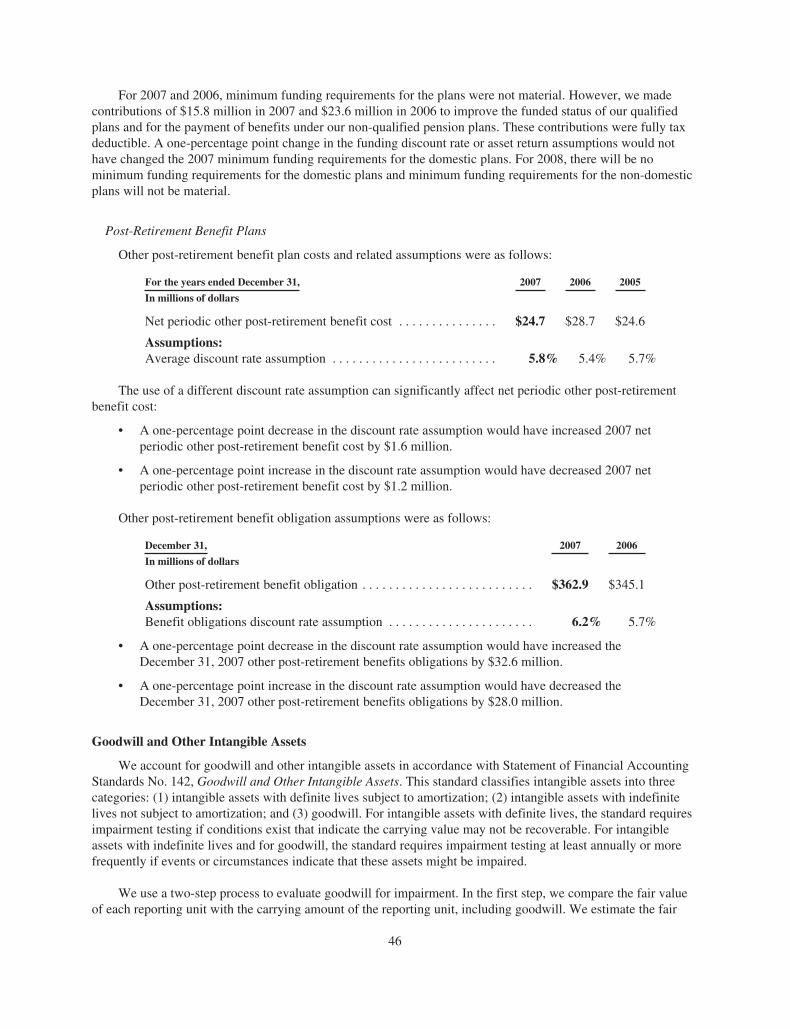
For 2007 and 2006, minimum funding requirements for the plans were not material. However, we madecontributions of $15.8 million in 2007 and $23.6 million in 2006 to improve the funded status of our qualifiedplans and for the payment of benefits under our non-qualified pension plans. These contributions were fully taxdeductible. A one-percentage point change in the funding discount rate or asset return assumptions would nothave changed the 2007 minimum funding requirements for the domestic plans. For 2008, there will be nominimum funding requirements for the domestic plans and minimum funding requirements for the non-domesticplans will not be material.
Post-Retirement Benefit Plans
Other post-retirement benefit plan costs and related assumptions were as follows:
For the years ended December 31, 2007 2006 2005
In millions of dollars
Net periodic other post-retirement benefit cost . . . . . . . . . . . . . . . $24.7 $28.7 $24.6
Assumptions:Average discount rate assumption . . . . . . . . . . . . . . . . . . . . . . . . . 5.8% 5.4% 5.7%
The use of a different discount rate assumption can significantly affect net periodic other post-retirementbenefit cost:
• A one-percentage point decrease in the discount rate assumption would have increased 2007 netperiodic other post-retirement benefit cost by $1.6 million.
• A one-percentage point increase in the discount rate assumption would have decreased 2007 netperiodic other post-retirement benefit cost by $1.2 million.
Other post-retirement benefit obligation assumptions were as follows:
December 31, 2007 2006
In millions of dollars
Other post-retirement benefit obligation . . . . . . . . . . . . . . . . . . . . . . . . . . $362.9 $345.1
Assumptions:Benefit obligations discount rate assumption . . . . . . . . . . . . . . . . . . . . . . 6.2% 5.7%
• A one-percentage point decrease in the discount rate assumption would have increased theDecember 31, 2007 other post-retirement benefits obligations by $32.6 million.
• A one-percentage point increase in the discount rate assumption would have decreased theDecember 31, 2007 other post-retirement benefits obligations by $28.0 million.
Goodwill and Other Intangible Assets
We account for goodwill and other intangible assets in accordance with Statement of Financial AccountingStandards No. 142, Goodwill and Other Intangible Assets. This standard classifies intangible assets into threecategories: (1) intangible assets with definite lives subject to amortization; (2) intangible assets with indefinitelives not subject to amortization; and (3) goodwill. For intangible assets with definite lives, the standard requiresimpairment testing if conditions exist that indicate the carrying value may not be recoverable. For intangibleassets with indefinite lives and for goodwill, the standard requires impairment testing at least annually or morefrequently if events or circumstances indicate that these assets might be impaired.
We use a two-step process to evaluate goodwill for impairment. In the first step, we compare the fair valueof each reporting unit with the carrying amount of the reporting unit, including goodwill. We estimate the fair
46

value of the reporting unit based on discounted future cash flows. If the estimated fair value of the reporting unitis less than the carrying amount of the reporting unit, we complete a second step to determine the amount of thegoodwill impairment that we should record. In the second step, we determine an implied fair value of thereporting unit’s goodwill by allocating the reporting unit’s fair value to all of its assets and liabilities other thangoodwill (including any unrecognized intangible assets). We compare the resulting implied fair value of thegoodwill to the carrying amount and record an impairment charge for the difference.
The assumptions we used to estimate fair value are based on the past performance of each reporting unit andreflect the projections and assumptions that we use in current operating plans. We also consider assumptions thatmarket participants may use. Such assumptions are subject to change due to changing economic and competitiveconditions.
Our other intangible assets consist primarily of customer-related intangible assets, patents and trademarksobtained through business acquisitions. We amortize customer-related intangible assets and patents over theirestimated useful lives. The useful lives of trademarks were determined to be indefinite and, therefore, we do notamortize them. We evaluate our trademarks for impairment by comparing the carrying amount of the assets totheir estimated fair value. If the estimated fair value is less than the carrying amount, we record an impairmentcharge to reduce the asset to its estimated fair value. The estimated fair value is generally determined based ondiscounted future cash flows.
The Company performs annual impairment tests in the fourth quarter of each year or when circumstancesarise that indicate a possible impairment might exist. As a result of reduced expectations for future cash flowsresulting from lower expected profitability, we determined that the carrying amount of our wholly-ownedsubsidiary, Hershey do Brasil, exceeded its fair value and recorded a non-cash impairment charge of $12.3million in December 2007. There was no tax benefit associated with this charge. We discuss the impairmenttesting results in more detail in Note 1 and Note 16 to the Consolidated Financial Statements. We determined thatnone of our goodwill or other intangible assets were impaired as of December 31, 2006 and 2005 based on ourannual impairment evaluation.
Commodities Futures Contracts
We use futures contracts in combination with forward purchasing of cocoa and other commodities primarilyto reduce the risk of future price increases, provide visibility to future costs and take advantage of marketfluctuations. Accounting for commodities futures contracts is in accordance with SFAS No. 133. Additionalinformation with regard to accounting policies associated with commodities futures contracts and otherderivative instruments is contained in Note 5, Derivative Instruments and Hedging Activities.
Our gains (losses) on cash flow hedging derivatives were as follows:
For the years ended December 31, 2007 2006 2005
In millions of dollars
Net after-tax gains (losses) on cash flow hedging derivatives . . . . . . . . . . . . . $6.8 $11.4 $ (6.5)Reclassification adjustments from accumulated other comprehensive loss to
income . . . . . . . . . . . . . . . . . . . . . . . . . . . . . . . . . . . . . . . . . . . . . . . . . . . . . .2 (5.3) 18.1Hedge ineffectiveness (losses) gains recognized in cost of sales, before
tax . . . . . . . . . . . . . . . . . . . . . . . . . . . . . . . . . . . . . . . . . . . . . . . . . . . . . . . . . (.5) 2.0 (2.0)
• We reflected reclassification adjustments related to gains or losses on commodities futures contracts incost of sales.
• No gains or losses on commodities futures contracts resulted because we discontinued a hedge due tothe probability that the forecasted hedged transaction would not occur.
47

• We recognized no components of gains or losses on commodities futures contracts in income due toexcluding such components from the hedge effectiveness assessment.
The amount of net losses on cash flow hedging derivatives, including foreign exchange forward contractsand commodities futures contracts, expected to be reclassified into earnings in the next twelve months wasapproximately $5.0 million after tax as of December 31, 2007. This amount is primarily associated withcommodities futures contracts.
RETURN MEASURES
We believe that two important measures of profitability are operating return on average stockholders’ equityand operating return on average invested capital. These operating return measures calculated in accordance withGAAP are presented on the SIX-YEAR CONSOLIDATED FINANCIAL SUMMARY on page 18 with thedirectly comparable Non-GAAP operating return measures. The Non-GAAP operating return measures arecalculated using Non-GAAP Income excluding items affecting comparability. A reconciliation of Net Incomepresented in accordance with GAAP to Non-GAAP Income excluding items affecting comparability is providedon pages 19 and 20, along with the reasons why we believe that the use of Non-GAAP Income in thesecalculations provides useful information to investors.
Operating Return on Average Stockholders’ Equity
Operating return on average stockholders’ equity is calculated by dividing net income by the average ofbeginning and ending stockholders’ equity. To calculate Non-GAAP operating return on average stockholders’equity, we define Non-GAAP Income as net income adjusted to exclude certain items. These items include thefollowing:
• After-tax effect of the business realignment and impairment charges in 2007, 2006, 2005, 2003 and2002
• Adjustment to income tax contingency reserves which reduced the provision for income taxes in 2004
• After-tax gain on the sale of a group of our gum brands in 2003
• After-tax effect of incremental expenses to explore the possible sale of our Company in 2002
Our operating return on average stockholders’ equity, GAAP basis, was 33.6% in 2007. Our Non-GAAPoperating return on average stockholders’ equity was 75.5% in 2007. The decrease in operating return on averagestockholders’ equity in 2007 was principally due to lower income. Over the last six years, our Non-GAAPoperating return on stockholders’ equity has ranged from 32.8% in 2002 to 75.5% in 2007.
Operating Return on Average Invested Capital
Operating return on average invested capital is calculated by dividing earnings by average invested capital.Average invested capital consists of the annual average of the beginning and ending balances of long-term debt,deferred income taxes and stockholders’ equity.
For the calculation of operating return on average invested capital, GAAP basis, earnings is defined as netincome adjusted to add back the after-tax effect of interest on long-term debt. For the calculation of theNon-GAAP operating return measure, we define earnings as net income adjusted to add back the after-tax effectof interest on long-term debt excluding the following:
• After-tax effect of the business realignment and impairment charges in 2007, 2006, 2005, 2003 and2002
• Adjustment to income tax contingency reserves on the provision for income taxes in 2004
48

• After-tax gain on the sale of a group of our gum brands in 2003
• After-tax effect of incremental expenses to explore the possible sale of our Company in 2002
Our operating return on average invested capital, GAAP basis, was 12.4% in 2007. Our Non-GAAPoperating return on average invested capital was 25.0% in 2007. Over the last six years, our Non-GAAPoperating return on average invested capital has ranged from 18.9% in 2002 and 2003 to 26.8% in 2005 and2006.
OUTLOOK
The outlook section contains a number of forward-looking statements, all of which are based on currentexpectations. Actual results may differ materially. Refer to Risk Factors beginning on page 9 for informationconcerning the key risks to achieving our future performance goals.
The year ended December 31, 2007 was very difficult. We experienced sharp increases in the cost ofcommodities, particularly costs for dairy products. These cost increases totaled approximately $100 million andreduced gross margin by approximately 240 basis points. We also experienced increased competitive activity andchanging consumer trends toward premium and trade-up product segments that affected our growth andprofitability. In the face of these challenges, we did not have adequate product innovation and sufficient brandsupport or retail execution in our core U.S. market. Additionally, we continued to invest in key internationalmarkets.
We expect this environment to continue into 2008 with continued increases in input costs versus 2007 ofapproximately $100 million, reducing gross margin by 200 basis points in 2008. We will also incur higher costsfor increased investment in brand support and selling capabilities in the U.S., while we are taking steps toenhance product innovation across our portfolio. We will also be continuing to invest in key internationalmarkets, particularly China and India.
To offset higher input costs, we are implementing aggressive productivity and cost savings initiatives inaddition to those already underway as part of our global supply chain transformation program. We are alsopursuing opportunities to improve price realization, including list price increases effective in January 2008.However, these pricing actions will only partly offset input cost increases and expenses associated withinvestment spending plans, resulting in lower EBIT and EPS, excluding items affecting comparability.
We expect consolidated net sales to grow 3% to 4% in 2008. Our primary goal is to stabilize businessperformance in the United States. We will continue to emphasize our iconic brands, particularly Reese’s,Hershey’s and Kisses. We will also introduce Hershey’s Bliss™, Signatures packaged candy and Starbucks®
branded chocolates to more fully participate in the rapidly growing premium and trade-up segments of thechocolate category. We will also have the full-year benefit of increased levels of retail coverage and increasedinvestment in brand support. For the remainder of the Americas, we expect increases in net sales and profitabilityfrom Canada and Mexico, offset somewhat in Brazil as we restructure our business.
Global growth is a key component of our future. We plan continued focus on growth in Asia, particularlyChina and India. We expect Godrej Hershey Foods and Beverages Company to have a positive impact on netsales for 2008 as we geographically expand the sugar confectionery business and introduce milk mix products.We anticipate net sales increases in China as the product line we introduced in 2007 gains distribution andconsumer trial. We also anticipate the opening of Hershey’s Shanghai Chocolate World prior to the 2008Olympics to gain additional exposure for our brands.
For 2008, we expect total pre-tax business realignment and impairment charges for our global supply chaintransformation program and restructuring our business in Brazil to be in the range of $140 to $160 million. Weexpect costs of approximately $85 million to be included in cost of sales, primarily for accelerated depreciation,
49

and approximately $20 million to be included in selling, marketing and administrative expenses for start up costsand program management. The remainder of these costs will be included in business realignment and impairmentcharges. Total charges associated with our business realignment initiatives in 2008 are expected to reduce dilutedearnings per share by $0.37 to $0.42.
As a result of higher input costs and increased investment in trade and consumer promotional programs andadvertising, along with investment in our international businesses, we expect EBIT to decrease in 2008,excluding the impact of business realignment and impairment charges. We expect EBIT margin to decline due toinvestments in advertising, selling capabilities and building infrastructure for our international businesses.
Business realignment and impairment charges associated with our global supply chain transformationprogram and the restructuring of our business in Brazil will reduce net income and earnings per share in 2008.Excluding the impact of these business realignment initiatives, net income is expected to decline reflecting theincreased investments in our businesses. As a result, non-GAAP earnings per share-diluted excluding itemsaffecting comparability is expected to be within the $1.85 to $1.90 range for 2008.
A reconciliation of GAAP and non-GAAP items to the Company’s earnings per share-diluted outlook is asfollows:
2008
Expected EPS-diluted in accordance with GAAP . . . . . . . . . . . . . . . . . . . . . . . . . . . . . . . . $1.43-1.53Total business realignment and impairment charges . . . . . . . . . . . . . . . . . . . . . . . . . . . . . . $0.37-0.42
Non-GAAP expected EPS-diluted excluding items affecting comparability . . . . . . . . . . . $1.85-1.90
We believe that the disclosure of non-GAAP expected EPS-diluted excluding items affecting comparabilityprovides investors with a better comparison of expected year-to-year operating results. A reconciliation of certainhistorical results presented in accordance with GAAP to non-GAAP financial measures excluding items affectingcomparability is provided on pages 19 and 20, along with the reasons why we believe the use of non-GAAPfinancial measures provides useful information to investors.
We anticipate cash flows from operating activities in 2008 to be strong, but below 2007 levels as a result ofreduced working capital improvements compared with 2007 and increased cash required for our global supplychain transformation program. We expect working capital to improve in 2008, primarily driven by inventoryreductions in the second half of the year, but not at the levels experienced in 2007. Net cash provided fromoperating activities is expected to exceed cash requirements for capital additions, capitalized software additionsand anticipated dividend payments. For 2008, we expect total capital additions to be in the range of $300 to $325million, with $150 to $170 million associated with our global supply chain transformation program.
SUBSEQUENT EVENT
In January 2008, we announced an increase in the wholesale prices of our domestic confectionery line,effective immediately. The price increase applied to our standard bar, king-size bar, 6-pack and vending lines andrepresented a weighted average increase of approximately thirteen percent on these items. These productsrepresent approximately one-third of our U.S. confectionery portfolio. The price changes approximated a threepercent price increase over our entire domestic product line. We implemented this action to help partially offsetincreases in input costs, including raw materials, fuel, utilities and transportation.
NEW ACCOUNTING PRONOUNCEMENTS
In September 2006, the FASB issued Statement of Financial Accounting Standards No. 157, Fair ValueMeasurements (“SFAS No. 157”). SFAS No. 157 establishes a framework for measuring fair value in GAAP,and expands disclosures about fair value measurements. SFAS No. 157 applies under other accounting
50
pronouncements that require or permit fair value measurements. SFAS No. 157 is effective for our Companybeginning January 1, 2008 as it applies to the accounting for financial assets and liabilities, as well as for anyother assets and liabilities that are carried at fair value on a recurring basis in the financial statements. We do notexpect any significant changes to our financial accounting and reporting as a result of this new accountingstandard.
In February 2007, the FASB issued Statement of Financial Accounting Standards No. 159, The Fair ValueOption for Financial Assets and Financial Liabilities (“SFAS No. 159”). SFAS No. 159 permits entities tochoose to measure many financial instruments and certain other items at fair value and establishes presentationand disclosure requirements designed to facilitate comparisons between entities that choose differentmeasurement attributes for similar types of assets and liabilities. SFAS No. 159 is effective for our Companybeginning January 1, 2008 for financial assets and liabilities, as well as for any other assets and liabilities that arecarried at fair value on a recurring basis in the financial statements. We do not expect any significant changes toour financial accounting and reporting as a result of this new accounting standard.
In December 2007, the FASB issued Statement of Financial Accounting Standards No. 141 (revised 2007),Business Combinations (“SFAS No. 141R”). The objective of SFAS No. 141R is to improve the relevance,representational faithfulness, and comparability of the information that a reporting entity provides in its financialreports about a business combination and its effects. SFAS No. 141R establishes principles and requirements forhow the acquirer:
a. Recognizes and measures in its financial statements the identifiable assets acquired, the liabilitiesassumed and any noncontrolling interest in the acquiree;
b. Recognizes and measures the goodwill acquired in the business combination or a gain from a bargainpurchase;
c. Determines what information to disclose to enable users of the financial statements to evaluate thenature and financial effects of the business combination.
SFAS No. 141R is effective for our Company for business combinations occurring subsequent to December 31,2008. We have not yet determined the impact of the adoption of this accounting standard.
In December 2007, the FASB also issued Statement of Financial Accounting Standards No. 160,Noncontrolling Interests in Consolidated Financial Statements, an amendment of ARB No. 51 (“SFAS No. 160”).The objective of SFAS No. 160 is to improve the relevance, comparability and transparency of the financialinformation that a reporting entity provides in its consolidated financial statements by establishing accountingand reporting standards for the noncontrolling interest in a subsidiary and for the deconsolidation of a subsidiary.SFAS No. 160 is effective for our Company as of January 1, 2009. We have not yet determined the impact of theadoption of this new accounting standard.
Item 7A. QUANTITATIVE AND QUALITATIVE DISCLOSURES ABOUT MARKET RISK
The information required by this item with respect to market risk is set forth in the section entitled“Accounting Policies and Market Risks Associated with Derivative Instruments,” found on pages 37 through 40.
51
Item 8. FINANCIAL STATEMENTS AND SUPPLEMENTARY DATAPAGE
INDEX TO CONSOLIDATED FINANCIAL STATEMENTS
Responsibility for Financial Statements . . . . . . . . . . . . . . . . . . . . . . . . . . . . . . . . . . . . . . . . . . . . . . . . . . . . . 53
Report of Independent Registered Public Accounting Firm . . . . . . . . . . . . . . . . . . . . . . . . . . . . . . . . . . . . . 54
Consolidated Statements of Income for the years ended December 31, 2007, 2006 and 2005 . . . . . . . . . . . 55
Consolidated Balance Sheets as of December 31, 2007 and 2006 . . . . . . . . . . . . . . . . . . . . . . . . . . . . . . . . . 56
Consolidated Statements of Cash Flows for the years ended December 31, 2007, 2006 and 2005 . . . . . . . 57
Consolidated Statements of Stockholders’ Equity for the years ended December 31, 2007, 2006 and2005 . . . . . . . . . . . . . . . . . . . . . . . . . . . . . . . . . . . . . . . . . . . . . . . . . . . . . . . . . . . . . . . . . . . . . . . . . . . . . . 58
Notes to Consolidated Financial Statements . . . . . . . . . . . . . . . . . . . . . . . . . . . . . . . . . . . . . . . . . . . . . . . . . 59
52

RESPONSIBILITY FOR FINANCIAL STATEMENTS
The Hershey Company is responsible for the financial statements and other financial information containedin this report. The Company believes that the financial statements have been prepared in conformity with U.S.generally accepted accounting principles appropriate under the circumstances to reflect in all material respectsthe substance of applicable events and transactions. In preparing the financial statements, it is necessary thatmanagement make informed estimates and judgments. The other financial information in this annual report isconsistent with the financial statements.
The Company maintains a system of internal accounting controls designed to provide reasonable assurancethat financial records are reliable for purposes of preparing financial statements and that assets are properlyaccounted for and safeguarded. The concept of reasonable assurance is based on the recognition that the cost ofthe system must be related to the benefits to be derived. The Company believes its system provides anappropriate balance in this regard. The Company maintains an Internal Audit Department which reviews theadequacy and tests the application of internal accounting controls.
The 2007, 2006 and 2005 financial statements have been audited by KPMG LLP, an independent registeredpublic accounting firm. KPMG LLP’s report on the Company’s financial statements is included on page 54.
The Audit Committee of the Board of Directors of the Company, consisting solely of independent,non-management directors, meets regularly with the independent auditors, internal auditors and management todiscuss, among other things, the audit scopes and results. KPMG LLP and the internal auditors both have full andfree access to the Audit Committee, with and without the presence of management.
David J. WestChief Executive Officer
Humberto P. AlfonsoChief Financial Officer
53

REPORT OF INDEPENDENT REGISTERED PUBLIC ACCOUNTING FIRM
The Board of Directors and Stockholders
The Hershey Company:
We have audited the accompanying consolidated balance sheets of The Hershey Company and subsidiaries(the “Company”) as of December 31, 2007 and 2006, and the related consolidated statements of income, cashflows and stockholders’ equity for each of the years in the three-year period ended December 31, 2007. Theseconsolidated financial statements are the responsibility of the Company’s management. Our responsibility is toexpress an opinion on these consolidated financial statements based on our audits.
We conducted our audits in accordance with the standards of the Public Company Accounting OversightBoard (United States). Those standards require that we plan and perform the audit to obtain reasonable assuranceabout whether the financial statements are free of material misstatement. An audit includes examining, on a testbasis, evidence supporting the amounts and disclosures in the financial statements. An audit also includesassessing the accounting principles used and significant estimates made by management, as well as evaluatingthe overall financial statement presentation. We believe that our audits provide a reasonable basis for ouropinion.
In our opinion, the consolidated financial statements referred to above present fairly, in all material respects,the financial position of The Hershey Company and subsidiaries as of December 31, 2007 and 2006, and theresults of their operations and their cash flows for each of the years in the three-year period ended December 31,2007, in conformity with U.S. generally accepted accounting principles.
As discussed in Note 1, the Company adopted Statement of Financial Accounting Standards No. 158,Employers’ Accounting for Defined Benefit Pensions and Other Postretirement Plans, at December 31, 2006.
We also have audited, in accordance with the standards of the Public Company Accounting Oversight Board(United States), the effectiveness of the Company’s internal control over financial reporting as of December 31,2007, based on criteria established in Internal Control-Integrated Framework issued by the Committee ofSponsoring Organizations of the Treadway Commission (COSO), and our report dated February 18, 2008expressed an unqualified opinion on the effectiveness of the Company’s internal control over financial reporting.
New York, New YorkFebruary 18, 2008
54
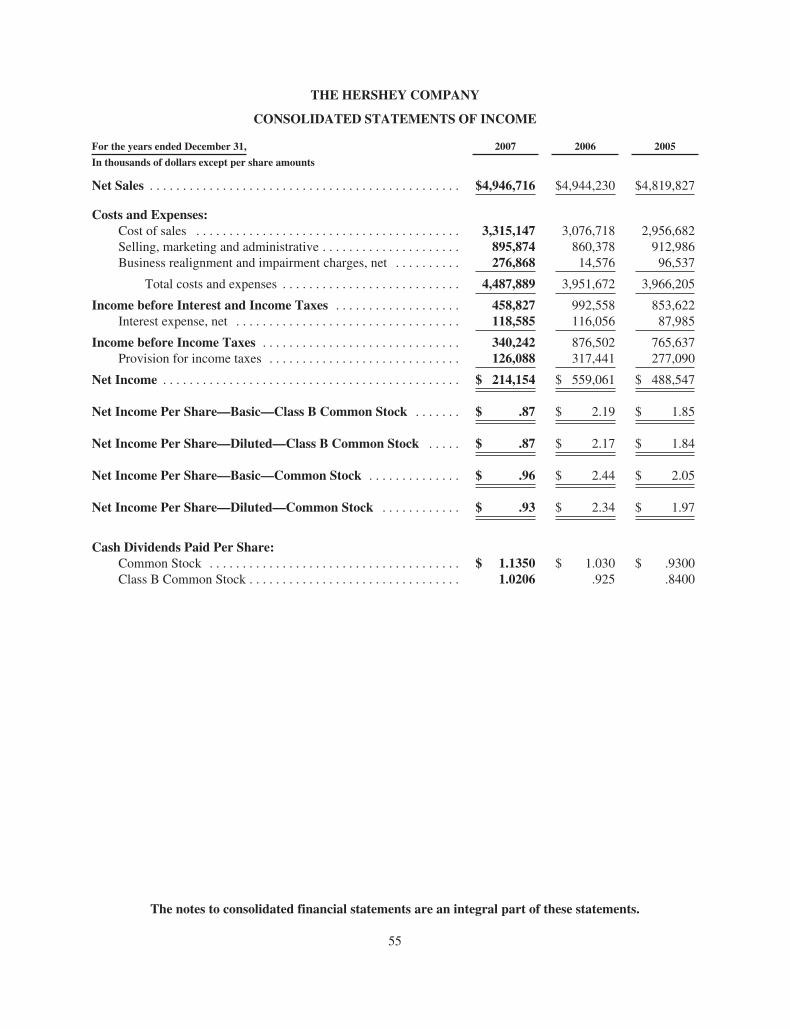
THE HERSHEY COMPANY
CONSOLIDATED STATEMENTS OF INCOME
For the years ended December 31, 2007 2006 2005
In thousands of dollars except per share amounts
Net Sales . . . . . . . . . . . . . . . . . . . . . . . . . . . . . . . . . . . . . . . . . . . . . . . $4,946,716 $4,944,230 $4,819,827
Costs and Expenses:Cost of sales . . . . . . . . . . . . . . . . . . . . . . . . . . . . . . . . . . . . . . . . 3,315,147 3,076,718 2,956,682Selling, marketing and administrative . . . . . . . . . . . . . . . . . . . . . 895,874 860,378 912,986Business realignment and impairment charges, net . . . . . . . . . . 276,868 14,576 96,537
Total costs and expenses . . . . . . . . . . . . . . . . . . . . . . . . . . . 4,487,889 3,951,672 3,966,205
Income before Interest and Income Taxes . . . . . . . . . . . . . . . . . . . 458,827 992,558 853,622Interest expense, net . . . . . . . . . . . . . . . . . . . . . . . . . . . . . . . . . . 118,585 116,056 87,985
Income before Income Taxes . . . . . . . . . . . . . . . . . . . . . . . . . . . . . . 340,242 876,502 765,637Provision for income taxes . . . . . . . . . . . . . . . . . . . . . . . . . . . . . 126,088 317,441 277,090
Net Income . . . . . . . . . . . . . . . . . . . . . . . . . . . . . . . . . . . . . . . . . . . . . $ 214,154 $ 559,061 $ 488,547
Net Income Per Share—Basic—Class B Common Stock . . . . . . . $ .87 $ 2.19 $ 1.85
Net Income Per Share—Diluted—Class B Common Stock . . . . . $ .87 $ 2.17 $ 1.84
Net Income Per Share—Basic—Common Stock . . . . . . . . . . . . . . $ .96 $ 2.44 $ 2.05
Net Income Per Share—Diluted—Common Stock . . . . . . . . . . . . $ .93 $ 2.34 $ 1.97
Cash Dividends Paid Per Share:Common Stock . . . . . . . . . . . . . . . . . . . . . . . . . . . . . . . . . . . . . . $ 1.1350 $ 1.030 $ .9300Class B Common Stock . . . . . . . . . . . . . . . . . . . . . . . . . . . . . . . . 1.0206 .925 .8400
The notes to consolidated financial statements are an integral part of these statements.
55
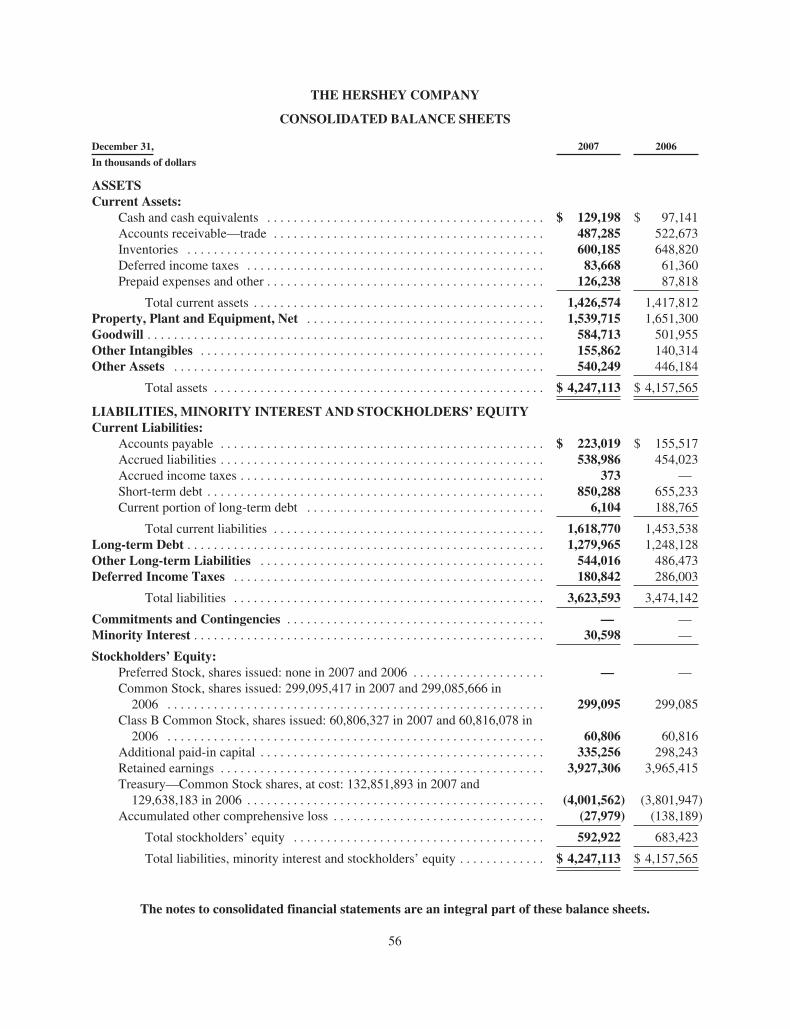
THE HERSHEY COMPANY
CONSOLIDATED BALANCE SHEETS
December 31, 2007 2006
In thousands of dollars
ASSETSCurrent Assets:
Cash and cash equivalents . . . . . . . . . . . . . . . . . . . . . . . . . . . . . . . . . . . . . . . . . . $ 129,198 $ 97,141Accounts receivable—trade . . . . . . . . . . . . . . . . . . . . . . . . . . . . . . . . . . . . . . . . . 487,285 522,673Inventories . . . . . . . . . . . . . . . . . . . . . . . . . . . . . . . . . . . . . . . . . . . . . . . . . . . . . . 600,185 648,820Deferred income taxes . . . . . . . . . . . . . . . . . . . . . . . . . . . . . . . . . . . . . . . . . . . . . 83,668 61,360Prepaid expenses and other . . . . . . . . . . . . . . . . . . . . . . . . . . . . . . . . . . . . . . . . . . 126,238 87,818
Total current assets . . . . . . . . . . . . . . . . . . . . . . . . . . . . . . . . . . . . . . . . . . . . 1,426,574 1,417,812Property, Plant and Equipment, Net . . . . . . . . . . . . . . . . . . . . . . . . . . . . . . . . . . . . 1,539,715 1,651,300Goodwill . . . . . . . . . . . . . . . . . . . . . . . . . . . . . . . . . . . . . . . . . . . . . . . . . . . . . . . . . . . . 584,713 501,955Other Intangibles . . . . . . . . . . . . . . . . . . . . . . . . . . . . . . . . . . . . . . . . . . . . . . . . . . . . 155,862 140,314Other Assets . . . . . . . . . . . . . . . . . . . . . . . . . . . . . . . . . . . . . . . . . . . . . . . . . . . . . . . . 540,249 446,184
Total assets . . . . . . . . . . . . . . . . . . . . . . . . . . . . . . . . . . . . . . . . . . . . . . . . . . $ 4,247,113 $ 4,157,565
LIABILITIES, MINORITY INTEREST AND STOCKHOLDERS’ EQUITYCurrent Liabilities:
Accounts payable . . . . . . . . . . . . . . . . . . . . . . . . . . . . . . . . . . . . . . . . . . . . . . . . . $ 223,019 $ 155,517Accrued liabilities . . . . . . . . . . . . . . . . . . . . . . . . . . . . . . . . . . . . . . . . . . . . . . . . . 538,986 454,023Accrued income taxes . . . . . . . . . . . . . . . . . . . . . . . . . . . . . . . . . . . . . . . . . . . . . . 373 —Short-term debt . . . . . . . . . . . . . . . . . . . . . . . . . . . . . . . . . . . . . . . . . . . . . . . . . . . 850,288 655,233Current portion of long-term debt . . . . . . . . . . . . . . . . . . . . . . . . . . . . . . . . . . . . 6,104 188,765
Total current liabilities . . . . . . . . . . . . . . . . . . . . . . . . . . . . . . . . . . . . . . . . . 1,618,770 1,453,538Long-term Debt . . . . . . . . . . . . . . . . . . . . . . . . . . . . . . . . . . . . . . . . . . . . . . . . . . . . . . 1,279,965 1,248,128Other Long-term Liabilities . . . . . . . . . . . . . . . . . . . . . . . . . . . . . . . . . . . . . . . . . . . 544,016 486,473Deferred Income Taxes . . . . . . . . . . . . . . . . . . . . . . . . . . . . . . . . . . . . . . . . . . . . . . . 180,842 286,003
Total liabilities . . . . . . . . . . . . . . . . . . . . . . . . . . . . . . . . . . . . . . . . . . . . . . . 3,623,593 3,474,142
Commitments and Contingencies . . . . . . . . . . . . . . . . . . . . . . . . . . . . . . . . . . . . . . . — —Minority Interest . . . . . . . . . . . . . . . . . . . . . . . . . . . . . . . . . . . . . . . . . . . . . . . . . . . . . 30,598 —
Stockholders’ Equity:Preferred Stock, shares issued: none in 2007 and 2006 . . . . . . . . . . . . . . . . . . . . — —Common Stock, shares issued: 299,095,417 in 2007 and 299,085,666 in
2006 . . . . . . . . . . . . . . . . . . . . . . . . . . . . . . . . . . . . . . . . . . . . . . . . . . . . . . . . . 299,095 299,085Class B Common Stock, shares issued: 60,806,327 in 2007 and 60,816,078 in
2006 . . . . . . . . . . . . . . . . . . . . . . . . . . . . . . . . . . . . . . . . . . . . . . . . . . . . . . . . . 60,806 60,816Additional paid-in capital . . . . . . . . . . . . . . . . . . . . . . . . . . . . . . . . . . . . . . . . . . . 335,256 298,243Retained earnings . . . . . . . . . . . . . . . . . . . . . . . . . . . . . . . . . . . . . . . . . . . . . . . . . 3,927,306 3,965,415Treasury—Common Stock shares, at cost: 132,851,893 in 2007 and
129,638,183 in 2006 . . . . . . . . . . . . . . . . . . . . . . . . . . . . . . . . . . . . . . . . . . . . . (4,001,562) (3,801,947)Accumulated other comprehensive loss . . . . . . . . . . . . . . . . . . . . . . . . . . . . . . . . (27,979) (138,189)
Total stockholders’ equity . . . . . . . . . . . . . . . . . . . . . . . . . . . . . . . . . . . . . . 592,922 683,423
Total liabilities, minority interest and stockholders’ equity . . . . . . . . . . . . . $ 4,247,113 $ 4,157,565
The notes to consolidated financial statements are an integral part of these balance sheets.
56
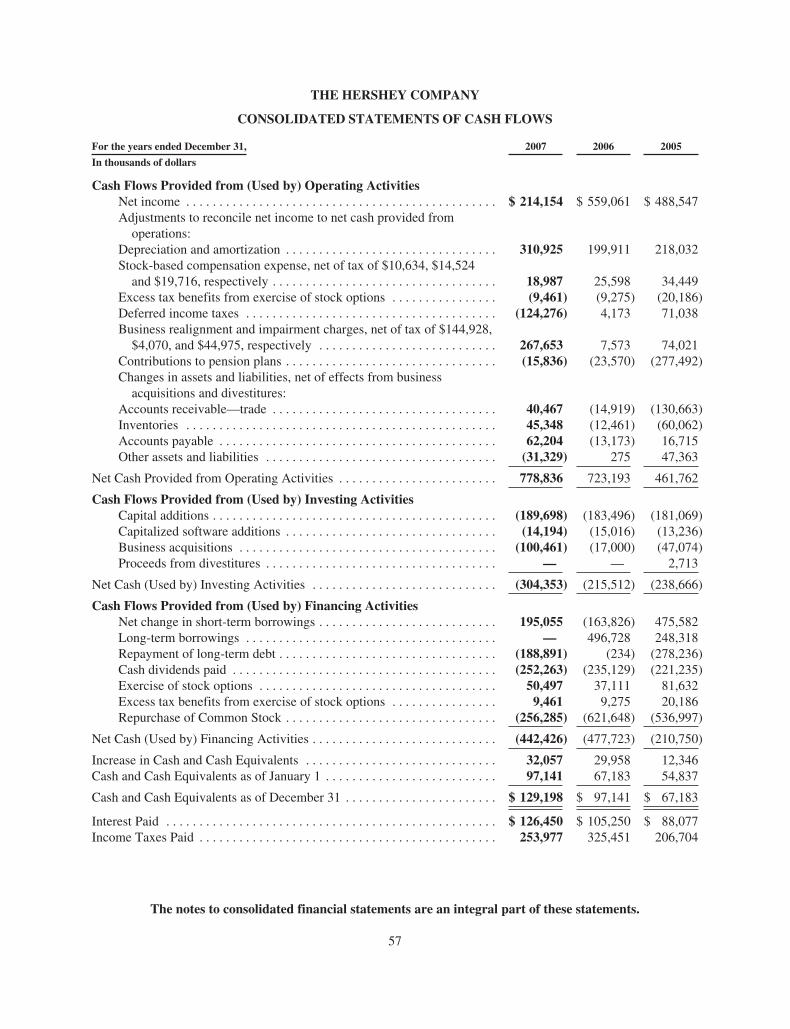
THE HERSHEY COMPANY
CONSOLIDATED STATEMENTS OF CASH FLOWS
For the years ended December 31, 2007 2006 2005
In thousands of dollars
Cash Flows Provided from (Used by) Operating ActivitiesNet income . . . . . . . . . . . . . . . . . . . . . . . . . . . . . . . . . . . . . . . . . . . . . . . $ 214,154 $ 559,061 $ 488,547Adjustments to reconcile net income to net cash provided from
operations:Depreciation and amortization . . . . . . . . . . . . . . . . . . . . . . . . . . . . . . . . 310,925 199,911 218,032Stock-based compensation expense, net of tax of $10,634, $14,524
and $19,716, respectively . . . . . . . . . . . . . . . . . . . . . . . . . . . . . . . . . . 18,987 25,598 34,449Excess tax benefits from exercise of stock options . . . . . . . . . . . . . . . . (9,461) (9,275) (20,186)Deferred income taxes . . . . . . . . . . . . . . . . . . . . . . . . . . . . . . . . . . . . . . (124,276) 4,173 71,038Business realignment and impairment charges, net of tax of $144,928,
$4,070, and $44,975, respectively . . . . . . . . . . . . . . . . . . . . . . . . . . . 267,653 7,573 74,021Contributions to pension plans . . . . . . . . . . . . . . . . . . . . . . . . . . . . . . . . (15,836) (23,570) (277,492)Changes in assets and liabilities, net of effects from business
acquisitions and divestitures:Accounts receivable—trade . . . . . . . . . . . . . . . . . . . . . . . . . . . . . . . . . . 40,467 (14,919) (130,663)Inventories . . . . . . . . . . . . . . . . . . . . . . . . . . . . . . . . . . . . . . . . . . . . . . . 45,348 (12,461) (60,062)Accounts payable . . . . . . . . . . . . . . . . . . . . . . . . . . . . . . . . . . . . . . . . . . 62,204 (13,173) 16,715Other assets and liabilities . . . . . . . . . . . . . . . . . . . . . . . . . . . . . . . . . . . (31,329) 275 47,363
Net Cash Provided from Operating Activities . . . . . . . . . . . . . . . . . . . . . . . . 778,836 723,193 461,762
Cash Flows Provided from (Used by) Investing ActivitiesCapital additions . . . . . . . . . . . . . . . . . . . . . . . . . . . . . . . . . . . . . . . . . . . (189,698) (183,496) (181,069)Capitalized software additions . . . . . . . . . . . . . . . . . . . . . . . . . . . . . . . . (14,194) (15,016) (13,236)Business acquisitions . . . . . . . . . . . . . . . . . . . . . . . . . . . . . . . . . . . . . . . (100,461) (17,000) (47,074)Proceeds from divestitures . . . . . . . . . . . . . . . . . . . . . . . . . . . . . . . . . . . — — 2,713
Net Cash (Used by) Investing Activities . . . . . . . . . . . . . . . . . . . . . . . . . . . . (304,353) (215,512) (238,666)
Cash Flows Provided from (Used by) Financing ActivitiesNet change in short-term borrowings . . . . . . . . . . . . . . . . . . . . . . . . . . . 195,055 (163,826) 475,582Long-term borrowings . . . . . . . . . . . . . . . . . . . . . . . . . . . . . . . . . . . . . . — 496,728 248,318Repayment of long-term debt . . . . . . . . . . . . . . . . . . . . . . . . . . . . . . . . . (188,891) (234) (278,236)Cash dividends paid . . . . . . . . . . . . . . . . . . . . . . . . . . . . . . . . . . . . . . . . (252,263) (235,129) (221,235)Exercise of stock options . . . . . . . . . . . . . . . . . . . . . . . . . . . . . . . . . . . . 50,497 37,111 81,632Excess tax benefits from exercise of stock options . . . . . . . . . . . . . . . . 9,461 9,275 20,186Repurchase of Common Stock . . . . . . . . . . . . . . . . . . . . . . . . . . . . . . . . (256,285) (621,648) (536,997)
Net Cash (Used by) Financing Activities . . . . . . . . . . . . . . . . . . . . . . . . . . . . (442,426) (477,723) (210,750)
Increase in Cash and Cash Equivalents . . . . . . . . . . . . . . . . . . . . . . . . . . . . . 32,057 29,958 12,346Cash and Cash Equivalents as of January 1 . . . . . . . . . . . . . . . . . . . . . . . . . . 97,141 67,183 54,837
Cash and Cash Equivalents as of December 31 . . . . . . . . . . . . . . . . . . . . . . . $ 129,198 $ 97,141 $ 67,183
Interest Paid . . . . . . . . . . . . . . . . . . . . . . . . . . . . . . . . . . . . . . . . . . . . . . . . . . $ 126,450 $ 105,250 $ 88,077Income Taxes Paid . . . . . . . . . . . . . . . . . . . . . . . . . . . . . . . . . . . . . . . . . . . . . 253,977 325,451 206,704
The notes to consolidated financial statements are an integral part of these statements.
57

TH
EH
ER
SHE
YC
OM
PA
NY
CO
NSO
LID
AT
ED
STA
TE
ME
NT
SO
FST
OC
KH
OL
DE
RS’
EQ
UIT
Y
Pre
ferr
edSt
ock
Com
mon
Stoc
k
Cla
ssB
Com
mon
Stoc
k
Add
itio
nal
Pai
d-in
Cap
ital
Une
arne
dE
SOP
Com
pens
atio
nR
etai
ned
Ear
ning
s
Tre
asur
yC
omm
onSt
ock
Acc
umul
ated
Oth
erC
ompr
ehen
sive
Inco
me
(Los
s)
Tot
alSt
ockh
olde
rs’
Equ
ity
Inth
ousa
nds
ofdo
llars
Bal
ance
asof
Janu
ary
1,20
05..
....
....
....
....
....
....
....
..$—
$299
,060
$60,
841
$171
,413
$(6,
387)
$3,3
74,1
71$(
2,76
2,30
4)$
309
$1,1
37,1
03
Net
inco
me
....
....
....
....
....
....
....
....
....
....
....
....
488,
547
488,
547
Oth
erco
mpr
ehen
sive
(los
s)..
....
....
....
....
....
....
....
....
.(9
,631
)(9
,631
)
Com
preh
ensi
vein
com
e..
....
....
....
....
....
....
....
....
....
478,
916
Div
iden
ds:
Com
mon
Stoc
k,$.
93pe
rsh
are
....
....
....
....
....
....
....
(170
,147
)(1
70,1
47)
Cla
ssB
Com
mon
Stoc
k,$.
84pe
rsh
are
....
....
....
....
....
..(5
1,08
8)(5
1,08
8)C
onve
rsio
nof
Cla
ssB
Com
mon
Stoc
kin
toC
omm
onSt
ock
....
....
..23
(23)
—In
cent
ive
plan
tran
sact
ions
....
....
....
....
....
....
....
....
....
236
1,16
11,
397
Stoc
k-ba
sed
com
pens
atio
n..
....
....
....
....
....
....
....
....
..35
,764
35,7
64E
xerc
ise
ofst
ock
optio
ns..
....
....
....
....
....
....
....
....
...
44,7
5973
,258
118,
017
Em
ploy
eest
ock
owne
rshi
ptr
ust/b
enef
itstr
ansa
ctio
ns..
....
....
....
.20
23,
194
193,
415
Rep
urch
ase
ofC
omm
onSt
ock
....
....
....
....
....
....
....
....
.(5
36,9
97)
(536
,997
)
Bal
ance
asof
Dec
embe
r31
,200
5..
....
....
....
....
....
....
...
—29
9,08
360
,818
252,
374
(3,1
93)
3,64
1,48
3(3
,224
,863
)(9
,322
)1,
016,
380
Net
inco
me
....
....
....
....
....
....
....
....
....
....
....
....
559,
061
559,
061
Oth
erco
mpr
ehen
sive
inco
me
....
....
....
....
....
....
....
....
..9,
105
9,10
5
Com
preh
ensi
vein
com
e..
....
....
....
....
....
....
....
....
....
568,
166
Adj
ustm
entt
oin
itial
lyap
ply
SFA
SN
o.15
8,ne
tof
tax
....
....
....
.(1
37,9
72)
(137
,972
)D
ivid
ends
:C
omm
onSt
ock,
$1.0
3pe
rsh
are
....
....
....
....
....
....
...
(178
,873
)(1
78,8
73)
Cla
ssB
Com
mon
Stoc
k,$.
925
per
shar
e..
....
....
....
....
...
(56,
256)
(56,
256)
Con
vers
ion
ofC
lass
BC
omm
onSt
ock
into
Com
mon
Stoc
k..
....
....
2(2
)—
Ince
ntiv
epl
antr
ansa
ctio
ns..
....
....
....
....
....
....
....
....
..84
03,
250
4,09
0St
ock-
base
dco
mpe
nsat
ion
....
....
....
....
....
....
....
....
....
34,3
7434
,374
Exe
rcis
eof
stoc
kop
tions
....
....
....
....
....
....
....
....
....
.9,
732
39,9
9249
,724
Em
ploy
eest
ock
owne
rshi
ptr
ust/b
enef
itstr
ansa
ctio
ns..
....
....
....
.92
33,
193
1,32
25,
438
Rep
urch
ase
ofC
omm
onSt
ock
....
....
....
....
....
....
....
....
.(6
21,6
48)
(621
,648
)
Bal
ance
asof
Dec
embe
r31
,200
6..
....
....
....
....
....
....
...
—29
9,08
560
,816
298,
243
—3,
965,
415
(3,8
01,9
47)
(138
,189
)68
3,42
3
Net
inco
me
....
....
....
....
....
....
....
....
....
....
....
....
214,
154
214,
154
Oth
erco
mpr
ehen
sive
inco
me
....
....
....
....
....
....
....
....
..11
0,21
011
0,21
0
Com
preh
ensi
vein
com
e..
....
....
....
....
....
....
....
....
....
324,
364
Div
iden
ds:
Com
mon
Stoc
k,$1
.135
per
shar
e..
....
....
....
....
....
....
(190
,199
)(1
90,1
99)
Cla
ssB
Com
mon
Stoc
k,$1
.020
6pe
rsh
are
....
....
....
....
...
(62,
064)
(62,
064)
Con
vers
ion
ofC
lass
BC
omm
onSt
ock
into
Com
mon
Stoc
k..
....
....
10(1
0)—
Ince
ntiv
epl
antr
ansa
ctio
ns..
....
....
....
....
....
....
....
....
..1,
426
2,08
23,
508
Stoc
k-ba
sed
com
pens
atio
n..
....
....
....
....
....
....
....
....
..29
,790
29,7
90E
xerc
ise
ofst
ock
optio
ns..
....
....
....
....
....
....
....
....
...
5,79
754
,588
60,3
85R
epur
chas
eof
Com
mon
Stoc
k..
....
....
....
....
....
....
....
...
(256
,285
)(2
56,2
85)
Bal
ance
asof
Dec
embe
r31
,200
7..
....
....
....
....
....
....
...
$—$2
99,0
95$6
0,80
6$3
35,2
56$
—$3
,927
,306
$(4,
001,
562)
$(2
7,97
9)$
592,
922
The
note
sto
cons
olid
ated
fina
ncia
lsta
tem
ents
are
anin
tegr
alpa
rtof
thes
est
atem
ents
.
58

THE HERSHEY COMPANY
NOTES TO CONSOLIDATED FINANCIAL STATEMENTS
1. SUMMARY OF SIGNIFICANT ACCOUNTING POLICIES
Significant accounting policies employed by our Company are discussed below and in other notes to theconsolidated financial statements.
Items Affecting Comparability
In September 2006, the Financial Accounting Standards Board (“FASB”) issued Statement of FinancialAccounting Standards No. 158, Employers’ Accounting for Defined Benefit Pension and Other PostretirementPlans, an amendment of FASB Statements No. 87, 88, 106, and 132 (R) (“SFAS No. 158”). SFAS No. 158requires an employer that is a business entity and sponsors one or more single-employer defined benefit plans to:
• Recognize the funded status of a benefit plan—measured as the difference between plan assets at fairvalue and the benefit obligation—in its statement of financial position. For a pension plan, the benefitobligation is the projected benefit obligation; for any other post-retirement benefit plan, such as a retireehealth care plan, the benefit obligation is the accumulated post-retirement benefit obligation.
• Recognize as a component of other comprehensive income, net of tax, the gains or losses and priorservice costs or credits that arise during the period but are not recognized as components of net periodicbenefit cost.
• Measure defined benefit plan assets and obligations as of the date of the employer’s fiscal year-endstatement of financial position.
• Disclose in the notes to financial statements additional information about certain effects on net periodicbenefit cost for the next fiscal year that arise from delayed recognition of the gains or losses, priorservice costs or credits, and transition asset or obligation.
Effective December 31, 2006, we adopted SFAS No. 158. The provisions of SFAS No. 158 require that thefunded status of our pension plans and the benefit obligations of our post-retirement benefit plans be recognizedin our balance sheet. Appropriate adjustments were made to various assets and liabilities as of December 31,2006, with an offsetting after-tax effect of $138.0 million recorded as a component of other comprehensiveincome rather than as an adjustment to the ending balance of accumulated other comprehensive loss. Thepresentation of other comprehensive income for the year ended December 31, 2006 was adjusted to exclude theimpact of the adoption of SFAS No. 158.
The consolidated financial statements include the impact of our business realignment initiatives as describedin Note 3. Cost of sales included a pre-tax charge resulting from the business realignment initiatives of$123.1 million in 2007, a pre-tax credit of $3.2 million in 2006, and a pre-tax charge of $22.5 million in 2005.Selling, marketing and administrative expenses included a pre-tax charge resulting from the business realignmentinitiatives of $12.6 million in 2007 and $.3 million in 2006.
Our effective income tax rate was 37.1% in 2007, 36.2% in 2006 and 36.2% in 2005. The effective incometax rate for 2007 was higher by 1.1 percentage points and for 2005 benefited by 0.2 percentage points from theimpact of tax rates associated with business realignment and impairment charges.
We have made certain reclassifications to prior year amounts to conform to the 2007 presentation.
59

THE HERSHEY COMPANY
NOTES TO CONSOLIDATED FINANCIAL STATEMENTS—(Continued)
Principles of Consolidation
Our consolidated financial statements include the accounts of the Company and our majority-ownedsubsidiaries and entities in which we have a controlling financial interest after the elimination of intercompanyaccounts and transactions. We have a controlling financial interest if we own a majority of the outstanding votingcommon stock and minority shareholders do not have substantive participating rights, or we have significantcontrol over an entity through contractual or economic interests in which we are the primary beneficiary. In May2007, we entered into an agreement with Godrej Beverages and Foods, Ltd., to manufacture and distributeconfectionery products, snacks and beverages across India. Under the agreement, we own a 51% controllinginterest in Godrej Hershey Foods and Beverages Company. This business acquisition is included in ourconsolidated financial results, including the related minority interest.
Equity Investments
We use the equity method of accounting when we have a 20% to 50% interest in other companies andexercise significant influence. Under the equity method, original investments are recorded at cost and adjusted byour share of undistributed earnings or losses of these companies. Equity investments are reviewed for impairmentwhenever events or changes in circumstances indicate that the carrying amount of the investments may not berecoverable. In May 2007, we entered into a manufacturing agreement in China with Lotte ConfectioneryCompany, LTD to produce Hershey products and certain Lotte products for the market in China. We own a 44%interest in this entity and are accounting for this investment using the equity method.
Use of Estimates
The preparation of financial statements in conformity with U.S. generally accepted accounting principlesrequires management to make estimates and assumptions that affect the reported amounts of assets and liabilitiesat the date of the financial statements, and revenues and expenses during the reporting period. Critical accountingestimates involved in applying our accounting policies are those that require management to make assumptionsabout matters that are highly uncertain at the time the accounting estimate was made and those for whichdifferent estimates reasonably could have been used for the current period. Critical accounting estimates are alsothose which are reasonably likely to change from period to period and would have a material impact on thepresentation of our financial condition, changes in financial condition or results of operations. Our most criticalaccounting estimates pertain to accounting policies for accounts receivable—trade, accrued liabilities andpension and other post-retirement benefit plans.
Revenue Recognition
We record sales when all of the following criteria have been met:
• a valid customer order with a fixed price has been received;
• a delivery appointment with the customer has been made;
• the product has been delivered to the customer;
• there is no further significant obligation to assist in the resale of the product; and
• collectibility is reasonably assured.
Net sales include revenue from the sale of finished goods and royalty income, net of allowances for tradepromotions, consumer coupon programs and other sales incentives, and allowances and discounts associated withaged or potentially unsaleable products. Trade promotions and sales incentives primarily include reduced pricefeatures, merchandising displays, sales growth incentives, new item allowances and cooperative advertising.
60
THE HERSHEY COMPANY
NOTES TO CONSOLIDATED FINANCIAL STATEMENTS—(Continued)
Cost of Sales
Cost of sales represents costs directly related to the manufacture and distribution of our products. Primarycosts include raw materials, packaging, direct labor, overhead, shipping and handling, warehousing and thedepreciation of manufacturing, warehousing and distribution facilities. Manufacturing overhead and relatedexpenses include salaries, wages, employee benefits, utilities, maintenance and property taxes.
Selling, Marketing and Administrative
Selling, marketing and administrative expenses represent costs incurred in generating revenues and inmanaging our business. Such costs include advertising and other marketing expenses, salaries, employeebenefits, incentive compensation, research and development, travel, office expenses, amortization of capitalizedsoftware and depreciation of administrative facilities.
Cash Equivalents
Cash equivalents consist of highly liquid debt instruments, time deposits and money market funds withoriginal maturities of three months or less. The fair value of cash and cash equivalents approximates the carryingamount.
Commodities Futures Contracts
In connection with the purchasing of cocoa beans and cocoa products, sugar, corn sweeteners, natural gas,fuel oil and certain dairy products for anticipated manufacturing requirements and to hedge transportation costs,we enter into commodities futures contracts to reduce the effect of price fluctuations.
We account for commodities futures contracts in accordance with Statement of Financial AccountingStandards No. 133, Accounting for Derivative Instruments and Hedging Activities, as amended (“SFASNo. 133”). SFAS No. 133 provides that the effective portion of the gain or loss on a derivative instrumentdesignated and qualifying as a cash flow hedging instrument be reported as a component of other comprehensiveincome and be reclassified into earnings in the same period or periods during which the hedged transactionaffects earnings. The remaining gain or loss on the derivative instrument, if any, must be recognized currently inearnings. For a derivative designated as hedging the exposure to changes in the fair value of a recognized asset orliability or a firm commitment (referred to as a fair value hedge), the gain or loss must be recognized in earningsin the period of change together with the offsetting loss or gain on the hedged item attributable to the risk beinghedged. The effect of that accounting is to reflect in earnings the extent to which the hedge is not effective inachieving offsetting changes in fair value. All derivative instruments which we are currently utilizing, includingcommodities futures contracts, are designated and accounted for as cash flow hedges. Additional informationwith regard to accounting policies associated with derivative instruments is contained in Note 5, DerivativeInstruments and Hedging Activities.
Property, Plant and Equipment
Property, plant and equipment are stated at cost and are depreciated on a straight-line basis over theestimated useful lives of the assets, as follows: 3 to 15 years for machinery and equipment; and 25 to 40 years forbuildings and related improvements. Maintenance and repair expenditures are charged to expense as incurred.Applicable interest charges incurred during the construction of new facilities and production lines are capitalizedas one of the elements of cost and are amortized over the assets’ estimated useful lives.
61

THE HERSHEY COMPANY
NOTES TO CONSOLIDATED FINANCIAL STATEMENTS—(Continued)
We review long-lived assets for impairment whenever events or changes in circumstances indicate that thecarrying amount of such assets may not be recoverable. We measure the recoverability of assets to be held andused by a comparison of the carrying amount of long-lived assets to future undiscounted net cash flows expectedto be generated, in accordance with Statement of Financial Accounting Standards No. 144, Accounting for theImpairment or Disposal of Long-Lived Assets. If such assets are considered to be impaired, we measure theimpairment to be recognized as the amount by which the carrying amount of the assets exceeds the fair value ofthe assets. Assets to be disposed of are reported at the lower of the carrying amount or fair value less cost to sell.
Asset Retirement Obligations
We account for asset retirement obligations in accordance with Statement of Financial AccountingStandards No. 143, Accounting for Asset Retirement Obligations, and FASB Interpretation No. 47, Accountingfor Conditional Asset Retirement Obligations—an interpretation of FASB Statement No. 143. Asset retirementobligations generally apply to legal obligations associated with the retirement of a tangible long-lived asset thatresult from the acquisition, construction or development and the normal operation of a long-lived asset.
We assess asset retirement obligations on a periodic basis. We recognize the fair value of a liability for anasset retirement obligation in the period in which it is incurred if a reasonable estimate of fair value can be made.We capitalize associated asset retirement costs as part of the carrying amount of the long-lived asset.
Goodwill and Other Intangible Assets
We account for goodwill and other intangible assets in accordance with Statement of Financial AccountingStandards No. 142, Goodwill and Other Intangible Assets. Other intangible assets primarily consist oftrademarks, customer-related intangible assets and patents obtained through business acquisitions. Wedetermined that the useful lives of trademarks are indefinite and, therefore, these assets are not being amortized.We are amortizing customer-related intangible assets over their estimated useful lives of approximately ten years.We are amortizing patents over their remaining legal lives of approximately thirteen years.
We conduct an impairment evaluation for goodwill annually, or more frequently if events or changes incircumstances indicate that an asset might be impaired. The evaluation is performed by using a two-step process.In the first step, the fair value of each reporting unit is compared with the carrying amount of the reporting unit,including goodwill. The estimated fair value of the reporting unit is generally determined on the basis ofdiscounted future cash flows. If the estimated fair value of the reporting unit is less than the carrying amount ofthe reporting unit, then a second step must be completed in order to determine the amount of the goodwillimpairment that should be recorded. In the second step, the implied fair value of the reporting unit’s goodwill isdetermined by allocating the reporting unit’s fair value to all of its assets and liabilities other than goodwill(including any unrecognized intangible assets) in a manner similar to a purchase price allocation. The resultingimplied fair value of the goodwill that results from the application of this second step is then compared with thecarrying amount of the goodwill and an impairment charge is recorded for the difference.
We conduct an impairment evaluation of the carrying amount of intangible assets with indefinite livesannually, or more frequently if events or changes in circumstances indicate that an asset might be impaired. Theevaluation is performed by comparing the carrying amount of these assets to their estimated fair value. If theestimated fair value is less than the carrying amount of the intangible assets with indefinite lives, then animpairment charge is recorded to reduce the asset to its estimated fair value. The estimated fair value is generallydetermined on the basis of discounted future cash flows.
The assumptions we use to estimate fair value are generally consistent with the past performance of eachreporting unit and are also consistent with the projections and assumptions that are used in current operating
62
THE HERSHEY COMPANY
NOTES TO CONSOLIDATED FINANCIAL STATEMENTS—(Continued)
plans. We also consider assumptions which may be used by market participants. Such assumptions are subject tochange as a result of changing economic and competitive conditions.
As a result of reduced expectations for future cash flows resulting primarily from lower expectedprofitability, we determined that the carrying amount of our wholly-owned subsidiary, Hershey do Brasil,exceeded its fair value and recorded a non-cash impairment charge of $12.3 million in December 2007. Based onour annual impairment evaluations, we determined that no goodwill or other intangible assets were impaired asof December 31, 2006 and 2005.
Comprehensive Income
We report comprehensive income (loss) on the Consolidated Statements of Stockholders’ Equity andaccumulated other comprehensive income (loss) on the Consolidated Balance Sheets. Additional informationregarding comprehensive income is contained in Note 6, Comprehensive Income.
We translate results of operations for foreign entities using the average exchange rates during the period.For foreign entities, assets and liabilities are translated to U.S. dollars using the exchange rates in effect at thebalance sheet date. Resulting translation adjustments are recorded as a component of other comprehensiveincome (loss), “Foreign Currency Translation Adjustments.”
Prior to the adoption of SFAS No. 158 as of December 31, 2006, a minimum pension liability adjustmentwas required when the actuarial present value of accumulated pension plan benefits exceeded plan assets andaccrued pension liabilities, less allowable intangible assets. Minimum pension liability adjustments, net ofincome taxes, were recorded as a component of other comprehensive income (loss), “Minimum Pension LiabilityAdjustments.” Subsequent to the adoption of SFAS No. 158, changes to the balances of the unrecognized priorservice cost and the unrecognized net actuarial loss, net of income taxes, are recorded as a component of othercomprehensive income (loss), “Pension and Post-retirement Benefit Plans”.
Gains and losses on cash flow hedging derivatives, to the extent effective, are included in othercomprehensive income (loss), net of related tax effects. Reclassification adjustments reflecting such gains andlosses are ratably recorded in income in the same period as the hedged items affect earnings. Additionalinformation with regard to accounting policies associated with derivative instruments is contained in Note 5,Derivative Instruments and Hedging Activities.
Foreign Exchange Forward Contracts
We enter into foreign exchange forward contracts to hedge transactions denominated in foreign currencies.These transactions are primarily related to firm commitments or forecasted purchases of equipment, certain rawmaterials and finished goods. We also hedge payment of forecasted intercompany transactions with oursubsidiaries outside the United States. These contracts reduce currency risk from exchange rate movements.
Foreign exchange forward contracts are intended to be and are effective as hedges of identifiable foreigncurrency commitments and forecasted transactions. Foreign exchange forward contracts are designated as cashflow hedging derivatives and the fair value of such contracts is recorded on the Consolidated Balance Sheets aseither an asset or liability. Gains and losses on these contracts are recorded as a component of othercomprehensive income and are reclassified into earnings in the same period during which the hedged transactionaffects earnings. Additional information with regard to accounting policies for derivative instruments, includingforeign exchange forward contracts is contained in Note 5, Derivative Instruments and Hedging Activities.
63
THE HERSHEY COMPANY
NOTES TO CONSOLIDATED FINANCIAL STATEMENTS—(Continued)
License Agreements
We enter into license agreements under which we have access to certain trademarks and proprietarytechnology, and manufacture and/or market and distribute certain products. The rights under these agreementsare extendible on a long-term basis at our option subject to certain conditions, including minimum sales and unitvolume levels, which we have met. License fees and royalties, payable under the terms of the agreements, areexpensed as incurred and included in selling, marketing and administrative expenses.
Research and Development
We expense research and development costs as incurred. Research and development expense was $28.0million in 2007, $27.6 million in 2006 and $22.6 million in 2005. Research and development expense is includedin selling, marketing and administrative expenses.
Advertising
We expense advertising costs as incurred. Advertising expense included in selling, marketing andadministrative expenses was $127.9 million in 2007, $108.3 million in 2006 and $125.0 million in 2005. We hadno prepaid advertising expense as of December 31, 2007 and $0.4 million as of December 31, 2006.
Computer Software
We capitalize costs associated with software developed or obtained for internal use when both thepreliminary project stage is completed and it is probable that computer software being developed will becompleted and placed in service. Capitalized costs include only (i) external direct costs of materials and servicesconsumed in developing or obtaining internal-use software, (ii) payroll and other related costs for employees whoare directly associated with and who devote time to the internal-use software project and (iii) interest costsincurred, when material, while developing internal-use software. We cease capitalization of such costs no laterthan the point at which the project is substantially complete and ready for its intended purpose.
The unamortized amount of capitalized software was $35.9 million as of December 31, 2007 and was$36.0 million as of December 31, 2006. We amortize software costs using the straight-line method over theexpected life of the software, generally three to five years. Accumulated amortization of capitalized software was$159.6 million as of December 31, 2007 and $145.4 million as of December 31, 2006.
We review the carrying value of software and development costs for impairment in accordance with ourpolicy pertaining to the impairment of long-lived assets. Generally, we measure impairment under the followingcircumstances:
• when internal-use computer software is not expected to provide substantive service potential;
• a significant change occurs in the extent or manner in which the software is used or is expected to beused;
• a significant change is made or will be made to the software program; and
• costs of developing or modifying internal-use computer software significantly exceed the amountoriginally expected to develop or modify the software.
64
THE HERSHEY COMPANY
NOTES TO CONSOLIDATED FINANCIAL STATEMENTS—(Continued)
2. ACQUISITIONS AND DIVESTITURES
In May, 2007, we entered into an agreement with Godrej Beverages and Foods, Ltd., one of India’s largestconsumer goods, confectionery and food companies, to manufacture and distribute confectionery products,snacks and beverages across India. Under the agreement, we invested $61.5 million during 2007 and own a 51%controlling interest in Godrej Hershey Foods and Beverages Company. In accordance with the purchase methodof accounting, the purchase price of the acquisition was allocated to the underlying assets and liabilities at thedate of the acquisition based on their preliminary estimated respective fair values which may be revised at a laterdate. We have not yet finalized the purchase price allocation for the Godrej Hershey Foods and BeveragesCompany acquisition and are in the process of obtaining valuations for the acquired net assets. Total liabilitiesassumed in 2007 were $51.6 million.
Also in May 2007, we entered into a manufacturing agreement in China with Lotte Confectionery Co.,LTD., to produce Hershey products and certain Lotte products for the market in China. We invested $39.0million in 2007 and own a 44% interest. We are accounting for this investment using the equity method.
In October 2006, our wholly-owned subsidiary, Artisan Confections Company, purchased the assets ofDagoba Organic Chocolates, LLC, based in Ashland, Oregon, for $17.0 million. Dagoba is known for its high-quality organic chocolate bars, drinking chocolates and baking products that are primarily sold in natural foodand gourmet stores across the United States. Total liabilities assumed were $1.7 million.
In August 2005, Artisan Confections Company completed the acquisition of Scharffen Berger ChocolateMaker, Inc. Based in San Francisco, California, Scharffen Berger is known for its high-cacao content, signaturedark chocolate bars and baking products sold online and in a broad range of outlets, including specialty retailers,natural food stores and gourmet centers across the United States. Scharffen Berger also owns and operates threespecialty stores located in New York, New York and in Berkeley and San Francisco, California.
Also, in August 2005, Artisan Confections Company acquired the assets of Joseph Schmidt Confections,Inc., a premium chocolate maker located in San Francisco, California. Distinctive products created by JosephSchmidt include artistic and innovative truffles, colorful chocolate mosaics, specialty cookies, and handcraftedchocolates. We sell these products in select department stores and other specialty outlets nationwide as well as inJoseph Schmidt stores located in San Jose and San Francisco, California. The combined purchase price forScharffen Berger and Joseph Schmidt was $47.1 million.
Results subsequent to the dates of acquisition were included in the consolidated financial statements. Hadthe results of the acquisitions been included in the consolidated financial statements for each of the periodspresented, the effect would not have been material.
In October 2005, our wholly-owned subsidiary, Hershey Canada Inc., completed the sale of its Mr. Freezefreeze pops business for $2.7 million. There was no significant gain or loss on the transaction.
3. BUSINESS REALIGNMENT INITIATIVES
In February 2007, we announced a comprehensive, three-year supply chain transformation program (the“global supply chain transformation program”) and, in December 2007, we recorded impairment and businessrealignment charges associated with our business in Brazil (together, “the 2007 business realignmentinitiatives”).
When completed, the global supply chain transformation program will greatly enhance our manufacturing,sourcing and customer service capabilities, reduce inventories resulting in improvements in working capital and
65
THE HERSHEY COMPANY
NOTES TO CONSOLIDATED FINANCIAL STATEMENTS—(Continued)
generate significant resources to invest in our growth initiatives. These initiatives include acceleratedmarketplace momentum within our core U.S. business, creation of innovative new product platforms to meetcustomer needs and disciplined global expansion. Under the program, which will be implemented in stages overthree years, we will significantly increase manufacturing capacity utilization by reducing the number ofproduction lines by more than one-third, outsource production of low value-added items and construct a flexible,cost-effective production facility in Monterrey, Mexico to meet current and emerging marketplace needs. Theprogram will result in a total net reduction of 1,500 positions across our supply chain over the three–yearimplementation period.
The estimated pre-tax cost of the global supply chain transformation program is from $525 million to $575million over three years. The total includes from $475 million to $525 million in business realignment costs andapproximately $50 million in project implementation costs. The costs will be incurred primarily in 2007 and2008. Total costs of $400.0 million were recorded in 2007 for this program.
In 2001, we acquired a small business in Brazil, Hershey do Brasil, which has not gained profitable scale oradequate market distribution. In an effort to improve the performance of this business, in January 2008 Hersheydo Brasil entered into a cooperative agreement with Pandurata Alimentos LTDA (“Bauducco”), a leadingmanufacturer of baked goods in Brazil whose primary brand is Bauducco. The arrangement with Bauducco willleverage Bauducco’s strong sales and distribution capabilities for our products throughout Brazil. Under thisagreement we will manufacture and market, and they will sell and distribute our products. We will maintain a51% controlling interest in Hershey do Brasil. In the fourth quarter of 2007, we recorded a goodwill impairmentcharge and approved a business realignment program associated with initiatives to improve distribution andenhance the financial performance of our business in Brazil.
In July 2005, we announced initiatives intended to advance our value-enhancing strategy (the “2005business realignment initiatives”). Charges (credits) for the 2005 business realignment initiatives were recordedduring 2005 and 2006 and the 2005 business realignment initiatives were completed by December 31, 2006.
66

THE HERSHEY COMPANY
NOTES TO CONSOLIDATED FINANCIAL STATEMENTS—(Continued)
Charges (credits) associated with business realignment initiatives recorded during 2007, 2006 and 2005were as follows:
For the years ended December 31, 2007 2006 2005
In thousands of dollars
Cost of sales2007 business realignment initiatives:
Global supply chain transformation program . . . . . . . . . . . . . . . . . . . $123,090 $ — $ —2005 business realignment initiatives . . . . . . . . . . . . . . . . . . . . . . . . . . . . . — (1,599) 22,459Previous business realignment initiatives . . . . . . . . . . . . . . . . . . . . . . . . . . — (1,600) —
Total cost of sales . . . . . . . . . . . . . . . . . . . . . . . . . . . . . . . . . . . . . 123,090 (3,199) 22,459
Selling, marketing and administrative2007 business realignment initiatives:
Global supply chain transformation program . . . . . . . . . . . . . . . . . . . 12,623 — —2005 business realignment initiatives . . . . . . . . . . . . . . . . . . . . . . . . . . . . . — 266 —
Total selling, marketing and administrative . . . . . . . . . . . . . . . . . . . . . . . . . . . . . 12,623 266 —
Business realignment and impairment charges, net2007 business realignment initiatives:
Global supply chain transformation program:Fixed asset impairments and plant closure expense . . . . . . . . . . . 61,444 — —Employee separation costs . . . . . . . . . . . . . . . . . . . . . . . . . . . . . . 188,538 — —Contract termination costs . . . . . . . . . . . . . . . . . . . . . . . . . . . . . . 14,316 — —
Brazilian business realignment:Goodwill impairment . . . . . . . . . . . . . . . . . . . . . . . . . . . . . . . . . . 12,260 — —Employee separation costs . . . . . . . . . . . . . . . . . . . . . . . . . . . . . . 310 — —
2005 business realignment initiatives:U.S. voluntary workforce reduction program . . . . . . . . . . . . . . . . . . . — 9,972 69,472U.S. facility rationalization (Las Piedras, Puerto Rico plant) . . . . . . . — 1,567 12,771Streamline international operations (primarily Canada) . . . . . . . . . . . — 2,524 14,294
Previous business realignment initiatives . . . . . . . . . . . . . . . . . . . . . . . . . . — 513 —
Total business realignment and impairment charges, net . . . . . . 276,868 14,576 96,537
Total net charges associated with business realignment initiatives andimpairment . . . . . . . . . . . . . . . . . . . . . . . . . . . . . . . . . . . . . . . . . . . . . . . . . . . . $412,581 $11,643 $118,996
The charge of $123.1 million recorded in cost of sales for the global supply chain transformation programrelated primarily to the accelerated depreciation of fixed assets over a reduced estimated remaining useful lifeand costs related to inventory reductions. The $12.6 million recorded in selling, marketing and administrativeexpenses related primarily to project management and administration. In determining the costs related to fixedasset impairments, fair value was estimated based on the expected sales proceeds. Certain real estate with acarrying value or fair value less cost to sell, if lower, of $40.2 million was being held for sale as of December 31,2007. Employee separation costs included $79.0 million primarily for involuntary terminations at six NorthAmerican manufacturing facilities which are being closed. The facilities are located in Naugatuck, Connecticut;Reading, Pennsylvania; Oakdale, California; Smiths Falls, Ontario; Montreal, Quebec; and Dartmouth, NovaScotia. The employee separation costs also included $109.6 million for charges relating to pension and otherpost-retirement benefits settlements, curtailments and special termination benefits.
67
THE HERSHEY COMPANY
NOTES TO CONSOLIDATED FINANCIAL STATEMENTS—(Continued)
During the fourth quarter of 2007, we completed our annual impairment evaluation of goodwill and otherintangible assets. As a result of reduced expectations for future cash flows resulting primarily from lowerexpected profitability, we determined that the carrying amount of our wholly-owned subsidiary, Hershey doBrasil, exceeded its fair value and recorded a non-cash impairment charge of $12.3 million in December 2007.There was no tax benefit associated with this charge. We discuss the impairment testing results in more detail inNote 1 and Note 16 to the Consolidated Financial Statements. During the fourth quarter of 2007, we alsorecorded a business realignment charge of $.3 million associated with our business in Brazil. This charge wasprincipally associated with employee separation costs. Remaining charges of approximately $5.0 million for thisbusiness realignment program are expected to be recorded in 2008.
The charges (credits) recorded in cost of sales relating to the 2005 business realignment initiatives includeda credit of $1.6 million in 2006 resulting from higher than expected proceeds from the sale of equipment from theLas Piedras plant and a charge of $22.5 million in 2005 resulting from accelerated depreciation related to theclosure of the Las Piedras plant. The charge recorded in selling, marketing and administrative expenses in 2006resulted from accelerated depreciation relating to the termination of an office building lease. The net businessrealignment charges included $7.3 million and $8.3 million for involuntary terminations in 2006 and 2005,respectively.
The charges (credits) recorded in 2006 relating to previous business realignment initiatives which began in2003 and 2001 resulted from the finalization of the sale of certain properties, adjustments to liabilities which hadpreviously been recorded, and the impact of the settlement as to several of the eight former employees who hadfiled a complaint alleging that the Company had discriminated against them on the basis of age in connectionwith the 2003 business realignment initiatives. A settlement was reached with the remaining former employees inSeptember 2007.
The liability balance as of December 31, 2007 relating to the 2007 business realignment initiatives was$68.4 million for employee separation costs to be paid primarily in 2008 and 2009. As of December 31, 2007, theliability balance relating to the 2005 business realignment initiatives was $3.3 million. During 2007 we madepayments against the liabilities recorded for the 2007 business realignment initiatives of $13.2 million principallyrelated to employee separation and project administration. We made payments during 2007 against the liabilitiesrecorded for the 2005 business realignment initiatives of $16.2 million related to the voluntary workforcereduction. During 2006 we made total payments of $28.0 million against the liabilities recorded for the 2005business realignment initiatives primarily associated with the voluntary workforce reduction.
4. COMMITMENTS AND CONTINGENCIES
We enter into certain obligations for the purchase of raw materials. These obligations are primarily in theform of forward contracts for the purchase of raw materials from third-party brokers and dealers. These contractsminimize the effect of future price fluctuations by fixing the price of part or all of these purchase obligations.Total obligations for each year consisted of fixed price contracts for the purchase of commodities and unpricedcontracts that were valued using market prices as of December 31, 2007.
The cost of commodities associated with the unpriced contracts is variable as market prices change overfuture periods. We mitigate the variability of these costs to the extent that we have entered into commoditiesfutures contracts to hedge our costs for those periods. Increases or decreases in market prices are offset by gainsor losses on commodities futures contracts. This applies to the extent that we have hedged the unpriced contractsas of December 31, 2007 and in future periods by entering into commodities futures contracts. Taking delivery ofand making payments for the specific commodities for use in the manufacture of finished goods satisfies ourobligations under the forward purchase contracts. For each of the three years in the period ended December 31,2007, we satisfied these obligations by taking delivery of and making payment for the specific commodities.
68
THE HERSHEY COMPANY
NOTES TO CONSOLIDATED FINANCIAL STATEMENTS—(Continued)
As of December 31, 2007, we had entered into purchase agreements with various suppliers. Subject tomeeting our Company’s quality standards, the purchase obligations covered by these agreements were as followsas of December 31, 2007:
Obligations 2008 2009 2010 2011
In millions of dollars
Purchase obligations . . . . . . . . . . . . . . . . . . . . . . . . . . . . . . . . . . . . . . . . . . . . $1,058.2 $618.0 $277.5 $99.3
We have commitments under various operating leases. Future minimum payments under non-cancelableoperating leases with a remaining term in excess of one year were as follows as of December 31, 2007:
Lease Commitments 2008 2009 2010 2011 2012 Thereafter
In millions of dollars
Future minimum rental payments . . . . . . . . . . . . . . . . . . . . . . . . . $15.4 $11.9 $7.5 $6.3 $5.4 $7.9
Our Company has a number of facilities that contain varying degrees of asbestos in certain locations withinthese facilities. Our asbestos management program is compliant with current regulations. Current regulationsrequire that we handle or dispose of this type of asbestos in a special manner if such facilities undergo majorrenovations or are demolished. We believe we do not have sufficient information to estimate the fair value of anyasset retirement obligations related to these facilities. We cannot specify the settlement date or range of potentialsettlement dates and, therefore, sufficient information is not available to apply an expected present valuetechnique. We expect to maintain the facilities with repairs and maintenance activities that would not involve theremoval of asbestos.
As of December 31, 2007, certain real estate associated with the closure of facilities under the global supplychain transformation program is being held for sale. We are not aware of any significant obligations related to theenvironmental remediation of these facilities which has not been reflected in our current estimates.
In connection with its pricing practices, the Company is the subject of an antitrust investigation by theCanadian Competition Bureau, and has received a request for information from the European Commission. Inaddition, the U.S. Department of Justice is conducting an inquiry. The Company is also party to approximately50 related civil antitrust suits in the United States and three in Canada. Each claim contains class actionallegations, instituted on behalf of consumers and, in some cases, by certain companies that purchase chocolatefor resale, that allege conspiracies in restraint of trade and challenge the pricing and/or purchasing practices ofthe Company. Several other chocolate confectionery companies are the subject of investigations and/or inquiriesby the government entities referenced above and have also been named as defendants in the same litigation. OneCanadian wholesaler is also a subject of the Canadian investigation and is a defendant in certain of the lawsuits.While it is not feasible to predict the final outcome of these proceedings, in our opinion they should not have amaterial adverse effect on the financial position, liquidity or results of operations of the Company. The Companyis cooperating with the government investigations and inquiries and intends to defend the lawsuits vigorously.
5. DERIVATIVE INSTRUMENTS AND HEDGING ACTIVITIES
We account for derivative instruments in accordance with SFAS No. 133. SFAS No. 133 requires us torecognize all derivative instruments at fair value. We classify the derivatives as assets or liabilities on the balancesheet. Accounting for the change in fair value of the derivative depends on:
• whether the instrument qualifies for and has been designated as a hedging relationship; and
• the type of hedging relationship.
69

THE HERSHEY COMPANY
NOTES TO CONSOLIDATED FINANCIAL STATEMENTS—(Continued)
There are three types of hedging relationships:
• cash flow hedge;
• fair value hedge; and
• hedge of foreign currency exposure of a net investment in a foreign operation.
As of December 31, 2007, all of our derivative instruments were classified as cash flow hedges.
Objectives, Strategies and Accounting Policies Associated with Derivative Instruments
We use certain derivative instruments, from time to time, to manage interest rate, foreign currency exchangerate and commodity market price risk exposures. We enter into interest rate swaps and foreign currency contractsand options for periods consistent with related underlying exposures. We enter into commodities futurescontracts for varying periods. The futures contracts are effective as hedges of market price risks associated withanticipated raw material purchases, energy requirements and transportation costs. We do not hold or issuederivative instruments for trading purposes and are not a party to any instruments with leverage or prepaymentfeatures. In entering into these contracts, we have assumed the risk that might arise from the possible inability ofcounterparties to meet the terms of their contracts. We do not expect any significant losses from counterpartydefaults.
Interest Rate Swaps
In order to minimize financing costs and to manage interest rate exposure, from time to time, we enter intointerest rate swap agreements.
In December 2005, we entered into forward swap agreements to hedge interest rate exposure related to$500 million of term financing to be executed during 2006. In February 2006, we terminated a forward swapagreement hedging the anticipated execution of $250 million of term financing because the transaction was nolonger expected to occur by the originally specified time period or within an additional two-month period of timethereafter. We recorded a gain of $1.0 million in the first quarter of 2006 as a result of the discontinuance of thiscash flow hedge. In August 2006, a forward swap agreement hedging the anticipated issuance of $250 million of10-year notes matured resulting in cash receipts of $3.7 million. The $3.7 million gain on the swap will beamortized as a reduction to interest expense over the term of the $250 million of 5.45% Notes due September 1,2016.
In October 2003, we entered into swap agreements effectively converting interest payments on long-termdebt from fixed to variable rates. We converted interest payments on $200 million of 6.7% Notes due in October2005 and $150 million of 6.95% Notes due in March 2007 from their respective fixed rates to variable ratesbased on LIBOR. In March 2004, we terminated these agreements, resulting in cash receipts totaling $5.2million, with a corresponding increase to the carrying value of the long-term debt. We amortized this increaseover the remaining terms of the respective long-term debt as a reduction to interest expense.
We included gains and losses on these interest rate swap agreements in other comprehensive income. Werecognized the gains and losses on these interest rate swap agreements as an adjustment to interest expense in thesame period as the hedged interest payments affected earnings.
As of December 31, 2007, we were not a party to any interest rate swap agreements.
We classify cash flows from interest rate swap agreements as net cash provided from operating activities onthe Consolidated Statements of Cash Flows.
70

THE HERSHEY COMPANY
NOTES TO CONSOLIDATED FINANCIAL STATEMENTS—(Continued)
Our risk related to the swap agreements is limited to the cost of replacing the agreements at prevailingmarket rates.
Foreign Exchange Forward Contracts
We enter into foreign exchange forward contracts to hedge transactions primarily related to commitmentsand forecasted purchases of equipment, raw materials and finished goods denominated in foreign currencies. Wemay also hedge payment of forecasted intercompany transactions with our subsidiaries outside the United States.These contracts reduce currency risk from exchange rate movements. We generally hedge foreign currency pricerisks for periods from 3 to 24 months.
Foreign exchange forward contracts are effective as hedges of identifiable, foreign currency commitments.Since there is a direct relationship between the foreign currency derivatives and the foreign currencydenomination of the transactions, the derivatives are highly effective in hedging cash flows related to transactionsdenominated in the corresponding foreign currencies. We designate our foreign exchange forward contracts ascash flow hedging derivatives.
These contracts meet the criteria for cash flow hedge accounting treatment. Accordingly, we include relatedgains and losses in other comprehensive income. Subsequently, we recognize the gains and losses in cost of sales orselling, marketing and administrative expense in the same period that the hedged items affect earnings. In enteringinto these contracts, we have assumed the risk that might arise from the possible inability of counterparties to meetthe terms of their contracts. We do not expect any significant losses from counterparty defaults.
We classify the fair value of foreign exchange forward contracts as prepaid expenses and other currentassets, other non-current assets, accrued liabilities or other long-term liabilities on the Consolidated BalanceSheets. We report the offset to the contracts and options in accumulated other comprehensive loss, net of incometaxes. We record gains and losses on these contracts as a component of other comprehensive income andreclassify them into earnings in the same period during which the hedged transaction affects earnings. On hedgesassociated with the purchase of equipment, we designate the related cash flows as net cash flows (used by)provided from investing activities on the Consolidated Statements of Cash Flows. We classify cash flows fromother foreign exchange forward contracts as net cash provided from operating activities.
Commodities Futures Contracts
We enter into commodities futures contracts to reduce the effect of raw material price fluctuations and tohedge transportation costs. We generally hedge commodity price risks for 3 to 24 month periods. Thecommodities futures contracts are highly effective in hedging price risks for our raw material requirements andtransportation costs. Because our commodities futures contracts meet hedge criteria, we account for them as cashflow hedges. Accordingly, we include gains and losses on hedging in other comprehensive income. We recognizegains and losses ratably in cost of sales in the same period that we record the hedged raw material requirementsin cost of sales.
We use exchange traded futures contracts to fix the price of physical forward purchase contracts. Physicalforward purchase contracts meet the SFAS No. 133 definition of “normal purchases and sales” and, therefore, arenot accounted for as derivative instruments. On a daily basis, we receive or make cash transfers reflectingchanges in the value of futures contracts (unrealized gains and losses). As mentioned above, such gains andlosses are included as a component of other comprehensive income. The cash transfers offset higher or lowercash requirements for payment of future invoice prices for raw materials, energy requirements and transportationcosts. Futures held in excess of the amount required to fix the price of unpriced physical forward contracts areeffective as hedges of anticipated purchases.
71

THE HERSHEY COMPANY
NOTES TO CONSOLIDATED FINANCIAL STATEMENTS—(Continued)
Hedge Effectiveness—Commodities
We perform an assessment of hedge effectiveness for commodities futures on a quarterly basis. Because ofthe rollover strategy used for commodities futures contracts, as required by futures market conditions, someineffectiveness may result in hedging forecasted manufacturing requirements. This occurs as we switch futurescontracts from nearby contract positions to contract positions that are required to fix the price of anticipatedmanufacturing requirements. Hedge ineffectiveness may also result from variability in basis differentialsassociated with the purchase of raw materials for manufacturing requirements. In accordance with SFASNo. 133, we record the ineffective portion of gains or losses on commodities futures currently in cost of sales.
The prices of commodities futures contracts reflect delivery to the same locations where we take delivery ofthe physical commodities. Therefore, there is no ineffectiveness resulting from differences in location betweenthe derivative and the hedged item.
Summary of Activity
Our cash flow hedging derivative activity during the last three years was as follows:
For the years ended December 31, 2007 2006 2005
In millions of dollars
Net after-tax gains (losses) on cash flow hedging derivatives . . . . . $6.8 $11.4 $ (6.5)Reclassification adjustments from accumulated other
comprehensive income to income, net of tax . . . . . . . . . . . . . . . . .2 (5.3) 18.1Hedge ineffectiveness gains (losses) recognized in cost of sales,
before tax . . . . . . . . . . . . . . . . . . . . . . . . . . . . . . . . . . . . . . . . . . . (.5) 2.0 (2.0)
• Net gains and losses on cash flow hedging derivatives were primarily associated with commoditiesfutures contracts.
• Reclassification adjustments, from accumulated other comprehensive income (loss) to income, relatedto gains or losses on commodities futures contracts were reflected in cost of sales. Gains on interest rateswaps were reflected as an adjustment to interest expense.
• We recorded a gain of $1.0 million in 2006 as a result of the discontinuance of an interest rate swapbecause the hedged transaction was no longer expected to occur. No other gains or losses on cash flowhedging derivatives resulted because we discontinued a hedge due to the probability that the forecastedhedged transaction would not occur.
• We recognized no components of gains or losses on cash flow hedging derivatives in income due toexcluding such components from the hedge effectiveness assessment.
The amount of net losses on cash flow hedging derivatives, including foreign exchange forward contracts,interest rate swap agreements and commodities futures contracts, expected to be reclassified into earnings in thenext twelve months was approximately $5.0 million after tax as of December 31, 2007. This amount wasprimarily associated with commodities futures contracts.
72

THE HERSHEY COMPANY
NOTES TO CONSOLIDATED FINANCIAL STATEMENTS—(Continued)
6. COMPREHENSIVE INCOME
The presentation of other comprehensive income for the year ended December 31, 2006 was adjusted toexclude the impact of the adoption of SFAS No. 158. A summary of the components of comprehensive income isas follows:
For the year ended December 31, 2007Pre-TaxAmount
Tax(Expense)
BenefitAfter-TaxAmount
In thousands of dollars
Net income . . . . . . . . . . . . . . . . . . . . . . . . . . . . . . . . . . . . . . . . . . . . . . . . . . . . . $214,154
Other comprehensive income (loss):Foreign currency translation adjustments . . . . . . . . . . . . . . . . . . . . . . . . . . $ 44,845 $ — 44,845Pension and post-retirement benefit plans . . . . . . . . . . . . . . . . . . . . . . . . . 104,942 (46,535) 58,407Cash flow hedges:
Gains (losses) on cash flow hedging derivatives . . . . . . . . . . . . . . . . 10,623 (3,838) 6,785Reclassification adjustments . . . . . . . . . . . . . . . . . . . . . . . . . . . . . . . . 252 (79) 173
Total other comprehensive income . . . . . . . . . . . . . . . . . . . . . . . . . . . . . . . . . . . $160,662 $(50,452) 110,210
Comprehensive income . . . . . . . . . . . . . . . . . . . . . . . . . . . . . . . . . . . . . . . . . . . . $324,364
For the year ended December 31, 2006Pre-TaxAmount
Tax(Expense)
BenefitAfter-TaxAmount
In thousands of dollars
Net income . . . . . . . . . . . . . . . . . . . . . . . . . . . . . . . . . . . . . . . . . . . . . . . . . . . . . $559,061
Other comprehensive income (loss):Foreign currency translation adjustments . . . . . . . . . . . . . . . . . . . . . . . . . . $ (278) $ — (278)Minimum pension liability adjustments . . . . . . . . . . . . . . . . . . . . . . . . . . . 5,395 (2,035) 3,360Cash flow hedges:
Gains (losses) on cash flow hedging derivatives . . . . . . . . . . . . . . . . 18,206 (6,847) 11,359Reclassification adjustments . . . . . . . . . . . . . . . . . . . . . . . . . . . . . . . . (8,370) 3,034 (5,336)
Total other comprehensive income . . . . . . . . . . . . . . . . . . . . . . . . . . . . . . . . . . . $ 14,953 $ (5,848) 9,105
Comprehensive income . . . . . . . . . . . . . . . . . . . . . . . . . . . . . . . . . . . . . . . . . . . . $568,166
For the year ended December 31, 2005Pre-TaxAmount
Tax(Expense)
BenefitAfter-TaxAmount
In thousands of dollars
Net income . . . . . . . . . . . . . . . . . . . . . . . . . . . . . . . . . . . . . . . . . . . . . . . . . . . . . $488,547
Other comprehensive income (loss):Foreign currency translation adjustments . . . . . . . . . . . . . . . . . . . . . . . . . . $ 17,151 $ — 17,151Minimum pension liability adjustments . . . . . . . . . . . . . . . . . . . . . . . . . . . (5,395) 3,164 (2,231)Cash flow hedges:
Gains (losses) on cash flow hedging derivatives . . . . . . . . . . . . . . . . (10,255) 3,791 (6,464)Reclassification adjustments . . . . . . . . . . . . . . . . . . . . . . . . . . . . . . . . (28,435) 10,348 (18,087)
Total other comprehensive income . . . . . . . . . . . . . . . . . . . . . . . . . . . . . . . . . . . $ (26,934) $ 17,303 (9,631)
Comprehensive income . . . . . . . . . . . . . . . . . . . . . . . . . . . . . . . . . . . . . . . . . . . . $478,916
73

THE HERSHEY COMPANY
NOTES TO CONSOLIDATED FINANCIAL STATEMENTS—(Continued)
Comprehensive income is included on the Consolidated Statements of Stockholders’ Equity. Thecomponents of accumulated other comprehensive loss, as shown on the Consolidated Balance Sheets, are asfollows:
December 31, 2007 2006
In thousands of dollars
Foreign currency translation adjustments . . . . . . . . . . . . . . . . . . . . . . . . . . . . . . . $ 44,810 $ (35)Pension and post-retirement benefit plans . . . . . . . . . . . . . . . . . . . . . . . . . . . . . . (79,565) (137,972)Cash flow hedges . . . . . . . . . . . . . . . . . . . . . . . . . . . . . . . . . . . . . . . . . . . . . . . . . 6,776 (182)
Total accumulated other comprehensive loss . . . . . . . . . . . . . . . . . . . . . . . . . . . . $(27,979) $(138,189)
7. FINANCIAL INSTRUMENTS
The carrying amounts of financial instruments including cash and cash equivalents, accounts receivable,accounts payable and short-term debt approximated fair value as of December 31, 2007 and 2006, because of therelatively short maturity of these instruments.
The carrying value of long-term debt, including the current portion, was $1,286.1 million as ofDecember 31, 2007, compared with a fair value of $1,331.1 million based on quoted market prices for the sameor similar debt issues. The carrying value of long-term debt, including the current portion, was $1,436.9 millionas of December 31, 2006 compared with a fair value of $1,519.1 million.
Foreign Exchange Forward Contracts
For information on the objectives, strategies and accounting polices related to our use of foreign exchangeforward contracts, see Note 5, Derivative Instruments and Hedging Activities.
The following table summarizes our foreign exchange activity:
December 31, 2007 2006
ContractAmount
PrimaryCurrencies
ContractAmount
PrimaryCurrencies
In millions of dollars
Foreign exchange forward contractsto purchase foreign currencies . . . . $13.8
British poundsAustralian dollarsEuros
$29.0Australian dollarsCanadian dollarsEuros
Foreign exchange forward contractsto sell foreign currencies . . . . . . . . $86.7
Canadian dollarsBrazilian reaisMexican pesos
The fair value of foreign exchange forward contracts is included in prepaid expenses and other currentassets, other non-current assets, accrued liabilities or other long-term liabilities, as appropriate.
We define the fair value of foreign exchange forward contracts as the amount of the difference betweencontracted and current market foreign currency exchange rates at the end of the period. On a quarterly basis, weestimate the fair value of foreign exchange forward contracts by obtaining market quotes for future contracts withsimilar terms, adjusted where necessary for maturity differences.
74
THE HERSHEY COMPANY
NOTES TO CONSOLIDATED FINANCIAL STATEMENTS—(Continued)
The combined fair value of our foreign exchange forward contracts included in prepaid expenses and othercurrent assets, other non-current assets, accrued liabilities or other long-term liabilities on the ConsolidatedBalance Sheets was as follows:
December 31, 2007 2006
In millions of dollars
Fair value of foreign exchange forward contracts and options—(liability) asset . . . . . . $(2.1) $1.5
8. INTEREST EXPENSE
Net interest expense consisted of the following:
For the years ended December 31, 2007 2006 2005
In thousands of dollars
Long-term debt and lease obligations . . . . . . . . . . . . . . . . . . . . . . $ 80,351 $ 71,546 $66,324Short-term debt . . . . . . . . . . . . . . . . . . . . . . . . . . . . . . . . . . . . . . . . 43,485 46,269 23,164Capitalized interest . . . . . . . . . . . . . . . . . . . . . . . . . . . . . . . . . . . . . (2,770) (77) (3)
Interest expense, gross . . . . . . . . . . . . . . . . . . . . . . . . . . . . . . . . . . 121,066 117,738 89,485Interest income . . . . . . . . . . . . . . . . . . . . . . . . . . . . . . . . . . . . . . . . (2,481) (1,682) (1,500)
Interest expense, net . . . . . . . . . . . . . . . . . . . . . . . . . . . . . . . . . . . . $118,585 $116,056 $87,985
9. SHORT-TERM DEBT
As a source of short-term financing, we utilize commercial paper, or bank loans with an original maturity ofthree months or less. Credit agreements entered into over the last three years were as follows:
Date of Agreement Type of Agreement Purpose Credit Limit
August 2007(expires August 2008)
Unsecured revolvingcredit agreement
General corporate purposes $300 million
December 2006(term extended in 2007,
now expires December 2012)
Unsecured revolvingcredit agreement
General corporate purposes $1.1 billionOption to borrow
$400 million more
September 2006(expired December 2006)
Letter amendment Extend terms of March 2006agreement
$200 million
March 2006(expired September 2006)
Unsecured revolvingcredit agreement
Seasonal working capitalShare repurchasesOther business activities
$400 million
September 2005(expired December 2005)
Unsecured revolvingcredit agreement
General corporate purposesRetire 6.7% NotesRefinance lease arrangementsPension Plan contributionsStock repurchaseSeasonal working capital
$300 million
75
THE HERSHEY COMPANY
NOTES TO CONSOLIDATED FINANCIAL STATEMENTS—(Continued)
The August 2007 and December 2006 unsecured revolving credit agreements contain a financial covenantwhereby the ratio of (a) pre-tax income from operations from the most recent four fiscal quarters to(b) consolidated interest expense for the most recent four fiscal quarters may not be less than 2.0 to 1 at the endof each fiscal quarter. The credit agreements contain customary representations and warranties and events ofdefault. Payment of outstanding advances may be accelerated, at the option of the lenders, should we default inour obligation under the credit agreements. As of December 31, 2007, we complied with all customaryaffirmative and negative covenants and the financial covenant pertaining to our credit agreements. There were nosignificant compensating balance agreements that legally restricted these funds.
In addition to the revolving credit facility, we maintain lines of credit with domestic and internationalcommercial banks. Our credit limit in various currencies was $57.0 million in 2007 and $54.2 million in 2006.These lines permit us to borrow at the banks’ prime commercial interest rates, or lower. We had short-termforeign bank loans against these lines of credit for $22.5 million in 2007 and $12.5 million in 2006.
The maximum amount of our short-term borrowings during 2007 was $1,065.0 million. The weighted-average interest rate on short-term borrowings outstanding was 4.5% and 5.3% as of December 31, 2007 and2006, respectively.
We pay commitment fees to maintain our lines of credit. The average fee during 2007 was less than0.1% per annum of the commitment.
We maintain a consolidated cash management system that includes overdraft positions in certain accounts atseveral banks. We have the contractual right of offset for the accounts with overdrafts. These offsets reducedcash and cash equivalents by $5.9 million as of December 31, 2007 and $36.6 million as of December 31, 2006.
10. LONG-TERM DEBT
Long-term debt consisted of the following:
December 31, 2007 2006
In thousands of dollars
6.95% Notes due 2007 . . . . . . . . . . . . . . . . . . . . . . . . . . . . . . . . . . . . . . . . . . . . . . . . . . $ — $ 150,1685.30% Notes due 2011 . . . . . . . . . . . . . . . . . . . . . . . . . . . . . . . . . . . . . . . . . . . . . . . . . . 250,000 250,0006.95% Notes due 2012 . . . . . . . . . . . . . . . . . . . . . . . . . . . . . . . . . . . . . . . . . . . . . . . . . . 150,000 150,0004.85% Notes due 2015 . . . . . . . . . . . . . . . . . . . . . . . . . . . . . . . . . . . . . . . . . . . . . . . . . . 250,000 250,0005.45% Notes due 2016 . . . . . . . . . . . . . . . . . . . . . . . . . . . . . . . . . . . . . . . . . . . . . . . . . . 250,000 250,0008.8% Debentures due 2021 . . . . . . . . . . . . . . . . . . . . . . . . . . . . . . . . . . . . . . . . . . . . . . . 100,000 100,0007.2% Debentures due 2027 . . . . . . . . . . . . . . . . . . . . . . . . . . . . . . . . . . . . . . . . . . . . . . . 250,000 250,000Obligations associated with consolidation of lease arrangements . . . . . . . . . . . . . . . . . — 38,680Other obligations, net of unamortized debt discount . . . . . . . . . . . . . . . . . . . . . . . . . . . 36,069 (1,955)
Total long-term debt . . . . . . . . . . . . . . . . . . . . . . . . . . . . . . . . . . . . . . . . . . . . . . . . . . . . 1,286,069 1,436,893Less—current portion . . . . . . . . . . . . . . . . . . . . . . . . . . . . . . . . . . . . . . . . . . . . . . . . . . . 6,104 188,765
Long-term portion . . . . . . . . . . . . . . . . . . . . . . . . . . . . . . . . . . . . . . . . . . . . . . . . . . . . . . $1,279,965 $1,248,128
The increase in other obligations, net of unamortized debt discount reflected debt associated with theacquisition of Godrej Hershey Foods and Beverages Company.
76
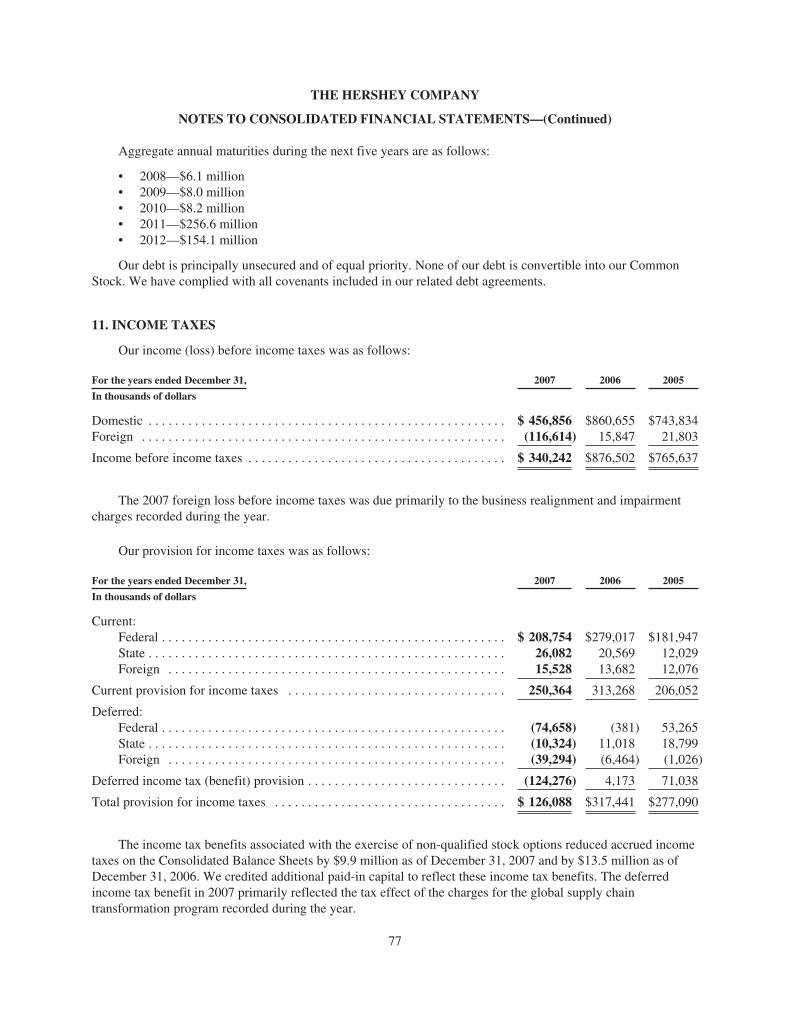
THE HERSHEY COMPANY
NOTES TO CONSOLIDATED FINANCIAL STATEMENTS—(Continued)
Aggregate annual maturities during the next five years are as follows:
• 2008—$6.1 million• 2009—$8.0 million• 2010—$8.2 million• 2011—$256.6 million• 2012—$154.1 million
Our debt is principally unsecured and of equal priority. None of our debt is convertible into our CommonStock. We have complied with all covenants included in our related debt agreements.
11. INCOME TAXES
Our income (loss) before income taxes was as follows:
For the years ended December 31, 2007 2006 2005
In thousands of dollars
Domestic . . . . . . . . . . . . . . . . . . . . . . . . . . . . . . . . . . . . . . . . . . . . . . . . . . . . . . $ 456,856 $860,655 $743,834Foreign . . . . . . . . . . . . . . . . . . . . . . . . . . . . . . . . . . . . . . . . . . . . . . . . . . . . . . . (116,614) 15,847 21,803
Income before income taxes . . . . . . . . . . . . . . . . . . . . . . . . . . . . . . . . . . . . . . . $ 340,242 $876,502 $765,637
The 2007 foreign loss before income taxes was due primarily to the business realignment and impairmentcharges recorded during the year.
Our provision for income taxes was as follows:
For the years ended December 31, 2007 2006 2005
In thousands of dollars
Current:Federal . . . . . . . . . . . . . . . . . . . . . . . . . . . . . . . . . . . . . . . . . . . . . . . . . . . . $ 208,754 $279,017 $181,947State . . . . . . . . . . . . . . . . . . . . . . . . . . . . . . . . . . . . . . . . . . . . . . . . . . . . . . 26,082 20,569 12,029Foreign . . . . . . . . . . . . . . . . . . . . . . . . . . . . . . . . . . . . . . . . . . . . . . . . . . . 15,528 13,682 12,076
Current provision for income taxes . . . . . . . . . . . . . . . . . . . . . . . . . . . . . . . . . 250,364 313,268 206,052
Deferred:Federal . . . . . . . . . . . . . . . . . . . . . . . . . . . . . . . . . . . . . . . . . . . . . . . . . . . . (74,658) (381) 53,265State . . . . . . . . . . . . . . . . . . . . . . . . . . . . . . . . . . . . . . . . . . . . . . . . . . . . . . (10,324) 11,018 18,799Foreign . . . . . . . . . . . . . . . . . . . . . . . . . . . . . . . . . . . . . . . . . . . . . . . . . . . (39,294) (6,464) (1,026)
Deferred income tax (benefit) provision . . . . . . . . . . . . . . . . . . . . . . . . . . . . . . (124,276) 4,173 71,038
Total provision for income taxes . . . . . . . . . . . . . . . . . . . . . . . . . . . . . . . . . . . $ 126,088 $317,441 $277,090
The income tax benefits associated with the exercise of non-qualified stock options reduced accrued incometaxes on the Consolidated Balance Sheets by $9.9 million as of December 31, 2007 and by $13.5 million as ofDecember 31, 2006. We credited additional paid-in capital to reflect these income tax benefits. The deferredincome tax benefit in 2007 primarily reflected the tax effect of the charges for the global supply chaintransformation program recorded during the year.
77

THE HERSHEY COMPANY
NOTES TO CONSOLIDATED FINANCIAL STATEMENTS—(Continued)
Deferred taxes reflect temporary differences between the tax basis and financial statement carrying value ofassets and liabilities. The tax effects of the significant temporary differences that comprised the deferred taxassets and liabilities were as follows:
December 31, 2007 2006
In thousands of dollars
Deferred tax assets:Post-retirement benefit obligations . . . . . . . . . . . . . . . . . . . . . . . . . . . . . . $154,174 $150,794Accrued expenses and other reserves . . . . . . . . . . . . . . . . . . . . . . . . . . . . 126,032 123,690Stock-based compensation . . . . . . . . . . . . . . . . . . . . . . . . . . . . . . . . . . . . 55,003 46,087Accrued trade promotion reserves . . . . . . . . . . . . . . . . . . . . . . . . . . . . . . 6,107 4,606Net operating loss carryforwards . . . . . . . . . . . . . . . . . . . . . . . . . . . . . . . 26,792 18,858Other . . . . . . . . . . . . . . . . . . . . . . . . . . . . . . . . . . . . . . . . . . . . . . . . . . . . . 14,096 18,298
Gross deferred tax assets . . . . . . . . . . . . . . . . . . . . . . . . . . . . . . . . . . . . . . 382,204 362,333Valuation allowance . . . . . . . . . . . . . . . . . . . . . . . . . . . . . . . . . . . . . . . . . (28,029) (25,587)
Total deferred tax assets . . . . . . . . . . . . . . . . . . . . . . . . . . . . . . . . . . 354,175 336,746
Deferred tax liabilities:Property, plant and equipment, net . . . . . . . . . . . . . . . . . . . . . . . . . . . . . . 200,478 263,226Pension . . . . . . . . . . . . . . . . . . . . . . . . . . . . . . . . . . . . . . . . . . . . . . . . . . . 163,461 151,672Acquired intangibles . . . . . . . . . . . . . . . . . . . . . . . . . . . . . . . . . . . . . . . . . 48,756 46,522Inventories . . . . . . . . . . . . . . . . . . . . . . . . . . . . . . . . . . . . . . . . . . . . . . . . . 34,008 35,586Other . . . . . . . . . . . . . . . . . . . . . . . . . . . . . . . . . . . . . . . . . . . . . . . . . . . . . 4,646 64,383
Total deferred tax liabilities . . . . . . . . . . . . . . . . . . . . . . . . . . . . . . . 451,349 561,389
Net deferred tax liabilities . . . . . . . . . . . . . . . . . . . . . . . . . . . . . . . . . . . . . . . . . $ 97,174 $224,643
Included in:Current deferred tax assets, net . . . . . . . . . . . . . . . . . . . . . . . . . . . . . . . . . (83,668) (61,360)Non-current deferred tax liabilities, net . . . . . . . . . . . . . . . . . . . . . . . . . . 180,842 286,003
Net deferred tax liabilities . . . . . . . . . . . . . . . . . . . . . . . . . . . . . . . . . . . . . $ 97,174 $224,643
Deferred tax liabilities associated with property, plant and equipment decreased from 2006 to 2007primarily as a result of tax benefits related to accelerated depreciation recorded as part of our global supply chaintransformation program. The decrease in other deferred tax liabilities from 2006 to 2007 was associated with theadoption of FASB Interpretation No. 48, Accounting for Uncertainty in Income Taxes, an interpretation of FASBStatement No. 109 (“FIN No. 48”) as of January 1, 2007. The gross amount of unrecognized tax benefits wasreclassified to other long-term liabilities and the related Federal benefit from state taxes was reclassified to otherassets.
We believe that it is more likely than not that the results of future operations will generate sufficient taxableincome to realize the deferred tax assets. The valuation allowances as of December 31, 2007 and 2006 wereprimarily related to tax loss carryforwards from operations in various foreign tax jurisdictions. Additionalinformation on income tax benefits and expenses related to components of accumulated other comprehensiveincome (loss) is provided in Note 6, Comprehensive Income.
78

THE HERSHEY COMPANY
NOTES TO CONSOLIDATED FINANCIAL STATEMENTS—(Continued)
The following table reconciles the Federal statutory income tax rate with our effective income tax rate:
For the years ended December 31, 2007 2006 2005
Federal statutory income tax rate . . . . . . . . . . . . . . . . . . . . . . . . . . . . . . . . . . . . . 35.0% 35.0% 35.0%Increase (reduction) resulting from:
State income taxes, net of Federal income tax benefits . . . . . . . . . . . . . . . . . . 2.2 2.8 2.6Qualified production income deduction . . . . . . . . . . . . . . . . . . . . . . . . . . . . . . (1.7) (.9) (.9)Puerto Rico operations . . . . . . . . . . . . . . . . . . . . . . . . . . . . . . . . . . . . . . . . . . . — — (.6)Business realignment initiatives . . . . . . . . . . . . . . . . . . . . . . . . . . . . . . . . . . . . 1.1 — (.2)Other, net . . . . . . . . . . . . . . . . . . . . . . . . . . . . . . . . . . . . . . . . . . . . . . . . . . . . . .5 (.7) .3
Effective income tax rate . . . . . . . . . . . . . . . . . . . . . . . . . . . . . . . . . . . . . . . . . . . 37.1% 36.2% 36.2%
Included with the purchase of the Nabisco gum and mint business in December 2000, was a U.S. InternalRevenue Code (“IRC”) Section 936 company with a subsidiary operating in Las Piedras, Puerto Rico. Theoperating income of this subsidiary was subject to a lower income tax rate in both the United States and PuertoRico. We sold the IRC Section 936 company in December 2005.
The effective income tax rate for 2007 was higher by 1.1 percentage points and the effective income tax ratefor 2005 benefited by 0.2 percentage points from the impact of tax rates associated with business realignment andimpairment charges.
In June 2006, the FASB issued FIN No. 48. FIN No. 48 clarifies the accounting for uncertainty in incometaxes recognized in an enterprise’s financial statements in accordance with Statement of Financial AccountingStandards No. 109, Accounting for Income Taxes. FIN No. 48 describes a recognition threshold and measurementattribute for the financial statement recognition and measurement of a tax position taken or expected to be takenin a tax return and also provides guidance on derecognition, classification, interest and penalties, accounting ininterim periods, disclosure and transition.
We adopted the provisions of FIN No. 48 as of January 1, 2007. The adoption of FIN No. 48 did not resultin a significant change to the liability for unrecognized tax benefits, less offsetting long-term tax assets.
A reconciliation of the beginning and ending amount of unrecognized tax benefits is as follows:
In thousands of dollars
Balance as of January 1, 2007 . . . . . . . . . . . . . . . . . . . . . . . . . . . . . . . . . . . . . . . . . . . . . . . . . $79,040Additions for tax positions taken during prior years . . . . . . . . . . . . . . . . . . . . . . . . . . . . . . . . 4,385Reductions for tax positions taken during prior years . . . . . . . . . . . . . . . . . . . . . . . . . . . . . . . (7,819)Additions for tax positions taken during the current year . . . . . . . . . . . . . . . . . . . . . . . . . . . . 10,388Settlements . . . . . . . . . . . . . . . . . . . . . . . . . . . . . . . . . . . . . . . . . . . . . . . . . . . . . . . . . . . . . . . . (5,900)Expiration of statutes of limitations . . . . . . . . . . . . . . . . . . . . . . . . . . . . . . . . . . . . . . . . . . . . . (5,370)
Balance as of December 31, 2007 . . . . . . . . . . . . . . . . . . . . . . . . . . . . . . . . . . . . . . . . . . . . . . $74,724
The total amount of unrecognized tax benefits that, if recognized, would affect the effective tax rate is $49.5million.
We report accrued interest and penalties related to unrecognized tax benefits in income tax expense. Werecognized interest (net of federal benefit) and penalties of $.4 million during 2007, $1.4 million during 2006,and $3.9 million during 2005. Accrued interest and penalties were $20.8 million as of December 31, 2007 and$17.4 million as of January 1, 2007.
79

THE HERSHEY COMPANY
NOTES TO CONSOLIDATED FINANCIAL STATEMENTS—(Continued)
We file income tax returns in the U.S. federal jurisdiction and various state and foreign jurisdictions. Anumber of years may elapse before an uncertain tax position, for which we have unrecognized tax benefits, isaudited and finally resolved. While it is often difficult to predict the final outcome or the timing of resolution ofany particular uncertain tax position, we believe that our unrecognized tax benefits reflect the most likelyoutcome. We adjust these unrecognized tax benefits, as well as the related interest, in light of changing facts andcircumstances. Settlement of any particular position could require the use of cash. Favorable resolution would berecognized as a reduction to our effective income tax rate in the period of resolution.
The number of years with open tax audits varies depending on the tax jurisdiction. Our major taxingjurisdictions include the United States (federal and state) and Canada. We are no longer subject to U.S. federalexaminations by the Internal Revenue Service (“IRS”) for years before 2004 and various tax examinations bystate taxing authorities could be conducted for years beginning in 2000. We are no longer subject to Canadianfederal income tax examinations by the Canada Revenue Agency (“CRA”) for years before 1999. U.S. andCanadian federal audit issues typically involve the timing of deductions and transfer pricing adjustments. Wework with the IRS and the CRA to resolve proposed audit adjustments and to minimize the amount ofadjustments. We do not anticipate that any potential tax adjustments will have a significant impact on ourfinancial position or results of operations.
We reasonably expect reductions in the liability for unrecognized tax benefits of approximately $9.9 millionwithin the next twelve months because of expirations of statutes of limitations.
12. PENSION AND OTHER POST-RETIREMENT BENEFIT PLANS
We sponsor a number of defined benefit pension plans. Our policy is to fund domestic pension liabilities inaccordance with the minimum and maximum limits imposed by the Employee Retirement Income Security Actof 1974 (“ERISA”) and Federal income tax laws. We fund non-domestic pension liabilities in accordance withlaws and regulations applicable to those plans.
We have two post-retirement benefit plans: health care and life insurance. The health care plan iscontributory, with participants’ contributions adjusted annually. The life insurance plan is non-contributory.
Effective December 31, 2006, we adopted SFAS No. 158. The provisions of SFAS No. 158 required that thefunded status of our pension plans and the benefit obligations of our post-retirement benefit plans be recognizedin our balance sheet. The provisions of SFAS No. 158 also revised employers’ disclosures about pension andother post-retirement benefit plans. SFAS No. 158 did not change the measurement or recognition of these plans,although it did require that plan assets and benefit obligations be measured as of the balance sheet date. We havehistorically measured the plan assets and benefit obligations as of our balance sheet date.
80
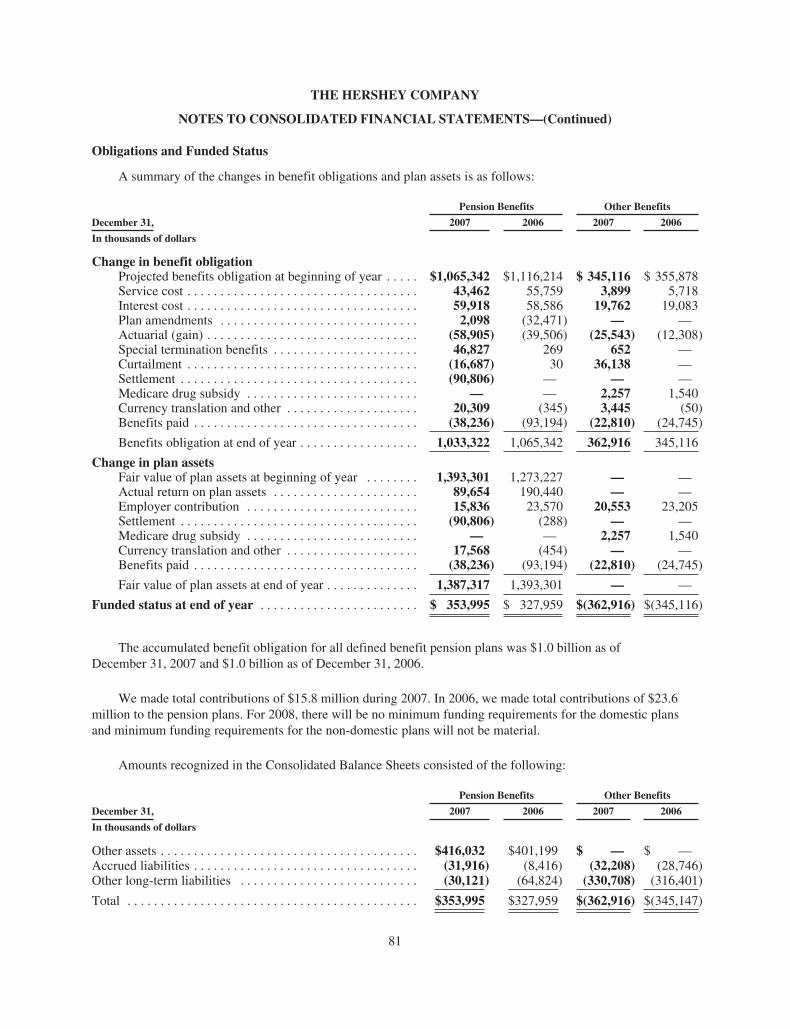
THE HERSHEY COMPANY
NOTES TO CONSOLIDATED FINANCIAL STATEMENTS—(Continued)
Obligations and Funded Status
A summary of the changes in benefit obligations and plan assets is as follows:
Pension Benefits Other Benefits
December 31, 2007 2006 2007 2006
In thousands of dollars
Change in benefit obligationProjected benefits obligation at beginning of year . . . . . $1,065,342 $1,116,214 $ 345,116 $ 355,878Service cost . . . . . . . . . . . . . . . . . . . . . . . . . . . . . . . . . . . 43,462 55,759 3,899 5,718Interest cost . . . . . . . . . . . . . . . . . . . . . . . . . . . . . . . . . . . 59,918 58,586 19,762 19,083Plan amendments . . . . . . . . . . . . . . . . . . . . . . . . . . . . . . 2,098 (32,471) — —Actuarial (gain) . . . . . . . . . . . . . . . . . . . . . . . . . . . . . . . . (58,905) (39,506) (25,543) (12,308)Special termination benefits . . . . . . . . . . . . . . . . . . . . . . 46,827 269 652 —Curtailment . . . . . . . . . . . . . . . . . . . . . . . . . . . . . . . . . . . (16,687) 30 36,138 —Settlement . . . . . . . . . . . . . . . . . . . . . . . . . . . . . . . . . . . . (90,806) — — —Medicare drug subsidy . . . . . . . . . . . . . . . . . . . . . . . . . . — — 2,257 1,540Currency translation and other . . . . . . . . . . . . . . . . . . . . 20,309 (345) 3,445 (50)Benefits paid . . . . . . . . . . . . . . . . . . . . . . . . . . . . . . . . . . (38,236) (93,194) (22,810) (24,745)
Benefits obligation at end of year . . . . . . . . . . . . . . . . . . 1,033,322 1,065,342 362,916 345,116
Change in plan assetsFair value of plan assets at beginning of year . . . . . . . . 1,393,301 1,273,227 — —Actual return on plan assets . . . . . . . . . . . . . . . . . . . . . . 89,654 190,440 — —Employer contribution . . . . . . . . . . . . . . . . . . . . . . . . . . 15,836 23,570 20,553 23,205Settlement . . . . . . . . . . . . . . . . . . . . . . . . . . . . . . . . . . . . (90,806) (288) — —Medicare drug subsidy . . . . . . . . . . . . . . . . . . . . . . . . . . — — 2,257 1,540Currency translation and other . . . . . . . . . . . . . . . . . . . . 17,568 (454) — —Benefits paid . . . . . . . . . . . . . . . . . . . . . . . . . . . . . . . . . . (38,236) (93,194) (22,810) (24,745)
Fair value of plan assets at end of year . . . . . . . . . . . . . . 1,387,317 1,393,301 — —
Funded status at end of year . . . . . . . . . . . . . . . . . . . . . . . . $ 353,995 $ 327,959 $(362,916) $(345,116)
The accumulated benefit obligation for all defined benefit pension plans was $1.0 billion as ofDecember 31, 2007 and $1.0 billion as of December 31, 2006.
We made total contributions of $15.8 million during 2007. In 2006, we made total contributions of $23.6million to the pension plans. For 2008, there will be no minimum funding requirements for the domestic plansand minimum funding requirements for the non-domestic plans will not be material.
Amounts recognized in the Consolidated Balance Sheets consisted of the following:
Pension Benefits Other Benefits
December 31, 2007 2006 2007 2006
In thousands of dollars
Other assets . . . . . . . . . . . . . . . . . . . . . . . . . . . . . . . . . . . . . . . $416,032 $401,199 $ — $ —Accrued liabilities . . . . . . . . . . . . . . . . . . . . . . . . . . . . . . . . . . (31,916) (8,416) (32,208) (28,746)Other long-term liabilities . . . . . . . . . . . . . . . . . . . . . . . . . . . (30,121) (64,824) (330,708) (316,401)
Total . . . . . . . . . . . . . . . . . . . . . . . . . . . . . . . . . . . . . . . . . . . . $353,995 $327,959 $(362,916) $(345,147)
81

THE HERSHEY COMPANY
NOTES TO CONSOLIDATED FINANCIAL STATEMENTS—(Continued)
Amounts recognized in accumulated other comprehensive income (loss), net of tax, consisted of thefollowing:
Pension Benefits Other Benefits
December 31, 2007 2006 2007 2006
In thousands of dollars
Actuarial net loss . . . . . . . . . . . . . . . . . . . . . . . . . . . $(70,000) $(104,959) $(13,645) $(34,173)Net prior service credit (cost) . . . . . . . . . . . . . . . . . 2,374 (611) 1,706 1,771
Total . . . . . . . . . . . . . . . . . . . . . . . . . . . . . . . . . . . . . $(67,626) $(105,570) $(11,939) $(32,402)
Plans with accumulated benefit obligations in excess of plan assets were as follows:
December 31, 2007 2006
In thousands of dollars
Projected benefit obligation . . . . . . . . . . . . . . . . . . . . . . . . . . . . . . . . . . . . . . . . . $63,014 $69,633Accumulated benefit obligation . . . . . . . . . . . . . . . . . . . . . . . . . . . . . . . . . . . . . . 55,623 61,542Fair value of plan assets . . . . . . . . . . . . . . . . . . . . . . . . . . . . . . . . . . . . . . . . . . . . 977 15,275
Components of Net Periodic Benefit (Income) Cost and Other Amounts Recognized in OtherComprehensive Income
Net periodic benefit cost for our pension and other post-retirement plans consisted of the following:
Pension Benefits Other Benefits
For the years ended December 31, 2007 2006 2005 2007 2006 2005
In thousands of dollars
Service cost . . . . . . . . . . . . . . . . . . . . . . $ 43,462 $ 55,759 $ 49,065 $ 3,899 $ 5,718 $ 5,149
Interest cost . . . . . . . . . . . . . . . . . . . . . . 59,918 58,586 55,181 19,762 19,083 18,115
Expected return on plan assets . . . . . . . (115,956) (106,066) (90,482) — — —
Amortization of prior service cost(credit) . . . . . . . . . . . . . . . . . . . . . . . . 1,936 3,981 4,380 (151) 192 (1,279)
Amortization of unrecognizedtransition balance . . . . . . . . . . . . . . . — 59 392 — — —
Amortization of net loss . . . . . . . . . . . . 1,095 12,128 10,611 1,218 3,705 2,639
Administrative expenses . . . . . . . . . . . . 563 889 782 — — —
Net periodic benefit (income) cost . . . . . . . . (8,982) 25,336 29,929 24,728 28,698 24,624Special termination benefits . . . . . . . . . 46,827 269 22,792 652 — 1,910Curtailment loss . . . . . . . . . . . . . . . . . . 8,400 49 785 41,653 113 7,874Settlement loss . . . . . . . . . . . . . . . . . . . 11,753 28 — — — —
Total amount reflected in earnings . . . . . . . . $ 57,998 $ 25,682 $ 53,506 $67,033 $28,811 $34,408
The Special Termination benefits charge and Curtailment Loss recorded in 2007 were related to the supplychain transformation program and the amounts during 2006 and 2005 were primarily associated with a voluntaryworkforce reduction program.
82

THE HERSHEY COMPANY
NOTES TO CONSOLIDATED FINANCIAL STATEMENTS—(Continued)
The amounts recognized in other comprehensive income for 2006 were adjusted to exclude the impact of theadoption of SFAS No. 158. Other amounts recognized in other comprehensive income and net periodic benefit(income) cost before tax for our pension and other post-retirement plans consisted of the following:
Pension Benefits Other Benefits
For the years ended December 31, 2007 2006 2005 2007 2006 2005
In thousands of dollars
Actuarial net gain . . . . . . . . . . . . . . . . . . . . . . . . $(58,481) $ — $ — $(41,594) $ — $ —Prior service cost (credit) . . . . . . . . . . . . . . . . . . (4,975) — — 108 — —Minimum pension liability . . . . . . . . . . . . . . . . . — 5,395 (5,395) — — —
Total recognized in other comprehensiveincome . . . . . . . . . . . . . . . . . . . . . . . . . . $(63,456) $ 5,395 $ (5,395) $(41,486) $ — $ —
Total recognized in net periodic benefit(income) cost and other comprehensiveincome . . . . . . . . . . . . . . . . . . . . . . . . . . $(72,438) $30,731 $24,534 $(16,758) $28,698 $24,624
The estimated amounts for the defined benefit pension plans and the post-retirement benefit plans that willbe amortized from accumulated other comprehensive income into net periodic benefit (income) cost over thenext fiscal year are as follows (in thousands):
Pension PlansPost-Retirement
Benefit Plans
Amortization of net actuarial (loss) gain . . . . . . . . . . . . . . . . . . . . . . . . . . . . . . . . . . $ (165) $ 214
Amortization of prior service cost (credit) . . . . . . . . . . . . . . . . . . . . . . . . . . . . . . . . $1,268 $(457)
Assumptions
Certain weighted-average assumptions used in computing the benefit obligations as of December 31, 2007were as follows:
Pension Benefits Other Benefits
2007 2006 2007 2006
Discount rate . . . . . . . . . . . . . . . . . . . . . . . . . . . . . . . . . . . . . . . . . . . . . 6.2% 5.7% 6.2% 5.7%Rate of increase in compensation levels . . . . . . . . . . . . . . . . . . . . . . . . 4.8% 4.8% N/A N/A
For measurement purposes as of December 31, 2007, we assumed a 9.0% annual rate of increase in the percapita cost of covered health care benefits for 2008, grading down to 5.00% by 2012.
For measurement purposes as of December 31, 2006, we assumed a 9.0% annual rate of increase in the percapita cost of covered health care benefits for 2007, grading down to 5.25% by 2010.
Certain weighted-average assumptions used in computing net periodic benefit (income) cost are as follows:
Pension Benefits Other Benefits
For the years ended December 31, 2007 2006 2005 2007 2006 2005
Discount rate . . . . . . . . . . . . . . . . . . . . . . . . . . . . . . . . . . 5.8% 5.4% 5.7% 5.8% 5.4% 5.7%Expected long-term return on plan assets . . . . . . . . . . . . 8.5% 8.5% 8.5% N/A N/A N/ARate of compensation increase . . . . . . . . . . . . . . . . . . . . 4.7% 4.8% 4.8% N/A N/A N/A
83

THE HERSHEY COMPANY
NOTES TO CONSOLIDATED FINANCIAL STATEMENTS—(Continued)
We based the asset return assumption of 8.5% for 2007, 2006 and 2005 on current and expected assetallocations, as well as historical and expected returns on the plan asset categories. The historical geometricaverage return over the 20 years prior to December 31, 2007, was approximately 9.8%.
Assumed health care cost trend rates have a significant effect on the amounts reported for the post-retirement health care plans. A one-percentage point change in assumed health care cost trend rates would havethe following effects:
Impact of assumed health care cost trend ratesOne-PercentagePoint Increase
One-PercentagePoint
(Decrease)
In thousands of dollars
Effect on total service and interest cost components . . . . . . . . . . . . . . $ 528 $ (475)Effect on post-retirement benefit obligation . . . . . . . . . . . . . . . . . . . . 8,005 (7,230)
Plan Assets
The following table sets forth the actual asset allocation and weighted-average target asset allocation for ourU.S. and non-U.S. pension plan assets:
TargetAllocation
2008
Percentage of PlanAssets as of December 31,
Asset Category 2007 2006
Equity securities . . . . . . . . . . . . . . . . . . . . . . . . . . . . . . . . . . . . . . 58-85% 71% 75%Debt securities . . . . . . . . . . . . . . . . . . . . . . . . . . . . . . . . . . . . . . . . 15-42 27 23Other . . . . . . . . . . . . . . . . . . . . . . . . . . . . . . . . . . . . . . . . . . . . . . . 0-5 2 2
Total . . . . . . . . . . . . . . . . . . . . . . . . . . . . . . . . . . . . . . . . . . . . . . . . 100% 100%
Investment objectives for our domestic plan assets are:
• To optimize the long-term return on plan assets at an acceptable level of risk;
• To maintain a broad diversification across asset classes;
• To maintain careful control of the risk level within each asset class; and
• To focus on a long-term return objective.
Our Company complies with ERISA rules and regulations and we prohibit investments and investmentstrategies not allowed by ERISA. We do not permit direct purchases of our Company’s securities or the use ofderivatives for the purpose of speculation. We invest the assets of non-domestic plans in compliance with lawsand regulations applicable to those plans.
Cash Flows
Information about the expected cash flows for our pension and other post-retirement benefit plans is asfollows:
Expected Benefit Payments
2008 2009 2010 2011 2012 2013–2017
(In thousands of dollars)
Pension Benefits . . . . . . . . . $158,906 $111,960 $72,819 $46,877 $57,619 $379,793Other Benefits . . . . . . . . . . . 32,208 36,006 37,286 36,861 35,240 145,644
84

THE HERSHEY COMPANY
NOTES TO CONSOLIDATED FINANCIAL STATEMENTS—(Continued)
13. EMPLOYEE STOCK OWNERSHIP TRUST AND SAVINGS PLANS
Prior to December 31, 2006, our Company’s employee stock ownership trust (“ESOP”) served as theprimary vehicle for employer contributions to The Hershey Company 401(k) Plan (formerly known as TheHershey Company Employee Savings Stock Investment and Ownership Plan) for participating domestic salariedand hourly employees. In December 1991, we funded the ESOP by providing a 15-year, 7.75% loan of $47.9million. The ESOP used the proceeds of the loan to purchase our Common Stock. During 2006 and 2005, theESOP received a combination of dividends on unallocated shares of our Common Stock and contributions fromus. This equals the amount required to meet principal and interest payments under the loan. Simultaneously, theESOP allocated to participants 318,351 shares of our Common Stock each year. As of December 31, 2006 allshares had been allocated. We consider all ESOP shares as outstanding for income per share computations.
The following table summarizes our ESOP expense and dividends:
For the years ended December 31, 2006 2005
In millions of dollars
Compensation (income) expense related to ESOP . . . . . . . . . . . . . . . . . . . . . . . . . . . . . . . $(.3) $.4Dividends paid on unallocated ESOP shares . . . . . . . . . . . . . . . . . . . . . . . . . . . . . . . . . . . .3 .5
• We recognized net compensation expense equal to the shares allocated multiplied by the original cost of$10.03 per share less dividends received by the ESOP on unallocated shares.
• We reflected dividends paid on all ESOP shares as a reduction to retained earnings.
Contributions to The Hershey Company 401(k) Plan are based on a portion of eligible pay up to a definedmaximum. Beginning in 2007, the defined maximum was increased for all salaried and non-union hourlyemployees and all matching contributions were made in cash. Beginning in 2008, the defined maximum wasincreased for certain union hourly employees. Some domestic employees are eligible to participate in similarplans. The 2007 matching contributions totaled $18.2 million.
14. CAPITAL STOCK AND NET INCOME PER SHARE
We had 1,055,000,000 authorized shares of capital stock as of December 31, 2007. Of this total,900,000,000 shares were designated as Common Stock, 150,000,000 shares as Class B Common Stock (“Class BStock”) and 5,000,000 shares as Preferred Stock. Each class has a par value of one dollar per share. As ofDecember 31, 2007, a combined total of 359,901,744 shares of both classes of common stock had been issued ofwhich 227,049,851 shares were outstanding. No shares of the Preferred Stock were issued or outstanding duringthe three-year period ended December 31, 2007.
Holders of the Common Stock and the Class B Stock generally vote together without regard to class onmatters submitted to stockholders, including the election of directors. The holders of Common Stock have onevote per share and the holders of Class B Stock have ten votes per share. However, the Common Stock holders,voting separately as a class, are entitled to elect one-sixth of the Board of Directors. With respect to dividendrights, the Common Stock holders are entitled to cash dividends 10% higher than those declared and paid on theClass B Stock.
Class B Stock can be converted into Common Stock on a share-for-share basis at any time. During 2007,9,751 shares of Class B Stock were converted into Common Stock. During 2006, 2,400 shares were convertedand during 2005, 23,031 shares were converted.
85

THE HERSHEY COMPANY
NOTES TO CONSOLIDATED FINANCIAL STATEMENTS—(Continued)
Changes in outstanding Common Stock for the past three years were as follows:
For the years ended December 31, 2007 2006 2005
Shares issued . . . . . . . . . . . . . . . . . . . . . . . . . . . . . . . 359,901,744 359,901,744 359,901,744
Treasury shares at beginning of year . . . . . . . . . . . . (129,638,183) (119,377,690) (113,313,827)Stock repurchases:
Repurchase programs and privately negotiatedtransactions . . . . . . . . . . . . . . . . . . . . . . . . . . (2,915,665) (10,601,482) (4,153,228)
Stock options and benefits . . . . . . . . . . . . . . . . (2,046,160) (1,096,155) (4,859,403)Stock issuances:
Stock options and benefits . . . . . . . . . . . . . . . . 1,748,115 1,437,144 2,948,768
Treasury shares at end of year . . . . . . . . . . . . . . . . . . (132,851,893) (129,638,183) (119,377,690)
Net shares outstanding at end of year . . . . . . . . . . . . 227,049,851 230,263,561 240,524,054
Basic and Diluted Earnings Per Share were computed based on the weighted-average number of shares ofthe Common Stock and the Class B Stock outstanding as follows:
For the years ended December 31, 2007 2006 2005
In thousands except per share amounts
Net income . . . . . . . . . . . . . . . . . . . . . . . . . . . . . . . . . . . . . . . . . . $214,154 $559,061 $488,547
Weighted-average shares—BasicCommon Stock . . . . . . . . . . . . . . . . . . . . . . . . . . . . . . . . . . . 168,050 174,722 183,747Class B Stock . . . . . . . . . . . . . . . . . . . . . . . . . . . . . . . . . . . . 60,813 60,817 60,821
Total weighted-average shares—Basic . . . . . . . . . . . . . . . . . . . . 228,863 235,539 244,568
Effect of dilutive securities:Employee stock options . . . . . . . . . . . . . . . . . . . . . . . . . . . . 2,058 2,784 3,336Performance and restricted stock units . . . . . . . . . . . . . . . . 528 748 388
Weighted-average shares—Diluted . . . . . . . . . . . . . . . . . . . . . . . 231,449 239,071 248,292
Earnings Per Share—BasicCommon Stock . . . . . . . . . . . . . . . . . . . . . . . . . . . . . . . . . . . $ .96 $ 2.44 $ 2.05
Class B Stock . . . . . . . . . . . . . . . . . . . . . . . . . . . . . . . . . . . . $ .87 $ 2.19 $ 1.85
Earnings Per Share—DilutedCommon Stock . . . . . . . . . . . . . . . . . . . . . . . . . . . . . . . . . . . $ .93 $ 2.34 $ 1.97
Class B Stock . . . . . . . . . . . . . . . . . . . . . . . . . . . . . . . . . . . . $ .87 $ 2.17 $ 1.84
For the year ended December 31, 2007, 6.8 million stock options were not included in the diluted earningsper share calculation because the exercise price was higher than the average market price of the Common Stockfor the year. Therefore, the effect would have been antidilutive. In 2006, 3.7 million stock options were notincluded, and in 2005, 2.0 million stock options were not included in the diluted earnings per share calculationbecause the effect would have been antidilutive.
86

THE HERSHEY COMPANY
NOTES TO CONSOLIDATED FINANCIAL STATEMENTS—(Continued)
Milton Hershey School Trust
Hershey Trust Company, as Trustee for the benefit of Milton Hershey School, as institutional fiduciary forestates and trusts unrelated to Milton Hershey School, and as direct owner of investment shares, held 13,286,691shares of our Common Stock as of December 31, 2007. As Trustee for the benefit of Milton Hershey School,Hershey Trust Company held 60,612,012 shares of the Class B Stock as of December 31, 2007, and was entitledto cast approximately 80% of the total votes of both classes of our common stock. The Milton Hershey SchoolTrust must approve the issuance of shares of Common Stock or any other action that would result in the MiltonHershey School Trust not continuing to have voting control of our Company.
Stockholder Protection Rights Agreement
In December 2000, our Board of Directors unanimously adopted a Stockholder Protection RightsAgreement and declared a dividend of one right (“Right”) for each outstanding share of Common Stock andClass B Stock payable to stockholders of record at the close of business on December 26, 2000. The Rights willat no time have voting power or receive dividends. The issuance of the Rights has no dilutive effect, does notaffect reported earnings per share and is not taxable. The Rights will not change the manner in which ourCommon Stock is traded.
The Rights become exercisable only upon:
• resolution of the Board of Directors after any person (other than the Milton Hershey School Trust) hascommenced a tender offer that would result in such person becoming the beneficial owner of 15% ormore of the Common Stock;
• our announcement that a person or group (other than the Milton Hershey School Trust) has acquired15% or more of the outstanding shares of Common Stock; or
• a person or group (other than the Milton Hershey School Trust) becoming the beneficial owner of morethan 35% of the voting power of all of the outstanding Common Stock and Class B Stock.
When exercisable, each Right entitles its registered holder to purchase from our Company, at a pre–determined exercise price, one one-thousandth of a share of Series A Participating Preferred Stock, par value$1.00 per share. The Rights are convertible by holders of Class B Stock into Series B Participating PreferredStock based on one one-thousandth of a share of Series B Participating Preferred Stock for every share of Class BStock held at that time. Each one one-thousandth of a share of Series A Participating Preferred Stock haseconomic and voting terms similar to those of one share of Common Stock. Similarly, each one one-thousandthof a share of Series B Participating Preferred Stock has economic and voting terms similar to those of one shareof Class B Stock.
Each Right will automatically become a right to buy that number of one one-thousandth of a share of SeriesA Participating Preferred Stock upon the earlier of:
• a public announcement by our Company that a person or group (other than the Milton Hershey SchoolTrust) has acquired 15% or more of the outstanding shares of Common Stock, or
• such person or group (other than the Milton Hershey School Trust) acquiring more than 35% of thevoting power of the Common Stock and Class B Stock.
The purchase price is pre-determined. The market value of the preferred stock would be twice the exerciseprice. Rights owned by the acquiring person or group are excluded. In addition, if we are acquired in a merger orother business combination, each Right will entitle a holder to purchase from the acquiring company, for thepre-determined exercise price, preferred stock of the acquiring company having an aggregate market value equalto twice the exercise price.
87
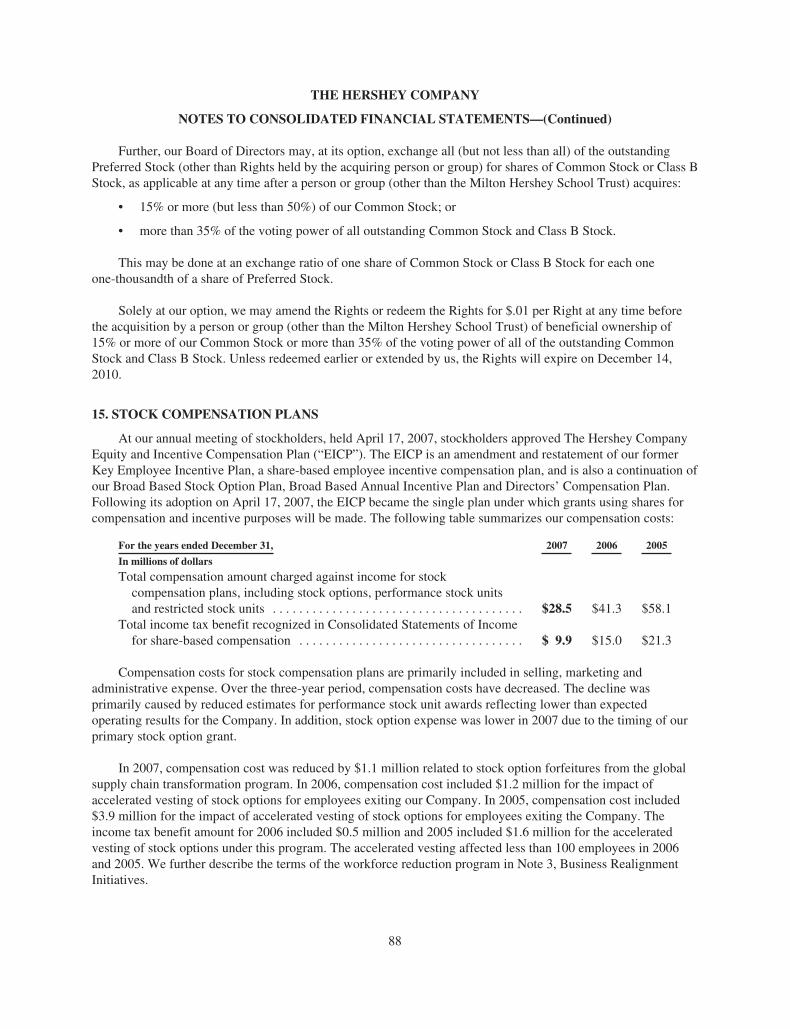
THE HERSHEY COMPANY
NOTES TO CONSOLIDATED FINANCIAL STATEMENTS—(Continued)
Further, our Board of Directors may, at its option, exchange all (but not less than all) of the outstandingPreferred Stock (other than Rights held by the acquiring person or group) for shares of Common Stock or Class BStock, as applicable at any time after a person or group (other than the Milton Hershey School Trust) acquires:
• 15% or more (but less than 50%) of our Common Stock; or
• more than 35% of the voting power of all outstanding Common Stock and Class B Stock.
This may be done at an exchange ratio of one share of Common Stock or Class B Stock for each oneone-thousandth of a share of Preferred Stock.
Solely at our option, we may amend the Rights or redeem the Rights for $.01 per Right at any time beforethe acquisition by a person or group (other than the Milton Hershey School Trust) of beneficial ownership of15% or more of our Common Stock or more than 35% of the voting power of all of the outstanding CommonStock and Class B Stock. Unless redeemed earlier or extended by us, the Rights will expire on December 14,2010.
15. STOCK COMPENSATION PLANS
At our annual meeting of stockholders, held April 17, 2007, stockholders approved The Hershey CompanyEquity and Incentive Compensation Plan (“EICP”). The EICP is an amendment and restatement of our formerKey Employee Incentive Plan, a share-based employee incentive compensation plan, and is also a continuation ofour Broad Based Stock Option Plan, Broad Based Annual Incentive Plan and Directors’ Compensation Plan.Following its adoption on April 17, 2007, the EICP became the single plan under which grants using shares forcompensation and incentive purposes will be made. The following table summarizes our compensation costs:
For the years ended December 31, 2007 2006 2005
In millions of dollars
Total compensation amount charged against income for stockcompensation plans, including stock options, performance stock unitsand restricted stock units . . . . . . . . . . . . . . . . . . . . . . . . . . . . . . . . . . . . . . $28.5 $41.3 $58.1
Total income tax benefit recognized in Consolidated Statements of Incomefor share-based compensation . . . . . . . . . . . . . . . . . . . . . . . . . . . . . . . . . . $ 9.9 $15.0 $21.3
Compensation costs for stock compensation plans are primarily included in selling, marketing andadministrative expense. Over the three-year period, compensation costs have decreased. The decline wasprimarily caused by reduced estimates for performance stock unit awards reflecting lower than expectedoperating results for the Company. In addition, stock option expense was lower in 2007 due to the timing of ourprimary stock option grant.
In 2007, compensation cost was reduced by $1.1 million related to stock option forfeitures from the globalsupply chain transformation program. In 2006, compensation cost included $1.2 million for the impact ofaccelerated vesting of stock options for employees exiting our Company. In 2005, compensation cost included$3.9 million for the impact of accelerated vesting of stock options for employees exiting the Company. Theincome tax benefit amount for 2006 included $0.5 million and 2005 included $1.6 million for the acceleratedvesting of stock options under this program. The accelerated vesting affected less than 100 employees in 2006and 2005. We further describe the terms of the workforce reduction program in Note 3, Business RealignmentInitiatives.
88
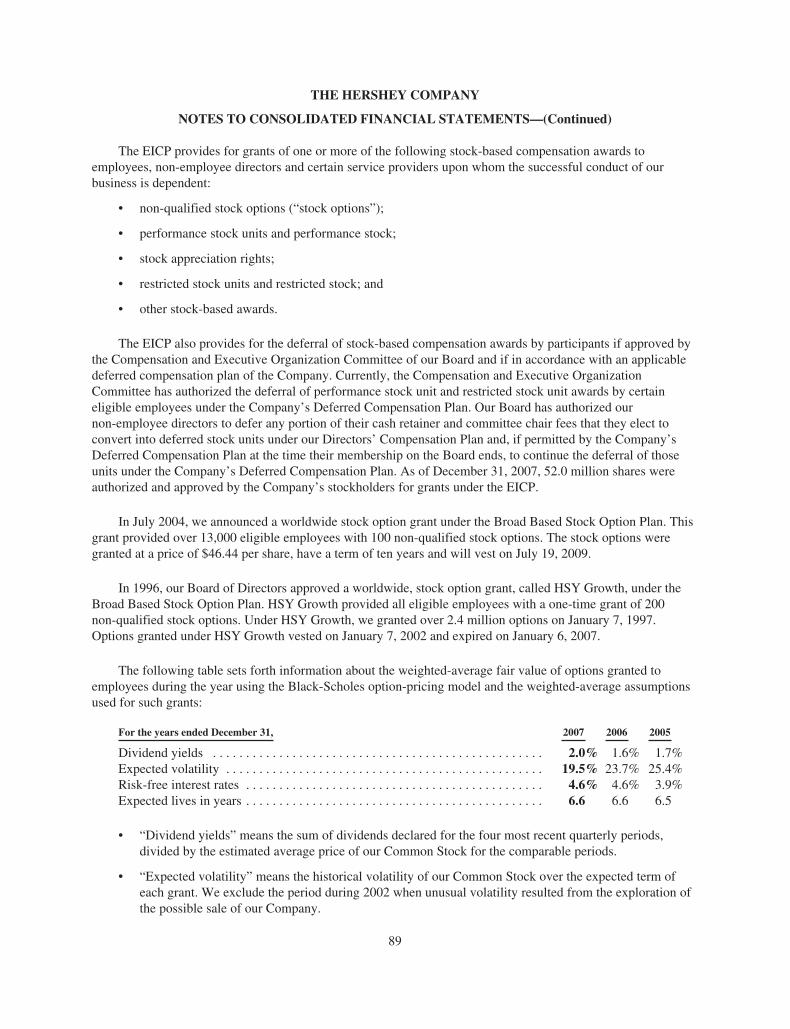
THE HERSHEY COMPANY
NOTES TO CONSOLIDATED FINANCIAL STATEMENTS—(Continued)
The EICP provides for grants of one or more of the following stock-based compensation awards toemployees, non-employee directors and certain service providers upon whom the successful conduct of ourbusiness is dependent:
• non-qualified stock options (“stock options”);
• performance stock units and performance stock;
• stock appreciation rights;
• restricted stock units and restricted stock; and
• other stock-based awards.
The EICP also provides for the deferral of stock-based compensation awards by participants if approved bythe Compensation and Executive Organization Committee of our Board and if in accordance with an applicabledeferred compensation plan of the Company. Currently, the Compensation and Executive OrganizationCommittee has authorized the deferral of performance stock unit and restricted stock unit awards by certaineligible employees under the Company’s Deferred Compensation Plan. Our Board has authorized ournon-employee directors to defer any portion of their cash retainer and committee chair fees that they elect toconvert into deferred stock units under our Directors’ Compensation Plan and, if permitted by the Company’sDeferred Compensation Plan at the time their membership on the Board ends, to continue the deferral of thoseunits under the Company’s Deferred Compensation Plan. As of December 31, 2007, 52.0 million shares wereauthorized and approved by the Company’s stockholders for grants under the EICP.
In July 2004, we announced a worldwide stock option grant under the Broad Based Stock Option Plan. Thisgrant provided over 13,000 eligible employees with 100 non-qualified stock options. The stock options weregranted at a price of $46.44 per share, have a term of ten years and will vest on July 19, 2009.
In 1996, our Board of Directors approved a worldwide, stock option grant, called HSY Growth, under theBroad Based Stock Option Plan. HSY Growth provided all eligible employees with a one-time grant of 200non-qualified stock options. Under HSY Growth, we granted over 2.4 million options on January 7, 1997.Options granted under HSY Growth vested on January 7, 2002 and expired on January 6, 2007.
The following table sets forth information about the weighted-average fair value of options granted toemployees during the year using the Black-Scholes option-pricing model and the weighted-average assumptionsused for such grants:
For the years ended December 31, 2007 2006 2005
Dividend yields . . . . . . . . . . . . . . . . . . . . . . . . . . . . . . . . . . . . . . . . . . . . . . . . . . 2.0% 1.6% 1.7%Expected volatility . . . . . . . . . . . . . . . . . . . . . . . . . . . . . . . . . . . . . . . . . . . . . . . . 19.5% 23.7% 25.4%Risk-free interest rates . . . . . . . . . . . . . . . . . . . . . . . . . . . . . . . . . . . . . . . . . . . . . 4.6% 4.6% 3.9%Expected lives in years . . . . . . . . . . . . . . . . . . . . . . . . . . . . . . . . . . . . . . . . . . . . . 6.6 6.6 6.5
• “Dividend yields” means the sum of dividends declared for the four most recent quarterly periods,divided by the estimated average price of our Common Stock for the comparable periods.
• “Expected volatility” means the historical volatility of our Common Stock over the expected term ofeach grant. We exclude the period during 2002 when unusual volatility resulted from the exploration ofthe possible sale of our Company.
89

THE HERSHEY COMPANY
NOTES TO CONSOLIDATED FINANCIAL STATEMENTS—(Continued)
• We base the risk-free interest rate for periods within the contractual life of the option on the U.S.Treasury yield curve in effect at the time of grant.
• “Expected lives” means the period of time that options granted are expected to be outstanding basedprimarily on historical data.
Stock Options
The exercise price of each option equals the market price of the Company’s Common Stock on the date ofgrant. Prior to approval by our stockholders of the EICP on April 17, 2007, the exercise price of stock optionsgranted under the former Key Employee Incentive Plan was determined as the closing price of our CommonStock on the New York Stock Exchange on the trading day immediately preceding the date the stock optionswere granted. Following approval of the EICP, the exercise price is the closing price of our Common Stock onthe New York Stock Exchange on the date of the grant. Each option has a maximum term of ten years. Optionsgranted to executives and key employees prior to December 31, 1999, vested at the end of the second year aftergrant. In 2000, we changed the terms and conditions of the grants to provide for pro-rated vesting over four yearsfor options granted subsequent to December 31, 1999.
For the years ended December 31, 2007 2006 2005
In millions of dollars
Compensation amount charged against income for stock options . . . . . . . . . $26.8 $33.4 $38.2
In 2007, compensation cost was reduced by $1.1 million related to stock option forfeitures from the globalsupply chain transformation program. The 2006 compensation amount included $1.2 million for the impact of themodification of stock option grants resulting in accelerated vesting of stock options. In 2005, this amount was$3.9 million. The modification related to employees exiting our Company in 2006 and 2005 under the terms ofthe voluntary workforce reduction program.
A summary of the status of our Company’s stock options and changes during the years ending on thosedates follows:
2007 2006 2005
Stock Options Shares
Weighted-AverageExercise
Price Shares
Weighted-AverageExercise
Price Shares
Weighted-AverageExercise
Price
Outstanding atbeginning of year . . . 13,855,113 $40.29 13,725,113 $37.83 14,909,536 $32.82
Granted . . . . . . . . . . . . . 2,240,883 $53.72 1,777,189 $52.43 2,051,255 $61.49Exercised . . . . . . . . . . . . (1,686,448) $29.97 (1,269,690) $28.68 (2,898,419) $28.14Forfeited . . . . . . . . . . . . (520,432) $52.29 (377,499) $47.19 (337,259) $43.54
Outstanding at end ofyear . . . . . . . . . . . . . . 13,889,116 $43.26 13,855,113 $40.29 13,725,113 $37.83
Options exercisable atyear-end . . . . . . . . . . 8,316,966 $37.43 8,212,209 $34.39 7,001,941 $30.86
Weighted-average fairvalue of optionsgranted during theyear (per share) . . . . . $ 12.84 $ 15.07 $ 16.90
90

THE HERSHEY COMPANY
NOTES TO CONSOLIDATED FINANCIAL STATEMENTS—(Continued)
For the years ended December 31, 2007 2006 2005
In millions of dollars
Intrinsic value of options exercised . . . . . . . . . . . . . . . . . . . . . . . . . . . . . . . . $34.3 $32.3 $91.8
The aggregate intrinsic value of options outstanding as of December 31, 2007 was $45.5 million. Theaggregate intrinsic value of exercisable options as of December 31, 2007 was $44.8 million.
As of December 31, 2007, there was $37.7 million of total unrecognized compensation cost related tonon-vested stock option compensation arrangements granted under the EICP. We expect to recognize that costover a weighted-average period of 2.5 years.
The following table summarizes information about stock options outstanding as of December 31, 2007:
Options Outstanding Options Exercisable
Range of ExercisePrices
NumberOutstanding as
of 12/31/07
Weighted-Average
RemainingContractualLife in Years
Weighted-Average
Exercise Price
NumberExercisable as of
12/31/07
Weighted-Average
Exercise Price
$22.50-34.39 . . . . . 3,561,534 3.8 $29.64 3,561,534 $29.64$34.66-52.28 . . . . . 5,100,259 5.8 $39.33 3,350,248 $36.68$52.30-64.65 . . . . . 5,227,323 8.2 $56.37 1,405,184 $58.98
$22.50-64.65 . . . . . 13,889,116 6.2 $43.26 8,316,966 $37.43
Performance Stock Units and Restricted Stock Units
Under the EICP, our Company grants performance stock units to selected executives and other keyemployees. Vesting is contingent upon the achievement of certain performance objectives. If our Company meetstargets for financial measures at the end of the applicable three-year performance cycle, we award the fullnumber of shares to the participants. The performance scores for 2007 grants of performance stock units canrange from 0% to 250% of the targeted amounts.
In 2007, 2006 and 2005, we awarded restricted stock units to certain executive officers and other keyemployees under the EICP. We also awarded restricted stock units quarterly to non-employee directors.
For the years ended December 31, 2007 2006 2005
In millions of dollars
Compensation amount charged against income for performance and restrictedstock units . . . . . . . . . . . . . . . . . . . . . . . . . . . . . . . . . . . . . . . . . . . . . . . . . . . . $1.7 $7.9 $19.9
Our Company recognizes the compensation cost associated with the performance stock units ratably overthe three-year term, except for the 2003 grants. An additional three-year vesting term was imposed for the 2003grants with accelerated vesting for retirement, disability or death. The compensation cost for the 2003 grants isbeing recognized over a period from three to six years. Compensation cost is based on the grant date fair valuefor the 2003, 2006 and 2007 grants because those grants can only be settled in shares of our Common Stock.Compensation cost for the 2005 grants is based on the year-end market value of the stock because those grantscan be settled in cash or in shares of our Common Stock. We recognize the compensation cost associated withemployee restricted stock units over a specified restriction period based on the year-end market value of thestock. Upon adoption of SFAS No. 123R in the fourth quarter of 2005, we elected to begin recognizing expense
91
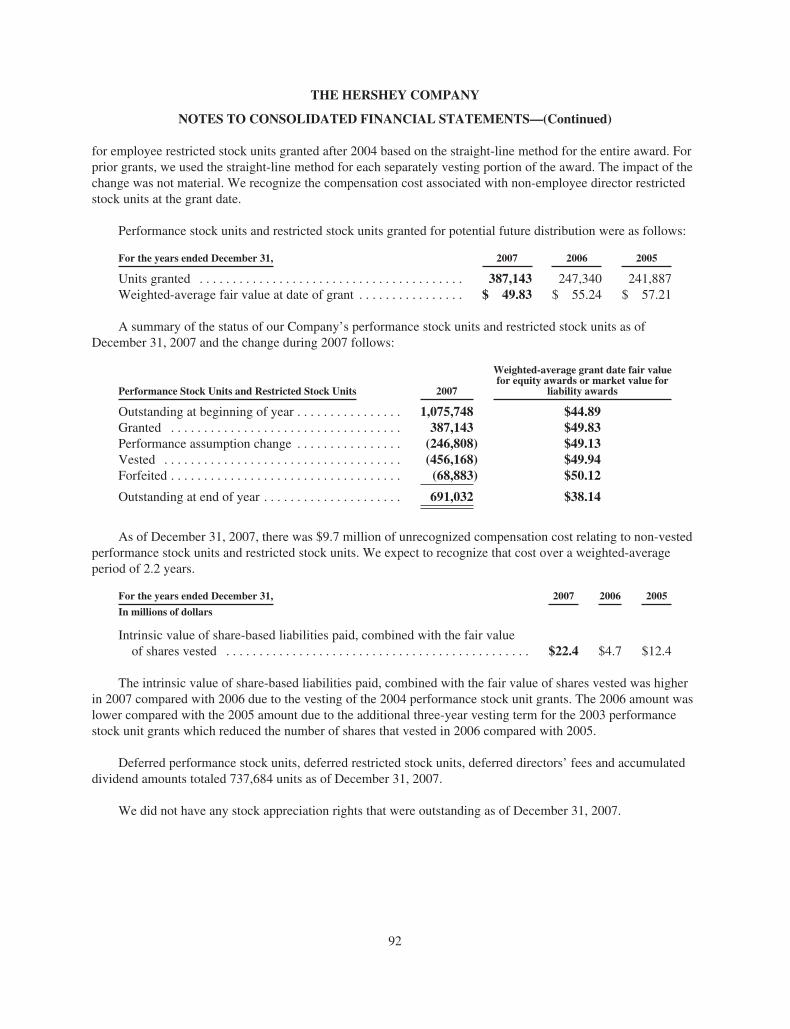
THE HERSHEY COMPANY
NOTES TO CONSOLIDATED FINANCIAL STATEMENTS—(Continued)
for employee restricted stock units granted after 2004 based on the straight-line method for the entire award. Forprior grants, we used the straight-line method for each separately vesting portion of the award. The impact of thechange was not material. We recognize the compensation cost associated with non-employee director restrictedstock units at the grant date.
Performance stock units and restricted stock units granted for potential future distribution were as follows:
For the years ended December 31, 2007 2006 2005
Units granted . . . . . . . . . . . . . . . . . . . . . . . . . . . . . . . . . . . . . . . . 387,143 247,340 241,887Weighted-average fair value at date of grant . . . . . . . . . . . . . . . . $ 49.83 $ 55.24 $ 57.21
A summary of the status of our Company’s performance stock units and restricted stock units as ofDecember 31, 2007 and the change during 2007 follows:
Performance Stock Units and Restricted Stock Units 2007
Weighted-average grant date fair valuefor equity awards or market value for
liability awards
Outstanding at beginning of year . . . . . . . . . . . . . . . . 1,075,748 $44.89Granted . . . . . . . . . . . . . . . . . . . . . . . . . . . . . . . . . . . 387,143 $49.83Performance assumption change . . . . . . . . . . . . . . . . (246,808) $49.13Vested . . . . . . . . . . . . . . . . . . . . . . . . . . . . . . . . . . . . (456,168) $49.94Forfeited . . . . . . . . . . . . . . . . . . . . . . . . . . . . . . . . . . . (68,883) $50.12
Outstanding at end of year . . . . . . . . . . . . . . . . . . . . . 691,032 $38.14
As of December 31, 2007, there was $9.7 million of unrecognized compensation cost relating to non-vestedperformance stock units and restricted stock units. We expect to recognize that cost over a weighted-averageperiod of 2.2 years.
For the years ended December 31, 2007 2006 2005
In millions of dollars
Intrinsic value of share-based liabilities paid, combined with the fair valueof shares vested . . . . . . . . . . . . . . . . . . . . . . . . . . . . . . . . . . . . . . . . . . . . . . $22.4 $4.7 $12.4
The intrinsic value of share-based liabilities paid, combined with the fair value of shares vested was higherin 2007 compared with 2006 due to the vesting of the 2004 performance stock unit grants. The 2006 amount waslower compared with the 2005 amount due to the additional three-year vesting term for the 2003 performancestock unit grants which reduced the number of shares that vested in 2006 compared with 2005.
Deferred performance stock units, deferred restricted stock units, deferred directors’ fees and accumulateddividend amounts totaled 737,684 units as of December 31, 2007.
We did not have any stock appreciation rights that were outstanding as of December 31, 2007.
92

THE HERSHEY COMPANY
NOTES TO CONSOLIDATED FINANCIAL STATEMENTS—(Continued)
16. SUPPLEMENTAL BALANCE SHEET INFORMATION
Accounts Receivable—Trade
In the normal course of business, our Company extends credit to customers that satisfy pre-defined creditcriteria. Our primary concentration of credit risk is associated with McLane Company, Inc., one of the largestwholesale distributors to convenience stores, drug stores, wholesale clubs and mass merchandisers. As ofDecember 31, 2007, McLane Company, Inc. accounted for approximately 25.9% of our total accounts receivable.No other customer accounted for more than 10% of our year-end accounts receivable. We believe that we havelittle concentration of credit risk associated with the remainder of our customer base. Accounts Receivable-Trade, as shown on the Consolidated Balance Sheets, were net of allowances and anticipated discounts of $17.8million as of December 31, 2007. Allowances and discounts were $18.7 million as of December 31, 2006.
Prepaid Expenses and Other Current Assets
As of December 31, 2007, prepaid expenses and other current assets included a receivable of approximately$17.7 million related to the recovery of damages from a product recall and temporary plant closure in Canada. Areceivable of $14.0 million was included as of December 31, 2006. The increase resulted from currencyexchange rate fluctuations and additional costs. The product recall during the fourth quarter of 2006 was causedby a contaminated ingredient purchased from an outside supplier with whom we have filed a claim for damagesand are currently in litigation.
Inventories
We value the majority of our inventories under the last-in, first-out (“LIFO”) method and the remaininginventories at the lower of first-in, first-out (“FIFO”) cost or market. Inventories include material, labor andoverhead. LIFO cost of inventories valued using the LIFO method was $369.9 million as of December 31, 2007and $400.2 million as of December 31, 2006. We stated inventories at amounts that did not exceed realizablevalues. Total inventories were as follows:
December 31, 2007 2006
In thousands of dollars
Raw materials . . . . . . . . . . . . . . . . . . . . . . . . . . . . . . . . . . . . . . . . . . . . . . . . . . $199,460 $214,335Goods in process . . . . . . . . . . . . . . . . . . . . . . . . . . . . . . . . . . . . . . . . . . . . . . . . 80,282 94,740Finished goods . . . . . . . . . . . . . . . . . . . . . . . . . . . . . . . . . . . . . . . . . . . . . . . . . . 407,058 418,250
Inventories at FIFO . . . . . . . . . . . . . . . . . . . . . . . . . . . . . . . . . . . . . . . . . . . . . . 686,800 727,325Adjustment to LIFO . . . . . . . . . . . . . . . . . . . . . . . . . . . . . . . . . . . . . . . . . . . . . (86,615) (78,505)
Total inventories . . . . . . . . . . . . . . . . . . . . . . . . . . . . . . . . . . . . . . . . . . . . . . . . $600,185 $648,820
93

THE HERSHEY COMPANY
NOTES TO CONSOLIDATED FINANCIAL STATEMENTS—(Continued)
Property, Plant and Equipment
The property, plant and equipment balance included construction in progress of $142.6 million as ofDecember 31, 2007 and $76.3 million as of December 31, 2006. Major classes of property, plant and equipmentwere as follows:
December 31, 2007 2006
In thousands of dollars
Land . . . . . . . . . . . . . . . . . . . . . . . . . . . . . . . . . . . . . . . . . . . . . . . . . . . . . $ 86,596 $ 86,734Buildings . . . . . . . . . . . . . . . . . . . . . . . . . . . . . . . . . . . . . . . . . . . . . . . . . . 788,267 746,198Machinery and equipment . . . . . . . . . . . . . . . . . . . . . . . . . . . . . . . . . . . . 2,731,580 2,764,824
Property, plant and equipment, gross . . . . . . . . . . . . . . . . . . . . . . . . . . . . 3,606,443 3,597,756Accumulated depreciation . . . . . . . . . . . . . . . . . . . . . . . . . . . . . . . . . . . . (2,066,728) (1,946,456)
Property, plant and equipment, net . . . . . . . . . . . . . . . . . . . . . . . . . . . . . . $ 1,539,715 $ 1,651,300
During 2007 we recorded accelerated depreciation of property, plant and equipment of $108.6 millionassociated with our 2007 business realignment initiatives. As of December 31, 2007, certain real estate with acarrying value or fair value less cost to sell, if lower, of $40.2 million was being held for sale. These assets wereassociated with the closure of facilities as part of the 2007 business realignment initiatives.
Goodwill and Other Intangible Assets
Goodwill and intangible assets were as follows:
December 31, 2007 2006
In thousands of dollars
Unamortized intangible assets:Goodwill balance at beginning of year . . . . . . . . . . . . . . . . . . . . . . . . . . . $501,955 $487,338Goodwill acquired during the year and other adjustments . . . . . . . . . . . . 79,932 13,661Effect of foreign currency translation . . . . . . . . . . . . . . . . . . . . . . . . . . . . 15,086 956Impairment charge . . . . . . . . . . . . . . . . . . . . . . . . . . . . . . . . . . . . . . . . . . . (12,260) —
Goodwill balance at end of year . . . . . . . . . . . . . . . . . . . . . . . . . . . . . . . . $584,713 $501,955
Trademarks . . . . . . . . . . . . . . . . . . . . . . . . . . . . . . . . . . . . . . . . . . . . . . . . $127,491 $110,676Amortized intangible assets, gross:
Customer-related . . . . . . . . . . . . . . . . . . . . . . . . . . . . . . . . . . . . . . . . . . . . 31,442 29,743Patents . . . . . . . . . . . . . . . . . . . . . . . . . . . . . . . . . . . . . . . . . . . . . . . . . . . . 8,317 8,317
Total other intangible assets, gross . . . . . . . . . . . . . . . . . . . . . . . . . . . . . . . . . . 167,250 148,736Accumulated amortization . . . . . . . . . . . . . . . . . . . . . . . . . . . . . . . . . . . . . . . . (11,388) (8,422)
Other intangibles . . . . . . . . . . . . . . . . . . . . . . . . . . . . . . . . . . . . . . . . . . . . . . . . $155,862 $140,314
The increase in goodwill was primarily associated with the acquisition of Godrej Hershey Foods andBeverages Company in May 2007 and the impact of currency translation and other adjustments. Certainadjustments were made to reflect the final fair value of assets acquired through business acquisitions. Theseincreases were offset somewhat by a reduction due to a goodwill impairment charge of $12.3 million recorded in2007. The impairment charge resulted from our annual goodwill impairment evaluation for our business inBrazil. Despite a relatively high investment level, our Brazilian business has not gained profitable scale oradequate market distribution. This resulted in reduced expectations for future cash flows and a lower estimated
94
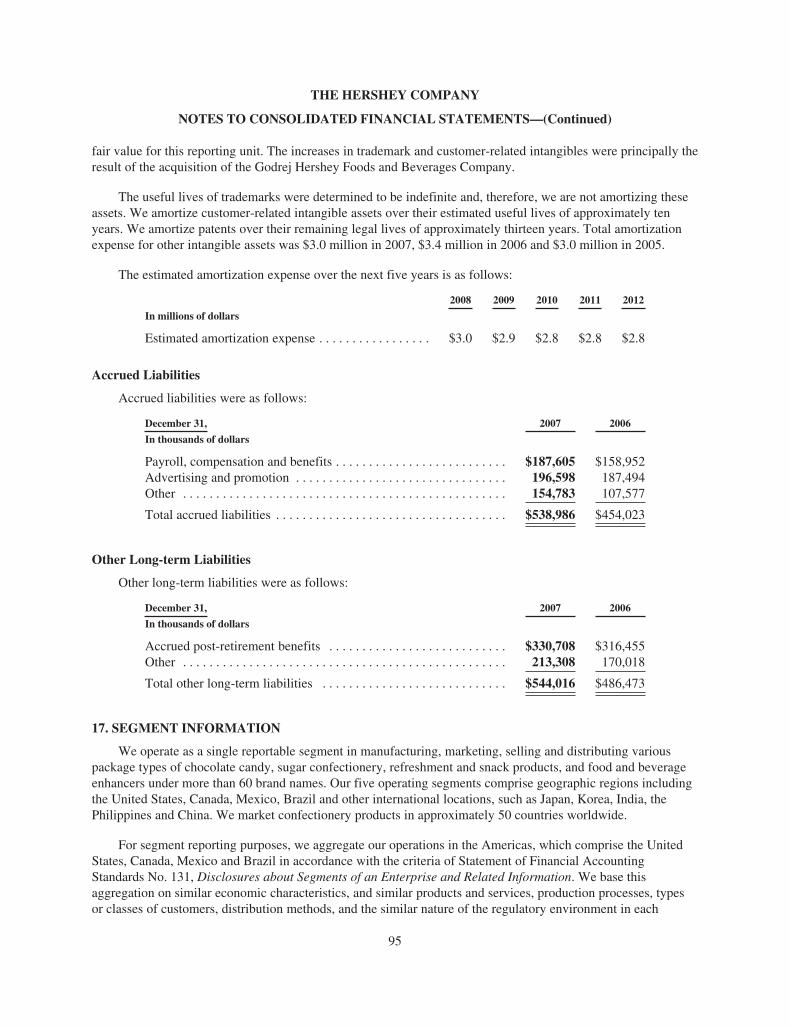
THE HERSHEY COMPANY
NOTES TO CONSOLIDATED FINANCIAL STATEMENTS—(Continued)
fair value for this reporting unit. The increases in trademark and customer-related intangibles were principally theresult of the acquisition of the Godrej Hershey Foods and Beverages Company.
The useful lives of trademarks were determined to be indefinite and, therefore, we are not amortizing theseassets. We amortize customer-related intangible assets over their estimated useful lives of approximately tenyears. We amortize patents over their remaining legal lives of approximately thirteen years. Total amortizationexpense for other intangible assets was $3.0 million in 2007, $3.4 million in 2006 and $3.0 million in 2005.
The estimated amortization expense over the next five years is as follows:
2008 2009 2010 2011 2012
In millions of dollars
Estimated amortization expense . . . . . . . . . . . . . . . . . $3.0 $2.9 $2.8 $2.8 $2.8
Accrued Liabilities
Accrued liabilities were as follows:
December 31, 2007 2006
In thousands of dollars
Payroll, compensation and benefits . . . . . . . . . . . . . . . . . . . . . . . . . . $187,605 $158,952Advertising and promotion . . . . . . . . . . . . . . . . . . . . . . . . . . . . . . . . 196,598 187,494Other . . . . . . . . . . . . . . . . . . . . . . . . . . . . . . . . . . . . . . . . . . . . . . . . . 154,783 107,577
Total accrued liabilities . . . . . . . . . . . . . . . . . . . . . . . . . . . . . . . . . . . $538,986 $454,023
Other Long-term Liabilities
Other long-term liabilities were as follows:
December 31, 2007 2006
In thousands of dollars
Accrued post-retirement benefits . . . . . . . . . . . . . . . . . . . . . . . . . . . $330,708 $316,455Other . . . . . . . . . . . . . . . . . . . . . . . . . . . . . . . . . . . . . . . . . . . . . . . . . 213,308 170,018
Total other long-term liabilities . . . . . . . . . . . . . . . . . . . . . . . . . . . . $544,016 $486,473
17. SEGMENT INFORMATION
We operate as a single reportable segment in manufacturing, marketing, selling and distributing variouspackage types of chocolate candy, sugar confectionery, refreshment and snack products, and food and beverageenhancers under more than 60 brand names. Our five operating segments comprise geographic regions includingthe United States, Canada, Mexico, Brazil and other international locations, such as Japan, Korea, India, thePhilippines and China. We market confectionery products in approximately 50 countries worldwide.
For segment reporting purposes, we aggregate our operations in the Americas, which comprise the UnitedStates, Canada, Mexico and Brazil in accordance with the criteria of Statement of Financial AccountingStandards No. 131, Disclosures about Segments of an Enterprise and Related Information. We base thisaggregation on similar economic characteristics, and similar products and services, production processes, typesor classes of customers, distribution methods, and the similar nature of the regulatory environment in each
95

THE HERSHEY COMPANY
NOTES TO CONSOLIDATED FINANCIAL STATEMENTS—(Continued)
location. We aggregate our other international operations with the Americas to form one reportable segment.When combined, our other international operations share most of the aggregation criteria and represent less than10% of consolidated revenues, operating profits and assets.
The percentage of total consolidated net sales for businesses outside of the United States was 13.8% for2007, 10.9% for 2006 and 10.9% for 2005. The percentage of total consolidated assets outside of the UnitedStates as of December 31, 2007 was 16.2%, and 13.8% as of December 31, 2006.
Sales to McLane Company, Inc., one of the largest wholesale distributors in the United States toconvenience stores, drug stores, wholesale clubs and mass merchandisers, exceeded 10% of total net sales in eachof the last three years, totaling $1.3 billion in 2007, $1.2 billion in 2006 and $1.1 billion in 2005. McLaneCompany, Inc. is the primary distributor of our products to Wal-Mart Stores, Inc.
18. SUBSEQUENT EVENT
In January 2008, we announced an increase in the wholesale prices of our domestic confectionery line,effective immediately. The price increase applied to our standard bar, king-size bar, 6-pack and vending lines andrepresented a weighted average increase of approximately thirteen percent on these items. These productsrepresent approximately one-third of our U.S. confectionery portfolio. The price changes approximated a threepercent price increase over our entire domestic product line. We implemented this action to help partially offsetincreases in input costs, including raw materials, fuel, utilities and transportation.
19. QUARTERLY DATA (Unaudited)
Summary quarterly results were as follows:
Year 2007 First Second Third Fourth
In thousands of dollars except per share amounts
Net sales . . . . . . . . . . . . . . . . . . . . . . . . . . . . . . . . . . . . . . . $1,153,109 $1,051,916 $1,399,469 $1,342,222Gross profit . . . . . . . . . . . . . . . . . . . . . . . . . . . . . . . . . . . . . 414,031 329,438 470,623 417,477Net income . . . . . . . . . . . . . . . . . . . . . . . . . . . . . . . . . . . . . 93,473 3,554 62,784 54,343
Per share—Basic—Class B Common Stock (a) . . . . . . . .37 .01 .26 .22Per share—Diluted—Class B Common Stock . . . . . . . . .37 .02 .26 .22Per share—Basic—Common Stock . . . . . . . . . . . . . . . . .42 .02 .28 .24Per share—Diluted—Common Stock (a) . . . . . . . . . . . . .40 .01 .27 .24
Year 2006 First Second Third Fourth
In thousands of dollars except per share amounts
Net sales . . . . . . . . . . . . . . . . . . . . . . . . . . . . . . . . . . . . . $1,139,507 $1,051,912 $1,416,202 $1,336,609Gross profit . . . . . . . . . . . . . . . . . . . . . . . . . . . . . . . . . . . 432,142 407,835 545,469 482,066Net income . . . . . . . . . . . . . . . . . . . . . . . . . . . . . . . . . . . 122,471 97,897 185,121 153,572
Per share—Basic—Class B Common Stock . . . . . . . . .47 .38 .73 .61Per share—Diluted—Class B Common Stock (a) . . . .47 .38 .72 .61Per share—Basic—Common Stock (a) . . . . . . . . . . . . .52 .42 .81 .68Per share—Diluted—Common Stock . . . . . . . . . . . . . .50 .41 .78 .65
(a) Quarterly income per share amounts do not total to the annual amounts due to changes in weighted-averageshares outstanding during the year.
96
Item 9. CHANGES IN AND DISAGREEMENTS WITH ACCOUNTANTS ON ACCOUNTING ANDFINANCIAL DISCLOSURE
None.
Item 9A. CONTROLS AND PROCEDURES
As required by Rule 13a-15 under the Securities Exchange Act of 1934 (the “Exchange Act”), the Companyconducted an evaluation of the effectiveness of the design and operation of the Company’s disclosure controlsand procedures as of December 31, 2007. This evaluation was carried out under the supervision and with theparticipation of the Company’s management, including the Company’s Chief Executive Officer and ChiefFinancial Officer. Based upon that evaluation, the Chief Executive Officer and Chief Financial Officer concludedthat the Company’s disclosure controls and procedures are effective. There has been no change during the mostrecent fiscal quarter in the Company’s internal control over financial reporting identified in connection with theevaluation that has materially affected, or is likely to materially affect, the Company’s internal control overfinancial reporting.
Disclosure controls and procedures are controls and other procedures that are designed to ensure thatinformation required to be disclosed in the Company’s reports filed or submitted under the Exchange Act isrecorded, processed, summarized and reported within the time periods specified in the Securities and ExchangeCommission’s rules and forms. Disclosure controls and procedures include, without limitation, controls andprocedures designed to ensure that information required to be disclosed in the Company’s reports filed under theExchange Act is accumulated and communicated to management, including the Company’s Chief ExecutiveOfficer and Chief Financial Officer, as appropriate, to allow timely decisions regarding required disclosure.
The Company’s Common Stock is listed on the New York Stock Exchange (“NYSE”) under the tickersymbol “HSY.” On May 8, 2007, the Company’s Chief Executive Officer, Richard H. Lenny, certified to theNYSE pursuant to Rule 303A.12(a) that, as of the date of that certification, he was not aware of any violation bythe Company of the NYSE’s Corporate Governance listing standards.
On November 13, 2007, we received a notice from NYSE Regulation, Inc. stating that the Company wasdeficient in meeting the requirements of the following sections of the New York Stock Exchange ListedCompany Manual:
303A.01—The Company does not have a majority of independent directors serving on the Board ofDirectors of the Company (the “Company Board”).
303A.04(a)—The Company does not have any independent directors serving on the Nominating Committeeof the Company Board.
303A.07(a)—The Company does not have three members serving on the Audit Committee of the CompanyBoard.
303A.07(a)—The Company does not have an audit committee with financial management expertise.
On November 16, 2007, we notified the NYSE that we had cured all of the above deficiencies. The itemslisted above had arisen as the result of the November 11, 2007 changes in the composition of our Board ofDirectors.
97

MANAGEMENT REPORT ON INTERNAL CONTROL OVER FINANCIAL REPORTING
The management of The Hershey Company is responsible for establishing and maintaining adequate internalcontrol over financial reporting, as such term is defined in Exchange Act Rule 13a-15(f). The Company’s internalcontrol system was designed to provide reasonable assurance to the Company’s management and Board ofDirectors regarding the preparation and fair presentation of published financial statements.
All internal control systems, no matter how well designed, have inherent limitations. Therefore, even thosesystems determined to be effective can provide only reasonable assurance with respect to financial statementpreparation and presentation.
The Company’s management, including the Company’s Chief Executive Officer and Chief FinancialOfficer, assessed the effectiveness of the Company’s internal control over financial reporting as of December 31,2007. In making this assessment, the Company’s management used the criteria set forth by the Committee ofSponsoring Organizations of the Treadway Commission (COSO) in Internal Control—Integrated Framework.Based on this assessment, management believes that, as of December 31, 2007, the Company’s internal controlover financial reporting was effective based on those criteria.
David J. WestChief Executive Officer
Humberto P. AlfonsoChief Financial Officer
98
REPORT OF INDEPENDENT REGISTERED PUBLIC ACCOUNTING FIRM
The Board of Directors and Stockholders
The Hershey Company:
We have audited The Hershey Company and subsidiaries (the “Company”) internal control over financialreporting as of December 31, 2007, based on criteria established in Internal Control - Integrated Frameworkissued by the Committee of Sponsoring Organizations of the Treadway Commission (COSO). The Company’smanagement is responsible for maintaining effective internal control over financial reporting and for itsassessment of the effectiveness of internal control over financial reporting, included in the accompanyingmanagement report on internal control over financial reporting. Our responsibility is to express an opinion on theCompany’s internal control over financial reporting based on our audit.
We conducted our audit in accordance with the standards of the Public Company Accounting OversightBoard (United States). Those standards require that we plan and perform the audit to obtain reasonable assuranceabout whether effective internal control over financial reporting was maintained in all material respects. Ouraudit included obtaining an understanding of internal control over financial reporting, assessing the risk that amaterial weakness exists, and testing and evaluating the design and operating effectiveness of internal controlbased on the assessed risk. Our audit also included performing such other procedures as we considered necessaryin the circumstances. We believe that our audit provides a reasonable basis for our opinion.
A company’s internal control over financial reporting is a process designed to provide reasonable assuranceregarding the reliability of financial reporting and the preparation of financial statements for external purposes inaccordance with generally accepted accounting principles. A company’s internal control over financial reportingincludes those policies and procedures that (1) pertain to the maintenance of records that, in reasonable detail,accurately and fairly reflect the transactions and dispositions of the assets of the company; (2) provide reasonableassurance that transactions are recorded as necessary to permit preparation of financial statements in accordancewith generally accepted accounting principles, and that receipts and expenditures of the company are being madeonly in accordance with authorizations of management and directors of the company; and (3) provide reasonableassurance regarding prevention or timely detection of unauthorized acquisition, use, or disposition of thecompany’s assets that could have a material effect on the financial statements.
Because of its inherent limitations, internal control over financial reporting may not prevent or detectmisstatements. Also, projections of any evaluation of effectiveness to future periods are subject to the risk thatcontrols may become inadequate because of changes in conditions, or that the degree of compliance with thepolicies or procedures may deteriorate.
In our opinion, the Company maintained, in all material respects, effective internal control over financialreporting as of December 31, 2007, based on criteria established in Internal Control - Integrated Frameworkissued by the Committee of Sponsoring Organizations of the Treadway Commission.
We also have audited, in accordance with the standards of the Public Company Accounting Oversight Board(United States), the consolidated balance sheets of The Hershey Company as of December 31, 2007 and 2006,and the related consolidated statements of income, cash flows and stockholders’ equity for each of the years inthe three-year period ended December 31, 2007, and our report dated February 18, 2008 expressed an unqualifiedopinion on those consolidated financial statements.
New York, New YorkFebruary 18, 2008
99

Item 9B. OTHER INFORMATION
None.
100

PART III
Item 10. DIRECTORS, EXECUTIVE OFFICERS AND CORPORATE GOVERNANCE
The names, ages, positions held with our Company, periods of service as a director, principal occupations,business experience and other directorships of nominees for director of our Company are set forth in the ProxyStatement in the section entitled “Proposal No. 1—Election of Directors,” following the question “Who are thenominees?,” which information is incorporated herein by reference.
Our Executive Officers as of February 12, 2008
Name Age Positions Held During the Last Five Years
David J. West . . . . . . . . . . . . 44 President and Chief Executive Officer (December 2007); President (October2007); Executive Vice President, Chief Operating Officer (and ChiefFinancial Officer until July 2007, when his successor to that position waselected) (January 2007); Senior Vice President, Chief Financial Officer(January 2005); Senior Vice President, Chief Customer Officer (June 2004);Senior Vice President, Sales (December 2002)
Humberto P. Alfonso (1) . . . . 50 Senior Vice President, Chief Financial Officer (July 2007); Vice President,Finance and Planning, North American Commercial Group (October 2006);Vice President, Finance and Planning, U.S. Commercial Group (July 2006)
John P. Bilbrey (2) . . . . . . . . 51 Senior Vice President, President Hershey North America (December 2007);Senior Vice President, President International Commercial Group (November2005); Senior Vice President, President Hershey International (November2003)
Michele G. Buck (3) . . . . . . . 46 Senior Vice President, Global Chief Marketing Officer (December 2007);Senior Vice President, Chief Marketing Officer, U.S. Commercial Group(November 2005); Senior Vice President, President U.S. Snacks (April 2005)
Thaddeus Jastrzebski (4) . . . . 46 Senior Vice President, President Hershey International (December 2007);Vice President, International Finance and Planning (September 2004)
Burton H. Snyder . . . . . . . . . 60 Senior Vice President, General Counsel and Secretary (November 2003);General Counsel, Secretary, and Senior Vice President, International(December 2002)
C. Daniel Azzara . . . . . . . . . 53 Vice President, Global Research and Development (April 2007); VicePresident, Global Innovation and Quality (October 2005); Vice President,Global Research and Development (June 2004); Vice President, Research andDevelopment (January 2002)
George F. Davis . . . . . . . . . . 59 Vice President, Chief Information Officer (December 2000)David W. Tacka . . . . . . . . . . 54 Vice President, Chief Accounting Officer (February 2004); Vice President,
Corporate Controller and Chief Accounting Officer (April 2000)
There are no family relationships among any of the above-named officers of our Company.
(1) Mr. Alfonso was elected Vice President, Finance and Planning, U.S. Commercial Group effective July 17,2006. Prior to joining our Company he was Executive Vice President Finance, Chief Financial Officer,Americas Beverages, Cadbury Schweppes (March 2005); Vice President Finance, Global Supply Chain,Cadbury Schweppes (May 2003); Vice President Finance, Pfizer Inc., Adams Division (August 2000).
(2) Mr. Bilbrey was elected Senior Vice President, President Hershey International effective November 5, 2003.Prior to joining our Company he was Executive Vice President, Sales—Mission Foods (May 2003);President and Chief Executive Officer—Danone Waters of North America, Inc., a division of GroupeDanone, Paris (June 2001).
(3) Ms. Buck was elected Senior Vice President, President U.S. Snacks effective April 19, 2005. Prior tojoining our Company, Ms. Buck was Senior Vice President and General Manager, Kraft Confections(October 2001).
101
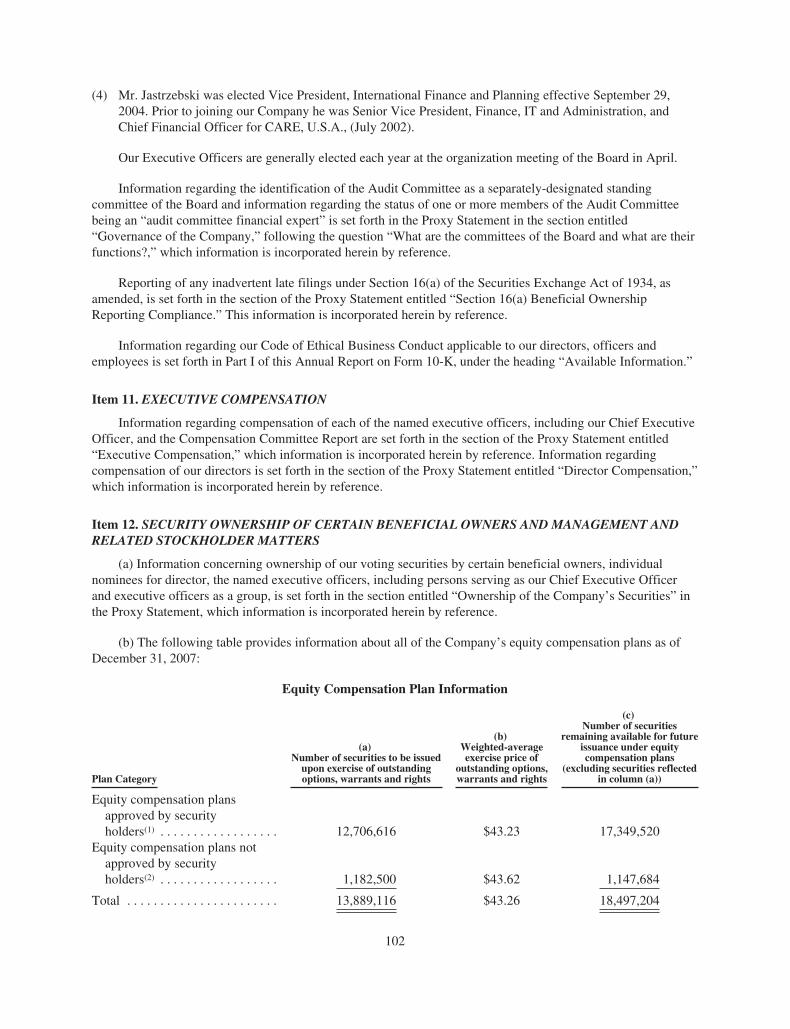
(4) Mr. Jastrzebski was elected Vice President, International Finance and Planning effective September 29,2004. Prior to joining our Company he was Senior Vice President, Finance, IT and Administration, andChief Financial Officer for CARE, U.S.A., (July 2002).
Our Executive Officers are generally elected each year at the organization meeting of the Board in April.
Information regarding the identification of the Audit Committee as a separately-designated standingcommittee of the Board and information regarding the status of one or more members of the Audit Committeebeing an “audit committee financial expert” is set forth in the Proxy Statement in the section entitled“Governance of the Company,” following the question “What are the committees of the Board and what are theirfunctions?,” which information is incorporated herein by reference.
Reporting of any inadvertent late filings under Section 16(a) of the Securities Exchange Act of 1934, asamended, is set forth in the section of the Proxy Statement entitled “Section 16(a) Beneficial OwnershipReporting Compliance.” This information is incorporated herein by reference.
Information regarding our Code of Ethical Business Conduct applicable to our directors, officers andemployees is set forth in Part I of this Annual Report on Form 10-K, under the heading “Available Information.”
Item 11. EXECUTIVE COMPENSATION
Information regarding compensation of each of the named executive officers, including our Chief ExecutiveOfficer, and the Compensation Committee Report are set forth in the section of the Proxy Statement entitled“Executive Compensation,” which information is incorporated herein by reference. Information regardingcompensation of our directors is set forth in the section of the Proxy Statement entitled “Director Compensation,”which information is incorporated herein by reference.
Item 12. SECURITY OWNERSHIP OF CERTAIN BENEFICIAL OWNERS AND MANAGEMENT ANDRELATED STOCKHOLDER MATTERS
(a) Information concerning ownership of our voting securities by certain beneficial owners, individualnominees for director, the named executive officers, including persons serving as our Chief Executive Officerand executive officers as a group, is set forth in the section entitled “Ownership of the Company’s Securities” inthe Proxy Statement, which information is incorporated herein by reference.
(b) The following table provides information about all of the Company’s equity compensation plans as ofDecember 31, 2007:
Equity Compensation Plan Information
Plan Category
(a)Number of securities to be issued
upon exercise of outstandingoptions, warrants and rights
(b)Weighted-averageexercise price of
outstanding options,warrants and rights
(c)Number of securities
remaining available for futureissuance under equitycompensation plans
(excluding securities reflectedin column (a))
Equity compensation plansapproved by securityholders(1) . . . . . . . . . . . . . . . . . . 12,706,616 $43.23 17,349,520
Equity compensation plans notapproved by securityholders(2) . . . . . . . . . . . . . . . . . . 1,182,500 $43.62 1,147,684
Total . . . . . . . . . . . . . . . . . . . . . . . 13,889,116 $43.26 18,497,204
102
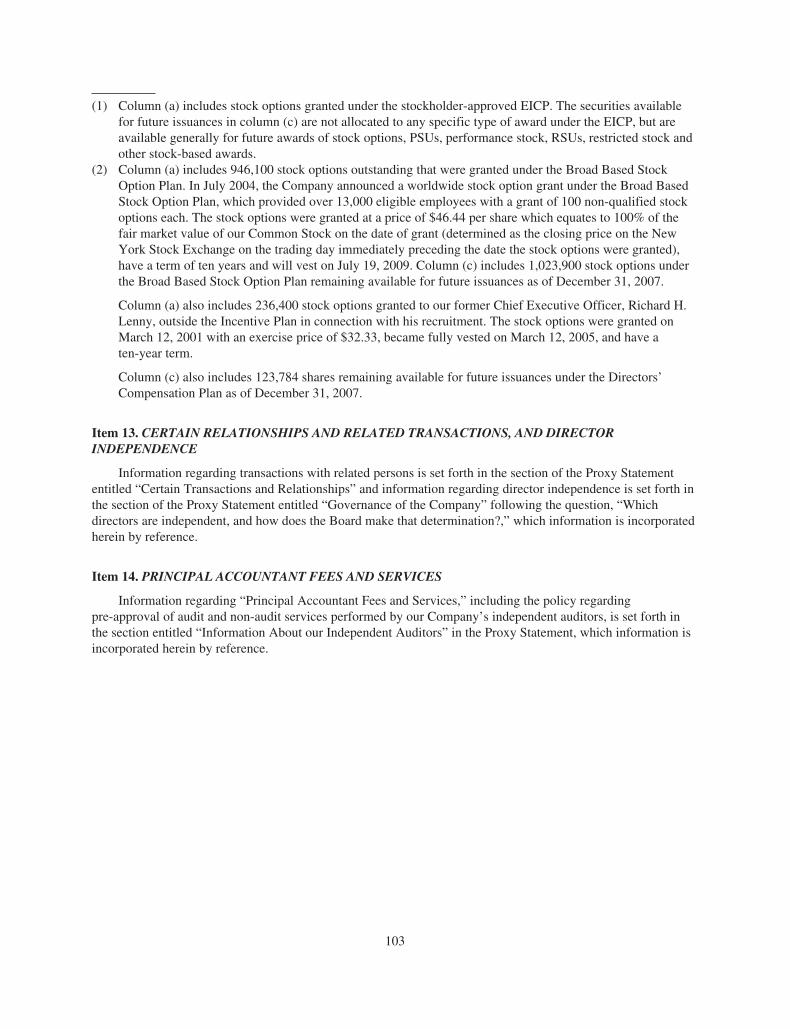
(1) Column (a) includes stock options granted under the stockholder-approved EICP. The securities availablefor future issuances in column (c) are not allocated to any specific type of award under the EICP, but areavailable generally for future awards of stock options, PSUs, performance stock, RSUs, restricted stock andother stock-based awards.
(2) Column (a) includes 946,100 stock options outstanding that were granted under the Broad Based StockOption Plan. In July 2004, the Company announced a worldwide stock option grant under the Broad BasedStock Option Plan, which provided over 13,000 eligible employees with a grant of 100 non-qualified stockoptions each. The stock options were granted at a price of $46.44 per share which equates to 100% of thefair market value of our Common Stock on the date of grant (determined as the closing price on the NewYork Stock Exchange on the trading day immediately preceding the date the stock options were granted),have a term of ten years and will vest on July 19, 2009. Column (c) includes 1,023,900 stock options underthe Broad Based Stock Option Plan remaining available for future issuances as of December 31, 2007.
Column (a) also includes 236,400 stock options granted to our former Chief Executive Officer, Richard H.Lenny, outside the Incentive Plan in connection with his recruitment. The stock options were granted onMarch 12, 2001 with an exercise price of $32.33, became fully vested on March 12, 2005, and have aten-year term.
Column (c) also includes 123,784 shares remaining available for future issuances under the Directors’Compensation Plan as of December 31, 2007.
Item 13. CERTAIN RELATIONSHIPS AND RELATED TRANSACTIONS, AND DIRECTORINDEPENDENCE
Information regarding transactions with related persons is set forth in the section of the Proxy Statemententitled “Certain Transactions and Relationships” and information regarding director independence is set forth inthe section of the Proxy Statement entitled “Governance of the Company” following the question, “Whichdirectors are independent, and how does the Board make that determination?,” which information is incorporatedherein by reference.
Item 14. PRINCIPAL ACCOUNTANT FEES AND SERVICES
Information regarding “Principal Accountant Fees and Services,” including the policy regardingpre-approval of audit and non-audit services performed by our Company’s independent auditors, is set forth inthe section entitled “Information About our Independent Auditors” in the Proxy Statement, which information isincorporated herein by reference.
103

PART IV
Item 15. EXHIBITS AND FINANCIAL STATEMENT SCHEDULES
Item 15(a)(1): Financial Statements
The audited consolidated financial statements of the Company and its subsidiaries and the Report of theIndependent Registered Public Accounting Firm thereon, as required to be filed with this report, are set forthunder Item 8 of this report.
Item 15(a)(2): Financial Statement Schedule
The following consolidated financial statement schedule of the Company and its subsidiaries for the yearsended December 31, 2007, 2006 and 2005 is filed herewith on the indicated page in response to Item 15(c):
Schedule II—Valuation and Qualifying Accounts (Page 110)
Other schedules have been omitted as not applicable or required, or because information required is shownin the consolidated financial statements or notes thereto.
Financial statements of the parent company only are omitted because the Company is primarily an operatingcompany and there are no significant restricted net assets of consolidated and unconsolidated subsidiaries.
Item 15(a)(3): Exhibits
The following items are attached or incorporated by reference in response to Item 15(c):
Articles of Incorporation and By-laws
3.1 The Company’s Restated Certificate of Incorporation, as amended, is incorporated by reference fromExhibit 3 to the Company’s Quarterly Report on Form 10-Q for the quarter ended April 3, 2005. TheBy-laws, as amended and restated as of December 4, 2007, are incorporated by reference from Exhibit3.1 to the Company’s Current Report on Form 8-K, filed December 7, 2007.
Instruments defining the rights of security holders, including indentures
4.1 Stockholder Protection Rights Agreement between the Company and Mellon Investor Services LLC, asRights Agent, dated December 14, 2000, is incorporated by reference from Exhibit 4.1 to the Company’sAnnual Report on Form 10-K for the fiscal year ended December 31, 2000.
4.2 The Company has issued certain long-term debt instruments, no one class of which creates indebtednessexceeding 10% of the total assets of the Company and its subsidiaries on a consolidated basis. Theseclasses consist of the following:
1) 5.300% Notes due 2011
2) 6.95% Notes due 2012
3) 4.850% Notes due 2015
4) 5.450% Notes due 2016
5) 8.8% Debentures due 2021
6) 7.2% Debentures due 2027
7) Other Obligations
104

The Company will furnish copies of the above debt instruments to the Commission upon request.
Material contracts
10.1 Kit Kat and Rolo License Agreement (the “License Agreement”) between the Company and RowntreeMackintosh Confectionery Limited is incorporated by reference from Exhibit 10(a) to the Company’sAnnual Report on Form 10-K for the fiscal year ended December 31, 1980. The License Agreementwas amended in 1988 and the Amendment Agreement is incorporated by reference from Exhibit 19 tothe Company’s Quarterly Report on Form 10-Q for the quarter ended July 3, 1988. The LicenseAgreement was assigned by Rowntree Mackintosh Confectionery Limited to Societe des ProduitsNestle SA as of January 1, 1990. The Assignment Agreement is incorporated by reference fromExhibit 19 to the Company’s Annual Report on Form 10-K for the fiscal year ended December 31,1990.
10.2 Peter Paul/York Domestic Trademark & Technology License Agreement between the Company andCadbury Schweppes Inc. (now Cadbury Beverages Delaware, Inc.) dated August 25, 1988, isincorporated by reference from Exhibit 2(a) to the Company’s Current Report on Form 8-K datedSeptember 8, 1988. This agreement was assigned by the Company to its wholly-owned subsidiary,Hershey Chocolate & Confectionery Corporation.
10.3 Cadbury Trademark & Technology License Agreement between the Company and Cadbury Limiteddated August 25, 1988, is incorporated by reference from Exhibit 2(a) to the Company’s Current Reporton Form 8-K dated September 8, 1988. This agreement was assigned by the Company to its wholly-owned subsidiary, Hershey Chocolate & Confectionery Corporation.
10.4 Trademark and Technology License Agreement between Huhtamaki and the Company datedDecember 30, 1996, is incorporated by reference from Exhibit 10 to the Company’s Current Report onForm 8-K dated February 26, 1997. This agreement was assigned by the Company to its wholly-ownedsubsidiary, Hershey Chocolate & Confectionery Corporation. The agreement was amended and restatedin 1999 and the Amended and Restated Trademark and Technology License Agreement is incorporatedby reference from Exhibit 10.2 to the Company’s Annual Report on Form 10-K for the fiscal year endedDecember 31, 1999.
10.5 Five Year Credit Agreement dated as of December 8, 2006 among the Company and the banks,financial institutions and other institutional lenders listed on the respective signature pages thereof(“Lenders”), Citibank, N.A., as administrative agent for the Lenders (as defined therein), Bank ofAmerica, N.A., as syndication agent, UBS Loan Finance LLC, as documentation agent, and CitigroupGlobal Markets, Inc. and Banc of America Securities LLC, as joint lead arrangers and joint bookmanagers is incorporated by reference from Exhibit 10.1 to the Company’s Current Report on Form 8-K, filed December 11, 2006.
10.6 Short-Term Credit Agreement, dated March 13, 2006, among the Company and the banks, financialinstitutions and other institutional lenders listed on the respective signature pages thereof (“Lenders”),Citibank, N.A., as administrative agent for the Lenders, Bank of America, N.A., as syndication agent,UBS Loan Finance LLC, as documentation agent, and Citigroup Global Markets Inc. and Banc ofAmerica Securities LLC, as joint lead arrangers and joint book managers, is incorporated by referencefrom Exhibit 10.1 to the Company’s Current Report on Form 8-K, filed March 15, 2006.
10.7 Letter Amendment to Short Term Credit Agreement, dated September 14, 2006, among the Companyand the banks, financial institutions and other institutional lenders listed on the respective signaturepages thereof (“Lenders”), and Citibank, N.A., as agent for the Lenders, is incorporated by referencefrom Exhibit 10.1 to the Company’s Current Report on Form 8-K, filed September 15, 2006.
10.8 Agreement dated July 26, 2006, between the Company and Hershey Trust Company, as Trustee for thebenefit of Milton Hershey School, is incorporated by reference from Exhibit 10.1 to the Company’sCurrent Report on Form 8-K filed July 28, 2006.
105
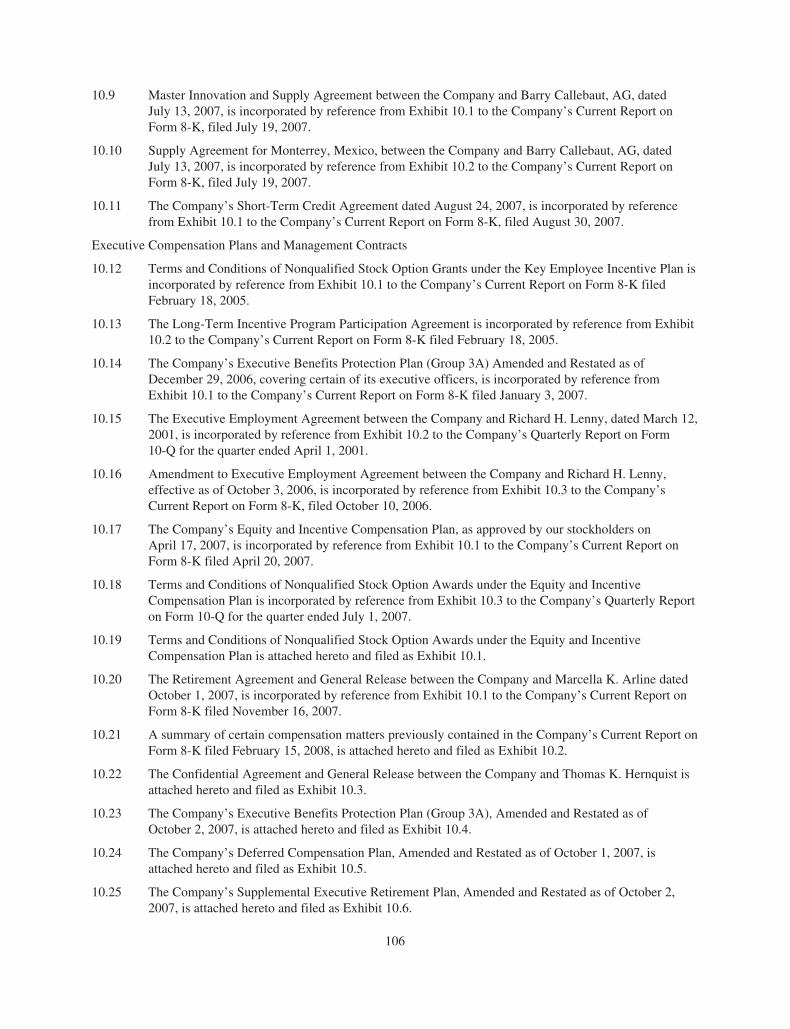
10.9 Master Innovation and Supply Agreement between the Company and Barry Callebaut, AG, datedJuly 13, 2007, is incorporated by reference from Exhibit 10.1 to the Company’s Current Report onForm 8-K, filed July 19, 2007.
10.10 Supply Agreement for Monterrey, Mexico, between the Company and Barry Callebaut, AG, datedJuly 13, 2007, is incorporated by reference from Exhibit 10.2 to the Company’s Current Report onForm 8-K, filed July 19, 2007.
10.11 The Company’s Short-Term Credit Agreement dated August 24, 2007, is incorporated by referencefrom Exhibit 10.1 to the Company’s Current Report on Form 8-K, filed August 30, 2007.
Executive Compensation Plans and Management Contracts
10.12 Terms and Conditions of Nonqualified Stock Option Grants under the Key Employee Incentive Plan isincorporated by reference from Exhibit 10.1 to the Company’s Current Report on Form 8-K filedFebruary 18, 2005.
10.13 The Long-Term Incentive Program Participation Agreement is incorporated by reference from Exhibit10.2 to the Company’s Current Report on Form 8-K filed February 18, 2005.
10.14 The Company’s Executive Benefits Protection Plan (Group 3A) Amended and Restated as ofDecember 29, 2006, covering certain of its executive officers, is incorporated by reference fromExhibit 10.1 to the Company’s Current Report on Form 8-K filed January 3, 2007.
10.15 The Executive Employment Agreement between the Company and Richard H. Lenny, dated March 12,2001, is incorporated by reference from Exhibit 10.2 to the Company’s Quarterly Report on Form10-Q for the quarter ended April 1, 2001.
10.16 Amendment to Executive Employment Agreement between the Company and Richard H. Lenny,effective as of October 3, 2006, is incorporated by reference from Exhibit 10.3 to the Company’sCurrent Report on Form 8-K, filed October 10, 2006.
10.17 The Company’s Equity and Incentive Compensation Plan, as approved by our stockholders onApril 17, 2007, is incorporated by reference from Exhibit 10.1 to the Company’s Current Report onForm 8-K filed April 20, 2007.
10.18 Terms and Conditions of Nonqualified Stock Option Awards under the Equity and IncentiveCompensation Plan is incorporated by reference from Exhibit 10.3 to the Company’s Quarterly Reporton Form 10-Q for the quarter ended July 1, 2007.
10.19 Terms and Conditions of Nonqualified Stock Option Awards under the Equity and IncentiveCompensation Plan is attached hereto and filed as Exhibit 10.1.
10.20 The Retirement Agreement and General Release between the Company and Marcella K. Arline datedOctober 1, 2007, is incorporated by reference from Exhibit 10.1 to the Company’s Current Report onForm 8-K filed November 16, 2007.
10.21 A summary of certain compensation matters previously contained in the Company’s Current Report onForm 8-K filed February 15, 2008, is attached hereto and filed as Exhibit 10.2.
10.22 The Confidential Agreement and General Release between the Company and Thomas K. Hernquist isattached hereto and filed as Exhibit 10.3.
10.23 The Company’s Executive Benefits Protection Plan (Group 3A), Amended and Restated as ofOctober 2, 2007, is attached hereto and filed as Exhibit 10.4.
10.24 The Company’s Deferred Compensation Plan, Amended and Restated as of October 1, 2007, isattached hereto and filed as Exhibit 10.5.
10.25 The Company’s Supplemental Executive Retirement Plan, Amended and Restated as of October 2,2007, is attached hereto and filed as Exhibit 10.6.
106
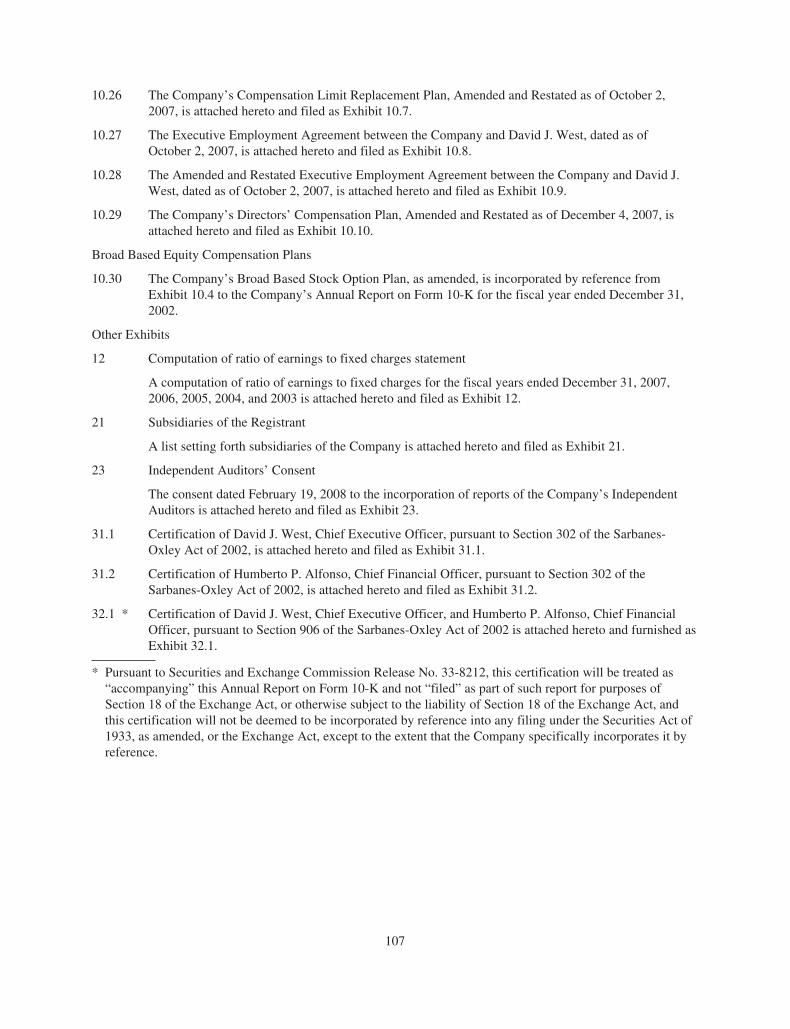
10.26 The Company’s Compensation Limit Replacement Plan, Amended and Restated as of October 2,2007, is attached hereto and filed as Exhibit 10.7.
10.27 The Executive Employment Agreement between the Company and David J. West, dated as ofOctober 2, 2007, is attached hereto and filed as Exhibit 10.8.
10.28 The Amended and Restated Executive Employment Agreement between the Company and David J.West, dated as of October 2, 2007, is attached hereto and filed as Exhibit 10.9.
10.29 The Company’s Directors’ Compensation Plan, Amended and Restated as of December 4, 2007, isattached hereto and filed as Exhibit 10.10.
Broad Based Equity Compensation Plans
10.30 The Company’s Broad Based Stock Option Plan, as amended, is incorporated by reference fromExhibit 10.4 to the Company’s Annual Report on Form 10-K for the fiscal year ended December 31,2002.
Other Exhibits
12 Computation of ratio of earnings to fixed charges statement
A computation of ratio of earnings to fixed charges for the fiscal years ended December 31, 2007,2006, 2005, 2004, and 2003 is attached hereto and filed as Exhibit 12.
21 Subsidiaries of the Registrant
A list setting forth subsidiaries of the Company is attached hereto and filed as Exhibit 21.
23 Independent Auditors’ Consent
The consent dated February 19, 2008 to the incorporation of reports of the Company’s IndependentAuditors is attached hereto and filed as Exhibit 23.
31.1 Certification of David J. West, Chief Executive Officer, pursuant to Section 302 of the Sarbanes-Oxley Act of 2002, is attached hereto and filed as Exhibit 31.1.
31.2 Certification of Humberto P. Alfonso, Chief Financial Officer, pursuant to Section 302 of theSarbanes-Oxley Act of 2002, is attached hereto and filed as Exhibit 31.2.
32.1 * Certification of David J. West, Chief Executive Officer, and Humberto P. Alfonso, Chief FinancialOfficer, pursuant to Section 906 of the Sarbanes-Oxley Act of 2002 is attached hereto and furnished asExhibit 32.1.
* Pursuant to Securities and Exchange Commission Release No. 33-8212, this certification will be treated as“accompanying” this Annual Report on Form 10-K and not “filed” as part of such report for purposes ofSection 18 of the Exchange Act, or otherwise subject to the liability of Section 18 of the Exchange Act, andthis certification will not be deemed to be incorporated by reference into any filing under the Securities Act of1933, as amended, or the Exchange Act, except to the extent that the Company specifically incorporates it byreference.
107

SIGNATURES
Pursuant to the requirements of Section 13 or 15(d) of the Securities Exchange Act of 1934, the Companyhas duly caused this report to be signed on its behalf by the undersigned, thereunto duly authorized, this19th day of February, 2008.
THE HERSHEY COMPANY
(Registrant)
By: /S/ HUMBERTO P. ALFONSO
Humberto P. AlfonsoSenior Vice President, Chief Financial Officer
Pursuant to the requirements of the Securities Exchange Act of 1934, this report has been signed below bythe following persons on behalf of the Company and in the capacities and on the date indicated.
Signature Title Date
/S/ DAVID J. WEST
(David J. West)Chief Executive Officer and Director February 19, 2008
/S/ HUMBERTO P. ALFONSO
(Humberto P. Alfonso)Chief Financial Officer February 19, 2008
/S/ DAVID W. TACKA
(David W. Tacka)Chief Accounting Officer February 19, 2008
/S/ ROBERT F. CAVANAUGH
(Robert F. Cavanaugh)Director February 19, 2008
/S/ CHARLES A. DAVIS
(Charles A. Davis)Director February 19, 2008
/S/ EDWARD J. KELLY, III(Edward J. Kelly, III)
Director February 19, 2008
/S/ ARNOLD G. LANGBO
(Arnold G. Langbo)Director February 19, 2008
/S/ JAMES E. NEVELS
(James E. Nevels)Director February 19, 2008
/S/ THOMAS J. RIDGE
(Thomas J. Ridge)Director February 19, 2008
/S/ CHARLES B. STRAUSS
(Charles B. Strauss)Director February 19, 2008
/S/ KENNETH L. WOLFE
(Kenneth L. Wolfe)Director February 19, 2008
/S/ LEROY S. ZIMMERMAN
(LeRoy S. Zimmerman)Director February 19, 2008
108

REPORT OF INDEPENDENT REGISTERED PUBLIC ACCOUNTING FIRM
The Board of Directors and StockholdersThe Hershey Company:
Under date of February 18, 2008, we reported on the consolidated balance sheets of The Hershey Companyand subsidiaries as of December 31, 2007 and 2006, and the related consolidated statements of income, cashflows and stockholders’ equity for each of the years in the three-year period ended December 31, 2007, which areincluded in The Hershey Company’s Annual Report on Form 10-K. In connection with our audits of theaforementioned consolidated financial statements, we also audited the related financial statement schedule. Thisfinancial statement schedule is the responsibility of the Company’s management. Our responsibility is to expressan opinion on this financial statement schedule based on our audit.
In our opinion, such financial statement schedule, when considered in relation to the basic consolidatedfinancial statements taken as a whole, presents fairly, in all material respects, the information set forth therein.
As discussed in Note 1 to the consolidated financial statements, the Company adopted Statement ofFinancial Accounting Standards No. 158, Employers’ Accounting for Defined Benefit Pensions and OtherPostretirement Plans, at December 31, 2006.
/s/ KPMG LLP
New York, New YorkFebruary 18, 2008
109
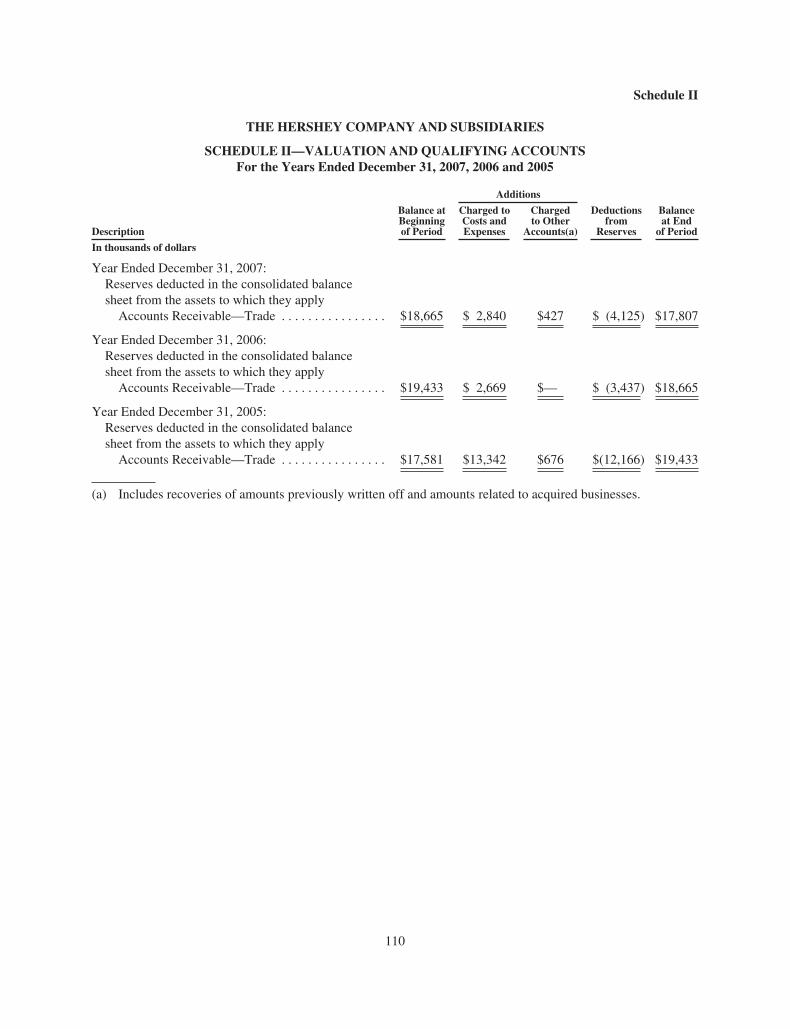
Schedule II
THE HERSHEY COMPANY AND SUBSIDIARIES
SCHEDULE II—VALUATION AND QUALIFYING ACCOUNTSFor the Years Ended December 31, 2007, 2006 and 2005
Balance atBeginningof Period
Additions
Deductionsfrom
Reserves
Balanceat End
of PeriodDescription
Charged toCosts andExpenses
Chargedto Other
Accounts(a)
In thousands of dollars
Year Ended December 31, 2007:Reserves deducted in the consolidated balancesheet from the assets to which they apply
Accounts Receivable—Trade . . . . . . . . . . . . . . . . $18,665 $ 2,840 $427 $ (4,125) $17,807
Year Ended December 31, 2006:Reserves deducted in the consolidated balancesheet from the assets to which they apply
Accounts Receivable—Trade . . . . . . . . . . . . . . . . $19,433 $ 2,669 $— $ (3,437) $18,665
Year Ended December 31, 2005:Reserves deducted in the consolidated balancesheet from the assets to which they apply
Accounts Receivable—Trade . . . . . . . . . . . . . . . . $17,581 $13,342 $676 $(12,166) $19,433
(a) Includes recoveries of amounts previously written off and amounts related to acquired businesses.
110

CERTIFICATION
I, David J. West, certify that:
1. I have reviewed this Annual Report on Form 10-K of The Hershey Company;
2. Based on my knowledge, this report does not contain any untrue statement of a material fact or omit tostate a material fact necessary to make the statements made, in light of the circumstances under whichsuch statements were made, not misleading with respect to the period covered by this report;
3. Based on my knowledge, the financial statements, and other financial information included in thisreport, fairly present in all material respects the financial condition, results of operations and cashflows of the registrant as of, and for, the periods presented in this report;
4. The registrant’s other certifying officer(s) and I are responsible for establishing and maintainingdisclosure controls and procedures (as defined in Exchange Act Rules 13a-15(e) and 15d-15(e)) andinternal control over financial reporting (as defined in Exchange Act Rules 13a-15(f) and 15d-15(f)) forthe registrant and have:
(a) Designed such disclosure controls and procedures, or caused such disclosure controls andprocedures to be designed under our supervision, to ensure that material information relating tothe registrant, including its consolidated subsidiaries, is made known to us by others within thoseentities, particularly during the period in which this report is being prepared;
(b) Designed such internal control over financial reporting, or caused such internal control overfinancial reporting to be designed under our supervision, to provide reasonable assuranceregarding the reliability of financial reporting and the preparation of financial statements forexternal purposes in accordance with generally accepted accounting principles;
(c) Evaluated the effectiveness of the registrant’s disclosure controls and procedures and presented inthis report our conclusions about the effectiveness of the disclosure controls and procedures, as ofthe end of the period covered by this report based on such evaluation; and
(d) Disclosed in this report any change in the registrant’s internal control over financial reporting thatoccurred during the registrant’s most recent fiscal quarter (the registrant’s fourth fiscal quarter inthe case of an annual report) that has materially affected, or is reasonably likely to materiallyaffect, the registrant’s internal control over financial reporting; and
5. The registrant’s other certifying officer(s) and I have disclosed, based on our most recent evaluation ofinternal control over financial reporting, to the registrant’s auditors and the audit committee of theregistrant’s board of directors (or persons performing the equivalent functions):
(a) All significant deficiencies and material weaknesses in the design or operation of internal controlover financial reporting which are reasonably likely to adversely affect the registrant’s ability torecord, process, summarize and report financial information; and
(b) Any fraud, whether or not material, that involves management or other employees who have asignificant role in the registrant’s internal control over financial reporting.
David J. WestChief Executive Officer
February 19, 2008
111

CERTIFICATION
I, Humberto P. Alfonso, certify that:
1. I have reviewed this Annual Report on Form 10-K of The Hershey Company;
2. Based on my knowledge, this report does not contain any untrue statement of a material fact or omit tostate a material fact necessary to make the statements made, in light of the circumstances under whichsuch statements were made, not misleading with respect to the period covered by this report;
3. Based on my knowledge, the financial statements, and other financial information included in thisreport, fairly present in all material respects the financial condition, results of operations and cashflows of the registrant as of, and for, the periods presented in this report;
4. The registrant’s other certifying officer(s) and I are responsible for establishing and maintainingdisclosure controls and procedures (as defined in Exchange Act Rules 13a-15(e) and 15d-15(e)) andinternal control over financial reporting (as defined in Exchange Act Rules 13a-15(f) and 15d-15(f)) forthe registrant and have:
(a) Designed such disclosure controls and procedures, or caused such disclosure controls andprocedures to be designed under our supervision, to ensure that material information relating tothe registrant, including its consolidated subsidiaries, is made known to us by others within thoseentities, particularly during the period in which this report is being prepared;
(b) Designed such internal control over financial reporting, or caused such internal control overfinancial reporting to be designed under our supervision, to provide reasonable assuranceregarding the reliability of financial reporting and the preparation of financial statements forexternal purposes in accordance with generally accepted accounting principles;
(c) Evaluated the effectiveness of the registrant’s disclosure controls and procedures and presented inthis report our conclusions about the effectiveness of the disclosure controls and procedures, as ofthe end of the period covered by this report based on such evaluation; and
(d) Disclosed in this report any change in the registrant’s internal control over financial reporting thatoccurred during the registrant’s most recent fiscal quarter (the registrant’s fourth fiscal quarter inthe case of an annual report) that has materially affected, or is reasonably likely to materiallyaffect, the registrant’s internal control over financial reporting; and
5. The registrant’s other certifying officer(s) and I have disclosed, based on our most recent evaluation ofinternal control over financial reporting, to the registrant’s auditors and the audit committee of theregistrant’s board of directors (or persons performing the equivalent functions):
(a) All significant deficiencies and material weaknesses in the design or operation of internal controlover financial reporting which are reasonably likely to adversely affect the registrant’s ability torecord, process, summarize and report financial information; and
(b) Any fraud, whether or not material, that involves management or other employees who have asignificant role in the registrant’s internal control over financial reporting.
Humberto P. AlfonsoChief Financial Officer
February 19, 2008
112