foreword - eureka · foreword by any measure, this ... as underscored by deloitte’s 2015 tech...
TRANSCRIPT

1

32
FOREWORD
By any measure, this is a time of unprecedented scientific opportunity, with major research in a
number of areas now being driven by advances made on the technology front.
As underscored by Deloitte’s 2015 Tech Trends report, such changes are being driven by a confluence
of business and technological forces fueled by innovation. Five macro forces continue to drive
enormous transformation: digital, analytics, the cloud, the renaissance of core systems, and the
changing role of IT within the enterprise. These forces are not just fueling innovation and giving
rise to new business models. They are also enabling historic advances in materials, medical, and
manufacturing science, among many other areas.
At the same time, Europe’s economy is facing an ever-growing innovation gap with its global
competitors, as the U.S., Japan and South Korea ramp up the digitalisation of their economies, with
increasing productivity innovation expected to follow. If Europe does not keep up, we risk missing
out on a major boost to competitiveness.
The Internet economy is now truly global and diverse, creating opportunities for people at all levels
of society. The Web giants — the “GAFA,” (Google, Apple, Facebook and Amazon) — presently
monopolise the value of data, including data collected from 500 million Europeans. Despite the
combined efforts of our innovators, policymakers and business community, there is no European
GAFA to turn to. At the same time, we should not ignore however, that there are a number of software
and hardware pioneers, innovators and fast-growing tech startups in exciting spaces all across
Europe.
At every stage in its 30 year journey, EUREKA has been ready to adapt to changing conditions in an
increasingly fast-paced global market. The organisation is oriented to the future, identifying key
trends and indicators that may point towards new areas of interest and highlight new priorities.
The future will bring a rapid and forceful move towards the knowledge economy with increasing
emphasis on digital technology and services. These technologies have the potential to transform
and improve the functioning of our society, economy and everyday life in fundamental ways.
The rising worldwide interest in innovation policy represents the search to answer some important
questions: What are the most appropriate and effective ways for governments to help realise this
potential? What role should governments play in supporting and creating industries and jobs in
today’s high-technology, global economy?
Governments are increasingly wading into the innovation game. It is time to realise that while the
price of innovation is steep, so too are the costs of not innovating. As we have seen throughout
EUREKA’s history, Europe has not always capitalised as fully as possible upon evolving technological
trends. Must EUREKA itself change in order to help the EU meet its ambitious goals? And if so, how
can it best face the challenge?
This report brings to light EUREKA’s contribution to the evolution of technological trends in Europe
and its recognition of the network’s major achievements and global successes will make it a
reference point for ministers and public authorities responsible for innovation budgets.
No single report however can do justice to EUREKA’s impact on the European R&D&I scene. This
influence is evident in the diversity of projects currently being supported as well as those that have
been completed and are benefitting users all over the world. It is an appropriate tool for a globalised
and tech-driven world, given the flexibility of its international cooperation and its openness to new
and shifting partnerships.
I would like to conclude with a quote from Bertel Haarder, one of the first ministers involved in the
creation of EUREKA, ‘the only alternative to EUREKA is a better EUREKA’.
EUREKA must not become the territory of a few hi-tech specialists. Europe’s future, above all, is for its citizens. We must ensure that the concrete benefits of new technologies – and their impact on living and working conditions – are thoroughly explained, and always in the public eye. CHANCELLOR HELMUT KOHL Hannover Conference November 1985
“
”
PEDRO DE SAMPAIO NUNESHead of EUREKA Secretariat

54
EXECUTIVE SUMMARY
Since 1985 EUREKA has contributed to advancements in a wide array of different technological areas through R&D&I (Research & Development & Innovation) activities that led to the design, development and distribution of new and innovative products, services and processes in Europe and beyond. Whereas, in the past, EUREKA reports and academic studies have largely focused on impact on participating organisations in terms of turnover, employment, as well as organizational and behavioural criteria, this report presents an assessment of the technological and innovation impact of EUREKA projects.
The report is structured as follows: Key findings are described below, followed by evidence of
EUREKA’s technological importance presented in a series of “Global Success Stories”: case
studies based on surveys and interviews. Recent projects with a high potential for success are also
presented. This is followed by quantitative results based on a patent citation analysis and novel
innovation indicators using data collected from EUREKA Final Reports and Market Impact Reports. A
discussion of EUREKA’s contribution to wider technological development and its innovation impact
is then presented under four main technological areas, representing four key overarching sectors
in the modern economy – ICT, Life Sciences & Medicine, Energy & Environment and Industrial
Technologies. Finally a detailed methodological note and glossary clarify the analytical tools and
terms used in the report.
The results presented need to be accompanied by a few caveats. In particular, the patent citation
analysis (key finding 3) requires further investigation and corroboration, with further work required
on matching participating and non-participating companies and estimating EUREKA additionality
. Furthermore, the innovation indicators results (key finding 4) are characterised by the usual self-
selection bias of self-reported data. Further details are presented in section 3.
KEY FINDINGS
This report identifies key innovations deriving from projects and initiatives funded by EUREKA which have shaped the evolution of various technologies, contributing significantly to European competitiveness and innovation capacity, and having a profound impact on the way we live
The I-StARS project helped Valeo to achieve global leadership in Stop-Start systems, and claim a market share of 90% in 2015
The PROMETEHUS project lies behind a number of important technologies currently applied by automotive manufacturers today – including including the ACC system, the navigation system and digital map design
Thanks to the Celtic-Plus Cluster’s project 100GET, the telecommunications company Alcatel-Lucent achieved global leadership in January 2012 in 100 Gb/s optical transmission systems and reach a market share of 70%
The ITEA Cluster’s DIGITAL CINEMA project helped Barco to achieve a global market share of 60% in its associated technologies
EUREKA helped AlienVault achieve a leading position in the global Security Information and Event Management market via the AlienVault ESC project - with the company now seeing more than 65% year-on-year sales growth
The DAB project achieved the most significant advance in radio technology since the introduction of FM stereo and contributed to Fraunhofer’s lucrative MP3 patent portfolio, worth tens of millions of euros each year
1
Thanks to EUREKA, the next few years may see important breakthroughs in areas such as life sciences, information technology and security, resulting from projects such as:
The Eurostars projects BLISK, NewBone, ReBAT, ISTAR and FIIA
The EUREKA Network Project FELLOWSHIP
2

76
0,1
0,2
0,3
0,4
0,5
0,6
0
Further Innovation indicators were developed, based on EUREKA data drawn from Market Impact Reports. The results showed that:
EUREKA projects exhibited a high level of technological innovation, with projects in Industrial Technologies showing the highest proportion of product and/or process innovation (70.0% of respondents)
Product innovations are more common than process innovations, especially for ICT projects
High success rate: In each technological area, close to two-thirds of projects were defined as successful by project participants
4The innovation impact of EUREKA’s project outcomes has also been analysed using patent citation analysis. Initial results show that EUREKA project participation is associated with higher technological impact, measured by patent citations, when compared to European patents not associated with EUREKA participation.1 (See chart below)
This conclusion holds for all four technology areas investigated and for three different measures of impact – average citations within the same year, 1-2 years and 5 years after the patent application.
EUREKA innovation impact in Life Sciences & Medicine, ICT and Industrial Technologies have been high, using all three temporal indicators, when compared to other patents with no relation to EUREKA projects.
An analysis of knowledge spillovers between technological areas found the most significant spillovers from the Life Sciences sector to Industrial Technologies. These spillovers generally showed a higher overall impact from EUREKA-related patents than from non-EUREKA related patents.
3
1 See section 1.3 for more details
IM (Immediacy Index) measures the average number of citations received within the year of patent application.IF (Impact Factor) measures the average number of citations received 1 (EUREKA) or 2 years (non-EUREKA) after a patent application.IF5 (Impact Factor 5) measures the average number of citations received 5 years after a patent application.
NON EUREKA
NON EUREKA
NON EUREKA
NON EUREKA{ { { {
Aver
age n
umbe
r of
cita
tion
s
Life sciences & medicine IcT Industrial technologies ENERGY & Environment
IM
IFIF5
IM
IF
IF5
IM
IF
IF5
IM
IFIF5
IM
IF IF5
IM
IFIF5
IM
IFIF5
IM
IFIF5

98
FOREWORD 2EXECUTIVE SUMMARY 4
EUREKA’S INNOVATION IMPACT 101.1 GLOBAL SUCCESS STORIES1.2 HIGH POTENTIAL PROJECTS 1.3 PATENT CITATION ANALYSIS 1.4 INNOVATION INDICATORS
TECHNOLOGICAL AREAS 352.1 INFORMATION AND COMMUNICATIONS TECHNOLOGY (ICT)2.2 LIFE SCIENCES AND MEDICINE2.3 INDUSTRIAL TECHNOLOGIES2.4 ENERGY AND ENVIRONMENT
METHODOLOGICAL NOTE 70
GLOSSARY 76
TABLE OF CONTENT
2
3
1
4

1110
EUREKA’S INNOVATION IMPACT
With its bottom-up approach, EUREKA supports the development of innovative and rapidly marketable products, processes and services that help improve the daily life of everyday people. Their commercialisation has added billions of euros to national economies.
This section of the report identifies key innovations deriving from projects and initiatives funded
by EUREKA which have shaped the evolution of various technologies, contributed significantly to
European competitiveness and innovation capacity, and had a profound impact on the way we live.
The self-contained case studies which follow provide clear evidence of EUREKA’s achievements in
promoting R&D&I investment and global technological development in Europe and worldwide.
The analysis includes projects which have been completed throughout EUREKA’s 30-year history.
Global success cannot be demonstrated yet for the more recent projects; nevertheless, some of the
best prospects for global success have also been identified.
The ‘global’ success stories were selected according to worldwide economic and technological
impact. Information such as market size, position and share was taken into account. However, it is
important to note that the success stories presented here have been selected not only because of
their significant global impact, but also because information could be collected to verify impact in
the time-frame dedicated to this study. Other projects, which may have been equally successful,
but where impact has not yet been similarly assessed, shall be investigated in subsequent studies.
1
1.1 GLOBAL SUCCESS STORIES

1312
I-STARS
The “i-StARS” project started in 2006 and ran for 48 months. The partners invested in research and development to develop a new technology which would extend the “Stop-Start” functionality for high-volume cars at low cost.
Project impact
The Stop-Start system automatically switches the engine off when the vehicle is at a standstill and restarts the engine immediately, as soon as the driver lifts his foot off the brake or disengages the clutch, leading to a significant reduction in CO2 emissions2 (up to 4%).
The automotive supplier Valeo has achieved a #1 global position in “Stop-Start” systems, with a market share of 90% in 2015. Today, the system is implemented at Peugeot-Citroën, Mercedes, Smart, Nissan and Suzuki; in Europe, Japan and India. Additional volumes will equip new models as of 2017 in Europe, North America and Japan. Additionally, i-StARS operates on full hybrid vehicles as a starter generator in combination with an electric traction motor at BMW, Subaru and Audi.
The production of i-StARS with integrated electronics started in 2010, and it will be marketed until at least
2024.
Thanks to EUREKA, we can save fuel and reduce CO
2 emissions
“
”
Year 2006-2010
Countries France, Belgium, Germany
Main beneficiary Valeo
Market share position #1 (2015)
Technological area automotive
Market size 90% of the market (2015)
Cost €9.85 million
Company impact
Thei-StARS project helped Valeo become a leader in belt-driven systems, in 12 and in 48V for stop-start and mild hybrid cars.
Societal and economic impact
The ramp-up of i-StARS and alternators in the Etaples plant (Pas de Calais, France), have safeguarded and even increased employment in the area.
This solution provides all car drivers with a fuel savings or CO2 reduction of up to 4% in the NEDC (New European Driving Cycle) cycle, with consequent reduction of air pollution.
Technological impact
i-StARS helped to make the “Stop-Start” system a standard for car manufacturers. This technological breakthrough was also essential for the launch of the High Efficiency Generator, which uses the same technology.
The i-StARS system is becoming a standard for belt-driven stop-start systems, and other automotive equipment manufacturers are starting to sell systems based on the technology.
2 www.valeo.com/en/our-activities/powertrain-systems/technologies/systems-stop-start-48.html

1514
PROMETHEUS
The “Prometheus” project started in 1987 and ran for more than 11 years. More than 200 partners and public authorities invested €749 million in research and development to create concepts and solutions for a cleaner, safer and more efficient road traffic system.
Project impact
A significant proportion of the technology currently applied by automotive manufacturers can trace its origins to Prometheus. Every car currently on the
market owes something to this project.
Technological impact
PROMETHEUS is to date the biggest R&D project on driverless cars ever undertaken.
Its main objective was to use IT to improve the safety and efficiency of traffic. Ultimately, the project aimed to create vehicles that could communicate with surrounding infrastructure and lead to more autonomous driving.
Thanks to EUREKA, we can drive our cars more safely
“
”
Year 1987-1995
Countries UK, Sweden, Norway, The Netherlands, Italy, France, Finland, Germany, Switzerland, Belgium, Austria
Main beneficiary Daimler AG
Technological area Automotive
Cost €749 million
PROMETHEUS was a pioneering initiative which gave birth to a new technological era. Between 1994 and 1995, the project was responsible for developing two of the earliest autonomous driving systems capable of covering large distances without human intervention.
For the duration of the project, the consortium was so productive that many of the industry’s current technological developments are derived from the outcomes of PROMETHEUS – although the project itself did not realise all of these innovations, due to technological constraints.
A number of breakthrough innovations did come well ahead of their time, including the ACC system, the navigation system and digital map design - all products of PROMETHEUS brought to market in subsequent years. The automotive industry in Europe is still getting to grips with some of the discoveries made under PROMETHEUS.
Societal and economic impact
As shown by the growth of telematics services which provide traffic information and management, PROMETHEUS technology is used by all road users, operators and service providers today.

1716
CELTIC-PLUS 100GET
The “100GET” EUREKA Celtic-Plus project started in 2007 and ran for three years. 41 Partners and public authorities invested €65 million in research and development to enable, identify and test the next generation of telecommunications products able to reach the “100 Gigabit per second” transmission speed.
Project impact
Thanks to EUREKA and the 100GET project, the telecommunications company Alcatel-Lucent achieved global leadership in January 2012 in 100 Gb/s optical transmission systems and reached a market share of 70%. Alcatel-Lucent has been improving its approach towards higher bit rates and in 2014 it was the only supplier having deployed 200 Gb/s systems with 13.5% of the global market share3. When the first product was launched, market size was €270m and growth was much higher than expected: forecasts from January 2012 were indicating a total market of €720m for 2013 and 1.3bn for 2014, while the actual figures reached €2.2bn in 20134 and €3.7bn the following year.5
Thanks to EUREKA, we can enjoy immediate access to data-heavy Internet applications such as video and cloud computing
“
”
Year 2007-2010
Countries Germany, France, Sweden, Finland, Spain
Main beneficiary Alcatel-Lucent
Market share position #1 (2012), only supplier with 200 Gb/s products (2014)
Technological area Telecommunications
Market size €3.7 billion (2014)
Cost €65 million
Societal impact
This solution allows all Internet users to experience much faster rates of data transfer (10x) when transferring large quantities of data. It does not apply to a specific application; however the most striking benefits include video streaming and massive data exchange related to cloud computing.
Technological impact
This product was a technological breakthrough. The new concept allowed breaking a barrier that prevented optical transmission equipment to exceed a capacity of 10 Gb/s, or 40 Gb/s at a limited distance. It has also served as the basis for the subsequent versions which will be able to transfer data at rates of up to 400 Gb/s, reaching 1000 Gb/s in the short-to-medium term.
Alcatel-Lucent was able to commercialise its product two years ahead of competition, obtaining an important commercial advantage.
This type of equipment represents today a large part of the investments made by telecommunications operators and this technology allows them to offer a service where the transfer of video and access to data stored in the cloud is ten times faster than was previously possible.
3 ACG Research4 Dell’Oro5 Ovum
1918
ITEA DIGITAL CINEMA
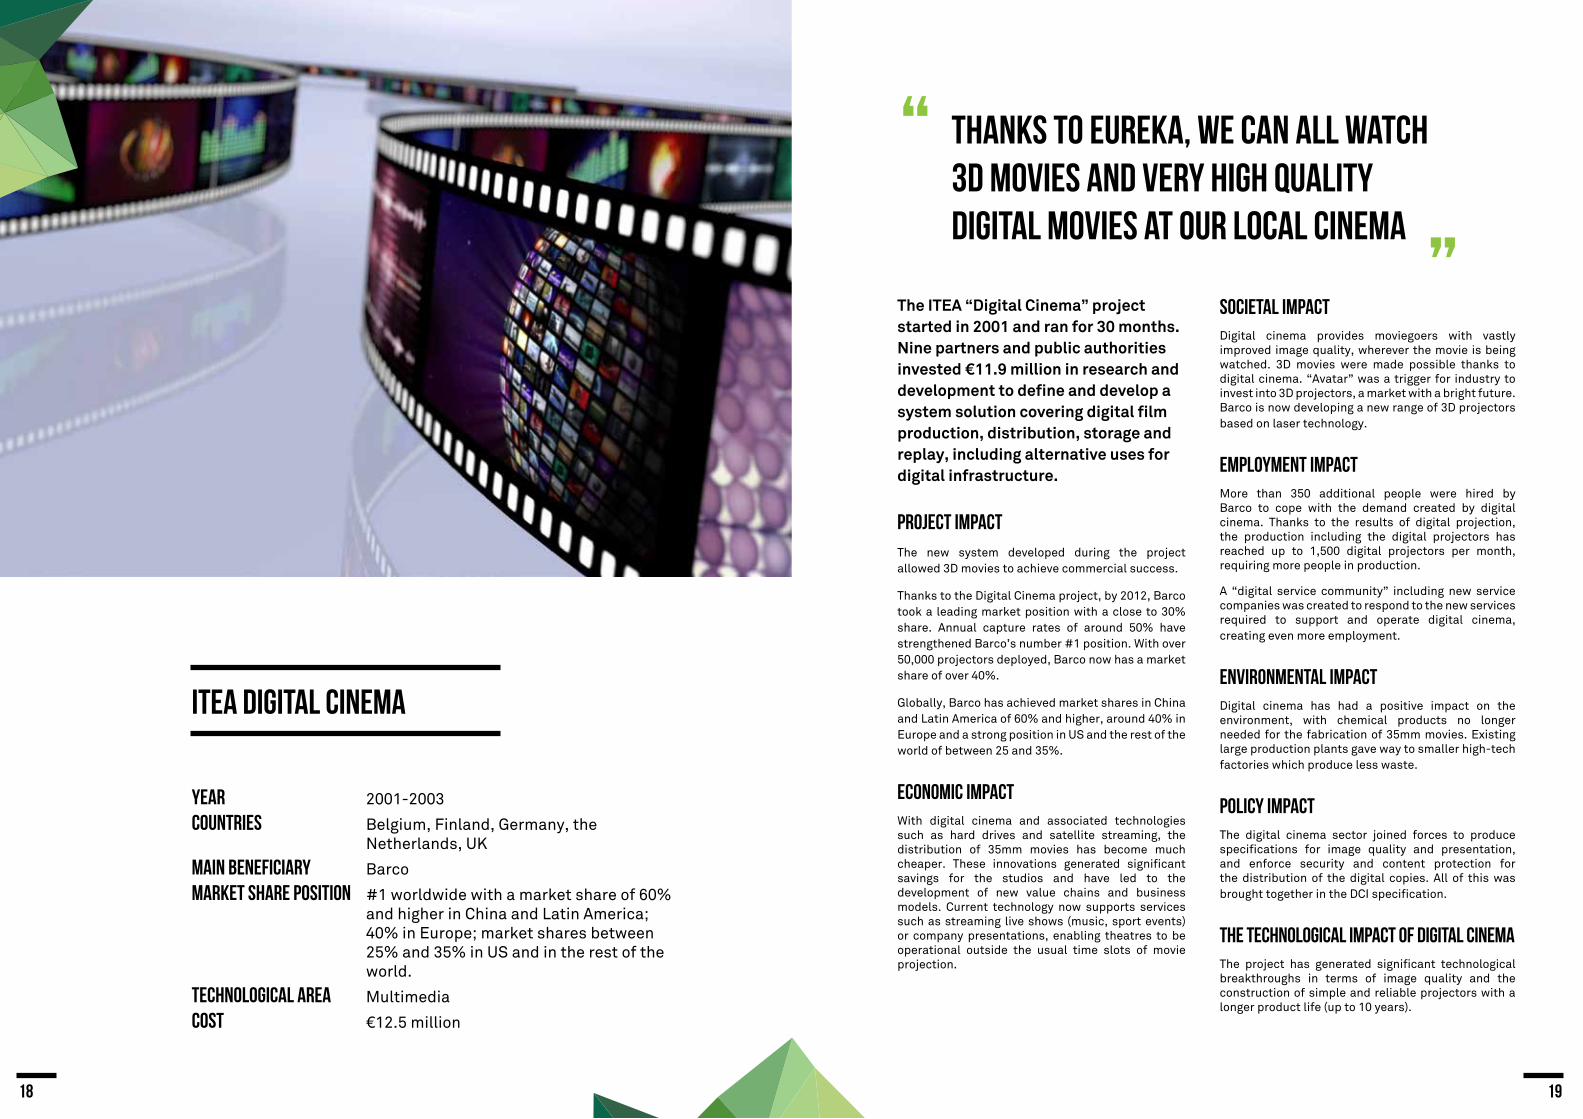
The ITEA “Digital Cinema” project started in 2001 and ran for 30 months. Nine partners and public authorities invested €11.9 million in research and development to define and develop a system solution covering digital film production, distribution, storage and replay, including alternative uses for digital infrastructure.
Project impactThe new system developed during the project allowed 3D movies to achieve commercial success.
Thanks to the Digital Cinema project, by 2012, Barco took a leading market position with a close to 30% share. Annual capture rates of around 50% have strengthened Barco’s number #1 position. With over 50,000 projectors deployed, Barco now has a market share of over 40%.
Globally, Barco has achieved market shares in China and Latin America of 60% and higher, around 40% in Europe and a strong position in US and the rest of the world of between 25 and 35%.
Economic impact
With digital cinema and associated technologies such as hard drives and satellite streaming, the distribution of 35mm movies has become much cheaper. These innovations generated significant savings for the studios and have led to the development of new value chains and business models. Current technology now supports services such as streaming live shows (music, sport events) or company presentations, enabling theatres to be operational outside the usual time slots of movie projection.
Thanks to EUREKA, we can all watch 3D movies and very high quality digital movies at our local cinema
“
”
Year 2001-2003
Countries Belgium, Finland, Germany, the Netherlands, UK
Main beneficiary Barco
Market share position #1 worldwide with a market share of 60% and higher in China and Latin America; 40% in Europe; market shares between 25% and 35% in US and in the rest of the world.
Technological area Multimedia
Cost €12.5 million
Societal impact
Digital cinema provides moviegoers with vastly improved image quality, wherever the movie is being watched. 3D movies were made possible thanks to digital cinema. “Avatar” was a trigger for industry to invest into 3D projectors, a market with a bright future. Barco is now developing a new range of 3D projectors based on laser technology.
Employment impactMore than 350 additional people were hired by Barco to cope with the demand created by digital cinema. Thanks to the results of digital projection, the production including the digital projectors has reached up to 1,500 digital projectors per month, requiring more people in production.
A “digital service community” including new service companies was created to respond to the new services required to support and operate digital cinema, creating even more employment.
Environmental ImpactDigital cinema has had a positive impact on the environment, with chemical products no longer needed for the fabrication of 35mm movies. Existing large production plants gave way to smaller high-tech factories which produce less waste.
Policy impactThe digital cinema sector joined forces to produce specifications for image quality and presentation, and enforce security and content protection for the distribution of the digital copies. All of this was brought together in the DCI specification.
The technological impact of Digital CinemaThe project has generated significant technological breakthroughs in terms of image quality and the construction of simple and reliable projectors with a longer product life (up to 10 years).

2120
ALIENVAULT ESC
The “AlienVault ESC” project started in 2008 and ran for 21 months. Two partners and public authorities from Spain and France invested €1.2 million in research and development to create a new software product called AlienVault Enterprise Security Console (AlienVault ESC), adding innovative intelligence risk measurement algorithms, high performance and legal reinforcement to the open source leader SIM OSSIM.
Project impact
Today, vast quantities of personal information are stored on the Internet, and advanced security capabilities are required to enforce data protection.
SIEM (Security Information and Event Management), the market sector for AlienVault™ products, did not exist when AlienVault started its activities in 2003. The market is now worth €2 billion and is the fastest growing in the security field. The SIEM market responds to the growing demand of data protection: today, all citizens’ personal information is on the Internet and the companies need to reinforce more and more their security capabilities. Thanks to the SIEM market, companies can match compliance regulations to develop and protect the privacy and security of organisations and their users.
AlienVault achieved a #1 position in the mid-size worldwide SIEM market (composed of SMEs), with more than 65 % year-over-year sales growth; and a #3 position in the global SIEM market (including also large companies). AlienVault is the largest independent vendor in the SIEM market.
The AlienVault tool is sold in 180 countries, with customers from a broad range of sectors.
Thanks to EUREKA, we can protect and secure our personal data
“”
Year 2008-2010
Countries Spain, France
Main beneficiary AlienVault
Market share position #1 mid-size market; #3 global market (2015)
Technological area Information Technology
Cost €1.2 million
Economic impact
AlienVault’s growth has been remarkable. From a start-up it has now become an established company with offices in the US and throughout Europe. This success has created new jobs in the US, UK, Ireland, Germany and Spain, where the engineering team is based.
AlienVault shows how European start-ups can become global vendors, competing on a par with Silicon Valley while maintaining and creating
engineering jobs in Europe.
Societal impact
Thanks to this EUREKA product, companies can secure and protect citizens’ personal data. In addition, tens of thousands of Universities, schools, SMEs and Governments are using AlienVault’s free Open Source tool, providing free security capabilities for everyone.
Technological impact
AlienVault increased speed ten-fold compared to existing solutions, by analysing huge volumes of data generated by the hardware and software assets of companies, as well as improving the detection of attacks.
The ALIENVAULT project helped position the eponymous company as a benchmark in its sector. Thanks to EUREKA, the company developed security software that is now not only a reference in the field but also an essential line of defence in modern
cyber-wars.
Policy impact
AlienVault products allow companies to comply with regulations and industry requirements concerning
security and protection of data.

2322
DAB
The “DAB” project started in 1987 and ran for 13 years. 17 partners and public authorities invested €89.2 million in research and development to bring radio broadcasting in line with the most recent advances in digital recording technology.
Thanks to the DAB project, the German research institute Fraunhofer IIS and the French electronics maker Thomson (now Technicolor) have an important portfolio of patents related to MP3. Fraunhofer continues to receive tens of millions of euros in licence fees annually from their series of patents for MP3.
Thanks to EUREKA, we can listen to our favourite music wherever we are
“
”
Year 1987-2001
Countries United Kingdom, The Netherlands, France, Germany and Finland
Main beneficiary Fraunhofer IIS, Technicolor (formerly Thomson)
Market share position #1 (2015)
Technological area Information technologies
Cost €89.2 million
Project impact
DAB’s innovation did not end with digital broadcasting. Three of the project partners went on to develop MPEG-1 Audio Layer 2, the audio format better known as MP2. It was this format that gave rise to the de facto standard of audio encoding MP3, which has been and still is the most widely used standard for listening to music on portable devices.
Technological impact
The project took more than ten years to complete, but it achieved and exceeded its aims, developing a new broadcasting standard that has been hailed as “the most significant advance in radio technology since the introduction of FM stereo”. Today, DAB is used in more than 30 countries worldwide, mostly within the Europe and Asia-Pacific regions.

2524
Thanks to EUREKA, the next few years may see important breakthroughs in areas such as life sciences, information technology and security. Early results from very promising EUREKA projects will be monitored in coming years for important innovations in domains such as biotechnology, medicine and drugs, information technology, security and energy.
Most of the projects described in this section were funded under the
Eurostars programme, where a large number of projects have recently been
completed and the first global results will be visible soon.
1.2 HIGH POTENTIAL PROJECTS
Enabling large scale production of microfluidic cartridges.
The BLISK project started in 2012 and ran for 23
months. Two partners (Axxicon Moulds Eindhoven
B.V and Biosurfit, SA) and public authorities from
The Netherlands and Portugal invested €1.6 million
in R&D to develop a novel lab on disk devices capable
to perform a wide variety of multi-parameter
blood tests for near patient diagnostics as well as
developing large scale production methods. The
project has submitted six patents, and devices are
currently being manufactured at pilot level, aiming
to lead to a larger scale production.
EUROSTARS PROJECT E! 6851 BLISK
Year 2012-2013
Countries The Netherlands, Portugal
Main beneficiary Axxicon
Achieved Six patents, pilot manufacturing
Aiming at Large scale production, IPR/licensing
Technological area Biotech
Cost €1.6 million
Development and clinical testing of a novel osteoconductive synthetic bone graft substitutes.
The NewBone project started in 2010 and ran for 36
months. The partners and public authorities from
Norway and Spain invested €2.2 million in R&D.
NewBone is implanted into the bone in order to assist
the healing and repair of damaged bones. It aims
to overcome all the risks of disease transmission,
product degradation during storage and mechanical
instability as well as lowering production costs.
Greater mechanical strength has already been
achieved and there are very promising in vitro and in
vivo results.
EUROSTARS PROJECT E! 5069 NEWBONE
Year 2010-2013
Countries Norway, Spain
Main beneficiary Corticalis
Achieved One pending patent, in vivo and in vitro experiments, two PhDs
Aiming at Partnering with large industry players
Technological area Biotech
Cost €2.2 million

2726
Injection System for Transderm Administration of dRugs.
The ISTAR project started in 2008 and ran for 16
months. Two partners (Hirtenberger Automotive
Safety GmbH & Co KG and CrossJect) and public
authorities from Austria and France invested €3.6
million in research and development to design,
test and validate on human skin a needle free drug
delivery injector ready to be produced and put on the
market. The medical community sees self-injection
as a safe and reliable solution especially adapted to
the treatment of chronic diseases such as hepatitis
or arthritis.
EUROSTARS PROJECT E! 4258 ISTAR
Year 2008-2010
Countries Austria, France
Main beneficiary CrossJect
Achieved 400+ patents, pilot tests
Aiming at Large scale production (150 million units sold as soon as 2015) in a mass market of 12 billion injections per year
Technological area Biotech
Cost €3.6 million
Forensic Image Identifier and Analyzer.
The FIIA project started in 2011 and ran for 31
months. Three partners and public authorities
invested €1.2 million in R&D to create an innovative
software service for the forensic market that
automatically identifies and analyses the content
of images on web sites and seized computers.
Videntifier subsequently closed a deal with Interpol
to bring the technology into the International Child
Sexual Exploitation Database. One of the goals of
this project is to allow police forces from around
the world to share and identify known child abuse
content and verify if the offender has already been
discovered and eventually caught.
EUROSTARS PROJECT E! 6687 FIIA
Year 2011-2014
Countries UK, Iceland, France
Main beneficiary Videntifier
Achieved Turnover doubled, ten employees hired, contract with Interpol, internationalisation of the activities
Aiming at Sales into the multimedia sector
Technological area Information Technology
Cost €1.2 million
Development of a Bispecific therapeutic antibody for the treatment of metastatic breast cancer.
The ReBAT project started in 2010 and ran for 35
months. The project partners developed a fully
human bi-specific antibody (Biclonic™) production
technology platform to be applied for generating
a therapeutic candidate for breast cancer. The
development of a scalable and economic purification
process for bi-specific antibodies is one of the key
achievements of the project. With five patents, the
project has already generated a new technology used
to generate a first in class drug candidate that limits
the appearance of treatment resistant tumours,
reduces treatment toxicity, and that is potentially
effective in a broader patient population.
EUROSTARS PROJECT E! 6121 REBAT
Year 2010-2013
Countries The Netherlands, Switzerland
Main beneficiary Merus, ChromaCon
Achieved Five patents, enhancements to existing platforms, €23 million additional VC investment
Aiming at Large scale production
Technological area Biotech
Cost €1.8 million
Fuel cells for low emission ships.
The FELLOWSHIP project started in 2007 and run
for 34 months. The partners and public authorities
from Germany and Norway invested €11.7 million
in R&D to develop and demonstrate fuel cell power
packs especially suitable for marine and offshore
use, which will vastly improve the energy efficiency
of ships, subsequently reducing running costs
and the vessels’ impact on the environment. The
FELLOWSHIP team has developed highly innovative
HotModule fuel cells that take advantage of recent
developments in the fields of Molten Carbonate Fuel
Cell (MCFC).
EUREKA NETWORK PROJECT E! 3636 FELLOWSHIP
Year 2007-2010
Countries Germany, Sweden
Main beneficiary Det Norske Veritas A/S (Dnv)
Achieved Highly innovative HotModule fuel cells
Aiming at Commercial sales
Technological area Energy, Environment
Cost €11.7 million

2928
IM 0.067 0.043 0.119 0.058 0.044 0.032 0.029 0.026
IF 0.309 0.191 0.484 0.217 0.340 0.162 0.184 0.147
IF-5 0.378 0.234 0.574 0.258 0.340 0.206 0.235 0.189
Overview
The use of patents to measure innovation output remains controversial. Clearly, not all innovations are patented – particularly for areas such as software and the internet economy, where copyright may be a more important form of intellectual property protection. Nevertheless, for some industries such as Life Sciences, patents are considered a good proxy of innovation outputs8. A recent study of the impact of Eurostars programme used an econometric evaluation of patent data to establish a positive and significant impact of the programme on the development of the patent portfolio of funded firms, compared to non-funded programme applicants9.
Put simply, patent citation is similar to bibliographic citation: an innovation may be partly based on an earlier patented innovation. The inventor is required to disclose all “prior art” related to the patented invention. Therefore particularly novel, or technologically important, patented innovations will be the subject of greater citation10. Citation analysis therefore allows the diffusion of technological knowledge to be traced - where innovations are patented, citations appear to be a robust measure of their innovation or technological impact. Furthermore, strong links have been found between patent citation counts and measures of economic value11.
For this report, a patent citation analysis was carried out to analyse the innovation impact of EUREKA’s project outcomes. The analysis follows a network approach: in the patent citation network, patent applications are considered as the network nodes, and citations between them are the network links. To measure a patent’s impact, the citations that other patents, released at a later time, make to the patent of interest (also known as ‘forward’ citations) are counted. In this temporally evolving network that spans technological areas and geographical locations (e.g. country origin of patenting companies/organisations), three network-based Innovation Metrics are employed that summarise, over time, the impact of patents both within and between EUREKA’s main technological areas: Life Sciences & Medicine, Energy & Environment, ICT and Industrial Technologies.
These metrics have been labelled the Immediacy Index (IM), the Impact Factor (IF), and the 5-Year Impact Factor (IF5): the metrics were used to estimate short-term impact (i.e. citations) in the year
of application (IM), 1-2 years (IF) and 5 years after application (IF-5).
1.3 PATENT CITATION ANALYSIS
ResultsThe results summarized in Table 1 indicate that patents related to EUREKA project participation have a higher technological impact, measured by citations, compared to European patents unrelated with EUREKA participation in all four technology areas investigated.12 This conclusion holds for the three different metrics of impact – IM, IF, and IF5.
EUREKA innovation impact in Life Sciences & Medicine, ICT and Industrial Technologies have been high, using all three temporal indicators, when compared to other patents with no relation to EUREKA projects in respective technological areas. Average citations of EUREKA-related patents are highest in Life Sciences & Medicine with an average of 0.12 citations per patent application within the same year (IM), 0.48 citations after 1-2 years (IF) and 0.57 citations after five years (IF5). Overall, the results indicate that participation in EUREKA projects does indeed confer higher levels
of technological innovation.
The results also show:
For Life Sciences & Medicine, ICT and Energy & Environment, the IF5 measure picks up extra citations compared to IF, which is not the case for Industrial Technologies.
Among non EUREKA-related patents, the differences between technological areas are less significant than for EUREKA-related patents.
Compared to other technological areas, patent citations for EUREKA Energy & Environment projects have been relatively low. This may be explained by the importance of scale in these sectors, as well as the well-known volatile nature of investment, which may have led to
increased project cancellations.13
8 In Life Sciences industries patents are a crucial tool due to long product lead times requiring expensive research before there is a marketable product. Gollin M.A., “Driving Innovation: Intellectual Property Strategies for a Dynamic World” , Cambridge University Press, 2008
9 European Commission, “Final Evaluation of the Eurostars Joint Programme”, November 201410 Marco A.C., “The dynamics of patent citations”, 200611 Trajtenberg M, “A penny for your quotes: patent citations and the value of innovations”, RAND Journal of Economics Vol. 21, No.1 Spring 1990
Table 1-1 Citation scores of EUREKA and non EUREKA-related patents
IM (Immediacy Index) measures the average number of citations received within the year of patent application.IF (Impact Factor) measures the average number of citations received 1 (EUREKA) or 2 years (non-EUREKA) after a patent application.IF5 (Impact Factor 5) measures the average number of citations received 5 years after a patent application.
NON EUREKA
NON EUREKA
NON EUREKA
NON EUREKA
Life sciences & medicine ICT Industrial technologies ENERGY & Environment
12 See Section 3 for more details.13 Forbes, “Clean Energy Innovation: An Unstoppable and Volatile Force”, January 2013 http://onforb.es/1hR0AxM

3130
Specific results of interest are investigated further in the below diagrams, which depict the innovation
impacts of EUREKA participation in the difference between the light green and dark green areas.
Figure 1-1 shows the innovation impact of EUREKA in Life Sciences & Medicine, as measured by the IM metric. There appears to have been a peak in patent citations related to EUREKA projects around 2003-2006, which could be explained by the advancements in Genome Research: in the early 2000 the first rough draft of the human genome was completed (cf. the Human Genome Project in which the EUREKA project LABIMAP was a significant contributor together with a few other EUREKA projects, namely 696 Gene Imaging; 2370 Cancer Circuitry and Eurostars E! 4731 Arrayvolution). More
recently, the course of biotechnology research and innovation shifted towards genomics research.
The apparent decline in patent citations in recent years may be attributed to a growing time lag
between publication and citation, or changes in patenting strategies within the Life Sciences sector.
Figure 1-2 shows EUREKA’s innovation impact in ICT, as measured by the IM metric. Three major peaks in citations over the past 25 years are apparent - before 2000, around 2005 and after 2010 - coinciding with the following innovations in the ICT sector:
1997: cable and digital subscriber lines started to make their appearance in homes and broadband connections have started to make their appearance;
2005: 3G, the third generation of mobile telecommunications technology, were introduced; and
2012-2013: high-speed mobile network technologies (4G) and mobile computing technologies began to be adopted on global scale.
Given the short-term impact of EUREKA ICT patents (as measured by same-year and two-year patent citations), it can be surmised that EUREKA projects played an active role in these waves of innovation, a finding which is corroborated further by the success stories discussed in this report.
FigURE 1-2 Innovation impact on ICT - IMFigURE 1-1 Innovation impact on Life Sciences & Medicine - IM
2000 2005 20101990 1995
Year of application
Imm
edia
cy in
dex
(sam
e yea
r)
Immediacy index for EUREKA and non EUREKA related European patent applications - Life Sciences & Medicine
0
0.2
0.4
0.6
0.8
1
EUREKA relatedNON EUREKA relatedSmoothed EUREKA
2000 2005 20151990 1995
Year of application
Imm
edia
cy in
dex
(sam
e yea
r)
Immediacy index for EUREKA and non EUREKA related European patent applications - ICT Technology
0
0.05
0.10
0.15
EUREKA relatedNON EUREKA relatedSmoothed EUREKA
2010

3332
A number of qualifying factors regarding EUREKA additionality must be taken into account when interpreting the above results:
Given the nature of innovation ecosystems, where innovative companies often draw on funds and assistance from a number of sources, usually no single funding body or organisation can claim sole paternity for an innovation. However each of these funding sources can play a crucial role in bringing a new product or process to fruition.
The differences between results for EUREKA and non EUREKA-related patents may be due to differences in the companies applying for EUREKA projects compared to other companies generating patents, and therefore not be directly caused by EUREKA funding. Nevertheless, Final and Market Impact Reports provide some evidence of additionality given that patents are explicitly mentioned as having been developed in the course of the funded project
Given the above, the findings needs to be explored further, if possible using counterfactual analysis,
in order to draw definite conclusions regarding EUREKA additionality.14
SpilloversThe industrial knowledge spillovers between the different technological areas on a European level, were also explored.
The results obtained show:
The most significant spillovers from the Life Sciences sector were to Industrial Technologies. These spillovers showed a significantly higher overall impact from EUREKA-related patents than from non-EUREKA related patents
Industrial Technologies’ most significant spillovers were in the Energy & Environment area,
Energy & Environment projects most important and cumulative spillovers were reported on Industrial Technologies, and
ICT’s most important spillovers were recorded for Industrial Technologies. The immediate impact of these spillovers was significantly higher for EUREKA-related patents. Moreover, EUREKA’s impact in terms of ICT knowledge spillovers shows a sizeable increase in recent years
With respect to scientific and innovation spillovers from ICT to other technological areas (Biotechnology, Industrial Manufacturing, Energy/Environment), it appears that knowledge spillovers between ICT and Industrial Technologies has been of high overall impact, showing a
sizeable increase over the years.
Aside from patent citation analysis a number of other innovation indicators were developed to explore the results of projects funded by EUREKA and the impact of its funding on participating organisations. The data is drawn largely from EUREKA Market Impact Reports, completed by participants in EUREKA Network Projects and Eurostars projects.15 Market Impact Reports provide data on outcomes 1-4 years after the end of the project, allowing time for the early innovative results
to develop16.
1.4 INNOVATION INDICATORS: TECHNOLOGICAL INNOVATION AND DIFFUSION OF INNOVATION
14 Technopolis Group, “Evaluation Reference Model. For TAFTIE’s Taskforce Benchmarking Impact, Effectiveness and Efficiency of Innovation Instruments”, January 2014
Instrument TOTAL
1Technological innovation indicator (inc. Eurostars)
Network Projects & Eurostars
59.8%N=174
68.0%N=319
70.0%N=457
63.8%N=282
65.4%N=1232
1aProduct Innovation Indicator
Network Projects48.6%N=111
57.8%N=218
57.1%N=382
50.5%N=190
54.9%N=904
1BProcess Innovation Indicator
Network Projects31.5%N=111
33.5%N=218
41.4%N=382
44.7%N=190
38.8%N=904
2Diffusion of Innovation
Network Projects64.3%N=143
61.3%N=284
63.2%N=506
63.8%N=246
63.1%N=1179
Table 1-2 Results of innovation indicators based on data from EUREKA Market Impact Reports
Life sciences & medicine
ICT Industrial t echnologies
ENERGY & Environment
15 See Methodological Note for further details. N= number of participant replies16 Conversely, assessments based on Final Impact Reports (completed upon project finalisation) tend to underestimate project
outputs due to their immediacy

3534
Among the different forms of innovation, following the OECD, those related to product or process innovations can be described as technological innovations.17
EUREKA Network and Eurostars projects show a higher level of technological innovation (product + process innovations) 1-4 years after project completion in Industrial Technologies (70.0%) and ICT (68.0%), compared with Energy & Environment (63.8%) and Life Sciences & Medicine (59.0%).18 Long lead times, trials and regulatory hurdles in Life Sciences innovation may help to explain the latter result.
While each technological area shows a similar level of product innovation, the results indicate a higher level of process innovation in the Energy & Environment and Industrial Technologies areas. This may indicate that project participants in these technological areas are more likely to be operating in markets characterised by a “dominant design”, or de facto standard, leading companies to focus more on process and organisational innovation19, compared with ICT or Life Sciences.
Another explanation for differing levels of product and process innovation could be sought in the extent to which economies of scale are present in different markets. Existing research indicates that, for firms which achieve competitive advantage by exploiting economies of scale, innovation is more product than process orientated20. This suggests that more scale-intensive industries will have a higher level of product innovation. However, this is difficult to verify with the available results, as each technological area corresponds to numerous sectors and markets (see the network graphs in section 2).
ICT projects score noticeably higher in terms of the proportion of sales to newly-developed or improved products. This may be due to the ICT featuring a higher proportion of younger companies, in comparison the other three technological areas, with relatively low sales of existing products and services.
It is encouraging to note that in each technological area, diffusion of innovation i.e. the proportion of organisations who have reported to have accomplished good or excellent commercial impact because of their participation is uniformly high (60 to 65%) across the technological areas.
17 “Technological innovations comprise new products and processes and significant technological changes of products and processes. An innovation has been implemented if it has been introduced on the market (product innovation)”. OECD Frascati Manual, Sixth edition.
18 It is important to underline that a major source of EUREKA ICT projects, EUREKA Clusters, are not included in this analysis.
19 Teece D., “Profiting from technological innovation: implications for integration, collaboration, licensing and public policy”, Research Policy 15 (pp. 285-305), 1986. Utterback J., “Mastering the dynamics of innovation”, 1994 A dominant design refers to a de facto standard in an industry.
20 Pyka M, Fonseca M., (eds), “Catching Up, Spillovers and Innovation Networks in a Schumpeterian Perspective”, Springer 2011
TECHNOLOGICAL AREAS2

3736
EUROSTARSNETWORK PROJECTSCLUSTERS
5500
5000
6500
5000
4500
4000
3500
3000
2500
2000
1500
1000
500
0
19851989
19901994
19951999
20002004
20052009
20102014
EUROSTARSNETWORK PROJECTSCLUSTERS
500
550
450
400
350
350
300
250
200
150
100
50
0
19851989
19901994
19951999
20002004
20052009
20102014
32,3%
36,2%
ELECTRONICS, MICROELECTRONICSSOFTWARE & SYSTEMSMULTIMEDIACOMMUNICATIONS & NETWORKSOFTWARE FOR HEALTH,TOURISM AND TRANSPORT
8,4%
11.5%
11,7%
12,5%
46,9%
11,3%2,7%
26,6%
SMELARGE COMPANYUNIVERSITYRESEARCH INSTITUTEOTHER
ELECTRONICSCONSUMER PRODUCTS & SERVICESCOMMUNICATIONSOTHER COMPUTER RELATEDTRANSPORTATIONINDUSTRIAL PRODUCTS / MANUFACTURINGMEDICAL / HEALTHOTHER
6,0%
17,1%
6,3%
5,3%
27,7%
15,4%
8,9%
13,3%
*Eurostars projects only, as reported up to 3 years after project end.
PATENTS GRANTED 17,8%PATENTS APPLIED/PENDING 33,3%PATENTS RESEARCHED 10,0%NO ACTIVITY 38,9%
Number of projectsProject investment (€M)
Project investment by technology
Patent activity
Project investment by market application
Participation by organisation type
Information & communications technology
2.1
Information & communications technology in numbers

3938
EUREKA’s shaping and developing of global technological trends in the field of Information & Communications Technology is illustrated in the below timeline, which is based on concrete examples.
Information & communications technology project timeline

4140
The ICT (Information and Communications Technology) sector is a significant component of the Europe’s economy in its own right, accounting for 5.6% of Europe’s GDP (€670 billion) and 5.3% of employment.21 ICT R&D and innovation are key to the advancement of Europe’s economic and wider well-being.
Moreover, ICT has become fully integrated into our daily lives - mobile broadband subscriptions reached 2.3 billion globally in 201422 - becoming embedded in processes, products and services in almost every sector of the economy – from Manufacturing (e.g. via the use of sensors) to Consumer goods, Health & Medicine, and Energy (e.g. smart grids).
Since 1985 ICT has seen three important life cycles, each of them, during their initial phase, disrupting existing markets and heralding a new wave of competition. In the 1980s, the PC became a leading product, establishing a new market segment and conditioning the evolution of the whole ICT sector, while opening the door for the Internet. In the mid-1990s mobile telephony took the lead. The evolution of digital systems towards 3G (UMTS) and later 4G provided new opportunities for market and usage expansion, while at the same time giving an impulse to convergence with the Internet. Since 2000, consumer electronics have seen a wave of innovation, with the success of videogames, digital cameras, digital television and other home-based ICT products focused on leisure.
For decades, the pace of change in ICT has been driven by underlying advances in electronics. Here, EUREKA can claim to have been at the forefront of European and global innovation, with early investment via the JESSI Cluster, later followed by MEDEA and CATRENE.23 The CATRENE EXEPT project focused on developing photolithography and EUV technology, commercialized by ASML, is a recent example of EUREKA generating commercial success in the electronics sector.
EUREKA has also been central to the development of European telecommunications and network technology, notably via the CELTIC and CELTIC PLUS Clusters. For example, the WINNER+ project developed systems, concepts and simulations to test and validate ideas for broadband mobile communications, which are now being exploited for global standards. As can be seen in Fig.1 below, communications technology has been a primary focus of EUREKA projects since the 1980s - with clear benefits to the European industry. In telecoms equipment, in 2013 Europe was home to the leading manufacturer (Ericsson) and claimed three of the top ten places by revenue, equal to the US, ahead of China (2) and Japan (1).
The trajectories of technological development in other sectors have also been clearly shaped by EUREKA funding. The Digital Cinema project, developed via the ITEA Cluster has proved to be a major success, helping to make Belgian company BARCO a global leader in digital cinema projectors. The Section on Global Success Stories analyses EUREKA successes in the fields of network technologies (100GET), digital radio (DAB) and web security (ALIENVAULT), with the latter a clear example of European success in an increasingly core sector for the internet economy.
EUREKA has also assisted the embedding of ICT into the Industrial sphere, with ground-breaking high-tech projects such as PROMETHEUS and i-StARS (See Global Success Stories).
In recent years, the main trends have seen Network and Eurostars project investment increasing steadily since 2008 in the areas of Data Management, Processing and Protection, with investment in running projects reaching €250 million in 2015. While funding of various domains of electronics and network technologies via Network and Eurostars projects has declined in recent years, there have been continued larger investments in Clusters focusing on these domains (see Global Success Stories). Project investment in semantics and human language technologies have seen an increase in 2014, reaching close to €20 million.
As depicted in Figure 2-1, EUREKA’s Eurostars and Network projects in ICT since 2000 have been dedicated largely to Information Processing and Information Systems (19%), Telecommunications (7%), IT and Telematics (6%), Microelectronics (6%) and Multimedia (3%). Predictably, given ICT’s role as an enabling technology, these projects have had market diffuse applications, beyond Computer Software (16%), Data Communications (5%) and Electronic Components (3%) to Leisure and Recreation (4%), Industrial Automation (3%) and a long tail of 55 other market areas24.
21 http://ec.europa.eu/enterprise/sectors/ict/competitiveness/ict-brief/index_en.htm22 https://www.itu.int/net/pressoffice/press_releases/2014/23.aspx23 Of the seven currently running EUREKA Clusters, four are dedicated to themes closely related to ICT: ITEA 3 (Software-
intensive Systems & Services), CELTIC-PLUS (Telecommunications, New Media, Future Internet), EURIPIDES² (Smart Electronic Systems) and CATRENE (Semiconductors).
24 Some are depicted (in blue) in Figure 2-1, although many are excluded for clarity
2,000 projects funded
7,000 participating organisations
€23.7 billion public-private investment
Information & communications technology FACTS

4342
IT & telematicsmultimedia
Telecoms
Satellite Microwave communications
Electronic components
Electronics related equipment
Electronics, Microelectronics
Information (processing, systems)
industrial automation
Motor vehicles, equipment & parts
Industrial equipment & machinery
other medical / Health related
Leisure & recreational
other services
consumer services
retailing
medical - diagnostic
Railways trains
other construction
Manufacturing
computer services
Environment services
security services
computer software
other communications related
Telephone related
Naval transport, ships, boatsCommercial communications
scanning related
other consumer related
finance, Insurance & real estate
data communications
The diagram shows the major technological areas (green) developed in EUREKA ICT projects and their market applications (blue). The thicker the line, the more projects represented by this connection. The diagram shows the wide variety of market applications deriving from EUREKA project funding of ICT technologies, in areas as diverse as retail, finance, transport, leisure and recreation.
FIGure 2-1 Information & communications technology Technological areas and market applications of EUREKA ICT projects

4544
The internet economy – implications for EUREKA The Internet has transformed our daily lives over the past decade and has fundamentally changed the way we stay in touch with friends and relatives, search for and purchase products and services, and entertain ourselves. It has also transformed the way we do business. A significant and increasing portion of economic growth in Europe and elsewhere is attributable to the Internet with some countries such as the UK and Sweden leading the way internationally with over 6% of GDP derived solely from the Internet25. While challenges remain, in the coming decade the Internet promises to fuel economic growth and improve well-being. With the Internet expected to reach half of the world population in 2016, its importance for European economies can only grow.
Taken as a whole, Europe has been a follower, rather than a leader in the global Internet economy, slower to develop and capture its full benefits. In terms of global competition, the most successful Internet economies are the United States, South Korea and to some extent China, countries which have spawned the most successful and popular global leaders in this sector (Google, Apple, Samsung, Facebook, Tencent etc.)26 while Europe, with some notable exceptions, is lagging behind. Although there are many European web start-ups, they rarely grow into global players.
Key reasons accounting for the sector’s slower development in Europe include:
Market and regulatory fragmentation: The EU’s single market exhibits less homogeneity than the US, particularly in terms of language and culture. Inconsistencies between member states abound both in terms of sectoral legislation (eg. regulation of the internet, licensing, authorisations, IPRs) as well wider policies such as corporate taxation. Addressing a range of regional or national specificities, increases the time, cost and risk of launching a new product or service. As a result it is more difficult for European companies to rapidly move into new promising business areas or to successfully enter a new market.
Unbalanced distribution of facilities and resources across Europe: Ecosystems to support the creation and scaling of enterprises in the internet economy are not common to all EU countries.
Differences in the provision of infrastructure: Fragmented broadband and a lack of pan-European internet service providers has contributed to the slower diffusion of advanced online services in the past
Clearly, the principal reasons for the slow development of the sector in Europe have a structural character. Therefore, European governments should join forces and collaborate in order to reduce these structural gaps, following a single market approach - as envisaged in the EU’s Digital Single
Market Strategy.
EUREKA’s role
Although in its early stages, the importance of promoting Europe’s ICT sector was at the forefront of EUREKA’s projects from 1985. The network mobilised considerable resources for the development of the sector. EUREKA has continually focused on creating and expanding networks and boosting synergies by supporting projects involving organisations from two or more different countries. This has addressed some of the structural barriers which impede the creation of a European digital market.
In this way EUREKA enhanced knowledge sharing and supported the implementation of trials and business exploitation activities in countries with different cultural, legal and economic environments.
However, what is still needed are policy measures that will preserve and extend the openness of the Digital Single Market initiative and help the European Internet industries to overcome their fragmentation. EUREKA can contribute to the EU Digital Single Market initiative by continuing to support multinational projects in the internet economy as well intensifying market experimentation
activities in different environments.
25 McKinsey Global Institute, “Internet matters: The Net’s sweeping impact on growth, jobs, and prosperity”, May 2011 http://bit.ly/1oyMmjT
26 Recent figures show that seven of the top ten global smartphone manufacturers are from China, two from South Korea and Apple. http://bit.ly/1PJKcxM
Number of participants
2 3 4 5 6 7 8 9 10+
1985-95 42 36 17 19 15 12 19 10 41
1996-2005 202 115 67 55 40 31 22 22 188
2006-2015 317 200 106 74 54 30 25 33 259
Table 2-1 EUREKA ICT PROJECTS PER DECADE AND NUMBER OF PARTICIPANTS

4746
Number of projectsProject investment (€M)
Project investment by technology
Project investment by market application
Participation by organisation type
Patent activity
400
350
500
450
300
250
200
150
100
50
0
200
250
150
100
50
0
Life Sciences & Medicine
2.2
Life sciences & medicine in numbers

4948
Life sciences & medicine project timelineEUREKA’s shaping and developing of global technological trends in the field of Life Sciences & Medicine is illustrated in the below timeline,which is based on concrete examples.

5150
With the population of the Western world and Europe in particular ageing dramatically, the impact of a higher number of elderly citizens, longer healthy life expectancy, and fewer numbers of working-age individuals will have an increasing effect on our economy and society in the years to come. Technology derived from the life sciences is therefore likely to have an ever more central role in the European and world economy.
Innovation in the life sciences is a very complex and expensive undertaking, often involving numerous actors from the public and private sectors. A high risk of failure is accompanied by the need for long-term investments – for example, clinical trials mean that players need to invest for many years before seeing ROI. At each stage of the innovation cycle, many social and economic factors can affect the development, uptake or diffusion of new technologies. For these reasons, public funding has been proved to play a crucial role in bringing new products and services to market27.
Furthermore, as emphasised in a recent report from Deloitte, “innovation strategies founded on collaboration, networking and asset acquisitions continue to grow in importance and impact…the ability to engage in and subsequently manage strategic alliances effectively is a critical success factor in life sciences R&D” 28
In drug development and other areas, with externalisation of R&D remaining a persistent strategy to cope with the scientific, regulatory and commercial uncertainty, SMEs are expected to continue to play a central role. Nevertheless it remains extremely difficult for SMEs to move from idea to market alone, especially when the intended market is international – here the EUREKA model of collaborative innovation proves its worth.
In pharmaceuticals, the decline of an existing business model – based on the blockbuster drug – is closely linked to the structural shift in R&D activity towards an ecosystem including smaller players.29 This is reinforced by the rising importance of diagnostics, which reinforces the need for a more flexible R&D model aimed at personalising patient care. It is such synergies between previously separate areas of the sector which reinforce and reestablish EUREKA’s collaborative model.
Looking at its historical project portfolio, depicted in Figure 2-2, 62% of EUREKA projects in the sector have been dedicated to developing Medical Technology, while a further 29% have addressed Biology/Biotechnology. The major areas of market application have been Diagnostics (30%), Therapeutics (29%) and Pharmaceuticals (24%). Focusing on the sub-sector of Biotechnology, the same three areas of market application dominate, although diagnostic applications are less important (15%) than for the Life Sciences projects as a whole.
EUREKA project investment in Life Sciences & Medicine reached over €465 million from 2010 to 2014 with 314 projects funded, mainly via the Eurostars programme. This compares to 141 projects for the period 2005 to 2009. Average project investment was €1.5 million in 2014 (€2.7 million since 1985). Diagnostic technologies have seen significant growth in EUREKA project investment with total running project costs increasing from €25m in 2008 to almost €90m by 2014. This reflects a market in which segments such as cancer diagnostics (including high-tech genomics screening) and the use of biomarkers in early-stage clinical development are leading the way.
27 IMD Working Paper 2013-01 http://bit.ly/1UjPr9w28 Deloitte Centre for Health Solutions, “Measuring the return from pharmaceutical innovation 2014. Turning a corner?”, p.4
http://bit.ly/1wcpM5b
29 A. Kandybin, V. Genova, “Big Pharma’s Uncertain Future”, strategy+business, Spring 2012 http://bit.ly/1IDFTtZ
900 projects funded
2,900 participating organisations
€2.5 billion public-private investment
Life Sciences & Medicine FACTS

5352
Biology/biotechnology
Medical technology
Micro- & nanotechnology related to biological sciences
genome research
Consumer products
services - environment
Fishing, sea food & farming
food & beverages
horticulture
monoclonal antibodies & hybridomas
other biotechnology / molecular technology
Biocaptors
industrial services
bioinformatics
Gene splicing & manufacturing equipment
Cultivation of cereals / crops / vegetables
viticulture & fruit tree cultivation
recombinant DNA
Industrial equipment & machinery
genomics /proteomics / metabolomics other services
animal husbandry
diagnosticother medical health
Therapeutic
The diagram shows the major technological areas (green) developed in EUREKA Life Sciences & Medicine projects and their market applications (pink). The thicker the line, the more projects represented by this connection. The major markets are equally split between Therapeutics, Pharmaceuticals and Diagnostics. This reflects the major trends in medical R&D&I in the last 30 years. The widespread applications of biotechnological innovation can be seen, with market areas including Consumer Products and Agriculture/Agrofood sectors. The diagram depicts EUREKA Network and Eurostars Projects.
Figure 2-2 Life Sciences & Medicine Technological areas and market applications of EUREKA Life Sciences & Medicine projects

5554
Number of projectsProject investment (€M)
Project investment by technology
Project investment by market application
Participation by organisation type
Patent activity
EUROSTARSNETWORK PROJECTSCLUSTERS
400
350
300
250
200
150
100
50
0
19851989
19901994
19951999
20002004
20052009
20102014
19002000
1500
1000
600
300200
1700
1300
800
400
2100
1800
1400
900
500
1600
12001100
700
1000
19851989
19901994
19851989
19901994
19951999
20002004
20052009
20102014
67,1%
INDUSTRIAL MANUFACTURNG,AND TRANSPORTATIONCHEMICAL, PHYSICAL AND EXACT SCIENCESMEASUREMENTS AND STANDARDSOTHER INDISTRIAL TECHNOLOGIES
10,1%
14.0%
8,6%
13,9%
41,9%
12,3%2,1%
29,7%
SMELARGE COMPANYRESEARCH INSTITUTEUNIVERSITYOTHER
INDUSTRIAL PRODUCTSTRANSPORTATIONMEDICAL/HEALTHCONSUMER PRODUCTS & SERVICESENERGYCONSTRUCTION / BUILDING PRODUCTELECTRONICS RELATEDOTHER
9,3%
4,3%
24,8%
4,8%
37,8%
9,2%
6,2%
3,6%
*Eurostars projects only, as reported up to 3 years after project end.
PATENTS GRANTED 25,6%PATENTS APPLIED/PENDING 33,8%PATENTS RESEARCHED 1,7%NO ACTIVITY 33,9%
EUROSTARSNETWORK PROJECTSCLUSTERS
Industrial Technologies
2.3
Industrial Technologies in numbers

5756
EUREKA’s shaping and developing of global technological trends in the field of Industrial Technologies is illustrated in the below timeline,which is based on concrete examples.
INDUSTRIAL TECHNOLOGIES project timeline

5958
Today it is estimated that industry and manufacturing in Europe generate 25% of all private sector jobs, 80% of private sector R&D, and 75% of exports in Europe. Europe is a global heavy-weight in advanced manufacturing technologies.
Despite its successes, the challenges facing Europe’s manufacturing industry over the past decade have become more pronounced: competition with low-cost countries producing low-to-medium technology products; high manufacturing costs accompanied by chronic low productivity, and thirdly the “low investment - low productivity – low growth” trap due to enduring economic uncertainties and problems in accessing finance30. To meet these challenges, Europe needs to continue to invest in innovation to revolutionise manufacturing and enable re-industrialisation.
Manufacturing is back at the top of the innovation policy agenda31, with leading economists engaged in debate over the economic and social benefits of supporting and developing a domestic manufacturing base, and reflecting on the need for an “Entrepreneurial State”.32 Indeed, according to McKinsey “manufacturing remains a vital source of innovation and competitiveness, making outsized contributions to research and development, exports, and productivity growth”33.
However, to succeed in a new era of advanced manufacturing, companies from advanced and developing economies will have to be highly agile and networked, delivering products and services to diverse global markets. In particular, advances in ICT continue to revolutionise manufacturing processes, creating global supply chains, and furnishing new forms of intelligence - for example via data-gathering sensors in production machinery and logistics34.
Early proof of the emphasis given by EUREKA to advanced industrial technologies can be seen in the FAMOS Umbrella project (1986-1995), which aimed to boost Europe’s industrial competitiveness by developing flexible automation. FAMOS foreshadowed later initiatives to re-shore Europe’s manufacturing base35 and was followed by successive Umbrellas in the manufacturing domain, most recently ProFactory+ (2011-2015).
In terms of technological domains, of those which feature strongly in Fig. 5, transport and materials boast some of the clearest examples of EUREKA’s success.
PROMETHEUS became not only a model for subsequent EUREKA projects and Clusters, but also one of the most influential endeavours in transport technology that the world has ever seen. The 150 participants aimed to develop new ways to make the most out of existing traffic networks by augmenting communication between drivers, traffic managers and other road users.
A pioneering initiative, the project developed two of the earliest autonomous driving systems capable of covering large distances without human intervention.
The project I-STARS led to the development of a compact, fully integrated and low-cost start-stop system for cars to replace conventional alternators in mass production and represented a perfect example of the profitable synergies created through EUREKA’s collaborative projects. Project leader Valeo took the responsibility for the assembly of the mechatronics unit, while its partners provided expertise in microelectronics. The resulting STARS system already fulfils global demands for more energy-efficient vehicles and can cu fuel consumption by as much as 25 percent.
Materials has also seen significant investment via EUREKA projects, in fields ranging from textiles to metals and alloys (see Fig.5). The recent Eurostars project IM-ITSHT allowed main partner RocTool to perfect its technique to realise complex mouldings without any apparent joints. The technology developed allows components to be produced in just two minutes; a reduction of 90%. The company’s primary market is now Asia, where it licensed the technology to the manufacturer of iPhone shells.
The successful LRF project, generated under the ProFactory+ Umbrella, focused on developing lightweight carbon fibre technology for installing roof fixtures, one of the core processes when assembling a vehicle. Swedish SME FlexProp, which partnered with Audi in the project, now has deals with major companies in the automotive and aerospace sectors.
In recent years, EUREKA’s influence on advanced manufacturing systems has also continued via projects such as Eurostars OPTITUNE, which developed new optical filters allowing life-threatening diseases to be diagnosed at an earlier stage and at lower cost. The project helped Danish SME DELTA to challenge US-based rivals in the market for variable filters.
As shown in Figure 2-3, EUREKA Industrial projects have been dedicated to innovations such as Composite Materials (5%), Design and Modelling technologies (5%), Metals and Alloys, Process Control and Logistics, Moulding, Textiles and Road Vehicles technologies.
The main applications of EUREKA Industrial technological advancements have been in Motor Vehicles (10%), Chemicals and Materials (10%), Transportation Equipment and Parts (10%), Aircrafts and Aerospace (3%).
Recent years have confirmed the importance of transport technologies in EUREKA’s portfolio. EUREKA Network and Eurostars projects have seen an increasing investment in Road Transport Technology and Traffic Control (€90 million in running projects in 2014), Composite Materials (at least €45 million), and Sensors (€35 million, not including significant funding via Clusters projects).
30 www.cecimo.eu/site/publications/magazine0/advanced-manufacturing/31 See the European Commission’s 2014 Communication, For a European Industrial Renaissance32 Mazzucato M., “The entrepreneurial state : debunking public vs. private sector myths”, Anthem Press, 2014.33 McKinsey, Manufacturing the future: The next era of global growth and innovation, November 201234 Ibid.
1,750 projects funded
6,400 participating organisations
€6.2 billion public-private investment
Industrial technologies FACTS
35 “Results of the EUREKA FAMOS Research Programme: A European Contribution to Manufacturing Technology”. Robotics & Computer-Integrated Manufacturing, Vol. 10, No. 1/2, pp. 13-19, 1993

6160
paper technology
constructionwood pulp & paper
clothing shoes & accessories
naval transport,ships & boats
machine tools /metal working
laser related
airlines, aircraft,aerospace
textilessynthetic & natural
access control equipment & systems
fibre-reinforced (plastic) composites
Industrial equipment & machinery
Industrial products/manufacturing
water treatmentequipment
motor vehicles
steel metalwork
building materials
civil engineering
other industrial technologies
process control & logistics
footwear / leathertechnology
composite materials
industrial manufacturing
textiles technologymetals & alloys
iron& steel, steelworksmachine
toolstechnology
moulding
forming
road vehiclestechnology
design of vehicles
physical sciences nanotechnology
design & modelingprototypes
membranefiltrationtechnology
shipbuildingtechnology
building materials componants& methods
The diagram shows the major technological areas (green) developed in EUREKA projects and their market applications (brown). The thicker the line, the more projects represented by this connection. The diagram shows the importance of materials – in particular, metals - and transport as technological and market areas where EUREKA projects have made a significant contribution. Industrial design technology also features strongly, in particular related to automotive design. The diagram depicts EUREKA Network and Eurostars projects.
Figure 2-3 Industrial Technologies Technological areas and market applications of EUREKA Industrial Technologies projects

6362
Number of projectsProject investment (€M)
Project investment by technology
Project investment by market application
Participation by organisation type
Patent activity
EUROSTARSNETWORK PROJECTSCLUSTERS
250
300
200
150
100
50
0
19851989
19901994
19951999
20002004
20052009
20102014
EUROSTARSNETWORK PROJECTSCLUSTERS
500
400
300
200
900
800
700
600
100
0
19851989
19901994
19951999
20002004
20052009
20102014
37,1%
15,9%
15,3%
ENERGYENVIRONMENTAGRICULTURE & MARINEAGROFOOD
31,8%
ENERGYAGRICULTURE, FORESTRY AND FISHINGCONSUMER PRODUCTS & SERVICESINDUSTRIAL PRODUCTS/MANUFACTURINGTRANSPORTATIONOTHER
17,9%
18,1%
9,1%
9,6%
28,5%
16,9%
19,0%
SMELARGE COMPANYRESEARCH INSTITUTEUNIVERSITYOTHER
16,2%
41,0%14,2%
3,5%
25,1%
*Eurostars projects only, as reported up to 3 years after project end.
PATENTS GRANTED 25,7%PATENTS APPLIED/PENDING 33,8%PATENTS RESEARCHED 1,4%NO ACTIVITY 39,2%
Energy & ENVIRONMENT
2.4
ENERGY & ENVIRONMENT in numbers

6564
EUREKA’s shaping and developing of global technological trends in the field of Energy & Environment is illustrated in the below timeline,which is based on concrete examples.
ENERGY & ENVIRONMENT project timeline

6766
1,200 projects funded
6,400 participating organisations
€3.5 billion public-private investment
The progress of energy and environmental technologies will be essential for finding sustainable solutions to humanity’s most pressing challenges, including a growing global population, climate change, depletion of natural resources, waste disposal, water and air pollution. Despite the well-known difficulties surrounding the propagation of GM food, innovation in the agricultural sector is fundamental to sustainably feed 9 billion people in 2050. Economic growth and changing consumption patterns will place increasing demands on the primary sector.
As the OECD recently underlined, technological innovation, while no panacea, continues to play a key role in addressing these challenges, and much progress has been made in recent decades.
Indeed, Europe is a world leader in environmental and energy technology, with more than two million people working in its eco-industries. Energy and environmental technologies in Europe account for about one third of the global market and are growing by around 5% a year. European companies are particularly strong in renewable power generation and waste management / recycling, where they have a global market share of 40% and 50% respectively .
Despite this, considerable uncertainties surround investment in energy and environmental technology, linked to fluctuations in the price of oil as well as a shifting regulatory landscape. The most efficient policy instruments are therefore “those which are able to reduce the market uncertainty, without second-guessing future market demand” . The bottom-up, market-driven approach of EUREKA helps to fill this gap.
Indeed, EUREKA has funded a significant number of projects in the areas of renewables and energy efficiency which contribute to the overall aims of CO2 emissions reduction and increasing the share of energy coming from renewable sources.
EUREKA’s energy Cluster EUROGIA+ has been the crux of sustainable energy research within the Network. The Cluster has scored particular successes in energy management and storage, including the ILIS project, which developed Europe’s first battery to store clean energy, paving the way for the use of renewable energy in grids. Following ILIS’ successful pilot, participating companies Acciona Energia and SAFT are talking to potential customers from all over the world, with high demand from the US.
The RENERSTA project, which started in 2010, aimed to design and test a fully modular autonomous and compact energy station using only renewable energies, integrating different existing energy sources and energy storages controlled by a single management system. The technology is now central to the success of French startup Powidian, which has attracted equity finance to support its growing business in autonomous energy solutions.
In terms of technological areas, EUREKA Network and Eurostars projects, have been dedicated primarily to developing Agricultural technology (16%), Environmental Technology (15%), Renewables (13%), and Waste Management (12%). Within the category of Agricultural Technology, nearly a third of projects involved animal husbandry, while half of the Environmental Technology projects have concerned water pollution or treatment.
The main market applications of EUREKA technological advancements have been in Renewable and Nuclear Energy (15%), Food & Beverages (13%), Pollution and Recycling (9%), and Utilities (7%).
Once again, focusing on Network Projects and Eurostars, photovoltaics and solar energy, as well as other renewable and alternative energies, and water pollution and treatment projects have seen a significant increase in funding since 2009. Investment between 2010-13 in running solar projects was worth €35 million, while investment in running energy efficiency projects recently climbed to €50 million.
36 European Environment Agency, “Energy and Environment in the European Union”, 2006 Labat, A., Kitous, A., Perry, M., Saveyn, B., Vandyck, T., and Vrontisi, Z. (2015). “GECO2015. Global Energy and Climate Outlook. Road to Paris”, JRC Scientific and Policy Reports, EUR 27239 EN.
37 European Commission Directorate General Environment , “Bridging the Valley of Death: public support for commercialisation of eco-innovation”, 2009
ENERGY & ENVIRONMENT FACTS

6968
resources of the sea, fisheries
renewable energysources
energy production, transmission
agricultural technology
energy efficiency
food quality & safetynutrition & health
energy & transport
technologies for the food industry
environment tech
waste management tech
manufacturing of building materials
other biotechnology / molecular tech
cultivation of cereals /crops / vegetables
utilities & related firms
renewable & nuclear energy
other energy
motor vehiclesequipment
viticulture
Fishing, sea food & farming
horticulture
energy conservation related
other construction& building products
animal husbandry
food &beverages
environment services
pollution & recycling
chemicals & materials
manufacturing
naval transport,ships, boats
batteries
The diagram shows the major technological areas (green) developed in EUREKA projects and their market applications (red). The thicker the line, the more projects represented by this connection. For Energy & Environment, Waste Management, Food and Renewables have been among the most common technological areas, while Renewable & Nuclear Energy, Pollution & Recycling and Food & Beverages are the most common markets. The diagram depicts EUREKA Network and Eurostars projects.
Figure 2-4 energy & environment Technological areas and market applications of EUREKA energy & environment projects

7170
METHODOLOGICAL NOTE3
EUREKA GLOBAL SUCCESS STORIES
The purpose of identifying EUREKA’s global Success Stories has been to locate those EUREKA projects that had a significant impact on European competitiveness and innovation capacity, while paying particular attention to EUREKA’s contribution to the development of Europe’s digital champions.
The methodological approach to identify EUREKA success stories was twofold:
In-depth desk research to identify major future technological trends and the projects which demonstrated significant scientific / innovation impact on the European technological and economic arena.
Contact with EUREKA NPCs (current and former), HLRs, Clusters and Umbrellas representatives, and several members of ESE to spot the global EUREKA success stories among the many EUREKA projects that have been funded over the 30 year lifespan of EUREKA. “Success” was understood to mean any project and/or an organisation which participated in a project that led to a major economic/technological development/breakthrough or caused significant socio-economic impact at European and global level. The selected projects representatives were contacted in person and personal interviews were held based on a semi-structured questionnaire, so as to identify the impacts and value-added of EUREKA in their technological and innovation achievements.
SOCIAL NETWORK GRAPHS
These graphs are used to illustrate the connections between projects in terms of technological and market area. The arrows in the graphs represent funded projects; the darker the arrow, the more projects it represents. The size of the bubbles indicate the number of projects funded in that technological and/or market area.
EUREKA uses technological area to define the technological innovation of a project, and market area to define its market application. Although a project may develop a technology with more than one market application, project officers (Network Projects) or participants (Eurostars) choose the single most appropriate technological and market for the project, at a one, two and three digit level (see Annex 1 of the pdf version of this report for the complete lists of market and technological areas).
The graphs depict EUREKA Network Projects since 2001 (projects were not previously tagged with technological and market area), and Eurostars projects since 2008. Clusters projects have not yet been tagged and therefore were not included in this analysis.
The graphs were developed with NodeXL, the open source network visualisation and analysis tool available as an add-on for MS Excel. The graphs’ layout has been designed with clarity in mind. In particular, for Industrial Technologies a filter has been applied to reduce the number of arrows (links between technological and market areas below a certain number of projects).

7372
INNOVATION IMPACT
Innovation has been explored using the definition provided in the Oslo Manual38 of OECD: “An innovation is the implementation of a new or significantly improved product (good or service), or process, a new marketing method, or a new organisational method in business practices, workplace organisation or external relations… An innovative firm is one that has implemented an innovation during the period under review”.
The underlying data for this section are drawn from Market Impact Reports for Network / Umbrella Projects (sent to participants 2 and 4 years after project end) and in some cases Eurostars projects (1 year). Where, due to inconsistencies between the reports, it was not possible to integrate the data from Eurostars and Network Projects, data from the latter has been used.
99% of EUREKA Network Projects Market Impact Report (MIR) data relates to projects approved in the period 2000-2010. For this period, 12.3% of organisations returned at least one MIR. For Eurostars projects, 37% of organisations returned a MIR.
The average return rate has been close to 20%. As with all survey data, results will be affected by (e.g. self-selection) bias.39 The results obtained in this section have therefore a descriptive purpose and are aimed at providing a first indication of EUREKA project results based on Market Impact Reports. It is worth noting that the bottom-up nature of EUREKA Network and Eurostars projects helps to avoid some of the problems of selection bias inherent with other, thematic funding instruments.
Indicators were calculated for each main technological area, which were formulated by merging more detailed project technological areas as follows40:
Main Technological area used in report 1-digit technological areas
Life Sciences & Medicine 6. Biological Sciences
ICT 1. Electronics, IT and Telecoms Technology
Industrial Technologies
2. Industrial Manufacturing, Material and Transport3. Other Industrial Technologies5. Chemistry, Physical and Exact Sciences9. Measurements and Standards
Energy & Environment
4. Energy Technology 7. Agriculture and Marine Resources8. Agrofood Technology 10. Technology for Protecting Man and the Environment
38 OECD/Eurostat (2005), Oslo Manual: Guidelines for Collecting and Interpreting Innovation Data, 3rd Edition, The Measurement of Scientific and Technological Activities, OECD Publishing, Paris
39 Ibid., p.7440 For more information on EUREKA Technological and Market areas, please see Annex 1 of the pdf version of this report
a. Innovation indicators
Technological innovation indicator = Number of participants reporting having achieved a new or improved product and/or process / Number of participants’ responses41
Information was drawn from EUREKA Network Projects and Eurostars projects.
Product innovation indicator = Number of participants reporting having achieved a new or improved product / Number of participants’ responses42
Information was drawn from EUREKA Network Projects only.
Process innovation indicator = Number of participants reporting having achieved a new or improved process / Number of participants’ responses43
Information was drawn from EUREKA Network Projects only.
Diffusion of Innovation Indicator = Number of participants reporting having accomplished good or excellent commercial impact because of their participation / Number of participants’ responses44. Information was drawn from EUREKA Network Projects only.
Data was cleaned to avoid double counting of 2 and 4-year MIRs for the same participant/project.
b. Patent citation analysis
A quantitative assessment of the innovation impact of EUREKA projects was made by patent citation analysis, based on matching EUREKA patent data to data retrieved from PATSTAT.
From the information contained in EUREKA’s Network Projects and Eurostars Final and Market Impact Reports databases, a total of about 1250 project participants were identified to have performed some form of patenting activity relevant to the topic of the EUREKA project to which they participated. Identification was based on combining information from the relevant variables present in the associated Reports.
Mining of EUREKA related patents in PATSTAT was based on the following information:
41 Market Impact report question: From the following list of possible achievements, please indicate by ticking the appropriate box(es) which were part of your initial objectives, which have been achieved and which are expected to be achieved within 2/4 years?)
42 Market Impact report question: From the following list of possible achievements, please indicate by ticking the appropriate box(es) which were part of your initial objectives, which have been achieved and which are expected to be achieved within 2/4 years?)
43 Market Impact report question: From the following list of possible achievements, please indicate by ticking the appropriate box(es) which were part of your initial objectives, which have been achieved and which are expected to be achieved within 2/4 years?)
44 Market Impact report Question: “Please rate your overall commercial achievements”) / Q’s overall technological area’s population
Participant data Address Country of origin
Project dataProject start / end dates (inferred where none available)
Final Report and Market Impact Report dates
Project title/description
reported technological area

7574
This information was matched with relevant PATSTAT fields, located in different parts (files) of the database with a variety of association/binding keys. PATSTAT fields searched included:
For this task existing text search/mining algorithms and custom made algorithms/routines built in R and Intel Fortran were used, operating iteratively on a word-by-word search and combining the findings.
Patent applications corresponding to EUREKA’s participants were identified. For smaller companies with focused R&D and fewer patent applications it was possible to identify the exact patents that correspond to their EUREKA participation. For participants with larger size (e.g. Blaupunkt, Thomson, Renault, BBC, EADS, etc.) a large number (family) of patents that are closely related to the topic of their EUREKA-funded R&D activity were identified and were included in the analysis with a weight assigned to correct for biases arising from their large number.
Having identified the set of patent applications that are associated with EUREKA participants and patent applicants within each technological area, the next step was to build a network describing associations between EUREKA and non-EUREKA related patents in PATSTAT according to:
• Time period• Cross-sectoral influences (spillovers)• Spatial dimension.
Associations were defined using patent citations.
Relevant information was extracted from PATSTAT and the required datasets for network analysis have been built. The analysis has produced average values for an Immediacy Index (IM), the Impact Factor (IF) and the 5-Year Impact Factor (IF5) for each technological area, defined as follows:
(1) Immediacy index (IM)
A measure of the immediate impact of a set of items (e.g. EUREKA and non-EUREKA -related patent applications). For a set of applications made at year i, it is defined as the average number of citations per item received within the same year. Formally,
Nij = Number of times patent applications from subpopulation j made at year i were cited at the same year i
Tij = Number of patent applications from subpopulation j made at year i
IMij = Immediacy Index (same year) of subpopulation j at year i
IMij = Nij / Tij
j = 1,2 (1 = EUREKA, 2 = non-EUREKA)
Person names Person IDs Country of origin
Patent application titles and ID’s
Date of application & publication
technological area (IPC codes).
(2) Impact Factor (IF): For a set of applications made at years i-1 and i-2, defined as the average number of citations per item received in year i.
For a set of applications made at years i-1 and i-2, it is defined as the average number of citations per item received in year i. Formally,
Nij = Number of times patent applications from subpopulation j made at years i-1 and i-2 were cited at year i
Tij = Number of patent applications from subpopulation j made at years i-1 and i-2
IFij = Impact Factor of subpopulation j at year i
IFij = Nij / Tij
j = 1,2 (1 = EUREKA, 2 = non-EUREKA)
(3) 5-year Impact Factor (IF-5): Defined as (2) with the basis of calculations the set of applications made at years i-1 to i-5
Values were computed for each year from 1985 (start year of the EUREKA programme) to 2014, for the main technological areas - Life Sciences, Industrial Manufacturing, Energy/Environment and ICT), for EUREKA and non-EUREKA related patents. The analysis generated a time series that allowed for a comparison of their impact within each technological area. As the main focus is on Europe, the analysis was restricted to cited patents originating from Europe.
It is important to note factors which may have impacted the level and timing of the patenting activity (applications and/or citations) analysed in this study:
The global financial crisis (2007-8) and subsequent Eurozone crisis , which had a negative impact on the total number of patent applications
The time lag between the filing and the granting of a patent (According to EPO, the average time between the filing of a patent and its publication is around 3,5 years),
Administrative burdens and the costs associated with filing a patent until the advent of the European patent
The time required for patents to build citations
The timing of the patent publication, as patents published in the beginning of a calendar year have more chances of being cited in the same year
c. Knowledge spillovers
The temporal order and number of links between patents produced by EUREKA projects and other non-EUREKA originated patents were analysed. Network metrics were computed that allow for the comparative assessment of non-EUREKA and EUREKA-associated patents’ impact within and between broad technological areas over time. To compare the impact of EUREKA-related patenting activity with other European patenting activity in each of the four technological areas under review, the metrics computed in the Patents Analysis (IM, IF, IF5) were computed again using the PATSTAT network, restricted to cited patents that originate from Europe only. Spillovers from each technological area to the other three technological areas were measured by the citations that patents in the former area have received from patents in the latter three.

7776
GLOSSARY2
CLUSTERS
Initiated by European industry, EUREKA
Clusters are long-term and strategically
significant initiatives that develop
technologies of key importance for European
competitiveness. Addressing the needs of
both large companies and SMEs, they are the
engine for industrial innovation and economic
growth. There are currently seven EUREKA
Clusters: ACQUEAU, CATRENE , Celtic-Plus,
EUROGIA2020, EURIPIDES², ITEA 3, Metallurgy
Europe
EUROSTARS
Eurostars supports international innovative
projects led by research and development-
performing small- and medium-sized
enterprises (R&D-performing SMEs).
Eurostars is a joint programme between
EUREKA and the European Commission,
co-funded from the national budgets of 34
Eurostars Participating States and Partner
Countries and by the European Union through
Horizon 2020. In the 2014-2020 period it has a
total public budget of €1.14 billion
EUREKA NETWORK
EUREKA is a publicly-funded,
intergovernmental network, involving over
40 countries. EUREKA’s aim is to enhance
European competitiveness by fostering
innovation-driven entrepreneurship in Europe,
between small and large industry, research
institutes and universities. By doing this,
EUREKA concentrates the existing potential of
experts, of knowledge, research facilities and
financial resources in a more efficient way.
FINAL REPORTS (FIRS)
A form sent to all participants of Network
Projects and Eurostars within six months of
project completion has been completed. The
form contains questions aimed at monitoring
participants development and evaluating
the impact of project participation, in terms
of a range of inputs, activities, outputs and
outcomes. Currently different versions are
sent out to participants in Eurostars and
Network Projects.
MARKET IMPACT REPORTS (MIRS)
Sent to Network Projects participants 2 and
4 years after project end, and Eurostars
participants 1 and 3 years after project end.
Similar to Final Reports but with an emphasis
on commercialisation of project results. This
report focuses on data from MIRs in order to
assess patent and other impacts some time
after project end. Currently different versions
are sent out to participants in Eurostars and
Network Projects.
NETWORK PROJECTS
Formerly known as EUREKA Individual projects,
Network Projects are transnational, market-
driven innovative research and development
projects. Projects supported by the public
administrations and public funding agencies that
represent EUREKA in each of its 40+ member
countries. Network Projects are market-driven
international R&D projects, aiming to develop
marketable products, services or processes. To
set up a EUREKA Network Project there must be
at least two partners from two different EUREKA
countries
UMBRELLAS
Umbrellas are thematic networks within
EUREKA which focus on a specific technology
area. The main goal of an umbrella is to facilitate
the generation of EUREKA Network or Eurostars
projects in its own target area. Umbrella
activities are coordinated and implemented
by a working group consisting of EUREKA
representatives and industrial experts.

78 79
AuthorsThe report was coordinated by ViLabs and elaborated in collaboration with InterInnov and SYSTASI Consulting as well as individual experts from the fields of impacts evaluation (Prof. N. Vonortas) and data mining (Prof. C. Emmanouilides).
AcknowledgementsThe authors would like to thank all the individuals from within and beyond the EUREKA network for their contributions to this study, and in particular those who answered questions for the section “Global Success Stories”.
Data and other annexes are available upon request.

80