forest wood consumption and wood shortage in pakistan
TRANSCRIPT
© The Pakistan Development Review
57:1 (2018) pp. 73–98
Forest Wood Consumption and Wood Shortage
in Pakistan: Estimation and Projection
through System Dynamics
NAILA NAZIR, LAURA SCHMITT OLABISI, and SALMAN AHMAD*
Consumption rates of major forest products such as timber and firewood, place
significant strain on wood stock and forest area in Pakistan. With the country’s rising
population, the consumption of these two major products is increasing because of the growing
energy demand, and no alternative products are likely to replace wood consumption in the near
future. We apply system dynamics modelling to an analysis of the forestry sector in Pakistan
for novel insights into the drivers and future trajectories of wood consumption. The present
research is based on time series macroeconomic data from 1990-2010 and projections to 2040
of wood supply, forest area, population growth, wood extraction, wood imports and different
uses of wood in the country. The study reveals that there is no significant increase in area
under forest, while consumption of firewood and timber has increased. The consumption of
firewood is greater than timber consumption in Pakistan, both in percentage share and in total
volume of wood consumption. The sustainable supply of wood is less than wood consumption,
and with population growth this gap is increasing; wood supply from agricultural lands is a
viable option to fill the gap.
Keywords: Wood Consumption, Sustainable Wood Supply, Projected Wood
Shortage
I. INTRODUCTION
The forestry sector’s contribution to Gross Domestic Product (GDP) in Pakistan
was 1.2 percent in 1990, decreasing to 0.6 percent in 2011 [FBS (2014)]. If farmland
forestry products are included, the forestry share would increase to 1.58 percent to the
GDP. The forestry business generates revenue that is equivalent to 10 percent of the
country’s exports [FAO (2009a); FAO (2014a)].
In a country where the forest area is very low and deforestation rate is high, it is
imperative to look into the forest wood resource supply and consumption. There is a
consensus that high population growth, over-exploitation of wood resources, over-
grazing and poor land-use management are the main causes of deforestation [Ouerghi
(1993); NIPS (2009); Mather and Needle (2000); Qasim, et al. (2013)]. In developing
countries, wood energy represents approximately 15 percent of the total primary energy
Naila Nazir <[email protected]> is Associate Professor, Department of Economics, University of
Peshawar, Peshawar. Laura Schmitt Olabisi <[email protected]> is Assistant Professor, Department of
Community Sustainability Environmental Science and Policy Programme, Michigan State University, USA.
Salman Ahmad <[email protected]> is Faculty of Business, Dubai Men’s College, Higher College of Technology, United Arab Emirates.
74 Nazir, Olabisi, and Ahmad
consumption [Trossero (2002)]. The share of Pakistan’s consumption of conventional
wood and biomass energy, as a portion of the total energy in 1993-94 was 46 percent
[FAO (1997b)]. The FAO (2009a) estimated that the share of wood energy as a portion of
rural energy consumption in the country is 37.52 percent. Despite a high level of
dependence on wood biomass, there is no data or insufficient data for wood supply and
consumption in Pakistan [Nazir (2009)]. This presents a barrier to natural resource
planning [FAO (1997a)]. Information regarding the use of fuel wood and traditional fuels
was mainly based on rough estimates, until the Household Energy Strategy Study (HESS)
was undertaken [Ouerghi (1993)]. Khalil (2000) also pointed out that in Pakistan the
major constraints in environmental resource valuation are irregular and unsystematic data
collection across authorities, responsible for data collection; the absence of complete sets
of data and absence of data adequately describing the multi-disciplinary environmental
and cross resource issues. The values of total consumption of wood in Pakistan are based
on per capita wood consumption [see for example, Pakistan (2005); Mathtech (1988);
Sheikh (1990); FAO (2009a); Clark (1990)]. Some studies consider sources of wood
supply in the country, but lack time series data on the volume of wood supplied by each
source [Clark (1990); Pakistan (2005, 2010)].
There is a need to add data and analysis to the on-going efforts to construct data
sets for natural resources in Pakistan. Estimating and forecasting domestic wood
consumption is also important to check the patterns, prices of wood and import of wood
products. The present research is one such effort that focuses on estimating and
projecting few key variables related to wood consumption, wood supply and sustainable
wood supply in the country.
Economic and environmental management uses several different tools for
estimation and analysis. Different modelling techniques are used to address natural
resource issues, for example, Geospatial techniques [Bhalli, et al. (2012)]; Spatial explicit
models, Aspatial models [Seto and Kaufmann (2003)]; Multi-agent systems models
[Parker, et al. (2003)]; Stochastic models and Behavioural models [Irwin and Geoghegan
(2001)]. Simulation or mathematical modelling is an important tool for interaction
between economic and environmental fields [Khalil (2000)]. However, dynamical models
are more useful as these consider temporal lags and nonlinearities; have strong interface
for scenario testing [Agarwal, et al. (2002); Olabisi (2010)]; cover all the affecting forces
[Yu, et al. (2011)] and consider feedbacks in a system [Veldkamp and Lambinb (2001)].
System dynamics methodology considers dynamic behaviour of the components in a
system [Sterman (2000); Musango, et al. (2012)]. Computer based System Models are
developed by constructing stocks and flows of information, material or data as sets of
differential equations, linked through intermediary functions and data structures [Gilbert
and Troitzsch (1999)]. Time is broken into discrete steps to allow feedback. Human and
ecological interactions can be represented within these models, depending on the causes
and functional representation [Baker (1989)].
System dynamics is a new approach in Pakistan for analysing wood consumption
in the country. Using this methodology, the present study is designed to address the
question: What is the sustainable wood supply gap (consumption minus sustainable
production) in Pakistan? The main aim of this study is to build a system model for the
forestry sector that covers wood products; timber and firewood; wood stock availability;

Forest Wood Consumption and Wood Shortage 75
forest area; sources of wood supply; population growth and consumption of wood. The
objective of the study is to discuss the changing trends of timber and fuel wood supply
from State forests, farmlands and from imports. It also aims at discussing the use of wood
for household, for industries and for commercial sectors. The gap between wood
consumption and wood supply for Pakistan would be estimated over time. A policy
option of doubling the growth of wood supply from farmlands would be considered to
check wood consumption and sustainable wood supply gap.
This model would be a reference model for estimating and projecting wood
resources in a country, using Pakistan as a case study. The contribution of the present
study is the development of a methodology which may be helpful in conducting research
around natural resource extraction, when there are data gaps.
II. FOREST AREA AND DEFORESTATION IN PAKISTAN
Humanity’s Ecological Footprint is spread across six land use categories: cropland,
grazing land, fishing grounds, built-up area, land for carbon absorption and forests
[Kitzes, et al. (2007)]. The global forest area is approximately 4 billion hectares; about 7
percent of this is planted forests [FAO (2014a)]. Pakistan has 4.5 million ha. forest area
(5.1 percent of the land area). The per capita forest area of 0.03 hectares is well below
the world’s average of 1 hectare [Bukhari, Haider and Laeeq (2012); PFI (2004)], and
this amount is further decreasing with the growth of population. According to EUAD
(1992), deforestation was 0.2 percent (7,000 to 9,000 ha per annum) in the 1980s. Conifer
forests have been declining at the rate of 1.27 percent per annum since 1992 [Pakistan
(1992); Ahmad, et al. (2012)]. The FAO (2009a) reported deforestation of 39,000 ha per
year in the 1990s in Pakistan. According to FBS (2010), Pakistan’s annual deforestation
rate in 1999-2000 was between 1.8 percent, and was 2.1 percent during 2000-2005.
Studies support the argument that deforestation in the Himalayan region is caused by
increasing the human population [Eckholm (1975, 1976); Sterling (1976); Lall and
Moddie (1981); Myers (1986)]. The IUCN (2002) has estimated that with the on-going
rate of population growth, wood consumption in Pakistan would increase by 3 percent per
year. Some studies indicate that rural fuel wood requirements do not seem to be a major
cause of deforestation in designated forest lands in Pakistan [Ravindranath and Hall
(1995)] while some other studies show that one of the main reasons for deforestation is
timber and firewood harvesting in the country [FAO (1997c); Sheikh and Hafeez (1977);
Knudsen (1995); Ali (1999)]. In the Western Himalayan region, in the Northern Areas
(NAs) of Pakistan fuel wood consumption by local people is one of the causes of
deforestation [Ali and Benjaminsen (2004)]. However, in forest-rich Northern Areas
(NA) of Pakistan, population growth is slow. Ali and Benjaminsen (2004) attribute forest
cutting in this region to the presence of timber smugglers [Yusufzai (1992)], who take the
fallen wood and dead wood which was previously collected by locals as fuel wood, thus
leaving the local people to harvest wood from public forests. In other words, commercial
harvesting and corruption contribute to deforestation. The construction of the Karakorum
Highway (KKH), linking Pakistan with China, is also contributing to deforestation
[Schickhoff (1995); Ali and Benjaminsen (2004)]. Some studies are showing population
growth as the prime threat to forests [Lodha (1991); Pati1 (1992); Dijk and Maliha
(1994); Ahmad (1994); IUCN (1998); Payr (1999)] while others argue that blaming
76 Nazir, Olabisi, and Ahmad
population growth is sometimes considered an over simplification of the complex
problem of resource management. Other factors, like government policy on infrastructure
development, including the forest clearance for other land use and increasing cash crop
production are important causes [Nazir (2009); Ali (2004); Ali, et al. (2006); Wannitikul
(2005); Write and Muller (2006); White and Dean (2004); Burgi, et al. (2000)].
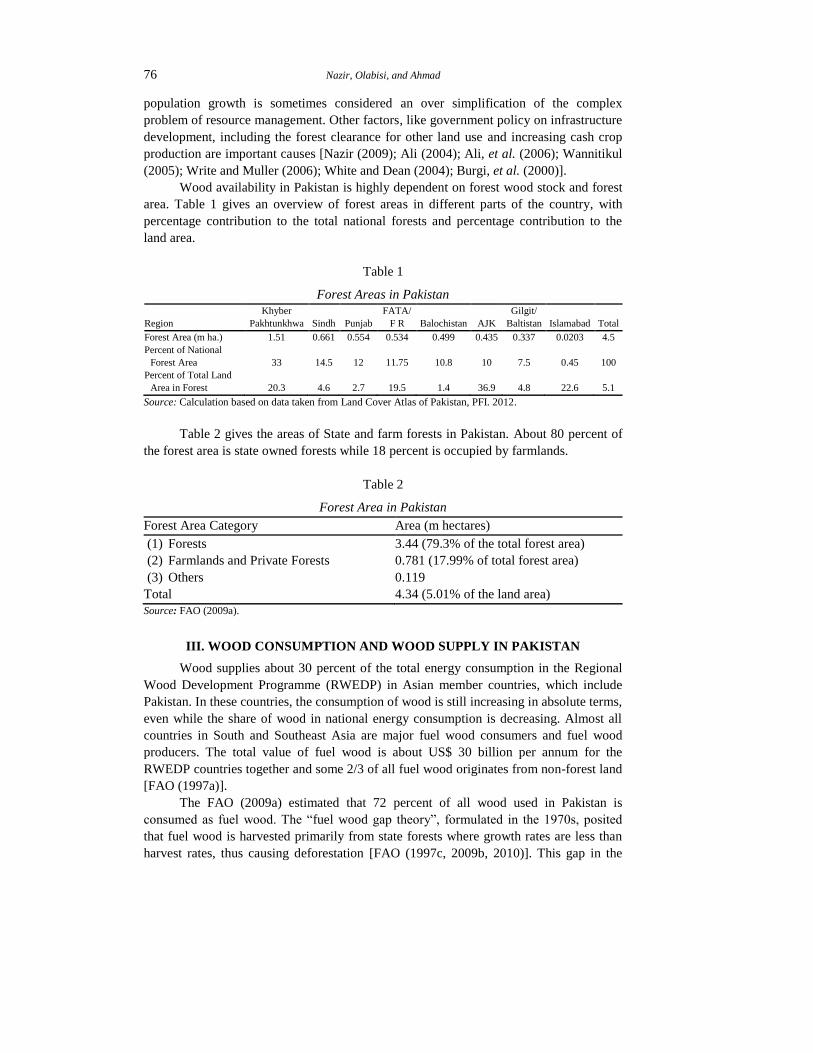
Wood availability in Pakistan is highly dependent on forest wood stock and forest
area. Table 1 gives an overview of forest areas in different parts of the country, with
percentage contribution to the total national forests and percentage contribution to the
land area.
Table 1
Forest Areas in Pakistan
Region
Khyber
Pakhtunkhwa Sindh Punjab
FATA/
F R Balochistan AJK
Gilgit/
Baltistan Islamabad Total
Forest Area (m ha.) 1.51 0.661 0.554 0.534 0.499 0.435 0.337 0.0203 4.5
Percent of National
Forest Area 33 14.5 12 11.75 10.8 10 7.5 0.45 100
Percent of Total Land
Area in Forest 20.3 4.6 2.7 19.5 1.4 36.9 4.8 22.6 5.1
Source: Calculation based on data taken from Land Cover Atlas of Pakistan, PFI. 2012.
Table 2 gives the areas of State and farm forests in Pakistan. About 80 percent of
the forest area is state owned forests while 18 percent is occupied by farmlands.
Table 2
Forest Area in Pakistan
Forest Area Category Area (m hectares)
(1) Forests 3.44 (79.3% of the total forest area)
(2) Farmlands and Private Forests 0.781 (17.99% of total forest area)
(3) Others 0.119
Total 4.34 (5.01% of the land area)
Source: FAO (2009a).
III. WOOD CONSUMPTION AND WOOD SUPPLY IN PAKISTAN
Wood supplies about 30 percent of the total energy consumption in the Regional
Wood Development Programme (RWEDP) in Asian member countries, which include
Pakistan. In these countries, the consumption of wood is still increasing in absolute terms,
even while the share of wood in national energy consumption is decreasing. Almost all
countries in South and Southeast Asia are major fuel wood consumers and fuel wood
producers. The total value of fuel wood is about US$ 30 billion per annum for the
RWEDP countries together and some 2/3 of all fuel wood originates from non-forest land
[FAO (1997a)].
The FAO (2009a) estimated that 72 percent of all wood used in Pakistan is
consumed as fuel wood. The “fuel wood gap theory”, formulated in the 1970s, posited
that fuel wood is harvested primarily from state forests where growth rates are less than
harvest rates, thus causing deforestation [FAO (1997c, 2009b, 2010)]. This gap in the
Forest Wood Consumption and Wood Shortage 77
past was being used by policy makers as justification for investment in forests. But
current data indicates that about 60 percent of the global fuel wood is coming from non-
forest areas and these sources are enough to bridge the gap between production and
consumption [FAO (1997c)]. In Pakistan in 1991, out of a total of 29.4 million tons of
wood consumed, 12.6 percent was from state owned forests and 84.1 percent from other
lands, while 3.3 percent was from unknown sources [FAO (1997b)]. Driving forces of
fuel wood consumption are household size; urbanisation and income level; and non-
availability of alternate energy sources. In Pakistan, households that have a size of 16 or
higher consume 2.17 times more than household with fewer than 5 persons [Ouerghi
(1993)].
Pakistan’s consumption of fuel wood was estimated at 26 million m3
in 1992,
increasing to 31.52 million m3
in 2003. The consumption of fuel wood in the commercial
sector was estimated at 1.047 million m3 [FAO (2009a)]. The household sector is the
largest consumer of wood with 79 percent to 81.8 percent [Hafeez (2000); Siddiqui
(2000)], followed by the industrial sector at 14.9 percent and the commercial sector at 3.3
percent. The annual wood consumption in Pakistan was estimated 43.761 million cubic
meters in 2003 compared to the annual forest growth of 14.4 million cubic meters,
estimated in Forestry Sector Master Plan 1992. So, there is a gap of 29.361 million cubic
meters per annum between production and consumption [UNDP-PK-ECC (undated);
Pakistan (2005)]. Consumption of fuel wood is highly price-inelastic in Pakistan [Burney
and Akhtar (1990)].
Mathtech (1988) used per capita (0.04 m3)
annual fuel wood requirement and
estimated fuel wood consumption at 56 m3
per year per person for 2008. An area equal to
2.8 million hectares would be required to provide that volume of fuel wood for the
population. This may lead to a conversion of 14 percent of cultivated area to wood
plantations. Sheikh (1990) also used per capita wood consumption and estimated 30
million m3 total consumption for the year 2000. Both studies assumed constant population
growth rate and constant per capita consumption. Similarly, consumption values are used
to estimate timber supply from private lands. The volume of wood supplied by private
lands is generated by subtracting the state and import supply from the total consumption
[Amjad and Khan (1988); Sheikh (1990); Clark (1990)].
There are three sources of wood supply in Pakistan: State forests, private
farmlands and imports. State controlled forests supply only 10 percent of the fuel wood
and farmlands are estimated to produce 50 percent of the timber and 90 percent of the
firewood used in the country. Timber and firewood production from State forests was
0.371 million m3
and 0.32 million m3
respectively in 1992, declining to 63 percent and 80
percent in 2009-10. This decline was mainly attributed to the wood harvesting ban
implemented in 1993 [Fischer (2010)]. Amjad and Khan (1988) estimated the farm
timber availability by taking estimated per capita timber consumption of 0.0239 m3 per
capita and multiplying it by the population to arrive at national consumption. This total
consumption is then subtracted from public sector production and imports. Assuming the
fixed household consumption rate, the figure for timber supplied from farmlands may be
1.2 million m3 per year. This is 51 percent of the total timber production.
During 1990’s, Pakistan’s North-West Frontier Province (presently called Khyber
Pakhtunkhwa) was leading in timber production with 49 percent, followed by Azad

78 Nazir, Olabisi, and Ahmad
Kashmir 20 percent, Sindh 15 percent, Punjab 11 percent and Northern Areas 5 percent.
Fuel wood was coming from Punjab at 53 percent, Sindh 34 percent, NWFP (present KP)
8 percent, Northern Areas 3 percent and Balochistan 2 percent and with negligible
production from Kashmir [Clark (1990)].
Imports were supplying about 36 percent of the total wood used in Pakistan during
the 1990’s. Malaysia is the main supplier of wood to Pakistan. Imports of wood have
decreased in volume, as prices have increased [Clark (1990)]. Out of the total imports,
about 10 percent of the volume and 6 percent of the value is timber wood. About 91
percent of the value is pulp, paper and paperboard; the import of which has increased
since 1975 [Amjad and Khan (1988)]. The imports of wood in monetary terms increased
during 1992–2003 (Table 5), at an average annual increase of 0.95 percent. They
accounted for 1.92 percent of the total imports of the country. Exports have shown an
increasing trend from1992-1993 to 2002-2003 with a per annum average growth rate of
1.78 percent. Out of the total exports, sports goods exports make up 92 percent, followed
by furniture at 4.8 percent [FAO (2009a); UNDP-PK-ECC (2010)].
According to the Wood Supply and Demand Survey, the consumption of wood in
Pakistan is expected to increase to 58 million m³ by the year 2018. The wood shortage of
29.361 million m³ assumes a constant forest growth of 14.4 million m³ from state forests
since 1992 [UNDP- PK-ECC (2010)]. The level of sustainable supply is below the actual
consumption. The difference between the sustainable supply and the level of
consumption would be considered as the annual depletion rate. It is therefore crucial to
carry out an in-depth analysis of wood consumption and the sustainable production of
wood, as well as the dynamics of these processes [Ouerghi (1993)].
IV. SYSTEMS DYNAMIC METHODOLOGY FOR ESTIMATING WOOD
SUPPLY AND WOOD CONSUMPTION
To develop systems’ methodology, a procedure has been followed: first, by
developing a conceptual model (section a); designing Stella built model (section b) and
the model validation (section c). After that, the results have been described with
discussion and policy implications.
A conceptual diagram (Fig. 1) has been built to show the relationship among
variables. These variables are: wood consumption and driving forces of wood
consumption; wood supply and sources of wood supply and wood supply consumption
gap. Based on Fig. (1), a Systems Model (Fig. 2) has been developed by taking key
stocks and flows, namely: forest area, wood stock and population growth. The model is
structured by designing five frames, Population; Wood yield; Forest area; sources of
wood supply and Wood consumption to show interlinkages among the variables. After
model development, the model validation is done. Validation is a process of building
confidence in the usefulness of a model [Forrester and Senge (1980)]. Forrester (1968)
mentioned that one cannot expect absolute validity of a model but should remember that
models are developed for a purpose. He further emphasised that the model can be valid
for the purpose for which it has been designed but may not be valid for some other
purposes. Therefore, models may not be proved valid but may be judged as valid [Barlas
and Carpenter (1990)]. The features of model validation contain its “structure” and its
“behaviour” [Lane (1998); Barlas (1996); Forrester and Senge (1980)]. Barlas (1989)
Forest Wood Consumption and Wood Shortage 79
highlighted some tests for validating systems’ model behaviour, including comparing the
trend and comparing the periods. The present study is based on trend analysis by taking
past and projected periods. Two key variables, the population growth and wood
consumption have been selected for our model validation. There are two reasons to select
these variables, first, the problem of historic and projected data availability from official
sources for rest of the variables and second, these two variables have given information
and help to estimate model data on other variables, for example, wood supply from
different sources (see section e. frame five). Therefore, if the source variable (wood
consumption) and key driving force variable (population growth) is validated, the rest of
the results would be confidently used for projection.
(a) Model Description
The conceptual diagram is as follows (Fig.1):
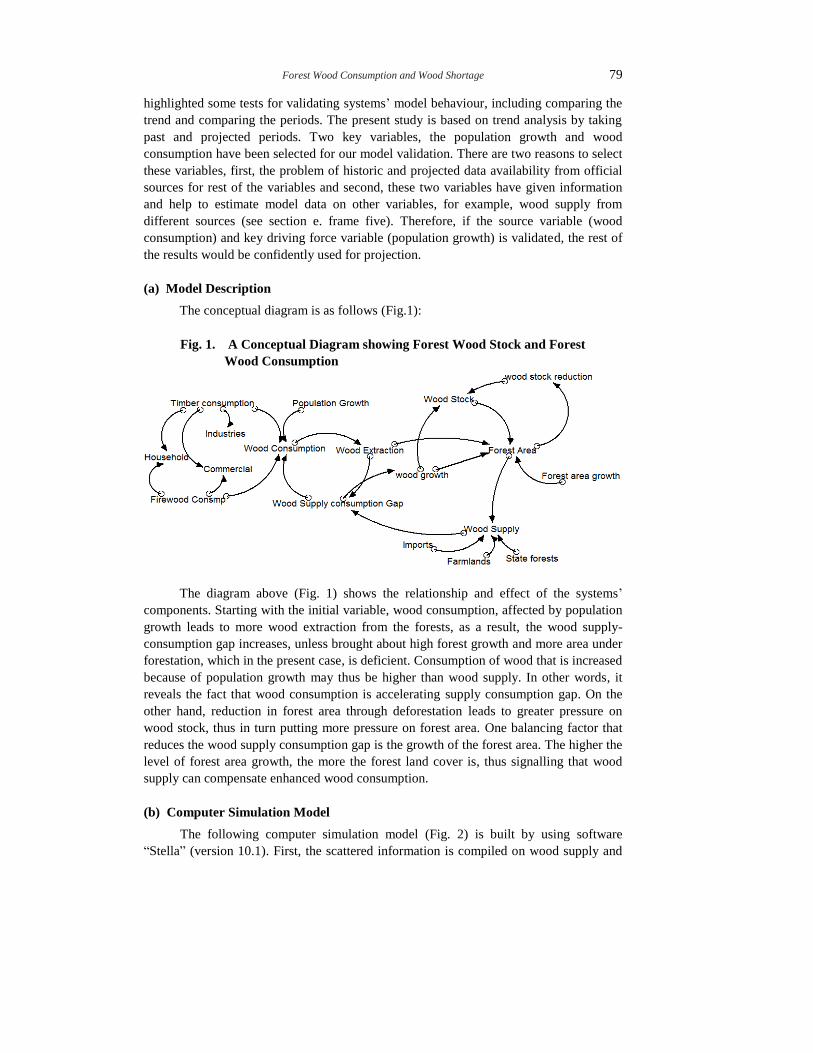
Fig. 1. A Conceptual Diagram showing Forest Wood Stock and Forest
Wood Consumption
The diagram above (Fig. 1) shows the relationship and effect of the systems’
components. Starting with the initial variable, wood consumption, affected by population
growth leads to more wood extraction from the forests, as a result, the wood supply-
consumption gap increases, unless brought about high forest growth and more area under
forestation, which in the present case, is deficient. Consumption of wood that is increased
because of population growth may thus be higher than wood supply. In other words, it
reveals the fact that wood consumption is accelerating supply consumption gap. On the
other hand, reduction in forest area through deforestation leads to greater pressure on
wood stock, thus in turn putting more pressure on forest area. One balancing factor that
reduces the wood supply consumption gap is the growth of the forest area. The higher the
level of forest area growth, the more the forest land cover is, thus signalling that wood
supply can compensate enhanced wood consumption.
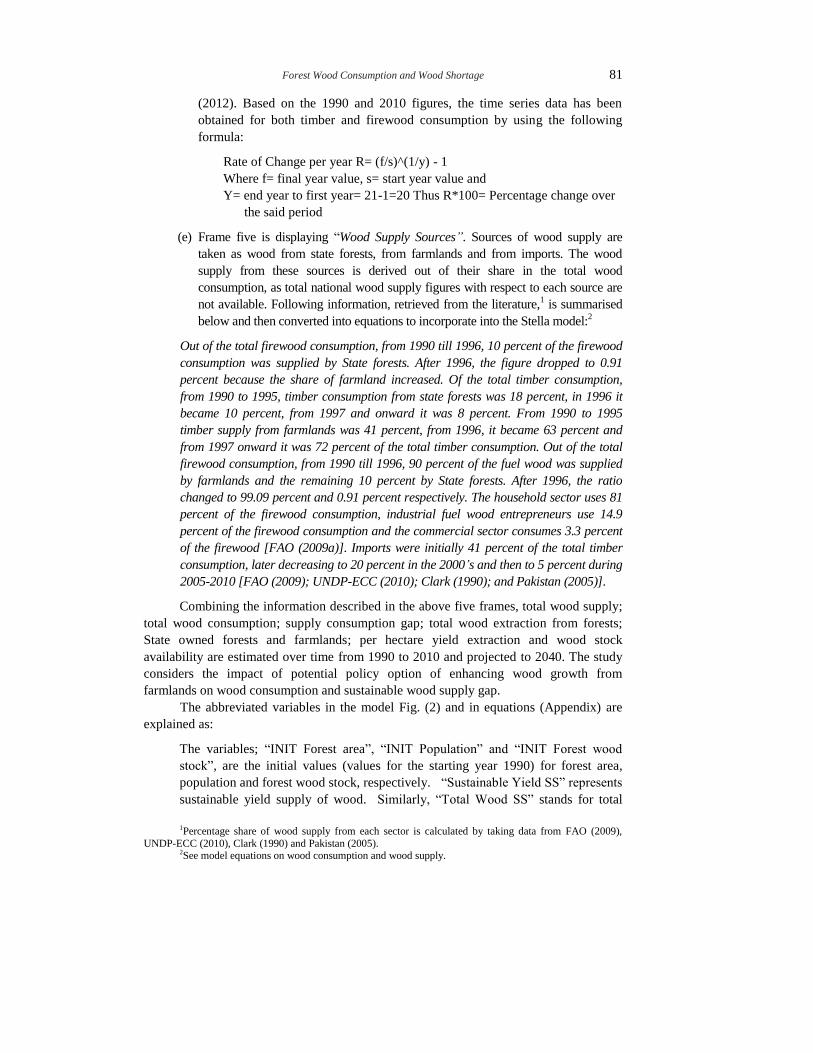
(b) Computer Simulation Model
The following computer simulation model (Fig. 2) is built by using software
“Stella” (version 10.1). First, the scattered information is compiled on wood supply and
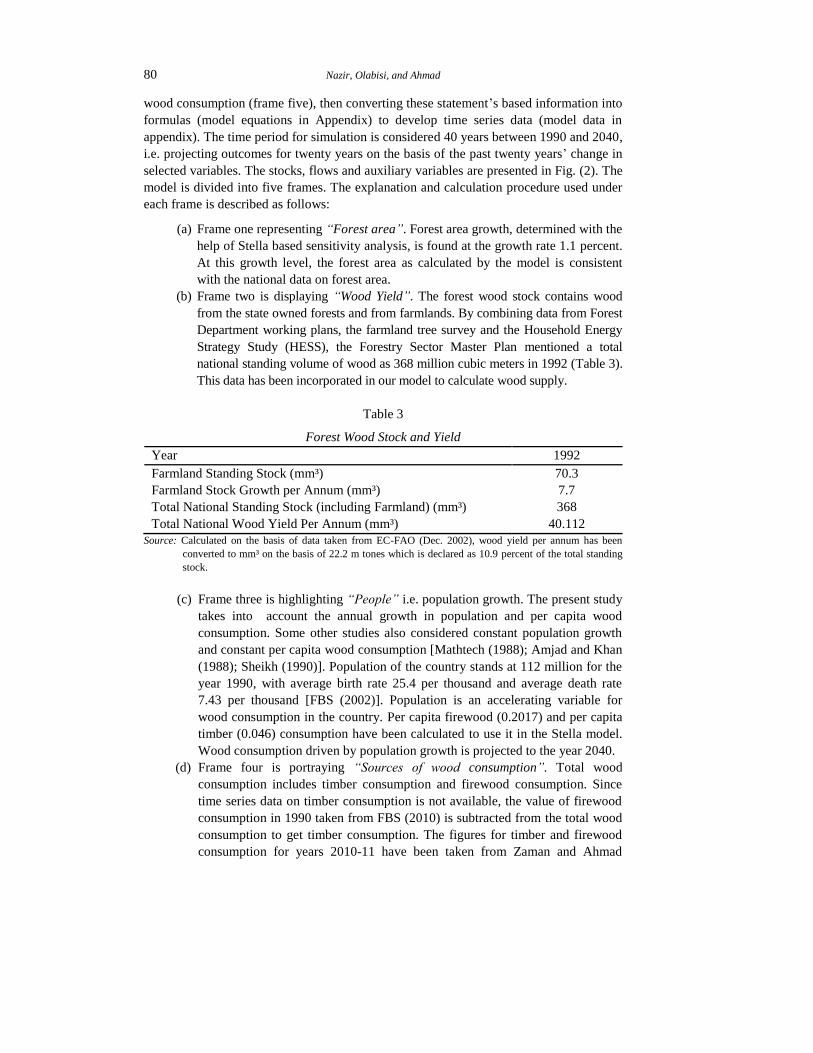
80 Nazir, Olabisi, and Ahmad
wood consumption (frame five), then converting these statement’s based information into
formulas (model equations in Appendix) to develop time series data (model data in
appendix). The time period for simulation is considered 40 years between 1990 and 2040,
i.e. projecting outcomes for twenty years on the basis of the past twenty years’ change in
selected variables. The stocks, flows and auxiliary variables are presented in Fig. (2). The
model is divided into five frames. The explanation and calculation procedure used under
each frame is described as follows:
(a) Frame one representing “Forest area”. Forest area growth, determined with the
help of Stella based sensitivity analysis, is found at the growth rate 1.1 percent.
At this growth level, the forest area as calculated by the model is consistent
with the national data on forest area.
(b) Frame two is displaying “Wood Yield”. The forest wood stock contains wood
from the state owned forests and from farmlands. By combining data from Forest
Department working plans, the farmland tree survey and the Household Energy
Strategy Study (HESS), the Forestry Sector Master Plan mentioned a total
national standing volume of wood as 368 million cubic meters in 1992 (Table 3).
This data has been incorporated in our model to calculate wood supply.
Table 3
Forest Wood Stock and Yield
Year 1992
Farmland Standing Stock (mm³) 70.3
Farmland Stock Growth per Annum (mm³) 7.7
Total National Standing Stock (including Farmland) (mm³) 368
Total National Wood Yield Per Annum (mm³) 40.112
Source: Calculated on the basis of data taken from EC-FAO (Dec. 2002), wood yield per annum has been
converted to mm³ on the basis of 22.2 m tones which is declared as 10.9 percent of the total standing
stock.
(c) Frame three is highlighting “People” i.e. population growth. The present study
takes into account the annual growth in population and per capita wood
consumption. Some other studies also considered constant population growth
and constant per capita wood consumption [Mathtech (1988); Amjad and Khan
(1988); Sheikh (1990)]. Population of the country stands at 112 million for the
year 1990, with average birth rate 25.4 per thousand and average death rate
7.43 per thousand [FBS (2002)]. Population is an accelerating variable for
wood consumption in the country. Per capita firewood (0.2017) and per capita
timber (0.046) consumption have been calculated to use it in the Stella model.
Wood consumption driven by population growth is projected to the year 2040.
(d) Frame four is portraying “Sources of wood consumption”. Total wood
consumption includes timber consumption and firewood consumption. Since
time series data on timber consumption is not available, the value of firewood
consumption in 1990 taken from FBS (2010) is subtracted from the total wood
consumption to get timber consumption. The figures for timber and firewood
consumption for years 2010-11 have been taken from Zaman and Ahmad
Forest Wood Consumption and Wood Shortage 81
(2012). Based on the 1990 and 2010 figures, the time series data has been
obtained for both timber and firewood consumption by using the following
formula:
Rate of Change per year R= (f/s)^(1/y) - 1
Where f= final year value, s= start year value and
Y= end year to first year= 21-1=20 Thus R*100= Percentage change over
the said period
(e) Frame five is displaying “Wood Supply Sources”. Sources of wood supply are
taken as wood from state forests, from farmlands and from imports. The wood
supply from these sources is derived out of their share in the total wood
consumption, as total national wood supply figures with respect to each source are
not available. Following information, retrieved from the literature,1 is summarised
below and then converted into equations to incorporate into the Stella model:2
Out of the total firewood consumption, from 1990 till 1996, 10 percent of the firewood
consumption was supplied by State forests. After 1996, the figure dropped to 0.91
percent because the share of farmland increased. Of the total timber consumption,
from 1990 to 1995, timber consumption from state forests was 18 percent, in 1996 it
became 10 percent, from 1997 and onward it was 8 percent. From 1990 to 1995
timber supply from farmlands was 41 percent, from 1996, it became 63 percent and
from 1997 onward it was 72 percent of the total timber consumption. Out of the total
firewood consumption, from 1990 till 1996, 90 percent of the fuel wood was supplied
by farmlands and the remaining 10 percent by State forests. After 1996, the ratio
changed to 99.09 percent and 0.91 percent respectively. The household sector uses 81
percent of the firewood consumption, industrial fuel wood entrepreneurs use 14.9
percent of the firewood consumption and the commercial sector consumes 3.3 percent
of the firewood [FAO (2009a)]. Imports were initially 41 percent of the total timber
consumption, later decreasing to 20 percent in the 2000’s and then to 5 percent during
2005-2010 [FAO (2009); UNDP-ECC (2010); Clark (1990); and Pakistan (2005)].
Combining the information described in the above five frames, total wood supply;
total wood consumption; supply consumption gap; total wood extraction from forests;
State owned forests and farmlands; per hectare yield extraction and wood stock
availability are estimated over time from 1990 to 2010 and projected to 2040. The study
considers the impact of potential policy option of enhancing wood growth from
farmlands on wood consumption and sustainable wood supply gap.
The abbreviated variables in the model Fig. (2) and in equations (Appendix) are
explained as:
The variables; “INIT Forest area”, “INIT Population” and “INIT Forest wood
stock”, are the initial values (values for the starting year 1990) for forest area,
population and forest wood stock, respectively. “Sustainable Yield SS” represents
sustainable yield supply of wood. Similarly, “Total Wood SS” stands for total
1Percentage share of wood supply from each sector is calculated by taking data from FAO (2009),
UNDP-ECC (2010), Clark (1990) and Pakistan (2005). 2See model equations on wood consumption and wood supply.
82 Nazir, Olabisi, and Ahmad
wood supply. “Wood SS from state forests” and “Wood SS from Farmlands”
represent data on wood supply from State Forests and from Farmlands. “Wood CC
and Sustainable Gap” stands for gap between wood consumption and sustainable
wood production. “Timber Fraction” is the percentage share of imported wood in
the total wood consumption with respect to time. “Timber SS from State Forests”
and Timber SS from Farmlands” represent variables for timber supply from State
Forests and from Farmlands, respectively. Similarly, “Firewood SS from State
Forests” and Firewood SS from Farmlands” represent data on firewood supply
from State Forests and from Farmlands, respectively. Three other variables; “for
industries”, “for household” and ‘for commercial use” display data on firewood
consumption for these three areas.
Fig. 2. Systems Model Showing Sources of Wood Supply and Forest
Wood Consumption in the Country
Forest Wood Consumption and Wood Shortage 83
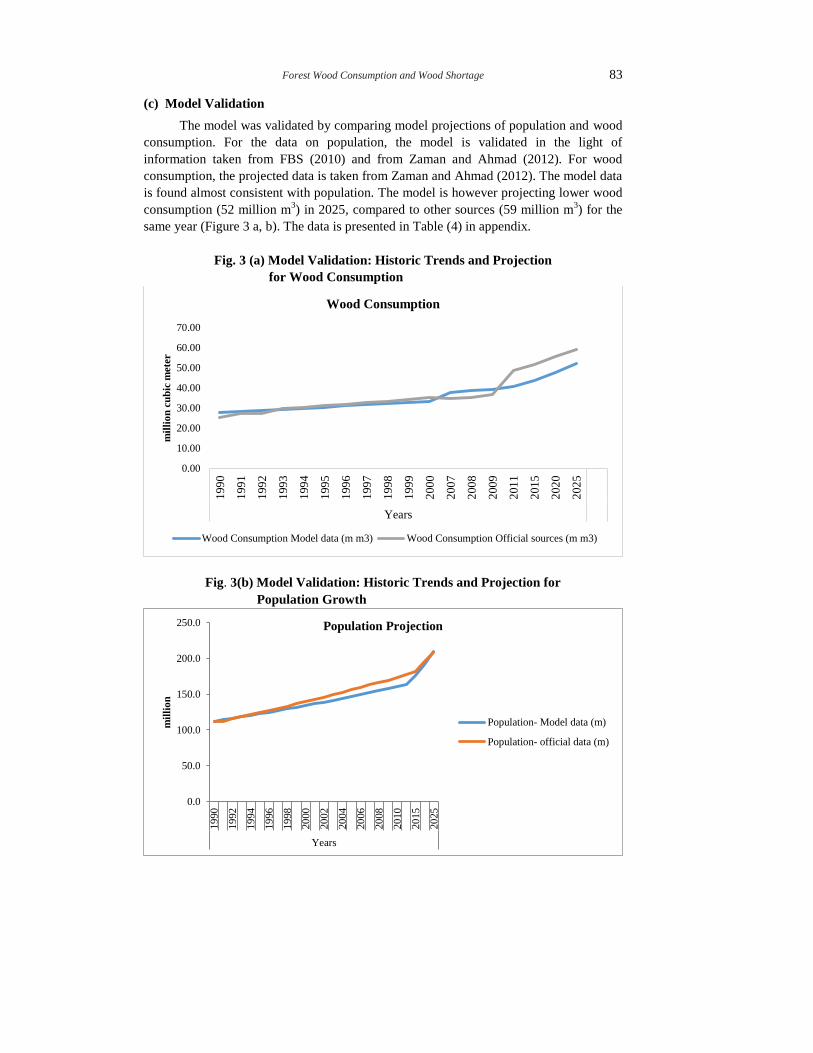
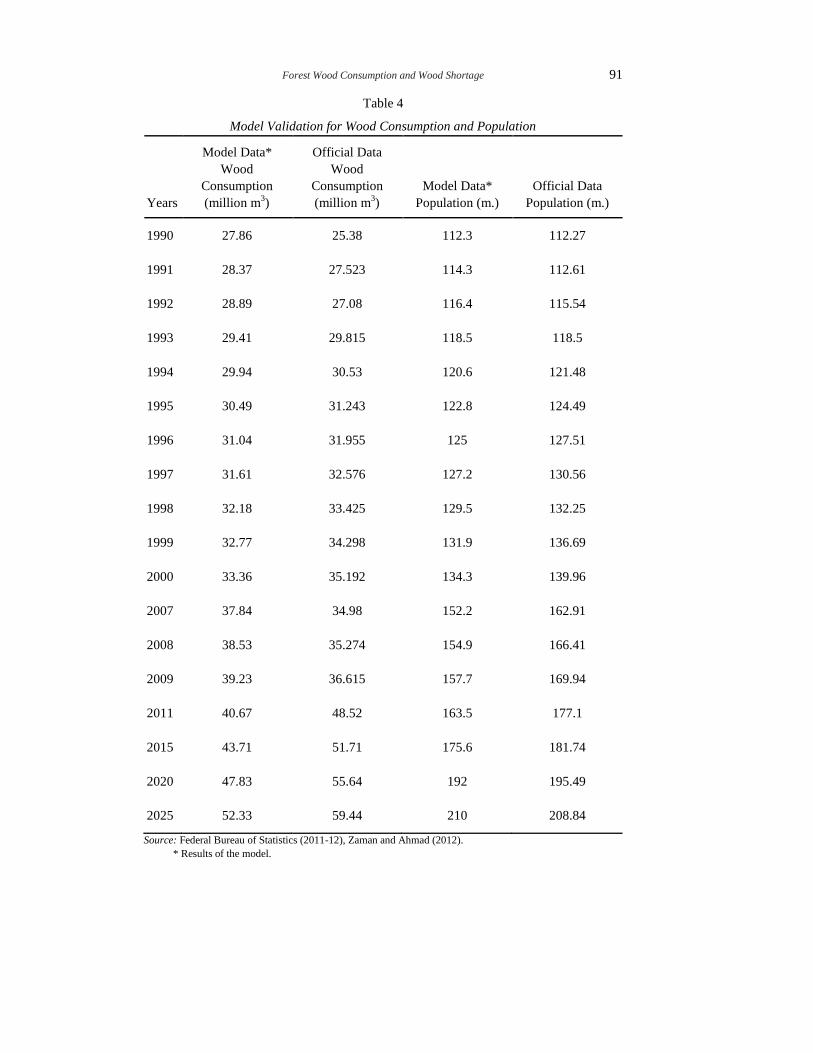
(c) Model Validation
The model was validated by comparing model projections of population and wood
consumption. For the data on population, the model is validated in the light of
information taken from FBS (2010) and from Zaman and Ahmad (2012). For wood
consumption, the projected data is taken from Zaman and Ahmad (2012). The model data
is found almost consistent with population. The model is however projecting lower wood
consumption (52 million m3) in 2025, compared to other sources (59 million m
3) for the
same year (Figure 3 a, b). The data is presented in Table (4) in appendix.
Fig. 3 (a) Model Validation: Historic Trends and Projection
for Wood Consumption
Fig. 3(b) Model Validation: Historic Trends and Projection for
Population Growth
0.00
10.00
20.00
30.00
40.00
50.00
60.00
70.00
199
0
199
1
199
2
199
3
199
4
199
5
199
6
199
7
199
8
199
9
200
0
200
7
200
8
200
9
201
1
201
5
202
0
202
5
Years
mil
lio
n c
ub
ic m
ete
r
Wood Consumption
Wood Consumption Model data (m m3) Wood Consumption Official sources (m m3)
0.0
50.0
100.0
150.0
200.0
250.0
19
90
19
92
19
94
19
96
19
98
20
00
20
02
20
04
20
06
20
08
20
10
20
15
20
25
Years
mil
lio
n
Population Projection
Population- Model data (m)
Population- official data (m)
84 Nazir, Olabisi, and Ahmad
V. RESULTS
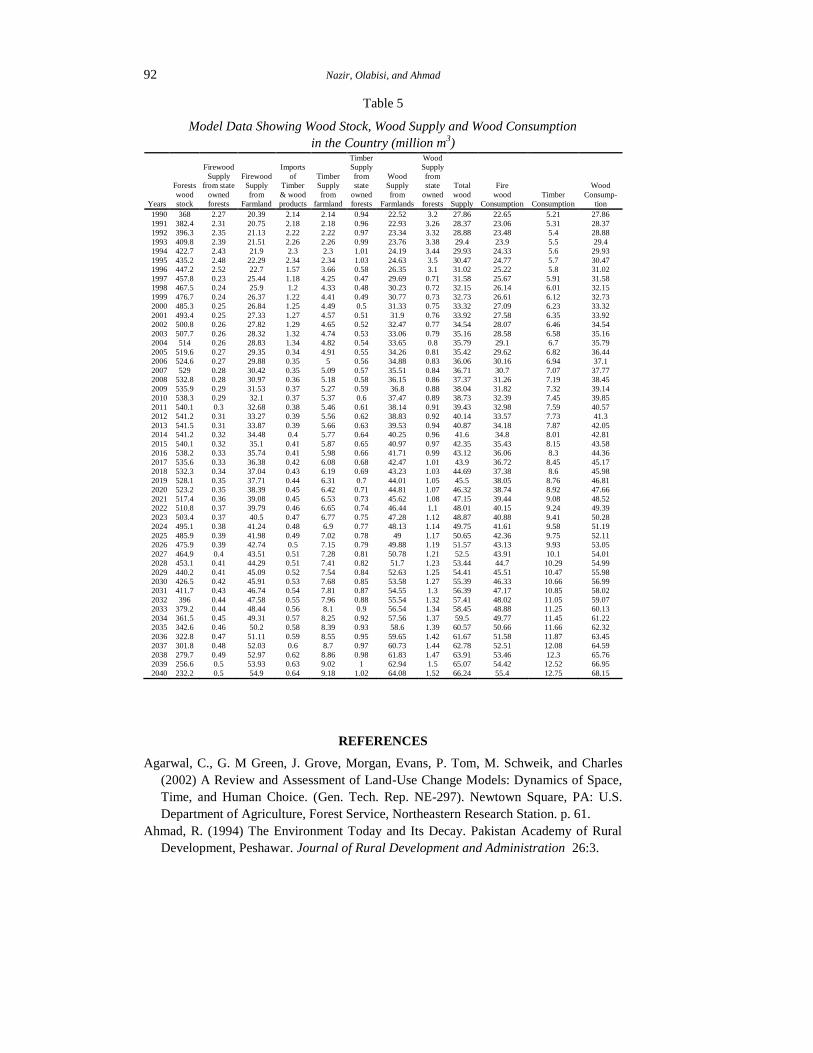
The results of the model are presented below. Detailed model output is given in
Table 5 (Appendix):
Forest Area and Wood Stock
Forest area is projected to increase from 3.46 million hectares in 1990 to 5.98
million hectares in 2040. The model results show that total wood stock of 368 million m³
in 1990 is projected to reduce to 232 million m³ in 2040. The national wood growth of
40.112 million m³ per annum has been added to the wood stock. However, total wood
stock has decreased over time because of the increasing pressure of wood extraction from
the forests.
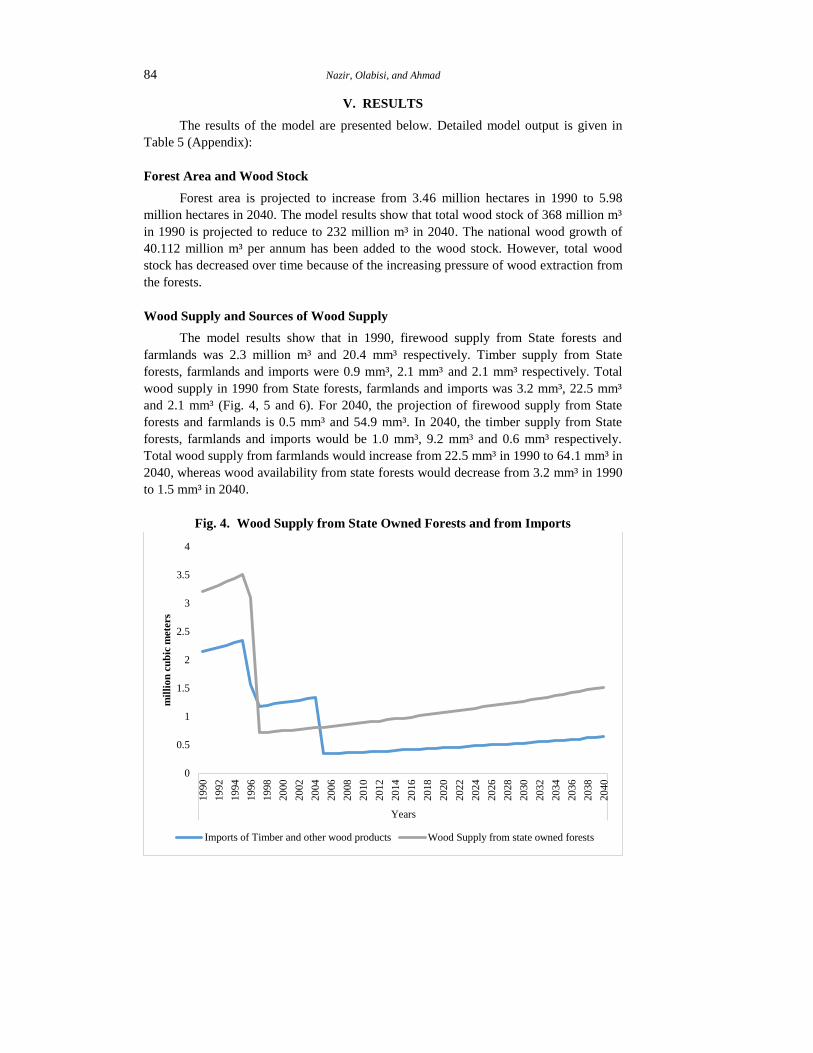
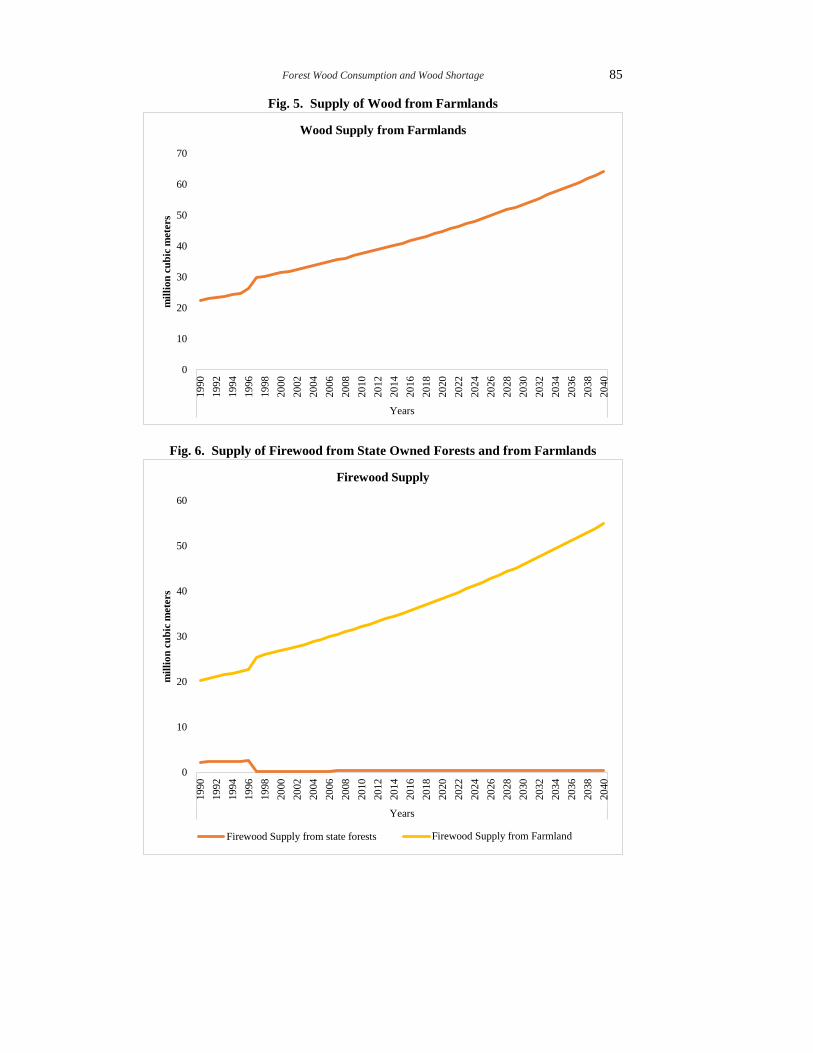
Wood Supply and Sources of Wood Supply
The model results show that in 1990, firewood supply from State forests and
farmlands was 2.3 million m³ and 20.4 mm³ respectively. Timber supply from State
forests, farmlands and imports were 0.9 mm³, 2.1 mm³ and 2.1 mm³ respectively. Total
wood supply in 1990 from State forests, farmlands and imports was 3.2 mm³, 22.5 mm³
and 2.1 mm³ (Fig. 4, 5 and 6). For 2040, the projection of firewood supply from State
forests and farmlands is 0.5 mm³ and 54.9 mm³. In 2040, the timber supply from State
forests, farmlands and imports would be 1.0 mm³, 9.2 mm³ and 0.6 mm³ respectively.
Total wood supply from farmlands would increase from 22.5 mm³ in 1990 to 64.1 mm³ in
2040, whereas wood availability from state forests would decrease from 3.2 mm³ in 1990
to 1.5 mm³ in 2040.
Fig. 4. Wood Supply from State Owned Forests and from Imports
0
0.5
1
1.5
2
2.5
3
3.5
4
19
90
19
92
19
94
19
96
19
98
20
00
20
02
20
04
20
06
20
08
20
10
20
12
20
14
20
16
20
18
20
20
20
22
20
24
20
26
20
28
20
30
20
32
20
34
20
36
20
38
20
40
Years
mil
lio
n c
ub
ic m
ete
rs
Imports of Timber and other wood products wood Supply from state owned forestsWood Supply from state owned forests
Forest Wood Consumption and Wood Shortage 85
Fig. 5. Supply of Wood from Farmlands
Fig. 6. Supply of Firewood from State Owned Forests and from Farmlands
0
10
20
30
40
50
60
70
19
90
19
92
19
94
19
96
19
98
20
00
20
02
20
04
20
06
20
08
20
10
20
12
20
14
20
16
20
18
20
20
20
22
20
24
20
26
20
28
20
30
20
32
20
34
20
36
20
38
20
40
Years
mil
lio
n c
ub
ic m
ete
rs
Wood Supply from Farmlands
0
10
20
30
40
50
60
19
90
19
92
19
94
19
96
19
98
20
00
20
02
20
04
20
06
20
08
20
10
20
12
20
14
20
16
20
18
20
20
20
22
20
24
20
26
20
28
20
30
20
32
20
34
20
36
20
38
20
40
Years
mil
lio
n c
ub
ic m
ete
rs
Firewood Supply
Firewood Supply from state forests Firewood Supply from FramlandFirewood Supply from Farmland
86 Nazir, Olabisi, and Ahmad
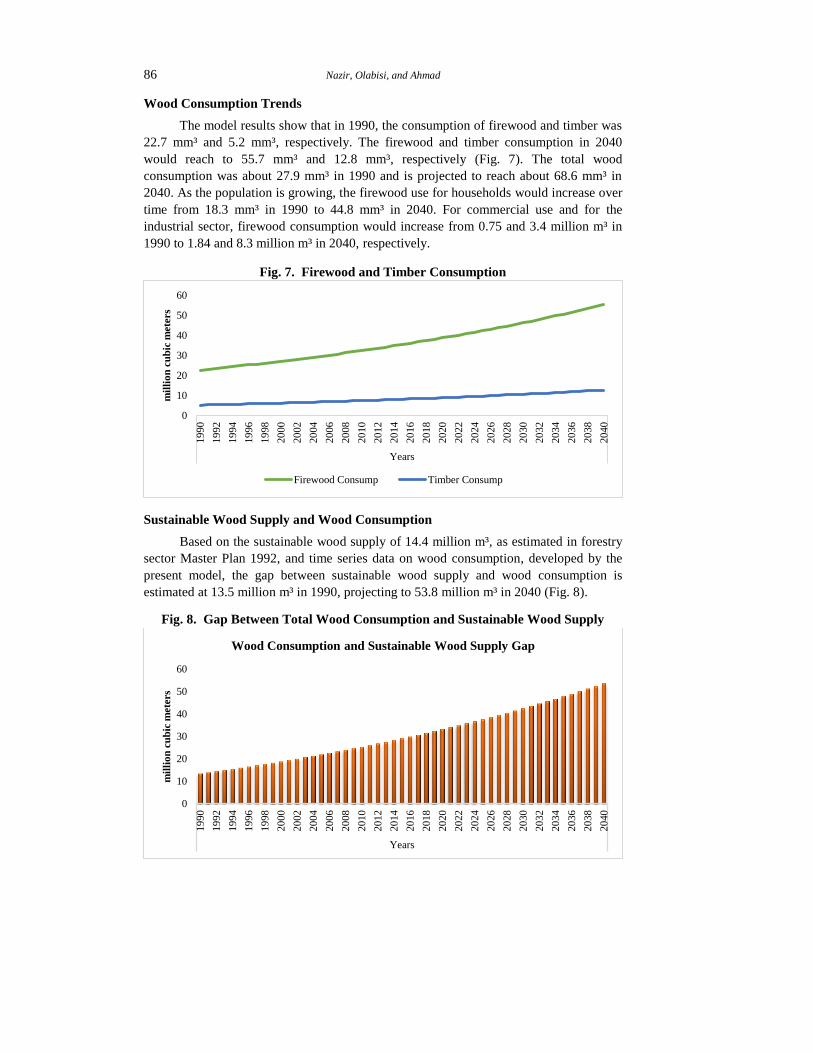
Wood Consumption Trends
The model results show that in 1990, the consumption of firewood and timber was
22.7 mm³ and 5.2 mm³, respectively. The firewood and timber consumption in 2040
would reach to 55.7 mm³ and 12.8 mm³, respectively (Fig. 7). The total wood
consumption was about 27.9 mm³ in 1990 and is projected to reach about 68.6 mm³ in
2040. As the population is growing, the firewood use for households would increase over
time from 18.3 mm³ in 1990 to 44.8 mm³ in 2040. For commercial use and for the
industrial sector, firewood consumption would increase from 0.75 and 3.4 million m³ in
1990 to 1.84 and 8.3 million m³ in 2040, respectively.
Fig. 7. Firewood and Timber Consumption
Sustainable Wood Supply and Wood Consumption
Based on the sustainable wood supply of 14.4 million m³, as estimated in forestry
sector Master Plan 1992, and time series data on wood consumption, developed by the
present model, the gap between sustainable wood supply and wood consumption is
estimated at 13.5 million m³ in 1990, projecting to 53.8 million m³ in 2040 (Fig. 8).
Fig. 8. Gap Between Total Wood Consumption and Sustainable Wood Supply
0
10
20
30
40
50
60
19
90
19
92
19
94
19
96
19
98
20
00
20
02
20
04
20
06
20
08
20
10
20
12
20
14
20
16
20
18
20
20
20
22
20
24
20
26
20
28
20
30
20
32
20
34
20
36
20
38
20
40
Years
mil
lio
n c
ub
ic m
ete
rs
Firewood Consump Timber Consump
0
10
20
30
40
50
60
19
90
19
92
19
94
19
96
19
98
20
00
20
02
20
04
20
06
20
08
20
10
20
12
20
14
20
16
20
18
20
20
20
22
20
24
20
26
20
28
20
30
20
32
20
34
20
36
20
38
20
40
Years
mil
lio
n c
ub
ic m
ete
rs
Wood Consumption and Sustainable Wood Supply Gap

Forest Wood Consumption and Wood Shortage 87
Effect of Policy Intervention
Under the present situation of energy crisis in Pakistan, consumption of wood
products should not be ignored, for the population is also increasing. During financial
year 2014-15, out of the total electricity generation in the country, 36.80 percent was
from oil, 26.5 percent from gas, 30.40 percent from hydel, 5.4 percent from nuclear and
0.7 percent from coal [HDIP (2015)]. Electricity generation in Pakistan is dominated by
thermal power plants (68 percent), running on imported oil [NEPRA (2013)]. According
to State Bank of Pakistan, we imported approximately $12 b., worth of oil during 2014-
15, which was 30 percent of the total import bill [PBC (2016)]. The projection shows that
by 2022, total electricity production would be 53404 MW and the share of renewable
sources would be only 9 percent of the total electricity production. Total demand is
projected to increase at 72169 MW by 2025. About 51 Million people in the country have
no access to electricity. Based on technical and economic feasibility, around 32,889
villages cannot be connected to the national grid [Khan (2016)]. Thus, it is imperative not
to ignore the use of wood consumption in the country. Therefore, the sustainable wood
supply should be considered. There is a need to increase sustainable wood supply.
For improving sustainable yield from the forest, in our model, we are left with two
viable options: increase in forest area and increase in farmland wood growth to reduce the
wood consumption-supply gap. To test this strategy, the growth of wood from farmlands
was enhanced in the model to double of its present level i.e. 7.7 million cubic meters,
thus the gap between wood consumption and sustainable supply would be decreased from
53.8 million m³ per year to 46 million m³. This quantity is still substantial, thus leading us
to think that enhancing growth of wood from farmland will not be effective unless forest
area would be increased through afforestation.
VI. DISCUSSION, CONCLUSION AND IMPLICATION
OF THE STUDY
Wood supply and consumption in a country depends on several factors, forest area;
wood stock availability; domestic and foreign sources of wood supply and above all
population growth. With growing population and shortage of electricity and gas in
Pakistan, consumption of wood especially fuel wood has increased over time. There are
three sources of wood supply: state owned forests, farmlands and imports. During 1990-
2010, the share of state owned forest in total wood supply decreased from 11.5 percent to
2.3 percent, whereas the share of farmlands in total wood supply increased from 80.8
percent to 96.7 percent during the same period. The imports of wood have decreased over
time, thus putting more pressure on domestic forests; both state owned forests and
farmlands. The wood extraction from domestic forests increased over time; the pressure
is more for firewood than timber. Out of the total wood consumption, the share of
firewood consumption was 81.3 percent whereas the share of timber was 18.7 percent.
For firewood, the state-owned forests contributed 10 percent while the contribution of
farmlands remained 90 percent in the total firewood supply. With the passage of time the
share of state owned forests in firewood supply further decreased to less than 1 percent
while the share of farmlands increased to 99.1 percent. The demand for firewood is
highest from the household sector, followed by the industrial sector and commercial use.
Other studies are highlighting that the main use of wood in forest rich areas especially in

88 Nazir, Olabisi, and Ahmad
Hazara and Swat by local people is for cooking, followed by wood use for construction
and for fodder. Local population typically does not engage in large scale wood cutting for
commercial purposes [Nazir (2009); Ali (2004); Ali, et al. (2006)].
Like fuel wood supply trends, timber supply from state forests has decreased from
18 percent to less than 10 percent while the share of farmlands has increased from about
41 percent to 84 percent, while wood extraction was increasing from domestic forests,
created negative pressure on wood stock. Wood yield extraction per hectare would
increase from 7.4 cubic meters in 1990 to 10.9 cubic meters in 2040, thus resulting in a
decline in wood stock availability over time. It is estimated that wood extraction from
domestic forests will surpass annual national wood yield growth (40.112 million m3) in
2018. Sustainable supply of wood is estimated at 14.4 million m3 annually in Pakistan
[Pakistan (1992); UNDP-ECC (undated); Pakistan (2005)]. The results of the present
study estimated that the gap between sustainable wood supply and wood consumption
increased over time in the country, thus reaching the conclusion that unsustainable wood
extraction from domestic forests increased from 11 million m3 in 1990 to 51 million m
3
in 2040.
The research on forestry issues in Pakistan shows that a large part of the
population depends on wood, as fuel source and for construction [Ali, Tanvir, and Suleri
(2006)]. Since the alternate energy sources are either not available to large part of the
population or are expensive, main stress is on wood sources. This is also aggravating
illegal cutting and timber smuggling from national forests in Pakistan [UNOCD and
SDPI (2011)]. Further, studies show that the insufficient data availability is a hindrance
in the way of forest product analysis [see for example, Ouerghi (1993); Khalil (2000)].
The present study is designed with the aim to estimate data on key forestry variables
under the assumption that, in the absence of sufficient alternate energy supply, if the
present rate of wood consumption is continued, there would be high demand in future, as
the population is increasing, thus increasing consumption and the supply gap. Other
studies are also projecting high wood consumption in the country [see for example,
UNDP- PK-ECC (undated)]. Fisher, et al. (2010) also mentioned that the demand supply
gap may increase to 13.6 million m3 by 2050. High demand supply gap may result in
depleting and disappearance of forest areas of Malakund and Hazara by 2027 [Joachim
(2000)]. Siddiqui and Amjad (1993) also mentioned that the reliance on wood is expected
to remain high in Pakistan in the foreseeable future. Since land conversion is also going
on. There is a need to take substantial steps to meet the needs of the local communities.
Nazir and Ahmad (2016) estimated long term land use conversion trends in Pakistan and
found that if the present rate of land conversion would not be checked, an area equal to
0.0536 m. ha would be converted to construction area, rangeland area and agriculture
land by 2030. Controlling deforestation is not the only strategy, as estimated by Nazir and
Ahmad (2016) but efforts should be made to increase sustainable wood supply and to
provide alternative energy sources in the country. The area under forest has also been
estimated in the present study. The forest area of Pakistan is low by international
standards. Forest area is projected to increase only to 5.4 million hectares in 2040 from
3.4 million hectares in 1990. The growth seems to be very slow because of high
deforestation in Pakistan and low rate of afforestation and regeneration. Velle (1998)
mentioned that in 1998, normal regeneration was observed only in 5.5 percent of the

Forest Wood Consumption and Wood Shortage 89
forest area, some regeneration in 24 percent of the area, while no regeneration was
observed in 70.5 percent of the area. At global level, programmes have been launched to
increase forest area by planting billion trees [UNEP (2011)]. The present KP government
has also taken an initiative under its programme “Billion Tree Tsunami Afforestation
Project” (BTTAP), to plant one billion trees to meet the demand of wood for the local
communities and to increase forest area to 2 percent [Govt. of KP (2015)]. This project
emphasised the participation of local communities and plantation on farmlands. The
present study suggested that increasing wood supply from farmlands might ease some
pressure on forests but would still not solve the problem totally. Rauf (1994) also
emphasised the need of agro-forestry to meet Pakistan’s fuel wood needs. Ayaz and Wani
(2000) mentioned that the major contributors in the national wood supply were
farmlands. The prospects of farm forestry are evident in the HESS wood demand survey,
which indicated that during 1990-91 around 125 million trees were planted and the share
of non-fruit trees was almost 90 percent. The largest proportion of the planted trees (44.9
percent) was for timber, where 29.8 percent was destined for fuel purposes, with the
remainder being planted for fruits, shade, fodder and other purposes [Ouerghi (1993)].
For the proper management of forests in a country, it is necessary to estimate
the present and projected forest resources. The consumption and supply of wood
resources is one of the main areas that needs proper planning. Methodology that
incorporates systems’ components and its changing trends, to estimate natural
resource variables, gives us a detailed picture of a problem. System dynamics
methodology also helps to generate data for variables for which there is insufficient
information available. Pakistan’s forestry sector also suffers from data deficiency.
The present case study of building a systems’ model by developing causal relations
and feedback loops of data with information gaps helped us to develop time series
data of wood supply and consumption in Pakistan. Research based on case studies
help to replicate the model for other similar settings.
In developing countries, the underlying driving force for wood consumption is
population growth. The growing population in Pakistan is resulting in an increasing
demand for forest products. The main area of concern is firewood use; particularly by
households. There is a limited room for growth in wood supply from State forests as there
is no significant increase in forest area. Imports of wood, being expensive, are declining.
It is pertinent to focus on increasing sustainable wood by focusing on farmland growth
and afforestation in the country.
Model estimated data on key variables, such as: national wood stock; timber
supply from farmlands and from state forests (mm3); firewood supply from farmlands and
from state forests (mm3); imports of wood products (mm
3) and projected wood supply
consumption gap, is a valuable addition to the literature of forestry of Pakistan. The
results of the study can be used to estimate other variables and address other issues in the
field. For example, the targets set under Billion Tree Tsunami Project and projected
change after the inclusion of the project in the existing growth is to calculate sustainable
wood availability in the country and estimating change in the volume of wood stock and
wood consumption etc. By using demand supply gap, this study would be helpful in
estimating the illegal wood harvest in the country.

90 Nazir, Olabisi, and Ahmad
APPENDIX
Model Equations and Supporting Data
Variables Data and Equations
Forest area (t) Forest area (t - dt) + (Forest area change) * dt
INIT Forest area 3460000 hectares
INIT Forests wood stock 368000000 m3
Growth rate forest area 1.1% INIT Population 112270000
Birth rate 25.45
Death rate 7.4
Annual growth national wood yield 40112000
Sustainable yield SS 14400000
Per capita firewood consumption 0.201754698 m3
Average Per capita timber consumption 0.046429402 m3
Firewood Consumption Per capita firewood consumption*Population
Firewood from Farmland IF TIME<=1996THEN.90*Firewood
Consumption ELSE 0.9909*Firewood
Consumption
Firewood from state forests If time < = 1996 then 0 .1 *Firewood
Consumption else 0.0091* Firewood
Consumption
Firewood for commercial use 0.033*Firewood Consumption
Firewood for household 0.81*Firewood Consumption
Firewood for industries 0.149*Firewood Consumption
Imports of Timber, other wood Timber Consumption *Timber Fraction Timber
Fraction
GRAPH (TIME) Timber Fraction = 0.41 (1990-1995), 0. 27
(1996), 0. 20 (1997-2004), 0.05 (2005-10)
Supply from Farmlands Firewood from Farmland +Timber from
farmland
Timber from Farmland IF TIME > = 1990 AND TIME <= 1995 then
0.41*Timber Consumption
ELSE IF TIME =1996 then 0.63*Timber Consumption
ELSE 0.72*Timber Consumption
Timber from State forests IF TIME > = 1990 AND TIME <= 1995 then
0.18*Timber Consumption
ELSE IF TIME = 1996 then 0.10*Timber Consumption
ELSE 0.08*Timber consumption
Forests wood stock (t) Forests wood stock (t - dt) + (annual growth
national wood yield – wood stock reduction) * dt
Wood stock reduction Total wood extraction
Total wood extraction Wood SS from state forests + wood SS from
Farmlands
Total wood SS wood SS from state forests + Imports of Timber
and other wood products + wood SS from
Farmlands
Wood CC and Sustainable Gap Wood Consumption-Sustainable yield SS
Wood stock per ha availability Forests wood stock/Forest area
Yield extraction per ha Total wood extraction/Forest area
Forest Wood Consumption and Wood Shortage 91
Table 4
Model Validation for Wood Consumption and Population
Years
Model Data*
Wood
Consumption
(million m3)
Official Data
Wood
Consumption
(million m3)
Model Data*
Population (m.)
Official Data
Population (m.)
1990 27.86 25.38 112.3 112.27
1991 28.37 27.523 114.3 112.61
1992 28.89 27.08 116.4 115.54
1993 29.41 29.815 118.5 118.5
1994 29.94 30.53 120.6 121.48
1995 30.49 31.243 122.8 124.49
1996 31.04 31.955 125 127.51
1997 31.61 32.576 127.2 130.56
1998 32.18 33.425 129.5 132.25
1999 32.77 34.298 131.9 136.69
2000 33.36 35.192 134.3 139.96
2007 37.84 34.98 152.2 162.91
2008 38.53 35.274 154.9 166.41
2009 39.23 36.615 157.7 169.94
2011 40.67 48.52 163.5 177.1
2015 43.71 51.71 175.6 181.74
2020 47.83 55.64 192 195.49
2025 52.33 59.44 210 208.84
Source: Federal Bureau of Statistics (2011-12), Zaman and Ahmad (2012).
* Results of the model.
92 Nazir, Olabisi, and Ahmad
Table 5
Model Data Showing Wood Stock, Wood Supply and Wood Consumption
in the Country (million m3)
Years
Forests
wood
stock
Firewood
Supply
from state
owned
forests
Firewood
Supply
from
Farmland
Imports
of
Timber
& wood
products
Timber
Supply
from
farmland
Timber
Supply
from
state
owned
forests
Wood
Supply
from
Farmlands
Wood
Supply
from
state
owned
forests
Total
wood
Supply
Fire
wood
Consumption
Timber
Consumption
Wood
Consump-
tion
1990 368 2.27 20.39 2.14 2.14 0.94 22.52 3.2 27.86 22.65 5.21 27.86
1991 382.4 2.31 20.75 2.18 2.18 0.96 22.93 3.26 28.37 23.06 5.31 28.37
1992 396.3 2.35 21.13 2.22 2.22 0.97 23.34 3.32 28.88 23.48 5.4 28.88
1993 409.8 2.39 21.51 2.26 2.26 0.99 23.76 3.38 29.4 23.9 5.5 29.4
1994 422.7 2.43 21.9 2.3 2.3 1.01 24.19 3.44 29.93 24.33 5.6 29.93
1995 435.2 2.48 22.29 2.34 2.34 1.03 24.63 3.5 30.47 24.77 5.7 30.47
1996 447.2 2.52 22.7 1.57 3.66 0.58 26.35 3.1 31.02 25.22 5.8 31.02
1997 457.8 0.23 25.44 1.18 4.25 0.47 29.69 0.71 31.58 25.67 5.91 31.58
1998 467.5 0.24 25.9 1.2 4.33 0.48 30.23 0.72 32.15 26.14 6.01 32.15
1999 476.7 0.24 26.37 1.22 4.41 0.49 30.77 0.73 32.73 26.61 6.12 32.73
2000 485.3 0.25 26.84 1.25 4.49 0.5 31.33 0.75 33.32 27.09 6.23 33.32
2001 493.4 0.25 27.33 1.27 4.57 0.51 31.9 0.76 33.92 27.58 6.35 33.92
2002 500.8 0.26 27.82 1.29 4.65 0.52 32.47 0.77 34.54 28.07 6.46 34.54
2003 507.7 0.26 28.32 1.32 4.74 0.53 33.06 0.79 35.16 28.58 6.58 35.16
2004 514 0.26 28.83 1.34 4.82 0.54 33.65 0.8 35.79 29.1 6.7 35.79
2005 519.6 0.27 29.35 0.34 4.91 0.55 34.26 0.81 35.42 29.62 6.82 36.44
2006 524.6 0.27 29.88 0.35 5 0.56 34.88 0.83 36.06 30.16 6.94 37.1
2007 529 0.28 30.42 0.35 5.09 0.57 35.51 0.84 36.71 30.7 7.07 37.77
2008 532.8 0.28 30.97 0.36 5.18 0.58 36.15 0.86 37.37 31.26 7.19 38.45
2009 535.9 0.29 31.53 0.37 5.27 0.59 36.8 0.88 38.04 31.82 7.32 39.14
2010 538.3 0.29 32.1 0.37 5.37 0.6 37.47 0.89 38.73 32.39 7.45 39.85
2011 540.1 0.3 32.68 0.38 5.46 0.61 38.14 0.91 39.43 32.98 7.59 40.57
2012 541.2 0.31 33.27 0.39 5.56 0.62 38.83 0.92 40.14 33.57 7.73 41.3
2013 541.5 0.31 33.87 0.39 5.66 0.63 39.53 0.94 40.87 34.18 7.87 42.05
2014 541.2 0.32 34.48 0.4 5.77 0.64 40.25 0.96 41.6 34.8 8.01 42.81
2015 540.1 0.32 35.1 0.41 5.87 0.65 40.97 0.97 42.35 35.43 8.15 43.58
2016 538.2 0.33 35.74 0.41 5.98 0.66 41.71 0.99 43.12 36.06 8.3 44.36
2017 535.6 0.33 36.38 0.42 6.08 0.68 42.47 1.01 43.9 36.72 8.45 45.17
2018 532.3 0.34 37.04 0.43 6.19 0.69 43.23 1.03 44.69 37.38 8.6 45.98
2019 528.1 0.35 37.71 0.44 6.31 0.7 44.01 1.05 45.5 38.05 8.76 46.81
2020 523.2 0.35 38.39 0.45 6.42 0.71 44.81 1.07 46.32 38.74 8.92 47.66
2021 517.4 0.36 39.08 0.45 6.53 0.73 45.62 1.08 47.15 39.44 9.08 48.52
2022 510.8 0.37 39.79 0.46 6.65 0.74 46.44 1.1 48.01 40.15 9.24 49.39
2023 503.4 0.37 40.5 0.47 6.77 0.75 47.28 1.12 48.87 40.88 9.41 50.28
2024 495.1 0.38 41.24 0.48 6.9 0.77 48.13 1.14 49.75 41.61 9.58 51.19
2025 485.9 0.39 41.98 0.49 7.02 0.78 49 1.17 50.65 42.36 9.75 52.11
2026 475.9 0.39 42.74 0.5 7.15 0.79 49.88 1.19 51.57 43.13 9.93 53.05
2027 464.9 0.4 43.51 0.51 7.28 0.81 50.78 1.21 52.5 43.91 10.1 54.01
2028 453.1 0.41 44.29 0.51 7.41 0.82 51.7 1.23 53.44 44.7 10.29 54.99
2029 440.2 0.41 45.09 0.52 7.54 0.84 52.63 1.25 54.41 45.51 10.47 55.98
2030 426.5 0.42 45.91 0.53 7.68 0.85 53.58 1.27 55.39 46.33 10.66 56.99
2031 411.7 0.43 46.74 0.54 7.81 0.87 54.55 1.3 56.39 47.17 10.85 58.02
2032 396 0.44 47.58 0.55 7.96 0.88 55.54 1.32 57.41 48.02 11.05 59.07
2033 379.2 0.44 48.44 0.56 8.1 0.9 56.54 1.34 58.45 48.88 11.25 60.13
2034 361.5 0.45 49.31 0.57 8.25 0.92 57.56 1.37 59.5 49.77 11.45 61.22
2035 342.6 0.46 50.2 0.58 8.39 0.93 58.6 1.39 60.57 50.66 11.66 62.32
2036 322.8 0.47 51.11 0.59 8.55 0.95 59.65 1.42 61.67 51.58 11.87 63.45
2037 301.8 0.48 52.03 0.6 8.7 0.97 60.73 1.44 62.78 52.51 12.08 64.59
2038 279.7 0.49 52.97 0.62 8.86 0.98 61.83 1.47 63.91 53.46 12.3 65.76
2039 256.6 0.5 53.93 0.63 9.02 1 62.94 1.5 65.07 54.42 12.52 66.95
2040 232.2 0.5 54.9 0.64 9.18 1.02 64.08 1.52 66.24 55.4 12.75 68.15
REFERENCES
Agarwal, C., G. M Green, J. Grove, Morgan, Evans, P. Tom, M. Schweik, and Charles
(2002) A Review and Assessment of Land-Use Change Models: Dynamics of Space,
Time, and Human Choice. (Gen. Tech. Rep. NE-297). Newtown Square, PA: U.S.
Department of Agriculture, Forest Service, Northeastern Research Station. p. 61.
Ahmad, R. (1994) The Environment Today and Its Decay. Pakistan Academy of Rural
Development, Peshawar. Journal of Rural Development and Administration 26:3.
Forest Wood Consumption and Wood Shortage 93
Ahmad, S. S., Q. U. A. Abbasi, R. Jabeen, and M. T. Shah (2012) Decline of Conifer
Forest Cover in Pakistan: A GIS Approach. Pakistan Journal of Botany 44:2, 511–
514.
Ali and Shah (2004) Local Communities’ Access to Forest Resources of Hilkot
Watershed, Mansehra. Pakistan Forest Institute, Peshawar. Pakistan Journal of
Forestry 52:2.
Ali, B. S. Tanvir, and A. Suleri (2006). Analysis of Myths and Realities of Deforestation
in North West Pakistan: Implications for Forestry Extension. International Journal of
Agriculture and Biology 107–110.
Ali, H. K. (1999) Management of Natural Resources Through Partnership Arrangement:
Experiences from Social Forestry Project, Malakand, NWFP. Changing Roles in
Development: The Effects of Community Involvement on Line Agencies and NGOs, p.
89-96, Department of Forestry, Fisheries and Wildlife NWFP, Peshawar.
Ali, J. and T. A. Benjaminsen (2004) Fuel Wood, Timber and Deforestation in the
Himalayas. Mountain Research and Development 24:4, 312–318.
Amjad, M. and N. Khan (1988) The State of Forestry in Pakistan. Pakistan Forest
Institute. Peshawar. p. 103.
Ayaz, M. and B. A. Wani (2000) Abstract. The Pakistan Journal of Forestry 50: (1-2).
Pakistan Forest Institute Peshawar.
Baker, W. L. (1989) A Review of Models in Landscape Change. Landscape Ecology 2:2,
111–133.
Barlas, Y. (1989) Multiple Tests for Validation of System Dynamics Type of Simulation
Models. European Journal of Operational Research 42:1, 59–87.
Barlas, Y. (1996) Formal Aspects of Model Validity and Validation in System Dynamics.
System Dynamics Review 12:3, 183–210.
Barlas, Y. and S. Carpenter (1990) Philosophical Roots of Model Validation: Two
Paradigms. System Dynamics Review 6:2, 148–166.
Bhalli, M. N., A. Ghaffar, S. A. Shirazi, N. Parveen, and M. M. Anwar (2012) Change
Detection Analysis of Land Use by Using Geospatial Techniques: A Case Study of
Faisalabad, Pakistan. Science International (Lahore) 24:4, 539–546.
Bukhari, B. S., S. A. Haider, and M. T. Laeeq (2012) Land Cover Atlas of Pakistan.
Pakistan Forest Institute, Peshawar.
Burgi, M., Emily W. B. Russell, and M. Glenn (2000) Effects of Post Settlement Human
Activities on Forest Composition in the North-Eastern United States: A Comparative
Approach. Journal of Biogeography Department of Geological Sciences, Rutgers,
University, Newark, NJ 07102, USA, Blackwell Science Ltd.
Burney, N. and N. Akhtar, (1990) Fuel Demand Elasticities in Pakistan. The Pakistan
Development Review 29: 2, 155–174.
Clark, W. P. (1990) Marketing Farm Produced Timber in Pakistan. Winrock
International Petit Jean Mountain Morrilton, Arkansas 72110 for the Government of
Pakistan U.S. Agency for International Development Forestry Planning and
Development Project.
Dasgupta, M. (1986) Forest Management in Darjeeling Hill Area from British Raj to
Swaraj (Ed.) Forestry Development in North East India. Omsons Publications Rajouri
Garden, New Delhi.
94 Nazir, Olabisi, and Ahmad
Dijk, A. V. and M. Hussein (1994) Environmental Profile of North West Frontier
Province- Pakistan. pp. 31-69, EDC (Pvt.) Limited, Enterprise and Development
Consulting, Islamabad. Pakistan.
EC-FAO (2002) An Overview of Forests and Forest Products Statistics in South and
South East Asia- EC-FAO Partnership Programme (2000-2002). Food and
Agriculture Organisation.
Eckholm, E. (1975) The Deterioration of Mountain Environments. Science 189, 764–770.
EUAD (1992) Pakistan’s National Conservation Strategy, Government of Pakistan,
Environment and Urban Affairs Division, Islamabad.
FAO (1997a) State of the World’s Forests 1997. Food and Agricultural Organisation of
the United Nations.
FAO (1997b) Asia-Pacific Forestry Sector Outlook Study. (Working Paper Series No.
34). Forestry Policy and Planning Division, Regional Office for Asia and the Pacific,
Bangkok.
FAO (1997c) Regional Study on Wood Energy Today and Tomorrow in Asia- Regional
Wood Energy Development Programme in Asia GCP/RAS/154/NET Field Document
No.50, Bangkok.
FAO (2009a) Pakistan Forestry Outlook Study— Asia-Pacific Forestry Sector Outlook
Study II. (Working paper series, Working Paper No. APFSOS II/WP/2009/28).
Ministry of Environment, Government of Pakistan, Food and Agriculture
Organisation of the United Nations regional office for Asia and the Pacific, Bangkok.
FAO (2009b) State of the World’s Forests 2009. Food and Agriculture Organisation.
FAO (2010) Global Forest Resources Assessment 2010. Country Report Pakistan,
Forestry Department FAO- FRA 2010/158, Rome, 2010.
FAO (2014a) 2013 Global Forest Products Facts and Figures. Available at
(http://www.fao.org/forestry/statistics/84922/en/) accessed June 5, 2015
FAO (2014b) Contribution of Forestry Sector to National Economies, 1990-2011. Forest
Finance Working Paper FSFM/ACC/09, Forest Economics, Policy and Products
Division, Forestry Department Food and Agriculture Organisation of the United
Nations, Rome, 2014.
FBS (2002) Economic Survey of Pakistan (2000-2001). Islamabad: Federal Bureau of
Statistics, Islamabad, Pakistan.
FBS (2010) Compendium on Environment Statistics of Pakistan 2010. Islamabad:
Federal Bureau of Statistics, Pakistan.
FBS (2014) Economic Survey of Pakistan (2013-2014). Islamabad: Federal Bureau of
Statistics, Islamabad, Pakistan.
Fischer, K. M., M. H. Khan, A. K. Gandapur, A. L. Rao, R. M. Zarif, and H. Marwat
(2010) Study on Timber Harvesting in NWFP, Pakistan. Pak-Swiss Integrated Natural
Resource Management Project, Swiss Agency for Development and Cooperation.
ISBN: 969-9082-02-x. United Nations, Rome, Italy.
Forester, J. J., R. Kanaan, M. Malley, T. Roule, and J. Thomson (2003) Conflict Timber:
Dimensions of the Problem in Asia and Africa, Final Report Submitted to the United
States Agency for International Development, Volume II, Asian Cases. USAID/OTI
and USAID/ANE/TS.
Forest Wood Consumption and Wood Shortage 95
Forrest, J. W. (1968) Industrial Dynamics—A Response to Ansoff and Slevin.
Management Science 14:9, 601–618.
Forrester, J. W. and P. M. Senge (1980) Tests for Building Confidence in System
Dynamics Models. In A. A. Legasto, JR, J. W. Forrester, and J. M. Lyneis (Ed.)
System Dynamics: TIMS Studies in the Management Science 14, 209–228. New York:
North-Holland.
Gilbert, N. and K. G. Troitzsch (1999) Simulation for the Social Scientist. Open
University.
Hafeez, S M. (2000) Bio-energy for Meeting Growing Energy Needs. In RWEDP
[Regional Wood Energy Development Programme], editor. Wood Fuel Production
and Marketing in Pakistan. National Workshop, Faisalabad, Pakistan, 28-30 October
1997. RWEDP Report No 49. Bangkok, Thailand: FAO [Food and Agriculture
Organisation of the United Nations], pp. 143–149.
HDIP (2015) Pakistan Energy Year Book 2015. Hydrocarbon Development Institute of
Pakistan (HDIP), Ministry of Petroleum and Natural Resources, Government of
Pakistan.
Irwin, E. and J. Geoghegan (2001) Theory, Data, Methods: Developing Spatially-Explicit
Economic Models of Land Use Change. Agric. Ecosyst. Environ 85, 7–24.
IUCN (1992) Natural Resource Use Survey Korangi/Phitti Creek. Main Report, IUCN,
Pakistan Programme, Coastal Ecosystem Unit, Volume I and II.
IUCN (1998) Natural Resource Management Strategy-Environmental Rehabilitation in
NWFP and Punjab Project, IUCN, Pakistan.
IUCN (2002) Environmental Issues. Land. Fuel Wood. http://www.edu.sdnpk.
org/edu/land.htm ; accessed on September, 2015.
IUCN (2004) Abbottabad—State of the Environment and Development. IUCN Pakistan
and NWFP: Karachi, Pakistan. XII, pp. 136.
Joachim, S. K. M. (2000) Provincial Forest Resource Inventory (PFRI) North West
Frontier Province—Pakistan. GAF AG: München, Germany.
Khalil, S. (2000) The Economic Valuation Methods of Environment: Application to
Mangrove Ecosystem (Products) Along Karachi Coastal Line. Pakistan Economic and
Social Review 38:1, 16–46.
Khan, M. I. (2016) Renewable Energy and Energy Efficiency Project. Deutsche
Gesellschaft für Internationale Zusammenarbeit (GIZ).
Khyber Pakhtunkhwa, Government of (2015) Revised Pc-1 for Billion Trees Tsunami
Afforestation Project in Khyber Pakhtunkhwa, Phase – I, 2014-15, March 18, 2015,
Forest Department Government of Khyber Pakhtunkhwa, Department of Forestry,
Environment and Wildlife .
Kitzes, P. Justin, G. Audrey, and W. Steve (2007) Current Methods for Calculating
National Ecological Footprints Accounts. Science for Environment and Sustainable
Society 41:1, 1–9.
Knudsen, A. J. (1995) Forest Management in Pakistan: Failed Policies or Local
Mismanagement? pp. 1-13, CHR. Michelsen Institute, Development Studies and
Human Rights, Fantoft-Bergen, Norway.
Knudsen, A. J. (1996) Deforestation and Entrepreneurship in the North-West Frontier
Province, Pakistan. In S. T. Madsen (ed.). State, Society and the Environment in
South Asia. Richmond, UK. Curzon Press, pp. 200–235.
96 Nazir, Olabisi, and Ahmad
Lall, J. S. and A. D. Moddie (1981) The Himalaya: Aspect of Change. New Delhi:
Oxford University Press.
Lane, D. C. (1998) Can we have Confidence in Generic Structures? The Journal of the
Operational Research Society 49:9, 936–947.
Lodha, R. M. (1991) Environmental Essays. New Delhi: Ashish Publishing House.
Mather, A. S. and C. L. Needle (2000) The Relationships of Population and Forest
Trends. The Geographical Journal 166:1, 2–13.
Musango, J. K., A. C. Brent, B. Amigun, L. Pretorius, and H. Muller (2012) A System
Dynamics’ Approach to Technology Sustainability Assessment: The Case of
Biodiesel Developments in South Africa. Technovation 32:11, 639–651.
Myers, N. (1986) Environmental Repercussions of Deforestation in the Himalayas.
Journal of World Forest Resources Management 2, 63–72.
Nazir, N. (2009) An Analysis of Socio-economic Factors Affecting Forest Area in
Pakistan with Special Reference to NWFP (1972-2000). A PhD. Thesis Submitted to
the Department of Economics, University of Peshawar, Pakistan.
Nazir, N. and S. Ahmad (2016) Forest Land Conversion Dynamics: A Case of Pakistan.
Environment Development Sustainability. doi:10.1007/s10668-016-9887-3
NEPRA (2013) State of Industry Report 2013. National Electric Power Regulatory
Authority.
Olabisi, L. S. (2010) The System Dynamics of Forest Cover in the Developing World:
Researcher versus Community Perspectives. Sustainability 2, 1523–1535.
Ouerghi, A. (1993) Woodfuel Use in Pakistan: Sustainability of Supply and Socio-
economic and Environmental Implications. In Wood Energy Development:
Planning, Policies and Strategies; Regional Wood Energy Development
Programme in Asia. Food and Agriculture Organisation of the United Nations.
vol. II, pp. 61-84.
Pakistan, Government of (1992) Forestry Sector Management Plan. Ministry of
Environment, Government of Pakistan.
Pakistan, Government of (2005) Supply and Demand of Fuel Wood and Timber for
Household and Industrial Sectors and Consumption Pattern of Wood and Wood
Products in Pakistan. Ministry of Environment, Government of Pakistan.
Parker, D. C., S. M. Manson, M. A. Janssen, M. J. Hoffmann, and P. Deadman (2003)
Multi-Agent Systems for the Simulation of Land-Use and Land-Cover Change: A
Review. Annals of the Association of American Geographers 93:2, 314–337.
Pati, R. N. (ed.) (1992) Health, Environment and Development. S. B. Nangia, Ashish
Publishing House 8/81, Punjabi Bagh, New Delhi 110026.
Payr, G. (1999) Joint Forest Management in State Forests in the Context of the German
Supported Siran Kaghan Forest Development Project (SKFDP), Seminar Proceedings
“Changing Roles in Development: The Effects of Community involvement on Line
Agencies and NGO’s”. Department of Forestry, Fisheries and Wildlife, NWFP.
PBC (2015) Energy Report-PEF III, Integrated Energy Plan-2015-2025. Pakistan
Business Council, Nov. 19, 2015.
PFI (2004) National Forest and Rangeland Assessment Study. Pakistan Forest Institute,
Government of Pakistan, Ministry of Environment, pp. 83–88.
Forest Wood Consumption and Wood Shortage 97
Qasim, M., K. Hubacek, M. Termansen, and L. Fleskens (2013) Modelling Land Use
Change Across Elevation Gradients in District Swat, Pakistan. Reg. Environ Change
13:567–581, Springer-Verlag Berlin Heidelberg 2013 Quantitative Methods in
Landscape Ecology. Springer-Verlag, New York.
Rao, A. L. and A. H. Marwat (2003) Northern Areas Strategy for Sustainable
Development. Background Paper for Forestry. Gilgit, Pakistan: IUCN [The World
Conservation Union].
Rauf, R. A. (1994) Agro-forestry—Conserving the Environment. Pakistan Academy of
Rural Development, Peshawar. Journal of Rural Development and Administration
26:3.
Ravindranath, N. H. and D. O. Hall (1995) Biomass, Energy and Environment: A
Developing Country Perspective from India. Oxford University Press.
Schickhoff, U. (1995) Himalayan Forest-Cover Change in Historical Perspective: A Case
Study from the Kaghan Valley, Northern Pakistan. Mountain Research and
Development 15:1, 3–18.
Seto, K. C. and R. K. Kaufmann (2003) Modeling the Drivers of Urban Land Use
Change in the Pearl River Delta, China: Integrating Remote Sensing with
Socioeconomic Data. Land Economics 79:1, 106–121.
Shahbaz, M., M. Zeshan, and T. Afza (2012) Is Energy Consumption Effective to Spur
Economic Growth in Pakistan? New Evidence from Bounds Test to Level
Relationships and Granger Causality Tests. Economic Modelling 29:6, 2310–2319.
Sheikh, M. I. (1990) Background Paper—Wood Producers-Users’ Seminar Souvenir.
Office of the Inspector General of Forests. Islamabad, p.3-10.
Sheikh, M. I. and M. Hafeez (1977) Forests and Forestry in Pakistan, pp. 1-4, 14-2240-
42,47-51,64- 66,70,72,113,234, Pakistan Forest Institute, Peshawar.
Siddiqui, K. M. and M. Amjad (1993) A Case Study on Marketing of Wood Fuel in
Peshawar City. Pakistan. Bangkok, Thailand: Food and Agriculture Organisation of
the United Nations.
Siddiqui, K. M. (2000) Wood Fuel in the National Energy Balance. In RWEDP [Regional
Wood Energy Development Programme], editor. Wood, Fuel Production and
Marketing in Pakistan. National Workshop, Faisalabad, Pakistan, 28-30 October 1997.
RWEDP Report No 49. Bangkok, Thailand: FAO [Food and Agriculture Organisation
of the United Nations], pp. 25–30.
Sterling, C. (1976) Nepal. Atlantic Monthly 23:8(4), 14–25.
Sterman, J. D. (2000) Business Dynamics: Systems Thinking and Modeling for a Complex
World. Boston (MA): McGraw- Hill Higher Education.
Trossero, M. A. (2002) Wood Energy: The Way Ahead. Unasylva 53, 3–12.
UNDP-ECC (2010) Forests and Biodiversity Information/Data Report UNDP-PK-ECC-
Forests and Biodiversity, May 4, available at http://www.pk.undp.org/
content/dam/pakistan/docs/Environment%20&%20Climate%20Change/UNDP-PK-
ECC-Forests%20and%20Biodiversity.pdf accessed on June 20, 2015.
UNEP (2011) UNEP Billion Tree Campaign Reaches 12 Billion Milestone. Nov 8, 2011,
available at http://www.unep.org/newscentre/Default.aspx?DocumentID=2659&
ArticleID=8930, retrieved May 27, 2016.
UN-FAO (2010) Global Forest Resource Assessment-2010. (Working Paper No:
APFSOS/WP/34). Regional Study on Wood Energy Today and Tomorrow in Asia:
Regional Wood Energy Development Programme in Asia, GCP/RAS/154/NET.
98 Nazir, Olabisi, and Ahmad
UNOCD and SDPI (2011) Examining the Dimensions, Scale and Dynamics of Illegal
Economy: A Study of Pakistan in the Region, 2011. United Nations Office on Drugs
and Crime (UNODC), Country Office Pakistan and SDPI, Pakistan.
UNOCD and SDPI (2011) Examining the Dimensions, Scale and Dynamics of Illegal
Economy: A Study of Pakistan in the Region, 2011, United Nations Office on Drugs
and Crime (UNODC), Country office Pakistan and SDPI, Pakistan.
Veldkamp and E. F. Lambinb (2001) Predicting Land-Use Change. Agriculture,
Ecosystems and Environment 85, 1–6.
Velle, K. (1998) Natural Forest Inventory. High Altitude Integrated Natural Resources
Management. Project Report No 4, Norway: Centre for International Environment and
Development Studies, Agricultural University of Norway.
Wannitikul, Ga (2005) Deforestation in Northeast Thailand, 1975-91: Results of a
General Statistical Model. Singapore Journal of Tropical Geography 26:1, 102–118.
Department of Geography, National University of Singapore.
Whelan, J. and K. Msefer (1996) Economic Supply and Demand. Prepared for the MIT
System Dynamics in Education Project under the Supervision of Professor Jay W.
Forrester, MITP, D-4388.
White, K. and H. Dean (2004) Moderate Environmental Amenities and Economic
Change: The Nonmetropolitan Northern Forest of the Northeast U.S., 1970–2000.
Growth and Change 35:1 (Winter 2004), 42–60.
World Bank/Esmap and UNDP (1993) Pakistan Household Energy Strategy Study.
World Bank.
Wright, J. and C. M. Helene (2006) The Future of Tropical Forest Species.
BIOTROPICA 38:3, 287–301. Department of Ecology, Evolution and Behaviour,
University of Minnesota, St. Paul, Minnesota, U.S.A.
Yu, W., S. Zang, C. Wu, W. Liu, and X. Na (2011) Analysing and Modeling Land Use
Land Cover Change (LUCC) in the Daqing City, China. Applied Geography 31.
Yusufzai, R. (1992) The Timber Mafia. Newsline 19, 92:10, 126–130.
Zaman, S. B. and S. Ahmad (2012) Wood Supply and Demand Analysis in Pakistan—
Key Issues, Managing Natural Resources for Sustaining Future Agriculture. Research
Briefings 4:22.