current and projected wood energy consumption in the ...restricted open burning, incineration, and...
TRANSCRIPT

In: Klass, Donald L., ed. Energy from biomass and wastes 23.Proceedings of IGT’s conference; 1989 February 13-17; New Orleans, LA.Chicago, IL: Institute of Gas Technology; 1990: 229-260.
CURRENT AND PROJECTED WOOD ENERGY CONSUMPTIONIN THE UNITED STATES
Colin High, Ph.D.Research Professor
Environmental Studies ProgramDartmouth CollegeHanover, NH 03755
Kenneth Skog, Ph.D.Research Forester
USDA Forest Products LaboratoryMadison, WI 53705
ABSTRACT
The USDA Forest Service is preparing long-termprojections of wood energy use as part of an assessment ofdemand for and Supply of resources from forest andrangelands in The United States to be published in 1989.To assess the lmpact of wood energy demand on timberresources, two systems dynamics simulation models are usedto project residential and industrial/commercial fuelwooduse from several fuelwood sources: stickwood, whole treechips, logging residue, and mill residue.
The projections are driven by a projected increasingcost advantage of wood fuels over fossil fuels. There arenumerous assumptions that other conditions will changerelatively little over the projection period. Fuelwood useis projected to increase from 1.3 quadrillion Btu’s (quad)or 5.2 billion cubic feet (BCF) in 1986, to 2.2 quad or 8.8BCF by 2020, then decline to just under 2 quad or 7.8 BCFby 2040. If we add a modelate amount of black pulpingliquor use, our total wood energy use would be less in 2010than the DOE projected amount of 3.7 quad. Residentialfuelwood will dominate consumption and is projected toincrease 64% between 1986 and 2020. Much of this increaseis due to a 50% increase in number of households. Use ofchips and logging residue for industrial/ commercial fuelis projected to grow by a factor of 3 to 4 between 1986 and2020 because mill residue is now fully utilized.
Fuelwood use (excluding bark) is projected to increasefrom 27% of roundwood harvested in 1986 to 29% in 2020,then decline to 25% in 2040. Fuelwood will likely becomea relatively permanent part of the forest products economyand this may have important implications for forestmanagement in the long term.

CURRENT AND PROJECTED WOOD ENERGY CONSUMPTIONIN THE UNITED STATES
INTRODUCTION
The Forest Service of the U.S. Department ofAgriculture is directed under requirements of the RenewableResources Planning Act of 1974 and the Renewable ResourcesResearch Act of 1978 to make periodic assessments of thecurrent and long-range demand for and supply of renewableresources from forest and rangelands in the United States.The Forest Service is preparing such an assessment withprojections to 2040 to be published in 1989. Theassessment of timber resource demand and supply has beenprepared in draft form (13). This paper discusses one partof this assessment of the timber situation--the analysis ofthe demand for and supply of timber for energy.
Since 1980, faculty and staff at Dartmouth Collegehave worked with the Forest Service to prepare long-rangeprojection models of wood energy use, first for residentialwood burning, and second, for industrial/commercial woodenergy use. To project the demand for timber resources forfuel we must assess how economically many forms of woodenergy may substitute for conventional fuels as used bymany end users. The two models discussed in this paper,CHIPS and WOODSTOV, project how much of several types ofwood energy will be used by 1) households,2) pulp/paper/paperboard mills, 3) solid wood productsmills, 4) large non-forest-products boilers, and 5) smallnon-forest-products boilers in response to the projectedcost advantage of wood relative to oil, natural gas,electricity, and coal.
Wood for energy can come from many sources. It iS Ofconsiderable interest in an assessment of timber demand tosort out wood energy supply sources because many sourcesare not used for sawlogs, veneer logs, or pulpwood. Woodenergy supply sources used in this paper include
Roundwood, in the form ofStickwood (primarily residential use)Chips (made by whole tree harvesting and chipping)Logging residue (primarily industrial/commercial use)
Mill residue, wood and bark
Black pulping liquor
Fuelwood as used in this paper is defined to includeboth roundwood and mill residue. Currently, fuelwood usedby households is almost entirely roundwood and fuelwoodused by the industrial/commercial sector is mostly millresidue.
We exclude 1) waste wood products such as pallets,discarded furniture, and demolition waste, 2) wood used to
230

make liquid fuels, and 3) trees grown by short rotationintensive culture (SRIC). The first source was consideredsmall compared to other wood energy sources, and the secondand third face high economic uncertainty relative to othersources. If liquefaction processes or SRIC can producewood for energy at a price competitive with other woodenergy sources, they may displace or add to wood energysources discussed in this paper.
Roundwood, which by definition comes directly fromtimber, is further subdivided into the categoriestraditionally used to assess timber supply: first, byhardwood and softwood species; second, by landsource--timberland, woodland, and nonforest land; andthird, (on timberland only) by type of timbervolume-- growing stock and other. Timberland producesgrowing stock growth of 20 cubic feet per acre per year;woodland produces less. For simplicity we divide roundwoodinto four categories:
Growing stock volumeHardwoodSoftwood
Other sourcesHardwoodSoftwood
In 1986 about 90% of sawlogs, veneer logs, andpulpwood came from growing stock volume: only about 26% ofstickwood used for residential wood burning came fromgrowing stock volume.
This paper is divided into sections discussinghistorical trends in wood energy use, present wood energyuse patterns, methods used to project wood energy use to2040, and projections of use.
HISTORICAL BACKGROUND
Woodfuel was the major energy source of NativeAmericans as well as early colonists over most of NorthAmerica. The availability of wood and its ease of use inagricultural and simple industrial activities made it anideal fuel for a mobile and rapidly changing frontiersociety. The abundance of wood assured its dominant rolein the early industrialization in North America throughmuch of the 19th century even while coal had grown moreimportant in Europe. In 1850, wood was the largest singleenergy source in the United States, and more wood was usedfor fuel than for any other purpose. Although coal usegrew rapidly in the later 1800s, wood use continued to growto a peak in the 1870s when it provided slightly less than3 quad of energy or about 11 BCF (Figure 1) (10). Thefuelwood used through the mid 1900s was almost entirelyfrom roundwood. Relatively small amounts of mill residuemay also have been used. After 1870, the total amount ofroundwood used for fuel in the United States declined
231

steadily to a low in early 1970s. The Forest Serviceestimates a low of about 0.5 BCF in 1972 or 0.1 quad (12).The U.S. Department of Energy (DOE) estimates a low ofabout 22 million OD tons in 1972 or 0.4 quad (14). DOEestimates that by 1984 roundwood use by households aloneincreased to 3.9 BCF or 0.78 quad (15). Industry andcommercial establishments burned an additional small amountof roundwood. Total roundwood use has since decreased withthe decline in fossil fuel prices.
While roundwood use decreased in the 1950s, ’60s and‘70s, industry increased its use of mill residue and blackpulping liquor for fuel. so total wood energy use(roundwood, mill residue, and black liquor) may not havedropped lower than 1.4 quad (Figure 1). Mill residue useincreased as forest products industries produced additionalresidue, and more stringent environmental regulationsrestricted open burning, incineration, and landfilldisposal of wood residue. More restrictive water pollutionregulations increased the incentives to fully use blackpulping liquor for fuel.
From 1974 to 1985, rapid increases in oil pricesstimulated increases in wood energy use in several sectorsof the economy. By 1986 DOE estimates total wood energyuse had risen to 2.52 quads. High oil prices, combinedwith further pressure from environmental regulations, hascreated a situation in the forest products industries wheremost surplus wood residue is now being used for energy andincreased quantities of wood are harvested as fuel for bothindustrial and residential sectors. Substantialimprovements in energy efficiency have been made in mostsectors that use wood so that the effective energy yieldfrom the wood is greater now than in the past.
The use of wood for energy has expanded beyond theforest products industries and the residential sector toinclude commercial and institutional use, industrial steamproduction, electric cogeneration, and electric utilitypower production. Research and development work was inprogress in both the public and private sectors tocommercialize wood gasification, methanol and ethanolproduction, and synthetic petroleum fuels production.However, the fall in oil prices since 1985 hassignificantly reduced commercial interest in much of thiswork although considerable technical progress has been madein most areas.
PRESENT WOOD ENERGY USE PATTERNS
The most detailed information about wood energy supplyin 1986 comes from the U.S. Forest Service and the AmericanPaper Institute, and the most detailed information aboutdemand comes from DOE.
On the supplywas used primarily
side, an estimated 3.11 BCF of roundwoodby residential households in stoves,
232

furnaces and fireplaces (Table 1). An estimated 2.06 BCFof mill residue (wood and bark) was used primarily inindustrial/commercial boilers. These amounts total5.17 BCF of wood and bark. Additional amounts were burnedin the form of mill residue from secondary processingplants and waste wood products. No estimates are availableon these amounts, but they are significantly less than theamount from primary mill residue. The total of theavailable supply estimates for 1986 is 5.17 BCF or about1.3 quad. If we add 0.90 quad of black pulping liquor usedfor fuel (2), partial total wood energy from supply sideinformation sources is 2.2 quad. This is a partial totalbecause it does not contain an estimate of secondary millresidue or waste wood products used for fuel.
On the demand side, DOE surveys and estimates forindustries, commercial facilities and utilities show aconsumption of 2.52 quad in 1986. If we deduct 0.9 quadfor black liquor, this leaves 1.62 quad or 6.5 BCF in theform of roundwood and mill residues (wood and bark). Thedifference between supply and demand side estimates ofroundwood plus mill residue use (5.2 BCF and 6.5 13CF) isdue in part to the lack of information about use ofsecondary mill residue and waste wood products. Thisdifference is also likely to be due to use of differentconversion factors and differences in survey and estimationprocedures.
To assess the impact of fuelwood use on timberresources, roundwood use in 1986 must be subdivided bytimber source: growing stock and other sources. Of the5.16 BCF of fuelwood, only 16% or 0.81 BCF came fromgrowing stock (Table 1). So, relatively little fuelwoodcurrently comes from the same supply category as mostsawlogs, veneer logs, and pulpwood.
METHODS USED TO PROJECT WOOD ENERGY USE TO 2040
Wood energy demand and supply have been projectedthrough the year 2040 with the use of a formal computersimulation modeling procedure, which has two partscorresponding to the industrial/commercial and residentialsectors. These two sectors are very different in manyrespects, and in consequence, the models are also quitedifferent, although they share some commoncharacteristics. CHIPS and WOODSTOV III are bothsimulation models written in DYNAMO and originallyconceptualized by people in the same research group.
The residential wood use model (WOODSTOV III) is ademand model that estimates residential woodfuel demandgiven a set of input parameters. It does not keep aninventory of available wood resources or estimate fuelwoodprices, but uses the price and supply information from theindustrial wood energy model (CHIPS). CHIPS is both asupply and a demand model, which keeps an inventory of woodfuels available through its forest inventory sector. CHIPS
233

Figure 1. Historical and projected wood energy use.Sources: Refs. 10, 14, 17.
Figure 2. Data flow between the TAMM, WOODSTOV and CHIPSmodels.
234

Figure 3. Division of United States into regions forprojection models.
235

Table 1. Wood energy use estimates by the USDA Forest Service and U.S. DOE for 1986

CHIPS Overview
Figure 4. Components of the CHIPS model.

provides estimates of fuelwood prices to WOODSTOV andreceives estimates of residential fuelwood demand fromWOODSTOV. Both the demand and supply side of the CHIPSmodel are affected by the consumption of wood in the forestproducts industries, and CHIPS therefore exchangesinformation with the U.S. Forest Service forest Sectorprojection model, the Timber Assessment Market Model (TAMM)(1,5). TAMM incorporates estimates from other specializedmodels that project pulp and paper production, lumber andpanel production, timber required to produce these productsand resultant timber inventory. The interactions among themodels is shown in Figure 2.
Both the CHIPS and WOODSTOV models are regionallydisaggregated because of the strong regional differences inwood energy use patterns. Transporting wood fuel for longdistances is not economical because of its low energy toweight ratio. Consequently, relatively local markets havedeveloped. The results of the modeling are shown in thispaper as national totals ancl totals for three regions-North, South, and West (Figure 3). The model regions (fivein CHIPS and nine in WOODSTOV) have been aggregated toproduce results for each of the three U.S. regions.Verification of the two models is conducted independentlyagainst separate data sets but both use consistentassumptions about future prices of conventional fuels.
The Industrial Fuelwood Projection Model (CHIPS)
The structure of each regional model is basically themodel structure described by Van Wie (18). The model is asystem of levels and rates controlled by a set of economicdecision-making functions that simulate the behavior ofnumerous energy-using companies and fuelwood suppliers.The model has two main parts: an industrial boiler fuelselection submodel and a fuelwood/mill-residue supplysubmodel (Figure 4). The two submodels are connected byfour variables:
1. Average prices paid by forest product industries forspecific categories of fuelwood
2. Average prices paid by non-forest-productsindustries for specific categories of fuelwood
3. Total industrial fuelwood demanded by various users
238

4. Total fuelwood supplied from various sources
The boiler selection submodel is derived from a modelknown as WOODBLR3 (4). The boiler submodel has foursectors corresponding to the four major industrial sectorsusing wood energy. These are 1) pulp and paper, 2) lumberand wood products, 3) large nonforest industries, and4) small nonforest industries. Roundwood and mill residuedemand for fuel is tracked separately for each sector foreach region. In the case of the pulp and paper industry,the contribution of black liquor is subtracted from thedemand for total energy. In each sector, the same methodis used in the model to allocate industrial. boilerinvestments among four boiler types: wood-fired,coal-fired, gas-fired, and oil-fired. The model simulatesthree specific rationales for boiler investments: 1) tomeet new capacity requirements, 2) to replace oldboilers,and 3) to switch from one fuel type to another.
New capacity and replacement capacity investments areallocated among the four boiler types by a logit functionbased on an adjusted lifecycle cost for each boilersystem. The determinants of the adjusted lifecycle costsare 1) the actual lifecycle cost of building and operatingeach boiler system, 2) the perceived security of each fuelsupply, and 3) the awareness of and confidence in woodbioler technology. Specifically, the actual lifecycle costof each boiler type will be adjusted upward if there is aperceived insecurity in the fuel supply as indicated by anunsteady or unpredictable fuel price. Thus , CHIPSsimulates the implied risk of an insecure fuel supply as anaddition to the lifecycle cost of a boiler system. Inaddition, the lifecycle cost of a wood-fired boiler systemis adjusted upward to reflect the low awareness of andconfidence in wood boiler technology, especially among thenon-forest-product industries. As wood boiler technologyachieves greater levels of penetration into the industrialenergy market, awareness and confidence grow, increasingthe competitiveness of wood energy.
The decision to switch boiler fuels is based on thecalculated payback period of the proposed installationrelative to the alternative. Again, fuel supply securitiesand wood technology awareness can weigh in thedecision-making process, reducing the extent to which fuelswitching occurs even when the payback period is short.
The model addresses an important concern: that weprevent an unrealistic demand for wood fuel from plantslocated a long distance from wood supplies. To controlfuelwood use in forest products plants, the model relies onwood prices to limit demand. We assume such plants arenear wood sources. To control fuelwood use innon-forest-products plants, we rely on 1) wood price, whichis adjusted upward to account for their higher cost forwood, due in part to higher transport costs, and 2) anupper limit on the proportion of non-forest-products boilercapacity that is likely to be near wood resources and would
239

have realistically low transport costs. As a result ofthese controls, wood energy does not account for more than1% of energy consumed by non-forest-products plants in ourprojections and non-forest-products plants account for nomore than 3.6% of all wood boiler capacity.
Demand for nonfuel timber products is exogenous but isincluded in the inventory and price structure of the CHIPSmodel so that fuelwood demand and the demand for otherproducts are linked.
The demand for industrial fuelwood estimated by theboiler selection submodel is met from a fuelwood inventorythat is tracked by the fuelwood supply submodel. Thesupply submodel accounts for five different fuelwood typeswithin the industrial wood energy market: hardwood chips;softwood chips; logging residue; mill residue; and bark.A logit function is used to distribute fuelwood based onthe price of each component of fuelwood supply. AnImportant assumption within the pricing sector of CHIPS isthat prices will be set to favor the use of waste wood andresidues, since these components have little value outsidethe wood energy market. Thus, the price of chips, thecostliest component of fuelwood supply, places a practicalupper limit on the price of the residual and wastecomponents of fuelwood supply.
The second assumption is that the supplies of fuelwoodwill be limited to categories described above. Noallowance has been made for the possibility of thedevelopment of plantations of fast-growing wood or thesignificant recovery of waste wood products, such asdemolition debris or waste pallets.
The third assumption is that wood energy conversiontechnology will remain relatively static through 2040. Weassume that combustion technologies will remain dominant
240

and that liquid fuel production from wood will not besignificant.
The CHIPS model is quite well suited to evaluatingalternative scenarios that might include changes in any ofthe assumptions described above. Earlier versions of themodel have been used to evaluate some of these issues (3).In general, the model should be considered as a long-termtrend analysis tool and not as a predictor of short-termmarket fluctuations.
External Inputs. The CHIPS model has a number ofimportant external inputs. These fall into two categories:inputs related to forest products and fuel priceinformation. Projections of future consumption of pulp,timber, and residential fuelwood are received from the TAMMand WOODSTOV models. The pulp and timber consumptionestimates received from TAMM are used for both submodels inCHIPS. The demand for pulp and timber affects the demandfor energy in pulp, lumber and other wood productsindustries, which in turn affects the demand for fuelwood.Pulp and timber production also increase the supply oflogging and mill residues and reduce the forest inventoryof timber. CHIPS also uses and is very sensitive to theprojected future price of competing fuels. Fuel priceprojections taken from DOE are used as one of the keyexogenous variables in the model. The DOE industrial fuelprice projections that were used in the model are shown inFigure 5.
Model Verification. The CHIPS model is initializedwith 1970 data and simulates the system from 1970 to 2040.The model has been calibrated and validated on a limitedset of variables for the period 1975 to 1985. Severaldifficulties are associated with validating this model.The most important is the dearth of continuous sets ofhistorical records of wood energy use by fuelwood type andindustrial sector. The most important record against whichthe model can be validated is the American Paper Institute(API) records of wood energy use among their membercompanies. This represents over 90% of the energy demandin the pulp industry in the United States. The results ofthe CHIP model simulations are shown plotted against theAPI record of wood energy use (excluding black liquor) forthe period of 1975 to 1985 in Figure 6. As can be seenthere is relatively good agreement between the modelprojections and reported data. Because the structure usedfor projecting woodfuel use in the other sectors isrelatively similar to that used for pulp and paper, we mayhave some confidence in the other sectors also. However,in projecting as far into the future as 2040 we cannot beconfident that the parameters established on the basis ofthe period 1975 to 1985 will hold for over 50 years. Ingeneral, the reliability of projections will declinefurther into the future and as the model deals with smallersupply and demand sectors. Because we have been able toverify the behavior of the model against real world dataover a period of 10 years for the pulp and paper industry,
241

Figure 5 . Industrial fuel price projections from DOE usedin CHIPS model.Sources: Ref. 17, USFS projections.
Figure 6. Reported fuelwood usesimulated use for theSources: Ref. 2, USFS
242
(API) comparedpulp and paperprojections.

we have the most confidence in the results for thatsector. The total industrial consumption estimates fromthe model have been checked against estimates made by DOE(17). After allowance is made for the treatment of blackliquor, the model simulations and the DOE estimatesgenerally agree for the 1980-1986 period, given thedifferences between the DOE and USFS estimates. Thissuggests that the model is reasol~ably representing theaggregate behavior of the nonpulp industries as well.Specific checks have been made of other parameters in themodel against known data points or estimates made duringthe last 10 years. Parameters checked include biomassinventories, production of logging residues, use of millresidue for fuel and wood prices. After allowances fordefinitional differences there is broad agreement in bothmagnitudes and trends.
Sensitivity testing has been conducted on numerousparameters over many iterations of the model, and severalchanges have been made to make the model more robust incertain areas. Not surprisingly, the model is verysensitive to the price of competing fuels. Becausefuelwood is a very small part (about 2%) of the nationalenergy picture, wood enelgy use is strongly influenced bynational energy trends but itself exerts relatively littleinfluence on those trends. The results presented here onlyshow projections based on one set of fuel price projections(Figure 5); but several other fuel price forecasts havebeen tested, and in nearly all cases, the general trend offuelwood consumption follows the trend in real oil prices.The model is also sensitive in some sectors to changes Indemand for other forest products. As described above,increased production of pulp or timber affects both thedemand and supply side of the model, which makes theindustrial fuelwood model quite sensitive to the results ofthe TAMM model. Overall, the CHIPS model is most sensitiveto these exogenous variables, which is consistent with thesituation in which fuelwood plays a relatively small partin two large national markets: the energy market and theforest products market.
The Residential Fuelwood Projection Model (WOODSTOV)
Structure of the Model. The residential fuelwoodprojection model is a systems dynamics simulation writtenin Dynamo and run on a mainframe computer. It has nineindependent regional models with identical structures. Theprojections for the North, South, and West regions shownhere are aggregated as follows. The North region isaggregated from the North-Central, Mid-Atlantic and NewEngland model regions. The South region is aggregated fromthe Southeast and South-Central model regions. The West isaggregated from the Pacific Northwest, Southern RockyMountain, and Northern Rocky Mountain model regions.
The structure of the model was developed by Marshalland others (6,7,8). The model is a system of levels and
243

rates controlled by a set of economic decision-makingfunctions that simulate the behavior of households. Themodel has two main parts simulating wood use in stoves andwood use in fireplaces (Figures 7 and 8).
The submodel that estimates wood use in stoves andfurnaces (hereafter referred to as stoves) divides occupiedhousing units (equivalent to the number of households) intothree types: single family, multifamily and mobile homes.Each of these types is further subdivided into householdsusing oil, natural gas, or electricity as a primary fuel,or a backup fuel for wood.
Wood use in stoves is calculated separately for eachof these nine categories of households in each region. Theamount of wood used in each category is the product of theamount of fuelwod use capacity installed (stove orfurnace) and the proportion of capacity used (Figure 7).The fuelwood use capacity is the product of the number ofhouseholds with capacity and the average capacity in ahome. Capacity is modified in each successive period by1) equipment installation in new housing (determined byfuel cost savings if wood is used rather than theconventional fuel alternative), 2) retrofits to installwood-burning capacity (determined by the payback period fornew wood-burning equipment), and 3) retirement of oldequipment (influenced by wood fuel cost savings). Theproportion of capacity actually used is determined by thefuel cost saving if wood is used rather than theconventional alternative.
A number of important adjustments are made incalculating capacity additions and removals, and capacityutilization. First, stove capacity installations in newhomes are influenced by installation costs that vary byhousing type and 1) increase as the fraction of householdswith stoves Increases and 2) increase as wood heat providesa greater fraction of heating needs in the averagewood-heating home. Second, cost of fuelwood is increasedas the proportion of wood-burning households increases.This is to reflect the fact that late adopters tend to behouseholds that 1) have less access to wood they can cutthemselves and therefore must purchase or 2) live furtherfrom wood sources and must purchase wood, which includeshigher transport costs. Third, wood fuel cost savings areinfluenced by the fact that a given amount of heat providedby a wood stove will displace a greater quantity ofconventional fuel than the same amount of heat provided bya central furnace. In other words, when a wood stove isused, fewer rooms are heated. This behavior increases woodfuel cost savings compared to fuels burned in furnaces.
Wood use in fireplaces is calculated in a simpler waythan wood use in stoves. Wood use in fireplaces is theproduct of the number of households using fireplaces andthe average amount of wood used per household (Figure 8).The number of households using fireplaces is influenced bystove fuel cost savings. Fuel cost savings for stove use

Figure 7. WOODSTOV-III model structure for wood use instoves.
Figure 8. WOODSTOV-III model structure for wood use infireplaces.
245

is taken as a proxy for the perceived desirability of usingfireplaces. The average amount burned is influenced byfuelwood price.
First, it is assumed that households make decisionsabout fuel choices based on perceived economic benefit.The ecolmmic benefit for early adopters includes access torelatively inexpensive wood supplies that they purchase orcut themselves. It is assumed the net economic benefit forlate adopters is reduced because they must pay more forwood supplies they purchase or cut themselves. The modelassumes wood users place a cost on the extra effortrequired to use wood. This extra effort is assumed toincrease for late adopters but does not increase generallyover the projection period.
Second, in our base case projections, the effect ofregulations on wood-burning equipment and use is assumed tobe minimal. We discuss a test of this assumption in themodel verification section below.
Third, it is assumed that the conversion efficiencyfor conventional fuels and fuelwood will improve through2000, but the average wood fuel conversion efficiency willremain somewhat less than for conventional fuel. After2000 conversion efficiencies for all fuels are assumed toremain constant.
Fourth, it is assumed that the mix of housing typesand conventional fuels used in various regions will remainconstant over the projection period. Fuelwood use woulddecrease to the extent that households moved from singlefamily to multifamily housing units. Fuelwood use wouldalso decrease to the extent that households shifted tolower cost conventional fuels, thus decreasing theadvantage of wood burning. However, the effect of fuelswitching on wood use will be minimized under theprojections used here where natural gas and oil areexpected to cost about the same on average nationwide(Figure 9).
oil, natural gas, and electricity through 2010 are from DOEprojections (17). By 2020 and thereafter, prices areassumed to level off at the equivalent of $50 per barrel ofoil (1982 dollars) (Figure 9). Fuelwood prices areprojected by increasing regional prices from a 1980survey (9) at t)ie same rate as whole chip prices projectedby the CIIIPS model. The number of households is projectedto increase at the rate projected for the 1989 ForestService Assessment (13).
246

2040. The model has been calibrated and validated usingseveral sources of information about trends in fuelwood usebetween 1970 and 1986, and detailed survey data on fuelwooduse characteristics for 1980. Three sources of informationwere used to establish the national trend in residentialfuelwood use between 1970 and 1986:
1. Forest Service (FS) surveys/ estimates for 1970, 1980,and 1986
2. DOE estimates for 1970 to 19833. DOE surveys for 1981 to 1986
The first two sources agree on a rapid increase in usebetween 1970 and 1980 but do not agree on the level offuelwood use in 1970. The DOE sources agree on acontinuing increase in the early 1980’s. Tile FS and DOEsurveys suggest a decline by 1986. The FS surveys alsosuggests use in 1986 was lower than in 1980. Using thisinformation, the WOODSTOV model was calibrated to increasefrom a 1970 level of 12 million cords, to the 41 millioncords in 1980, then decrease to 38.9 million cords in 1986(Figure 10).
In addition to tracking national total use, the 1980model estimates for the North, South, and West are close to1980 survey estimates (Table 2), and separate 1980 modelestimates of wood use in stoves and fireplaces are close to1980 survey estimates.
Sensitivity testing, conducted with many model runs,shows the model to be relatively insensitive to modestchanges in single assumptions about how stove capacityadditions or removals will respond to a given fuel costsavings or payback periods. The model is quite sensitivethough to changes in projected prices for fuelwood andconventional fuels.
To assess the possible impact of EPA stove standardsand more widespread restrictions on fireplace use weprepared a high regulation impact projection. In the basecase, the cost of stove installation increases in responseto increased proportion of households owning stoves andincreased proportion of a home’s heat that is supplied bywood. In the high regulation impact case four changes aremade:
1. Stove costs increase 35% starting in 1990.2. Stove efficiency is 5% higher by 2000 than in the
base case.3. The number of fireplaces In homes is 10% lower
by 2000 than in the base case.4. Wood use in fireplaces is 10% lower by 2000 than
in the base case.
Under the high regulation impact assumptions,residential fuelwood use would increase 41% rather than
247

Figure 9. Residential fuel costs from 1960 to 1986, withprojections to 2040.Sources: Ref. 17, USFS projections.
Figure 10. Reported fuelwood use compared to WOOSTOV-IIIsimulated fuelwood use in-residences.Sources: Refs. 9, 13, 14, lb, USFS projections
248

249

65% between 1966 and 2020. Fuelwood use would be 12%less in 2020 for the high impact case (Figure 11).
PROJECTIONS OF FUELWOOD CONSUMPTION 1986 TO 2040
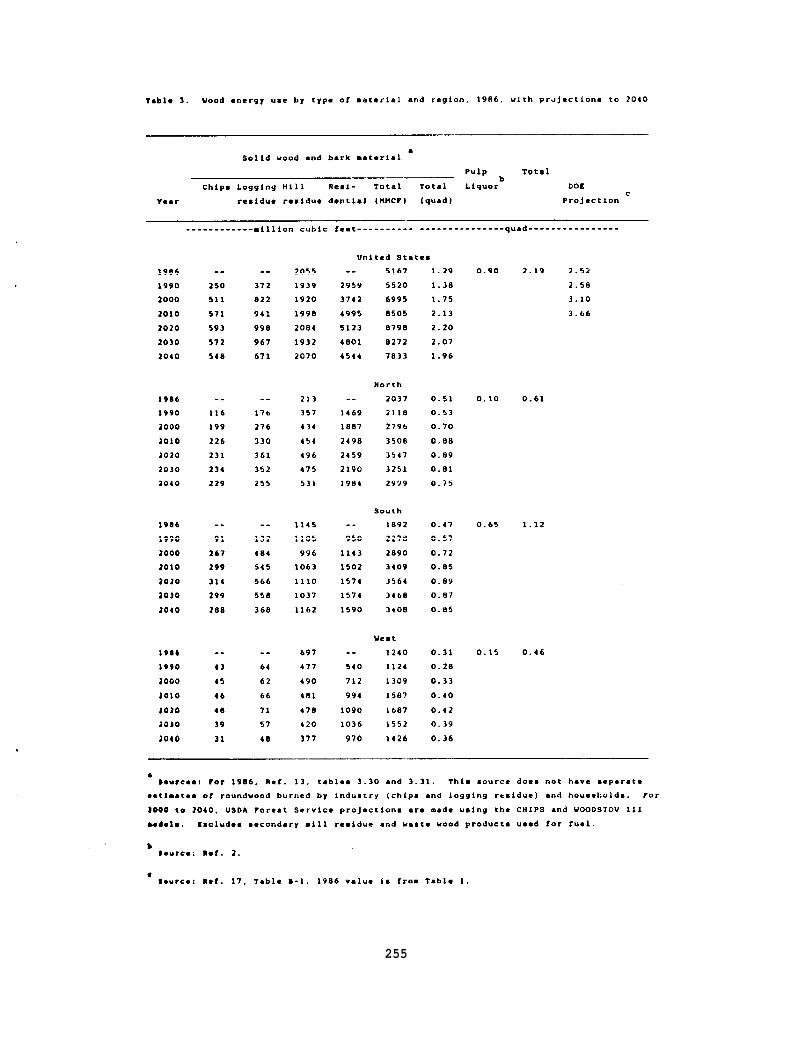
The projections of fuelwood use from theindustrial/commercial and residential fuelwood models havebeen aggregated into three regional projections and into aprojection for the United States as a whole (excludingAlaska and Hawaii). These projections are presented inFigures 12 to 15 and Tables 2 and 3. Although the overalltrend for 1980 to 2040 is one of increase in all. regions,there are some notable differences between the regions andamong the component parts of the total.
As a result of a projected cost advantage of fuelwoodover nonwood fuels in all regions, the industrial andresidential fuelwood use is projected to increase fromabout 1.3 quad or 5.2 BCF in 1986 to 2.2 quad or 8.8 BCF in2020, and to fall to just below 2.0 quad or 7.8 BCF in 2040(Figure 12). Total fuelwood use declines after 2020because residential use is expected to decline as fuelwoodbecomes less competitive with other fuels. Residentialfuelwood use is also projected to decline from 1986 to 1990because of lower oil prices. This projection is supportedby reports of current trends in the residential sector.
Although residential fuelwood use is currently muchlarger than industrial./commercial use, the industrial/commercial sector is expected to continue to grow morerapidly, with most increased supply coming from loggingresidues and whole tree chips. Mill residue use will growslightly as the pulp and timber industries expand, but mostgrowth in wood energy outside the forest productsindustries will be supplied by roundwood (Table 3)(Figure 12).
The North has the highest wood energy consumption,with more than double the consumption in the Westthroughout the period. The northern regions show thegeneral patterns of consumption described for the nation,except that the fluctuations in residential use aresufficiently large to cause greater variation in the totalfuelwood consumption (Figure 13). Residential andconsequently, total fuelwood consumption are projected todecline from 1986 to 1990 even though some small growthstill occurs in the industrial and commercial sectors.Residential use also falls again after 2020 for thereasons already described. Generally higher than averageenergy costs in the North make the region more sensitive tofuel price competition.
Although the South starts off with lower levels offuelwood consumption in both the residential andindustrial/commercial sectors, it is projected to increaseits consumption more rapidly overall, so that by 2040fuelwood consumption Levels will exceed those in the North
250

(Figure 14). Residential consumption in the south is notprojected to fall as sharpiy from 1986 to 1990 whileindustrial/commercial use is expected to increase quiterapidly as a result of the growth in use in the forestproducts industries in the region. A far greater share ofthe totaL industrial fuelwood supply is provided from millresidues in the South, although the rate of growth in thethe use of chips and logging residue should be much morerapid than in either of the other two regions. Unlike theNorth, residential use remains almost level after 2020,while the overall decline in fuelwood use is accounted forby a reduction in the logging residue supply after 2020.
The West is a very large and diverse region in whichoverall fuelwoad use is relatively less important.Although tile fuelwood use trend is projected to increasethrough 2020 and then decline in line with the otherregions, the relative changes in residential andindustrial/commercial use are quite different (Figure 15).Unlike the rest of the nation, no significant increase inindustrial fuelwood is projected through the period, andmost industrial/commercial fuelwood is expected to besupplied by mill residues. Almost all the total fuelwoodincrease through 2020 is projected to come from increasesin the residential sector, which should double fuelwood usein the West from 1990 to 2020, after a flat period from1980 to 1990. Residential use is projected to fall after2020 as fuelwood loses some of its competitiveness againstother fuels.
Figure 1 shows how our projections compare to recentand long term historical trends. Between 1990 and 2010,the roundwood portion of wood energy use is projected toincrease more slowly than it did during the late 1970s andearly ‘80s. Its rate of increase will also be slower thanthe rate of increase in all wood energy use projected byDOE . Although DOE projects total wood energy use willclimb well above the 2.8 quad (11 BCF) level attained inthe 1870s, roundwood used for fuel will increase to justover half the level attained in the 1870s. Roundwood usefor fuel is projected to peak in 2020 at 6.7 BCF.
Nationally, the proportion of all U.S. roundwoodconsumption that is used for fuel is not expected to changedramatically between now and 2040. Using the projectionsfrom this study and the roundwood use projections from theTAMM model (13), Figure 16 compares the projectedconsumption of roundwood for fuel and nonfuel use.Roundwood use for fuel as a percentage of total roundwooduse is expected to go from 27% in 1986 to about 29 % atthe projected peak of fuelwood consumption in 2020, beforefalling back to 25% in 2040. Fuelwood’s share ofroundwood consumption is projected to remain higher thanduring the last three decades. Fuelwood will probablybecome a relatively permanent part of the forest productseconomy.
251

Source; USFS projections
for wood andFigure 12. Wood energy projectionsblack liquor to 2040.Sources: Ref. 17, USFS projections.
252

Figure 13. U.S. North fuelwood consumptionprojected to 2040.Source: USFS projections.
Figure 14. U.S. South fuelwood consumptionprojected to 2040.Source: USFS projections.
253

Figure 15. U.S. West fuelwood consumptionprojected to 2040.Source: USFS projections.
Figure 16. U.S. roundwood consumption by wood fuel andwood product categories projected to 2040.Sources: USFS reports and projections.
254
—
255

To more closely describe the impact of fuelwood use ontimber sources used for sawlogs, veneer logs, and pulpwoodwe must further subdivide total. roundwood used for fuel.First, we deduct all logging residue that is used forfuel. This is a category of material that will be a drainon timber resources regardless of whether or not it is usedfor fuel (Table 4). Material that is now logging residuewill be removed for fuel in integrated operations whensawlogs and veneer logs are removed or in secandaryoperations. Second, we deduct material coming fromnon-growing stock sources. For residential fuelwood use,two sources indicate non-growing stock use is 75-80%(9,13). The (Ion-growing stock portion is higher forhardwoods and lower for softwoods. For industrial andcommercial use, most fuelwood which is not logging residuewill be taken by whole tree chipping If whole treechipping harvests wood from average stand~ on timberland,the average proportions of non-growing stock would be 50%and 30% for hardwood and softwood stands, respectively(11). However, the proportion of fuel chips that isnon-growing stock will be higher than these figures for tworeasons. First, whole tree chipping for fuel will tend touse stands with a higher proportion of non-growing stockbecause they will be cheaper. This may include some landwith trees that is not classified as timberland. Second,harvest of chips for fuel will often be combined withharvest of chips for pulp mills. Pulp chips will moreoften be from clean growing stock (main stem) parts oftrees whereas fuel chips wil 1 more often he fromnon-growing stock parts (Tops, braches) w i t h m o r e b a r k a n ddirt content.
The overall proportion of roundwood (excluding loggingresidue) from non-growing stock will be largely determinedby residential use. Although overall industrial/commercialuse is projected to increase, so does residential use, andindustrial use does not exceed 14% of total use.
The estimated 1986 proportion of roundwood fromnon-growing stock was taken from Forest Serviceestimates (13). It is assumed to remain high over theprojection period since residential use of non-growingstock sources is expected to remain high, and expanded useof whole tree chipping operations for industrial/commercialfuel will provide fuel chips with a high proportion ofnon-growing stock similar to current levels using thechipping practices mentioned above.
Growing stock use for fuel is projected to increasefrom 0.80 BCF in 1986 (5% of all roundwood use), to a highof 1.35 BCF in 2010 (5%), then decline to 1.14 BCF in 2040(4%) (Table 4). Even though 25-30% of all roundwood maybe used for fuel over the projection period, only 4-5% isprojected to come from growing stock.
--

257

CONCLUSIONS AND RESERVATIONS
The general conclusion that we draw from thesemodeling studies is that fuelwood use, after a rapidincrease in the 1970s and early 1980s, IS expected to growsteadily through 2020 at an average rate slightly greaterthan that for all other timber products. Although thereare important regional variations in projected fuelwood usepatterns, the national picture is one of steady growth inboth residential and industrial fuelwood use through 2020,with a decline in both from 2020 to 2040. Theseprojections suggest fuelwood’s share of total roundwoodharvest is set and fuelwood will become a fairly permanentfeature of the forest products economy. This may haveimportant implications for forest management in the longterm.
A second and not at all surprising conclusion is thatthe demand for fuelwood is very dependent on the price ofcompeting fuels. Any marked rise in real prices of oil,gas, or to some extent electric power can be expected tocause fuelwood use to rise in both the residential andindustrial sectors, with the residential sector probablyliable to more rapid responce especially in some regions.These projections have used DOE energy price projections,which shows moderate increases in oil and gas pricesthrough 2010. Other enerqy price projections would producevery different responses in the fuelwood market. To theextent that uncertainty exists in oil Price projections,uncertainty will necessarily exist in fuelwood demandprojections as well.
Finally, we should note that national andinternational energy policies may have to be reviewed inthe next decade as we gain a better unders.canding of thegreenhouse effect. The costs of our present heavy relianceon fossil fuels may be determined to be unacceptable, andin consequence, national policy may restrict increased useof fossil fuels and could even encourage large scalereforestation to support wood fuel production. This wouldclearly produce very significant changes in the projectionsthat we have made. To a large extent, these projectionsare based on a business as usual view of the next fiftyyears, which may very well turn out to not be the case.
258

1.
2.
3.
4.
5.
6.
7.
8.
9.
10.
11.
REFERENCES CITED
Adams, D.M. and Haynes, R.W., “The 1980 SoftwoodTimber Assessment Market Model: Structure,Projections, and Policy Simulations”, Forest ScienceMonograph 22, supplement to Vol. 26, no. 3,Sept. 1980.
American Paper Institute, U.S. Pulp and PaperboardIndustry Estimated Fuel and Energy Use, EnergyData Services, NY, NY, 1987.
Bradley, M.A., “A Simulation Analysis of Policies toControl Boiler Emissions from Southern Industries”,DSD #468, Resource Policy Center, Thayer School ofEngineering, Dartmouth College, Hanover, NH, 1982.
Bradley, M.A., Van Wie, D.A. and Hewett, C.E.,“A Simulation Analysis of Industrial Wood Energy inthe South 1970-2000”, DSD #466, Resource PolicyCenter, Thayer School of Engineering, DartmouthCollege, Hanover, NH, 1982.
Hayncs, R.W. and Adams, D.M., “Changinq Perceptions ofthe U.S. Forest Sector: Implications for the RPA
Economics, Dec. 1983.
Marshall, N.L., “The Dynamics of ResidentialWood-Energy Use in New England 1970-2000”, RP#363,Resource Policy Center, Thayer School of Engineering,Dartmouth College, Hanover, NH, 1981.
Marshall, N.L, “WOODSTOV: A Regionally DisaggregatedModel of Residential Wood-Energy Use 1970-2000”,DSD #447, Resource Policy Center, Thayer School ofEngineering, Dartmouth College, Hanover, NH, 1982.
Marshall, N.L. ,Patten III, B.M., and Skog, K.E., “TheDynamics of Residential Wood-Energy Use in the UnitedStates: 1970-2030”, DSD #477, Resource Policy Center,Thayer School of Engineering, Dartmouth College,Hanover, NH. 1983.
Skog, K.E. and Watterson, I.A., “ResidentialUse in the United States: 1980-81”, ResourceWO-3, U.S. Department of Agriculture, ForestWashington, DC, 1986.
FuelwoodBull.Service,
USDA, Forest Service, Fuelwood Used in the UnitedStates: 1630-193Q, Circular no. 641, Washington, DC,1942.
USDA, Forest Service, Tree Biomass - A State-of-the
-Art Compilation, GTR-WO-33, Washington, DC, 1981.
259

USDA, Forest Service, U.S. Timber Production, Trade, Consumption and Prices, 12.
1950-86,Misc. pub. 1460, Washington, DC, 1981.
13. USDA, Forest Service, “An Analysis of the TimberSituation in the United States: 1989-2040”,Parts 1 & 2, draft, Washington, DC, 1988.
U.S. Wood Energy Consumption from 1949 to 1981,14. USDOE, Energy Information Administration, Estimates of
DOE/EIA-0341. Washington, DC, 1982.
15. USDOE, Energy Information Administration, Residential Energy Consumption Survey: Consumption andExpenditures, April 1984 through March 1985,Part 1, DOE/EIA-0321/l(84), Washington, DC, 1987.
16. USDOE , Energy Information Administration, AnnualEnerqy Review- -1988, DOE/EIA-0384(88), Washington,DC, Forthcoming.
17. USDOE, Office of Policy, Planning and Analysis, LongRange Energy Projections to 2010, DOE/PE-00f12,W a s h i n g t o n , D C ; 1988
10. Van Wie, D.A., “Industrial Wood Energy in the South,1970 to 2040”, M.S. thesis, DSD #487, Resource PolicyCenter, Thayer School of Engineering, DartmouthCollege, Hanover, NH, 1983.
269 Printed on recycled paper