foreign investment in papua new guinea
TRANSCRIPT
,·
Foreign investment in Papua New Guinea

Finally there is the question of dependence on foreign investment. As in many policy areas, Papua New Guinea has had the benefit of watching what has happened in other countries. There is often far too much ideological debate about whether foreign investment is a good thing or a bad thing, and far too little attention paid to how we can get the foreign investment we need on the best terms.
Concluding remarks of Barry Holloway, CBE. MP. and Minister for Finance in his 1979 Budget Speech delivered on 14 November 1978.

Pacific Research Monograph
12
Foreign investment in Papua New Guinea Policies and practices Philip Daniel and Rod Sims
Series editor Helen Hughes
National Centre for Development Studies The Australian National University Canberra 1986

©Philip Daniel and Rod Sims 1986. This work is copyright. Apart from those uses which may be permitted under the Copyright Act 1968 as amended, no part may be reproduced by any process without written permission. Inquiries may be made to the publisher.
© All or part of this work may be copied by members of educational institutions and libraries for the purpose of research, study or teaching provided the source is acknowledged.
National Library of Australia Cataloguing-in-publication entry
Daniel, Philip. Foreign investment in Papua New Guinea.
Bibliography. ISBN 0 86784 761 1. 1. Investments, Foreign - Papua New Guinea. I. Sims, Rod. II. Australian National University. National Centre for Development Studies. Ill. Title. (Series: Pacific research monograph; no. 12.)
332.6'73099'53 ISSN 0155 9060 Printed and manufactured in Australia by the Australian National University.
Printed and manufactured in Australia by the Australian National University.

Ab s tra ct
This monograph initially examines the r elat ionship among Papua New Gu inea ' s economic stru c tur e , d evelopment s t rategy , macroeconomic policy and f oreign investment policy . In general t erms it then examines the available s tatist ical data on f oreign inves tment , the g eneral regulatory framework f aced by f oreign inves t ors , the evolution of g eneral f i scal incent iv es and comparative expectations and exp erience in f oreign investment f lows .
The f ore ign inve s tment policy and exper ience in the mining , petroleum , f ores try , agr iculture , f i shing and manufac turing sec tor s are then d i scus sed in detail : the suc cess of Papua New Guinea ' s policies in mining and petroleum contrasts wi th the less favourab le experienc e in other sec t or s . The pap er consider s to what extent foreign inve s tment re gime s which evo lved in the var ious sectors have been consistent with the country ' s si tuat ion and obj ectives , and also with the minimum requiremen ts of f oreign inve stor s . In exp laining the d if f erence between expec tat ions and out comes of foreign inves tment f lows an attempt has been made to dis t inguish the relative influences of internat ional marke t condit ions , dome s t i c economi c o r phys ical const raint s , and po licy inadequacies .
The paper seeks to demonstrate that when the role of f oreign inve s tment i s p laced wi thin the c ontext of a country ' s development s trategy , when c l ear ob j e ctives ar e ident if ied , wi th p olic ies tar geted to real cons traints and based on an unders tanding of the re levan t internat ional indus try ec onomics , foreign inve stment can bring immediate net benefits whi ch are worth the effort involved to ensure the p re-condi t ions j us t s tated are met .
The pap er conc ludes tha t Papua New Guinea will have to devote more a t tention to f oreign inves tment policy in the nonmining sec tor s of the ec onomy and identif ies a number of imp or tant fac t or s up on which success in a t trac t ing b eneficial fore ign inves tment wi ll depend .
v

C ont en t s
1 Introduc t ion
2 Papua N ew Gu inea : economic pos it ion and d evelopment strategy
3 Macroeconomic management and f oreign inves tment
4 Foreign investment s tocks and f lows
5 Foreign investment policy and obj ec t ives
6 Exp ec tations ver su s experience in f oreign investment f lows
7 Papua N ew Gu inea ' s comparat ive advant age
8 The general regulatory framework
9 Evo lu t ion of g eneral f i scal incent ives
10 Mining and petroleum
11 Forestry and f ores t industries
12 Agricu lture
13 F isheries
14 Manu fac tur ing
15 C onclu s ions
Append ices
1 Publ ished reserves from mines and maj or gold pr ospec t s in Papua New Gu inea
2 The s t ock of foreign investment in Papua N ew Gu inea
3 Government of Papua N ew Gu inea , Industrial I .n format ion P amphlet N o . 18
Ref er enc es
vii
1
3
14
18
19
23
27
30
40
47
7 0
8 2
9 1
9 5
100
105
106
10 7
141

viii
Tab les and Figure s
Tab le s
1
2
3
4
5
6
Economic act ivity of ci tizen populat ion , 1980
I nd ice s of relative change in public f inance FY1972 /7 3-83
Structure of gross domestic product by expend i ture items , FY1972/73 and 1978
Exp or t shares of pr incipal commodi ty gr oup s
Growth and f luctuat ions in the Papua New Guinea economy FY1973/74-84
Financing of priva te cap i ta l expendi ture , 1982
7 Expected and actua l p roduct ion of maj or non-mining exports
8
9
10
11
Agr icu ltural export crop p roduction
Interna tional comparis on of mon thly <:·arnings , 1976
Fin ancia l s tructure of the Bougainville copp er proj ect
Loan s upp ort ob liga tions for shareholders in the Ok Te di proj ect
Figures
1
2
3
Se dimentary bas ins an d p e troleum p rospect ing licence s in Papua New Guinea
Comparative f iscal regimes for min ing and pe tFoleum in Papua New Guinea
Trends in t otal explora tion and grass-roots explo ra tion expendi tu re s
Statis t ical appendix
4
6
8
8
9
13
24
26
28
53
63
48
66
68
1 15
Acknowledgments
The monograph was p repared a s a ca se s tudy f or the E conomi c Affairs Division o f the Commonwealth S ecre tariat as part of a proj ect on comparative p r ivate foreign direct inves tment p ol i cies and performance .
The proj ect s tems from concern ab out the deb t cr1s1s and real decl ine of a id f lows . Can private direct inve s tment p lay a role in f i lling the gap and generating expor t s ? How have expectat ions of inve s tment f lows d if fered from outcomes ? What new approaches to inves tor /hos t-country relat ions show promise ? Papua New Guinea was inc luded because of i t s apparent success in reaching sati s fac t ory deals in the mining sector .
The authors are grateful for the c ooperation of the Governmen t of Papua New Guinea in this s t udy . A numb er of government agen c ie s provided valuable he lp , in p ar t icu lar the Depar tment of Finance , the Department of Minerals and Energy and the Na t ional S tatis t ical Off ice .
The au thors also wish t o thank Vince Cab le , Mike Fab er , Kei th Palmer and John Wylie f or the ir helpful c omment s on an ear lier draf t as well as those a t tend ing a seminar in July 1985 at Mar lborough House , London , organized as par t o f the Commonwea lth Secretar iat p roj ec t .
The authors also wish t o t hank Vishnu Persard , Direc tor of the Economic Af fairs Div i sion of the Commonwea lth S ecretariat , and his colleague s , for their suppor t f or this resear ch .
Finally , the authors are extremely grateful to Marguer ite Cooke and Jane Deakin at the IDS , Sussex , f or typ ing and revising succe s sive draf t s of the monograph . Florence Kireta at the Commonwealth Secretaria t a s s i sted wi th the typing of ear lier draf ts .
The opinions exp ressed in this paper are the responsib ility o f the authors and not any of the agencies with whi ch they have been as sociated .
ix
x
Key to symbols us ed in tables
not availab le
n . a . not appl icab le
z ero
A$ Australian dol lar
US$ Uni ted S tates do llar
(P) provisional e s t imat e subj ect to revis ion
FY f inancial year

Fore ign inves tmen t in Papua New Guinea : policies and practices
1. Introduc t i on
Papua New Guinea reached formal independence from Aus tralia only in 19 7 5 . Its sma l l , open ec onomy exports l i t t l e other than primary mineral , agri cul tural and fore s t product s ; it imports a lmos t all i t s fuel , cap ital goods and other inputs to product ion , together with the larger portion o f its marke ted f ood requirement s . Only one-eighth o f the economica l ly active p opulat ion in 1980 had f ormal wage emp loyment . At the t ime o f internal s e l f- gove rnmen t in 19 7 3 , Aus tra lian grants me t app roximately half government expenditure , and the World B ank did not recognize the country ' s s overeign credit-worthines s until 19 7 6 . Surface transport in Papua New Guinea is made ex tremely d i f f i cult by the terrain : domes t i c markets are deep ly fragmen ted , and the capi tal city i s s t i l l n o t conne c ted by road to any other maj or p opulat i on centre .
Yet in the ten years s ince inter nal s e lf-government Papua New Guinea b ecame a leadin g innovator in the de s i gn of relations between hos t countries and f oreign inve s tors in minerals industrie s . After succe s sful ly renegot iating the agreement governing the coun try ' s one large exi s t ing mine , B ougainville Copper Limi ted ( B CL) in 19 74 , the government reached agreemen t with other f oreign inve s tors f or a feas ib il i ty s tudy into another large copper and gold prospect at Ok Tedi in 19 7 6 , and app roved deve lopment prop osals in 19 80 . In May 1984 , Ok Tedi began gold p roduct ion , making Papua New Guinea ab out f ourth in the l eague of wes tern world gold producers , b ehind the Uni ted S tate , but , for the next two to three years at l eas t , ahead of B raz i l and Aus tralia . When the copper s tage of Ok Tedi is brought into produc t ion , Papua New Guinea will rank j us t b e hind Peru and the Philippines , but ahead of S outh Africa in copper mine production capac ity .
Following the Bougainville and Ok Tedi agreemen ts , and an agreement with Es so for p e troleum exp loration , general p o l icies f or minerals and petroleum were set out and general tax legislation f or the sector was pas sed in 19 7 8 . By mid- 1985 four teen petro leum prospecting li cences had been ne got iated wi th foreign companies , governed by full agreements along the l ines of a s tandard mode l . Natural gas has been f ound off- shore , and there are indications of c ommercial quan t i ties of oil from two on-shore wel l s dri lled in 1983 and 1984 .
1

2
At the same t ime , Papua New Guinea has managed s ince independence to dampen the severe f luctuations in economic activity leve ls charac ter is tic of pr imary commod ity exporters . Inf la tion has been conta ined a t mode rate rates , external payments have been kep t in medium- term bal ance , and the local currency ( the kina) remains freely convertib le for a l l current transact ions . In spite of a s igni f icant dec line in the real leve l of Aus tralian aid a current budge t surp lus has been sus tained throughou t by caut ious fiscal p olicy . The prop or tion of grant aid in government expenditure has now fallen to 30 p er cent . De sp i te the hi gh leve l of exploration activity , mining revenue s in 1983 and 1984 me t a lower propor tion of total government spend ing than at any t ime s ince Bougainv ille Copper Limi ted began to pay tax ; there has since been considerabl e widening and deep ening of the revenue base .
In con trast to these successes , Papua New Guinea ' s f oreign inve s tment p olicies in relat ion to fores try , agr iculture , f ishing and manufac tur ing have been confused and sectoral performance ha s been poor . Among other prob lems these sectors have suf fered from relative neglec t , c omp ared to mining , at the higher politi cal leve ls . With the excep tion of one oil palm p roj ect and s ome smal l ventures exploi ting the nation ' s lobs ter and prawn resources , s ince Independence there have on ly been f our maj or proj ects imp lemented in the f ores try , fishing , agriculture and manufac turing sec tors comb ined , and none of these can be counted a suc ces s : the Ramu Sugar proj ect more than tr ip led the price of domes tic sugar , the s teel rol ling mi ll promp t ly ceased operation , as did a timb er venture , and ano ther t imb er venture is in ser ious default of its agreement .
In this pap er we examine the relationship be tween direc t f oreign inves tment and the deve lopmen t s trat egy of Papua New Guinea , and cons ider to what extent the foreign inves tment regime evolved in different sectors of the ec onomy has been made cons i s tent wit h , on the one hand , the country ' s s itua t ion and obj ec t ives , and on the other , with the minimum requirement s of f oreign cap i tal sources . In exp laining difference s between expectations and ou tcomes f or f oreign inves tmen t f lows an attemp t i s made to dis tingu ish the relative inf luence of interna tiona l marke t cond i tions , domes tic economic or physica l cons tra ints , and p o licy inadequacie s . The sector s cho sen for case s tudy are set in the broader con text of the framework governing priva te inve s tmen t as a whole .
The genera l app roach taken in this paper is organized around three main que s tions . Fir s t , of the three potentia l sources of inve s tmen t ini t ia tive - government , loca l priva te and f oreign pr iva te - what have been the re lat ive roles of each, sec tor by sec tor , and why ? Second , in choo sing an assignment of roles in promoting inve s tment and negotiating agreements have policies addres sed rea l or imaginary cons traint s ? Third , what has been the dis tribu tion of risk and rewar d among the parties to proj e c t s involving f ore ign dire c t inve s tment ? Thr oughou t the monograph

3
we s tre ss the inf luence which the general f ramework of macroeconomic mana gement and microeconomi c in terven tions will have up on inves tment decisions in individual sectors .
2 . Papua New Guinea : economic p osit ion and development s trategy
The country ' s top ography and natural re source base have been largely determined by i t s loca t ion in the z one of intens ive crus tal ac tivi ty at the Wes t Pacif ic rim . Thi s exp lains the fault ing, f old ing and volcanic activity which have produced the ce ntral mountain ranges of the mainland and the lar ger is land s, and also the rich mineralizat ion character is tic of the whole Pacific rim . The topography creates extreme diff iculties f or land communi cat ion, sett lement and a griculture . Swamp condi tions are prevalent in many lowland areas, while the young lands capes of the highlands exhibit s teep s lop es, rapid wa ter run-of f and soil eros ion . The opp ortuni t ies f or extensive sett lement based on seden tary agricul ture are limited . S oi l and c limatic charac teris tics, however, have generated large areas of mixed-spec ies trop ical hardwood f ore s t . Ac cording to Papua New Guinea ' s Res ource Atlas (1973), on ly one per cen t of the land area (461,700 sq . km) is f ir s t-c las s agr icultural land ; 24 per cent is sui ted for agr icul ture, but with limitations ; 4 pe r cent is sui tab le f or grazing ; 55 per cent is deemed unsui tab le f or commercia l agr icultural deve lopment, whi le the remaining area ' s p otential is no t known .
Acc ording t o the mos t recent census ( s ee Tab le 1) a lit tle under hal f the 1980 c i t i zen p opula tion was engaged in ec onomic ac tivi ty, and, of thi s portion, only about one-e i ghth had wageearning j ob s . These f irm d i s tinc tions between typ es of emp loyment, however, are p otentially mi sleadin g . Whi le there are dif fering forms of economic ac tivity ( formal, informal, sub s i s tence ) , peop le may swi t ch eas i ly from one to the other ; over the course of a year significant sections of the p opulation may be p ar t-p ar ticipants in all three, and e sp ecially in some combinat ion of money-raising and sub sis tence rural activities . For this reason, a-dualis tic mode l which classifies b oth workers and products into dis tinct sec tor s of activ i ty is probab ly no t appropriate in P apua New Guinea . A useful alternative i s to consider the inter-relationship between sys tems of economic life based, on the one hand, on exchange of gif t s and subsis tence agricul ture, and on the other, on commodi ty exchange, divis ion o f lab our and cap i tal accumulation ( Gregory 1982). Present-day Papua New Guinea can then b e des cribed

4
Tab le 1 Economic activity of c i t i zen p opulation , 1980
Forma l wage employment
Informa l money-rai s ing activities (mainly farming and fishing)
Subsi s tence f arming or f ishing , and housekeeping
No t economical ly active
Othe r ( in c luding unemp loyed) and not s ta ted
To tal citi zens
(Non- c it izens )
( To ta l population)
Number
200 , 39 2
5 3 2 , 4 14
6 6 9 , 9 5 9
l , 2 9 1 , 154a
262 , 6 15
2 , 9 5 6 , 5 34
5 4 , 19 3
3 , 010 , 7 2 7
aOf which 87 7 , 406 were b e low 1 0 years o f age .
%
Source : Cal culated from data in Papua New Guinea , Na tional P lanning Office ( 1983) .
share
6 . 8
18 . 0
2 2 . 7
4 3 . 7
8 . 9
100 . 0
as an ' amb iguous ' ec onomy : the gi f t economy , b ased on the reproduction of the clan f orm of s ociety in cond i tions of extreme ly limited a lienation of land , has now incorpora t ed within itself aspec t s of the commod ity ec onomy - money and imported produ c t s . Conversely , the modern or commodi ty econ omy uti lized lab our and , to a l imi ted extent , land drawn from the gift economy . P eop le may funct ion in both ' economies ' s imultaneous ly .
The Papua New Guinea nat iona l accoun ts recogni ze a di s t inct ion between marke ted and non-marke ted prod uc t ion : the lat ter accounted f or 17 per cent of gros s domestic product ( GDP ) in 1983 , al though there i s a prevalent view that t his is a cons ide rab le undere s t imate of the s t reng th of the trad itiona l economy (Papua New Guinea , Na tional P lanning Office 1 9 83 : 17 ) . Papua New Guinea ' s deve lopmen t pattern to date has consis ted of a recent , rap id but uneven extension , towider areas of the coun try and greater numbers of peop le, of opp or tuni ties t o gain cash inc omes from marketed p roduc tion , thereby al tering the nature of the traditional economy , while thi s has relieved s ub s is tence production of s ome of the burden of supporting a rapidly growin g populat ion , it has not neces sarily tended to de s t roy it - p rinc ipa lly b e cause the proces s of land aliena tion has hardly advanced at a l l .
As the census sugges t s , however , the ratio o f those deriving cash from in formal or s e l f-emp loyed a c t ivi ties to those earning

wages i s about 2 . 7 : 1 . I f p revious census class ifications ( 19 6 6 and 1 9 7 1 ) are even roughly comparab le, then this r a t i o had b een ri s ing a t a very rapid rate ( 0 . 7 : 1 in 19 66, 1 . 2 : 1 in 19 7 1 - see Jackson 1981 : Tab le 1 . 8) . It is thus obvious that growth of
5
wage emp loyment i s far from being the principal avenue of economic deve lopmen t in Papua New Guinea . The rapid spread of smallho lder expor t crop produc tion s ince the mid-19 60s, the development of rural s ervi ce s and infrastruc ture, and, in more recent years, the grow th of urban self-emp l oymen t appear to have caused inf ormal and self-employed income opportuni t ies to grow much more rap i dly than wa ge emp loyment. Such a pattern of development had a lready been envi saged by late in 1972, when the f ir s t nationa l government came to power ( see, f or examp le, Overseas Deve lopment Group 19 7 3 : 2 7 ) , and was exp l i cit ly incorp orated into the Nat iona l Development S tra tegy o f 19 7 6 :
Wage emp loyment offers very limi ted p rospec t s . . . it i s unlikely that wage emp loyment wi l l grow by more than 3 per cent per year over the next de cade • . . the numb er of peop le in wage empl oyment woul d ri se to 2 7 0, 000 by 1986 . By thi s time the total workforce wil l have grown to over 1 . 65 million . . . . The Government wi ll encourage the growth of wage emp loymen t by p romot ing the es tablishment of indus tries and o ther modern sector ac tivities tha t are e conomically viab le . However, the Government will not p rovide p ermanent s ub s t ant ial sub s i dies mere ly to p romote a margina l increase in wage emp loyment . . . . Ra ther than sub s idising a minority, the Na tional Development S tra tegy seeks to promote the in comes o f t he maj or i ty o f the workforce by p roviding oppor tuni ties for self -emp loymen t (Papua New Guinea, Central P lanning Of f i ce 19 7 6 : 19-20) .
At s e l f-government, the Papua New Guinea authorities were faced wi th a maj or budge tary cons train t on their ab ility to promote emp l oyment or s e l f-emp loyment by means of addit ional pub lic spending : the high degree of dep endence up on budge tary ass is tance from Aus tralia . As a resul t of a la te, but rap id, bui ld-up of gove rnmen t serv ice provis ion and infras truc tural inve s tmen t from the mid- 1960s, central gove rnment expendi ture had grown to account f or 40 p er cen t of marke t GDP by FY 19 7 2 / 7 3, and hal f of thi s expendi ture was funde d direct ly by Aus tralia ( s ee App endix Tab les A . 2, A . 18) . With the approach of Inde pendence b oth governmen ts wi shed to s ee the share o f Aus tralian aid in Papua New Guinea ' s bud ge t begin to fal l . Although arrangements were sub sequent ly made to ensure that the de c line would be gradual, broad ly p redictab le and sustainab le, it meant that a p ortion o f addi tiona l domes tic revenue-rai s ing capac ity each year would have t o b e dev ot ed to the obj ec tive of f iscal self-re liance . The comb ined requirements f or public service and infras truc ture p rovision, and f or reduc tions in Aus tralian aid there f ore p laced a premium on revenue- genera ting economi c activities, and on an increased tax yie ld from exis tin g activitie s . Fo llowing rene gotiation of the

6
B ouga inville Copper Agreemen t , and marked increases in o ther forms of taxat ion , in ternal revenue was q ui ckly raised t o almos t 60 per cent of governmen t spend ing , whi le Aus tralian aid s lipp ed back to ab ou t 35 per cen t (App endix Tab le A . 18) . The rela tive change s in real value of var ious pub lic f inance aggregates over the de cade F'Y.19 7 2 / 7 3 to 1983 are shown in Tab le 2 : revenue has grown rapid ly relative to b oth GDP and government expendi ture , while the real value of Aus tralian aid fell by one- third . By the t ime o f publica t ion of the Nationa l Deve lopment Strategy late in 19 7 6 , the government wa s already s ta t ing that tax ra tes had been raised suf fic iently and tha t future revenue increases would have to come from ec onomi c expans ion .
Tab le 2 Indices o f re la tive change in pub lic f inance F'Y.1 9 7 2 /7 3-83
Index of : ( FY19 7 2 / 7 3 100) Level in 19 83
Real market GDP
Rea l government f ina l consump tion exp end i ture
1 d. a , b Tota gove rnment expen 1ture
. . a Non-m1n1ng revenue
To tal domes tic revenuea
. a Foreign gran t s
109 . 4
7 4 . 8
1 10 . 3
164 . 8
1 7 3 . 5
6 7 . 8
aAll de flated by the implicit price index o f gross domes ti c expend iture (marke t comp onent) , base 19 7 7 .
b inc lud ing in tere s t payments and Ok Tedi inves tmen ts in 1983 .
Source : Appendix Tab le s A . 3 , A . 4 and A . 18 .
Apart from a mode s t amount of continuing gold p roduc tion from the alluvial f ields at Wau and Bulolo , Papua New Guinea ' s mining sector has cons i s ted s olely of the B ouga inville copp er mine at Panguna in the Nor th S olomons Prov ince . S ince the commencement o f commerc ia l produc t ion in April 1 9 7 2 , B CL has exp or ted concentrates each year containing up to 193 , 000 tonnes of copper ( 19 7 8) , 2 3 tonnes of gold ( 19 7 8) and small quantities of silve r . The se expo rts have accounted for between 40 and 60 per cent o f domestic export earnings each year , depending up on relative export prices . S ince renego tiat ion of the B ouga inville Copper Agreement in 19 7 4 , government revenue from the mine ( taxe s p lus dividends) ha s amounted to a maximum of 27 p er cent of domes tic revenue ( 19 80) and a minimum of 5 per cent ( 19 83 ) ; the actual f lows to the budget have been s tab ilized by means of a Minera l Re sources S tab ilizat ion Fund (MRS F) . B CL , however ,

7
now d ire c t ly emp loys only j us t over 3000 Papua New Guineans , and its use of domestic intermediate inputs is minimal ; the government has theref ore cons is tently recogni zed government revenue as the mine ' s principal cont ribution , and as the mos t significant poten t ial con tributi on of o ther mining proj ects .
B ougainville Copp er L imited ' s largest contribut ion t o economic growth came dur ing the c onstruc t i on per iod and the early years of produc t ion up t o 1 97 5 . As is u sual in mod ern mining proj ec t s , high-grad e ores wer e extrac t ed f irst , so that mining cos t s have tended t o rise over t ime a s ore grades have f allen . Furthermore , BCL is by far t he largest s ingle u ser of imp orted fuels in Papua New Gu inea , s o that it s c ost s have increased st ill mor e as the r eal price of oil has r isen . 1980 was an except ional year because of the very high price realized f or gold ; with that exc ep t i on , BCL ' s revenue and GDP contr ibut ion has b een t end ing t o fall . Mining r evenue f lowing to the budget met 3 per c ent of government expend iture ( exclud ing Ok Ted i investment) in 1983 - d own from an early p eak of near ly 11 per c ent in FY197 5 / 7 6 ( see Append ix Tables A . 1 9 and A . 20) . The d irec t c ontribut ion of BCL value add ed to GDP f el l f r om more t han 17 per c ent in FY197 3 /7 4 t o 7 per c ent in 1 98 3 .
The con s t raint p laced on the growth of government expenditure by the declining real va lue of Aus tralian aid , and the tendency for B CL ' s GDP con tribution to fa l l , have b o th res t rained the overal l rate of growth of market GDP in the de cade s ince se lfgovernment . On average , we e s t imate tha t the rate o f growth of total real market GDP has been ab out hal f the rate of growth o f the market economy exc luding the dir e c t B CL and governmen t value added contributions p lus maj or mining inve s tments ( calculations de tai led in Appendix Tab le A. l) . It has b een sugge s ted that when the in direct effects of government spend ing are also exc luded , the under lying growth of ac tivity ou tside B CL and government has been even s tronger at a numb er of p oin ts in the decade ( Garnau t and Baxter 19 8 3 : Chap ter 6) . The e f fectivenes s , or o therwise , of the government ' s e f f or t s t o increase the avai lability of incomeearning oppor tuni ties cannot the re fore be prop er ly gauged from aggregate GDP stati s tic s .
The openne ss of Papua New Guinea ' s economy is c learly shown in Tab le 3, where the composition o f GDP i s given for two years of roughly average terms o f trade over the decade - in later years , the Ok Tedi proj ec t great ly in f lates both inves tment and import share s . Expor ts cons i s t overwhelmingly of pr imary pr oduc ts ( Tab le 4 ) , whi le impor t s consi s t of food and consumer goods ( 4 0-45 p er cen t) , fue ls and raw material s ( 20- 25 per cent ) , and o ther capi tal goods ( 35-40 per cent) . Domesti c manufac tur ing accoun ts for no more than 10 per cent of GDP , and inc ludes a sub s tantial elemen t of proces sing of agricu l tural p roducts f or expor t . According ly , domes tic mul t ip liers are low ; the marke t ec onomy is dr iven by real exports and exogenously-determined inves tment .

8
The leve l of economic ac tiv i ty is thus liab le to wide f luc tuat ions in l ine with varia tions in the terms of trade , and ( to a lesser extent because cap i tal f ormat ion is sub s tantially of fset by imp orts ) in inve s tment levels . For this reason , the government has at tache d great importance to the s tab il ization o f income and expendi ture f lows ar ound leve ls j udged to be s us tainab le over cyc le s of f luc tua t ions in expor t p r ice s .
Tab le 3 S truc t ure o f gross domestic pr oduc t by expendi ture items , FY 19 7 2 / 7 3 and 1 9 7 8
Government f ina l con sumption expendi ture
P r iva te f inal consumpt ion expend iture Marke t Non-marke t
Gross domestic inves tmen t Marke t Non-marke t
Exports
less imp orts
GDP (k mi l lion) Market % Non-marke t %
Percenta ge FY19 7 2 / 7 3
28 . 8
5 5 . 4 ( 34 . 9 ) ( 20 . 5 )
18 . 1 ( 1 7 . 6)
( 0 . 4 )
3 6 . 6
- 38 . 9
7 9 1 . 6 ( 7 9 . 1) ( 20 . 9 )
share 19 7 8a
2 5 . 4
5 6 . 7 ( 41 . 7 ) ( 1 5 . 1)
2 1 . 3 ( 2 1 . 1)
( 0 . 2 )
4 1 . 7
-45 . 1
1 , 4 1 3 . 3 ( 85 . O) ( 15 . O)
aShares calcula ted from total net of s t ati s t ical dis crepancy .
S ource : Append ix Tab le A . 2 .
Table 4 Expor t shares of p rincip al commodity groups
FY19 7 2 / 7 3 1 9 7 8 19 8 3
Me tal minerals 6 3 . 1 44 . 9 5 5 . 8
Tree crop s 26 . 9 4 3 . 9 3 2 . 3
Timber and f i sh 7 . 6 9 . 6 9 . 6
Other 2 . 4 1 . 6 2 . 3
Note : FY1 9 7 2 / 7 3 and 1 9 7 8 were years of app roximately average terms of trade over the FY1 9 7 2 / 7 3-83 p er iod ; 1983 was considerab ly be low average .
Source : Append ix Tab les A. 2 1 and A . 22 .

9
Some of these rela tionship s are illus trated in Tab le 5 . The p er iod from 19 81 onwards includes the effects of Ok Tedi mining inves tment up on cap i tal f orma tion and GDP - large ly f orei gnfinanced , as the low ratio of savings to inves tment in the se years in dica tes . Before the commencement o f Ok Tedi , phas es of st rong GDP grow th tended to be assoc ia ted wi t h rising exp orts and improving terms of trade (p erhap s with a slight lag , as occurred af ter the cof fee and c ocoa b oom of F'Yl 9 7 6 / 7 7 ) , whi le the general ly s trong growth of cap i tal f ormation does not appear t o b e directly ass ociated wi th exp ort perf ormance or the terms of trade . I t wi ll be argued b e low tha t inve s tmen t , ins tead , has been s tron gly in f luenced by the economi c policy env ironment . Given terms of trade f luc tua t ions , the opera tion of producer price s tab i lization funds f or maj or agricu ltural exp o rts and the MRS F for government minin g revenue , the ra tio of gross savings to gross inve s tment has f luc tua ted widely - as one would expect . Never theles s , unt il 1980 Papua New Guinea experience d re lat ive ly high savings ratios ( taking in to accoun t , o f course , governmen t savings supported by Aus tra lian aid) , reflec ted in a comf ortable current account b alance o f payments surp lus ( apart from minor de f i c i ts in F'Yl9 7 4 / 7 5 and
Tab le 5 Growth and f luc tuat ions in the P apua New Guinea economy , F'Yl9 7 3 / 7 4- 84
F'Y l9 7 3 / 7 4 F'Y l9 7 4 / 7 5 F'Yl9 7 5 / 7 6 FY19 7 7b 1 9 7 8 19 7 9 19 8 0 198 lc 1982 c
1983c
1984c
Percen tage change ove r p rev ious year in Marke t GDP Export s Gross f ixed Terms of ( 19 7 7 ( 19 7 7 cap ital trade prices) p ri ces ) formationa ( 19 7 7
2 . 1 2 2 . 8 - 1 . 4 6 . 3
0 . 5 - 12 . 6 - 1 . 7 -6 . 4
8 . 2 9 . 4 2 . 3 - 0 . 3
- 2 . 1 - 0 . 3 1 . 4 5 . 4
-0. 5 0 . 1 0.7 1.8 0 . 2 4 . 9
( 19 7 7 base) pr ice s )
-5 . 2 3 3 . 3 15 . 1 - 3 3 . 6
- 2 7 . 0 - 10 . 4 3 7 . 9 4 7 . 5
8 . 9 -11 . 4 15 . 7 1 6 . 7 12 . 9 - 10. 8
2 . 5 - 2 3 . 6 15 . 3 -5 . 5
3.6 11.3 -28 . 6 4 . 6
aMarke t c omponent . b 1 9 7 7 over F'Yl9 7 5 / 7 6 . c
lnc luding e f f e c t s o f O k Te di c ons truct ion .
Source s : Appen dix Tab les A . l , A . 3 , A . 4 , A . 9 .
Ra tio o f gros s na tional s avings to gross domes tic inves tment
3 . 33 0 . 9 3 1 . 3 3 1 . 3 5 1 . 2 3 1 . 2 2 0 . 7 6 0 . 4 7 0 . 46 0. 53 0 . 60
10
FY.19 7 5 / 7 6) and ac cumulat ion of foreign exchange reserves . Unt i l 198 0 , theref ore , new inf lows of f oreign direct inves tment ( or o f priva te cap i ta l i n general) , were n o t o f maj or f inanc ial s igni f icance in suppor ting domes tic cap i tal inve s tment . In fac t , when retained earn ings are ignored , balance of payments data sugge s t a net outf low o f f ore ign capital over the p eriod (Appendix Tab le A. 11) .
In large mea sure , these trends in the relat ionship o f fore i gn inves tmen t to Papua New Guinea ' s growth can be s imp ly exp lained . Af ter the c omp let ion o f B CL con s truc tion there were no large mining inve s tments unt il the commencemen t of Ok Tedi . Mineral explorat ion activity , as we shall see below , has cont inued at a relatively high level , but unt i l recen t ly this did not involve very lar ge overa l l inve s tment expendi tures . Mainly as a result o f the P lantat ion Redis tribu tion Scheme introduced i n 197 3 , and p ar tly b ecause the pro fitab il i ty of the tradi t iona l form of labourintensive plantation agriculture deteriora ted with rises in lab our costs and fue l price s relative to produc t prices , net dis inves tmen t by f oreigners (both resident and non- resident) appears to have taken p lace in the older tree- crop industrie s ) . Thi s disinves tment in agri cul ture has on ly j us t been offset by new inves tment in oil palm and f ores try ; un til ab ou t 1980 , new f oreign inve s tment in agriculture , fores try and fi shing fe l l s ub s tantially short o f expe cta tions . Between 1972 and 1 9 7 6 , durin g the main period of uncer tain ty surround ing the tran sit ion to self-government and Independence , there were a number of purchases of sub s tantial shares in f oreign owned enterp rises by new s tate-sponsored ins ti tu tions ( for example , p ·ortf olio inve s tment by the I nve s tment Corpora t ion , and e s tab lishment on the basis of exis t ing f ore ign bus iness es of the Papua New Guinea Banking Corporat ion and a nat ional airline , Air Niugini) . These change s were par t of a deliberate at temp t to imp lement the f ir s t o f the ' Ei gh t Nat ional Aims ' set ou t in De cemb er 19 7 2 :
A rap id increase in the proport ion of the ec onomy und er the control of Papua New Guinean individuals and group s and in the p rop or tion of personal and prope r ty inc ome tha t goe s to Papua New Guineans .
I t mus t be rememb ered tha t t hi s aim was put forward at a time when almost the only significant pr iva te Papua New Guinean ownership and control in the market ec onomy was in sma l lholder agricul ture . Outside the mining indus try and p ublic utilities there were a l so few signi ficant s tate shareholdings . Organized cons truction , transpor t and commerce were owned and run by fore i gner s ; p lantat ion agricult ure and exp ort/import bus ines ses were p redominant ly in the hands of three lar ge Aus tra lian or British-based trading comp anies .
Dur in g the middle and lat e 197 0s, therefore, there were three main source s of inve s tment initiative , othe r than the limi ted amount o f new fore ign direct inve s tment : inve s tment of

11
retained earnings by exis t ing fore ign busines ses , the pub lic sec tor , and the smal l- s cale Papua New Guinean private sector consi s t ing p redominant ly of rural smallholders . There are unfortunately insuff i c ien t data for the p eriod to p ermi t an a ccurate e s t imate of the contribution o f each group . Inspect ion of availab le ma ter ial f or FY19 7 6 / 7 7, when ne t forei gn inves tment ( exc luding retained earnings) was n egligib le , sugge s t s the following app roximate distrib uti on of gr oss f ixed cap i tal format ion :
Public s e c tor 35%
P rivate businesses mining
other
Smallholders
Unindent i f ied
20%) )
25%)
10%
10%
toge ther rep resenting about twi ce the level of retained earnings recorded f or the b alance of p ayments
( inc luding own-account capital forma t ion , s uch as land-clearing)
( cover ing cap i tal exp endi ture by mi ss ions , coop erative s and b us iness group s , purchase of new dwellings by owner-oc cup iers , lives tock no t for s laughter e tc . )
Such a dis trib u ti on take s no accoun t of the extent t o whi ch rural gr oup s and individuals have inve sted in urb an as se t s ; such inves tmen t has never been measured , b ut may now have b ecome s ignif icant . The shi f t in inves tmen t ini t ia t ive in the older typ es o f treecrop agr icul ture ( copra , cocoa and rubber) was mirrored in rising share s for smallholde r s in the supp ly of these export crop s ( see S ec t ion 1 2 ) .
By 1982, cap i tal expendi ture in the corp orate private s e ctor ( exc ludin g mining) s t ill re lied to a very lar ge extent on re taine d earnings , but the relative imp ortance of dome s tic and , esp e c ially , foreign b ank lendin g had r i sen cons iderab ly ( Tab le 6) . The change was par tly a resul t o f an increase in the numb er of sub s tant ial f oreign- f inanced p roj ects ( e specially in agriculture and fores try) , and p artly a result of a deliberate eff ort by the authorit ies to encourage off-shore b orrowing by private bus inesses . I t should be no ted that while 1 9 8 2 was the f irs t year for which such financing information was collected it was a year of deep recession , and thus no t necessar i ly represen tative of mediumterm trends .
In summary , P apua New Guinea ' s overall deve lopment s trategy s ince self- government consi s ted of the fol lowing e lemen t s ( Papua New Guinea Central P lanning O f f ice 19 7 6) . The princ ipal ob j ect ives were to in crease the proport ion of in come ac cruing to , and income- generating assets owned by , Papua New Guineans , to encoura ge a wider , and more even , spread of income-earning opportuni t ies

12
Tab le 6 Financ ing of p riva te capi tal expendi ture , 1982a
Percentage shares
Bank loans Indu stry Domes tic Overseas Equi ty Retained earnings
Agr icul ture and fores try 26 . 6 3 0 . 2 2 2 . 0 2 1 . 2
Manufac turin g 17 . 0 4 3 . 7 2.8 36 . 5
Con struc tion 14 . 4 31 . 4 3 . 3 5 0 . 9
Wholesale and retail trade e t c . 2 3 . 1 5 . 5 2 . 3 69 . 1
Tr ansport and communicat ion 2 2 . 4 16 . 4 2.7 5 8 . 5
Finance 19 . 3 1 . 0 2 9 . 9 49 . 8
Other service s 20 . 7 0 . 9 2 . 5 7 5 . 9
aExc luding the mining sec tor .
Source : Da ta provided by the National S tatistical Office , May 1984 .
among the population , and to achieve this predominan tly by encouraging rura l se lf-emp loyment . Dur ing the 19 7 2 - 7 5 per iod the ob j ec t ive of redi stribut ion from fore igners to nat ionals probab ly took priority , while the ob j e ctive of crea ting more in come-earning opportuni t ies , wide ly dis tribu ted , gained ascendancy from ab ou t 1 9 7 6 . The governmen t ' s ab i l ity to p lay the leading role was to be cons trained by the ob j e ctive of moving gradually towards fi scal s e lf-reliance - imp ly ing s teady reduct ions in bot h the real va lue of Aus tra lian aid , and i ts share in s uppor ting government spendin g . As a corollary of b oth the self-emp loyment and f inancial self-reliance goa ls , the deve lopmen t of maj or mineral resource s was to be promoted not for any direct deve lopmen tal b enef it s ( emp loyment , privat e sector income , indu strial l inkages etc . ) but f or its potent ial contr ibut ion t o government r evenues and thu s to the means of achieving other obj ec t ives . The pat t ern of growth in general economic activity was broadly to follow compara tive advan tage with no wides pread use of trade controls or protec tive tari f fs ; but , b y means of rapid imp rovement in pub lic ly-provided social an d physical infrastructure , and by means of polic ies designed to improve the coun try's relative cos t pos i t ion ( e . g . loca lizat ion and wage res train t) the aim was progress ive ly to increase the range of industries which could be prof i tab ly e s tab lished in the country . In re cogni tion of emp loymen t and income dis tribut ion aims , an d , als o , perhaps , of the likely origin of private Papua New Guinean capi tal inve s tment , the government rej ected the approach of app lying discriminatory tax
13
and policies towards the rural sec t or : ' Mos t o f the b urden o f [an] exp or t tax would f a l l o n rural smallho lders who se incomes are
b e low the minimum leve l for the p ayment of inc ome tax . Levying taxe s on low income rural producers wi ll t end to decrease future inves tment and goes agains t the goal o f rai sing the lowes t rural incomes ' (Papua New Guinea Central P lanning Off ice 1976:39). The governmen t ' s own inf luence upon res ource allocation and in come distribution, af ter the 1972-75 period of asset redistribut ion, was to be felt through the pat tern of taxa tion and of pub lic expenditure allocation .
I t can b e seen from this account ( and from the ' Eight Aims ' or the National Deve lopment Strategy) that economi c growth was not to be consi dered an end in i t se l f, but was to be viewed as a means t owards the achievement of other goals . Thi s was, in part, a reac tion to the policie s of gr owth maximi zat ion followed by the Aus tralian admini s tration in i t s closing years (1965-71) w ithout exp lic i t regard for regional or social inc ome dis tribut ion con siderations . There was to b e a p eriod during which great emphasis was p laced on creating a framework of p o licy and ins ti tut ions to ensure that the fruits of long-term growth were more evenly distributed .
Wi thout digress ing at length on criti cisms of the government ' s deve lopment s trategy, it is fair to s tate tha t overemphas i s o n s tab ili ty and equi ty at the expense of t otal income growth were fre quen tly allege d . There were, a t var ious t imes, critics who felt that more emphas i s should have b een laid s imp ly on the growth of manufacturing and / or agricultural produc tion . S ometime s such c r it ic i sm was based on t he view t hat f ormal wage employment creation shou ld have higher prior ity, and that a prot ectionist trade policy c ou ld be used t o ov ercome comparat ive d isadvantag e . Other crit ic s argu ed that the economy was altog ether t oo open and should be made more ' se lf-relian t ' autarki c and les s ' dependent ' . At t imes, mis sions from the International Mone tary Fund ( IMF) and Wor ld B ank incl ined to the view that aspects of macroeconomic p oli cy, as we ll as explici t redi s tributive meas ures, had mili tated agains t growth ( e . g . World Bank 1982).
S ince 1980, when the f ir s t full change of government s ince 1972 t ook p lace, there have been s i gns that the governmen t ' s s tance has been shi f t ing t owards one o f a more explicit emphasis on gr owth . From the perspect ive of the Nationa l Deve lopment Strategy ( Papua New Guinea Central P lanning O ffice 19 7 6) there is a good sound j us ti f ication for such a shif t : the policy framework n ow in place ( inc luding tha t for mining, discus s e d in thi s mono graph) , toge ther with the incidence o f taxation, the me chanisms o f pub lic expendi ture allocation and of wage de terminati on, goes a cons iderab le way t owards ensuring that the b enefits of e conomi c growth can b e wi de ly spread . In so far as the shi f t i s b ased up on pres sure from cri tics ab out the s upposed ' lack of growth ' in the past, however , it is probab ly misconceived - in that it i s

14
b ased on inadequate national ac coun ts da ta , and upon failure to apprec iate that , for a decade , the government and mining sec tors have been an inevitab le b rake on overall growth . Our data , and those pre sented by Garnau t and Baxter ( 19 83 ) sugge s t growth in o ther sector s has been s trong , if f luc tuat ing , and has b een based on p ar ti cular ly s trong growth in inve s tment and exports . Where growth has been slow or negative ( p lantat ion agricul ture) or below expectat ion ( forestry and fishing) the explana tions mus t b e sou ght in s e c tor- spec i f ic po licy fai lures , o r i n genera l s tructural cons train ts ( land tenure , high relative cos t s ) tha t are no t amenab le to ma croe conomic p ol icy solut ions or even medium- term re-allocat ions o f pub l ic spendin g .
Future inc ome growth i n Papua New Guinea i s thus mos t l ikely to come from reinves tment of mining and other revenues accruing to the s tate in infras truc ture and s ki lls nee ded to s timulate priva te inve s tment , or to a lesser extent in directly p roduct ive enterpris e s ; from reinve s tment by Papua New Guineans engaged in exp ort agriculture , b o th dire ctly and through rap i d development o f f inancial intermediat ion ; and , final ly , from whatever flows o f new f oreign inves tment , or retentions by exi s t ing bus ines se s , can be achieved .
3 . Macroeconomic managemen t and foreign inves tmen t
The Government has es tab lished , and intends t o maintain , a framework of economi c p olicy whi ch provi des for s tab le growth , and , as far as possib le , insulates the economy from s evere external shocks ; an economi c environment which allows the investor to p lan ahead with reasonab le conf idence is probab ly the mos t effective inves tment incentive of all ( Papua New Guinea National P lanning Office 19 7 8b : 87 ) .
Papua New Guinea ' s post- independence framework of macroeconomi c management and p olicy has b een des cribed at length e lsewhere (Morauta 1979 ; Palmer 19 7 9 ; Papua New Guinea National P lanning Of fice 1 9 7 8a and b ; Garnaut 1981 ; Garnaut and Baxter 1983) . For present purp oses , we are concerned wi th three aspe cts of macroec onomic management : i t s in centive e f fects up on foreign inve s tmen t ; the p lace of foreign capi tal f lows in the balance of paymen ts , and the que s t ion of whe ther attitude s t owards f oreign inves tment have been signif icantly inf luenced by short- to mediumterm balance of paymen ts pre s sure s .
In brie f , the obj ec tives o f macroeconomi c policy s ince first coherent ly formulated around 1 9 7 5 have b een : to maintain a c onvertib le local currency and a serv ic eab le leve l of foreign deb t ; to achieve a relative ly low and stab le ra te of p rice inf lation ; to s tab i l ize the leve l of economic activity , as far as

15
practicab le , around the leve l indicated by the med ium-run terms of trade and the prospects ofr exogenously- determined inves tment ; and , final ly to crea te condi tions in which the growth o f incomeearn ing opportuni ties would at leas t keep pace with the growth in demand for them . Thes e ob j ec t ives , and part icularly the las t , were deve lop ed to support the w ider deve lopment s t rategy we have a lready out l ined . They can b e regarded as an adap tat ion to Papua New Guinean condi tions o f the trad i t ional macroeconomi c ob j ec t ives o f inte rnal and external balance ( Meade 1951) . The obj ec tive of ' internal balance ' has s ometime s been exp li ci t ly de fined for the Papua New Guinean case , wi th the element of price s tab ility separated out , along the fol lowing line s :
Full employment can b e def ined as the state in whi ch the number of pe ople who pre f er wage employment to vil lage life , given the level of wages and other fac tors affecting non-village and village standards of living , roughly balance s the number o f wage and other non-village j ob s availab le ( Garnaut and Baxter 1983:54-5) .
There i s room for disagreement over the app licab il i ty of such a concep t of in ternal balance in circums tances of cons iderab le lab our-market fragmen tat ion , and where the ' market-clearing ' wage f or many of the marke t s i s extremely difficult to i dentify . Never the less , i f the de terminant s of the supp ly and demand for in come-earning opportuni ties are separated into the growth of inves tment on the one hand and the dis tribution of income on the o ther , the concep t can be converted into targe t s that are locally re levant (Palmer 1979) wi thout carrying the imp lication that growth and s tab iliza tion obj e ctive s can b e separa ted , or that internal balance can be brought ab out in the short-run by rap i d changes in wage rates or p ub lic expenditure . Our formulat ion follows thi s second approach .
With low domes tic multip l i ers , but with the economy liab le to extreme ly wide f luc tuat ions in ac t ivity levels as a result of export price fluc tuat i ons , a counter-cyclical fiscal p o licy would have required imprac t icab ly lar ge and frequent adj us tments in taxes , sub s i dies and the overall leve l of public spending . A given chan ge in the government ' s de f icit was like ly to have stronger e f fects on the ba lance o f paymen ts than up on other macroeconomi c variab les . Moreover , Papua New Guinea is a p ricetaker for all i t s s i gni f i cant exports , has a relatively smal l non- tradeab le se ctor , and , throughout the p er iod under cons iderat ion , money wages were e f fective ly l inked to import price s thr ough indexa tion arrangemen ts . Thus permanent changes i n relat ive p rices could not be ach ieved t hrough exchange rate adj ustments , and so the ' swi tchin g ' mechani sm ( Corden 1981) was not avai lab le for balance o f payments management .
Ac cordin gly , stab i lization o f the leve l o f ac t ivity was approached by direct measures to dampen f luctuations in p roducers '

16
income s ( an d government revenues ) from exports . The se consis ted of the stab i lizat ion funds for cof fee , cocoa and copra , administered by the respective indus try b oards , and the MRSF . Their balance s in p er iods of surp lus were large ly s terilized in deposits with the central bank . The governmen t ' s dire c t contribut ion to s tab le demand con s i sted of the attempt to main tain real public spendin g on good s and service s on a s teady and s lowly growing p ath . The balance of paymen ts was to be managed by fi s cal p ol icy , suppor ted by a caut ious but largely pas s ive , mone tary s tance . Under these arrangemen ts , the current account of the balance of paymen ts ( and thus the level of f orei gn exchange reserves) was liab le to sharp f luctuations around the med ium- term level . Given medium- term external balance , and given the very limited e f fects of the exchange rate on relative p rices or real incomes , the exchange ra te could be varied to moderate the e f fects of imp or ted infla t i on . This comb inat ion o f p olicies became known as the ' hard currency s trategy ' .
I t should b e s�ressed that this framework has relevance as long as all its e lemen t s are kep t in the approp r iate relation sh ip to one another , and as long as the assump t ions o f limi ted dome s t ic ec onomic linkages , small non-tradeab les sec tor , downward ly rigid real wages and so on con tinue t o hold . In the early 1980s , the economy was s ubject to a serie s of internal and external economic shocks nece s sitat in g c on s iderab le fiscal and mone tary retrenchment to res t ore external balance . This p roces s afforded an opp or tun ity to secure mod i f icat ion of the wage indexation arrangements f rom early 198 3 , so that s ome d egree of ' swit chin g ' by exchange rate devaluat i on became feasib le . Never the less, once t he adj us tment had been made (at the cost not only o f reduced levels of ac t ivi ty , but als o o f hi gher rates o f inf lation d irectly caused by d evaluat ion) the f ramework continued to be app licab le .
The ins trument s in the framework designed to pr omote income distribution , emp loyment and growth obj ec t ives are s trictly ' macroeconomic ' only in so f ar as they a ffect the overall degree of u tili z at ion of resources ( espec ially lab our ) rather than their allocat ion . Wage p olicy and budget policy ( tax and expendi ture allocation ) have , however , convent ionally been treated as part o f the integrated policy f ramework i n Pap ua New Guinea , and are s o treated here . Wage policy a f fec t s inves tmen t , and thus growth , through i t s impact on the governmen t budget ( in whi ch wages and salarie s have accounted for around 40 p er cent o f expendi ture -C olc lough and Daniel 198 2 ) and up on the poten t ia l cos t-compe t i t iveness of new med ium- and large-scale pr iva te sec t or indus tries . Thi s is not to say tha t levels o f inves tmen t in natural resourcebased industries will be p r imar ily in fluenced by wage levels , or that Papua New Guinea has the poten t ial to become a centre o f labour-intens ive manufac tur ing indus try at any f easib le level o f real unski lled wages ( given the floor t o wages s e t b y sub s i s tence ac tivit ies) . Neverthele s s , wage leve ls rep resent probab ly the mos t s ignif icant e lement of the domes t ic cost s tructure amenab le to
1 7
any degree o f policy in fluence , and there is evidence that the rap id real increases in the unski l led urban wage of 1972-75 had a maj or adverse impac t up on both emp loyment levels and the cost o f governmen t (Colclough and Danie l 1982 : 56-66) . S ince 19 7 5 , the government has general ly pursued a policy of s tab i lizing the real incomes of urban workers through indexation inc orporated in threeyear wage d eterminat ions , while p ermi ttin g any product ivi ty and localization gain s to reduce real labour cos ts . In 19 7 6 and 1983 there were add i tional reductions in rea l wages , though these were par t ly offset by inc reases in non-wage lab our cos ts ( leave p rovisions , prov id ent fund contribut ions e tc . ) . With budget p olicy used to inf luence the d i s tr ibu tion of income and the allocation of resources , the interp lay of wage p ol icy and b udge t p olicy inf luence s rural incomes , urban emp loymen t and wage levels, and thus migration .
The overall framework was broad ly succe s s f ul in mee t ing i t s obj ec t ives from 197 6-8 0 ( Garnaut and Baxter 1983 ) , b u t was then p laced under c on siderab le s train by a number of internal and external economic shocks over 198 0-8 2 . Never the le s s , sufficient res train t on aggregate demand was app lied to ens ure that over the p eriod since mone tary independence ( 19 7 6-8 4 ) the overal l balance of externa l payment s has p ermit ted a more than adequate level of f ore ign exchange reserves to b e maintained , and borrowing capacity has been availab le f or use in the more d i f f icult c ircums tanc e s o f the 1980s .
General economic stability ha s a lmos t certainly contributed to the rap id growth of inve s tment shown in Tab le 5 , b oth by enc ourag ing reinves tment by existing bus inesses and by cre ating an envir onmen t in which new natural resource-based and agric ultural pr oj ec t s cou ld be succe s s f ully negot iated . The lat ter acc ount f or the bulk of p rivate inve s tment from 1980 onward s . In contras t to the posit ion in many le s s d eve loped c ountrie s , Papua New Guinea now has a long record of currency conve r t ibility , c ont inuity of input and c onsumer goods supp ly , real wage s tab ility , and broad predictability in p ub l ic revenues and expend i tures .
Private cap i tal f lows have not in themse lves been s igni f icant in preserving external balance - the very large inf lows as soc iated with Ok Te d i f rom 1981 onwards have been subs tantially off set by impor t s . But s ince the large p rivate f lows go predominant ly to exp or t indus trie s , they are imp or tant in re laxing f uture bal ance of payment s con s traints . P olicy towards f oreign inves tmen t has n ot been in fluenced by short- term balance of paymen t s p res sure s ; in the sectors in which the re have been successes (notab ly minerals ) p olicy has been inf luenced more by a long- term view of comparative advantage and development p rospec t s . Possib ly mos t imp ortant has been the realization that a c ountry experienc ing chron ic governmen t revenue and f oreign exchange shortages will not be well-p laced t o str ike benef i c ia l d e a l s wi th f oreign inve s t ors .

18
4 . Fore ign inves tmen t s t ocks and f lows
The availab le s tatis t ical material on f orei gn inves tmen t in Pap ua New Guinea i s assembled in Appendix 2, and in Appendix Tab les A . l l-A . 17 . There is very lit t le p or t f olio inves tment by f ore i gners in Pap ua New Guinea, the mos t s igni f i cant e lement is the 23 per cent pub l ic shareholding in BCL . Valued at i t s his tor ic al cost, the s tock of direct f ore ign inves tment f inanced by equity inf l ows probably reached ar ound US $ 1 b illion by the end of 1983, while ass ociated loan-f inanced f oreign inves tment had probably reached a s imilar f igure . There is no satisfac t ory basis f or e s t imat ing the sec t oral d i s tr ib ut ion of this s t ock : i t i s probable that at least one- third of the c omb ined t otal i s accounted f or by BCL, and a f ur ther one-third by Ok Tedi c ap i tal expendi ture up to the end of 1983 . Hence the acc umulat ion of f ore ign inves tmen t out s ide the mining sec tor i s p robab ly fairly mod es t . The p ic ture is c omp l icated, however, by the fac t that these f igures are derived f r om the history of inves tment in Pap ua New Guinea by nonresidents ; there is no re liable acc ount of inve s tmen t by res ident non-cit izens .
From the c omp let ion of the B ougainvil le mine in 19 7 2 unt i l t he commenc emen t o f O k Tedi c on s t ruc t i on i n 198 1, ne t direct inves tment inf lows, exc luding retained earnin gs. s tayed at very modest l evels . Re tained earnings were a consist ent ly imp ortan t s ource o f inves tment f inance, but ne t p r ivate cap i tal f lows overall were neg ligib le . From 198 0, however, inflows increased r ap idly, princ ipally f or Ok Tedi, but also for a number of agricultural and f ore s t ry proj ec t s . Both new equity inves tment and retaine d earnings were important as catalys ts f or in f lows o f f ore ign bank lend ing to private sec tor p r oj ec t s . By Decemb er 1983, the Bank of Papua New Guinea e s t imated p r ivate external deb t outs tanding at US $85 9 . 4 mi llion of which US $ 65 0 . 3 million was owed by the mining sector, and US $ 12 0 . S mil lion by new agriculture and f ores try pr oj ec t s . The remainde r was accounted f or by the trading c ompan ies, c ommer cial banks, and vari ous smalle r enterprise s .
As might b e expec ted, d ividend f lows to non-residents from c ompanies other t han BCL have b een minor - usually less than KIO million per year . Interest p ayment s in recent years have s igni f icant ly exceeded d ividend out fl ows . By way of c omparison, remi t tances of savings by temporary residents (main ly expat r iate c ontract emp loyees ) have run at leas t f ive t imes the level of dividend remi t t ance s ( Tab le A . 12 ) . The vas t maj ori ty of d ividends paid t o re s ident s, however, are s t i l l believed t o be p aid t o res iden t f ore igners ; about hal f the d ivi dend s of Pap ua New Guinea c omp anies are pai d to r e s iden t s . Other forms o f current c ommercial paymen ts overseas ( royalties, paten t fees e tc . ) are negligible .
Aus tralia ha s c ont inued to be the s ingle mos t importan t s ource of inves tment flows during the 19 70s and ear ly 1980s ; the f oreign sharehold ing in BCL is Aus t ralian-based, and an Aus tralian

1 9
company holds 3 0 per cent of O k Ted i e qui ty . I n 1 98 3 , however , the t otal d irect inve s tmen t in flow from the United S tate s was greater ; a s imilar American shareholding in Ok Tedi was supplemented by inves tmen t in mine rals and petroleum exp loration . The Uni ted Kin gdom has tended to be an imp ortant s ource of agricultural inves tment (with the C ommonwea lth Deve lopment C orporat ion as the main e lement ) . There i s no deliberate policy about country sourc ing , flows by c ountry vary ac c ordin g to the s t ruc ture of f oreign c ompany part ic ipat i on in new proj ec t s . Papua New Guinea has signed some f orm of inve s tmen t p romotion and protect ion agreemen t wi th the Uni ted Kingdom , West Germany , and the Uni ted S tate s (via the Overseas Private Inves tment Corporat ion , OPIC) , b ut there has been no init iat ive f or one with Aus tralia .
5. Fore ign inves tment p olicy and ob j e c t ive s
Whi le c olonial p olicy was apparen tly l i t t le c oncerned with the dis tinct ion b e tween nat ional and f ore i gn ownership of inve s tment , p olicy in an independent Papua New Guinea c learly was . We have already quoted the f ir s t o f the ' Eight Nat ional Aims ' whi ch called for a rap id increase in the proport ion of Papua New Guinean owner ship of the economy and receipt of the income generated . I t is c lear f r om a number o f p os t-Independence government documents , however , that the need for a c on t inued f low o f new fore ign inve s tment was recognized - p r incipally on the g round s that , without it , tax revenue c ould not b e expec t ed to increase s uf f ic iently to p ermit b oth reduc tion s in aid and real increases in p ub lic spend ing (Pap ua New Guinea Nat ional Planning O f f ice 1978a : l7-18 ) .
S ince self-government in 197 3 all poli tical parties and near ly all Papua New Guinea p oliticians and pub lic servants have c onsi s tently he ld that f ore ign inve s tmen t is to be exc luded or re s t r icted in areas where Pap ua New Guieans can in the short- to medium-term own and c ontrol an ac t ivity : in o the r areas fore ign inves tment is to be welcomed wherever it i s o f c lear advan tage to the country . (A neo-marxis t view opp osing further foreign d irect inves tmen t , largely con f ined to some s taf f at the Univers i ty of Papua New Guinea , has had li t t le or no influence on po licy . ) The interes t ing policy que s t ions were there fore to define the exc luded or restric ted ac t ivities and to determine when a foreign inves tment is of c lear advan tage t o the count ry .
Es sen t ially three s chools of thought emerged on these ques tion s . Firs t , the ' national i s t ' s chool , which takes an op timi s t ic view o f what areas or ac t ivities Pap ua New Guineans can seek t o own and c ontrol in the near future . Thi s group was esp ecially p ower ful in the early 1970s when , as has already b een s tated , the ec onomy was overwhelmingly in f oreign hands . I t has d imini shed a li t t le in importance with t ime as government s tatutory author i t i es were es tab li shed in key areas and more Papua New Guinean s became involved in busine s s .

20
The s econd group , in a sen se at t he other extreme , is less c onc erned abou t the nat iona l i ty of the investor and f eel s that increased product ion in the economy i s a good thing . Thi s group could be d escribed as hav ing a very low rat e of t ime d iscount , will ing to ignore any early negat ive effects of a proj ect becau s e , t hey argue , when l ocal d emand and economic l inkag es improve , the proj ect will be of net benef it to the economy wel l int o t he futur e . Reinf orc ing adherenc e t o t h i s approach was the vi ew that the movement from villages to urban areas was inevitable , whatever ac t ion any government might take . S imple arithme t ic suggest ed that j ob s need ed to be qu ickly created in the t owns t o sat isfy t h e end les s d emand f or them . Thi s second group can b e called the ' pr oduct ion max imiz ing ' school and h a s o f t en f ound vocal and act ive adheren t s in the Indu stry and Agricultur e d epar tments of successiv e government s , and in part s of the private sec t or .
The third group is keen t o p rovid e Papua New Gu inea investor s wit h every advantage in areas where they can hope t o compete with or r ep lac e f oreign inves tment , but i s even mor e concerned to ensur e that any investment is of net b enef it to the economy . Thi s ' benef it maximiz ing ' school ha s always had it s main f ollowing in the central Ministr ies of Financ e and Nat ional Planning . They hav e a r elat ively high rat e of t ime d i scount , not being willing to f orgo r evenue if a proj ect was in s ignif icant need of cont inual government sub s idy or prov i sion of costly ini t ial in frastructure .
This group believes that rural-t o-urban migrat ion is larg ely a funct ion of the relat ive level of benef it s in the two ar eas and the probab ility of s ecuring those benef it s ( that is , in t own , of f ind ing a j ob) . A proj ect which provid ed urban employment at the cost of large sub s idy meant less government spend ing in t he rural areas , and so was not favoured . In the rural areas ther e exi s t s a larg e pot ent ial labour supply f or the towns , but g iven Papua New Gu inea ' s strong trad it ional rural economy money spent on prov id ing rural serv ices could prevent that potent ial being r ealiz ed . I t mu st also be said that sect ions of this group were inf luenced by the exper ience of Papua New Guinea ' s southern ne ighb our , Au stralia , which is widely acknowledged as having an ov erly protec t ed and ther efore ine f f icient manu facturing sec t or that has inhibit ed the growth of other sectors in which Au stralia may have a comparat ive advantag e .
Each o f the main groups had core support in one or mor e polit ical part ies . The Pangu Pat i , formed by Michael Somare ( pr ime minister f rom 1 9 7 5 unt il early 1 980 , and t hen again from mid-1 982) contained many supp or t ers of the ' benef i t s ' school . The party of the count ry ' s second prime minister ( Jul iu s Chan , f r om 1 98 0 unt il mid-1 98 2 ) , the Peoples Party ( PPP) , largely supported the product ion-max imiz ing approach . Final ly , the Melanesian All iance , mad e up of some peop le espec ial ly prominent in t he Cons t i tut ional Planning Committee pr ior to Ind epend enc e , largely supp orted the nat ional ist school .

2 1
The temporary alliance s f ormed b e tween any two o f the three s chools as d if f erent p roj ec t s were evaluated have always b een fas c inat ing to observe , inf ormat ive , and o ften frus t rating . S ome examp les will i llus trate .
The ' pr od uc t ion ' s chool had by 1978-89 long been p ushing a local cement fac tory . The ' nationali s t ' and ' b enef i t s ' s chools c omb ined to prevent the governmen t giving the necessary undertakin gs for the p roj ect to proceed ( see section 14 below) . The f ormer argued that small-s cale vert ical kiln technology was more appropria te and cou ld more easi ly be owned and c on t rolle d by Pap ua New Guineans . The lat ter argue d that the proj ect was not viab le as it would produce cement at d oub le the then import pr ice , a fac t n ot d i sputed by the produc t ion maximizer s .
The ' pr oduc t ion ' and ' nat ionali s t ' s chool s naturally came t ogether on the que s t ion of inc rea s ing incentives for inves tors , even though the lat ter s chool was int er ested only in inc ent ives f or citizen inve s tors . Thes e s chools also comb ined to ensure that the Government p rovided the neces s ary undertakings to allow the Ramu s ugar proj ec t ( see section 12 b elow) to proceed , their interes ts coinc iding because o f its near 5 0 per cent p ub lic sector equity . Those in the ' bene f i t s ' s chool argued that the proj e c t was n o t viable and , indeed , s ince i t s recent s tar t-up domestic s ugar prices have b een 3-4 times import p ar i ty and the proj e c t the re fore prob ab ly a n e t f orei gn exchange loser .
To c omp lete the circle of temp orary alliance s , the ' benef it s ' and ' produc t ion ' s chools have ( largely uns ucces s fully ) opp osed the ' nat ional is t ' s chool in tryin g to have the government take measures to enc ourage exis t ing expatriate plantation owners to inc rease produc t ion ( see discuss ion below on the agriculture sector ) .
The bat t les over these issues , and e spe c ially over the Ramu s ugar and cemen t proj ect s , have o ften been b i t te r , with mos t members o f each s chool appear in g intrans igent . Thi s i s hard ly the c l imate in whi ch to make sens ible general or p roj ect-specific policy , or for government to make the best o f i t s negotiating positi on by p resen ting a uni ted front .
These prob lems d i ffered in inten s ity between sectors , however . In mining and p e tr oleum p roj ects very f ew o f these prob lems arose . There never has b een a serious s chool o f thought p re s s in g f or a large national equity share or res tricti on of f orei gn inves tment in these sector s : they are generally felt to b e too large , t oo technical and wi th few linkages with the rest of the ec onomy t o j us ti fy s uch moves . The b ene f i t s to b e gain ed from mining and petroleum were also c lear : cap i tal intensive , with f ew linkages , and with the p otent ial for large abs o lute amounts of profits the essen t ially unchal lenged criterion by which s uch proj ec ts s t and or fall is their ab ility to generate government revenue . The p oten t ia l rewards from the min erals sector are s o large that

22
senior p olitic ians have b een keen to devote t ime and at tention to i t .
Moving t o the other extreme , the manufac turing sector had f ew s imilar advantages . There has b een con t inual dispute over the relat ive importance of revenue , employment , train in g and general e conomic l inkage obj ec t ives which has made policy formulation d i f f icult . There have also b een many d isputes over the ' appropriateness ' o f the chosen technology and the importan ce o f future nat ional equity options . As a result of these c omp lexi t ie s and i t s assumed lack o f importance thi s sector has never commanded high-level political at tention for the required t ime .
Other s ec tors lie in the middle o f the spec trum . We shal l s e e throughout this monograph that Papua New Guine a ' s performance in each sector dep ended on the amoun t and level o f politic a l and b ureaucratic attent ion it received and the exten t to which government could c larify i t s obj ec t ives .
A c lear s tatement o f Papua New Guinea ' s p o licy on f orei gn inves tment i s to b e found in the National Deve lopment S trategy , put out in 197 6 shor tly af ter Independenc e .
A number o f large s cale natural resource b ased ( foreign) inves tment s will b e encouraged to rais e revenue . With respec t t o inves tment in manufacturing and s ervice sec tors , the Government recognises the need for fur ther growth and that fur ther f oreign inves tment wil l be require d . S uch inves tments will b e encouraged i f they :
b ene f i t consumers through lower price s ; provide add i tional employment ; provide addi t i onal government revenue ; improve the balance of paymen t s .
On the other han d , inves tmen ts that would result in c ons iderably higher d omes tic prices ( or require cons iderable s ubs idi es) will not be admit ted
Such proj ec t s would either have serious in f la t ionary e f fec t , or reduce the Governmen t ' s ab ility t o p ursue i t s priority prog rammes in rural areas (Pap ua New Guinea 1 9 7 6 : 13-14) .
This s ta tement illus trates the c lari ty o f ob j ec t ives for mining and p etroleum proj ec t s in c omparis on wi th the o ther sector s . The las t two sen tences indicate a s l ight b ene fit maximizing b ias as doe s , more c learly , the f ol lowing quote :
Foreign inves tmen t will be encouraged in p riority areas where national resources o f cap i tal or skill are not avai lab le , and wi ll b e exc luded in areas where they are availab l e . In asses s ing the p otent ial b enef i t s o f a

23
proj e c t, Pap ua New Guinea is concerned t o s ecure a p o s i t ive net presen t value con tributed to the ec onomy by additions to tax revenue and to value-added , minus any cos ts involved in f inancial incentives or provision o f infra-structure (Pap ua New Guinea 1978b : 34) .
The logic o f s uch s tatement s o f nat ional p olicy, draf ted by the central economic minis t ries, is d i f f icult to d ispute ; in speci fic proj ec ts , however , a mul t itude o f interpretations and excep tions have of ten been invented .
6 . Expectations versus experien ce in f ore ign inves tment flows
C omparison of expec tations and exp er ience of f oreign inve s tment f lows is d i f f icult t o measure as governments rarely quan t i fy the f oreign inves tment f l ows they expect . We can, however , look at the exp ec ted versus ac tual produc t ion , government s tatement s on vari ous f oreign inves tment proj ects and other p ieces of relevant inf ormat ion to b ui ld up a general p ic ture .
Tab le 7 compares the government ' s p roduction forecas ts made in S ep tember 197 9 with those made in July 198 4 as wel l as with actual p e r formance .
The mos t s triking f eature of Tab le 7 is the c omparisons rela t ing to the t imber indus try . The d i f f erences between the 197 9 and 1984 f igures are largely due to the failure t o real ize exp ec ted foreign investment . The deferral of the Vanimo proj ec t , for example, exp lains mos t of the decline in expec ted woodchip and plywood production . The lower exp ec ted sawn t imber production represents a downward r evis ion of new foreign investment in general . The or iginal expectat ions may wel l have been op t imi s tic , bu t there is consid erable government fru s tration with i t s inability to attrac t foreign investors int o the forestry indu s try . The expec ted forestry produc t ion shortfall in 1 988 rep resents over 12 p er cent of total 1 98 0 export s at 1980 p r ices .
The unexpec ted fal l in tuna expor ts reflec t s a wi thdrawal o f foreign inves tment i n the tuna f i shing indu s try i n FY1982 /83 . Pr ior to 1 97 9 the government had been expec t ing a hu ge increase in tuna expor ts from f oreign inves tment which did no t materialize . For copra , cocoa , c o f f ee and oil p alm ac tual p er formance was close to 1 97 9 exp ectations . By 1 984 , however, there were more op t imistic exp ec tat ions for oil p alm, and more pessimis t i c ones on cocoa p roduction . By 1984, p er formance in rubber was wel l below expectations , and the 1984 f or ecas ts ant ic ipated hal f the production for ecas t in 1 97 9 .
These f igures do no t really tell the s tory in the tree crop s sector , however , as by 19 7 9 many people ' s expectations of
24
Tab le 7 Exp e c ted and actua l p rodu c t i on o f maj or non-mining exp or t s
Expec ted produc t ion 1981 1983 1986 1988 Sep tember 197 9 ( forecas t ) ( for ecast) ( f oreca s t ) ( forecas t )
( OOO tonne s unle ss otherwi se s ta ted )
Cop ra 8 5 85 85 8 5 Cocoa 2 9 3 1 42 5 5 Cof f ee 48 51 59 60 Oil palm 54 78 90 90 Rubber 5 6 9 10 Logs ( OOO m3 ) 1 , 110 1 , 8 00 2 , 5 00 2 , 240 Sawn t imber ( OOO m3 ) 5 5 5 5 2 7 3 3 6 1 Wood chip s (BDT) a 125 205 295 3 95 Plywood ( OOO m3 ) 8 5 2 5 2 5 2 Tuna 3 5 3 5 3 5 3 5 Prawns ( tonne s ) 1 , 2 00 1 , 200 1 , 2 00 1 , 2 00
1983 1986 1 9 88 Expected or ac tual produc t ion , July 1984
1981 ( ac tual) ( ac t ual) ( foreca s t ) ( forecast)
( OOO t onne s unles s otherwise sta ted)
Copra Cocoa Cof fee Oil palm Rubber Logs ( OOO m 3 ) Sawn timber ( OOO m3 ) Woodchip s (BDT) P lywood ( OOO m3 ) Tuna Prawns ( tonnes )
aBDT bone dry tonne
102 28 47 44
5 743
24 95
2 3 0
1 , 07 8
7 9 2 6 5 3 7 8
3 1 , 019
20 100
1 1
1 , 141
Sourc e : Financ e Dep ar tment , Port Moresby .
85 80 3 1 3 6 5 2 5 6
112 120 4 5
1 , 2 40 1 , 3 20 3 0 4 0
1 6 2 1 6 2 2 2
2 1 3 2 1 , 2 5 0 1 , 3 00
future p rodu c t i on had a lr eady b e en l owe red . Tab le 8 s hows produc tion in the mid-197 0s for cer tain crops broken into smallholder and p lantat ion prod uc t ion . In all cases smal lholder produc tion increased and that of p lantations , which are largely f oreign owned , remained s tatic or declined . Thi s oc curred be cause of for eign d i s investment which has lef t many seni le trees and

Tab le 8 Agr i cu l tural exEort c rop Eroduc t i on ( tonnes)
Cof fee Cocoa Copra P lan t a- Small- P lan ta- Sma l l- P lan ta- Small-t i on holder Total t i on holder Tota l t i on holder
FY197 4 / 7 5 1 2 , 5 6 9 26 , 011 38 , 5 8 0 2 2 , 3 9 6 12 , 6 5 5 3 5 , 05 1 7 6 , 5 1 2 5 5 , 8 90
FY1 9 7 5 / 7 6 12 , 8 7 1 2 9 , 3 18 4 2 , 18 9 18 , 984 12 , 8 5 6 3 1 , 8 4 0 8 1 , 7 9 2 5 8 , 8 2 2
1 9 7 6 1 4 , 6 5 3 3 3 , 3 7 7 4 8 , 03 0 1 6 , 904 12 , 5 4 2 2 9 , 4 4 6 69 , 7 9 7 5 0 , 2 5 7
197 7 l l , 1 7 3 2 6 , 1 4 7 3 7 , 3 2 0 14 , 5 7 4 1 3 , 8 7 2 2 8 , 4 4 6 7 1 , 5 3 3 6 7 , 7 5 0
1978 14 , 2 5 2 3 3 , 218 4 7 , 4 7 0 15 , 3 56 1 5 , 3 9 3 3 1 , 2 4 9 5 5 , 7 5 3 6 3 , 4 5 1
197 9 1 5 , 9 2 7 3 3 , 068 4 8 , 995 12 , 5 5 7 15 , 000 2 7 , 5 5 7 7 4 , 1 1 7 7 1 , 2 5 3
1980 1 7 , 2 7 5 3 6 , 7 08 5 3 , 9 8 3 13 , 3 18 14 , 2 3 1 2 7 , 5 4 9 68 , 6 7 7 7 1 , 6 7 1
1981 15 , 2 7 3 3 5 , 13 2 5 0 , 4 10 13 , 3 5 2 18 , 6 3 0 3 1 , 9 8 2 66 , 614 7 3 , 2 5 5
1982 1 0 , 7 1 9 16 , 1 2 1 2 6 , 8 4 0 5 5 , 8 9 1 8 2 , 5 18
1983 8 , 2 1 5 18 , 5 03 2 6 , 7 18 54 , 4 5 3 7 5 , 7 8 0
a1 9 7 6 / 7 7 .
Sourc e : Depar tment of Primary I ndu stry , Inspe c t ion Records , Cof fee Indus try B oard , Rur a l the Repor t by the Connni t tee of Review in to the P lanta t i on Red i s tr ibution Scheme .
Rubber P lan ta- Sma l l -
T o t a l t ion holder Total
1 3 2 , 4 02 5 , 2 86 2 6 9 5 , 5 5 5
140 , 6 14 3 , 7 7 4 4 9 1 4 , 2 65
1 2 0 , 05 4 3 , 8 6 8a
5 5 4a
4 , 4 2 2
1 3 9 , 2 8 3
1 1 9 , 2 04 3 , 5 68 4 17 3 , 98 5
145 , 3 7 0 3 , 64 4 5 3 3 4 , 1 7 7
1 4 0 , 3 4 8 3 , 57 9 6 1 9 4 , 1 9 8
1 3 9 , 8 69
1 3 8 , 4 09
1 3 0 , 2 3 3
S t a t i s t i cal Bulle t in , Appendix to
N V1
26
general ly rundown p lantation asse t s . I t was c le ar ly government policy to promot e smallholder deve lopment to the rela t ive neg le c t of p lantat ion s bu t succe ssive government s d i d not wish to s e e the level of f or e ign d i s inves tment in p lantat ions tha t ha s in fac t occurred . The S omare Government in 197 9 was suf f ic iently concerned to s e t up a Commi t tee o f Review into the causes o f thi s .
Another indication of expectat ions versus experience can be ga ined from the Finance Minis ter ' s 1 9 8 1 Budget Speech delivered in ear ly November 1 980 (pp . 5-6) .
I would like very brie fly to ou t line progress on some of the maj or resource deve lopment proj ec t s .
The Kl5 mi l lion Kapuluk proj e c t . . . involves log exp or t , a chipmil l and extens ive reforestation . . . the t imber permi t is exp ec ted to be issued in 1 981 .
Further back in the schedu ling i s the K5 0 mi llion Vanimo t imber proj ect in the Wes t Sep ik Province . Negotiations are presen t ly underway f or thi s resourc e .
In the New Ire land Prov ince , we have the K25 mi l li on Kavieng tuna canne ry . • . . Construc t ion shou ld s t ar t early in 1 9 8 2 and product ion commence by 1985 .
There are qui te a few large scale agr icultural proj e c t s in the pipeline , however mos t are he ld up by a lack of land . . .
Proj ec t s showing p leas ing progress inc lude the Ramu sugar proj ect , . . .
However , both the rice proj e c t in the Mekeo area and the rubber and cocoa pro j e c t at Cap e Rodney are being held up by the unwi l l ingness of the local peop le to make their land available .
The Porge ra gold prospec t in the Enga province looks very promis ing . The Government is hop e ful that a f inal feas ibi lity s tudy wi ll commence by mid-1 981 .
The Fr ieda River copper and gold proj e c t has s ti l l some way to go . . . the Government is hopefu l of a f inal feasibility s tudy beginning in 1982 . . .
Exc luded from this qu ote were the nat ionally owned proj e c t s . Of the eigh t f oreign investmen t proj ects mentioned two proceeded broad ly on schedule , two look l ike ly to proceed though we l l behind the s chedule envisaged above ( two to three years in each case ) , and f our have been she lved or dropped comp le tely .
Admit t ed ly on imperfect evid enc e , bu t wi th the support of a long p eriod of general observat ion , we conc lude that succe s s ive government s have been di sap pointed with the level of f oreign inves tment in f ore stry , f ishing and agriculture and reasonably satisf ied wi th that in mining and pe tro leum .

There have been f ew manufac turing proj ec ts that have serious ly caught p olitical at tention wi th the no tab le exception of the i ll-fated cement p roj ec t . Successive Papua New Guinea governments have unders tandably had f airly low expectations for thi s sec t or .
7 . Papua New Guinea ' s comparative advantage
2 7
An understand ing o f Papua New Guinea ' s c omparative advantage is ne ces sary to exp lain both the past and exi s t ing p at terns of investment and the government ' s inve s tment policies . The subj ect wi l l be d i scu s sed in only general terms .
Papua New Guinea has p lenti ful mineral s , f ores t s , f i sh , rainfall and suff icient arable land relative to i t s p opulat ion . Papua New Guinea ' s exports reflect thi s , being dominated by copper , gold , c of f ee , cocoa , copra , logs , sawn t imber , tuna and oil palm -which t ogether c omprised over 95 per cent o f exports in 1982 . Domes tically , the country ' s natural re sources have meant that in mos t areas of the country peop le can ob tain suf f ic ient f ood , c lothing and she lt er f or relatively lit tle effor t . Papua New Guinea can also be considered f or tunate in its l ocation , near the rap id ly expand ing As ian and Pac ific markets . The countries in the As sociat ion of Sou th East As ian Nations (ASEAN) have growing incomes and a populat ion of around 2 5 0 million : Aus tralia , Japan , Hong Kong and Korea are al so nearby . Many of the se countries provide good examp les of sound management and ec onomic success .
The negat ive side of the s t ory is that Papua New Guinea prov ides a small domestic marke t for l ocal produc t ion , much smaller in fac t than its p opulat ion of 3 mil lion would imp ly . The average inc ome is only around US $800 per head , and this is inf lated by a transit ory expatriate community , Aus tralian aid and the country ' s mineral wealth . Only one-eighth of the economically ac t ive cit izen population receives a wage or salary , and the acces s of the r emaind er to cash incomes from various kind s of self-emp loyment is intermit t ent and l imited . Equal ly imp or tant , the population is sp read throughou t a wide geographical area that is p oorly connected by road and of ten separa ted by hi gh mountains or sea . Thi s separa t ion i s resp onsible f or the l inguistic and ethnic fragmentation of the c ountry : over 7 00 languages are thought to be sp oken by d i f f erent group s in the Me lane s ian p opulat ion . The two main urban centres are separated by a mountain range : t o connec t them by road would apparently cost in excess of KlOO mi l lion , and there are currently no p lans to do so . It is of ten cheaper to ship good s from Jap an or Au s tralia to each of the Papua New Guinea urban centres than it i s to ship between them . Papua New Guinea is not one marke t bu t a collect ion of many very sma l l ones .
Urban wages in Papua New Guinea are higher than those in c omparable countr ies . Table 9 provides an international comparison

2 8
Table 9 International comparison of monthly earnings ,
Currency Exchangeb Country unit rate
Algeria Dinars 4. 3 5 9 0
Burundid Francs 78 . 7500
Kenya Shillings 8 . 3 100
Malawi Kwacha 0 . 9074
Maur i t ius Rupees 6 . 6390
Nigeriad Naira 0 . 6267
Sierra Leone Leones 1 . 1 7 4 8
Zambia Kwacha o. 7 9 34
Bolivia Pesos 20. 0000
Costa Rica Colones 8 . 5 7 00
Cuba P e sos 0 . 8290
Guyana Dollars 2 . 5 5 00
Honduras Lemp iras 2 . 0000
Nicaragua Cordobas 7 . 0260
Peru Soles 69 . 3700
Uruguay Pesos 4. 0000
Venezuela Bolivares 4 . 2 900
Korea, Rep . of Won 484 . 0000
Malaysia Ringgits 2 . 5 400
P hilippines d Pesos 7 . 5 100
Sri Lanka Rupees 8 . 8280
Fij i Dollars 0. 9415
New Caledonia France (CFP) 248 . 4 900
Mean
Papua New Guinea Kina 0 . 8 1 2 0
1976a
Non-agr icultural sectors Earnings Earnings in local in US currencyc dollars c
6 5 6 . 9 1 5 0 . 70
5 . 028 . oe 6 3 . 80
905 . 9e ' f 109 . 00
4 4 . 94e 4 9 . 50
346 . 1 3 5 2 . 10
42 . 7 0 68 . 10
49 . 15 4 1 . 8 0
1 3 1 . ooe 165 . 10
1 , 7 5 0 . 00e 87 . so
1 , 48 7 . 00 1 7 3 . 5 0
14 3 . ooe 1 7 2 . 5 0
7 0 . 58 27 . 7 0
2 5 3 . 48 1 2 6 . 70
9 7 4 . 1 1 1 3 8 . 60
6 , 805 . 60 98 . 10
1 , 8 16 . 00 4 2 3 . 30
62 , 3 62 . 00e , f 128 . 8 0
4 1 3 . 00 55 . 00
3 1 1 . 90 35 . 3 0
114 . 05
144 . 00 1 7 7 . 00
Agricultural sec t or Earnings Earnings in local in US currencyc dollarsc
3 , 5 54 . 0oE' 45 . 10
312 . 90e , f 3 7 . 7 0
10 . 9 8e 12 . 1 0
3 39 . 4 l f , g 5 1 . 10
34 . 22 5 4 . 60
s o . ooe 63 . 00
5 20 . 00f , h 60 . 7 0
1 3 5 . 17e 163 . 10
5 4 . 4 7 2 1 . 4 0
2 6 2 . 2 5 65 . 60
3 5 , 284 . 00f
72 . 9 0
1 30 . 00i 52 . 2 0
1 3 5 . 80f
18 . 00
1 30 . 8 3 i 14 . 8 0
108 . 7 5 1 1 5 . 30
2 4 , 5 2 3 . 00f
38 . 7 0
59 . 09
4 0 . 00 4 9 . 30
ain some cases , source data re fer to hourly , daily or weekly earnings . These have been converted t o monthly rates , assuming a n eight-hour day , a n d 2 1 . 66 days , or 4 . 33 weeks per working month. Wageearners only except where otherwise indica ted .
bUnits of national currency per US dollar . Market rates at end year are used wherever possib le . cNo non-cash earnings received or included, except where indica ted . dData are for 1975 . e including salary earners . f
Including the value of payments i n kind .
&p lantation and f ishing workers only .
�inimum rates . iPlantation workers onl y .
Source : Colclough and Daniel ( 1 98 2 ) .

29
of monthly earnings in twenty- three devel op ing c ountries f or 1976 . There are enormous data p rob lems with cross country comp arisons -from diff erent me thod s of data c omp i lat ion t o d i f f erent tax sys tems and mos t imp or tantly to the problems of c onversion in t o a common currency . S ince more than hal f the c ountries in the l i s t were at signif ican t ly higher levels of GDP p er capita in US dollar s , however , and s ince mos t achieved independence before Papua New Guinea and will have a more educated p opulat ion , the results indicate rough higher urban wages in Papua New Guinea than in countries with simi lar l evels of p er cap ita p roduct ivity . From Tab le 9 , on t he o ther hand , the average agr icultural wage in Papua New Guinea is not high r e lat ive to s imilar c ountrie s : the p rob lem lies with urban based ind ustries .
In terms o f human resourc es Papua New Guinea was one of the world ' s leas t deve loped countries at Independence . Experience in the use of complex equipment and part icularly in management i s s t ill limi ted . Ski l led Papua New Guinean labour therefore at trac t s a high s carcity premium and the shor tage is filled b y expens ive expatr iates . The skil l s are avai lable , but the cos t is very high .
Urban unemp l oyment in unski l led and semi- ski lled categor ies is high though this does no t depre s s wages to internat ionally c omparab le leve ls . There exi sts a sys tem of minimum wages which effective ly determines the average unskil led wage at a leve l ab ove tha t which labour demand and sup p ly condi tions appear to indicate . I t is pos sible however , that o ther pressures exi s t to keep wages high , and the same pressures might cause considerable indus trial dis location if a central wage fixing sys tem did no t exi s t : the con t inua l c omparison be tween wages paid t o c i t izens and wages paid to exp a triates ; some s tr on g ind iv idual unions , (miners , s t eved ores , public service ) ; many senior politicians have s trong union affi liat ion s in a s i tuation where the balance of p ol i t ica l p ower is tenuous and changeab le ; and it is natural tha t the wage to produc t ivi ty ra tio wi l l be higher f or unski lled workers in Papua New Guinea than , f or examp le , Hong Kong , as peop le in Papua New Guinea generally have the op tion of returning to vil lage life where basic nec e s s it ie s are availab le .
Virtually all land (97 per cen t ) i s under cus tomary ownership where t i t le is determined by his torical occupation and is not effec t ively regi s tered , making c ommercial loan f inance impossib le . Moreover, in many areas , p r ob lems in determining the t rue owners of land can f ru s trate its deve lopment , or make occup iers disinclined to deve lop it for f ear of at tracting an owners hip dispute . Mos t land-based activity in Papua New Guinea faces at minimum long delays .
Papua New Guinea i s vas t ly over-regulated as a result of , f irs t , inher i t ing i t s regulat ions from an over-regulated colonial ruler ; second , the introduct ion of s ome paternalistic c ontrols t o protect the p e op le ; third , a resor t to regula tions to make up

3 0
for p oor administrative capacity ; and f our th , regulat ions made complex by the limited admini s trative capacity of the pub lic service . Dea lings with government take cons iderab le t ime , even to obtain s imp le approvals . The main regulat ions af fec ting land , labour and capital are des cribed in the next sect ion . They provid e a barr ier t o the entry o f new firms and of t e n to the expansion of exi s t ing ones , and raise costs and prices : f or examp le , there is p otential f or monop olis tic mark-up pricing behaviour by existing firms , and Papua New Guinea experience s high cons truc tion costs and property rent als lar ge ly attributab le to land laws .
P apua New Guinea is par t ly locked in to his tori cal trade pat terns by iner t i a : imp or t s have traditionally come from the highly protectioni s t Aus tralian marke t a lon g expensive trade routes . The dominance of three large trading firms in the wholesale and re tai l sector has reinf orced this .
A f inal p oin t is that the c ountry ' s imp or t s equa l approxi ma tely half of i t s GDP . Indus tries imp or t more of their basic requirement s than they wou ld in other deve lop ing countr ies .
Of the prob lems lis ted some are capab le of shor t-term so lut ion - action can be taken to de crease government regulation and perhap s regis ter land t it le al though change wi l l not be easy to e f fec t (p os s ib le measures are discussed in the next section) . For others , it may take considerab le time to improve the movement of goods within the c oun try , lower comparative real lab our costs and improve economic linkages . Any offsetting government sub s idy , therefore , may b e c os t ly , over many year s . I t may b e preferab le if government indus try incent ive s , theref ore , reinf orced the na tion ' s compara tive advantage rather than worked again s t it . The ini tia l logic of saving the country money by imp or t sub s titut ion can rebound if a proj ec t i s a ne t f oreign exchange loser f or many years .
Papua New Guinea has a comparative advantage in proj ects that extrac t and process i t s na tural res ourc e s , proj ects that use them as an input t o manufac tur ing , and p roj ec t s that provide goods and especially services to it s small marke t in indus tries tha t have ' natura l ' protec t ion . P apua New Guinea may be ab le to efficient ly manufacture goods not re lated to its na tural resource base f or exp or t , but will generally not be ab le to do so s imp ly to rep l ace imp or ts on the small dome s t ic marke t .
8 . The general regula tory framework
Poten tial f oreign inves tor s are concerned not j us t with regulat ions that govern their en try and right to operate in a country , bu t also wi th those tha t govern their main factors of produc tion - land and labour - and their general c os t s truc ture . They are also concerned with the struc ture and organi zation of of government wi th which they have to deal .

3 1
(a) N IDA . 1 S inc e the early years of the f irst nat ional government ( Overseas Development Group 197 3 : 2 2-27 , 8 5 ) Papua New Guinea has f ollowed the pract ic e of exp licitly def ining activit ies in which beneficial f oreign investment is encouraged , and tho se in which it i s not . The practic e was f ormalized in the Nat ional Investment and Development Ac t of 19 7 4 , which saw the b ir th of NIDA - t he Nat ional Investment Development Au thority .
All foreign bus ine s ses which commenc ed their op erat ions af t er 6 Dec emb er 19 7 4 are requ ired to reg ister with NIDA pr ior t o star t ing bus ines s . Foreign businesses operat ing befor e this dat e have only t o not if y NIDA of their exi st ence , but a r e subj ec t t o d i scret ionary ' cal l ' which wou ld r equire them to r egister . Where such a no t if ied ent erpr ise as j ust d escribed i s taken over , NIDA is much mor e l ikely t o require the new owner to f ormally reg ister . A f oreign ent erpr ise i s broad ly one where 2 6 per cent or more of the vot ing power is held or controlled by p ersons who are not c itizens . Enterpr ises which ar e not corp orat ion s are considered f oreign if one or more of the par tners or propr ietors ar e not c itizens .
The mos t obv ious ( though not nece s sari ly the most important) representat ion of the country ' s f oreign investment policy is in NIDA ' s l i s t of investment pr ior it ies . The l i s f has b een alter ed from t ime to t ime but , f or examp le , in 198 2 ' Pr iority ' ac t ivities f or f or eign investment inc lud ed larg e-scale mining and p etroleum exp lorat ion or produc t ion , forestry and int egrat ed forest indus tr ies , ship build ing and repair and large-scale d eep-sea f i sher ies . ' Open ' act ivit ies in which f oreign inves tment would be welcomed inc luded mo st large- scale agricultur e ( though with a restric t ion to favour nuc l eus estat es in the case of estab l ished expor t crop s) and s econdary indu strie s , especially further proces s ing of raw mat erial s for export . Open act ivit ies also inc lude t echnical and profess ional serv ices . ' Reserved ' act ivit ies in which f oreigners wou ld not b e allowed t o e s tab l i sh o r t ake over bus inesses inc lud ed alluvial go ld min ing , cof f ee growing ( other t han robusta , with arab ica the main component of the country ' s product ion) , coastal f i sheries , all land transport , and v irtually every type of act iv ity potent ial ly su ited to smal l- scale Papua New Guinean ent erprise .
NIDA has a full-t ime S ecr etariat which processes the app l ication f or reg i s trat ion . Cop ies of t he ap p l ication and a proj ect s t udy , comp let ed by the foreign investor and out l ining the b enef it s t o Papua New Guinea of the proj ect , are c irculated to all relevant
l c omment s on NIDA in this sect ion have b enef it ed gr eat ly from a 198 0 crit ique of NIDA prepared by Roland Brown , then working for the Commonwealth Secr etar iat ( now with the United Nat ions C entre f or Tran snat ional C orporat ions) . Hi s cr it ique was prepared f or the Papua New Guinea Government and is unpubl i shed .

3 2
governmen t depar tmen ts and provinc ial government s . Once comments are rec e ived a recommendation i s made to the NIDA B oard , which nomina lly comprises the head s of government departmen t s mos t concerned with inve s tment . The B oard then makes a rec ommendation to the Minis ter f or hi s f inal dec ision .
Schedule 1 of the NI DA Act list s gu idel ines for the evaluat ion of app licat ion s . It mentions the inve s t ors ' pas t experience and the c on tr ibut ion the proj ec t can make to emp loyment creat ion , government revenue , the acquis i t ion o f useful ski ll s , e t c . To gain regis tra t ion an enterprise mus t agree to what is now a standard set of condi tions covering local equi ty par t icipat ion , a training program f or Papua New Guinean workers , use of local supp lies , the protec t ion of the envir onment and assis tance to cit izens in e s tab li shing bus inesses that could provide inputs to the new proj ec t .
NIDA was intended t o d o much more than s imp ly register new f oreign enterpr ises . Until very recen t ly , NIDA ' s s omewhat con tradictory function s were to coordinate , promo te , regulate , control and sup ervise f oreign inve s tment . . ( In 1983 the NIDA Ac t was changed to remove the inve s tment promotion func t ions of NIDA . ) Any change in an enterprise ' s ac tivities requires NIDA approval , a s do ' . • . any agreemen t s or ar rangements to which a f oreign enterprise i s par ty under which paymen ts are to be made in f oreign exchan ge by or to an enterprise in Papua New Guinea . ' ( From Par t IV of the NIDA Ac t . ) Thus al l over seas marke t ing , loan , management , royalty , etc . agreemen ts require pr ior NIDA appr oval , wh ich is given by the Minis ter af ter receiving a recommendation from the B oar d .
Many o f the princip les behind NIDA ' s formation commanded wid e support at the time , but the prac tical prob lems it has encoun tered have b een enormous , inc luding the dup licat ion of the exis ting func t i ons of government depar tmen ts and long de lays in processing inves tment app lica t ions .
I t was initially hoped tha t NIDA would be a ' one- s t op-shop ' f or f oreign inves tors . When i t was es tab lished , however , the exi s t ing p ower s of other governmen t depar tment s and agencie s were lef t in tact . To transact an over seas loan , theref ore , b oth central bank an d NIDA approval are required , presumab ly to check the same things . An expa triate housewife wis hing to babysit in her spare time mus t receive both Labour Depar tmen t and NIDA app roval . A fores try company mus t separa tely receive a t imber permi t , given only after very lengthy ne got iat ions , and NIDA approval .
A samp le analys is prepared by the NIDA S ecretariat sh ows tha t up un til mid 1 9 8 1 the average t ime taken from initial app licat ion to NIDA Board meeting was 194 days with a fur ther period of ab ou t s ix months before regis trat ion was e f fec ted .
3 3
Port Moresby acc ount ing and legal firms , who ac t for mos t new foreign inve s tor s , inf orm their clients that they sh ould expect a delay of ab ou t one and a half years between ini t ial app licat ion and receiving NIDA regis tration , toge ther with their non-citi zen work p ermi ts and lease on land (b oth d i scussed below) .
The nominated memb er s of the NIDA B oard se ldom at tend , s ince the maj ority of app lications before the B oard are f rom small inve s tors . The B oard has bec ome a mee t ing of relatively j unior officers . Thi s , p lus the fac t that the B oard inc ludes non-governmen t representatives , prec ludes the B oard from p laying any s igni ficant role in government ' s maj or inve s tment decis ion s , which are usually dealt with by inte r-depar tmental conuni t tees .
The NIDA c onditions of regi strat ion have l i t t le sub s tance in them, lar ge ly dup licating the requirements of var ious government departments . Perhap s the mos t imp or tant condit ion , the one requ ir ing cer tain levels of equity to be held by Papua New Guinean c i t izens wi thin a p er iod of t ime , has enc ouraged a non-produc tive c lass of ' front-men ' .
We s tated ab ove that only foreign en terprises es tab li shed af ter 1974 had to regis ter . With the long de lays and dis incentive e f fect of NIDA this has created a ' r ing fence ' of protect ion around long es tablished f oreign enterprises in areas where c i t izens do not p oss ess the necessary money and / or exper tise .
A f ina l cri t icism s tems from the case-by-ca se approval exercised by the Mini s ter . In the pas t , dep ending on the Mini s ter then responsib le for NIDA , mos t NIDA B oard recommenda t ions are generally accep t e d , or al terna t ively , genera l ly rej e c t ed by the Mini s ter ( depending on whe ther the Minis ter belongs to the ' benefi t s ' , ' produc tion ' or ' nat iona li s t ' school) . NIDA dec isions have consequent ly ga ined a reputat ion f or being arb i trary and inconsis tent .
Perhap s some of the above can be better under s t ood by a brief look a t the history of NIDA ' s concept ion :
P olicy in relat ion to terms and condit ions f or smaller f oreign inve s tmen ts wa s never given the hi gh level attent ion of minera ls policy , and a numb er of basic que s tions remained unse t t led . . . . There were extreme ly comp lex pol icy and admini s trative que s tions to be resolved . . . . The hiring of (management consul tant s ) W . D . S co t t mean t that the maj or ef f ort wen t into b ui ld ing an ins titu tion ( NIDA) rather than in to s e t t l ing policy . The administra t ive que stions were much less demanding politica lly and int e l lectually than the policy ques tions ( Garnau t 1981 : 1 9 7 - 9 8 ) .
34
( b) Land . Wit hin Papua N ew Gu inea fr eehold land account s f or about 1 p er cent of all availabl e land , mainly in the p lant at ion sector ; l easehold land al ienat ed by the State on lease t erms ranging up to nine ty-nine years accounts f or about 2 per cent of avai lab le land ; and all other land has cus t omary tit le , related to hi storical occupat ion , which is recognized in f ormal Papua New Guinea law ( see Knet sch and Treb ilcock 1 9 8 1) .
All f ore ign owned p lantations s tar ted before 19 7 4 are s ubj ec t to c ompuls ory acquis i t ion (with compen sation) , which seriou s ly lowers the incentive of exi s t ing investors to maintain much less impr ove their inves tments . These mat ters wi l l b e discus sed i n Se c ti on 12 b e low .
For l ea sehold land , o f re levance to all f oreign inves t or s wanting urban land , a recent s tudy no ted that ' . . . the sys tem i s one i n which each transac t ion , and every s tep i n each transac tion , mus t be approved . The government • . . chooses the rec ip ient s of the ( new) leases , largely determines the use t o b e made o f each allotment of land , passes j udgement on every impr ovemen t and on each sub s equent alterat ion to a l l improvement s and changes in lease cond i tions , approves all t rans fers , and requires that a ll mortgages be approved . All of these con trols are in addit ion t o such usual adminis tra tive requiremen ts as dra f t ing town p lans . . . al l are done on what amount s to a case by case review and app rova l bas i s ' ( Kne t s ch and Trebi lcock 1981 : 102-6) . The p ower o f approval rests with the Lands Mini s ter and mos t pas t minis ters have de legated lit t le of this power . There have b een in s tances of peop le wai ting year s for the Mini s ter t o app rove a s imp le one year sub-leas e of a single f lat .
In a t temp ting to develop the remaining 9 7 p er cent o f land for c ommerc ial use , many dif ficulties and delays arise f or both f ore ign and nat iona l inve s tor s . His torical occupat ion i s d i f f i cult t o prove and there can be more than one forceful ( legit imate or o therwi se) c laimant ; banks do not have a p iece o f paper cer t i fying t i t le aga inst whi ch to lend ; and the occupants may feel that suc cess would p romo te compe ting c la ims for presen t ly unchallenged ti t le . To overc ome these prob lems the government is attemp t ing to intr oduce leg i s lat ion that would enab le cus t omary t i t le to be regis tered .
For f oreign inve s tor s , cur rent regulat ion s prohib i t direc t dea lings in land wi th cus t omary owner s . Land is an integral part of the vil lage c onnnuni ty and it i s wide ly agreed that i t whould not b e permanently a lienated . To use such land , therefore , foreign inves tors mus t awai t negotiat ions wi th landowners leading to government acquisit ion , and then the issue of a l ease . Thi s p rocess can take a very long t ime . F o r land intens ive inves tments , such as those in agriculture and f ores try , the constraint i s often overriding and promi s ing proj ects have of ten been s t opped .

35
A foreign inves tor c oming to Papua New Guinea wi ll have some diffi cul ty ident ifying ava ilab le land , but thi s is not a maj or c ons traint . More imp or tant are the l egal and admini strative con s traint s on acquiring , improving , trans ferring and changing the use to which the land can be put . A huge backlog of app li cat ions for government approvals testif ies to the d i f ficulties .
( c ) Lab our . Having come t o Ind epend enc e in many ways unprepared , Papua New Guinea has a s ever e shor tage of skilled nat ional per sonnel . Unemployment in Papua N ew Gu inea rest s almo st ent irely with un skilled worker s . Emp loyment in unskilled occupations f or expatria tes i s banned . In those categorie s where ski lled manpower is in shor t supp ly the emp loyment of non-cit i zen workers is allowed . I t requires s ubmis sion of a comprehensive training and localization program f or the firm as a whole - a numb er o f expatriate positions are then approved f or three years on the basis of this . Each ind ividua l non-cit izen worker then requires prior approva l from the Lab our Dep ar tment , which ensures the individual ' s qualificat ions suit the p os ition , and from the Mi grat ion Of f ice , who check that the individual i s no t an ' undes irab le ' . Specif ic approva l is required if a non- c i tizen wants t o change j ob s . Few comp laints have been made ab out the princip le of monitor ing non-citizen emp loyment ( from the que s tionna ires referred to in ( f ) below) . The c on cern is more with the delay s involved .
( d ) O ther r egulat ions . Economic ac t ivity in Papua New Gu inea is subj ect to a wid e array of regulat ions cover ing everything from transport and build ing s tand ard s t o the var iety of licences r equ ired by a Papua New Gu inean t o estab l ish a bus iness . Many of these r egulat ions ar e o f t en ignor ed because of poor enf orcement but some , no tab ly the regulat ions on coastal shipping , which sp ec ify which boats shou ld call at what por t s and how often , and the air transport regulat ions , which prevent comp et it ion on many of the air routes , are said t o incr ease the co s t s of d o ing bus iness in Papua New Guinea s ignif icant ly . These mat t ers are d i f f icult to quant ify , however , and may not nec essar i ly compar e unfavourab ly wit h the cost increases induced by o ther countries ' restric t ive r egulat ions .
Many of Papua New Guinea ' s regulations were cop ied automat ically at Independence in 1 9 7 5 from Au s tralia , a country wi th a more s ophis ticated adminis trat ion . S ince Indep endence new legislat ion and regula tions have come into force and before late 1983 , no asses sment was made o f the comb ined effect of these regulat ions on t hose b e ing regulated .
In late 1983 the government formed a Government Regula tion Advisory Commit tee ( GRAC) whose Terms of Re ference required it to ' . . . ascer tain those areas of Government regulat ion and adminis tration which are v iewed as an imp ediment t o the es tablishment and cont inued operat ion of a bus iness in PNG ' . The GRAC has now rec ommended to the government appr op riate le gis lative and administrative change s , but at the t ime of wr i t ing ( mid- 1985 ) no act ion had b een taken .

36
On the posi tive s ide all government s s ince Independence have been commi t ted to a s trong and c onver t ib le currency and there are very f ew impediment s to bringing money in or send ing it out . Wi thin the libera l policy framework the centra l bank normal ly requires a deb t to equity rat io of 3 : 1 or le s s , and over seas borrowings mus t generally be f or a minimum of three years . The tax sy stem i s also rela tively eff icien tly adminis tered and not diss imi lar to that f ound in other countr ies . These fac tors , p lus the p oor adminis tration of many otherwi se p oten t ia l ly burdensome regulat ions are to be weighed again s t the delay s imp osed by the regulat ions on land , lab our and cap i tal ( tha t is , NIDA) and the high cos t s of all f orms of transp ort within Papua New Guinea wh ich are par t ly due to the res trict ions on compe t it i on .
( e) The s tructure of government . There are three t i ers of government in Papua N ew Gu inea . As wel l as the nat ional government and local coun c i ls , in 1 9 7 6 the country was d ivid ed int o ninet een prov inces , each w ith i t s own p rov inc ial assembly and execut ive council . The prov inc ial government s have concurrent power with the nat ional government in many areas such as agr icu l ture , f orestry , t own plann ing , labour and educat ion .
The Organic Law on Provinc ial Government requires only that the re levant provincial government be consulted by the nat ional government concerning large f oreign inves tment proj ec t s . The Constitut ion has in a number of recen t cases been in terpreted as saying such consultat ion mus t be ' meaningf ul ' , however , and this leverage , p lus the obvious prac t icalities of the s i tuation , means that opp os i tion from a provincial government can be fata l . Po tent ial inve s tors mus t make contac t with b oth the main t iers of government in a way tha t avoids damaging the sen s it ivit ies of of ei ther . Proj ec t s have been seriously delayed and even d iscouraged because one t ier wished at an advanced s tage to imp ose its ind ividual requiremen ts on a proj ect tha t was b eing large ly nego t iated with the other ( f or examp le , the S tar-Ki s t f ishery pr oj e c t on Manus was abandcned af ter b e lated Provinc ial Government opposit ion see Section 13) .
A main c omp lain t of new inve s tor s is the lack of a government agency that can e f fec t ively guide them thr ough the government ma z e . NIDA wa s or iginally intended to p lay this role b ut g iven i ts wide regula tory and screening respons ib ili t ies it has always been difficult f or b oth NIDA and the inves t or to see it in thi s role . Thi s gap i n the marke t has been f i lled by the legal and accounting f irms who se cos ts are prohib it ive f or small inves tors and whose knowledge i s inevitab ly l imi ted by not being in side government . The promotional func t i ons of NIDA have recent ly been removed and given to the new Dep ar tmen t of Indus trial Development : i t is too ear ly to tell what effect t his will have .
NIDA was als o supposed to coordina te the views of government on an inves tment prop osal so that one e f fect ive view is coherently

put to the inve s t or , bu t it does no t have the influence with government depar tment s to do thi s .
3 7
The lack o f a ' guide ' and ' coor d inator ' are s tr ong drawbacks to at trac t ing bene f i cial f oreign inves tment to Papua New Guinea .
I t i s worth noting in pas s ing the Papua New Guinea Inves tment Corporat i on . Recognizing a lack of Papua New Guinean cap i tal and entrepreneurship i t was created in the ear ly 1 9 7 0s by s tatute to acquire equ i ty in f oreign owned ventures and hold this in trus t for later sale t o p r ivate citizens . I t is of lit t le p olicy intere s t , being mainly a passive inve s t or in exis t ing enterprises rather than an ac tive partner in new j oint ventures . I t can be argued that it has facilitated an out f low of f oreign inves tment f rom Papua New Guinea , buying out t hose inves tors who wi sh t o leave the country ( e . g . the f or ei gn owner s of the Port Moresb y bus company ) .
( f ) The prob lems . Two recent quest ionnaires have been s ent to exist ing nat ional and f oreign inv estors in Papua N ew Guinea , one in t he cours e of an Ins t itut e of Nat ional Af fair s ( INA) s tudy (Trebilcock 1 98 3 ) and the o ther by the GRAC . Both found a p ervasive conc ern with how t o approach government and whom to approach , the int erminable d elays in obt ain ing government approvals , the d if f icu lt ies faced int erpret ing g ov ernment pol icy , and in the high-level case-by-case d ec i s ion making . The GRAC quest ionnaire asked whether government administrat ion and r egulat ions were a great er concern t han the phys ical and economic constraint s d iscussed in Sect ion 7 , and r ec e ived a strong ly aff irmat ive answer . Even allow ing f or the natural investor d islike of the r egulat ions t o which t hey may be subj ect and the b ia s in only sampl ing exi s t ing investors , the cons ist ency and st rengt h of the resu l t s support the view t hat ex ist ing g overnment r egulat ions s er iously d elay and imp ed e investmen t . The problem i s exacerba t ed by the lack of guid ance on government regulat ion or organ izat i on , and the lack of administra t ive and policy coord inat ion among government d epartment s .
I t is difficult to quantify the e f fe c t s of government regulations or to sub s tantiate the charge that such regulations are excessive or poorly adminis tered . Ra ther bold s tatement s wi ll therefor e b e made o n the b a s i s of the ab ove ques tionnaires cited , int erviews wi th representatives of the p r ivate sector , a rev iew of the numerous INA and o ther papers on the sub j ect , the au thor ' s Papua New Guinea exper ience and a priori reasoning from the cap ac ity of the Papua New Guinea adminis tration and the comp lexi ty of the r egulat ions .
Firs t , the high cost in terms of t ime and expens ive profess ional advice t o ob tain the necessary approvals mus t frus trate and eventual ly de ter s ome f oreign inves tors - particular ly the smaller one s . Many exis t in g inve s tor s in Papua New Guinea say they do not cons ider entering into new ac t ivitie s b ecause this would b ring their ent ire operat ions under NIDA s crut iny . Sec ond , the c omb ina-
38
tion of p ervasive red- tap e but p oor enf orcement causes a b ias toward s inve s tors who are wil ling to f lout the rules , or corrup t the rulers - a serious prob lem when a c ountry i s trying to maximi ze its bene f i t from foreign inve s tment . Not only i s there nonregis tered expa triate lab our , but there is develop ing a nonp roductive c lass of Papua New Guinea ' front ' p eop le to minimiz e de tection under the NIDA Ac t . Finally , s ince the regulations have an obviously greater e f fe c t on new inve stors than exi s t ing ones they create a high barrier to entry , thereby limit ing competit ion , creating oligopolis tically controlled industries with presumab ly higher cos t s than otherwise .
Thi s la s t point i s wor th s tressing . The b igges t hurdle s are f or new inves tors . An exis ting inves tor wanting only to operate in i t s NIDA- regis tered activity has fewer prob lems for t hree reasons . Even though NIDA labour and land approvals may b e required on a regular basis and involve delays , t here is never any ques t ion of clo sing down in the interim . Second , an inves tor with es tablished s taf f can more easily afford to have peop le wit h good contacts acquire the continuing approvals needed . Third , government agenc ie s tha t are supp osed to monitor con t inuing funct ions ( like health , transport , safety , et c . ) rather than the ini tial approva l func t ion s ( like land , lab our and NIDA) do not have the exp erienced s taf f to carry out inspe ctions . The result is a regula tory sys tem that is dif f icu l t to enter but relat ive ly easy to stay within .
There has been a noti ceab le increase in the amount o f inves tment in the hand s of a few exi sting f irms . Many f irms leave , but relative ly few ar e c oming in as the exi s t ing f irms expand by acquis it ion .
( g) S ome suggest ions for the future . Three sets of sugg est ions follow f rom the above d i scuss ion . These are not made with a v iew to making thing s easier for foreign investors , although in s ome cas es t hi s would b e t he ef f ect . Rather , they are made with a view t o assist ing the Papua N ew Guinea Government better achiev e it s own obj ect ives .
Firs t , the re i s a need to guide e f fe c t ive ly f oreign inves tors through the government maze and coordinate governmen t ' s approach to them . To guide inve s tors , an independent arm of government could be e s tab lished whose only f unct ion is as a p oint of contact f or foreign inve stors and a provider of inf ormat ion t o them ab out the law , governmen t regulat ions and policy and ab out whom t o see . Such an agency shou ld have no o ther execut ive funct ions and would not be asked to advise government in any way as to the suitab ility of any inve s tmen t or po tential inves tor .
To coor dinate government ' s response to foreign inves tment proposals and the grant ing , where appropriate , of the neces sary approval s , there could be es tab l ished a hi gh-level inter-dep ar tmental commi ttee to deal with each p roj e c t des ignated as being of
3 9
suf f ic ient importance to j u s t ify such e f forts . The Commi t tee would c ompr ise senior rep resentatives of the mo st affec ted departments . I t i s diff icult f or a s tatu tory authority or an ind ividual d epartment to coord inate government - a c ommittee char ged wi th the necessary resp onsib ility is the way government generally func t ions best .
The second se t of sug ge s t ions conc erns the government ' s regulations in general . Some means for a cont inuing review of the regulatory f ramework fac ing bu sines ses is now required . When rev iewing any spe cific regulations the g overnmen t ' s abi lity to administer and enforce them i s cruc ial . Many exi s ting regulat ions are de fended in terms of their princ ip l es , not their prac tice . An extremely e f fic ient administration can make very comp lex regu lat ions workab le : the opposite is also certainly true . In other areas the benef i t s of regulations can be redu ced by lack of enf orcement , especially af ter those being regulated realize this . The Depar tment of Labour pu ts sub s tant ial resources in to approving in Port Moresby quite complex training and localizat ion p lans yet , by its own admi ss ion , does little inspec t ion . There could wel l exist a wor ld o f d i f f erence between the contents o f an app roved training program and the extent of training ac tually under taken .
The third set of sugges t ions apply to the specifics of the exi sting regulat ions . In the case o f NIDA , at minimum the Ac t cou ld be amended to remove dup l ication : for examp le , the power to app rove transact ions and agr eements which are already scrutinized by the central bank and the tax office , the p ower to regis ter indu stries that already requ ir e a licence to exploit a natural resource and the ab il ity to regi s ter large f oreign inves tment proj ec t s tha t cou ld better be analysed by the inter-depar tmental commit tee . Thi s leaves a group of small pr oj ec t s some of which wi l l be effectiv e ly scrutinized by the work p ermi t sys tem of the Lab our Depar tment , and which would arguab ly be better scrutinized by a less ambit iou s au thor ity relying on less ambitious legis lat ion . Indeed , the p referred solu tion may be to liquidate NIDA and have this residual group of inves t ors require some formal approva l from an exi s t ing government depar tment .
Oppor tuni ties for significant gains also exi s t in de-regulating mat ters rel a t ing t o land . For examp le , there seems little need f or the Mini s ter for Land s or hi s designate to approve short- term sub -leases , mor tgag e s wit h approved financ ial ins titutions , or the use to whi ch individual p lo t s of land can be put given the existence of t own-p lanning z oning regulations .
To sp eed up the e s tab lishment of new inves tment p roj ects c onsid eration c ou ld be given t o allowing new inves t or s to submit c omprehensive training and localizat ion programs after op erations c ommence , when overseas inves tors are fami liar wi t h Pap ua New Guinea condi tions ( say wi thin one year) . New inves tors cou ld be res trained by laws which ban expatria tes working in cer tain j obs

40
and earning be low a certain wage . Ind eed , such cons traints could g eneral ly substitute for speci f ic Labour Depar tment approval of each expatria te emp loyee , ( the individual app roval to recruit and the is sue of ind ividual work permi ts ) , whi le maintaining the general framework of approval of each firm ' s tra ining and locali zati on program . The Labour Department could then c oncentrate i t s scarce resources o n approv ing and enforcing su ch pr ograms , and assis t ing indus try wi th their implementat ion .
Que stions o f de-regula tion can be complex . We have attemp ted here to make some simp le sug ges t ions and ind icate the scope for achi eving a given obj e c t ive withou t the need for s tep by s tep and of ten duplicated controls .
9 . Evolut ion of genera l fiscal incent ives
In t he decade pr ior to self-government the policy of the c olonial admini strat ion was mainly influenced by the need to take quick mea sures to st imula te economic activity in Papua New Guinea once it was rea lized that I ndependence was imminent . In our terms , the measure s adop ted stressed a ' produc tion-maximi z ing ' approach.
A p ioneer indu s tr ies ord inance gave new enterp r ises a f ive year tax hol iday . Personal and c orp orate tax rates in general were extremely low and there was no wi thhold ing tax on remi t ted d ivid end s . Very generous terms were given for the exp loitat ion of natura l resource proj ects , ev id enced by the 1967 agreement which gave Bougainville Copper Ltd an effective ten year tax holiday for the extrac t ion and export of gold and copper concent rate . Agricultural indu stries were allowed an immed ia te write off f or new inves tment expendi ture . The colonial admini s t rat ion also on occasion provid ed sub s tant ial amount s of cos t ly infras truc ture for maj or private investments .
Self -government in 1 97 3 saw some neces sary changes . In 1 9 7 2 some 6 0 p er cent of the Papua New Guinea bud ge t was f inanced d ir ec tly or ind irec tly by Aus tralia : it was c lear that an independent Papua New Guinea would no t continue to receive this l evel o f f inanc ial suppor t . Revenue needed to be raised . Firs t , a gradual increase in p ersonal tax rates to average wor ld leve ls was imp osed . Company tax ra tes were rai sed t o 3 5 per cent , and a new 15 p er cent wi thhold ing tax on remit ted d ividends took the effec t ive tax rate for a f ore ign inves tor to 4 6 p er cent . When the Au s tralian company tax rate went from 4 6 to 48 p er cent in the late 1 9 7 0s Papua New Guinea incr eased its company tax ra te to 3 6 . 5 per cent . The P ioneer Indus tries Ordinance was repealed in 1 9 7 4 and sub stan tial i tems of infras truc ture were no longer provided free to f or eign inves t ors . Finally , the B CL Agreement of 1967 was renego t iated in 1 974 , as d i s cussed in Sect ion 10 , removing i t s

4 1
tax holiday and a l s o making the c ompany ' s prof i t s above a cer tain level subj ect t o higher ra tes of taxation than normal ly prevail . The 1 0 0 p er cent illllllediate allowance for cap i tal expend iture incurred on agr icul tural inve stment s t i l l remains , however , il lustra ting the continual colllllli tment of all p olit ical groups to the rural sec t or .
I t would app ear that the above changes were made to increase revenue rather than as par t of a carefully considered private sec tor inves tment p olicy . There were many pressing prior ities f or the new government , and the provi sion of replacement fiscal incentives d id not rate highly . From a p r ivate inve s tment policy viewpoint the government felt two areas were of much higher priority . Fir s t , c ons iderable e f for t was put into p olicy for the mining and petroleum sec t or s . Thi s followed work on the BCL renegotiat ion , cont inued wi th nego t iations wi th various parties interes ted in deve loping the Ok Tedi gold and c opper proj ec t , and more or less c onc luded wi th s tandard tax and access legislat ion and model agreements f or b oth p etroleum and mining . Thi s took a c onsid erab le amount of senior political and bureaucratic t ime . That it was wor th whi le i s indi cated by the enormous revenue gains from each of the B CL renegotiat ion and the development of the Ok Tedi mine ( see S tatis tical Append ix) . All other sectors and proj ect s pu t together could not have yielded simi lar incremental gains wha tever the ef fort put into them .
Sec ond , the government p laced consid erab le emphas i s on es tab lishing a macroec onomic policy framework that would ensure ec onomic s tab ility . Not only was this neces sary anyway in a small , open ec onomy , but i t was possib ly the main incent ive that the government could p rovide p otential inve s tor s . Independence had generated a wi thdrawal of f orei gn inve s tment from the country , mainly because of fears of impend ing economic and polit ical instab ility . The achievement and maintenance of economic s tability wou ld make a maj or c ontribu tion to p ol i t ical s tab ili ty . I t would also he lp to even ou t the demand f or the output of p roj ects serving the domestic market . Even now , with a good track record of ec onomic and political s tab ility the Papua New Guinea Government regards the maintenance of mac r oeconomic s tab ility as i t s mos t imp or tant contribu tion to encouraging private sec tor inves tment . ( See , f or example , the 1980 Bud get Speech : 27 . )
By 197 7 there were s t il l es sential ly no f i scal incentives f or inve s tor s that app lied across all sectors of the ec onomy . The g overnment wou ld , p resumably have been willing to d i s cuss some limi ted measure s with new investor s , bu t there was nothing writ ten d own to pass immediately acros s the table . This is not to say that the mat ter was not f iercely debated . The ' pr oduc t ion ' school , f rom a base of the Indus t r ial Development Division o f the Depar tment of Lab our and Indus try , were c ont inually putting f orward comprehensive inc entive packages f or d iscu s s ion . They invariab ly included tax holidays and of ten ref erred t o the e�tab lishment of indus trial

4 2
e s tates . The ' nat ionalists ' of ten suppor ted such moves , looking f or more incentives f or national inves tors . Those adhering to the ' benef its ' school successfully. resis ted . They ar gued tha t given Papua New Guinea ' s general cost s tructu re , and its wage s in p ar ticular , the country would only at trac t industries tied to a source of raw materia ls or the local market whatever the tax incentives : the benef its would ma inly go to indus tries that would come to Papua New Guinea anyway . Incent ives sp ecif ically tai lored to the needs of the country were requi red . Exac t ly what these wou ld be rarely surf aced because of other prior i t ies and the t ime t aken wi th the debate on mor e generous incentive s .
Between 1 9 7 7 and 19 7 9 , however , different incent ive s chemes began to emerge from the government . This was mainly due t o c hanging pr ior ities within gove rnment and the int ere s t being taken in Papua New Guinea by inve stors who would p romote a sens ib le discussion of the issues . These reasons were enhanced by cont inua l pressure from the ' produc t i on ' school coup led with political concern about what was perceived a s a general lack of deve lopment .
The incentives were usually a generalization of what the government had been wi lling to do t o enc ourage a sp ec ific inves tment proj ec t . They were invar iably put to the Nat ional Executive Council ( the NE C or Cab ine t ) by the Finance Depar tment , demons trating that the ' benef i t s ' school was in control during this p er iod .
(a) The 1 97 7 - 7 9 inc ent ives . The in centives d evelop ed during this per iod are list ed in App endix 3 , which is a paper prepared in August 197 9 f or t he Papua N ew Gu inea-Austral ia Inves tment Promot ion C onference .
The f ir s t set of incentives devel oped were the Export Incent ive Scheme (EIS) , the Infant Indus try Loan S cheme ( I IL) and the Feasibili ties S tud ie s Contr ibu t ion S cheme ( FSC) .
The EIS large ly arose out of the cont inuing debate on incentive s between the ' benef i t s ' and ' pr oduc tion ' schools . The lat ter favoured ind us trial import sub s t i tu tion behind high protect ion and fiscal incent ives , while the f ormer ar gued f or expor t- led gr owth based on the country ' s comparative advantage . The EIS was the ' bene fi t s ' s chool giv ing evidence of c ommitment t o their stra tegy .
The EIS exemp t ed from company tax 5 0 p er cent of the p rof i t s f rom t h e gr owth in expor t sales i n the current year over the average value of export sales f or the preceding three year s . New or growing indu s tries would benefit rather than s tatic one s . The s cheme app lied to a wide range of manufac tur ed goods lis ted in the Appendix .

4 3
The I I L ar ose f rom negotiat ions to es tab li sh a tuna canning pr oj ec t in Papua New Guinea . The maj or lenders to the proj ec t a sked f or tax rel ief in the early year s of the proj ec t because of poten t ial debt service problems in the third and f ourth year s . The government f e l t this solut ion did not f it the prob lem and offered a loan fac ility that c ould , at the company ' s op t ion , be drawn in the problem year s . Such a loan would carry a commercial in ter e s t rate but would rank in terms of repayment behind other lender s . The ini t ia l c oncerns of the lenders w�re theref ore met , and an unneces sary tax c oncess ion avoided .
The I IL i s s imp ly generali z ed from this offer . The tuna proj ec t d id not proceed and the IIL was f ir s t app lied to the Raw Su gar proj ec t , which eventua lly drew a US $ 1 0 mi llion loan , a lar ge burden on the budge t . In the nego t iations the limi tat ions lis ted in Appendix 3 were es tab l ished : f or examp le , no dividends to b e dec lared whi le a n I IL i s ou t s tanding and the value of any loan limi ted to 15 p er cent o f the t o tal cap i tal funds required to imp lement the p r oj ec t .
The t i t le ' infant indu s try ' ar ose to counter the trad itional argument for protect ion of the same name . I f indus tries were viab le , but needed only s tar t-up assis tance for the short-run , then the IIL should be suf f icient . There was a s trong fear of companies initia l ly rec eiv ing imp or t indus try tar i f f protect ion and then discover ing they could not survive wi thout i t . Ex ante it was hard to distinguish such indu s tries from tho se with a genuine shor tterm need . The I IL would allow the companies t o dec ide for thems elve s .
Final ly , the FSC arose out of random reque s t s from companies f or su ch assis tance and a realization wi thin government that there was lit t le preva iling inf ormat ion on which to base an inves tment decision . It was not expec t ed to cost the government large sums of money . Und er the F SC the government of fers to f inance 5 0 per cent or Kl00 , 00 0 , whichever i s less , of the c os t s of a feasibility s tudy in return for an under taking tha t should a proj ec t not result the g overnment has access to a l l informat ion . If a proj ect did re sult , the money would become a loan or equi ty contribut ion .
In presenting ear ly vers ions of the general l i s t of incentive s , three other it ems wer e added . Firs t , there was a re ference to the zero rate of duties on imp or ted cap i tal goods and the generally low rat es on imp or ted raw materials from which comp le te exempt ion could al so be granted . Sec ond , the government s ta ted that it did not usually want equity in new proj ects , but that i t would generally take it when reques ted to demons trate i t s commi tment t o cer tain pr ior i ty pr oj ec t s . Such a s tatement was meant t o s atisfy the p erceived needs o f all overseas investor s . Finally , a general s tatement on protect ion p olicy was made (di scussed in S ection 14 be low) .

44
The paper describ ing the se s ix measures was cir culated in 1 9 7 8 and represented the f ir s t s tatement o f general fiscal incentives by Papua New Guinea . When it was re leased the government hoped that not only would the mea sur es themselves be e ffective : i t also hop ed that the p sychological impress ion c onveyed to potential and exi s t ing inves tors would off set a growing feelin g that the government was anti-inves tor and anti-growth. There was a large e lement of con fidenc e-bui ld ing involved .
The Finance Minis ter ' s 1980 budget speech added three more incen tives to the lis t . The first was acc e lerated depreciat ion , whereby el igib le inves tor s - those in manufac turing , transp or t , c ommuni cat ion , build ing and cons truc t ion - c ould c laim 2 0 per cen t of an investment in the year of purcha se as an addit ional depreciat ion a llowance . In the 1982 budget the scheme was extended to those items of agr icultural inves tment no t benefiting from the exi s t ing 100 per cent write-off app l icab le only to a tightly def ined set of agricul tura l equipment .
The second scheme was an of f er t o provide infras truc ture f or new proj ec t s in r eturn f or a negotiated user charge payab le over the life of the proj ect . Th is was really an of fer of f inance as the proj ect sponsor was expected to c ons truc t the inf ras truc ture and the user charge was to be ca lculated as a re turn on cap ital rather than lev ied on use . Repayment of the user charge would rank behind senior proj e c t deb t and no shar eho lder guar antee was required . The scheme therefore reduced a proj ec t sponsor ' s fron t end risk. The user charge was to be based on a commercial int ere s t ra te for mos t proj ects , but a l ower rate would app ly for non resource-related proj ects located outs ide the main t owns .
These two incent ives were generali zed f rom the mining indus try . The Finance Depar tment liked the idea of accelerated deprec iat ion as it only def erred ra ther than reduced nominal tax liab ility (although it d id reduce the present value of tax liab ility) . The idea of providing infras truc ture came d irec t ly from negotiat ions on the Ok Ted i p roj ect .
The las t of the three incentives ment ioned in the 1980 budge t speech a llowed a 200 p er cent deduct ion from asse s sable income for wages paid t o apprentices regis tered wi th the Apprenticeship B oard . I t was intr oduced to counter a declining trend in the numb er of new apprentices .
By 1980 the government had a range of incentives that had many advantages and few disadvantages . They c ould be manipulated to provide considerab le assis tan ce to a proj ect : f or example , the provision of infras tructure , accelerated depreciation and infant indus try support could grea t ly improve the expec ted f inancial p osit ion f or both shareholders and lend er s . The incentives would not , however , sub s idize prof itab le inves tor s and ran lit tle risk

45
of hav ing lar ge sums of money ou t laid or forgone f or minimal bene f i t . Mos t importantly , they met the perceived needs of marg inal proj ec t s in areas wher e Papua New Guinea had a comparat ive advan tage . Fina lly , they provided evidence of the government ' s commi tment to new private inve s tment and so enhanced inve s tor c onfidence .
The comp laint s against them are three-f o ld . Fir s t , some have c omment ed on the ir po tent ial cos t . In mos t cases , however , the government inf ras truc ture or infant industry loan can rely on the shareholder ' s assessment o f the proj ec t s viab i lity to ensure repayment , an assessmen t suppor ted by the equity ou t lay ( in infant indus try loan to Ramu Sugar was very cos t ly and not used on a viab le proj ec t , however , even in these c ircums tances , it was the bes t of the measures ava ilab le - see Sect ion 12) . The second comp laint , with admit tedly some j us ti ficat ion , was inevitab ly that they did not go far enough . Another legi t imate complaint , seldom raised a t the t ime , was that they were biased t owards promot ing cap i tal ra ther than lab our in tensive proj ec t s . I f the incentives were approp r iate to the real needs of investors , however , they would promote more emp loyment than incentives not so geared . The se las t two concerns were part ly addres sed a f ew year s later ( see be low) .
( b) 1 98 0-83 . From 1 98 0-83 d ebat e and act ion on inves tment incen t ives g ave way t o universal concern with maintaining ext ernal balance in Papua N ew Guinea in the face of rapidly falling commodity prices and a sharp fall in BCL ' s output . The only mea sures introduced were to provide specia l deprec iat ion allowances f or the cost of conver sion to alternative energy sources and a doub le deduc tion f or c oas tal shipping c os t s . The lat ter measure arose because the gover nment ' s p olicy of requiring a cer tain range and frequency of shipp ing services increased cos t s on many routes .
( c ) 1 983 -8 4 . Ex ternal balance was ma int ained by cu tbacks in government expend iture . By 198 3 most connnod ity prices had recovered and the crisis had passed . Demand out s id e the mining sector had been ser iously d epressed , however , and the economy was su f fering the e f fec t s of the cutbacks . S ome f irms had closed and unemployment had r isen con s iderably . As a result the g overnment began looking for measures to s t imulat e investment , while maintaining t ight control ov er g overnment expenditure .
Towards the end of 1983 the newly created Depar tment of Indu s trial Deve lopment released a draf t White Paper on Indus trial Deve lopment whi ch �as str ongly protec t ionis t . A fierce debate raged with the Finance Dep ar tment and the result was a compromi se Whi te Paper issued in February 1 9 8 4 which , f irs t , toned down the references to p r otec t ion , and second , f oreshadowed the introduc tion of var ious incentives . The se incent ives were probably a compromise between wha t the Finance Dep ar tment wanted t o do anyway to s timulate gr owth and the need t o entice the Depar tment of Indus trial Deve lopmen t to amend the Whi te Paper .
46
The f irst and most important was t o a llow for the f irst f ive years o f product ion of a new manufacturing ent erprise a tax rebat e equal t o a c ertain percentage of the min imum wag e per employee - the percentage being 40 , 3 0 , 2 0 , 15 and 10 per cent in each of the f ive year s . Thi s measure was politically p opular given the increase in unemp loyment with the recession , recogni zed that high urb an wages are a disincentive t o emp loyment , and offset s ome bias in favour of cap i ta l over lab our assoc iated with the ear lier incen tive s chemes . Only f i rms whose average rate of protection on their output i s less than 15 p er cen t higher than that on their inputs are e li gib le , so raising dut ie s on inputs would now , in e f f ec t , cheap en lab our .
The second measure for new manufac turing enterpr i ses allows them to accelera te their depreciat ion to avoid paying tax unt i l they have recovered their initial nomina l inves tment . This mea sure is taken d irec t ly from the f i scal package for mining and petroleum c ompanies developed in the mid 19 7 0s . I t has the advantage of only deferr ing nominal tax paymen ts and not app lying to prof i tab le proj ec t s .
Third , the exp ort incentive scheme was fur ther improved ( i t had earl ier been made more generous) to allow 100 per cent o f pro f i t s fr om export s to be exemp t from tax i n the first three year s of ope ration . This is effective ly a tax holiday for new exporting industrie s . Expenses incurred in promot ing export produc t ion were also a l lowed as a doub le deduction .
In addit ion t o these measures in Augu s t 1983 the company tax rate wa s reduced to 35 per cent ( at the same t ime the dividend withhold ing tax ra te was increased from 15 to 17 p er cen t) . The company tax rate could not be reduced below 35 per cent without givin g unnecessary advantage to the new Ok Tedi mine , which paid normal company taxes up to a limit of 3 5 p er cent until it recovered its investment .
The package of incent ives now on offer is wide , especially for manufac turing enterpr ises . I t is by and large cos t-effective and tailored to the c ount ry ' s needs and comparative advantage . I t largely follows the thinking of the ' b enefit s ' s chool , wi th s ome minor and b enef i cial inr oad s from the ' pr oduc t ion ' s chool .
The i s sue s till separa ting the se school s , however , esp ecially in relation to manu fac turing , is protec t ion . I t i s the maj or ou ts tanding i s sue of inves tmen t policy and is discussed b e low in the sec toral d iscussion on manuf ac tur ing .
I t i s diffi cult t o assess the effectivene s s of the ab ove incen tives . The Chie f Collec tor of Taxes in Papua New Guinea est imat ed ( in a p r ivate d iscu ss ion) t hat the measures int roduced p r ior to 1983-84 were d ec reas ing government revenues by K4 mil lion per annum , although mu ch of this wou ld be regain ed in lat er years .

4 7
The n ew measures he e s t imat es wou ld probably hav e a s imilar e f f ect . In present value t erms the measures will probably not cost much . The co s t wil l , however , b e very large i f some of the inf rastructure user charges or infant industry loans cannot be repaid ( and at the t ime o f writ ing there must be some concern over the r epayment of money ext end ed to Ok Ted i and Ramu Sugar) .
From d iscuss ions with at least exi s ting inves tor s the measures have imp r oved inve s tor c onfidence . They have enab led s ome proj ects to proceed where the alternative was either that they would not , or that they wou ld require muc h more generous incentive s .
10 . Mining and petr oleum
The principal mineral weal th to dat e has been found in the forms of gold and copper . Both the Bougainville and Ok Tedi mines are deve loped on porphyry copper-gold mineral izat ion of a type wid ely dis tr ibuted throughout the moun tain r egions of the country (Roger son , Williamson and Franc i s 1984 ) . With base me tal prices now depressed for a long p er iod , more than 90 p er cent of metal mineral expl orat ion ac tivity in Papua New Guinea i s concerned with the search f or med ium t o high tonnage , low-grade precious metalbear ing dep os i t s . Apart f r om the copper-gold porphyry s there are at least f ive o ther types of mineral dep os i t , exemp lified by the precious me tal dep osits located at P or gera , Wau , Mi s ima Is land , Lihir I s land and La loki respe c t ive ly ( see App endix 1) , all of whi ch con ta in sub s tantial quantities of gold in associat ion wi th other minerals . There are f our maj or sedimentary bas ins with pe troleum p otential ( Rogerson e t a l . 1984) : New Ire land , Nor th New Guinea , Papuan , and Cape Vogel Basin s (Figure 1) . The potentially commerc ial Juha ga s /condensa te f ie ld in the Papuan Basin was d i scovered in 198 3 , whi le the exi stence of sub s tan t ial gas deposits in the of f- shore areas of the same basin has b een known f or some years .
Since self- government , Papua New Guinea ' s principal obj ec t ives for the development of its mining and petroleum sec tor has been to maximize the long- term flow of government revenue from the sector , and thus help to mee t i t s goals of f i s cal self-reliance and pr ovi sion of new infras truc ture and services in rural areas .
Papua New Guinea ' s minerals po licy i s premised on the v iew tha t lar ge mines are useful not for any d irec t b enefits tha t they bring , bu t f or the f inancial suppor t that they can prov ide f or pr ogress towards other nat ional goals (Papua New Gu inea , Depar tmen t of Finance 197 7 : 2 ) .
The government has b een carefu l to dis tinguish the long- term revenue maximization obj ec t ive from the maximizat ion o f the government r evenue share in any indiv idua l proj ect ; i t views the approp ria te s tra tegy as one which balances the need f or incentives

48
Figure 1 Sedimentary basins and petroleum prospecting licences in Papua New Guinea
i jOo I i i ���....._2�9_0_,__.___._4�00 km i I
0
12° 141 ° 144° 1 47° 1 0° 1 3° 1 56°
Sourc e : Roge rson , Williams on and Franc i s ( 1984 ) , Figure 4 .
to proj ec t development ( and e f f ic ient operation ) with the immed iat e requirement f or tax revenue .
From the t ime of the BCL renegotiation the government ha s demons trated gr eat reluc tance to risk it s own budge tary re sources or borrowing capacity to promo te mining proj ec t s . The general rule has been e s tablished t ha t p r ivate inves tors as sume exp loration r isk , tha t proj ect sp onsor s wi l l be resp onsib le for provision o f a ll necessary infras tructure , and tha t governmen t equi ty ob ligat ions in min ing will be l imi ted to an op t ion to purchase a minor i ty share (maximum 30 per cen t , but usually much less) at par at the commencement of cons truc tion . In pet roleum , the government ' s minor i ty equity wi l l usually be fund ed by means o f a ' carried in teres t ' . There have been two excep t ions to this reluc tance t o risk pub lic fund s : f ir s t , in who lly exc ep t ional c ircums tances , such as those f ollowing the breakdown of ne got iat ions wi th the Kenne cott Copper Corp orat ion on the Ok Ted i pr oj ec t in 1 9 7 5 , the government has

4 9
taken s tri c t ly limi ted exp loration risk ; second , the government has b een wi l l ing t o provide inf ras truc ture ( in exchange f or equity or for a c ommerc ia l return on the funds ou t laid) where this would either reduce the inves tor ' s risk sufficiently to induc e an otherwise excessively risky but poten t ia l ly prof itab le investment , or would create s igni f icant externa l ec onomies by es tab lishing infras truc ture that might reduce the c o s t of other maj or proj ec t s .
Prof i t and cash-flow-based f orms of taxat ion have been viewed as the chief means f or meet ing revenue obj ec tives . In recognition of the s tate ' s limi ted f inanc ial and managerial capaci ties maj or ity equ i ty shares ( or even the lar ge s t share in a consor tium) have no t been sought . Pub li c servi ce adminis tra tive capac i t ies have been conc entrated on the ne gotiat ion of a sma l l number of key proj ec ts , which have then provided the basis f or general legis lat ion or forms of con tract to s imp lify the negotiation pr oces s for sub sequent proj ec ts .
At t he same time , considerab le ne gotiation e f f or t , and supp lemen tary mea sur es in ec onomic managemen t and public expenditure al locat ion , have been devoted t o coun ter ing potentia l ly adverse effects from mining : revenue in s tab ility , envir onmental damage , di srup tion of l o cal communit ies , or exc e s s demand pressur es in skil led and semi- ski l led labour marke t s . Where pos sib le , eff orts have been made to increase the non-financ ial linkage s from mining by imp osing loca lization and training , local purchas ing and loca l bus ine ss deve lopment ob ligat ions - but without j eopardizing achievement of revenue goa ls .
In imp lement ing these overal l princip les , the government has asser ted its sovereignty , on behal f of the people , over the minerals in the gr ound . Whi le s tating that the mos t effective means of deve lop ing i t s minera l resources wi l l be thr ough the agency of f ore ign inves tor s , the government has c ont inua lly emphasized that the ' lion ' s share ' of any profi t s above the level necessary t o induce a dec ision to inve s t wi l l ac crue t o the state through taxat ion .
The speci fic measures adop ted have paid careful at tention to the manner in which large mul t inational minerals and petroleum corporat ions make inves tment decisions , and t o any c ontrast between the ir pa tterns of ri sk aver s ion and ra tes of time preference and those of the state . The tax regime eventual ly incorp orated in genera l legi s la t ion i s designed t o enab le companies to make maximum use of foreign tax credi t s ( and thu s minimi ze revenue los s to Papua New Guinea) , and to be broadly neutral in its e f fect on the choice b e tween alternative means of f inanc ing large proj ec t s ( the prop or tion of loans o r equity) . The tax regime avoids devices which increase the risk of loss , such as high f lat-rate royalt ies or exp or t taxes , and concentrates on measures which tax revealed profitab il i ty . Taxat ion over and ab ove norma l company

50
inc ome tax ( levied on acc ounting prof i t) i s now levied only af ter achievemen t of a spe cif ied rate of return on proj ect out lays in a disc ounted cash f low calculation . Thi s reduces investor risk by increas ing the p o s s ib ility of ear ly rec overy of outlays in profitab le proj ects , permi t s repayment of deb t bef ore special taxation is imp osed , and incorporates a f orm of calculat ion which companies themse lves use in apprais ing proj ec t s .
The governmen t has s ought long- term stabi l i ty in i t s agreement s with minerals inve s tors . Thi s is achieved not only by c lear ly set t ing out the ru les o f the game in advance , but also by des igning the tax regime to adj ust automat ic a l ly to changes in profi tabi li ty and the balance of nego t iating advantage between the inves tor and the s tate during proj e ct lif e . Thus the need f or further renegot ia tions of the type required at Bougainvi l le in 1974 i s obv iated . In this respec t the government has departed from the widespread presump tion that conf li ct and periodic renegotiat ion are inherent in the relat i onship s b e tween inves tor s and ho s t countr ies i n extract ive indus tries ( s ee e . g . , Vernon 19 6 7 o r Smi th and Wel l s 1 9 7 5 ; the a lternative p o s i t ions are succinc t ly discussed in Garnaut and Clunies Ross 1983 : 69- 7 7 ) . Crucia lly , the tax regime adop ted does not require an ex ante j udgment by the s tate , based on inadequate ev idenc e , ab ou t the p otential profitab il i ty of any g iven mineral deposit .
Papua New Guinea has also favoured a move towards a framework of general legislation and p olicy s tatements of wide app licab ility , rather than c ontinuing case by case neg otiation of f i scal terms . Although case by case negot iat ion p otent ial ly a llows a government to collec t a higher share of revenue s from some proj ec t s without imp o s ing an exce s s ive burden on others , it great ly increases the burden of inf ormat ion- gather ing and ne gotiat ion e f f ort f or the government . Mor eover , where terms mus t be s e t t le d in advance of deve lopment the potential advantage is small and subj ec t to great uncertainty . A general f ramework is favoured in Papua New Guinea on prac tical gr ound s : negot iating capacity is l imi ted , and c learly s ta ted terms are seen t o f unct ion , in themselves , as an incentive to mineral exp lorat ion .
The concep t central to Papua New Guinea ' s current minerals and pe tr oleum tax regime i s tha t of resource ren t . Following Garnaut and Clunies Ro s s ( 19 7 5 , 1983) this is def ined as the value of the produce of a minera l resource minus all the costs of product ion , inc luding the minimum re turns to cap ital that are nece ssary to induc e inve s tment . These minimum re turns may be termed the ' supp ly price ' of inve s tment . S ince there wi l l ini t ial ly be uncer tain ty abou t the outcome o f a p articular inve s tment , the expec ted returns mus t technica lly be defined as the inves tor ' s asses sment of the probab i li ty dis tribut ion of returns af ter tax ; the supply price will then be the probability d i s tr ibution ( or , loos ely , ' rate o f return ' ) r equired by the least demanding investor . The supp ly price wi l l consist es sent ia l ly of the opp or tunity cost
5 1
o f cap i tal i n the indus try , adj us ted for p erceived risk . The supp ly price can be exp e c ted to increase with uncertainty , and with risk -which w i l l be grea ter the lar ger an ind ividual inves tor ' s exposure in a proj ec t . Ex an te the supp ly price nece s s ar i ly imp lies a d i scounted cash f l ow calculation . The governmen t ' s aim i s to tax away the highes t p os s ib le proportion of resource rent , so defined , which i s consis tent with ef ficiency of resource use and the wider incent ive to inve s t . P otent ial resource ren t from an individual deposit wil l vary accor ding to i ts relat ive c o s t c omp e t itivenes s i n the interna tiona l league fab le o f workab le deposits of the minera ls concerned ; thi s p o s i tion will be af fected by a wide range of fac tors , inc lud ing the richnes s of the ore , acce s s ib i li ty of the mine- s i te , co s t of inf ras truc ture and skills and so on . Papua New Guinea has aimed at a tax sys tem whi ch creates a mutual intere s t in the e f fic iency of resource use , and thus of rent maximi zation , but which a ls o ca ters f or b o th the mar ginal proj e c t and the highly prof itab le in tra-mar ginal one . The emergence of these princ ip le s can be traced through the rene gotiation of the B ougainville agreement , and the long negotiation p rocess l eading up to the commencement of c ons truction at Ok Tedi .
( a) The B ougainville renegot iat ion , 197 4 . The ev o lut ion of f iscal regimes f or min ing and petroleum in Papua New Guinea is summar iz ed in F igure 2 . Through t ime , the r eg ime has moved from one yield ing lit t le prospect of large returns to the state from a prof itable min e , to one d es igned ad hoe to achieve red is tribut ion of r eturns from an exi s t ing mine , and then to one based on the principles describ ed above ( f or Ok Tedi) , laying the f oundat ion f or a reg ime of general app licab il ity , and exp ec t ed durab il ity in a wide variety of circumstances .
The or iginal inves tment at Bougainville was made by C on z incRio T into of Au st ralia ( CRA) , the maj ority-owned Austral ian sub s idiary of the B ri t i sh-based interna tional mining comp any , the Rio Tinto-Zinc Corp ora tion ( RTZ) . At the t ime of i ts construct ion i t was the lar ge s t s ingle- stage copp er-mining op eration ever designe d and developed (Mikesell 1 9 7 5 : 7 9 ) . Reserves were e s t imated at 900 mi llion tonne s of ore , averaging 0 . 4 8 per cen t copper and 0 . 5 5 grams per tonne of gold ; there were , in addit ion , s ignif i cant quantit ies o f silver . B ougainvi l le ' s output record is represented in the export s tatis tics in App endix Tab le s A. 2 1 and A . 2 2 : in the ear ly year s of produc tion , the conc entrates p roduced and exported c ontained each year about 180 , 00 0 tonnes of copper and some 20 t onnes of gol d . The deposit was identified in 19 64 , eva luation was comp leted by 1969 , and produc t ion c ommenced in Apr i l 1 9 7 2 . Thi s was RTZ ' s first maj or deve lop ing coun try inves tment , although i t mode l led i t s approach on a similar but smaller open-p i t mine c onstruc ted by the c ompany at P a lab ora in S outh Africa . RTZ /CRA mot iva tions were clearly those of a c ommercially- or ien ted mining inve s tor seeking a fair ly rapid return of out lays , t oge ther with a dis c ounted cash f low rate of return commensurate with r isk and the opp ortuni ty cos t of c ap i tal (Mikesell 19 7 5 : 9 2-7 ) . RTZ and CRA
5 2
were no t i n s ear ch of c op per con cen trates t o f eed sme l ters ; sales contrac t s were s truck a t arm ' s length with f oreign buyer s , inc luding the portion sold to the sme lter o f an RTZ-associated c ompany , Rio Tinto Patino , in Spain . The pr oject was explored and appraised , and the dec i s ion to proceed was made , at a period during the 1960s wh en expe c tations ab out future c opper demand and prices were very otpimi s tic , and when the economics of copp er-mining had dictated a shi f t to lar ge , low- grade dep osits workab le by open-p i t , cap italinten sive and non- selective me thod s . Ini tial f inanc ing requiremen ts were large ( sub s tant ially exceeding Papua New Guinea ' s total GDP a t the t ime ) ; in common with other new mining proj ects , Bougainv i l le relied heavily on loan finance t o meet i t s capi tal need s ( Rad e t zki and Zorn 1 9 7 9 : 5 7-66) . I t was an example of par tial ' proj ect- f inancing ' in tha t the shar eholders were not required to guarantee all the loans unt i l f ina l repayment : once the proj ec t was comp leted to agreed s tandards , the commerc ial bank lenders re lie d up on proj e c t as sets and future cash f low for their secur i ty . The f inanc ing s truc ture of the proj ect is detai led in Tab le 1 0 . Much of the finance was in itially rai sed on the bas is of assurances p rovided by long- term sales contrac t s wi th Japane se and German smel ters .
Although the priva te spons or s were pur suing commercial profitab ility ob j ec tives , there were important non- f inancial fac tors enc oura ging t he inve s tment decis ion . At the time the Aus tralian Government wa s at temp ting to rap idly bui ld up Papua New Guinea ' s long-run exp or t-earning and revenue-raising capac ity , and was anxious to be seen to be prepar ing the country for eventual poli t i cal trans it ion to self-governmen t ( ful l Independence wa s no t in fac t env isaged for the near future at the time) . Thus the Aus tralian Governmen t was enthusias tic ab ou t a maj or mining inve s tmen t by a par t-Aus tralian company in Papua New Guinea : Aus tralian offic ial agenc ies direc t ly supported t he proj ect wi th loans ( Tab le 10) , whi le the Aus tralian Government lent Papua New Guinea the funds to purchase i t s shar eholding and contribute infras tructure . The Aus tra lian Government was not , however , prepared t o provide CRA with any guaran tee against the political risk of expropriat ion or nationalization by an ind ependen t Papua New Guinea .
Papua New Guinea ' s domes tic legislation ( and adminis trat ion) were no t or ganized to cope wi th an inves tmen t of this magnitude . Negotia ting skills were scarce , mining legis lat ion essentially of fered mining l eases unc ond i tional ly upon reque s t , and taxat ion of bus iness was pervaded by the ' p ioneer industry ' obj ec t ive of enc ouraging large numb ers of bus ine sses to es tab lish in re turn f or extended tax ho lidays f ollowed by extremely modes t tax rat es . When CRA reque sted a special agreement , arguing tha t the p roj ect was marginal and wou ld need an extended p eriod of tax holiday to mee t i ts deb t ob ligat ions and p rovide adequate incentive to equi ty-h older s , it was no t surpr ising tha t its arguments lar gely carr ied the day . The idea that government should provide the

5 3
Tab le 1 0 Financ ial s truc ture of the Bouga inville c opp er proj ecta
US $ mill ion
Loans
Commercial banks ( led by Bank of America) 7-year f loating rate Eurodol lar loan , due 1 9 7 8 Floating ra te Eurodollar loan due 1 9 7 3-76
US Exp or t- Import Bank 6% , due 19 7 3 - 7 8 Japane se Government , 8 . 2 2% due 1 9 7 3- 7 9 Japanese expor t- imp or t credi t , 6 . 85 % due 1 9 7 3-82 Aus tralian expor t cred i t , 7 . 2 5-7 . 7 5% , due 197 3-82 Aus tra lian Governmen t housing loan , 8% , due 1 9 7 4- 7 9
Total loans
Equity
Conzinc-Rio Tinto of Aus tralia Papua New Guinea Government Pub lic share of fering
Total equi ty
Total cap ital
6 7 . 4 96 . 0 5 4 . 6 3 0 . 0 2 3 . 1 26 . 5 15 . 6
89 . 6 3 3 . 4 4 3 . 2
aAt commencement of produc tion in 1 9 7 2 ; excludes government ' s infras truc ture contr ibut i on .
Source : Rade t zki and Zorn 197 9 : 65 ( drawing from company annua l reports ) .
313 . 2
16 6 . 2
4 7 9 . 4
minimum concession s needed t o procure the developmen t ( re lated to the expec ted rate o f profit f or the c ompanies ) did not , and , in view of the governmen t ' s ignorance , probab ly could not enter into the agreement . ' By this s tandard the B ouga inville Agreemen t can b e seen - and c ould have been seen by expe rts at the time - t o be far too generous to the companies ' ( Oversea s Deve lopmen t Group 1 9 7 3 : 69 ) .
B CL achieved a very low r oyalty ra te ( 1 . 25 per cent) , a threeyear tax holiday followed by the opportunity to take free depreciation , and a permanent exemption o f 2 0 per cent of copper income from tax . On these terms , and t he costs and prices ac tually realized , the c ompany would have recovered all its inves tment , with interes t , by the end of 1974 ( abou t 3 0 months of p roduc tion) and s t ill would have paid no income tax unt i l the ear ly 1980s ( Garnaut and C lunies Ros s 1983 : 2 3 4 ) .

54
B ougainvilleans themselves had p er s i s tent ly protes ted about the p roj ec t ' s impact on the local socie ty , and on the i sland ' s phys i cal environment . Dur ing cons truct ion some villagers in the por t area were f orcib ly removed and rese t t led ; exp loration par t ie s had b een f ired up on wi th bows and arrows . The arrangement s for disposal of tailings from the c oncentrator involved no s torage dam , but free di sp osal int o t he Jaba River sys t em in wes tern B ougainvi l le - once again nece ssitat ing vil lage rese t t lement , de s troying subsis tence f is heries , dramatically rai s ing the r iver b ed and creat ing a wholly new delta (a lar ge p or tion of which sub sequent ly s lipp ed in to the s ea and c ould not be reve ge tated as p lanned) . Although sub s tantial compensat ion for land right s and env ironmental damage were paid t o local pe op le , and landowner s at the mine si t e rec e ived 5 p er cent of the royalties paid to government ( that is 5 p er cent of 1 . 25 per c ent of total sales) , local resentment cont inued , and local polit ical leaders pressed f or a larger shar e of revenue s to accrue to the province . These prob lems fuel led a seces s ionist threat in the province - a threa t carr ied out s ome t ime af ter t he rene gotiation and not res olved unti l July 19 7 6 .
Formation o f Chief Minis ter S omare ' s f ir s t na t ional government co incided with the commencement of produc tion at B CL . In the two year s until ser ious renegot iat ions began , Bouga invil leans and o ther radical parliamentarians who obj ec ted to the existing agreement b ecame highly inf luential in and upon government . National and loca l political p r ot e s t coincided wi th the r ealization that copper and gold prices had r isen well ab ove expected levels , and the mine was b oth lar ger and less cos t ly to run p er tonne of output than envi saged in 1967 .
Rep orts from a numb er of ou tsiders ( e . g . Over seas Development Group 1 9 7 3 ) and Papua New Guineans ' widening awarenes s , through new in ternat ional contac t s , that the 19 6 7 agreement had become anoma lou s by current internat ional s tandard s all added to the pres sure for renegotiation . The process lead ing up to the ac tua l commencement o f renegotiation in July 1974 was far from s tra ightf orward , and was punc tuated by diver sions created by the myr iad o ther pressing tasks involved in the transit ion to s e l f-government and Independence ( Garnaut 1981) .
Never theles s , succe s s ful renegotiation was achieved , by Oc tober 1974 , once the government had d ecided up on i t s obj ec t ives in r enego tia t ion , had evo lved a coherent p olitica l and bureaucratic mechanism f or conduc t ing the renegotiations , and had launched a cred ib le threat to legislate i t s own s olution in the even t that the company wou ld not s tr ike a new bar gain .
The choice of obj e c t ives was drawn from the development s trategy out lined earlier in this monograph - the government gave pr imacy to the obj ec t ive of inc reasing tax revenue , and sou gh t n o mea sure of addi tional equity ownership o r manager ial control
5 5
for its own sake . Wi thin this overriding concern , the government also sought to incr ease the c ompany ' s other con tributions to the local ec onomy - particularly the Bougainvillean economy - by measures of localization and t raining , bus ines s development , and prov i sion f or the day when the minera l deposit wou ld be exhaus ted ; and t o p re s s the company to take bet ter measures to safeguard the p hy sical envir onment . The governmen t ' s prop osals f or achiev ing its obj ec tives were inf luenced on the one hand by recent in ternat ional exper ience in the evo lution of mining agreements ( advisers from the Commonweal th Secretariat , and one from CIPEC - the less deve lop ed countr i es copper exp or ter s ' organi zat ion - were used by the governmen t in the renegotiation , in addition to foreign advisers resid ent in P or t Moresby) , and , on the other , by the need t o s trike a deal that would not ultima tely deter f oreign inves tment in other pr ospec ts , and whose terms wou ld , at leas t in princip le , be broad ly rep licab le in futur e agreemen ts . The Ok Ted i deposit , for examp le , had been und er active exp lorat ion unt i l late 19 7 2 , and fur ther progress awai ted negotia t ion over work p r ogram and t erms of agreemen t between the government and Kenneco t t .
As par t o f the prep arat ion for both the B ougainville renegotiation and Ok Tedi , the ' resource rent tax ' ( RRT) p rop osal was worked out in 1973 for the Papua New Guinea Minis ter of Finance ( f ir s t pub li shed by it s authors in Garnaut and Clunies Ros s 19 7 5 ) . The RRT exp licitly taxe s mineral r ent , as previous ly defined , by accumulating al l nega tive cash f lows ( i . e . cap ital expendi tures and op erating cos ts) year by year at a compound interes t rate equa l to the agreed threshhold rate of re turn unt i l they are fully off s e t by p os i t ive cash f lows ( r evenues - inc luding net interes t paymen ts and deprecia tion provisions , so that the computation is not af f ec ted by f inanc ing s truc ture ) at wh ich p oint an RRT cuts in on all fur ther ne t positive cash flows at a sp eci f ied rate . The tax has been termed the Addit ional Prof i t s Tax (APT) in Papua New Guinea . ' The company reac ted quickly , s trongly and negatively to the prop osed system when given the opportunity to comment up on it in princip le ' ( Garnaut 198 1) . In the event , the princip le of taxing mineral rent by taxing prof i t s ab ove a cer tain annua l leve l was f ollowed , though not the method of app lying a discounted cash f low ( DCF) calculation over proj ect li fe imp lied by the RRT ( see Figure 2 ) .
The organizat iona l and tactical approach to nego t iat ions taken by the government set a precedent f or all future minerals proj ects , and i s thus imp or tant in i t s own right . For B ougainville the government f ir s t took a number of s tep s that progressively widened p o li t ical , pub lic ( and perhap s even interna tional) suppor t f or the view that renegotiat ion was necessary . As well as the Fab er rep or t , ( Overseas Development Group 19 7 3 ) the government commi s s ioned a repor t from Louis Wel ls of Harvard B us iness Schoo l , and con sulted a range of internat ional organizat ions and foreign government s ; af ter a series of debates , par liamentary support f or renegotiation was s trong . A small inter-depar tmental group , inc luding a range

5 6
o f advi sers , was app ointed t o hand le t h e renegotiation - thus cu t t ing across any ind ividual depar tmen tal interes t - with designated co-c hairmen and all members in c l ose and regular contac t with the poli t ic a l leader ship . The c losing s tages of the renegotiat ions were direc ted by a smal l minis terial group led f irs t by the Deputy Ch ief Minis ter , and f inal ly by Chief Minis ter S omare himsel f . The coherence of political , pub li c servi ce and advis ory contr ibu tions was a key e lement in a l l Papua New Guinea ' s maj or minera ls negotiations .
The company , naturally enough , did everything p os sib le f ir s t to prevent renegotiation , and then to sof ten i t s impac t on shar eho lders . The company tried , unsuccess fully , to enlis t in terven tion on its behalf by the Aus tralian Governmen t , and , with pe rhap s greater short-run suc ces s , t o rais e the threa t that no o ther company wou ld dare t o inves t in Papua New Guinea in the face of the risk of such a renego t iation . Finally , the company of fered a dea l involv ing acqui sit ion of at lea s t a 50 per cent shareholding , on the company ' s terms , by the government . The government , however , pres sed ahead wi th i t s demand for a great ly increased share of revenue through taxat ion , rather than any new deal on equity . In September 1974 the governmen t threa tened uni laterally to legislate its own p rop osals ; faced with nervou s shareholders (marke t valuation had su f fered bad ly at a number of point s since the spec tre of renegotiat ion was ra ised in 197 2 ) and lenders who pr obably p erceived greater ri sks to their own p os i t ion from a government-imp osed solu t ion than from a negotiated se t t lement , however adverse f or shar eho lders , the c ompany cap i tula ted .
The de tails of the sett lement , and the c ompari son with the 1 9 67 term s , are shown in Figure 2 . Par t ly because ad va lorem royal ty was regarded as an ineff icient f orm of rent taxa tion ( rai s ing the variable cost s of mining , and thus rai sing the ec onomic cu t-o f f grad e within a deposi t ) , and partly because secessioni s t pressur e up on the formu lat ion o f Papua New Guinea ' s new cons titu t ional framework mad e i t likely that mine ral royalties would be paid to fu ture prov inc ial governmen ts , not to central government , the 1 . 2 5 per cent royal ty provision remained . An add it ional payment f or the province of 5 0 cent s ( toea) per tonne of cont ained copp er was to be made to a Bougainville non-renewabl e resources fund .
Al l the tax holiday and accelerated d ep reciation provisions were swep t away . The form of add itional prof its tax imp o sed was of the kind now t ermed a ' progressive prof i t s tax ' or PPT ( Garnau t and Clunies Ros s 1983 : 95-7 ) ; in other word s , the more profi table the proj ect , the higher the ra te of tax , bu t wi th taxable inc ome asses sed on a prof it and los s , not cash f low , basi s . In the 1 9 7 4 Bouga inville Agreement prof i tability i s measured as af ter tax profit expressed as a p ercentage of ' cap i tal inve s tment ' . Capi tal investment is su bj e c t to re-estimation each year from a base of capital expend iture incurred up to the beginning of 197 4 , ne t of capitalized

5 7
interest and depreciation on replaceable it ems ; re-e s t ima tion ( in kina ) invo lves adj us tment f or change s in the US d ollar /kina exchange rate , add it ion of new capi tal expend i tures , and deduc tion o f dep reciation i n respec t o f replacement items . A t profit rates of 15 p er cent or below , normal company tax app lies , above 15 per cent a marg inal rate of 70 p er cent app lies to taxabl e inc ome , that is addit ional pro f i t s over the 15 p er cent threshold are additional ly taxed at ( 7 0-n) where ' n ' is the prevailing rate of company income tax . App l icat ions for u se o f a provision for discretionary revaluation of the cap ital base in c ircums tances of ' exce ssive inf lation ' have so far been turned d own by the Minister of Financ e .
By settling , rather than resis ting t o the p oint o f legis lation , the c ompany retained some imp or tant benefits : d epreciat ion o f total capital expend itures was to begin only from 1 January 1974 ; the new regime was no t backdated t o 197 3 or beyond ; and one-hal f of PPT liabi lity for the f ir s t hal f o f 1974 was related . Apar t from t he company ' s initial resi stance , the rea son f or no t us ing some f orm of RRT was probab ly the d i f f icul ty of making the renegotia ted agr eement fully retrospective , withou t which the app l icat ion of the DCF calculat ion required can bec ome s omewha t arib trary . Al though neither the company nor the government has expres sed a formal view on the matter , some observers have conc lud ed that the 1974 Bougainville reg ime , taken together with the per iod of app lication of the 1967 reg ime , ha s impo sed a lighter overall f iscal load on the investors than they would have borne had they been subj ec t t o the 197 8 gene ral mining tax regime from the incep tion of the proj ec t ( Garnau t and C luni es Ro ss 1983 : 23 6 ) .
Bouga inville Copper Limited paid additional p rofits tax from 1 97 4 , 197 9 and 1 980 income ( tax is norma lly paid to the MRSF one year later) . The total BCL-r elated revenue paid t o the MRSF has exceed ed K20 million in every year sinc e the new reg ime came in to f orce , exceeding KlOO mil l ion in 198 0 . Nevertheless , BCL has continued to dec lar e and pay signif icant d ividend s every year . Taking int o account royal ty , the government ' s 20 p er cent share of dividend s , and div id end wi thhold ing tax on dividend s sent abroad , earning s net of in terest and dep reciat ion have been divided on average in the ratio of 65-7 0 per cent t o government and 3 0-3 5 p er cent to private shareholders ( calcu lated from BCL Annual Report 1983 : 24 ) .
(b) Ok Ted i and the general mining tax legislat ion . Following d i scus s ion of Papua N ew Gu inea ' s g eneral princ iples in the mining sec t or , and of the Bougainv ille preced ent , the s et t l ement of the f iscal t erms f or Ok T ed i can be treated mor e briefly . Apart from its size and s ign i f icance f or the Papua New Gu inea economy , Ok T ed i is important in t hi s study for f our main reasons . First , it set the d etailed preced en t f or the 197 8 g eneral mining tax leg islat ion . S ec ond , the init ial expl orat ion company was ej ect ed from the prospect , with the state t emporarily assuming explorat ion r isk . Third , at the ' approval o f prop osals ' stag e in FY 197 9 / 8 0 , t he

5 8
gov ernment ' s r isk exp osur e i n i t s cont r ibut ion t o equity and t o inf rastruc ture became maj or negot iat ing issues , settlement of which s et further preced en t s . Fourth , t he geology and locat ion of the proj ec t , t ogether with the met al market c ircums t ances dur ing the t ime of its d esign and construct ion , have mad e Ok Ted i a consid erab ly more comp l ic at ed proj ect in which to safeguard the stat e ' s int erest t han B ougainvill e has been ; it will eventually be manys taged rather than s ingle-stag e , and involves a consort ium of sponsor s rather than a s ingle maj or c ompany . Two full-leng th books ab ou t Ok Ted i have recent ly been pub lished ( Jackson , R . 1982 ; P intz 1984) so t he proj ec t need not b e d escribed in detail here .
At the time o f the f ormal decision to proceed wi th cons truction of the mine ( February 1 9 8 1 ) , mineab le ore reserve s were e s t imated at j us t over 400 mi l l ion tonne s averaging 0 . 68 p er cent copper and 0 . 8 4 grams per tonne of gold ( there are also small but rec overable amounts of molybdenum) . Ok Tedi was thus a lowervolume bu t higher grade dep osit than Bougainville . These averages conceal a separa tion of Mt Fub ilan ( the ore b ody) into a number of d i s tinct zones : a leached capp ing rich in gold but con ta ining ins igni f icant amount s of copp er ; next an enr iched zone of high copper values , protrud ing int o the leached cap , a lso con taining gold ; then the main ore body more s imilar in charac teri s t i c s to tha t of Bougainvi lle : and f inal ly limi ted zone s of skarn ores wi th high copper and gold values . Each zone p resen t s d i f f erent mine p lanning and me tallurgical problems ; deve lopment s trategy is much more sensitive to the relat ive prices o f copper and gold than was the case at B ougainv i l le . The minesite is even less acce ssible than tha t of BCL , ha s a high ri sk of earthquake s and receives 1 0 , 0 0 0 mm of rain per annum falling over more than 3 3 0 days o f the year .
Ac t ive exp lorat ion of the prospec t was carr ied ou t by Kenne cott from 1 9 68 t o 1 9 7 2 - to the point where a subs tan tial preliminary engineering s tudy was commi ss ioned . Signif icant expend itur e was then hal ted as Kennec ott wai ted for the outcome of the BCL renego t iat ion , and sought a conce s s ion agreement of its own to increase its security of tenur e . During the 197 2- 7 4 per iod , however , Kennec ott was faced with a mu ltitud e of dif ficulties out s ide Papua New Guinea that may have had mor e inf luence on i t s decis ions than local event s : its intere s t s i n Chile were nationalized , its Uni ted States op erations faced tough new env ironmental legislation and anti-trust ac tion by the United S tates Jus t ice Depar tment , and its prof itabil i ty fell dramatic ally as a result f ir s t of United S tates pr ice controls and then of declining copper grades and increasing costs (Pintz 1984 : 4 6 ) .
The Papua New Guinea government was p reoccup ied wi th Bouga inv ille , but c ont inued to negotiate wi th Kenneco t t . From Oc tober 1974 , fresh from the BCL succe s s , the government devoted near ly six fur ther months to at temp t s t o reach a d eal on Ok Tedi . The at tempt foundered os tens ibly on Kennecot t ' s determina tion to achieve

5 9
more generous provi sions f or inve s tment recovery , and subsequently f or p rotec tion of i t s threshold return agains t the effects of inf lation , and up on i t s in sis tent refu sa l to submi t to P apua New Guinea law for the arb i tration of d i spu tes . Given tha t Kennec ot t also refused a government offer to finance c ont inued explora tion , in return f or equity , while neg otiation s were conduc ted , it i s hard t o avoid the conclus ion tha t , i n late 1 9 7 4 and early 19 7 5 , Kennecot t ' s worldwide problems were the main cause of its wi thdrawal from Ok Ted i . The accep tabi lity or otherwise of Papua New Gu inea ' s proposed f isca l terms was not f inal ly tes ted in these negotiations . In March 1 97 5 , the government refused to renew Kenne c ot t ' s Ok Ted i prosp ec t ing authority , and took over the prospect ( includ ing the s ite facilities) it self , sett ing up a government-owned company for the purp ose . In ord er to neu tra lize the ef fects of Kenneco t t ' s p robable obj ections to los s of ' r ight s ' to any o ther private investor , the government offered Kennecott an ex-gra tia payment o f i t s Ok Tedi expend iture in the form of bond s is suable a t the eventua l c ommencement of cons truc tion of a mine . By the early 1980s , Kennecott was back in Papua New Guinea , actively exploring in full awareness of the general mining tax l egis lat ion .
The government company also took over mos t of the former Kennec ott s i te emp loyees , and engaged c onsul tants Behre Dolbear of New York to carry out a drilling p rogram , based on Kennecott ' s work , aimed a t del ineat ing a target ore-body . This obj ec t ive was achieved wi th consid erab le succes s : US $4 mi l lion was spent and the expec ted size of the ore-body and the degree of confidenc e in the estimate were both great ly increased . Meanwhi le , the search for alternative private inves tors produced virtual ly p arallel sets of negot iat ions with a group led by Alusui sse of Swi t zerland and with the Broken Hi ll Proprie tary Company (BHP ) of Aus tralia . A draf t agreement with Alu suisse c ollap sed when one of its group , P ennaroya of France , pulled out . In March 1 97 6 , an agreement was s igned with BHP f or a f eas ibility s tudy of Ok Tedi , based on a careful defined work pr ogram , with targe t dates for comp le tion , submi ssion of proposals , for the dec is ion to proceed t o the f inance and market ing s tage , and ultimately to cons truct ion of a mine . The agreement was cond itional upon its incorp orat ion int o an Ac t of the Papua New Gu inea Par liament , and the succ e s s ful f ormation of an inve s t or consortium by BHP .
By Oc tob er 197 6 , these conditions had been fulf i l led , BHP wa s j oined ( 3 7 . S p er cent) by Amoco Miner als of the Uni ted S tates , and 25 per cent by Kup f erexp lorat ionsgesellschaf t (KE ) of Wes t Germany . BHP ' s own mot ives f or p ar tic ipation were s imilar to those of CRA at Bougainv i l le : BHP wi shed t o extend i ts overseas and non-ferrou s me tal interests , pursued es sentia lly a commercial rate of re turn , bu t f e l t s trong ob ligation as the lead ing Aus tralian p r ivate sector ' c orpor ate citizen ' to inve s t in Papua New Guinea . BHP i tself , and BHP direc tor s as ind ividuals , have from t ime t o t ime held other significant bus ine s s interests i n Papua New Guinea .

60
Amoco Minerals was the hard-rock mine rals subsidiary of the Standard Oi l Company of Ind iana ( SOI ) , an examp le of the d ivers ificat ion moves made by maj or oil companies dur ing the 1970s . At the t ime Amoco had no op erat ing mines , and its maj or copper interes t , at Tengke-Fungurume in Zaire was to be abandoned in 197 6 af ter s ignif icant ou tlays . Amoco s traightf orward ly sought a sati s fac tory f inancial rate of re turn on a diversif icat ion investment . KE was a Wes t German government-spons ored consor tium of f our metal p roces sing or fabricating companies led by Me tallgesellschaf t (MG) . I t s princ ip al obj ec tive was the enhancement of We s t Germany ' s securi ty of copper supp ly - par ticular ly of c opper in concentra te form su i tab le for feeding the smelting and ref ining p lant in which MG had a sub s tant ial in terest . Each par t ic ip ant in KE sought the least p os s ible risk exposure , and the gr oup received up to 6 0 p er cent of its exp loration c os t s as a l oan from its governmen t , repayable on ly in the event of development of a p roj ec t . KE ' s p ar t icipation opened the at tractive possibi l i ty , f or all the p r ivate par tner s , of even tua l off i cial German government f inanc ial suppor t f or the proj ec t ' s cons truc tion .
The agreement reached with BHP , and accepted by the other consor t ium partners , is detai led in Figure 2 ( third column) . The amoun ts cred itab le toward s the governmen t ' s equity share included the va lue o f the bond s issued to Kennecott - hence Kennecott was to be re imbur sed ind ir ec t ly from Ok Ted i i t self . Thi s time the RRT was accep ted : at a ra te of ( 7 0-n) , where ' n ' is the company income tax rate on ca sh flows in excess of ei ther a f lat 20 p er cent DCF rate o f return or a variab le rate of re turn cons i s t ing of the Uni ted S tates AAA corporate bond rate p lus 10 p ercentage p oin t s ( calcu lated each year as an annual average) . The choice was t o be made by the c ompany at the commencement of produc tion . I n effect the consortium was of fered alterna tive forms of inflat ion protection , av oiding the need to arrive at any indexation formu la f or capital inves tment : the real re turn c ould be 20 per cent less the realized rate of Uni ted S tates inflation ( f lat rate op tion) or 10 p er cent p lus the excess of a long-term Uni ted S t ates in teres t rate over Uni ted S tates inf lat ion .
In order t o meet the contras ting ri sks of ( i ) excessive prof i ts ( on an acc ounting bas i s ) during the period of ne gative cash flows f or APT purposes - polit ically unaccep tab le in Papua New Guinea , or ( i i) imposition of normal company tax lead ing to deb t s ervi ce diff icul t ies in early year s , the agreement incorp orated a ' hybrid ' of c ompany inc ome tax , op tional acce lerated deprecia tion and APT in the f orm of RRT . The logic o f the hyb rid i s carefully exp ounded in Palme r ( 1980) . By permi t t ing ' acceleration ' of deprec ia t ion to the p oint where after tax cash flows equal 2 5 per cent of the in itial inve s tment , the device ensures that a mar ginally prof i table proj ect will recoup inve s tment within four years , whi le a highly prof itab le proj ec t wi ll pay company income tax at an early date . Both risks are therefore c onsiderab ly reduced . I f the op tion t o acce lerate depreciat ion is exerc i sed , the date

when APT becomes payab le , on a prof itab le proj ect , i s advanced because early negative cash f lows in the f orm of c ompany tax
61
payments are reduced . In any ca se i f , a s i s likely , the government ' s rate o f d is c ount is lower than that of the inves tor , and the government ha s access to in ternational cap i tal markets the advancement of APT wi l l outweigh the p os tp onement of c ompany inc ome tax in p resent va lue terms to the government , without causing government liqu idi ty prob lems . The op t ion will also increase the like lihood of a p os i tive inves tment decis ion . The political unac cep tability (and thus increased risk o f renegot iat ion) of an extended tax holiday under a pure RRT sy s tem makes the hybr id a more pract ical approach .
S oon af ter the f orma tion of the Ok Tedi c onsor tium and the commencement of the feasibility s tudy , t he government is sued a S ta tement of Intent (Papua New Guinea , Department of Finance 197 7 ) t o soli c i t indus try comment on prop osals f or general mining tax legislat ion closely resemb ling the Ok Tedi f iscal arrangements . Af ter considering a large number of responses from mining c ompanie s and interna ti onal banks , the goverrunent enacted the terms s e t ou t i n the f ourth column o f Figure 2 . The pr incipal depar tures f rom the Ok Tedi arrangement s were a prov i s ion t o en courage add it ional cap i tal expend i t ure at e s tab li shed mines ( in ef fec t , a limited exten sion of accelerated depreciation) , the inc lusion of s t ock changes in the cash f low calcula tions f or APT p urp oses , and an at temp t - no t , in the end , altogether succe s s ful - to make the i ntere s t rate in the accumulat ion rate op tion les s ' subj ec tive ' by sub s t ituting Uni ted S tates P r ime Rate p lus 12 p ercentage poin ts . Immediat e ly af ter the Ok Tedi agreement , the goverrunent was faced wi th the p os s ibi lity of ne gotiat ions on at least two other proj ec t s ( Fr ieda River and P orgera) though full conce ssion agreemen t negotiations in fac t did no t oc cur . General legis lat ion was seen as a labour-saving device f or the government and an uncertainty-reducing ince ntive for p otential explorers . Su f fic ient f lexib ility over the terms f or government equi ty , and infras truc ture provis ion , was retained t o p ermi t alteration of the actual d ivision of risk and reward in special c ircumstance s .
( c ) O k T ed i : equity , loan guarant ees and provision of infrastruc ture . By the t ime the Ok T ed i d evelopment proposals were present ed t o the government lat e in 1 97 9 , the mine p lan had evolved to one of three stages ins t ead of a s ingle stag e ( ( i) g old bullion only , ( i i) g old bu l l ion and copper concentrat es , ( iii) copper c oncentrates only) . The consortium, not surpris ingly , cons idered the p roj ect to b e ' ma rg inal ' , and came forward with a shopping list o f new demands upon the government - mos t s i gni f icant among which wer e d emand s that the g overnment immediat ely indicat e i t s willingness t o exerci s e i t s 2 0 p er cent equity opt ion , and provide some A$ 180 million-worth o f in frastru cture on c onc ess ional t erms . The goverrunent meanwhile had formu lated it s own views on the manner in which it might prov id e in frastru ctur e , i f any , and the t erms upon which it wou ld take i t s equity share ( s ee P int z 1984 : 7 2-8 , 9 6-7 , for a fuller account ) .
6 2
As sis ted b y favourab le copper prices in la te 1979 and early 1980 , and an all time p eak in the price of gold during the negot iating per iod of January-February 198 0 , the governmen t was ab le to p resent and su s tain counter-proposals to those of the consort ium . The government agreed to provide a maximum of A$ 5 0 mi l lion toward s the cos t o f the mine a c c e s s road ( by 1 9 8 4 the road i n fac t cost much less) , in return f or a user charge that would yield approxima tely 15 p er cent ( the Eurobond yield p lus 5 percentage p oin t s ) DCF re turn o n the governmen t ' s out lays over a maximum of f i f teen year s following expected c omp le tion of St age 3 . I n other word s , the government extended a long- term loan to the proj ect , at a relative ly high ra te of int ere s t but without requir ing a guarantee of repaymen t from the shareholders . Repayment wi l l be b rought f orward if the proj e c t ' s deb t-cover ratio exceeds 1 . 25 in any earlier year . This ' l oan ' by the government is secured only agains t the proj ec t ' s assets and cash flow . Hence i t reduces the initial exposure of the private par tner s , and raises their re turn if the proj e c t as a whole yie ld s in exce s s of the in frastructure yie ld af ter tax . Conver sely , if the proj ect is marginally profi tab le , the int ere s t por t ion of the infras tructure user char ge wil l f unction a s a type o f ' royal ty ' i n raising the governmen t ' s revenues - but wi thou t the initial deterrent e ffect o f any higher roya lty upon the inve s tment decision .
The government indicated tha t i t wou ld reserve i t s fina l dec is ion up on its equity s hare unt i l it had approved the proj ec t ' s financ ing s trategy . Meanwhi le , f or S tage 1 ( the gold s tage ) agreement was reached tha t the governmen t would no t have t o prov ide loan guarantees proport ionate t o it s l ikely 20 per cent stake , nor would neces sarily have to mee t its proportionate share o f any proj ect cost overruns ( in whi ch case its equity share would dilute) . I t s share of loan guarant ees was e f fective ly reduced by 6 6 per cent (US $ 8 8 mill ion) in respect o f proj ect loans up to US$650 mi ll ion for S tage 1 . At sub se quent negot iat ions on the financing strat egy , limit s were also set on the government ' s loan support ob ligati ons f or S tage 2, and it was extended more f avourab le terms than the pr iva te par tners in the event that the s tate wished not to contribu te to addit ional equity calls to mee t cost overruns . These somewhat comp lex arrangemen t s ar e summarized in Tab le 1 1 . By 1984 the proj ect had overrun i t s or iginal budget by at leas t US $ 200 mill ion , so that the FY 1 9 80 / 81 supplemental agreements have been of s igni ficant value in reducing the government ' s cont ingent liab i l it ies (pub lic ly-guaranteed debt in World Bank termino logy) . In effec t , the government traded a lar ge con tingen t liab ility (not guaranteeing i t s full equ ity share of the loans) f or a s igni ficant ly lower actual liab i li ty ( the in fras truc ture loan) - the la tter carrying the pr ospect of a commer c ial return , and f inanced in part from conce ssional funds ; thi s was achieved in a manner that enc ouraged a p ositive inve s tment decis ion by the p r ivate sponsors . The negotiations served to emphasize tha t the risks of s tate par ticip ation in a high ly geared proj ect depend up on more than the quan tity of cash ou tlaid for shares .

63
Tab le 1 1 Loan supp or t obligations for shareho lders in the Ok Ted i proj ec t ( in US $ mi llion)
Proj ect cos t (as sumin g 7 0 : 3 0 deb t : equi ty)
S tage 1
Up to 4 00 400 to 7 00 7 00 to 9 28
over 9 2 8
S tage 2
Up to 4 9 3 / 5 28c
over thi s f i gure
S tage 3
Supp ort f or loan f inance Equi ty Cons or t ium S tate Consortium S tate
280 168 160
42 96 72
5 8 /65
S tate has op tion t o p ar ti c ipate or not in loan suppor t ; i f i t does not par ticipate 5 p er cent guarantee fee i s paid by Ok Tedi Mining to the consor tium guarantors .
9 7 / 1 32
S tate has op tion to par t ic ipate or not in loan suppor t ; i f it does not part ic ip ate 2� per cent guarantee fee is paid by Ok Ted i Mining to the c onsortium guarantors .
Note : Proj ect c o s t in S tage 2 inc ludes any op erating cash shor tfalls from Stage 1 .
Consor tium and s tate contribute in propor tion to shareho ldin g .
aSome $19 mi llion o f this amount w i l l b e b y way o f equi ty credits .
bThe s tate can dec line to contribute equity above $45 million but i s d i luted accord ing ly .
cFi gure i s 4 9 3 on bas i s of 7 5 : 25 deb t : equity ra tio allowed by Se cond Supp lemen ta l Agreement or 5 28 i f lenders ins i s t on 7 0 : 30 .
dThi s assumes that s ta te has me t full equity calls in S tage 1 and no t been d iluted ; if i t has been d i luted t hese figures will ref lec t the new shareholdin g percentages .
estate can dec line t o contribute equity above $26 mi llion ( either in form of new f unds or capitalizat ion of retained earnings ) , but is d ilu ted accord ingly .
Source : N . M . Ro ths child & Sons Ltd , Ok Tedi Gold/ Copper Proj ec t , Final Rep or t , 1 Ap ril 1980 - 3 1 March 1 98 1 , p . 10 .

64
(d) Petroleum . The princ iples of petroleum taxat ion , and pol icy toward s stat e part icipat ion , have evolved in c l ose parallel to those for min ing . A petro leum prospect ing licence ( PPL) agreement was reached with E s so in 197 6 , following the issue of a Statement of Int ent on f inanc ial pol icies in Octob er 1 97 5 ; t he stat ement was d i scu s s ed with petroleum companies , and sub s equent ly incorporated in g eneral leg is lat ion . Negot iat ions cont inued , however , over two maj or issues t hat appeared to be of great er importance to oil companies than to mining companies : t he d egree of minist erial d iscret ion ov er the right s of a company to progress from a PPL t o a d evel opment l icence in the event of a commerc ial d is covery , and the right s of oil companies to hold foreign exchang e off shore . Both issues wer e resolved in negot iat ions wit h d i f f erent companies over the period 197 8-8 0 : the f irst by the app licat ion of su itable arb it rat ion provision s and assurance of a right to proc eed prov id ed that all work had been carr ied ou t in accordance with good oilf ield prac t ice ; the second by Papua New Guinea ' s ins is t ence t hat the convert ib il ity of its cu rrency wou ld be ma intained , and by t he as suranc e that int eres t- free shareho lder loan s could count as normal loans (wi th cer tain res trict ions) for foreign exchange re tent ion purposes . A summary of Papua New Guinea ' s pe troleum tax and partic ipat ion regime is shown in Fi gure 2 ( c olumn 5 ) .
The carried in terest arrangemen t provides f or the s tate to acquire its equity share ( or , s tric tly , ' ventu re in teres t ' if the common j o in t venture f orm i s followed ) withou t cash out lay . Fund s are deemed to have been loaned to the s tate for the equity purchase by the priva te par tner ; the loan is repaid , with in teres t , from the proceeds of the s ta te ' s share of pr oduc tion , less produc t ion costs . The carried in terest op erates , in effec t , as a second t ier of resource rent t ax , cut t ing in ·when proj ect returns equal to the int erest rat e have b een achieved and at a rat e equal t o the stat e ' s percentage share (usual ly 2 2 . 5 per cent ) . Papua New Gu inea petr oleum agreemen t s are technic ally in product ion- shar ing form , bu t the s ta te may reque s t the pr ivate par tner s to marke t i t s share of oil .
Wi th var iat ions in rates to suit the pe tr oleum indus try , company in come tax , accelerated depreciat ion and APT in the RRT f orm all opera te in the same way as for other mineral s . I t should be no ted that exp lora tion expend i ture s are capitalized , and theref ore deprec iated agains t company inc ome tax rather than immediately expe nsed ; exp lora t ion expend i tures rep resent a far higher port ion of t o tal capital costs in p e troleum than in hard-rock mining . In order t o pr o tect i t s revenues agains t non-arm ' s length trans act ions , the state re tains the right to f ix a ' norm price ' for calculation of revenue s for tax purposes ; the norm price is based on the neare s t ava ilab le arm ' s- length or marke t p rice for the type of oil produced .
Papua New Guinea ' s fi scal and part ic ipa t ion pa ckage , when app lied to a rela t ive ly profi tab le field would probab ly sp lit cash f lows in the propor tions of s tate 85 per cent , priva te par tner s

65
15 p er cent . By the s tand ard s of oil-produc ing states such a split i s generous to the p riva te inve s tor s . It has to be remembered , however , tha t oil ha s no t yet been confirmed in commercial quantities in Papua New Guinea . When i t is it will be feasib le , f or examp le , to raise the carr ied in teres t equity shar e in agreements with la tecomers .
There is a reasonab ly good chanc e that a commercial d i scovery could be made at Lohia , in the northwes t corner of the Wes tern Province . Managed by Gulf Oil for a consor t ium of companies , two succe s sful holes have so far been drilled - if one or two more are dril led in dif ferent par t s of the licence area a c ommerc ial f ind will probab ly be recorded by the companies . They are looking f or a large di scovery to cover the expected high infras truc ture costs associated with such a remo te location .
( e) Minerals and petro leum : expec tat ions and result s . There are four set s of criteria by which the success o r failure of minerals pol icy might b e j udged : the share of cash f lows obt a ined from ex ist ing producers , the ext ent of commitment s to new produ ct ive capacity , the d egree of exp lorat ion int erest shown , and the amount of explora tion work undertaken . On the f ir s t two counts , Papua New Guinea ' s appr oach can be j udged a broad succe s s : BCL ha s con tinue d to produce , and to inves t , and has generated revenues f or the government and i t s private shareholders in roughly the expected prop ort ions . The Ok Tedi proj ect has b een launched , although i t remains to be seen whether it wi ll be interrup ted by the depr essed s tate of the copper market and whether i t s r evenue contribut ion wi ll match the expectat ions of 197 9-8 1 . On t he third and f ourth count s it is pos s ible t o f orm a j udgment on the rec ent rec ord of explorat ion act iv ity in Papua New Guinea ; this has been fully researched for the f ir s t t ime by Char le s Johns on and Allen Clark ( 1 984 ) 2 in respect of metal minerals .
Johnson and Clark d ivide mineral explora tion expendi ture s into ' grass-roots ' and ' maj or proj ec t ' expendi tures : the former refer s to activity on pr osp ec t ing aut hor i t ies wi thout maj or identif ied dis coveries , whi le the latter re fers to work on identif ied depos i t s pr ior to the concession agreement / feasib i l ity s tudy s tage . As shown in Figure 3 , expenditure in c on s tant prices peaked in the ear ly 1 9 7 0s , fell sharp ly , and then b egan to rise again from about 1 9 7 7 - although the resurgence of ' gras s-root s ' exp lorat ion has b een considerab ly less dynamic in the mos t recent p er iod . These phases can b e explained as fol lows . The b oom in
2This unpub li shed paper i s ci ted by kind permiss ion of Dr Al len Clark of the Eas t-We s t Cen ter , Honolulu , and of the Papua New Guinea Departmen t of Minerals and Energy . We ar e also indeb ted to Al len Clark and Char le s Johns on f or supp lying add itional tabu lations not inc lud ed in their pap er .

Figure 2 Compara t ive f i s cal regimes for mining and pe t roleum in Papua New Guinea
Governmen t equi ty
Government infras t r uc ture
Roy a l ty
Company income tax
Bougainville 1967
2 0% purchased a t par during con s truc t ion
A$41 m ; no charge to company
1\ % on f . o . b . sales value
( 1) 3-year tax holi day
( 2 ) Accelerated depreciat ion
( 3) 2 0% o f income from copper permanen t ly exemp t
( 4 ) Ini tial 2 5 % rate , ris ing gradually to 5 0% in 5 th year af ter tax payab le
Bougainvi lle 1974
No change
No change
No change - but t rans ferred t o P r ovinc ial Government
Tax holiday , accelerated tax deprecia tion , and 2 0% exemp t i on all ab olished
Ok Tedi 1 9 7 6
1 9 7 8 General mining regime ( inc luding p o l i cy s t a temen t s )
Op t i on to purchase up to 2 0% at par at commencement of c onstruct ion ( credit for outlay s )
' Ne go t iab le op t ion t o acquire u p to 3 0 % a t par ; early nego tiat i on of terms envis aged
Op t ion t o provide in return f or ' cap i tal user c ha rge ' , or equity credi t
Spons ors to provide , b u t Ok Te di op tions
· re tained
l� % o f f . o. b . sales As Ok Te di value , payab le to Provincial Government
Normal rate applicab le ( 3 3%% in 1 9 7 6 ) s ub j ect to maximum o f 35% dur ing inves tment recovery period . Acce lera ted depreciat i on o p t i on availab le
As Ok Tedi ( 48% maximum rate for nonPNG incorp orated companies )
1 9 7 8 General p e troleum regime ( including s tandard agreement)
Carried in tere s t op tion , usual ly 2 2 . 5% , repayab le at AAA b ond rate plus 5% from the s tate ' s share o f ' p rofit o i l '
Infras t ruc ture to b e p rovided by sponsors ( includ ing the s tate in p rop o r t i on to venture int e re s t )
1�% o f we llhead value of p ro duc tion
50% w i t h acce lerated depreciat ion op t ion

Addi ti onal p r o f its tax
Dividend wi thholdin g tax
Imp o r t duties
Deprec iat ion
Addi t ional capi tal outlays (a f ter commencement of produc t ion)
Fore ign exchange
None - but company tax to ri se by fur ther 1% p . a . f r om 26th year of produc t ion
Nil - in tr aduced in 1 9 7 2 a t 15% and appl i ed to B CL
Fr ozen at 1 9 6 7 leve ls (mos tly zero) for 10
years af ter c omp l e ti on
Ac celeration al lowed to pe rmit re covery of all c ap i t a l outlays be fore tax payab le
Imme diate deduct ion
Aus tra lian law , no special p rovi si on
Prof i ts in excess o f i 5 % o f cap i tal base to be taxed a t t o ta l rate of 7 0% ( including company tax) . Cap i t a l base to be adjusted for exchange rate changes , now cap i t a l i tems , a n d depre ciation o f i t ems replaced
15% on divi dends paid to non-resident s ; e f fe c t ively f ixed in agreement
Normal duties to be paid , but new duties not to be discrimina tory
Normal provisions of Income Tax Ac t , but assets deemed undeprec iated a t 1 / 1 / 7 4
P r ovision of APT deferral i f capi tal expenditure exceeds depreciation
No change
Cash f l ows in e xcess of 20% ( or op t iona l AAA b ond rate plus 10%) a f ter tax DCF re turn on total funds to bear APT at ( 7 0-n) % where ' n ' company tax rate . US $ /k ina exchange rate adj us tment allowed
As Ok Tedi , with o p t iona l r a te rep laced by US Prime Ra te p lus 12% , cash f lows def ined to include s t ock changes
15% on dividends paid 15% on divid ends paid to non-residents ; to non- residents rate f ixed in agree- (raised to 1 7 % in ment 1984 budge t)
Normal duti es , but new duties not t o be discrimina tory
Normal rates , b u t acceleration allowed if af ter tax cash f l ow is less than 25% o f init ial cap i tal exp endi ture
No special p r ovis ion (but automa t i c deduc t ion , for APT)
All exp o r t proceeds to be converted to kina , but provis ion to hold 3 months current ob l i ga t ions p lus loan repayments of f shore
Normal duties , with non- discrimin a t ion clause
Exp loration : lesser of 5 years or mine l i f e , st raigh t line . Deve lopmen t : le sser of 10 years or mine life , s traigh t line . Acce lerated depre cia tion op tion as in Ok Tedi
25% depreciation in first y ear (p lus automa tic deduc t i on for APT)
Convers ion to kina , but negot iab le p rovis ion to hold 3 months ob l i gat ions off-shore
Cash f l ows in exce s s of 27% af ter tax re turn on total funds , bear APT at 5 0% . APT a s sessed sep ara tely f o r each licence area
Nil - foreign pe tro leum companies not e xp e c te d to incorporate local ly
Normal du ties , wi th non-dis crimina tion clause
Exploration : lesser o f 4 years or f i e l d l i fe . Development : le sser of 8 year s or f ield life . Accelerated deprecia tion op tion
No spec ial provision ( automatic deduc tion for APT)
Pr ovi si on to hold at lea s t 3 months ob l i gat ions o f f shore , including repayment s of shareholde r s ' loans

6 8
Figure 3
20
5
Trends in t otal exploration and grass-roots exp loration exp endi tures
G rass- Roots Exploration
64 65 66 67 68 69 70 71 72 73 7 4 75 76 77 78 79 80 81 82
S ourc e : Johnson and Clark ( 1 98 4 : Fig . 16) .
ac t ivity in the la te 1960s coinc ides with the development o f t he B ouga invi lle dis covery ; there wa s strong intere s t in Papua New Guinea as a maj or new copper province in c ond it ions of op t imistic expecta t ions abou t f uture copper demand and price s , and also s ome sp il lover of exp lora t ion in tere s t from the b oom in Au s tralia . Dur ing this phase a numb er of maj or dep os i t s wer e identi fied -inc lud in g Ok Ted i and Fr ieda River . The subsequent sharp dec l ine resul t ed from the failure of the Kennec o t t negotiations , uncertainty surround ing the B CL renegot ia t ion and Papua New Guinea ' s trans it ion to Ind ep endence , and , j us t as importan t , f rom the sharp change in the p rospec t s for c opper pr ices and the for tunes of maj or mining compani es . Af ter the removal of poli tical uncer tainties and the e s tab li shment of Papua New Guin ea ' s c lear f i s cal framework , exploration ou t lays began t o r ise again , accelerating as Papua New Guinea became recogni zed as a poten t ial province of low-grade gold deposit s . Wi th the s tr ong rise in the price of gold over 1 9 7 9 /80 inter e s t has ri sen sharp ly ; thi s is no t , however , fully ref le c ted in exp loration out lays f or a spec i f ic admin i s trative rea s on . Dur ing 1980 Papua New Guinea ' s smal l and unders taffed Mines Divi sion respons ib le wi t hin the Depar tment o f Minerals and Energy f or proce s s ing prospec t in g au thor i ty ( PA) app licat ions

6 9
became unab le to c ope wi th the increas ing work load . A morat or ium on the is suing of new PAs was theref ore enforced from November 1980 t o November 1982 in order that the backlog might b e c leared . In retrosp ec t , t his wa s p rob ab ly an inapp ropria te and c o s t ly solut ion to the prob lem : use of c on sultants , or other temp orary arr angement s , migh t have added ano ther one mi l lion dollars per annum to ' grass-root s ' exp lora tion exp endi t ure ( Johnson and Cl�rk 198 4 : 51 ) .
The p os i t ion has s ince impr oved : the number of PA app licat i on s outs tand ing was reduced from f if ty-two in June 198 2 to thirty in March 1984 ( informa tion from the Dep ar tment of Mine rals and Energy) , of this thir ty-six are f or PAs in Nor th Solomons Prov in ce where a mora torium on further explorat ion has been in force f or more than a decade at the reque s t of the p rovince , thus twenty-f our new ap p licat ions were ou t s tand ing . S ome eighty PAs were under active exp lora t i on by March 1984 , alt hough a tendency had emerged to gran t very lar ge areas to two or three maj or c ompanies , so tha t s ome doub t mus t remain about the in tensity of work in s ome areas . It is c lear , however , that ( sub j e c t t o s olut ion of the se adminis tra t ive p r ob lems ) favourab le marke t condi tions f or gold or copper will b r ing a subs tantial up surge in exp lora tion activity in Papua New Guinea . In add i tion , feas ib i lity s tud ies were a t an advanced s tage on P or gera , Mis ima and Lihir at lea s t one to two of which could wel l commence mine c ons truc tion in the next twelve to twen ty-f our mon ths . All this c on f irms the broad ac cep tabi lity of a f i s ca l p ackage which yie lds the maj or share in revenue s from profitab le proj ec t s to the government .
The posit ion in petroleum i s s imilar . Because ful l petro leum agreemen ts are normally conc luded bef ore a PPL is is sued and explora t ion commence s , a much sma l ler number of PPLs has been i s sued since the governmen t ' s pe tro leum poli c ies were formula ted . As of March 1984 , ten PPLs were va lid , wi t h a fur t her s ix app lication s ou ts tand ing , involving twe lve maj or and indep enden t exp l oration c ompanies or c onsor tia . The s ixteen PPLs cover 15 66 on-shore and off -shore blocks , und er ar rangements which requi re a prop or t ion of blocks to be progressively re linqu ished during the maximum eleven-year li fe of a PPL ( inc luding a ll permi s s ib l e renewal s ) . On the basis of c ommitmen ts made by mid- 1985 i t i s likely t hat thirty- s ix we lls will have been dr i l l ed in P apua New Guinea in the decade 198 0- 8 9 by the sixteen con s or t ia , making t he country a hi ghly sought-af ter prospectin g ar ea desp ite i t s size and lack of a fully-grown proven commerc ial d i scov ery .
Papua New Guinea thus has the geo logical p otent ial , legal framework and f i s ca l arrangemen t s suff icien t to of fer cons iderab le incen t ive to minera l exp lorat ion and inves tmen t , given sat isfactory marke t condit ions . Provided tha t the government is ab le t o devote the necessary administrative and te c hnica l e f f or t , the framework a ls o a llows the government to ensure an intensive exp lora t ion ef f or t on the PAs and PPLs i t awards . In the event of a c ommerc ial

70
discovery , negotiation over f i scal provisions is now minimized , and the s tate can exp e c t a signif icant revenue f low if prof itab le proj e c t s are develop ed . The ou t s tanding areas of ne gotiat ion in each case concern the terms of the s tate ' s participat ion , the mine ( or oi lf ie ld) deve lopmen t s tr at egy , and the minimizat ion of adverse envir onmental and s ocial impac t . The government has so far had c onsid erab le success in limi ting the risks it is f orced to take in securing an adequa te in f low of foreign inve s tmen t and a maj ori t y share of the reward s from profi tab le proj ec t s . The con t inuing challenge , posed at b oth Bouga invi l le and Ok Tedi , is to ensure an op tima l pace of development ( f rom the viewp oint of resource use and government revenues) when c orporate obj ec t ive s d eviat e f rom the s t r ic t profitab ili ty cri teria with which Papua New Guinea ' s f i s cal re gime is desi gned to dea l , or when s tate and corporate percep t ions of risk significant ly d i ffer .
1 1 . Fore s try and f or e s t indus tries
Indone sia , Malays ia and the Philipp ines are j ointly resp ons ible for 65 per cent of the world ' s hardwood exp or t s . The total f ores t re sources of Papua New Guinea are of a s imi lar size to tha t of Malaysia and the Phil ipp ines and are approximately half the s i ze of Ind onesia ' s . On the basis of t o t a l f ores t resources p er head o f p opula tion , however , Papua New Guinea i s much b et t er endowed t han any of t h e other three count ries (Papua New Gu inea O f f ic e of Forest s 1983 : 3 ) . Papua N ew Gu inea has over thirt een t imes the averag e wor ld forest resources per head .
Of Papua New Guinea ' s 4 6 mi llion hec tares , 3 6 mi l lion are of enclosed f or e s t and 15 mi llion hec tares of that ( or over 30 per cent of the area of the c ountry) are he ld to be commer c ia lly op erable containing 500 million cub ic hectares of t imber (Papua New Gu inea O f f ic e of For est s 198 3 : 2 ) . Current t imber operat ing r ight s are held only ov er 1 . 5 mil l ion hect ares , or 10 per c ent o f the pot ent ial ly operab l e area , and the annual log harvest is only 1 . 5 million cub ic met res . Normal rat es of natural regenerat ion wou ld sugg est that the annual log cu t cou ld incr ea s e three t o f our t imes before Papu a New Gu inea ' s su s t a inabl e y ield is r eached , even though only 23 , 000 hec t ares have b een reforest ed . Becau s e of excess logging in other c ount r ie s , Papua N ew Gu inea is the last country in the As ian r eg ion in thi s pos it ion , a feature which should g iv e it consid erable barga ining power i n t h e future . Finally , t he f orest r esourc e s are evenly spread around main ly the lowland areas of the c ountry , making the indu st ry of potent ial b enef it t o mo s t o f the c ount ry and pu t t ing i t in close p rox imity t o many natural harbour s .
Aga ins t all these very positive f eature s , and in c omparison to the S outhea s t Asian resources , P apua New Guinea ' s fore s t areas con ta in lower volumes per hectare , a hapha zard mix of many species which vary from p lace to p lace ( one species i s usually a maximum of 10 per cen t o f the resource in the area) , and species which ,

while app arent ly possessing exce llent quali ties , are les s we ll known .
71
While only 10 per cent of the c ountry ' s operab le f ores t re source s are currently being exp loit ed , thi s 10 p er cen t is the mos t access ib le and generally has the best species mix . In some province s , f or examp le New Ireland and Eas t New Bri tain , very few areas of op erab le forest resources are le f t . Certainly in spe c i f ic areas and perhaps in the country as a whole , the lack of any siz eab le ef fort at refores tat ion mus t b e of c oncern despite the s tatistics quoted ab ove .
Fore s try is a concurrent sub j ect under the Or ganic Law on Provinc ial Government ; as a c onsequenc e f orestry field s taff are resp onsib le to the various provinc ial governmen ts , while overal l p olicy control and general resp onsib ility remains with the central Office of Fore s t s . Thi s of fice is , however , located
wi thin the large Dep ar tmen t of Primary Indus try , and so does not have sufficien t con trol over its own funding and s ta f f ing . The number of Provincial and Nat ional Office of Fore s t ' s s taf f i s currently at it s lowes t leve l in many year s , sharp ly declining sin ce Independence , a t ime when the indus try has been expanding . The governmen t ' s fores try admin i s tration has insuf ficient s taf f in a p oorly s tructured or gani zat ion .
There ar e three methods of acquiring rights to timb er from the tradit i onal landowners : the Timber Right s Purchase ( TRP ) exerci sed by the government over large areas ; the Timber Authority ( TA) f or very sma ll purchases , which are i s sued by a local f ores try inspe c tor ; and direct ly from owner s of timber with the approva l of the nat ional Min i s ter f or Forests under the Fore s try ( Pr ivate Dealings) Ac t . In each case , the traditi ona l owner s mus t agree to the acqui sit ion , whi ch gives them a p ower of veto over p otential deve lopmen t s . Whi le the first me thod requires a potential deve loper to deal with the nat ional government , the third method has encouraged s ome t imes uns crupulous develop er s to cultivate a c lose re lationship with and make false promises to the local people , who have then pres sured the nat ional Minister f or Fores t s in t o sanc t ioning prop osals f or deve lopment which are less b ene f ic ia l t o the c ountry than thos e required to gain access to fore s t resources under a TRP .
There are seventy- two sawmi l ls , three veneer mi lls , one p lywood and one wood chip mill current ly operating in P apua New Guinea . The wood pr ocessing indus try is composed of 130 fac t ories ( sawmills , j o iner ies , furniture f ac tories etc . ) emp loying around 4000 p eop le , or j u s t over 2 p er cent o f the country ' s wage-earning lab our force ( Papua N ew Gu inea O f f ice of Forest s 1983 : 13 ) . An equal number are probably employed in log cut t ing . There are f if t een maj or t imber companies in Papua N ew Gu inea , only t hree of which are maj ority Papua N ew Gu inea owned : the f oreign owner s are mainly from Au stralia and Japan , respec t ively owning the old er and newer

7 2
operat ions . Of the f ift een maj or t imber companies , t hree are only involved in log export , while s ix are main ly involved in this act iv ity (Papua New Gu inea Off ice of Fores t s 1983 : 15 ) .
Ind eed , nearly 8 0 per cent by' value ( over 8 5 per c ent by volume) of Papua New Gu inea ' s t otal forest export s were , in 198 2 , s imply the export o f logs . The indus t ry pays very l it t l e income tax , as declared profit s are negligib le : mo st c ompanie s show large accumulated losses . I t canno t be an unrela ted fac t that mos t log exp or t s are sold to the parent organiz a tion o f the local operat ing company . The g overnment sets minimum prices f or logs expor ted und er the Exp or t ( Con trol and Va lua tion) Ac t : however , the world marke t prices f or P apua New Guinea ' s les ser known sp ec ies are not eas ily det ermined . The mo st recent detailed ana lysis o f the Papua New Guinea t imber indu stry c onc luded that ' there appear s t o be a very sub s tantial le akage of potential opera t ing surp luses ou t of the sys tem . . . caused by ine f fic ient op erating by some mi l l s , or by the p ract ice of concea led trans fers that s ome oper ators may make to parent c ompan i es ' ( Fraser 1981 : 3 1) . Whi le some would comp lain tha t such a conc lus ion results from an ina dequa te appreciation of the c o s t s of doing bus iness in Papua New Guinea , it wou ld be a great surprise if operators had not taken advantage of this re lat ively easy way to lower taxe s and c onvince the governmen t that extra expend i ture on fur ther proces s ing could not be afforded .
Fr om negligib le levels in the ear ly 1950s exp or t s of logs and other f orest produc ts have risen s tead ily t o represent a peak of 12 per cen t of Papua New Guinea ' s total exports in 1982 , admi t tedly a year of higher than average pr ice s for f ores t products . Ye t despite thi s figure and the very high prop or ti on o f P apua New Guin ea ' s land area covered in fores ts , ' . . . t imber harves t ing , log expor ting and processing contribute only ab ou t 3 . 2 per cent of GDP and ab out 1 . 2 per cent of Government revenue ' ( Fraser 1981 : 9 7 ) . The high prop or tion of f ores t exp or t s made up of logs , the lack o f si gni fican t refores ta tion and the large accumulated losses of mos t timber c ompanies exp lain the low level of ec onomi c b enefit to the country from the f orest indus try .
( a) Forest pol icy . While early foreign t imb er operators in Papua New Guinea were ma inly from Au stralia , the lat e 1 9 60s and early 197 0s saw at least f ive maj or Japanese c ompan ies begin operat ions . C ontract s were signed which spec if ied that log expor t s wou ld cease aft er a per iod of t ime ( o f t en f ive year s ) , by which t ime variou s processing and reforest at ion act ivities were t o hav e b een wel l under way . The gov ernment ' s ma in a im b efore 1 9 7 8 was to encourag e local process ing , but i n each case contractual ob l igat ions were not met . O f the three maj or operat ions which commenced in the ear ly 197 0s it appears t hat N i sho Iwai ( at S t et t in Bay) and Honshu ( at Jant ) nev er kept t o the ir reforestat ion ob l igat ion s ; and S ohbu ( at Open Bay) never bu ilt a p romised veneer mill . At Open Bay , Sohbu ' s log expor ts were due t o cease af t er f ive years
73
( 197 8 ) but they s t i l l c ont inue and ind eed pr es en t ly const itute the company ' s only act ivity with the unfortunat e lo ss through f ire of t heir sawmil l .
With c ompanies signing the se theoretica lly very favourab le ( to the government ) c ontrac t s , the government kep t on ins i s t ing on qui te extravagant terms . P ot ent ial entrant s were asked to s t op all log exports in a few year s , build large sawmi lls and other p roces s ing unit s , undertake extensive ref ores tat ion and provide al l the ir own infras truc tur e in remo te locat ions . This kep t ou t the c ompanies who had a greater resp ect f or the sanct ity of c ont rac ts . Before 19 7 8 , the government ' s fore s t po licy had li t tle ef fect and its ob j ec t ives were not be ing achieved : indeed , the reverse was oc curring wi th more and more log expor t s . Very few is any comp anies before 1 9 7 8 were c losed down by the government for not fulfi lling the ir original contract .
Many older c ompanies , par ticular ly those re lying heavily on sawmil l s f or thei r revenues , were c los ing down vo luntarily . During 19 7 4 - 7 6 s ix sawmi lls ceased bus ines s , whi le all the rest were in grave financial dif fic ulty excep t one p r ocess ing only high quality logs . While transfer pricing was the suspe cted exp lana t ion for low logging prof i t s or losses , a signif icant amount of sawn timb er was s old at arm ' s length into Au stra lia and e lsewhere .
In 19 7 7 the government c onducted detailed surveys in to the p rofi tabi lity of logging and sawmi lling . The s tudies demonstra ted that logging was very prof i tab le , bu t tha t sawmi l ling was highly unpr of itab le . I t was es timat ed that i t cost Kl40 t o produce a cub ic metre of sawn timber , which on average would only fetch KllO . If the log inpu ts were valued at the ir fu l l opportunity cost ( tha t is , at what they would earn on t he export marke t ) , sawmi ll ing was even more unprof itab le . The upshot of this was that , first , if a company did honour i t s c on tract and process all logs cut , it could expec t to make very large losses ; sec ond , if full log export was al lowed and the resulting profits c orrec t ly assessed and taxed the money rece ived by governmen t would more than c over the c os t s of ref o res tation to rep lace what was cut and the sawmilling wages b i l l if all t imber had b een processed .
Sawmilling was unprof itab l e b ecause of ( i) the inab ility to use various lower quality of f cut s in the smal l local market , l eading t o much lower log ut ilizat ion in Papua New Gu inea c ompared t o , say , Japan ; ( ii) poor sawn t imb er prices b ecau s e Papua N ew Gu inea ' s sp ecies are relat ively unknown ; and ( iii) d i f f icu l t market ing problems due t o t he het erogene ity of t he Papua New Gu inea resources . Import ing countr ies ' pol ic ies no doubt favour ed the import of log s rather t han sawn t imber , which may have been r e f lected in the r elat ive pr ices of each product .
In 197 9 , the g overnment unv eiled a Whi t e Paper , t it led ' Rev ised Forest Policy ' . I t s ma in elements reflec t ed the f ind ing s

74
j u st quo t ed and wer e a s follows ( s ee Papua N ew Gu inea Of £ ic e of Forest s 197 9) .
( i ) A relaxation of restric� ions on log expor t s , certainly for spe cies no t f ound in sufficient quan t i t ies to j ustify market ing as sawn t imber . Only a minimum of 3 0 p er cent of logs cu t had to b e loca l ly p roces sed by new f oreign inve s tors , unless the area contained a high proportion of wel l known spe c ie s .
( ii ) The exis tin g l o g export tax of 5 p er cent was doub led but a rebate repre senting the increase was to be paid i f a t leas t 3 0 p er cen t logs were pr ocessed ( or a larger amount i f this was spe c i f ied in the concess ion agreement ) .
( i ii) Lo g expor t s can have the advan tage o f making Papua New Guinea species bet ter known . In add i tion , there was p ressure from many local groups to see their resources develop ed , but few foreign inves tors would f ind it prof itab le to under take proj ects with the required degree of processing in current market cond it ions . Given the lower f inancial and technical requirements of logging ver sus proces sin g , the government saw an oppor tunity to mee t its goa l of increased na t ional ownership by proposin g to create n at i onal logging comp anies . These would b e e s tab lished in areas wit h a species mix unsui tab le for pr oce s sing ( in tha t t here was not a core gr oup of dominan t spe c ie s ) and would be 7 4 p er cent Papua New Guinea owned the ba lance o f the equity being taken by an overseas management p ar tner .
( iv) The expected returns to the economy from logging would on ly be realized if s tep s were taken to ensure c orrect expor t pr ices f or logs . In fu ture contracts a c lause was t o be inserted giving government or its app ointed representat ive the r ight of first refusal over the marketing o f 2 5 per cent of each c ompany ' s logs f or expor t . The idea wa s tha t the government would either appoint or go into p ar tnership wi th an internat iona l log trader . The trader would have the r i ght t o marke t suf f icient o f the p rodu c t of the nat ional logg ing comp anies ( la ter cal led Forestry Deve lopment Companies , or FDCs) to have a marke t ing base .
(v) The g overnment would put more emphas i s on improving the perf ormance of exi s t ing p rocess ors than on a t t ra c t ing new one s . In choosing any new foreign inve s t ors the government would be muc h more selec t ive , b eing ' . . . as concerned with who it will deal with as the deal itself ' (Papua New Guinea Of fice o f Fores t s 19 7 9 : 9 ) . The government would look closely at a company ' s management , market in g and f inancial competence and experience .

7 5
( v i ) Whi le foreign c ompanies could subs titute refore s tat ion f or proce s s ing to gain a conces s i on , if they did undertake an ob l iga tion to process they would not in future be required to refores t . Government would undertake refores tat ion , us ing the higher exp ort taxes on logs for f inance . Companies had p erf ormed b adly at reforestat ion in the p as t , and t here had been serious delays in ob taining land from traditional landowners ( logging required landowner s to release t heir land for only a shor t p er iod , refores tation inc luded surrender for many y ear s to come ) .
(vi i ) ' Whe ther o r n o t al tera tions a r e made to exi s t ing Agreemen ts or p ermi t s the Government wi l l henceforth assume that all cond it ions are fair and reasonab le , and it shall enf orce al l such cond it ions . . . fully ' (Papua New Guinea O f f ic e of Forest s 197 9 : 3 7 ) . In future , t he Papua New Gu inea O f f ic e of For e s t s wou ld have the aut omat ic r ight to cut log export s proport ionat ely t o the nonfu lf ilment of proce s s ing ob l igations , in add i t ion to any right s gained by claiming breach of contract .
(vii i) B e f ore 19 7 9 the government ha d negot iated an op t ion to acquire 2 6 p er cen t equity within the f ir s t f ive years and to acquire maj ori ty ownership at a later s tage . Thes e op t ions had a c o s t t o t he government ( in terms o f other things that could have b een reques ted) b ut had only rar e ly been exer cised . In future the government would purchas e at par at proj ect commencement if i t want ed equ ity and would b argain later if it want ed further shares (Papua New Gu inea O f f ice of For es t s 1 97 9 : 3 9) .
( ix) ' Exis t ing fores try legis lat ion is in many respects ob sole te , technica lly inadequate or inappropriate t o deal e f fect ively with t h e allocat ion and management o f f orest resources • . . . A revised Nat ional For est Ac t . . •
wil l b e present ed t o Parliament in 1 97 9-80 ' (Papua New Gu inea O f f ic e of Forest s 197 9 : 5 4) .
The Revised P o li cy laid down c lear p ackages : nat ional , purely logging comp anies ; limit ed log export in re turn for road con s truction ( open to both f oreign and na tional inves tors) ; and log export coup led with various specific forms of processin g or refores tati on . I t s ought to e s tab l ish c lear rules for each ca tegory that would then be enf orced . Foreign inve s tors taking large fore s t resources would have to proce s s at least 30 p er cent of the logs cu t , would have incentives to p rocess (no expor t tax is paid on sawn t imber , the log export tax rebate is p ai d i f processing ob l i gat ions are met , and the general Exp ort Incent ive S cheme app l ied on p rocess ed exports rather than the export of logs) and p ena lties if they did not ( the proportionate cut in their log exp ort ent i t lement) : but the type of proces s ing ( s awn , veneer , woodchip) was large ly le f t to them .

7 6
The new policy theref ore took account o f prevai ling market circums tances : it had decided reasonab ly clearly what it d id and d id not want from f orei gn inve s tmen t .
(b) Recent performance . The government moved quickly to implement some aspe cts o f the new pol icy . The log export tax was promptly doub led and the system of rebates for tho se meet ing the process ing requirements ins talle d . Work s tarted on the es tab lishment of FDCs , two o f wh ich are now operat ing wi th o thers at d i f ferent s tages of implementat ion . The guidline s were presented to potential inves tors , and one agreement was very soon s i gned along the lines o f the new policy .
I n mos t respect s , however , the new p olicy has not been put into e f f ec t . Firs t , the government has s t i l l not appointed an agent to exerc ise the righ t of f i rs t refusal over the market ing of 2 5 p er cent of each company ' s logs for export companies whi ch now exi s t s in a number o f con trac t s . Second , no changes have been made to f ores try legis la t ion . Third , the government has not embarked on any maj or refores tation p roj ect s . Four th , there has been only limited evidence of the government b eing wi lling to enforce exi s ting con trac t s . Fi f th , the government s ti l l shows a s trong tendency to prefer inexper ienced companie s to develop i t s maj or fores t areas . Final ly , i n i ts las t maj or proj ect ne gotiat ion at the t ime of wri t ing the government app eared to have forgot ten a ll the le ssons that were behind the introduc t ion of the 1 9 7 9 policy . A review of recent exper ience i llus trates these p o in ts .
During the f ormula tion of the 1 9 7 9 Revised Policy , negotiat ions were he ld with Hyundai Interna tional for the Kap alik resource in wes t New Britain : an agreement was s igned af ter the revised p o licy wa s announced . In c ontras t with the government ' s policy , Hyundai had never undertaken a maj or f ores try proj ect before ( Fraser 1981 : 6 3) . The agreement s i gned saw Hyundai c ommi t t o build and operate a chipmil l and undertake re f ores tation , whi le t hey were allowed ( in conf ormity with the new policy ) to export logs thr oughout the li fe o f the agreement . The chipmi ll was c on s tructed on t ime , but at the t ime of wri t in g it had never been op erated . The company comp lains tha t there i s no marke t for the chips , even th ough the p arent company in Korea apparent ly provided a guarantee that they would take them ( inf ormat ion gained from d is cussions with Of f i ce of Forests staff) . Ref ores tation did not occur , since p ro f it ab ility was adversely affected by not b e ing ab le to use in the chipmi ll the trees that would b e cut when the land was c leared - there have a ls o been dif f iculties in acquirin g the neces sary land . While the government i s apparent ly giving seriou s con sideration to cut t ing the local company ' s log export quota , no act ion had b een taken at the t ime o f wri t ing .
The FDCs are good in concep t , but there now app ears a danger that many wi l l be s tarted in areas that should not simp ly be logged , and where no reforestation or sub s t itute long-term development will
7 7
occur . In addition to the two already s tarted ' . . . the Government hop es to s e t up • • . seven fur ther FDC ' s over the next three t o four year s 1 (Papua N ew Gu inea O f f ic e of Forest s 1983 : For eword) . The two so far d ev eloped are at Kumisi , in the Northern Province , and Ulab o , in Milne Bay . Both have New Z ealand c ompan ies as manager s and minor ity equ ity holders . The former proj ect apparent ly su f f ered from an inadequat e ini t ial assessment of the availab le r es ourc e , and c ou ld s oon close . The lat t er , while fac ing some res ource availab ility problems , is curr ent ly prof itable . In neither proj ec t ha s the g overnment establ ished some permanent economic ac t ivity t hat can su st ain the local community when the log s run out : t he forest policy stat ed that proj ect s wou ld not proceed unless the f o llow-up land u se program ( r efores t at ion , agr icu lture) was ident ified and fund ed (Papua N ew Gu inea O f f ic e of Fore s t s 197 9 : 2 1-4 ) . Presumab ly the polit ical pressure t o estab l ish the FDC s was no t mat ched by the bur eau c racy impl ementat ion capab ility . ' So c ial d islocat ion may resu l t from a t emporary bu i ld up in economic ac t iv ity followed by a rap id d ec line when the f orest resource is logged out . This has been the experienc e with a number of export logg ing operat ions elsewhere' (Papua New Gu inea O f f ice of Fore s t s 197 9 : 21) .
The government i s we l l advanced in es tab lishing two further FDCs , on Manus and B ougainvi l le I s lands respec t ively . B o th p r oj ec ts await res olution of dispu tes b e tween the p rovinc ial and nat ional government s over who shall manage t hem . The proposal t o e s tab lish a FDC on Manus is unf or tunate . The res ource i s 6 1 p er cent Ca lophy l lwn ; n o other Papua New Guinea res ource has such a lar ge concen trat ion of one sp ecies making i t part icularly sui tab le for a lar ge t imber proces s ing fac ility . The government had b een discus sing the Manus res ource with the Uni ted Africa Corp o ra tion ( UAC) , a subsi diary of Uni l ever . UAC has subs tantial experience in t imb er proj ects in the third world . Agreement could no t b e reached on the company ' s p r oposals , whi ch involved a per iod o f early lo g export t o tes t the marke t . When the UAC ne got iations b roke down , l o cal clamour for deve lopment of t he resource and the appr oaching exp iry of the original TRP promp t ed the idea of estab l ishing a FDC . I t i s ironic that such a move , involv ing only log export , shou ld follow the rej ec t i on of UAC ' s proposals on t he is sue of an over-reliance on log export s in the early years .
S ince the 19 7 9 Revi sed P o l icy was r e leased there have only b een two maj or new forestry proj ects nego t iated : one at Kapaluk that has already b een discussed , and one a Vanimo which will b e described shortly . In addit ion to the implementat ion o f various FDCs , the p er iod has seen the commencement of s ome smaller op erations and the ext ens ion of existing p roj ects .
The smal ler opera t ions have inc luded d irec t dealings b e tween landowners and f oreign inve s tors that have received the approval o f the Minis ter for Fores t s , and s ome agreemen ts allowing log export in return for road c ons truct ion ( inc lud ing mainly f ore ign

7 8
o r nat ional compani es a lready operat ing in Papua New Guinea) . Di re c t dealings are increas ing , and involve l ess onerous condit ions f or the f oreign inves tor . The weaknes s o f the fores try legi slation in descr ib ing more than one mechanism for foreign inves tors to gain acces s to a t imber res ource , especially given t he comp lex relat ionship b e tween v il lager , provincial and nati onal government , poses a serious threat to fu ture forest policy and performance in Papua New Guinea . For a country to gain the mos t out o f the exploi tat i on of a natural res ource one cent ral b ody mus t have e f fe ctive con trol over i t . The success of minerals p o li cy i l lus trates thi s .
Even though Sohbu ' s s awmi l l a t Open Bay burnt down over f our y ears ago , full log export has cont inued s ince then . A long pe ri o d of nego t iat ions has j us t c oncluded result ing in a grant to t he company of new t imber resources in return for refores tation and the c on s truct ion of a chipmi ll . Nisho Iwai a t S tet tin Bay has a l s o j u s t concluded nego tiation s with the government , and was grant ed the Kapiura resource in re turn f or a c ommi tment t o refor es t certain areas . In b o th cases , there fore , companies that c ommenced op eration s in the early 19 7 0s and whi ch failed to hon our their original contra c t s have b een grant ed extensive areas o f t imber resurces with apparent ly fair ly minimal and , i n the case of refores tation , d i f f icult t o enforce condition s . Had the government in the ear ly seventies offered the ori ginal t imb er resources seeking prop o sals s imi lar to the actua l performance o f Sohb u and Nisho Iwa i , one could eas i ly imagine more experienced c omp anies app ly ing and being wi l l ing at minimum to p ay much larger export taxes and agree to lower log export quotas . The enormous di f ference between the government ' s ' bark ' and i ts ' b ite ' has been very co stly .
( c ) Van imo . The Vanimo resource i s generally agreed t o be the nat ion ' s best : it i s two t o f our t imes larger than most other Papua New Guinea resources with an op erable area of 2 2 5 , 000 hec t ares and an est imat ed volume of over 13 mi l lion cubic metres o f sawn / veneer logs of greater than 5 0 cm width , and a g ood species mix (24 per cent o f t he resource is t he highly-p rized kwi la (Papua New Guinea O f f ice of Fores t s 1983 : 8 ) .
In 19 80 c ompani es were inv ited t o submit propos als t o develop the res ource . Many were interes ted , inc ludin g the exp er ienced in terna t iona l opera tors UAC , Inchcape and Weyerhaeuser , Bunn ing B r os - a very exp erienced Aus tralian c ompany , and a few o thers . An ini t ial deadline was s e t for the receip t of p roposals which only one company met , the others comp laining that i t was too short to allow proper inves tiga tion o f the resource . The deadline for the receip t of proposals was extended before t he ori ginal date was reached . On the b asis of t he extension many companies expended large t ime and e f f or t res earching their proposals . Two weeks b e f ore the revised dead line , however , the government chose He tura Mej a , the c ompany who met the f irs t deadl ine , for detailed
negotiations . He tura Mej a ( a Fil ip ino company) had no t imb er experience whatsoever and l i t t le f inancial b acking .
79
Af ter long negot iations an agreement was s igned with Hetura Mej a in Apr i l 1982 , j us t prior to an e lection which saw the de fea t o f the government of Julius Chan , which had c ome t o p ower in early 19 8 0 . The agreement was terminated i n January 1983 , however , when Hetura Mej a c ons i s tent ly fa iled t o s ubmit the f inancial and t imber working p lans required under their agreemen t : apparent ly they could not rais e the ne cessary f inance .
In January 1983 , four o f t he previously unsuccess ful companies ( Inchcap e , Bunnings , Weyerhaeus er and Hyundai) were invited to submit p rop osals within three months according to comprehens ive guide l ines . Within t hree to five years af ter proj e c t go-ahead these guideline s required the c ons truct ion and operation of lar ge saw , woodchip , p laning and veneer mil ls , a kiln drying p lant , the beginning of extens ive refores ta tion and the generat i on o f electricity surp lus to proj ect requiremen ts f o r genera l s a l e b y the government ' s generat ing authority . When all f our companies comp lained s trongly , the guide l ines were sub s tant ially modi fied in Oc tober 19 83 . The new guidelines rep resented an enormous change : the proposed s awmil l capac ity was reduced by two- thirds , the o ther p ro cess ing faci lit ies were made op t ional although various s tudies were required , and the requirement to generate s urp lus p ower was removed . The c ompanies were however given j us t two months to s ubmit p roposals . The two companies with the wides t array and large s t exp erience o f internat ional fores try operations declined the invi tati on .
In January 19 84 the Na tional Executive Council chose Hyundai over Bunnings . The Hyundai p roposal apparent ly required much les s cap i tal exp enditure : much more surpris ingly , th is was the company whi ch by this t ime had demons trab ly failed to mee t i ts c ommi tment s at Kapuluk .
Detai led negotiations commenced with Hyundai but f inal agreement c ould not be reached and the c ompany withdrew . In Sep tember 1984 the government c ommenced discus s ions wi th Bunnings and at the t ime of wri t ing it is unders t ood that full agreement has b een reached .
I t is useful t o c onsi der what mi ght have happened had t he government ' s original 1980 guidelines been s imilar to the late 1984 agreement reached with Bunnings and had a reas onab le p eriod of time allowed f or p roposals to b e submit ted . No t only would three years of was ted e ffort b een saved and Papua New Guinea ' s rep utation for dealing with f ore ign inves tors impr oved , but one suspects a much b e t ter deal c ould have b een secured .

80
(d) Ref lect ion s on policy and perf ormance . Forestry has been a s ect or from which high growth was expec t ed in processed t imber out put , emp loyment , g overnment r evenue and general cont r ibut ion to GDP . Performance has c ont inually fallen wel l s hort , however .
The p rob lems have already been i llustrated : p i t ching p ol icy guidelines at unreali s t ic levels , choos ing f oreign companies inexp erienced in maj or fores t developments , and not enforcing con tracts freely entered int o . These prob lems are in terrelated the f ir s t prob lem may have led to the second , and b oth were s trongly rein forced by the third . It mus t be extremely d i f ficult to de termine what a reasonab le p olicy package i s , much less negotiate i t , when at l east some o f the companies are convinced that they will not have to live up to the agreement s they s i gn .
The Ins t i tute o f Na tional Af fairs ( INA) , spons ors of much extremely useful res earch on general ( inc luding fores t ry) p o l i cy p rob lems within Papua New Guinea , ob tained ' . . • the op inions o f s ome o f the world ' s be t ter known companies with experience in trop ical t imber . . . to comment on their own ab sence from PNG ac t ivi ty . . . ' . They all b lamed governmen t p olicy and /or performance and many felt that those companies who are used to respecting contract s , or ' the serious inve s t or , wi l l be rep e l led . ' The INA c oncluded that the results of their survey ' . . . show qui te c learly that the ab sence of the ab ove companies from the PNG fores t scene is certainly no t due to ignorance of either the resource or the machinery of Government whi ch p revails • . . ' ( Fraser 1 9 8 l : xi i-xiii) .
A maj or caus e of the prob lems is the lack o f c lear obj ec t ive s and widely accep ted fores t p olicy . Papua New Guinea ' s mining p o licy , for example , was f ormulated amidst wide pub lic discus s i on and polit ical involvement at the hi ghes t l evels : anyone challenging i t would have a very di f ficult t ask . Virtua l ly the opposite is true o f f ores t p ol icy . Few politi cians have been involved in i ts f ormulation as the sect or ha s never become a maj or priority . Individual minis ters can success fully spons or prop o sals or initiat ive s which are again s t wri t ten p olicy . Ano ther cause o f the p rob lems is the inadequa te resources devoted to fores t ry within g overnment . Fore stry does not warrant i ts own depar tment : the Office of Fore s t s can f ind i ts e l f with many maj or and minor negotiat ions and few s ta f f to deal with them , much les s devote the enormous e f f ort required to t ake action agains t an exi s t ing de faulting t imber company .
Fores try is also an important arena o f potential c onflict be tween p erceived nat ional and provincial intere s t s , and between b o th tiers of government and local communi t ies . There are opp or tunit ies f or polit i cal gain by local or nat ional leaders wh o take a position in these disputes . The re is potent ial f or f inancial gain by leaders who can smooth the p ath o f inves tors with eithe r provinc ial or na t ional author i t i es . These p rob lems are increased by the fai lure of nat ional government , to date , in

81
negotiating deals in fore s try that are p erceived to be fair to all part ies and whi ch yield genuine bene fi ts both locally and nationally . This failure means that exces s ive wind fall p rofits may b e avai lab le to tho se who gain access to a f ores t res ource .
To draw les s ons from Papua New Guinea ' s f orestry experience it would b e help ful to understand why f ores try p olicy obj ectives are uncl ear , and why the sector receives lit t l e p olit ic a l support , p ar t icular ly in comp arison with the minin g sector . I t is d i f ficul t to be certain , but pos s ib le to speculate . Firs t , whi le the sector is large , each p ro j ec t is relative ly smal l . Mos t exis ting proj ects would t oday cos t no more than K30 mil lion to cons truct . The Ok Tedi p roj ect had an es timated tota l cos t o f KlSOO mi l lion in 1980 . Second , there are more p os s ible p olicy obj ec t ives -revenue , emp loyment , training , promot ion o f entrepreneurial skil l s , p rovis ion o f infras truc ture in remo te area s ( roads , bridges , harb ours) - no one obj ec t ive obvious ly dominates , and they are d i ff icult to balance against each other . Indeed , until the res ource d is appear s , with the excep tion o f raising revenue , all o f these obj ec t ives are b eing par t ly achieved . P eople in the fores t area , and p erhap s s ome nat ional p oliticians , will compare what they have with what they had , not wi th what could have been . Third , forestry is very land-intensive . In a Me lanes ian society with s trong attachments to land and cus t omary land ownership , landowners have impo rtant poli t i cal inf luence . An exis t ing inves tor may ensure his pos ition by providing s ervices and faci lit ies (at low cos t) to the l andowners despite b e coming extremely unp opular wi th headquarters fore s try s taff f or being in default o f the concess ion agreement . Finally , with i t s mix o f species and sizes , product p r ices are more d i f f icult to monitor . Government has been reluctant t o adap t p olicy t o observed performance .
These factor s do not make succe s s ful p olicy impossib le , rather they reinf orce the need f or c omp ensating action . To improve f ores try sector p er formance c lear obj ec t ives mus t be lis ted , with p riorities and trade- o f f s reflec ted in policy guide lines . This mus t be based on a sound unders tanding of the economic s o f dif feren t types o f fores try act ivity . During and after p ol icy f ormulation , a w ide l eve l of political and pub lic support and awareness is neces sary . Finally , there needs to b e adequate bureaucratic res ources devoted to imp lementation .
P apua New Guinea can s t i l l gain a very high return from i t s t imber indu s try . Much of the fore s t i s s t i l l unexp loi ted and t imb er p rices should increase in future in real terms , especially as other nat ions ban log exports and Papua New Guinea species b ecome better known . The dangers in a cont inuat ion o f current policies and p er formance are lar ge , however . ' Mos t o f the f ores t s ( o f the tropical world) a r e b eing mined for t imber w i t h little re gard f or what is lef t or what rep laces the natural forest . . • •
Papua New Guinea is following the s ame pattern ' ( Fraser 198l : v ) . Unt i l the goverrunent can make the appropriate changes i t would b e

82
wel l advised not to ini t iate many new proj e c t s and ins tead , devot e its e f f or t s to improving the exi s ting ones .
12 . Agri culture
Despite the country ' s low average populat ion dens i ty , good availab le agricultural land is relative ly s carce . Much of the count ry ' s terra in is mountainous and rugged . The soils are genera l ly poor , o ften containing little humus . Mos t impor tantly , owner ship o f 9 7 p er cent of the land i s determined by cus t omary occup at ion : acquiring land f or foreign inves tment proj e c t s i s d i f f icult and t ime c onsuming , and once acquired t it le cannot always b e guaranteed .
While Papua New Guinea has always been a rural based society , f ood p roduct ion has been undertaken predominan t ly for sub s i s tence and gif t-exchange , and only to a limi ted extent for cash sales . The urban areas con t inue t o rely heavily on imp orted f ood .
The e f fort required to inve s t in any f oreign country , compounded in Papua New Guinea by the d i f f i culties of acquiring land and NIDA regis tra tion , sug ge sts a minimum s i ze of agricul tural proj ect suitab le for f ore ign inves tment . Given the fragmented nature and small size of the Papua New Guinea marke t , export crops are usual ly more at tract ive to foreign inves tors than producing to sat is fy the loca l marke t . Exp erience in other countries of the poli ti cal risk in dome s tic food pricing reinforces this .
Tree crop agriculture ( co f fee , cocoa , copra , tea and rubber) dominated Papua New Guinea ' s exports before B ougainville Copper Ltd s tarted p roduction in 19 7 2 . P rior t o Ok Ted i commenc ing produc tion in mid- 1984 i t s t ill accoun ted for between 40 p er cent and 45 pe r cent o f Papua New Guinea ' s export s .
(a) Traditional agricultural expor t s - c opra , cocoa and cof fee . C opra product ion in Papua New Guinea started in t he late 19th century and in t he early 1920s compri sed mo st of the country ' s exports . I t s r ole is now relatively minor as other exports have grown to catch s tat i c copra p roduc t ion . S igni f i cant p lant ing ou ts ide the f oreign owned p lantat ion sec tor only began in the late 1950s , and since then p lantation production has s teadi ly de clined in importance to around 40 per cent o f total production .
Government o f f icials e s t imate the average p lantation s i z e i s only 200 hectares , usua lly owned and managed by small expat riate family group s . With no acces s t o redeve lopment f inance ( c ommercial banks will not lend for long periods and the Development Bank cannot lend to non- c i t i zens ) t hese inheren t ly uneconomic enterprises have b een hit hard by risin g fuel and lab our cos t s s ince the early 19 7 0 s . An amalgama tion o f properties by those with outs ide f inance i s required , but this has long b een prevent ed by explicit government po licy ( s ee be low) .

8 3
F o r copra , the C opra Market ing Board i s the sole export body and purchases all copra produced ( this and other industry board s are g overned by s t atute but are not government agenc ie s , and there has b een dominant producer rep resentation) . I t also admin i sters the Copra Stab il i z ation Fund . Le gis lat ion requires growers to pay a pr opor t ion of their revenues into the f und in year s of high p rices and rec e ive the money back in years of low pr ices . The fund has helped pr oducer s : widely f luc tuating prices could have been a strong dis incentive t o par ti c ip a t ion in the indus try .
Cocoa p lan tat ions began operation s in P apua New Guinea around the turn of the century . As with c opra , f oreign owned p lantation hold ings are generally small , and government of f ic ials estimate that near ly 70 p er cent of the area of p lantation cocoa comes from p r op er ties of less than 2 00 hectares .
The Cocoa Indus try B oard has wide p owers over the processing and marke ting of c oc oa and i s respon s ib le for the Cocoa S tab ilization Fund . The fund pays b ounties or collects levie s resp ec t ive ly equal to 50 p er c ent of the differ ence between the 10 year long term average c ocoa p r ice ( adj us ted for inf lation) and the current price .
Whi le c of f ee has been grown in P apua New Guinea s ince the las t century , only s ince 1950 has it been gr own on any s cale . P lanta tions now account f or only about 30 p er cent of product ion . S everal lar ge exporters dominate the market , whi ch i s divided into quo ta sales to members of the International Coffee Organization ( !CO) and sales to non-members a t heavily discoun ted pr ices . There exi s ts a Coffee S tab ilizat ion Fund which op erates in the same way as the fund for c oc oa , excep t that it also sub s idizes sales to non-memb er countries whi ch occur when quotas are imp osed .
Unlike many s imi lar stab ilization f unds overseas , the growers ' money in a l l three funds has never b een mis appropriated : perhap s over seas exp er ience has increased the vigilanc e of those responsib le .
Tab le 8 provides a b reakdown between foreign (virtually all p lantat ion) and nat ional ( a l l smallholder) agr iculture b e f ore Indep endence in FY 1 9 7 4 / 7 5 . Mos t agr icultura l exp or ts came from f ore ign owned p lan tat ion s .
Pre-Independence colon ial p o li cy had b een conduc ive to f ore ign inve s tment in agr iculture . An immediate wr ite-off against tax f or mos t cap i tal expenditure was allowed , wage s were very low and land was made availab le , of ten with freehold t i t le . Such ti t les today make up about 1 p er cent of land in P apua New Guinea .
The indus try b oard s , with the ir control over market ing and cash f low (via the s tab i lization fund s ) have a posit ive impact on
84
exi s ting p lantations and sma l lho lder s . I t i s que s t ionab le , however , whe ther many foreign inve s tors would have b een willing to s tar t large p lantat ions given such arrangement s . The i ssue never ar ose as pos t-Independence government policy no longer made land ava ilab le : in fact it at temp ted to take land away from exi s t ing p lantations .
After se l f-governmen t was achieved in Papua New Guinea a po tentially violent s i tuat ion deve loped . Trad i t i onal owners in land short areas or in areas where inadequate compensation had p revious ly been paid f or land demanded the re turn of expatriate owned p lantations . The only way , apparent ly , to defuse the s ituation , given the p ivotal imp or tance of tradit ional land to the peop le of Papua New Guinea , was to embark on a p rogram of land acquisit ion f r om p lantat ion owner s in cer tain areas . Rather than use exi s t ing legi s lat ion the government ' s answer was to enac t in 1 9 7 4 f our p i eces of le gislat ion that compr i sed the P lan tat ion Red i s tr ibut ion S cheme (PRS ) .
As s tated in 1981 by the then S tate Solici tor :
The P lantation Red i s trib u ti on Scheme i s an examp le of over legi s lation . . . ( i t ) goe s int o too great a detail in laying down the s teps that mus t be taken and required c onsulta tion and di scuss ion , promulgat ion of decis ions and giving of notices at too many levels (Woods 1981 : 5 6 ) .
Whi le sixty-eight p lantat i ons had been acquired by 1982 , the c omp lexi ty of the legis lat ion meant that none had been dis tr ibuted in accordanc e wi th the procedures laid down , and no national group had acquired t i t le .
Compound ing prob lems , the acquisit ion pr ice f ormula under the PRS a l lows room f or government discretion and does no t explic i t ly reward redeve lopment expend i ture made immediately prior to the acqui s i t ion . In addition , in 1 9 7 4 the Nat ional Executive Council adop ted the p olicy of not allowing any s ales of exi s t ing p lantations t o expatriates .
For exis ting f oreign inves tors the overa ll e f fect was , f ir s t , that there was no free marke t f or the sale of p lantations . Second , p lan tations were under c ont inual threat of compulsory acquis i tion . Even in areas where there was no land shortage or hi s tori cal grievance , the mere exis tence o f the s cheme could awaken in terest in the trad itional owners , who were not required to make an ini t ial f inanc ial out lay . Third , the p r obab i l i ty of a good re turn on current inves tment was greatly dimini shed .
The result was a sharp fall of f in reinves tment and a dec line in pr oduct ion whi ch can be seen from Tab le 8 f or copra , cocoa and rubber . Of more concern , many trees are now seni le and p oorly maintained and there has been l i t t le inves tment in research and
85
hybri d specie s . Production decline s wi l l con t inue in future even if reinve s tment occur s . Contribut ing to the product ion dec line from p lan ta tion s is the inexp er ience of the new manager s of p lantat ions taken over and the fac t that , in a number of cases , the peop le d id not want a p lan ta tion , j us t the ir land .
The c omb ined resul t of the P RS and the inab ility to sell p lantat ions t o f oreigners hit copra p lantat ions par ticularly badly . Though poor managemen t and lack o f redeve lopment f inance would have p revented some rep lanting , government p olicy ensur ed that it did not occur . Amalgamation and redeve lop ing copra p lan tations c ould at presen t b e very profi tab le given proj ec ted prices and pr oduc t ion cos ts for a large- s ca le venture . P o tential yield increases from hybrid c oconuts could also b oos t profitab ility : the hybrids are apparent ly avai lab le , but lit t le p lant ing has oc curred to take advan tage of them . Whe ther the amalgamat ion and redevelopment occur s depends on changes in government policy .
Government p olicy is also the main constraint to reinves tment and new inves tment in cocoa . Extens ive add i tional areas of land exi s t and new inves tment would be very profitab le , re inves tment even more so . Internal government e s t imates sugges t that over US $ 100 mil lion is needed to redeve lop exis t ing cocoa p lan tat ions , an amount of money whi ch cannot b e found ins ide Papua New Guinea .
Coff ee p lant at ions have fared bet t er , however , because the industry is younger , with a smal ler prop or t i on of senile t rees . Most o f t he trans fers o f p lantation s have been freely negot iated , and the new owners have a s trong incen t ive to maintain prof itab ility to f inance the transact ion .
Fr om 19 7 4 to 1 9 7 9 no review of p olicy was under taken . Whi le many appreciated the problems ass ociated with the scheme the i ssue was thought too politica lly sens i tive . The ' nationalist ' , ' produc tion ' and ' benef it s ' s chools could not agree on obj ec t ives for the p lantat ion sector .
By 1 9 7 9 however , the disas trous s tate of the p lantation sec tor and the scheme i t self commanded atten tion , and the Somare Government commi s sioned a review . The Review Commit tee recommended that , inter alia :
the f our Ac t s of the P RS b e repealed and workab le provi sions be inserted into the Land Act f or acqui sition when land in an area i s in shor t s upp ly or t o maintain a p lantation ' s produc t ive capacity ;
p lantat ion acquisitions need to be identif ied we l l in advance to minimiz e uncer tain ty , p referab ly from the many willing vendors ;
86
the trans f er price should be nego t iated and only af ter this has fai led should the comp ensation f ormula be used , suitab ly amended to recognize recent inves tment expenditure (Papua New Guinea 1 9 7 9 ) .
As a resu l t of the Commi t tee ' s rep ort the new Chan Governmen t in 1980 decided tha t no fur ther acquisit ions would be made . The relevant sect ion of the Land s Depar tment was ab olished . I t was also dec ided that agricul tural leases could be trans f erred between expatriates and p re- 1 9 7 4 leases could be reis sued to take certain p lantations out s ide the PRS , in return for a promise to redevelop the p lantation . Never the less , no legislative changes were made .
Limited reinve s tment in p lantations has s inc e occurred . The effects on conf idence of the p olicy changes have been s trengthened by the inherent p rofitab ility of the inve s tment s and a trend amongs t local landowner s to accep t the exi s tence of foreign . owned p lant at ions , recognizing the benef i ts they can b r ing , now that the more v ocif erou s ini t ial demand s for the return of a lienated land s have b een me t . S ome transfers o f leases between non-cit izens have b een app roved , but it is usual f or an ent ire p lan tat ion owning c ompany to be sold thus avoiding the need for government approval . No leases have b een reissued .
At the t ime of wri t ing a number of lar ge new inves tment or reinves tment cocoa and copra proj ects are p lanned ( there is lit t le land availab le for new coffee inves tment and Papua New Guinea ' s expor t s now exceed the ICO quota in any even t ) . I t remains t o b e seen whe ther the p otent ial proj e c t s will succ ess fully overc ome the PRS , the expor t licensing and monopoly market in g p owers of the indus try boards , and the enf orced cash f low management of the s tabi liza tion funds . There is lit tle indicat ion that the governmen t has suf f icien t ly c lar i f ied its obj e c t ives to enab le it to make t he decisions tha t would enab le these p roj ects to p roceed .
(b) New f oreign investment in agr icu lture . The most recent large agr icultural export proj ec t s t o b e started us ing foreign equity have been in oil palm . They have a large smallhold er component , and 50 p er cent government equity in each case ; t og et her with World Bank loans t hi s has provided the n ecessary increase in invest or con f id ence . The ot her 5 0 per cent equity was provided in each case by a s ingle f oreign par tner who also manages the operation .
In the 19 6 7 s cheme at Hoskins the foreign partment was Harrisons and C ros field ; the United Kingdom ' s Commonwealth Development Corporation ( CDC ) was the partner in the more recent 1 9 7 6 scheme at Popondet t a . The 1 9 7 2 Biala s cheme originally started under Japanese management . Poor performance led t o expropriat ion in 1 9 7 6 , and the subst itut ion of the Belgian firm S ipef . The proj ect ' s current success set s a useful p receden t that t hose respon sib le f or government f orest pol icy c ou ld f ollow .

The nucleus e s tates prov ide all p lant ing materia l , frui t transport , proce s s ing fac i l i t ie s , and research and advisory
8 7
services t o sma l lholder s , making the schemes independent o f the p erf ormance of the government ' s Depar tment of Primary Indus try ( DPI ) . This has been one of o i l palm ' s advantages over other f orms of tree crop agr icu lture . Government does not even control p roduct qua li ty , and market ing is the sole resp ons ib ility of the f oreign par tner on a commi s s ion basis .
Wi th the gradual introduct ion of the t hree schemes , oil palm produc t i on - ha s increased s tead i ly f rom j us t over 2 6 , 000 t onne s in 19 7 7 to over 110 , 000 t onnes in 1984 . I t is s old mainly in Europe for ref ining int o cooking o i l . The three s chemes have p rovided the only produ c tion and emp loyment growth in the agricultural sector . Direc t employment i s provided to 5000 peop le and 4 5 00 farmers depend on o i l palm for their livelihood . Together this represen t s ab out 4 per cen t of f ormal wage emp loyment p lus recorded self-employment ( 1980 census ) . This i s s igni f i cant and i llustrates the potentia l o f these schemes . At app roxima te ly US $25 , 000 cap ital co s t per j ob , employment is created at a fract ion of the co s t in a mining proj ec t .
The total comb ined c os t of the three schemes was over US $ 2 5 0 mil lion at mid- 1984 prices and exchange rates . One-quar ter was the resp on s ibility of government for general infras tructure and smallho lder development , the lat t er out lay being repayab le with interest from later produc t ion ( there have as yet b een no defaults ) . Three-quar ters of the tota l inves tment is an equal contrib ut ion of equity and loans , respective ly c ontributed and guaranteed by the government and p r ivate shareholder s to each scheme .
All three scheme s by 1984 had p os i t ive ac cumulated earnings and have produc t ion costs below what are felt to be long-term expected p roduct price s . For 1984 , a year of admit tedly higher than average pr i ce s , the three schemes were ( a t the t ime of wr i t ing) expecting comb ined prof i t s of around US $ 2 5 mi llion , a good return on , �equity .
As incentives t o t hese init ia l s cheme s government allowed the proj ec t s technical and market ing aut onomy ; a full wri te-off f or agricultural inve s tment ( as d i s t inct from inves tment in the fac t ory) ; mos t of the infras truc ture was provided f ree of charge ; and it took 50 p er cent of the equi ty and prov ided a s imi lar proportion of the loan guarantees . With the prob lem of se curi ty of land tenure a signif icant financ ial commi tment by government mus t have been vital .
In FY1983 /84 the government introduced an oil palm stab i li z ation fund simi lar t o those a lready described for the other t ree crop s . Whi le all smal lholders immediately came in to the f und , the nuc leus es tate companies were exemp t , though the Min i ster for Primary Indus try can b r ing t hem in at any t ime .

8 8
The f inancial re turns from making crude oil a r e much lar ger than from further proce s s ing . The government has de cided agains t subs idi zing a mar ginal proce s s ing indus try : i t s proj ected account in g p rofitab i li ty would probab ly c lo sely resemb le i t s proj ected n e t economic bene fit (wi th the excep tion of shadow prices for labour ) giv en the openness and lack o f signi f i cant b order taxes of the P apua New Guinea economy .
The oil palm indus try has proven i tself p ro f i tab le in Papua New Guinea . The three exi s t ing schemes are cont inuing to expand b eyond their ini t ia l s cope . B oth Harr ison s and Cro s f ie ld and CDC are looking at new schemes , and in each case the government is nego t ia t ing for them to take 60- 7 0 per cen t o f the equity t o lower its own burden . In the se nego t ia t ions , two p ol icy is sues have apparent ly ari sen which were not of c oncern previous ly . One of t he CDC ' s p o tential schemes centres on an exi s t ing p lantation and requires the reissue of leases to remove them from the PRS : the government probab ly wi l l not hesitate to do this . Creat in g more dif ficulty is the demand by the c ompanies for guaran teed future exemp t ion from the newly-es tab lished s tab i lization fund . The companies feel they can manage the ir own cash f l ows bet ter than the fund , and mus t have some linger ing concerns given the examp le of stab il i za tion schemes in other c ount ries ( Ghana , f or examp le) .
Indus try expansion wi ll be restricted by such inve s tor uncer tainties and by the exten t of the governmen t ' s inab ility to alloca te land t o p oten t ial sma l lholders and e s tate c ompanies .
( c ) Import subst itution . S ince Ind ependence foreign inve s t or s have n ot t aken any ser iou s int erest in agricult ur e f or import replacement . Wit h a large d egree of government prompt ing Japanese and other foreign compan ies have at d i fferent t imes c onducted feasibility stud ies int o rice produc t i on , but a c omb inat ion of land and t echnical prob lems have so far prevented any pract ical result .
The only large-s ca le f oreign inves tment in imp or t repla cement agr i culture has been the f oreign share o f j us t over 4 0 per cen t i n Ramu Su gar . In 19 7 8 the government c onnniss ioned B ooker Agricul ture Interna t ional (BAI ) to do a feasib i lity s tudy for a proj ect t o meet the P apua New Guinea market f or sugar . Unfortunately BAI was given a s surances that they would c onstruct and manage the p r oj ec t i f it proved viab le , wi thout an ear ly equity commitment fr om them . BAI c onc luded tha t such a proj ec t would be viab le , choosing f or the s i te an exce l lent p iece of agricul tural land then b e ing used for catt le grazing . The government promp t ly announced the proj ec t would pr oceed and formed the Ramu Sugar Hold ings Ltd .
I t ini tially put i t s equity s take at 3 0 per cent , agreed t o b a n all imp orted sugar a f ter proj ect s tar t-up a n d tried to int eres t p oten tial inves tors . The Internat ional Finance Corp orat i on , the commerc ial arm of the Wor ld B ank gr oup , dec lined the

89
invitat ion , express ing the v iew ( according to government officials) tha t various cap ital and operat in g costs app eared unders tated in the feasib i li ty s tudy . CDC t ook 3 0 per cent of the equi ty -they were already 5 0 per cen t shareholders wi th government in one of the oil palm schemes , and were in teres ted in other government ass ociated proj ec t s . The proj ect eventua lly achieved the requ ired equity by an increase in the government s take to near ly 50 per cent and by sub s cr ip tion of small parcels of equity by a c omb inat ion of public and priva te sector organizations . BAI eventually took only 5 per cent .
Governmen t ' s equity inve s tment was Kl2 . 5 mi l lion . The government also gave a KlO million infant indus try loan in an e f f ort to av oid having to guarantee all the proj ec t ' s loans . The loan was quickly drawn down af ter p r oj ec t s tar t up in late 1982 , and has s ince been converted to equity , taking t o tal government inves tment in the proj ect t o K2 2 . 5 mil lion , or approximately equal t o the annua l alloca t ion o f new proj ec ts in government budgets during the early eighties .
The comb ination o f rely ing mainly on short- term ( exp or t cred i t ) loans , higher than expected operating cos ts , slow closure of ports to imp orted sugar and los ses from the streng th of the Uni ted S tates ' dollar have led to a very high sugar price to avo id proj e c t c losur e . The original proj ect agreements assured Ramu Sugar of a sugar price linked to import parity . B e f ore the proj ec t c ommenced product ion , but af ter mos t o f the cons truc t ion had b een c omp leted , the company asked t o renegotiate the price . A b it ter struggle f ol lowed b o th within government and with the company . Faced wi t h the threat o f stop p ing the proj ect b e f ore any sugar was produced the government reluctantly increased the sugar price above the c ontractual level . The same threat has forced sub sequent upward revis ions . By October 1984 the sugar p ri ce received by Ramu Sugar was K7 60 a t onne , compared wi th a world p ri ce of one- sixth of this amoun t , and long-term guaranteed import pr ices into the Unite d States . and Uni ted Kingdom ( for examp le , f or Caribbean sugar) of much les s than half the K760 f i gure .
Given the high impor t comp onent o f cos t s and expenditure from wages one can assume that P apua New Guinea is current ly makin g a large f oreign exchange loss on the proj ect .
The government did not handle the estab lishment of the Ramu Sugar p roj ec t well . Ear ly decisions on the p roj ect were taken amidst f ierce c on f lict b e tween supporters of the ' b enefit s ' and ' produc t ion ' school s wi thin the government . The internal debate focused , at lea s t in the minds o f many politic ians , on whether or not to proceed with the proj ec t . The ' produc t ion ' school , aided by the ' nat iona li s t ' school ( a t trac ted by government equity) , won the day . The framework then set f or the proj e c t precluded marke t scrut iny ( e . g . those assess ing the proj e c t , BAI , had , in

90
the management con trac t , an inc entive for it to proc eed whe ther or not i t was profitab le ) . The government created the impres s i on tha t i t had d ec ided to have the proj ec t , whatever the cos t .
( d ) Overvi ew of policy and performance . C onsecut ive Papua New Guinea government s have voiced three obj ect ives f or agricultural developmen t . First , t o increase Papua New Guinean involvement in agr iculture : in d if f erent mind s this obj ect ive has ranged from promot ing smal lholder prod uc t i on t o a fervent nat i onalist call t o remove al l f oreigner s from possess ion of agr icultural land . Second , t o increase agricultural produc t i on t o benefit the general economy : such sent iment s were expressed wi thout reference t o t he fac t that most exist ing product ion came from f oreign owned p lantat ions . Third , t o prod uce locally food i t ems curren tly being import ed .
Thi s mix of obj ectives could have been pursued s imul taneou s ly wi th a well-thought-out policy whi ch came t o grips wi th the que s tion of foreign inves tment in agricul ture . Unfortuna t e ly i t was not .
The government over-reacted to the ini t ial demand s of some trad it i onal landowners f or the return of their land . Succe s s ive governments c omp ounded this prob lem by then ignor ing the ques tion of durat ion of non-citizens ' tenure over agr icul tural land .
The fa i lure to address this question led t o prob lems wi th achieving t he other two obj ect ives . The oil palm nuc leus estate proj ects c ost the government heavily in terms of alt ernat ive expend iture prior i t ies f orgone . They were u sually estab l i shed with due regard f or commercial p rinc ip les , however , and can be regarded as su cce ssful . Politicians were frus trated by a lack of pr ogres s on impor t replacement . There arose a per s i s tent danger tha t government would e s tab lish by decree a commercial p roj ec t that was beyond i ts comp etence to manage or eva luate : the Ramu Su gar proj ec t was the result .
Was there an al ternative approach t o the qu est ion of land tenure by fore igners? Both in 1 9 7 4 and 1984 a p lanned sys tem of acquis i t ion accord ing to explicit criteria was and is required . One way to imp l ement the pol i cy in future might b e to re-is sue leases to p lantat ions that are no t located in areas of land shortage and where there i s a b ind ing commitment to reinve s t . The i s sue becomes one of s imp ly in forming f oreign inves tors where they ar e , and are no t , we lc ome .
With the early 1980s world recession and Papua New Guinea ' s growing d eb t burden the government has p laced maj or emphasis on increasing produc ti on and emp loyment in a l l sectors o f the economy . The government does not have the money or technical expert ise t o increase great ly agricultural produc t ion and emp loyment . Foreign inves tment in s ome f orm i s needed , and can have many positive

9 1
research and extens ion flow-on e f f ec t s o n smal lholder produc tion . The government should therefore decide on exp licit obj ec tives and f ormu late policies to give ef fect to them .
13 . Fisherie s
Foreign investor s a r e involved i n Papua New Guinea ' s tuna , prawn , lobs ter and barramund i industrie s . Exc lud ing tuna , the other three p roduc t s represent only 1 per cent of Papua New Guinea ' s exp orts and the catches of each are at or near their sus tainab le yield : these indus tries are of little fu tur e policy interest .
Papua New Guinea ' s tuna ind ustry has enormous potential . Papua New Guinea waters lie astride the migrat ion r outes of maj or South Pac if i c s t ocks of tuna , part icu l ar ly skip j ack tuna . Within Papua New Guinea ' s 2 00 mi le extended economic z one the f ish are c aught by res ident c ompany control led p ole-and-line vessels and off- shore based longliner (using a long l ine , wi th bait and hooks , submerged in the water f or long pe r iods at great depth) and pur seseine vessels (using large net s ) , The annual catch in Papua New Guinea waters ranged from 3 0 , 000 to 106 , 000 t onnes from 1 9 7 2-80 , or 1 . 25 to 4 . 60 per cent o f wor ld tuna produc t ion . P apua New Guinea ranks seventh in wor ld tuna produc t ion and f ourth in wor ld skipj ack produ c tion ( Cop es 1981 : 12-15 ) .
There i s no d oub t that the catch in PNG waters i s s t i ll considerab ly below i t s maximum sus ta inab le p o tentia l , however . I t is not unreasonab le t o expect that a wel lorganised expansion of the f ishery c ould sustain a catch level a t least two or three times the current catch in PNG wa ters ( Cope s 198 1 : 15 ) .
Tuna exports from Papua New Guinea , or those tuna caught by res ident companies , amount to 3 per cent of the country ' s expor ts and less than ha lf the catch in P apua New Guinea waters . They rank as the c ountry ' s f i f th mos t impor tant expor t . All the catch f r om Papua New Guinea waters c ould b e taken by res ident companies . Given this , and the p os sibi lity of increas ing the t o ta l catch threefold , tuna expor t s can con tr ibute great ly to the Papua New Guinea ec onomy : if a l l the p ot en tial were to be realized , whi le other exports s tayed r oughly constan t , raw tuna exports would be over 15 per cent of tota l Papua New Guinea expor t s . I f the tuna were to be processed in Papua New Guinea ( dried or canned ) the c ontr ibu tion to expor t s would be gr eater .
( a ) St ructur e of the current industry . Papua New Guinea has good baiting areas c l o se to t he migration paths of the skipj ack . Two f or eign c omp anies s t arted pole-and-line f ishing in 197 0 , t he number peaked at f our during t he 197 0s , t hen reduced t o two again in 1 97 9 . Those remaining were the American owned Star-Ki st and the Japanese owned New Br itain F ishing Industries (NBFI ) .

92
The two companies have shore-side in stallat ions to supply their ships with ice and general servic es and in s ome cases hold the catch . Mos t of the catch , however , is s tored on mother .ship s ( six were op erat ing in Papua New Guinea in 1 9 8 1 ) whi ch accompany the fleet of pole-and- line vessels ( for ty-e ight operating in 1981) and are transhipped to an expor t ve s se l .
St ar-Kist and NBF I ceased f i shing operat ion s in 1 9 8 1 as a resu l t of a combinat ion of d epressed f i sh prices and the corporate plan s (main ly the ability t o catch suf fic ient f i sh elsewhere ) of the parent comp anies . S trongly inf luencing the dec ision of S tar-Kis t was the il l-wi l l created a f ter the c ompany ' s dec i s ion not to proceed with the · c ons truc t ion of a tuna cannery ( see be low) .
Domestic fi shing operati ons rec ommenced in early 1984 when agreemen t was reached wi th the Japanese company Okinawa Kaigai Fisher ies Co. Ltd . This company wi ll reopen the Katsuobushi ( smoked f ish) p lant whi ch ope rated dur ing 1 9 7 4 - 7 9 and wh ich has been the on ly tuna processing p lant in Papua New Guinea emp loying f if ty peop le .
Ves sel s b ased in Papua New Guinea sell the ir frozen raw f ish to p arent c ompanies . In an a t temp t to c ombat trans fer pricing the government establi shed the Fish Marke ting Corp oration ( FMC ) . This has the right , under s tatute , to purchase all exportab le marine produc ts on a r ight-of-fir s t-refusal bas i s . I f the FMC no tices low transfer pr i ces i t can pur chase the pr oduc t and resell it ( Cop es 198 1 : 4 3 ) . This mechanism is potent ially a good -solut ion . It s pract ical success has f luctuated within Papua New Guinea , d epend ing on the expertise of i t s staf f and the resources made avail able t o t hem .
The non-resident tuna fi shing operations are mainly Japane se long-line f lee t s taking fish from deeper waters and aiming at a special ized marke t in Jap an . In re cent years many purse-seine vessels have also been f i shing in Papua New Guinea waters ; purseseining has proved more produc tive and ef fic ient than other method s . Since Papua New Guinea dec lared i ts 2 00 mi le extended economic z one in 1 9 7 8 vessels f i shing f or non-res ident companies have had to pay licence fees to the Papua New Guinea Government in lieu of export tax . There have been many bit ter d isputes be tween the government and various American and Japanese b oat-owner group s about these fees , leading i n some years to very lit t le li censed f ishing in Papua New Guinea ' s 2 00 mile z one . The government is never sure how many ves sels f i sh i l legally : s ome surve il lance is carried out , but c omprehensive policing of the waters is beyond the na tion ' s capac ity . Licence fees repre sent the only re turn to Papua New Guinea f rom fish taken by non-res ident company controlled vessels .
9 3
The government has been trying to encourage long-l ine and purse-seine ve ssels to base themse lves in P apua New Guinea . The a t trac tions to the catching ve s sels should be large , avoid ing long trips to market and fue l cos t s . Thi s is particularly imp or tant f or the smaller long- line vessels . The government has , however , had no success .
The p otent ial advantages t o Papua New Guinea are large : there are va lue added gains from supp lying the ve ssels , free z ing and handl ing the catch and , mos t important ly , proce s s ing i t . The longl ine f ish can be p roce ssed int o spe c iali zed produc t s , katsuobushi and sashimi , whi le pur se-seine and p ole-and-line caught tuna can be loined or canned .
Papua New Guinea has been a t the forefront of attemp t s to establish a regional organization that would control a l l the tuna s t ocks in the southwes t Paci f ic . The aim has been to negotiate as one , rathe r than have the is land nat ions compe t ing for the at tention of the f oreign f i shing f leets who can catch the s ame f i sh in the waters of many nation s ( a lthough Papua New Guinea is perhap s better p laced than mos t ) . Regional cooperat ion is a lways d i ff icul t , however , as i t mus t imp inge on the sovereign ty of ind ividual state s . Compounding the prob lem are the areas o f high seas that separate the extended economic zones o f some count r ies . Given this , for each country greater importance attaches to quickly having the larges t number of f i sh ing ves sels based in the ir waters .
( b ) A tuna c annery . One way t o achieve this and other benef i t s i s to encourage the estab l ishment of a tuna c annery in the country , ' . . . the local resource app ears wel l in excess of the s iz e required t o sus t ain product ion of a c anning p lant of viable capac ity ' ( Copes 1 98 1 : 17 ) . Such an in st allat i on could be the f ocus of an enlarged local ly based f leet ; it would d i rectly employ ar ound 3 00 people in t he proc e s s ing fac ility alone ; it would add to t he d evelopment of industrial and admin i strat ive skills wi thin the country ; and it would provid e an inexp en sive subst itute f or current ly import ed c anned f ish . Papua New Guinea import s about 2 0 , 000 t onnes of c anned f ish , mainly mackere l . Being non-perishabl e it c an be hand led eas i ly by s imple marke t ing method s t hroughout the c oun try . From a tuna process ing f ac i lity only the white meat c an b e exported to t he very particular Uni ted States ' market . The d arker , no less nut r i t i ous meat becomes a byp roduct which could cheap ly but prof it ably be mad e avai lable locally . Import ed c anned mackerel contains much d ark meat so no problems of c on sumer accept ance should ari s e .
In 1 9 7 7 S tar-Ki s t , one of the three lar ge s t Uni ted S tates tuna packer s , submi t ted a proposal t o the Papua New Guinea Government to es tab lish a tuna cannery in P apua New Guinea . The proposal involved very limi ted f inancial exposure for S tar -Ki s t , who submi t ted fairly old tuna ves sels as the ir equity . The prop osal was c omprehens ive , however . I t was s tud ied in detail by the P apua

94
New Guinea Governmen t and the Internat ional Finance Corpora t i on ( I FC) , the c onunercial arm of the Wor ld Bank , and f ound t o b e viab le and of net benef i t to the country . S t ar-Ki s t and the P apua New Guinea Government were to each hold 40 per cent of the shares , wi th 20 per cent hold by the I FC : the IFC was a lso responsible f or a l l loan f inance which would be free from the need f or shareholder guarant ees .
The proj ect was negotiated over three to f our years . The IFC submi t ted the p r oj ec t and i t s f inancing to i t s b oard on a number of occas ions on ly to see dead lines exp ire as the deal could not be c onc luded . Whi le the reasons f or this could be laid a t the d o o r of each one of the par ties a t d i f ferent t imes , the main prob lem was with the government . The proj e c t never became a su fficien tly high priority to receive the ful l unders t and ing and backing of senior politicians and pub lic servant s . Thi s allowed various ind ividua ls cont inua lly to reopen d ifferent i s sues when they should have been set t led , caus ing c onsiderab le anxie ty within S tar-Ki st and the IFC .
The government originally ( in 1 9 7 7 ) d irec ted tha t the c annery be loca ted at Manus , at the t ime perhap s the second-bes t s i te in the c ountry . Kavieng , in New Ireland Prov ince , had the bes t bai t ing ground s and pole -and-line f ishing record . At Manus , however , the proj ect c ould utilize redundant de fence fac i li t ies , wou ld be quicker and cheap er to develop and c ould prov id e access t o b e t ter pur se-seine f ishing , wi th the hope of making the cannery the f ocus of an enlarged locally based f lee t .
Though a previou s deal had been reached wi th senior defence force personne l on the use o f Manus facilit i es , a change of p ersonne l in FY1 9 7 8 / 7 9 led to accusat ions that the proj ect would c ompromi se na tional secur i ty . Much more damaging was the role p layed by some na tiona l politi cians who expres sed repeated concern over the soc ial a spect s of the pr oj ec t . In p ar t icular , fears were expres sed ab ou t the mora l danger t o which women of Manus would be exposed when the fishermen came ashore .
The government ' s reac tion t o a l l the se a t tacks was unilatera lly to swi tch the s i te of the proj ect to Kavieng , a move which delighted New I reland off icials and up s e t those f rom the Manus Provincia l Government . Such behavi our unse t t led S tar-Kis t , although the c ompany may wel l have been p leased with the guara nteed acce s s this would give to the bes t bai t ing gr ounds . All the lengthy s i te s tud ies b y S t ar-Ki s t and the governmen t , h owever , and the f inancial p roj e c t ions by the IFC , had to be redone .
Around FY 19 7 9 /8 0 there were also changes in the c omposit ion of Fisheries Div i sion s ta f f . There was much in-fighting wi thin the Div i s ion , a lon g neg lec ted par t of the admin i s tration . Two factions had deve lop ed : those in the a scendency in FY19 7 7 / 7 8 thought the cannery proj ect a key item i n the overa l l fisherie s

9 5
program , whi le the o ther fact ion t ook a critical view of the p r oj ect ( thinking it detrac ted attention and e ff or t f r om villagebased f isher ie s ) .
The time f or the proj ec t had pas t and Star-Kis t ' s corporate at tention was turning elsewhere . The fatal b low was the depres sed tuna p rices of the ear ly 1980s . The i l l-will that had b een created led S tar-Ki s t t o cease pole-and-line fishing operat ions in P apua New Guinea .
( c ) Recent moves t o estab lish a tuna cann ery . The establ ishment of a tuna cannery remains t he main compon en t of Papua New Gu inea ' s d evelopment p lans for the f ish ing sec t or . The government ' s poor handling of the Star -Ki st proj ect d id not reflect und erlying gen eral antagon i sm t o the proj ec t , j ust t he poten t ial con f lict between perceived nat ional and provincial in tere s t s , and b e tween b oth tiers of governmen t and local communi ties , a l l wi th opp or tunit ie s for political or other gain , that mus t be reconc i led i f any maj or p roj ec t is to proceed .
Ev idence for t hi s comes with the governmen t ' s at temp t to e s tabl ish a tuna cannery in 198 3 , the result o f general frus tration with the p as t failure . A cons or tium of I t alian companies offered management assis tance t o es tab lish a cannery and f i shing fleet , and var ious members of the government were extreme ly enthusias tic . The proj e c t was well advanced in terms of political c ommi tmen t and pub l i c awarene s s b ef ore previously unanswered ques t ions on marke t ing , f inanc ing and overall viab ility brought i t to a ha lt . These answers came when the government ob tained an exp er t assessment of the proj ect by an over seas c ompany with no d irect intere s t in the proj ec t . Without thi s , the government would probab ly have repeated the mis takes made in the imp lementation of the Ramu Sugar proj ec t ( see Sec t ion 12) , where no such assessmen t was made .
The government cannot under take the cannery p roj ect without an experienced par tner . The proj ec t needs a comb ina tion of experience , ac cess to techno logy and par t icular ly overseas marke t ing conne c tions . The S tar-Kis t proposal would have seen these e lement s prov ided by a company wi th a s i gni f i cant equi ty int eres t . I t also had the IFC as a p oten t ial watch-dog over transfer pricing and as the prov ider of f inance that needed no government guarantees . P olicy prob lems did not prevent it f rom pr oceeding , nor lack of f inance . The prob lem was s imp ly one of a lack of c lear government obj e c t ives , p lanning and coordinat ion .
14 . Manufac tur ing
The manufac turing sec tor has alternative ly b een describ ed as small and weak , with lit t le s cope f or expansion ( Coop ers and Lyb rand 1983 : 12 ) , and as a sector that rep r esen t s 10 per cent o f

9 6
GDP and formal sec tor emp loymen t and s aw growth of over 1 0 p er cent per annum in real terms between 1 9 7 3 and 1978 (Wor ld B ank 1 9 8 2 : 44 ) . The exp lanat ion of this apparent contradiction lies in the def inition of manufactur ing . The standard ! S I C definit i on , used t o der ive the statistic s , inc ludes as manufacturing the processing of na tural res ources . Sawmi lling and the process ing of tea , cof fee , coc oa and oil palm are theref ore inc luded .
The manufactur ing sector d ivide s int o three main sub-sectors : 22 per cent of value added come s from wood and wood produc t s indus tries ; 4 0 per cent represent s f ood , b everages and tobacco ; and 26 per cent is made up of basic metal indus tries . A lar ge part of f ood , beverages and tobacco con s i s t s of the p r ocessing of coffee , c ocoa , tea and oil palm . Much of the rest o f this sub-sector , p lus the basic metal industries sub-sector , service the local ec onomy and are fundamentally non- tradeable proces s ing op erations : they have enj oyed a high degree of ' natural ' protect ion . Examp les inc lude s of t drinks , biscui ts , bakeries , shee t me tal work , general engineer ing and mo tor vehic le repairs . Such services were in shor t supply around the mid-seventies , par t ly as a result of the uncertaint ies surround ing Independ ence , and much of the rap id growth in t he manuf acturing sec t or can b e at tr ibut ed t o t he catch up .
Manu fact ur ing exports are ins igni f icant . The mos t s triking example of a non-re source related export is recent b eer sales t o California . An unusually high p e r cap ita lo cal consump t ion prov ided a good base f or expansion .
We have alr eady dwelt at length on the sma l l size of the local Papua New Guinea marke t , the d i f f iculties associated wi th acquiring land , lab our and NIDA regis trat ion , and the rela t ively high wages f or unski lled and semi-skil led workers . C ombined wi th the backload ing of ship s that take Papua New Guinea ' s natural resou rces to export marke t s , most t rad eable manuf actured goods can p resen tly be supp lied more cheap ly from overseas than from domes tic production .
Government p olicy for the manufac turing sector has always been confused and a subj ect of great con troversy in Papua New Guinea . The main batt les b etween the ' benef i t s ' and ' pr oduction ' schools have been f ought in thi s area : the evo lut ion of Papua New Guinea ' s fiscal incentives provided an examp le .
The policy debate has b een lit tle c oncerned with the f oreignness of the inves tment . With the excep t ion of the d if f i culties of obtaining NIDA regis trat ion , the p olicy f or foreign inves tors in this sector can b e best understood by a discussion of general sec toral p olicy . Having already discus sed f i scal in centives , a di scus sion of prot ection policy is now required .
9 7
( a ) Manufac tur ing sec t or policy . The re has been a lack of consen su s on t he obj ec t ives f or t he manufacturing sector . Ind ividual p roj e c t s t hat c ame under scrut iny were not large so t here was rarely the same polit ical interest that mining and some natural resource proj ect s could command . The confusion of obj ec t ives largely arose out of a d if ference of view over rural to urban migrat ion , as previou sly d i scussed ( Sect ion S) . Those broad ly belong ing to the ' product ion ' school would argue that people wi ll cont inue t o migrate to t he t owns , b e ing attrac t ed by the ' br ight light s ' , and t hat g iven t he low rate of urban j ob creat ion f r om other sector s s imple arithmet ic suggested t he need f or the manufacturing sector t o t ake j ob creat ion as i t s overrid ing obj ective - almost irrespective of c ost . The ' benef i t s ' school saw only a small role f or the manuf acturing sect or , g iven its perceived comparative advan t age : p o l ic ies should help it serve the rest of the ec onomy , not subtract from it ( t hrough t he cost of sub s id ie s and other forms of assistanc e) .
The proponent s of high growth in the manufacturing sector chose protect ion and , to a lesser extent , the provision of fiscal incentives as the principal ins trumen ts to achieve their end s . Had the p olicy e f f or t been f ocused on overc oming governmen tcreated b ot t le-necks , making adj u s tmen ts to the wage sys tem to suit the manufactur ing sec tor and trying to guide investors through the maze of governmen t p olicy and regulat ion , much more consensus and pr ogress would have b een achieved . We have a lready described the array of b o t t le-necks fac ing inves tors . A coordinated push from all re levant government depar tments and industry gr oup s on the wages fron t mi ght have achieved , for examp le , a wider accep tance of wages t ied t o perf ormance and a lowering of wage s for youth .
Wi th the main policy discus sion in manufactur ing p olicy cen tred on prote c t ion , however , an area of c ons iderab le disagreement within government , the p o licy differences wi thin the sec tor were made to seem exaggerated . Those in favour were of ten frus trated by what t hey saw as a lack of growth . If Papua New Guinea imp orted an item in sign i f icant quant i ties there usua lly exi s ted a rate of protection that would make loca l product ion v iab le . S ince each individual item was inevi tab ly only a small p rop or tion of t otal industry co s t s , the prop onen ts felt that the cos t of protection was sma ll . The c ountry wanted increased employment and pr oduc t ion , and pr otection app eared an as sured way to achieve these .
By the end of the 19 70s the argumen t s f or and against having a fully integrated and f oreign owned cement proj ec t us ing local l imestone were an es tab li shed p ar t of the protection debate . Both s ides were agreed on the basic economic s - the proj ect would doub le the price of cement in P apua New Guinea and , at leas t in its ini t ia l years , cause a net loss of f oreign exchange t o the ec onomy . Those in favour of the p roj ect felt that cemen t manu-
9 8
f ac ture was a vi tal ingredient of a local manu factur ing b ase . I f the ' p ositive ' a t t i tude they hoped the government would show on this project were app lied to other s , then the industrial base of the c ountry would expand , s o would the demand for cemen t , and the proj ec t would eventually be viab le . I t was a mat ter o f s tar t ing somewhere .
In add i tion to the c o s t o f the init ial foreign exchange loss those oppos ing the p r oj ect c ould see this exp er ience being magnified many t ime s over once the protect ion f loodgate was open . The c osts o f such act ion (wi th associated infras tructure and sub sidies) would seriously d ivert funds from developmen t of the rural areas where mos t peop le lived . Even more imp ortantly , cos t s to exp orters would increase on many fron t s so retard ing their gr owth , only to the b enef i t of proj e c t s ult imately con s trained by the small s i z e of the Papua New Guinea market . The growth of the wh ole economy would theref ore suf fer .
We have already s tated that the ' bene f it s ' s chool was lar gely in c on tr ol of mos t aspects of economi c policy dur ing the seven t ies and ear ly eighties . Thi s , and the general app ea l of policies that f avur rural deve lopment in a s oc iety that p laces so much emphas i s on the vil lage , allowed the cement protect ion proposal t o be resisted .
S tated goverrunent pol icy on protection s ince Independence has usua lly been cons is tent and no t r e f lected d isputes s uch as that j us t descr ibed . Succe s s ive governments have said that ine f f icient industr ies will not b e pr otec ted or sub s idized . The Infant Indus try Loan Scheme i s a practical c onsequence of such a policy , as is goverrunen t preference f or s tar t-up assis tance wi th infrastructure rather than assis tance which c ould be re lied on indef init ely . In excep t ional case s where t emp orary impor t b ans were used t o assis t estab lishment of an indus try , t he governmen t ins i s ted o n import par i ty pricing . Mini s ters have changed p ortf olios of ten in the pas t , requests for protect ion have been frequent and the initial app eal of such reque s t s so s tr ong , however , tha t the s ta ted policy has not , and arguab ly c ould not , a lways be adhered to .
A maj or deviat i on from s tated po licy has b een the Ramu S ugar p roj e c t ( s ee Section 1 2 ) . Although a s ugar ban c oup led wi th import par i ty pric ing was negot ia ted , when the proj ect ran int o tr oub le soon af ter produc tion commenced it succe s s fully pressed the government f or fur ther suppor t . By late 1984 sugar prices in Papua New Guinea were three to four t ime s import par ity .
The government ' s res olve ha s generally he ld bett er with c ompanies having higher leve l s of f oreign ownership . In the la te 1 9 7 0s a s teel r olling mil l was es tab lished in P apua New Guinea with 100 per cent f oreign equity . Governmen t o f f i cials could not see how the proj ect c ould b e profitab le g iven the small marke t and

9 9
i ts re liance on impor ted raw mater ials . S ince t he proj ect sponsors reque s ted no pr otect ion or sub s idy , however , i t was allowed to pr oceed . I t was no surp irse that immediately after s tar t-up i t s owner a sked for protecti on , even though a s cep t ical government had sen t a letter at the t ime c ons truct ion c ommenced warning that protection would not s ub sequent ly b e given . The government kep t i ts promise and the factory c lo sed short ly af ter product ion c ommenced . I t i s a memorial to the p erceived uncertainty of the government ' s protect ion policy .
(b) Recen t d evelopment s . In February 1 984 the government issued a White Pap er on Industr ial Development . We have d escr ibed elsewhere t he f iscal inc ent ives this d ocument foreshadowed ( Sect ion 9 ) .
The pap er re c ogni z e s the l imi t s of an imp or t sub s titution p olicy f or an economy such as Pap ua New Guinea and s tresses the b ene f i t s of an expor t orientat ion to indu s trial policy . I t stresses reliance on the p r ivate sector f or growth and the need t o re ly i n p a r t o n f oreign inves tment . Apart from the f is cal incentives it men t ions the work of the GRAC , f oreshadows automatic f i f teen-year NIDA regis trat ion f or f orei gn inves tors in manufactur ing and promises that the newly created Depar tment of Indus trial Deve lopment will act as a ' one s top shop ' for inves tors wishing to approach government (Papua New Guinea 1984) .
I t i s unf or tunate t hat the opp or t unity was not taken to f orge a workable protection p o licy rather than s imply s tating princip les . What was needed was agreement on c lear guidelines f or the grant ing of pr otect ion , wi th perhap s s ome upp er limit on the effective rate of protect ion granted to any industry .
I t i s not surpris ing , therefore that at the t ime of wr i t in g s tr ong moves a r e again b eing made t o ref ormulate t ariff policy , w ith li t t le emphasi s on economic considerat ions , and t o move i t from the Min i s try of Foreign Af fairs t o Industrial Development . Tar i f f p o licy i s seen as a quick way t o increas e p roduc tion and emp loyment in re sp onse t o a worsen ing law and order prob lem . The dangers this att i tude represen t s to t he expor t sector and economic growth are large . Widespread protec ti on for local pr oduc t ion or assemb ly of pre sently imp orted goods c ould , one imagines , adversely and deci s ive ly affect a future tuna cannery or furniture fact ory and many exi s t ing s awmi ll s . In addit ion , much of the government ' s revenue comes from the export sector and thi s would b e significan t ly affec ted .
A maj or potent ial cos t o f the new ly emerging debate on p rotect ion is again i ts ab ility to d iver t attention from the imp lemen tat i on of other policies that would be of c lear b ene f i t to the economy . In this regard it remains to b e seen what pract ical changes occur from the work of the GRAC in relat ion to land , labour and NIDA registration , and whether the Department of Industrial Deve lopment provides an effective ' one s top shop ' .

100
15 . Conclusi ons
In this monograph we have concen trated on analy s i s of Papua New Guinea ' s economic position , the consequent logic o f its deve lopment s t rategy ( includ ing short-term economic policy) and the p lace within tha t s trategy of f oreign inves tment policy in general and specific policy and performance in a numb er of sectors . The sectors chos en for detailed s tudy were mining and p e tr oleum , renewable natural resource s fores try and fishing , and agr icul ture and manufactur ing : the first two received early and intens ive government at tent ion , with a hi gh degree of success (measured in terms of both cap ital inf low and realized national benef i ts ) , whi le the others p r oved much more dif f icult areas in which t o f ormulate clear government ob j ec t ives and policies , and even more dif f icult areas in which , once f ormulated , to carry them ou t .
In s ome respect s i t may b e easier t o f ormulate policy and obj ec tives in the mining and petroleum s ect ors : ind ividual proj ects are more cap ital intensive , comp lex and b ring lar ger b ene f i t s t o the ec onomy . However the s ame d e f e c t s in p olicy and performance t hat a f fec ted o ther sectors in Papua New Guinea have appeared in many o ther countr ies ' mining and petroleum sectors - and f ishe ries and manufac turing are less land intensive than minera ls ventures , an impor tan t d i f ference in Papua New Guinea . Mining and p e troleum policy may appear easier in Papua New Guinea b ecaus e it has b een succes s fu l .
The enormous diff erence in the p erformance o f the various sec t or s is not , t o any signif icant extent , because o f their inherent phys ical d i ff erences . In the f ores try , f i shing , manufacturing and agriculture sector s we saw confusion of obj ectives , insuf fic ient p o li t ical attent ion t o and public debate of policy , wh ich was then poorly adminis tered . The extreme ly p oor performance in these sectors may promp t obs ervers to conc lude that f oreign inves tmen t cannot brin g net b enef i ts : tha t government s should consider nationalizing exis t ing inves tments and s tar t ing maj or new ventures with s igni f icant levels of nat iona l equity . The p er f ormance in the mineral and pe troleum sect ors indicates that such a c onclusion would b e incorrect .
In mining and p etroleum we have seen the imp ortan ce ( and bene f i t s ) of linking sectoral s trategies f or f oreign inve s tment with a c learly ar t iculated , and real i s tic deve lopmen t s trategy . The s e lect ion o f a s ingle overriding obj ec t ive , revenue maximizat ion , and an innovat ive approach t o i t s achievement , has c learly s imp lified the long- term conduc t of minerals policy in Papua New Guinea . The potentially powerful negotiat ing posit ion of internationa l companies has been succes s fully chal lenged , and turned to nat ional advantage , by combinin g c lear ob j ec t ives with underlying economic s tr ength ( the role of macroeconomic policy) , and s ound organi zat ion o f government ne gotiating teams , up to the

101
p oli tical leve l thr ough to j udicious use of outsi de f inancial and te chnical adviser s .
The minerals experience in Papua New Guinea perhap s reverses some earlier p recon cept ions ab out app ropr iate ways to secure maximum nationa l b ene f it from the operations of mul t inational c ompanies . A c ompany with maj or equity at risk , and thus a s trong int eres t in proj e c t prof itab il i ty , is l ikely b oth to p erf orm more efficient ly and to p lace greater va lue on the long- term s tab ili ty of i t s relat ions with the hos t c ountry than i s a minor shareholder , management con trac tor or mere supp lier of techno logy . We have seen how the s tate can maximize i t s re turn by unders tanding inves tor ob j ec t ives and designing f iscal and s tate p ar t i c ip ation terms to mee t the inves tor ' s minimum needs - no le ss , but no mor e . The s tate has a c lear interes t i n organ i z ing incent ives s o that a min ing inves tor wil l delineate a target oreb ody , or commi t to a maj or inves tmen t s ooner rather than later , and will eventually work the res ource wi th minimum was te o f low- grade material .
S tate equity owners hip is not e s sential t o meet revenue , f oreign exchange , or even l imit ed control ob j e c t ives ; indeed , i t may o f ten involve unnecessary r i sk exp osure f or the s tate and func tion , in effect , as a concess ion to the f oreign inves tor .
The va lue of sound , uncorrup t and reas onab ly wel l- organi zed admini s trat ion wi ll be evident . When this is c omb ined with pr ogress towards equi tab le and s e lf-adj us t ing fiscal terms then renegot iat ions ( such as B ougainville in 19 7 4 ) to achieve perceived fairness do no t neces sari ly deter other poten t ial inves tor s . Indeed , a case could b e made that the opp os i t e is t rue .
I t has b een sugges ted that the high p riority given to mineral proj ects has detracted ' . . • from the badly needed analysis and scru t iny of the f ores try and , to a c ons iderab le extent , agr icultura l sector s ' ( Fraser 19 8 1 : 33 ) . I t was appropriate f or the Papua New Guinea Governmen t to concen trate on the mining and p etroleum sectors and set t le obj ectives , p o licy and maj or imp lemen tat ion is sue s before t urning seriously to other sec tors : the relat ive rewards are much greater and , at a t ime when there were many pr�s s ing pr iorit ies , i t would not have b een wise for the government t o spread i tself too thinly . In the 1980s the need for a shi f t of emphasis has b e come clear , but such a shif t i s on ly pos s ib le because of previous success with minerals policy .
The government has very sensib ly not j us t deal t e f fectively with issues as they aro se in mining and p etr oleum , but has revised the Mining and Petroleum Ac ts , enacted s tandard tax provis ions f or these sectors , and in tegrated a l l this with mode l agreement s . The pa ckage of documents can be passed to in teres ted inves t ors and agreemen ts s i gned with l i t t le delay . The enormous concentrat ion of e f f or t that was required from 1974-80 shou l d not be required again , al though ser iou s imp lementat ion prob lems will always occur

102
(at the t ime of wri t ing protracted negot iat ions were oc curring in rela tion to S tage 2 of the Ok Ted i proj e ct ) . Now that the mac roeconomic cr i s i s (ass ociated with the 1 9 7 9-80 oil price rise , the f a ll in B CL output and the general col lap s e o f commodity p r ices) has b een con tained , the government can begin the attemp t to realize the enormous potential for increasing income earning opp or tuni t i es in par t icular ly the agr i culture and f ores try sectors . The succes s fu l imp lementat ion of sound f oreign inves tment policies wi ll have a large role to p lay .
The proper allocation o f s carce governmental promot i on and negot iat ing e f fo r t , however , is a central i s sue in foreign inves t ment p olicy and , indeed , i n development s trat egy a s a whole . As we have seen f rom both the p o s i t ive and negative examp le s , the requiremen t in terms of polit ical at ten t ion , technical and p o licy analys i s skil ls , and negotiat ing e f f or t for succe s s ful development and imp lemen tat ion of sect oral p olicy is very large . Taking all potent ial sec tors of foreign inve s tmen t together i t grea t ly exceeds the resources avai lab le t o a country such as Papua New Guinea . A coheren t view of deve lopment s trategy and potential bene f i t s is there f ore neces sary so that thi s allocat ion can b e made . A reliance on private inve s tment , market-determined price s i gnals , and compara t ive advantage does not ab s o lve a government from the need to work ou t how to appr oach and respond to privat e investor s .
Our analys i s sugge s t s the following lessons for es t ab l i shing and conducting foreign inve s tment policy in Papua New Guinea and , indeed , in developing countries generally .
( i ) The adminis t ra tion o f policy and legis lation for each na tura l res ource should res t c lear ly wi th one central b ody not a mul t ip lic ity of agenc ies ( this i s not current ly the case with fores t resources ) . That b ody should take resp ons ib ility f or organizing the interdepar tmen ta l ne got iat ing teams that are needed for specific proj e ct s , and f or in�orporating prov inc ial in tere s t s .
( ii) Policy formu la t ion needs h igh level polit ical invo lvemen t , access to the bes t availab le t echnical advice , even i f i t mus t b e hired overseas , and a campaign of pub lic awareness ( the mining and petroleum sectors con tras t with all o ther sec tors ) .
( ii i ) The smalles t poss ib le numb er of obj ec t ives mus t be f ormulated and s ta ted for each sec tor , with trade-of fs b etween mul t ip le obj ec t ives c l ear ly s tated ( the mining sector contra s t s par ticular ly with the agricul t ural sector ) .
( iv) S ec toral p olicies mus t b e t ar geted at real constraints ( the t ime spent debating f i scal incentives f or the

manufactur ing sec tor could have b een bet ter spent ) and mus t be l inked f i rmly and explicitly with the na tion ' s overall deve lopment s trategy ( as was the case wi th mining) .
103
(v) The governmen t s hould unders tand the comparative economics of d i f f erent s tages of produc tion in P apua New Guinea relative to internat ional comp et i t ive ventures . Such a quant ification mus t discount f or any inves t or uncertainty ( e . g . unfami liar spec ies in f ore s try , land t enure in agricul ture) . Thi s know ledge wil l enab le the government to appreciate mos t inves t ors ' walk-away p os it ions ( such knowledge was gained when formulat ing mining , p e troleum and fores try policy - in the lat ter sector the value of such an exercise was d emons trated but the les sons soon forgotten) .
(vi) Fore i gn inves tors will b e o f mos t use t o the country when they have a direct interes t in p roj ect p ro fi tability ( contras t the Ramu Sugar proj ect with the nat ional b ene f i t s gained fr om B CL) .
(vi i ) Government negotiat ing teams should have clear links with and the full support of sen ior politicians ( f or es try ne gotia t in g teams have of ten b een undermined by p o l i t i ca l interventions out s ide s tated government p o licy ) .
(viii) Countr ies are in a rela t ive ly p oor negotiat ing positi on without underlying macroeconomic s tab i l ity (Papua New Guinea could not have negot iated the Ok Tedi proj ect as s uccess fully had it b een in chronic b alance o f payments d i f f icul t ie s ) .
( ix) Whi le fair agreements mus t b e uphe ld government s are neverthe le s s in a good p os i tion to renegotiate t hose that are s i gn i f i cant ly out o f line wit h world practice (Papua New Guinea has b ene fited great ly from rene go tiat ing the B CL con trac t ) .
( x) Once the e f f or t has succes s fully b een made t o f ormulate and imp lement policy in one sec t or , the lessons should , where appr opriat e , b e enshrined in legis lation and model agreements so that p revious e f f or t does not have t o be dup li cated . Leav ing open one or two carefully chosen areas can cater for differen t proj ect charact er i s t ics ( in mining P apua New Guinea has , w i thin defined l imi t s , left op en the extent o f i ts minori ty equity p os i ti on and any cont r ib ut ion i t may make t o the provis ion o f p roj ect infras tructure) .

104
(xi) Fina lly , inves t o rs should not be encouraged t o feel that off icial policy can b e avoided by one means or another - es tab lished policy and pr ocedures will then be progre ssively undermined ( in mining ne got iations the Papua New Guinea Government ensured there could be no mi sunders tanding on this issue : investors interes ted in Papua New Guinea ' s timber , however , may we l l feel temp ted t o exp lore unof ficial channe ls) .

Appendix 1 Pub l i shed re serves from mines and maj or gold prosp e c t s in Papua New Guinea
Panguna mine
Reserves at t he end of 1 9 8 3 were about 7 2 0 m tonnes averaging 0 . 4% Cu and 0 . 4 6 gm/ t Au .
Ok Ted i mine
P r oven r e se rv e s of 4 10 m tonnes comp r is in g 34 m tonn e s at 2 . 8 7 gm/ t Au in a sur f icia l cap , underlain by 3 5 % m tonnes grading 0 . 7 % C u , 0 . 6 gm/ t Au and 0 . 0 1 1% Mo wi t h a fur the r 25 m tonnes averaging 1 . 1 7 % Cu , be low tha t again (Min. Ann. Re v . , 1 9 8 3 ) .
Frie d a prosp e c t
Es timate s o f t h e mineralizat ion are : Hor se-Ivaal area 500 m tonnes at 0 . 5 % Cu , 0 . 2 8 gm/ t Au Koki area 260 m tonnes a t 0 . 4% Cu , 0 . 2 3 gm/ t Au (MIM Ann . Rep t . , 1 9 8 1 ) .
Yandera Cu p r osp e c t
Re s e rv e s p r e s ented i n t h e Financia l Review ( 1 9 7 7 ) w e r e 5 4 0 m t onne s a t 0 . 6 5% C u equiv a lent u s in g a 0 . 4% Cu c u t o f f .
Porgera p r o spec t
Res e rves a r e e s t imat e d t o b e i n three p a r t s ( a ) 5 9 m tonne s averaging 3 . 3 gm/ t Au , 14 . 5 gm/ t Ag , ( b ) 16 m t onne s at 6 . 9 gm/ t Au and 9 . 0 gm/ t Ag , ( c ) 1 m tonnes a t 3 5 . 0 gm/ t A u and 5 5 . 0 gm / t Ag . Cu t - o f f 0 . 5 gm/ t Au .
Misima pr osp e c t
Es t imated r e s erve s a r e a t 4 5 m tonne s ave raging 1 . 4 2 gm/ t A u a n d 2 0 . 6 gm/ t Ag .
Wau area
Curr ent r e se rv e s a t Upper Ridges mine are 9 6 0 , 000 tonne s ave ra g ing 2 . 4 gm/ t Au and 7 gm / t Ag w i t h p robable reserves of 6 7 0 , 000 t onnes at 2 . 3 gm/ t Au and 7 gm/ t Ag .
La l oki prosp e c t
3 1 5 , 000 t onne s grad ing 4 . 3% Cu , 1 . 3% Zn , 6 . 4 gm/ t Ag and 3 . 5 gm/ t Au .
Arie pr ospec t
1 6 5 m t onne s gradin g 0 . 3 2 % Cu (Min. Jour . , 7 July 1 9 7 8 ) .
Ladolam pr ospe c t ( Li h i r )
7 5 . 6 rn t onne s a t 3 . 2 5 gm/ t Au .
Not e s : Au Ag Cu gm/ t
gold s i lver copper gram per t onne
S ource s : Rog e r s on , W i l l iamson and Francis ( 1 984 : Tab l e l ) ; B ougainv i l le Copp e r Limi ted ( 1 984 : 1 2 ) and in f orma t i on f rom t he Dep ar tment of Mine r a l s and Ene rgy ,
(.. ,_ Konedobu ( 1 9 8 5 ) .
105

106
Append ix 2 The s tock of foreign inve s tment in P apua New Guinea
A f ormal survey of private overseas inves tment in P apua New Guinea has not been conduc ted s ince 19 7 6 / 7 7 (Papua New Guinea Nat ional S tatis tical Off ice 1 9 7 8 ) . That survey d i s t in guished between ' d irect investment ' on the one hand , and ' p or t f olio inve s tmen t and insti tut ional loans ' . Both were valued at t h e his torical cost of inves tmen ts made or loan s drawn down . Portfolio investment , on an his tor ical cost basis , can be regarded as negligib le : even the larges t e lemen t - the 23 per cent f oreign pub lic shareho ld ing in Bougainville Copper Limited - amount ed only to ab out K2 7 million , and there have since been f ew ins tances o f new sales of shares in Papua New Guinea companies to f oreign p or t f olio inve s t or s . Ac cordingly , we can regard the p or t f olio element as fixed and treat all but d irect inve s tment as ' loans ' .
The 197 6 / 7 7 survey va lues direc t inve s tment at K4 08 mi ll ion ( U S $ 5 14 mi llion at the 1 9 7 7 exchange rate) , and ' loans ' a t Kl43 million ( US$180 mi llion) . I f we app ly to the se s t ocks the Bank of Papua New Guinea ' s rec orded ne t flows of for eign p r ivate inves tment , reinves tmen t and private borrowing from the balance of payments s tatistics ( Tab le A . 11) , we reach a 1983 s t ock of K7 68 mil lion f or direct inves tment and K5 60 mi llion f or ' loans ' . App lying annual US$ /kina exchange rates to these flows , the c orrespond in g dollar f igure s ar e US$ 9 93 million f or d i rec t inves tment and US$ 7 3 1 million for ' loans ' . It mu st not b e forgot t en t hat these are hist orical cost est imat es , net of loan repayment s and d i sinvestment , and bear n o neces sary relat i on t o t he potent ial internat ional market value of the companies or inve stment s conc erned , nor to t he replacement value of the as set s in stalled . Nor does the d irect inve stment f igure ref lect t he value of sharehold ers ' fund s in f ore ign owned compan ies .
In contrast , t he Bank of Papua New Guinea ' s survey of private ext ernal d ebt out stand ing at the end of 1983 found a total of US$859 mill ion , valued at curren t exchange rat e s ( t hat i s , est imated rep ayment cost ) . The Bank of Papua New Gu inea f igures also include ext ernal commerc ial d ebt incurred by g overnment owned compan ies and statutory public ent erprises , wher eas the 197 6 /7 7 survey apparently was rest r ic t ed t o ' privat e en terprises ' . Allowing for t hese c omplication s , the d ebt e s t imat e arr ived at by t he met hod d e scribed appears reasonable . If t hi s is allowed , then an est imat e of about one b illion US d o ll ar s f or the undepreciat ed hist or ical cost of t he s t ock of direct foreign inves tment (ne t of known disinves tment ) al s o seems appropriate . The hi s tori cal cost of the comb ined s tock of deb t outs tand ing and net equity f inanced f oreign inves tment wou ld then s tand in the region o f US $ 1 . 7 b i l lion to US $2 b i llion at the end of 1 983 . Since Ok Tedi ' s fir s t s tage was not quite comp lete at this date , and s inc e S tage 2 inve s tment is due to begin , the t o ta l sum will increase signif icant ly dur ing 1984 and 1985 . To the extent tha t deb t has been rep aid , but ini t ially deb t- f inanced assets remain part of the s t ock of d irect f ore ign investment , the se figures will underva lue the stoc k .

107
Appendix 3 Government of Papua New Gu inea Industr ial In formati on Pamphlet No . 18 prepared for the Papua New GuineaAus tralia Investment Promotion Conf erence , 1 9 7 9
Inves tment incentive s
Papua New Guinea has cons is tently recognized the need f or foreign inve s tment in deve lop ing i t s economic p otentia l . I n prac t ice , Papua New Guinea ' s inves tment p olicy encourages foreign inves tment in a ll business ac t iv i t ie s excep t those reserved exc lusively for na t ional inv olvement . The latter are iden t i f ied as ' reserved ac t iv it ies ' in the Nat iona l Inve s tment Prior i t ie s S chedule (NIP S) and encompass categor ie s of agricul tural production and assoc iated f irs t-s tage proce ssing , in land f ishing , p r imary commodi ty trading , and land transp ort services where Papua New Guineans have the requisite ski l l s and cap ital resources .
Within NIPS guidelines , P apua New Guinea ' s we lcome to f oreign enterpr ises extends to vari ou s non-equi ty arrangements , such as licensing agreements , purcha sing con trac t s , and service agreements involving technical , management and marke t ing services . These alterna t ive forms of in terface b e tween Papua New Guine a and f oreign enterpr ises are in ear ly s tages of deve lopment , but are being act ive ly promoted .
The government s tr ong ly bel ieves that the mos t e f fec t ive way of promoting foreign inves tmen t is the pursuit of macroeconomi c p olic ies that create c onf idence in present and fu ture s tabi li ty . The s trong accent on s tab ilizat ion in both interna l and external f inancial polic ies is deserving of inves tor c onfidence . In part icu lar , Papua New Guinea ' s p olicy framework has avoided the need f or exchange c ontrol res trictions and has es tab li shed the country as a credi twor thy borrower in commerc ial international money marke t s .
Never the less , the government apprecia tes the need f or a program of wide-ranging inves tment incentives that reflec t awareness of cer tain d i sadvantages that Papua New Guinea presents to certain p otent ia l investor s , namely , the small size of the domes tic marke t , and the associ ated high costs of d i s tr ibu tion .
In addi tion t o the general inves tment incent ives l i s ted below , spe c if ic sec tora l policies relat ing t o large s cale inves tment in t he p etr oleum , mining , f ishing and f ores try industries have been or wi ll be emb od ied in legi slat ion and p o licy s tatements , which will be o f extraord inary imp ortance to inve s tment decisions in the se sector s .
The followin g new tax and f inancial inc ent ives , which will be contained in P apua New Guinea ' s 1980 Budget reflect governmen t ' s commitment t o insuring a p os i t ive inves tment c l imat e :

108
1 . Accelerated deprecia t ion
Thi s incentive allows a gr eater c laim f or depreciation in the year of capi tal purchase , and thus means le s s as ses sab le inc ome and less tax paid .
I t i s in tended that this incent ive be made avai lable t o the f o llowing sector s :
manufacturing transport and communication bui ld ing and c onstruction bu s ine s s service ;
f or items of inves tment whi ch have a useful life o f over f ive year s . I t is considered that the retai l , f ishing , f ores try and mining sec t or s do not require such an incentive , while agricultural inve s tmen t can already be written o f f in the year of expend iture . The restriction to inves tment with a life of over five year s i s intended t o d irect the incent ive t owards long- term capi ta l inve stment rather than merely rep lacement of items wi th a shor t life such as mot or vehicles . E ligib le inves tors will be a l lowed to claim 20 p er cen t of the cos t of the inves tment in the year of purchase as an addi t ional allowance over wha t would otherwi se be allowed . For the r emaining li f e of the asset norma l depreciation would app ly on the res idual va lue of the cap ital equipment .
The f o llowing example s e t s out the effect of the p roposals for a machine pur chased cos t in g KlOO with a l if e of ten years .
Year
S traight l ine depr e c i a t i on
1
- without scheme 1 0
- w i t h sc heme 3 0
Reduc ing balance depreciat ion
- with scheme 15
- w i t hout s cheme 35
2 3 4 5 6 8 9 10
10 10 10 10 1 0 10 1 0 1 0 1 0
10 10 1 0 1 0 10 10 10 0 0
1 2 . 7 5 10 . 8 4 9 . 2 1 7 . 8 3 6 . 66 5 . 66 4 . 8 1 4 . 09 3 . 4 7
9 . 7 5 8 . 2 9 7 . 04 5 . 9 9 5 . 09 4 . 33 3 . 5 8 3 . 12 2 . 66
Thus , the s cheme allows 100 per cent depreciation but on an accelerated b as i s , thus p rovid in g earlier recovery of inve s tment costs which i s a maj or c ons iderat ion in inves tment decisions .
2 . Training scheme
This s cheme will allow a 200 per cent deduc t ion f rom assessable income or wages paid to apprentices regis tered with the Apprent iceship Board of Papua New Guinea .

109
The purpose i s to encourage emp loyers to hire apprentices to build up the industr ial and c ommercial skil ls of Papua New Guineans so that their c on tr ibution to the ec onomy can increase over t ime . As government asks emp loyers to incur c osts in training , it is appr opria te f or the government to offset s ome of these costs thr ough i t s tax p olicies .
3 . Provis ion o f inf ras truc ture for general and decen tralized indus trie s
The government will prov ide the nece ssary infrastruc ture , inc luding buildings , to inve s t or s for new indus t r ia l proj ects in re turn f or a nego t iated user charge payab le annual ly over the life of the proj ec t .
General user charge
The general user charge wi ll be designed to yie ld the governmen t a return on it s cap i tal and as such wi l l not be d irec t ly r elated t o the use made of the cap i tal goods provided . The rate charged will be a commerc ia l rate reflec ting :
the governmen t ' s risk exp osure ; the expected re turn of the inves tor on his equity ; the a lterna t ive uses to which government fund s can
be app l i ed .
Repayment of the user charge will rank b ehind senior proj ect d eb t and will b e secured only by the proj e c t i tself , and not by its shareholders or parent c ompany . In the event of default , however , t it le to the infrastructure will revert to the governmen t .
The advantage o f this scheme t o a p otent ial inves tor i s a lowering of ' fr on t-end r i sk ' ( or initial f inancial exposure) as the inves tor will need less cap ital to s tar t the proj ec t .
The government will provide f inanc ing to build infras truc ture but wi ll no t c ons truc t the proj ec t . Eligib ility extends to all inves t or s f or all typ es o f industrie s .
Decentral ization user charge
The govermnent will provide an additional infras truc turerelated incent ive to industries locating out s ide urban iz ed areas as Port Moresby , Lae and Arawa-Kie ta-Panguna . Thus , on a case by case basis the government may negotiate a lower user charge con s i dering b oth the general factors s tated ab ove and also the remoteness of the area cho sen for location and the inf luence provision of inf rastruc ture would have on the locat ion decision . In the case of infrastructure prov ided in remo te loca t ions , the government would b e

1 10
prepar ed to negotiate a user char ge close t o i t s mar ginal ( commerc ial) c os t of b orrowing .
This lower ( decentralization) user charge would not app ly to indus trie s involved in export o f raw materials or where locat ion i s dependent on nearness to an e s sen tial natural resource ( e . g . f ish , t imber , agricultural land , water , e tc . ) .
Under b oth the general and decentra lizat ion element s of this s cheme the minimum proj e c t si ze will genera lly be K300 , 000 though in spec ial pri or i ty cases smaller inves tments could b e considered . I t is anticipated that app lications wi ll b e received by the Minister o f Finance during 1 9 8 0 .
Other tax and f inancial incent ives
In add it ion to the ab ove , there are many other s chemes and p olic ies which enc ourage favourab le inves tmen t dec isions .
1 . Export Incent ive S cheme ( EI S ) f or manufac tured goods
The logic b ehind expor t assis tanc e as an inve s tment incentive is tha t inve s tment in imp or t subs titut ion indus tries will b e accelerated i f access t o expor t market s i s also enc ouraged . Thus the scheme is designed to improve the sale s prospects of manufac tured exports by reducing assoc iated tax liab ilit ies , and so expand the market po tent ial .
EI S exemp ts from company tax 5 0 per cent of the prof i t s related to the growth in exp or t sale s in the current year over the average value of export sales f or the p receding three years . Thus , export sales growth i s rewarded by reduced taxat ion . Where c omp anies in any year make a profit on expor t s but a loss on overall op erat ions , b enef i t s ac cruing under the s cheme can be carr ied f orward f or two year s af ter they are earned .
Certain product s which are present ly manufac tured in Papua New Guinea or will be manufac tured in the near future have been approved f or inclu s ion in EIS .
Ac t ivated carbon Art ifac t s Beverages ready
for consumption Biscuit s , snack
food Canned , lo ined and
smoked f i sh Canned f ruit and
vegetables Cement and
concrete product s
Chops ticks Cigarettes Clothing and
manufactured text iles
Confect ionary Dairy Products Dry cell batteries Electrical appliances Essent ial o i l s /
oleore s ins Fabricated product s Fishing net s
Flexib le packaging Foam produc t s Founded and
manufactured metal products
Glas s produc t s Hand tools Indus trial and
medical gases Jewellery L ive s tock feeds Mat ches Motor vehicles
Paints Paper p rodu ct s Plas t i c produc t s Processed and
c anne d meat products
S awn t imb er , mouldings , plywood and laminated product s
Ship and boat building and repairing
Soap Treated and
proces se d crocodile skins
Wood pulp Wooden furniture
component s and doors
However, any investor may request the Min i s ter f or Finance to add new produc t s t o the list .
2 . Infant Indus try Loan ( I IL) Scheme
111
Government will consider a s tandby loan facility up on proj ect c ommencement f or firms that can identify possib le f inancial p rob lems in the ear ly year s of the pr oj ect . Such problems wou ld usually be those identif ied when seeking commercial f inanc e and might inc lud e l ow deb t cover ratios in early s tages , uncer tain capab ility to service deb t or in certain pr ior i ty cases , a concern abou t avai lab ility of fund s to mee t cost overruns .
In such s i tua t ions the government may pr ovide funds to mee t the specif ied cont ingency . Such a s tandby loan , being unsecured , would no t af fect the rais ing of cap i tal or deb t f inancing on commercial terms and would greatly enhance the attrac t ivene s s of a proj ec t t o commerc ial lender s .
However , I IL i s not intended as a sub s t i tu te f or normal c ommercial loans and would ordinar i ly contain the following provi sions :
repayment a s soon as possib le wi thou t rescheduling any other d eb t s ;
no div idends dec lared while the infant indus try loan is ou t stand ing ;
interest rate marginally higher than o ther commercial proj ect funds availab le .
The aim of the scheme therefore i s t o fac ilitate the commerc ial fund ing of prior i ty , higher r i sk commer cial p roj ec ts with high prof i t p otentia l . Any proj ec t receiv ing an IIL mus t be proj ec ted a s prof itable over i ts operational life as this s cheme will not as sure prof i tabi l i ty but s imply balance ear ly losses with later prof i ts .

112
The scheme , although adminis tered with f lexib i l i ty , wi l l f ollow these gu idelines :
the term of the loan wi ll be the f ir s t f our years of commer c ial produc t ion ;
the amount of the loan f ac i l i ty wi ll not exceed 15 per cent of total capital fund s required t o implement the p roj ect .
3 . Feas ibili ty Stud ie s Con tr ibu t ion Scheme
The government appreciates that for many potent ial inves t or s , there is very little inf ormation avai lab le on the p roj e c t s they wi sh t o promote . In rec ogni tion of the high costs and as sociated high risk in ob taining such information in advance of a proj ec t go-ahead decis ion , the government has ini t iated the Feas ib ility S tud ies Contr ibut ion S cheme .
The government wi ll f inanc e 5 0 per cent or Kl00 , 000 , whichever is the le s ser , of the cost of the f easib ility s tudy , in return f or an und er taking tha t should the ini t ial f irm decide not t o pr oceed , the government has access to all information gained from the s tudy so as to attrac t another inve s t or .
If the inve stor proceed s wi th the proj ec t , or i f a later inves tor goe s ahead af ter ' sub s tantia lly ' us ing the ori ginal s tudy , the government may acq uire equi ty in the company equal t o its f inanc ia l c on tribution or the amount may be regarded as a loan to be repaid at commer c ial rates a f ter proj ect commencement .
To be el igible f or the scheme a pr oj ec t /indus try mus t satisfy the following cr i teria :
(a) i t has ei ther ' prior i ty ' or ' open ' s tatus , in the National Investment Prior i ties S chedule ; and
(b) it is one where the government desires f easib ility inf ormation .
A list of qualifying indus tries f ollows . However , an inves tor who is c on sidering the p otent ial f or manufac turing a produc t not appear ing on this li s t i s invited t o app ly to the Execut ive Dir ec tor of NIDA .

Act ivated c arbon Agricu ltural
hand tools Bandages , p lasters
and s anitary napkins Basic t ran sport Vehicle and
component assembly
Bol t s and nut s ( in cluding screws and r ive t s )
Cocoa proces s ing Conf ect ionary Domes t ic elect r ical
appliances Dry c e ll bat t eries E lectric l ight
f i t t ings Electric wire and
c ab le manufactur e
4 . No imp on : dut ies
Es sen tial o i l s / o leores in s ( growing o f c rops and proce s s ing)
Fish in g net and l ine manufac tures
Fue l a lcohol from b iomass ( such a s cas sav a , t imber , sago , sugarcane and nipa p alm)
Glas sware and sheet glas s
In stant co f fee Inj ect ion mou lded
plas t i c s Pharmaceut ical goods Preserving and
c anning of f ruit s and vegetab le s
113
Rubber goods S econdary bat t er ie�
( accumulators ) Ship repair and
boat building Solar heaters Spices growing
and proces s ing S tat ionery
goods Towels , terry
towel ling and o ther t extiles
Tradesman ' s tools ( s crewdrivers , hammers , saws , p incer s , e tc . )
Other than a gene ral impor t levy of 2� per c ent on all goods , there are no dut ies on imp or ted cap i ta l goods . Inve s tors can also apply f or exemp t ion from the generally low rates of duty in raw materia l s i f the latter are signi ficant to proj ect op erat ions .
5 . Government equi ty participation
As a matter of policy , the government does not usually ins i s t on taking an equi ty posi tion i n new proj ec ts . I t bel ieves tha t adequate f inanc ial returns to the na t ion from a pro j e c t can be secured b y a n appropr iate f i scal regime . I f des ired by the pr omo ting inve s tor , however , the government will c onsider taking an equity p osit ion to reflect i t s commi tment to that proj ec t .
6 . Pr otec tionist p olicies
Papua New Guinea is wil ling to protect cer tain new industries by banning the import of a good to be pr oduced in Papua New Guinea for a limi ted per iod . This is done only i f such protection is e s sential f or market penetrat ion and the recip ient agrees to submi t t o pr ice control on the basis of import parity pr ic ing . Tariff protect ion can also be granted , but

114
this incentive is used spar ingly as the g overnmen t prefers more visib le means of protec t ion where this is j udged to be neces sary .

Statist ical appendix
Tab les Al-A6 Gross domestic product 1 1 7- 2 2
Tables A7-A9 Income , s avings and inves tment 1 2 3-5
Tab les Al0-Al2 Balance of payment s 126-8
Tab les A1 3-Al 7 Forei gn investment f lows 129-33
Tab le s Al8-A20 Pub l i c f inan ce 134- 7
Tab les A21-A2 3 Export s 1 38-40
115

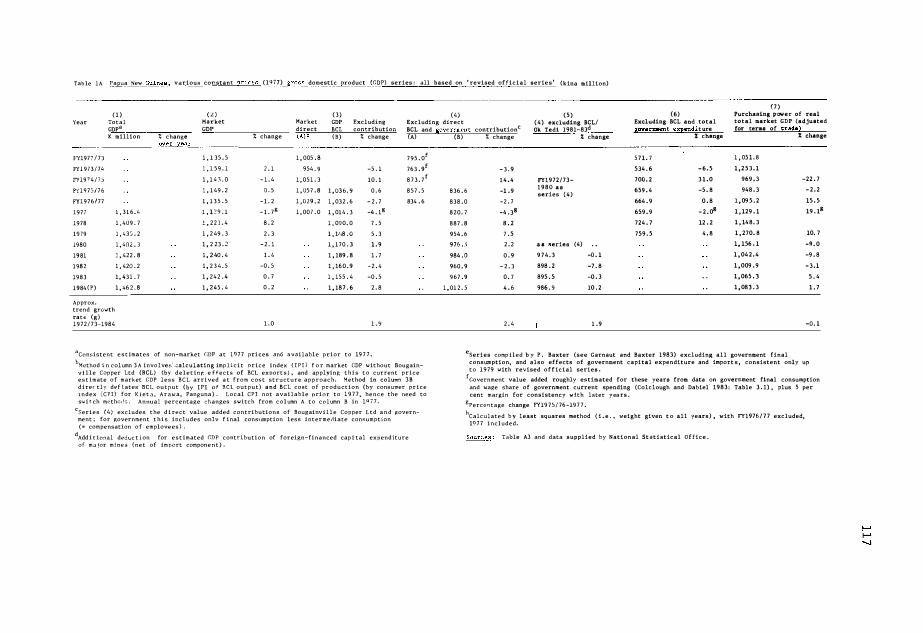
Tab le lA y_�a New Guinea, various constant prices ( 19 7 7 ) grcss domestic nroduct (GDP) series : all based on ' revised official serie s ' (kina million)
( 7 ) ( 1 ) ( 2 ) (3) (4) ( 5 ) (6) Purchasing power of real
Year Total Market Market GDP Excluding Excluding direct ( 4 ) excluding BCL/ Excluding BCL and total total market GDP (adjusted Ok Tedi 1981-83d GDP a GDP direct BCL contribution BCL and sovernment contributionc sovernm.en t e�endi t ure for terms of trade)
(A)5 % change K million % change % change ( B ) % change (A)
FY197 7 / 7 3 l , 1 35 . 5 1 , 005 . 8 7 95 . 0f
FY1 9 7 3 / 74 1 , 1 5 9 . 1 2 . 1 954 . 9 -5 . 1 763 . 9f
IT197 4 / 7 5 1 , 1 4 3 . 0 - 1 . 4 1 , 05 1 . 3 10 . 1 8 7 3 . 7f
F Y 1 9 7 5 / 7 6 1 , 1 49 . 2 0 . 5 1 , 057 . 8 1 , 03 6 . 9 0 . 6 857 . 5
FY1976/77 1 , 1 3 5 . 5 - 1 . 2 1 ,029 , 2 1 , 032 . 6 - 2 . 7 834 . 6
1977 1 , 3 1 6 . 11 l , 1 2 9 . 1 - 1 . 7S 1 , 00 7 . 0 1 , 014 . 3 -4 . 1s
1978 1 , 409 . 7 l , 2 2 1 . 4 8 . 2 1 , 09 0 . 0 7 . 5
1979 l , 43S . 2 1 , 2 49 . 3 2 . 3 1 , 1118 . o 5 . 3
1980 1 , 402 . 3 1 , 2 23 . 2 - 2 . 1 1 , 170 . 3 1 . 9 1981 ] • 422 . 8 1 , 2 40 . 4 1 . 4 1 , 189 . 8 1 . 7
198 2 1 , 420 . 2 1 , 2 3 4 . 5 -0 . 5 1 , 16 0 . 9 -2 . 4
1983 1 , 431 . 7 1 , 242 . 4 0 . 7 1 , 155 . 4 -0 . 5
1984 ( P) 1 , 46 2 . 8 1 , 245 . 4 0 . 2 1 , 18 7 . 6 2 . 8
Approx. trend growth rate (g) 1972/73-1984 1 . 0 1 .9
aConsistent e s t imates of non-market C.DP a t 1977 pri ces and available prior t o 19 7 7 . 1
Method i n column 3 A involves' .:alculating imp l ic i t p r i c e index (IPI ) f o r market GDP without Bougainv i ll e Copper Ltd (BCL) (by d e l e t inr; e f fects of BCL export s ) , and applying t h i s t o current p r i c e e s t imate o f market GDP l e s s B C L arrived a t f r o m cost s t r u c t u r e a p p r o a c h . Method in column 3B d i rec:tly def lates BCL o u t p u t (by IPI of B C L o u t p u t ) and B C L cost o f p r o d u c t i o n (by consumer p r i c e i n d e x ( C P I ) for K i e t a , A r a w a , Panguna ) . L o c a l CPI not a v a i l a b l e prior t o 1 9 7 7 , h e n c e the need to swi t ch methods . Annual percentage changes switch from c o l umn A t o c o l umn B in l Q / 7 .
cSeries (4) excludes the d i re c t value added contributions o f Bougainv i l l e Copper L t d a n d �overnment ; for government t h i s includes onlv f inal consumption less intermerliate consumption ( = compensation o f emplovee s ) .
dAdd i t ional dedl;c t i on for e s t imated GDP contribution of foreign-financed cap i tal expenditure of ma.jar mine s (net o f import compone n t ) .
(B) % change % change % change
5 7 1 . 7 1 , 05 1 . 8
- 3 . 9 534 . 6 - 6 . 5 1 , 2 5 3 . 1
1 4 . 4 FY1972/73- 700 . 2 3 1 . 0 969 . 3 -22 . 7
836 . 6 -1 . 9 1 9 8 0 a s series ( 4 ) 659 . 4 -5 . 8 948 . 3 - 2 . 2
838 . 0 -2 . 7 664 . 9 0 . 8 1 , 09 5 . 2 15 . 5
820. 7 -4 . 38 659 . 9 - 2 . 08 1 , 129 . 1 19 . lg
887 . 8 8 . 2 724 . 7 12 . 2 1 , 14 8 . 3
954 . 6 7 . 5 759 . 5 4 . 8 1 , 270. 8 10. 7
976 . 5 2 . 2 a s series (4) . . l, 156 . 1 -9 . 0
984 . 0 0 . 9 9 7 4 . 3 -0 . 1 1 , 04 2 . 4 -9 . 8
960 . 9 - 2 . 3 898 . 2 -7 . 8 1 , 009 . 9 - 3 . 1
967 . 9 o . 7 895 . 5 -0 . 3 1 , 065 . 3 5 . 4
1 , 01 2 . 5 4 . 6 986 . 9 10 . 2 1 , 08 3 . 3 1 . 7
2 . 4 1 . 9 -0 . 1
eSeries comp iled b y P . Baxter (see Garnaut and Baxter 1983) excluding all government final consumption, and also effects of government capital expenditure and import s , consistent only up t o 1979 with revised o f f icial series .
[Government value added roughly estimated for these years from data on government final consumption and wage share of government current spending (Colclough and Dabiel· 1 9 8 3 : Table 3 . 1) , plus 5 per cent margin for consistency wtth later y ea rs .
gPercentage change FY19 75/ 76-19 7 7 . hCalculated b y least squares method ( i . e . , weight given t o all years ) , with FY1976 / 7 7 excluded,
19 7 7 included.
Sourc�: Table A3 and data supplied by National S t a t istical O f fice .

1 able A2 Papua New Guinea - expenditure on Gross Dome s t ic Product at current purchaser s ' value s , ' revised o f f ic ia l series ' FY 1 9 7 2 / 7 3-1984 (kina mi l l ion)
Government Private final Increase Gross f ixed Gross Exports of Less S t atis t i c a l G r o s s domestic product f inal consump tion in s tocks a cap ital dome s t i c goods and Imports of discrepancy a
consump tion e�enditure formation expendi ture services goods and Market
Year expenditure Market Non-market Market Non-market Market Non-market services component Non-market Total
FY19 7 2 / 7 3 228 . 0 27 6 . 5 1 6 1 . 9 1 3 . 1 126 . 6 3 . 2 644 . 2 165 . 1 2 9 0 . 4 308 . 2 626 . 4 165 . 2 7 9 1 . 6
FY 1 9 7 3 / 7 4 2 7 0 . l 299 . 1 158 . 4 - 2 3 . 0 130 . 4 1 . 2 6 7 6 . 6 159 . 6 5 30 . 5 328 . 7 878 . 4 1 5 9 . 6 1 , 038 . 0
FY19 7 4 / 7 5 305 . 4 366 . 5 168 . 6 15 . 8 186 . 5 1 . 4 874 . 2 170 . 0 4 28 . l 485 . 8 8 1 6 . 5 1 7 0 . 0 986 . 5
FY19 7 5 / 7 6 347 . 0 432 . 3 17 5 . 7 2 . 2 1 6 1 . 4 2 . 0 943 . 1 1 7 7 . 7 4 00 . 4 4 7 0 . 9 8 7 2 . 4 1 7 7 . 7 1 ! 050 . 1
FY19 7 6 / 7 7 3 3 2 . 4 4 7 9 . 2 182 . 5 18 . 9 2 2 5 . 1 2 . 2 1 , 055 . 6 184 . 7 54 2 . 9 5 2 8 . 8 1 , 069 . 7 184 . 8 1 , 2 54 . 5
1 9 7 7 3 3 7 . 7 529 . 3 184 . 8 42 . 1 2 3 6 . 8 2 . 5 1 , 145 . 9 187 . 3 584 . 0 6 00 . 8 1 , 129 . 1 187 . 3 1 , 3 16 . 4
1978 353 . 3 5 7 8 . 9 209 . 6 2 7 . 8 265 . 9 2 . 6 1 , 2 2 5 . 9 2 1 2 . 2 5 7 9 . 1 6 2 7 . 5 2 3 . 4 1 , 2 01 . 0 212 . 3 1 , 4 13 . 3
1 9 7 9 3 7 1 . 4 666 . 9 2 2 3 . 7 57 . 1 3 2 3 . 5 2 . 7 1 , 4 18 . 9 2 2 6 . 4 7 4 2 . 5 7 4 4 . 3 -10 . 9 1 , 4 06 . 1 226 . 4 1 , 6 32 . 5
1980 4 1 1 . 2 7 9 1 . 9 2 5 9 . 4 36 . 4 3 9 1 . 3 2 . 9 1 , 6 30 . 8 262 . 3 7 37 . 6 9 10 . 8 -1 1 . 8 1 , 445 . 8 2 6 2 . 3 1 , 7 08 . 1
1981 454 . 4 8 2 1 . 2 28 2 . 9 7 . 4 4 4 7 . 5 3 . 2 1, 730 . 5 286 . 2 6 4 2 . 9 9 87 . 6 9 . 2 : , 395 . 0 286 . 2 1 , 681 . 2
1982 468 . 1 820 . 8 2 9 7 . 1 - 14 . 2 5 7 3 . 3 3 . 4 1 , 84 7 . 9 300 . 5 6 4 4 . 3 1 , 0 5 8 . 2 1 4 . 5 1 , 4 48 . 5 300 . 5 1 , 7 49 . 1
1983 4 7 1 . 3 9 2 6 . 0 319 . 8 - 6 . 2 6 3 2 . 3 3 . 6 2 , 02 3 . 4 3 2 3 . 4 7 7 1 . 2 1 , 1 35 . 4 -13 . 0 l. , 6 46 . 3 323 . 4 1 , 969 . 7
1984 ( P) 508 . 0 1 , 05 9 . 0 3 28 . 4 6 5 . o 485 . 1 3 . 8 2 , 1 1 7 . 1 332 . 2 908 . 0 1 , 202 . o 1 2 . 5 1 , 840 . 6 332 . 2 2 , 1 7 2 . 7
General no t e : For 19 7 8-84 , o f f ic ia l figures provided by the National S t a t i s t i c a l Sources : See general no te ; 1 9 7 8 , National Accounts S t atistic' s , Bul letin 1 7 , Consolid-O f f i c e a r e use d ; e a r l i e r f i gures have b e e n a d j u s t e d for consis tency with the ated Accounts for the Nation , National S t a t i s t i cal O f f i c e , 2 3 November 1983 ; later series in accordance with the recommenda t i ons of Mr Paul Baxter (Garnaut 1 9 7 9 , Bullet in 20 , National S t atistical O f f ice , 16 November 1984 ; 1980-84 ,
and Baxt e r , 1 9 8 3 ; unpublished papers supplied by Mr Baxter and National Bul l e t in 2 2 , Nat ional S t atist ical Of fice , 5 November 1985 . S t a t i s t ic a l O f f ice) . These adjustments are not necessar i ly endorsed by the Papua New Guinea National S tatist ical O f f ice .
I-' I-' 00

Table A3 PaEua New Guinea - exEenditure on Gross Domestic Product at constant 19 77 Eurchasers ' values1 ' revised official series' FY19 7 2 / 7 3-1984 (kina million)
Government Private final Increase Gross fixed Gross Exports less Statistical Gross domestic Eroduct f inal c onsump tion in stocksa capital domes tic of goods Imports on discrepancya Market consump tion ex2endi ture formation exEenditure and goods and component Non-market Total
Year expenditure Market Non-market Market Non-market Market Non-market services services
FY.19 7 2 / 7 3 401 . 4 441. 7 2 1 . 3 215 . 7 1, 080 . 1 546 . 9 491 . 5 1 , 135 . 5
FY.1973/74 394 . 3 423 . 7 -60. 5 204 . 4 961 . 9 67 1 . 5 474 . 3 1 , 159 . 1
FY.1974/75 386 . 6 400 . 5 19 . 8 235 . 2 1 , 042 . 1 7 13 . 5 612 . 6 1 , 143 . 0
FY.19 7 5 /76 385 . 9 462 . 8 2 . 4 1 7 1 . 7 1 , 022 . 8 6 2 3 . 7 497 . 3 1 , 149 . 2
FY19 7 6 / 7 7 337 . 2 492 . 0 19 . 2 232 . 3 1 , 080 . 7 596 . 6 5 41 . 8 1 , 135 . 5
1977 337 . 7 529 . 3 184 . 8 42 . 1 2 36 . 8 2 . 5 1 , 145 . 9 187 . 3 5 84 . 0 600 . 8 1 , 129 . 1 187 . 3 1 , 316 . 4
19 78 343 . 4 542 . 7 185 . 8 27 . 8 257 . 9 2 . 5 1 , 17 1 . 8 188 . 3 639 . 1 613 . 3 23 . 8 1 , 22 1 . 4 188 . 3 1 , 409 . 7
1979 349 . 6 580 . 9 183 . 6 52 . 6 298 . 5 2 . 3 1 , 281. 6 185 . 9 637 . 4 660 . 6 -9 . 1 1 , 249 . 3 186 . 0 1 , 4 35 . 2
1980 337 . 8 6 17 . 3 176 . 8 29 . 2 337 . o 2 . 3 1 , 321 . 3 179 . 1 6 35 . 3 7 2 3 . 5 -9 . 9 1 , 223 . 2 179 . 1 1 , 402 . 3
1981 324 . 8 597 . 0 180 . 1 5 . 2 345 . 5 2 . 3 1 , 27 2 . 5 182 . 4 669 . 6 7 24 . 7 2 3 . 0 1 , 240 . 4 182 . 4 1 , 422 . 8
1982 3 13 . 7 570 . 0 183 . 4 -10 . 5 398 . 4 2 . 3 1 , 271 . 6 185 . 7 6 70 . 5 7 3 2 . 1 -24 . 5 1 , 234 . 5 185 . 7 1 , 4 20 . 2
1983 300 . 4 605 .6 187 . o -4 . 0 412 . 7 2 . 3 1 , 314 . 7 189 . 3 6 82 . 4 744 . 0 -10 . 7 1 , 242 . 4 189 . 3 1, 431 . 7
1984 tP) 304 . 8 644 . 5 185 . o 39 . 2 294 . 7 2 . 4 1 , 244 . 0 1 8 7 . 4 716 . 1 7 33 . 4 -20 . 5 1 , 245 . 4 2 1 7 . 4 1 , 46 2 . 8
Notes and sources : As for Table A2 , except 1980-84 revised from data supplied b y National Statistical Office , June 1985 .

Tab le A4 Im£lici t 12ri ce indices of exp endi ture componen t s of marke t gross domes tic pr oduct ( 1 9 7 7 100) 1--' N 0
Government Private final Gros s fixed Gross Exports Imp orts Gross final consump tion capital domes tic of goods of goods dome s t i c cons ump tion exp endi ture formation expendi ture and and p roduct
Year exp endi ture (market ) (marke t ) (market ) services services (marke t )
FY 19 7 2 /7 3 5 6 . 8 62 . 6 58 . 7 5 9 . 6 5 3 . 1 62 . 7 5 5 . 2
FY 19 7 3 / 7 4 68 . 5 7 0 . 6 63 . 8 70 . 3 7 9 . 0 69 . 3 7 5 . 8
FY1 9 7 4 / 7 5 7 9 . 0 9 1 . 5 7 9 . 3 83 . 9 60 . 0 7 9 . 3 7 1 . 4
FY19 7 5 / 7 6 8 9 . 9 9 3 . 4 94 . 0 9 2 . 2 64 . 2 94 . 7 75 . 9
FY 19 7 6 / 7 7 98 . 6 9 7 . 4 9 6 . 9 9 7 . 7 9 1 . 0 9 7 . 6 94 . 2
19 7 7 100 . 0 100 . 0 100 . 0 100 . 0 100 . 0 100 . 0 100 . 0
19 7 8 102 . 9 106 . 7 103 . 1 104 . 6 9 0 . 6 102 . 3 98 . 3
19 7 9 106 . 2 114 . 8 108 . 4 110 . 7 116 . 5 112 . 7 112 . 6
1980 121 . 7 1 28 . 3 116 . 1 1 2 3 . 4 116 . 1 125 . 9 118 . 2
1 9 8 1 139 . 9 1 3 7 . 6 129 . 5 136 . 0 9 6 . 0 1 36 . 3 1 12 . 5
19 82 149 . 2 144 . 0 143 . 9 145 . 3 9 6 . 1 144 . 5 117 . 3
198 3 156 . 9 15 2 . 9 15 3 . 2 15 3 . 9 113 . 0 15 2 . 6 132 . 5
19 8 4 166 . 8 164 . 3 164 . 6 170 . 2 126 . 8 1 6 3 . 9 147 . 8
S ource : Calculated dire c t ly from Tab les A2 and A3 : curren t price e s t imates divided by cons tant pri ce e s t imates , expressed as percentages .

Tab le AS Cal cula tion of terms of trade e f fect
Marke t GFP Current after TOT p rice Terms of trade factor Terms of adj us tment exports
( 1 - 1 ) trade e f fe c t ( 19 7 7 prices , Year ( k mil lion) (mp xp ) ( k mi llion) k mil lion)
FY19 7 2 / 7 3 290 . 4 -0 . 2883 -83 . 7 1 , 05 1 . 8
FY197 3 / 7 4 5 3 0 . 5 0 . 1 7 7 2 +94 . 0 1 , 25 3 . 1
FY1 9 7 4 / 7 5 428 . 1 -0 . 4056 - 17 3 . 6 9 6 9 . 3
FY19 7 5 / 7 6 400 . 4 -0 . 5017 -200 . 9 948 . 3
FY19 7 6 / 7 7 542 . 9 -0 . 0 7 4 3 -40 . 3 1 , 09 5 . 2
19 7 7 584 . 0 1 , 129 . 1
19 7 8 5 7 9 . 1 - 0 . 1262 - 7 3 . 1 1 , 148 . 3
197 9 74 2 . 5 +0 . 0289 +2 1 . 5 1 , 2 7 0 . 8
1980 7 3 7 . 6 -0 . 06 7 0 -49 . 4 1 , 15 6 . 1
1981 642 . 9 -0 . 3080 -198 . 0 1 , 04 2 . 4
19 8 2 644 . 3 -0 . 3485 -224 . 6 1 , 009 . 9
1983 7 7 1 . 2 -0 . 2296 - 1 7 7 . 1 1 , 0 65 . 3
1984 908 . 0 -0 . 1 7 85 - 16 2 . 1 1 , 0 83 . 3
Note : mp = imp li c i t import price index ; xp = imp licit export pr ice index . ..... N
Source : Calculated fr om Tab le s A2 and A4 . .....

1 2 2
Tab le A 6 Growth rates o f cap i ta l f ormation and export s i n 19 7 7 cons tant prices ( annua l % change)
Gross f ixed cap i tal Exports of goods formation and services
Year (marke t comp onent )
FY19 7 3 / 7 4 - 5 . 2 2 2 . 8
FY 19 7 4 / 7 5 15 . 1 6 . 3
FY19 7 5 / 7 6 - 2 7 . 0 - 12 . 6
FY19 7 6 / 7 7 3 5 . 2 -4 . 3
19 7 7 3 7 . 9 a -6 . 4a
1978 8 . 9 9 . 4
1979 15 . 7 -0 . 3
19 8 0 12 . 9 -0 . 3
19 81 2 . 5 5 . 4
19 82 15 . 3 +-0 . 1
19 83 3 . 6 1 . 8
1984 -28 . 6 4 . 9
Trend annual growth rate 19 7 2 / 7 3- 19 7 7 6 . 6 1 . 2
aFY19 75 / 76-19 7 7 .
Source : Calculated from Tab le A3 .

Table A7 Cost structure o f gross domestic 12roduct and sources of income1 current 12rices 1 ' revised official series ' (kina million)
Com12ensation of em12lo;i:::ees 012erating sur2lus Consumption Net factor Gross Net Net National Free and Non- of fixed Indirect less income national national current dispos-
Year Total PP labour a Other Total Market market capital taxes subsidies GDP from r . o .w . income income transfers able
from r . o .w . income
FY19 7 2 / 7 3 3 20 . 2 37 . 0 283 . 2 381 . 0 215 . 8 165 . 2 57 . 0 36 . 2 2 . 8 791 . 6 -37 . 2 754 . 4 697 . 4 121 . 3 8 18 . 7
FY19 7 3 / 7 4 403 . 6 30 . 0 3 7 3 . 6 5 28 . 0 368 . 4 159 . 6 66 . 8 42 . 4 2 . 8 1 , 038 . 0 -78 . 5 959 . 5 89 2 . 7 129 . 3 1 , 02 2 . 0
FY19 7 4 / 7 5 449 . 6 20 . 9 428. 7 415 . 6 245 . 6 170 . 0 70 . 2 5 3 . 6 2 . 5 986 . 5 - 7 1 . 7 9 14 . 8 844 . 6 145 . 5 990 . 1
FY19 7 5 / 7 6 487 . 9 22 . 8 465 . 1 427 . 0 249 . 3 177 . 7 7 7 . 7 61 . 0 3 . 5 1 , 050 . 1 -38 . 9 l , Oll . 2 9 33 . 5 164 . 0 1 , 09 7 . 5
FY.19 7 6 / 7 7 5 2 3 . 1 2 1 . 2 501 . 9 573 . 3 388 . 5 184 . 8 87 . 2 7 5 . 3 4 . 4 1 , 254 . 5 -38 . 0 1 , 216 . 5 1 , 129 . 3 153 . 5 1 , 282 . 8
1977 5 2 2 . 9 19 . 4 503 . 5 624 . 7 437 . 4 187 . 3 89 . 3 84 . 0 4 . 5 1 , 316 . 4 - 26 . 7 1 , 289 . 7 1 , 200 . 4 142 . 0 1 , 342 . 4
1978 552 . 0 14 . 4 537 . 5 674 . 6 462 . 4 2 12 . 3 103 . 6 87 . 6 4 . 7 1 , 413 . 3 -19 . 4 1 , 39 3 . 9 1 , 29 0 . 4 137 . 4 1 , 42 7 . 7
1979 5 94 . 7 9 . 8 584 . 9 832 . 2 605 . 8 2 26 . 4 107 . 3 102 . 2 3 . 9 1 , 632 . 5 -39 . 6 1 , 59 2 . 9 1 , 485 . 6 124 . 2 1 , 609 . 8
1980 676 . 1 6 . 7 669 . 4 797 . 1 534 . 8 262 . 3 124 . 9 ll4 . 6 4 . 6 1 , 708 . 1 -58 . 7 1 , 649 . 4 1 , 5 2 4 . 6 130 . 7 1 , 65 5 . 3
1981 7 4 7 . 7 5 . 5 742 . 2 681 . 4 395 . 2 286 . 2 137 . 6 ll9 . 2 4 . 6 1 , 681 . 2 -60 . 4 1 , 6 20 . 8 1 , 483 . 1 162 . 3 1 , 645 . 4
1982 7 6 3 . 4 5 . 0 758 . 4 701 . 2 400 . 7 300 . 5 150 . 0 138 . 5 4 . 1 1 , 749 . 1 -72 . 5 1 , 676 . 6 1 , 5 26 . 6 180 . 1 1 , 706 . 7
1983 79 2 . 9 79 2 . 9 866 . 4 542 . 9 323 . 4 162 . 6 15 3 . 4 5 . 5 1 , 969 . 7 -102 . 6 1 , 86 7 . 1 1 , 704 . 6 202 . 7 1 , 907 . 3
1984 (P) 8 7 2 . 3 872 . 3 9 14 . 8 582 . 7 3 32 . 2 208 . 4 181 . 8 4 . 6 2 , 17 2 . 7 -91 . 0 2 , 08 1 . 7 1 , 8 7 3 . 3 216 . 9 2 , 090 . 2
a r . o .w . = patially-paid labour.
�: Gross domestic product cost structure, as for Table A2 ; factor incomes and current transfers , 19 78-79 , Bulletin 17, National Statistical Off ic� 23 November 1983 ; 1980-84 , Bulletin 2 2 , National Statistical Of fice , 5 November 1985 ; 197 7 , Bulletin ll , National Statistical Office ; FY19 72/ 73-FY1 9 76 / 7 7 , World Bank ( 1982) , Table 2. 7 ( from National Statist ical Of fice) .
...... N w
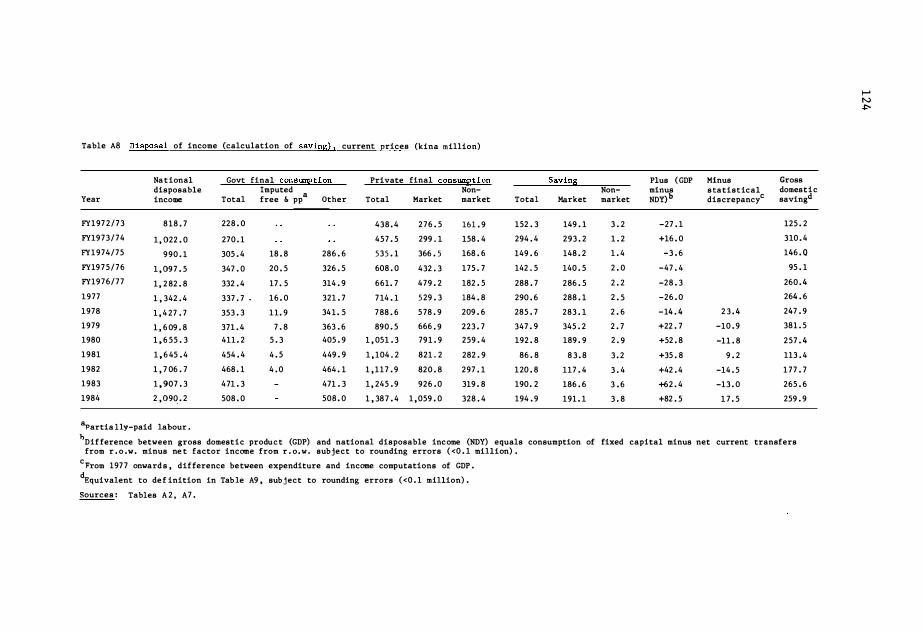
Table AS Dis2osal of income (calculation of saving) 2 current prices (kina million)
Na t ional Govt final consumetion Private final consumetion Savin,g Plus ( GDP Minus Gross disposable Imputed
a Non- Non- minus s tatistical domest i c Year income Total free & pp Other Total Market market Total Market market NDY) b discrepancyc savingd
FY197 2 / 7 3 8 18 . 7 228 . 0 438 . 4 2 7 6 . 5 161 . 9 152 . 3 149 . 1 3 . 2 -27 . 1 125 . 2
FY19 7 3 / 7 4 1 , 022 . 0 270 . 1 457 . 5 299 . 1 158 . 4 294 . 4 293 . 2 1 . 2 +16 . 0 3 10 . 4
FY 1 9 7 4 / 7 5 9 90 . 1 305 . 4 18 . 8 286 . 6 5 35 . 1 366 . 5 168 . 6 149 . 6 148 . 2 1 . 4 - 3 . 6 146 . Q
FY19 7 5 / 7 6 1 , 09 7 . 5 347 . 0 20 . 5 326 . 5 608 . 0 432 . 3 175 . 7 142 , 5 140 . 5 2 , 0 -47 . 4 95 . 1
FY19 7 6 / 7 7 1 , 2 82 . 8 332 . 4 17 . 5 314 . 9 661. 7 4 7 9 . 2 182 . 5 288 . 7 286 . 5 2 . 2 -28 . 3 260 . 4
1 9 7 7 1 , 342 . 4 337 . 7 • 16 . 0 321 . 7 7 14 . 1 5 29 . 3 184 . 8 290 . 6 288 . 1 2 . 5 -26 . 0 264 . 6
1978 1 , 4 27 . 7 353 . 3 1 1 . 9 34 1 . 5 7 88 . 6 5 78 . 9 209 . 6 285 . 7 283 . 1 2 . 6 - 14 . 4 2 3 . 4 247 . 9
1979 1 , 6 09 . 8 371 . 4 7 . 8 363 . 6 890 . 5 666 . 9 223 . 7 347 . 9 345 . 2 2 . 7 +22 . 7 -10 . 9 381 . 5
1980 1 , 6 55 . 3 411 . 2 5 . 3 405 . 9 1 , 05 1 . 3 79 1 . 9 259 . 4 192 . 8 189 . 9 2 . 9 +52 . 8 -11 . 8 257 . 4
1981 1 , 6 45 . 4 454 . 4 4 . 5 449 . 9 1 , 104 . 2 821 . 2 282 . 9 86 . 8 8 3 . 8 3 . 2 +35 . 8 9 . 2 113 . 4
1982 1 , 7 06 . 7 468 . 1 4 . 0 464 . 1 1 , 117 . 9 820 . 8 297 . 1 1 20 . 8 117 . 4 3 . 4 +42 . 4 -14 . 5 1 7 7 . 7
1983 1 , 90 7 . 3 4 71 . 3 471 . 3 1 , 245 . 9 926 . 0 319 . 8 190 . 2 186 . 6 3 . 6 +62 . 4 -13 . 0 265 . 6
1984 2 , 09q . 2 508 . 0 508 . 0 1 , 38 7 . 4 1 , 059 . 0 328 . 4 194 . 9 191 . 1 3 . 8 +82 . 5 1 7 . 5 259 . 9
aPartia l ly-paid labour . bDif ference between gross domestic produ c t (GDP) and national disposable income (NDY) equals consumption of fixed capital minus net current transfers
from r . o .w . minus ne t factor income from r . o . w . subject to rounding errors ( <0 . 1 million) . c
From 197 7 onward s , difference between expenditure and income computations of GDP . d
Equivalent to de f inition in Tab le A9 , sub j ect to rounding errors ( <0 . 1 million) .
Sources : Tables A 2 , A7 .
f-' N .p..

Table A9 Investment and savings FY1972 / 73- 19842 current Eurchasers 1 values (kina mill ion)
FY19 72 /7 3 FY1973 /74 FY1974 /7 5 FY1975 / 76 FY19 76 /7 7 1977 1978 1979 1980 1981 1982 1983
Gross fixed capital formation 129 . 8 13 1 . 6 187 . 9 163 . 4 227 . 3 239 . 3 268 . 5 326 . 2 394 . 2 450 . 7 576 . 7 6 35 . 9
Changes in stocks 13 . 1 -2 3 . 0 15 . 8 2 . 2 18 . 9 42 . 1 27 . 8 5 7 . 1 36 . 4 7 . 4 -14 . 2 -6 . 2
Gross domestic investment (GDI) 142 . 9 108 . 6 2 03 . 7 165 . 6 246 . 2 281 . 4 2 96 . 3 383 . 3 430 . 6 458 . 1 562 . 5 6 29 . 7
Imports , goods and services (M) 308 . 2 328 . 7 485 . 8 470 . 9 5 28 . 8 600 . 8 627 . 5 744 . 3 910 . 8 987 . 6 1 , 058 . 2 1 , 135 . 4
Exports , goods and services (X) 290 . 4 530. 5 428 . 1 400 . 4 542 . 9 584 . 0 579 . 1 742 . 5 7 37 . 6 642 . 9 644 . 3 7 7 1 . 2
Resource gap (RG = M-X) 17 . 8 -201 . 8 5 7 . 7 7 0 . 5 -14 . 1 16 . 8 48 . 4 1 . 8 173 . 2 344 . 7 413 . 9 394 . 6
Gross domes tic savings (GDS GDI-RG) 125 . 1 310 . 4 146 . 0 9 5 . 1 260 . 3 2 64 . 6 247 . 9 381 . 5 2 5 7 . 4 113 . 4 148 . 6 235 . 1
Net factor income r . o . w. -37 . 2 -78 . 5 - 71 . 7 -38 . 9 -38 . 0 -26 . 7 -19 . 4 - 30 . 6 -58 . 7 -60 . 4 -72 . 5 -102 . 6
Net current trans fers from r . o . w . 12 1 . 3 129 . 3 145 . 5 164 . 0 153 . 5 142 . 0 137 . 4 124 . 2 130 . 7 162 . 3 180 . 1 2 0 2 . 7
Gross national savings (GNS) 199 . 2 361 . 2 2 19 . 8 2 20 . 2 375 . 8 379 . 9 365 . 9 466 . 1 329 . 1 2 15 . 3 256 . 2 335 . 2
Implied financing gap /surplus (GNS-GDI) 56 . 3 252 . 6 16 . 1 54 . 6 129 . 6 98 . 5 69 . 6 8 2 . 8 -101 . 2 -242 . 8 -306 . 3 -29 4 . 5
Memo items
r.ross domestic product 791 . 6 1 , 038 . 0 986. 5 1 , 05 0 . 1 1 , 254 . 5 1 , 316 . 4 1 , 413 . 3 1 , 632 . 5 1 , 70 8 . 1 1 , 681 . 2 1 , 794 . 1 1 , 969 . 7
as % o f GDP - GDI 18. 1 10 . 5 2 0 . 6 15 . 8 19 . 6 2 1 . 4 21 . 0 2 3 . 5 2 5 . 2 2 7 . 2 31 . 4 3 2 . 0
GDS 14. 5 29 . 9 14 . 8 9 . 1 2 0 . 7 2 0 . 1 1 7 . 5 2 3 . 4 15 . 1 6 . 7 8 . 3 1 1 . 9
GNS 25 . 2 34 . 8 2 2 . 3 2 1 . 0 30 . 0 28 . 9 25 . 9 28 . 6 19 . 3 12 . 8 14 . 3 17 . 0
Note : This presenta tion is in the form commonly used by the World Bank ( e . g . , World Bank , 1982 , Table 2 . 7 ) ; for Papua New Guinea it is sub j e c t t o wide margins of error because the expenditure and income approaches t o t h e nat ional accounts a r e b lended , and because , prior to 197 7 , s tock changes incorporate the statistical dis crepancy between income and expenditure approaches . While the calculations are compiled on a di fferent basis , it can be no ted that the imp lied financing gap moves roughly in s tep with the balance of payments on current account shown in Table AlO.
1984
488 . 9
65 . 0
42 3 . 9
1 , 20 2 . 0
908 . 0
294 . 0
1 2 9 . 9
-91 . 0
216 . 9
255 . 8
-168 . 1
2 , 17 2 . 7
19 . 5
6 . 0
11 . 8
�: Factor incomes from r . o .w. and current transfers 19 80-84 , Bulletin 2 2 , 5 November ; 19 78-79 , Bul letin 17 , 23 November 1983 ; 19 7 7 , Bullet in 1 1 , 1 1 October 1981 ; FY19 72- 73-FY1976- 7 7 , World Bank (1982 ) , Table 2 . 7 ( f rom National Statist ical Office) ; GDP data from Table A2 .

Table AlO Pa£ua New Guinea : balance of £a:i!!!en ts (kina million)a 1--' N ""
1976 1977 1978 1979 1980 1981 1982 1983
Current account
Merchandise exports 452 552 533 720 660 566 568 69 1 Merchandise imports -351 -448 -478 -558 -684 -738 -752 -830
Trade balance 150 164 --SS 163 -:v; -172 - 184 - 139
Invisible receipts 71 53 52 65 70 89 114 108 Invisible paymentsd -199 -210 -217 -285 -342 -372 -387 -430
Net invis ibles -128 -157 - 165 -220 -272 -283 -273 -322
Net private transfers -51 -45 -62 -68 -80 -85 -91 -81
Net o f f icial trans fers 114 � 180 � � _!_l_ll � 212 Balance on current account 35 83 55 -197 -352 -355 -327
Capital account
Ne t official cap ital inf low 10 31 -5 27 44 78 75 125
Net private inf low d 12 -20 11 30 189 282 259
Non-official monetary sector b -5 -37 _]}_ -11 -5 _!I --=.!.
Balance on ca£i tal account 12 22 27 69 284 356 389 Net errors and omissions -13 21 -31 -4 81 29 -19 21 Overa ll balance 35 1iO ----:z 78 -:(7 --=-39 -=22 83
Govt c ommercial borrowings (GCB) c 2 5 4 9 6 8 7 4 70 Overall balance exc luding GCB 53 -96 -107 -96 13
International reserves
Level at end year 373 294 290 272 397 Import cover (no. of months) 6 . 9 4 . 7 4 . 7 4 . 0 5 . 4
aSince monetary independence in December 19 7 5 ; balance o f payments data on exports and imports are not compiled on the same basis as national accounts data ; totals sub j ect to rounding errors .
bTransactions reported by commerc ial banks .
cFor general budgetary purposes ( i . e . , excluding borrowings for specific proj ects or pub lic enterprises) . dRetained earnings treated as invisib le outf low with identi cal private capital inflow .
Source : Bank of Papua New Guinea , May 1984 .

Tab le A l l P r ivate capital f l ows in the balance o f payment s , 1 9 7 6- 1 9 8 3 (kina mil l ion)
Borrowings
B ougainv i l l e Cop per Ltd - ne t
Ok Tedi - n e t
Nor th Fly H i ghway Dev . Co . - neta
O the r p r iva t e :b
B orrow ings
Equity
Ok T e d i
Repaymen ts Ne t
Investment in PNG by overseas r e s i dent s Withdrawal o f investment i n PNG b y
overseas r e s idents Net
Wi thdrawal o f investment overseas by PNG re s iden t s
Inv e s tment overs eas by PNG res iden t s Net
Re tained earn ings ( r e invested) d
Total pr iva t e capi tal f lows (ne t )
19 7 6
- 2 . 3
9 . 7 - 1 7 . 3
- 7 . 6
4 . 5
- 3 . 0 1 . 5
1 . 6 -2 . 1 - 0 . 4 1 6 . 9
8 . 0
19 7 7
7 . 3
2 . 0 - 1 1 . 0
- 9 . 1
3 . 2
- 9 . 8 - 6 . 5
0 . 6 - 2 . 2 - 1 . 5 2 2 . 1
1 2 . 1
1 9 7 8
- 4 1 . 6
3 . 4 - 5 . 9 - 2 . 6
5 . 4
- 6 . 4 - 0 . 9
0 . 3 - 3 . 9 - 3 . 6 2 8 . 5
- 2 0 . 2
19 7 9
- 14 . 6
1 0 . 6 - 14 . 0
- 3 . 4
7 . 7
- 1 4 . 2 - 6 . 6
0 . 2 - 2 . 6 - 2 . 3 3 8 . 0
11 . 1
1 9 8 0
- 9 . 4
6 . 5 - 14 . 0
- 7 . 4
1 5 . 0
- 8 . 5 6 . 5
1 . 1 - 4 . 8 - 3 . 8 4 4 . 0
29 . 9
19 8 1
7 0 . 9
16 . 9
5 3 . 0 - 7 . 1 4 5 . 8
9 . 1 8 . 4
- 5 . 5 2 . 9
2 . 6 - 3 . 0 - 0 . 4 4 4 . 0
189 . 2
1 9 8 2
9 . 3
1 7 9 . 1
1 2 . 0
4 5 . 7 - 2 5 . 0
19 . 8
2 5 . 2 18 . 0
-9 . 4 8 . 6
2 . 3 - 3 . 6 - 1 . 4 3 0 . 0
2 8 2 . 6
aTh i s c ompany is a gov ernment-owned vehi cle for p rovi s i on o f a road as part o f the Ok Tedi mining p r oj ec t .
1 9 8 3
- 7 8 . 6
2 13 . 3
5 . 9
34 . 6 3 1 . 3
3 . 3
6 4 . 5
2 6 . 5 - 5 . 8 20 . 8C
30 . 0
2 5 9 . 2
blnc lude s d irect b orrowings by non-gove rnment pub l ic ent erp r ises ( i . e . , t ransac t i ons not covered by na t ional g overrunent budget ) .
cS eparat i on o f equi ty transac t i on s not ava i lab le f o r 1 9 8 3 .
dRe-inve s tment of r e t a ined earn ings unde r s tood to be based on B ank of Papua New Guinea res earch up t o 1 9 7 9 , but e s t imat ed thereaf ter .
Source : Da t a supp lied by Bank of Papua New Guinea , May 1 9 8 4 .

Tab le Al 2 S elected invisib le tran sact ions and transfers in the balance o f pa�men ts (kina million)
Invisib le s
Inves tment income p a i d overseas
B CL : a interest paid } dividends
Ok Tedi : interes t
O ther p r ivate �ivider,ds } payment s overseasb : interes t
Retained earnings re-inves tedc
Royalties , copyright , patent fees
Transfers
Remit t ances of savings o f t emporary residents
aMos t ly d ividends prior to 1981 .
bN . o s eparat ion availab le after 19 7 9 ,
1 9 7 6 19 7 7 19 7 8 19 7 9
18 . 4 16 . 1 1 7 . 2 38 . 5
r- 9 8 . 2 9 . 0 } 9 . 7
4 . 9 6 . 7 5 . 7
16 . 9 2 2 . 1 28 . 5 38 . 0
0 . 3 0 . 2 0 . 2 0 . 1
4 3 . 3 3 7 . 0 4 8 . 7 52 . 4
but increase in total ma inly due t o c
Treated a s an outf low in the invis ibles account and an inf l ow on cap ital
Source : Bank of Papua New Guinea , May 1984 .
1980 1981 1982
7 3 . 7 { 7 . 4 15 . 1
3 7 . 1 8 . 0
0 . 3 12 . 4
13 . 6 18 . 7 2 3 . 4
44 . 0 44 . 0 30 . 0
0 . 1 0 . 4 0 . 1
60 . 5 65 . 9 7 5 . 6
higher interes t rates .
account .
I-' N 00
1 9 8 3
9 . 4 19 . 9
2 5 . 8
18 . 9
3 0 . 0
0 . 4
7 1 . 5

1 29
Tab le Al3 Ne t inf lows o f fore ign inves tment (kina mil lion)
Direct inves tment Port fol io Direc t Re tained inves tment inves tment earnings and loans Total
(A)
FY 19 7 0 / 7 1 38 . 9 8 . 1 145 . 6 192 . 6
FY19 7 1 / 7 2
FY 19 7 2 / 7 3
FY 19 7 3 / 7 4
FY19 7 4 / 7 5
FY19 7 5 / 7 6
FY 19 7 6 / 7 7
(B)
197 6
19 7 7
19 7 8
19 7 9
1980
1981
19 82
1983
Sources :
63 . 3 0 . 7 105 . 8 169 . 8
6 . 0 5 0 . 6 - 2 7 . 4 2 9 . 3
1 1 . 5 85 . 8 - 2 3 . 0 7 4 . 3
45 . 0 - 10 . 2 - 7 . 8 2 7 . 1
2 3 . 7 14 . 6 - 13 . 6 24 . 8
- 15 . 0 19 . 1 18 . 8 2 2 . 8
1 . 5 1 6 . 9 -9 . 9 8 . 5
- 6 . 5 2 2 . 1 - 2 . 6 13 . 0
- 0 . 9 2 8 . 5 - 44 . 2 - 16 . 6
- 6 . 6 38 . 0 - 18 . 0 13 . 4
6 . 5 4 4 . 0 - 16 . 8 3 3 . 7
1 2 . 0 44 . 0 133 . 6 189 . 6
3 3 . 8 30 . 0 2 2 0 . 2 284 . 0
84 . S 3 0 . 0 143 . 9 2 5 8 . 4
Series A is drawn from Papua New Guinea Nat iona l S tatist-i ca l O ffice 1 9 7 8 , Tab le l ; i t covers inves tmen t from over seas in ' pr ivate enterp rises ' in P apua New Guinea .
Series B is drawn from Bank o f Papua New Guinea balance of payment s data ( as given in Tab le All) ; no p or t folio investment is included with loans , and non-budgetary loans to government-owned companies /pub lic ent erprises are included .

Tab le Al4 Inf low of overseas inves tmen t , a bJ:: indus try F'Y l9 7 0/7 1- F'Y l 9 7 6 / 7 7 (kina million)
Industry FY19 70 /7 1 FY19 7 1/ 7 2 F'Y l9 7 2 /7 3 FY19 7 3 /7 4 F'Y l9 74 / 7 5 FY1975 /7 6 FY19 76 /7 7
Agricul ture b 5 . 3 2 . 9 3 . 7 0 . 3 3 . 5 2 . 5 7 . 8
Mining 161 . 4 15 0 . 9 30 . 0 68 . 5 - 10 . 3 3 . 4 2 3 . 8
Manufacturing 3 . 1 4 . 2 10 . 1 5 . 9 4 . 1 1 . 4 1 . 8
Cons truc t ion 2 . 6 4 . 1 -0 . 1 0 . 3 -0 . 9 -1 . 8 - 3 . 9
Commerce c 12 . 1 9 . 3 3 . 5 -2 . 4 1 3 . 8 21 . 4 -9 . 6
Trans port 4 . 0 1 . 1 - 3 . 4 - 3 . 2 3 . 7 -5 . 0 1 . 3
Finance 4 . 3 - 2 . 7 - 14 . 6 4 . 9 13 . 2 2 . 8 1 . 7
To tal 192 . 6 169 . 8 29 . 3 7 4 . 3 2 7 . 1 24 . 8 2 2 . 8
aTotal net f l ow of equi ty and loans ; see Tab le Al l for neares t comparis on for later years .
b inc lude s f ores try and fishing ; dis inves tment in agriculture in F'Y l9 7 3 / 74 and FY19 7 5 /76 is o f f se t in the othe r e l emen ts .
�holesale and retail trade , res tauran ts and hotels .
Source : P ap ua New Guinea Nat ional S tatis tical Office , 1 9 7 8 , Table 3 .
I-' w 0

Table Al5 Inves tment income Ea�ab le overseas b� PaEua New Guinea ent erErise s , a FY1970/. 71-FY19 76 / 7 7 (kina million)
Indus t ry FY19 7 0 / 7 1 FY.19 7 1 / 7 2 FY. 19 7 2 / 7 3 FY. 19 7 3 / 7 4 FY. 19 7 4 / 7 5 FY19 7 5 / 7 6 FY 19 7 6 / 7 7
Agricu l ture 4 . 6 1 . 6 0 . 3 7 . 0 4 . 3 2 . 6 9 . 4
Mining 0 . 2 16 . 7 7 4 . 9 151 . 9 5 1 . 4 39 . 0 3 1 . 7
Manufac turing 3 . 1 3 . 2 3 . 8 2 . 7 3 . 8 1 . 5 3 . 3
Con s t ruction 2 . 7 3 . 4 0 . 5 0 . 3 0 . 2 0 . 2 0 . 1
Commerce 6 . 9 7 . 5 6 . 0 5 . 5 7 . 4 9 . 0 9 . 5
Transport 2 . 2 1 . 7 0 . 5 0 . 3 0 . 2 1 . 2
Finance 2 . 5 2 . 9 2 . 8 0 . 2 - 1 . 3 2 . 2 3 . 9
Tot al a 2 2 . 2 37 . 0 88 . 2 168 . 2 6 6 . 1 5 4 . 7 5 9 . 0
Tota l ne t of re tentions 14 . 1 3 6 . 3 37 . 6 82 . 4 7 6 . 3 4 0 . 1 39 . 9
ainc ludes all net interes t and dividends after t ax , and undis tributed p rof i ts o f s ubs idiaries or unremitted prof i t s o f branche s . In comp aring wit h later figures in Tab le Al2 , therefore , allowance mus t be made for the inclus ion of retentions in invisib le p ayment s ( equal to the retained earnings in f l ow on capita l account) .
Source : Papua New Guinea Nat ional S tatis tical O ffice 19 7 8 , Tab le 6 ( gros s flows) and Tab le 1 ( retent ions)

Table Al6 Direct fore ign investment inflows and out f lows by source country (balance of EaY!!!ents data) 2 19 76-83 (k ina mill ion)
Year Total a Aus tralia USA UK JaEan Hongkong New Zealand Wes t Germany Otherb
In Out In Out In Ou t In Out In Out In Out In Out In Out In Out
1976 4 . 5 3 . 0 2 . 5 2 . 7 0 . 3 0 . 5 1 . 0 0 . 4
1 9 7 7 3 . 2 9 . 8 0 . 7 6 . 3 0 . 1 2 . 0 0 . 9 0 . 7 0 . 1 1 . 0 0 . 3 0 . 1 0 . 1 0 . 2
1 9 7 8 5 . 4 6 . 4 2 . 3 5 . 3 0 . 7 1 . 6 0 . 9 0 . 7 O·. l
1 9 7 9 7 . 7 14 . 2 2 . 8 1 1 . 2 1 . 4 1 . 0 0 . 3 0 . 7 0 . 2 2 . 2 1 . 2 0 . 5 0 . 3
1980 15 . 0 8 . 5 4 . 4 5 . 1 2 . 9 0 . 4 3 . 1 0 . 3 0 . 6 2 . 8 2 . 2 0 . 1 0 . 1 0 . 2 0 . 9
1981 1 7 . 7 5 . 5 8 . 0 3 . 3 5 . 2 0 . 9 0 . 1 0 . 1 0 . 8 0 . 4 0 . 1 0 . 1 2 . 5 0 . 6 1 . 0
1982 4 3 . 2 9 . 4 1 6 . 4 5 . 2 15 . 5 1 . 3 1 . 7 0 . 9 0 . 3 2 . 7 6 . 5 1 . 8
1983 9 0 . 0 4 . 3 2 9 . 6 3 . 5 36 . 7 0 . 1 2 . 3 0 . 1 0 . 4 0 . 1 0 . 1 18 . 6 2 . 2
- means less than K50 , 00 0 .
aEquals flows o f investment in /out of Papua New Guinea by overseas residents i n Table All , including O k Tedi .
Ok Tedi elements are :
Total Aus tral ia USA West Germany
1981 9 . 1 3 . 4 3 . 4 2 . 3 1982 2 5 . 2 9 . 5 9 . 5 6 . 3 1983 64 . 5 24 . 2 24 . 2 16 . 1 (Country division imputed by P . Daniel on the basis o f known shareholdings in the Ok Tedi proj ect . )
bKnown to include S ingapore , South Korea , The Nether lands and Belgium.
Gene ral note : The Bank of Papua New Guinea treats mineral and petroleum explorat ion expenditure as a foreign investment inflow , whereas the Papua New Guinea Nat ional S tatistical O f fice t reats it as private final consump tion expenditure for national accounts purposes , not as capital formation . These flows by source country have not yet been checked against data avai lab le from the source countries themselves .
S ourc e : Data supplied by Bank of Papua New Guinea , May 198 4 .
0 . 1
0 . 2
0 . 4
0 . 2
0 . 5
..... VJ N

133
Tab le Al 7 Ne t inf low o f overseas inve s tment ( eouity and deb t ) by source country , FY19 7 0 / 7 1-FY19 7 6 / 7 7 (kina mi llion)
Year
FY19 70 / 7 1
FY 19 7 1 / 7 2
FY 19 7 2 / 7 3
FY 19 7 3 /7 4
FY 19 7 4 / 7 5
FY 19 7 5 / 7 6
Wl. 19 76 / 7 7
Aus t ralia
106 . 4
8 1 . 5
-4 . 4
8 0 . 8
18 . 0
2 9 . 6
-5 . 4
UK
4 . 0
65 . 7
19 . 9
- 60 . 9
10 . 3
4 . 3
- 1 . 6
USA
3 4 . 3
1 7 . 5
5 . 5
52 . 0
-8 . 1
- 12 . 5
6 . 7
Japan
4 3 . 8
2 . 8
6 . 6
2 . 0
5 . 6
1 . 8
1 . 9
O ther
4 . 1
2 . 3
1 . 7
0 . 5
1 . 2
1 . 6
2 1 . 2
Total
192 . 6
169 . 8
2 9 . 3
7 4 . 3
2 7 . 1
2 4 . 8
2 2 . 8
Note : ' Inves tment by overseas res i dents in Papua New Guinea comp r ises net increases in all f inancial liab i l i t ies o f Papua New Guinean ente rp r is e s to non-res idents , including shares , debentures , loan s , advances , indeb tednes s on curren t ac count b etween related companies , and in undistrib uted inc ome (bef ore approp r iat ion , i f any , t o reserves ) . ' ( Papua New Guinea Nat ional S tatis t ical O f f ice 19 7 8 : 2 ) .
S ource : Papua New Guinea National S tati s ti ca l O f f ice , 19 7 8 , Tab le 2 .
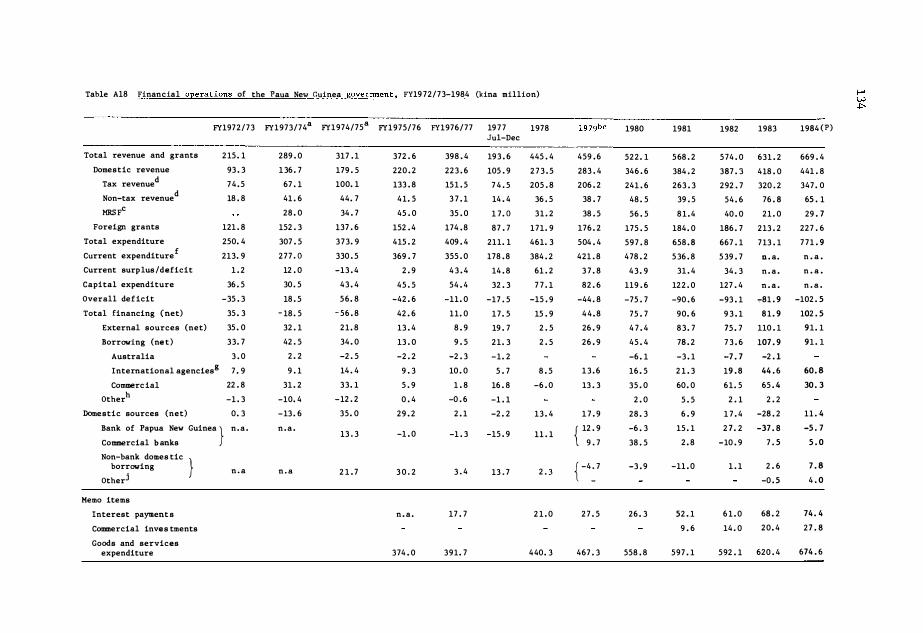
Table Al8 Financial operations of the Paua New Guinea government , FY19 7 2 / 7 3-1984 (kina million)
FY197 2 / 7 3 FY1973/74a FY1974/75a FY 1 9 7 5 / 7 6 FY1976 / 7 7 19 7 7
Total revenue and grants
Domestic revenue
Tax revenued
Non-tax revenued
MRS Fc
Foreign grants
Total expenditure
Current expendituref
Current surp lus /deficit
Capital expenditure
Overall def icit
Total financing (net)
External sources (net)
Borrowing (ne t )
Australia
International agenciesg
Commerc ial
Otherh
Domestic sources (net)
2 15 . 1
93 . 3
7 4 . 5
18 . 8
121 . 8
250. 4
213. 9
1 . 2
36 . 5
-35 . 3
35 . 3
35 . 0
33. 7
3 . 0
7 . 9
22 . 8
-1 . 3
0 . 3
Bank of Papua New Guinea } Commercial b anks
n . a .
Non-bank domes tic } borrowing
Otherj
Memo itema
Interest payment s
Connnercial inves tments
Goods and services expenditure
n . a
289 . 0
1 36 . 7
67 . 1
41 . 6
28 . 0
152 . 3
307 . 5
2 7 7 . o
12 . 0
30 . 5
18 . 5
- 18 . 5
32 . 1
42 . 5
2 . 2
9 . 1
31 . 2
-10. 4
- 13 . 6
n . a .
n . a
317 . 1
179 . 5
100. 1
44. 7
34 . 7
137 . 6
3 7 3. 9
330 . 5
-13 . 4
4 3 . 4
5 6 . 8
- 56 . 8
2 1 . 8
34 . 0
-2 . 5
14 . 4
3 3 . 1
- 12 . 2
35 . 0
13 . 3
2 1 . 7
372 . 6
220 . 2
133 . 8
4 1 . 5
45 . 0
152 . 4
415 . 2
369 . 7
2 . 9
4 5 . 5
-42 . 6
42 . 6
13 . 4
13 . 0
-2 . 2
9 . 3
5 . 9
0 . 4
2 9 . 2
-1 . 0
3 0 . 2
n . a .
3 74 . 0
398 . 4
22 3 . 6
15 1 . 5
3 7 . 1
35 . 0
174 . 8
409 . 4
355 . 0
4 3 . 4
5 4 . 4
-11 . 0
11. 0
8 . 9
9 . 5
-2 . 3
10 . 0
1 . 8
-0 . 6
2 . 1
-1 . 3
3 . 4
17 . 7
3 9 1 . 7
Jul-Dec
19 3 . 6
105 . 9
7 4 . 5
14 . 4
1 7 . o
8 7 . 7
211. 1
178 . 8
14 . 8
32 . 3
-17 . 5
1 7 . 5
19 . 7
2 1 . 3
- 1 . 2
5 . 7
16 . 8
-1 . 1
-2 . 2
-15 . 9
13 . 7
1978
445 . 4
2 7 3 . 5
205 . 8
36 . 5
3 1 . 2
1 7 1 . 9
461. 3
384 . 2
61 . 2
7 7 . 1
-15 . 9
15 . 9
2 . 5
2 . 5
8 . 5
-6 . 0
1 3 . 4
11 . 1
2 . 3
2 1 . 0
4 40 . 3
459 . 6
283 . 4
206 . 2
38 . 7
38 . 5
176 . 2
504 . 4
421 . 8
3 7 . 8
82 . 6
-44 . 8
4 4 . 8
26 . 9
26 . 9
1 3 . 6
13 . 3
1 7 . 9 { 12 . 9
9 . 7
{ -4�7
2 7 . 5
467 . 3
1980
52 2 . 1
346 . 6
241 . 6
48 . 5
56 . 5
175 . 5
5 9 7 . 8
4 78 . 2
4 3 . 9
ll9 . 6
-75 . 7
7 5 . 7
4 7 . 4
4 5 . 4
-6 . 1
16 . 5
35 . 0
2 . 0
28 . 3
-6 . 3
38 . 5
-3 . 9
26 . 3
558 . 8
1981
5 68 . 2
384 . 2
263 . 3
39 . 5
8 1 . 4
184 . 0
658 . 8
5 36 . 8
31 . 4
12 2 . 0
-90 . 6
90. 6
8 3 . 7
78 . 2
-3 . 1
2 1 . 3
60 . 0
5 . 5
6 . 9
15 . 1
2 . 8
-11 . 0
52 . 1
9 . 6
5 9 7 . 1
1982
5 74 . 0
387 . 3
2 92 . 7
5 4 . 6
40 . 0
186 . 7
667 . 1
5 39 . 7
34 . 3
127 . 4
-93 . 1
9 3 . 1
75 . 7
7 3 . 6
-7 . 7
19 . 8
6 1 . 5
2 . 1
1 7 . 4
2 7 . 2
-10 . 9
1 . 1
1983
631 . 2
418 . 0
320 . 2
76 . 8
2 1 . 0
2 13 . 2
7 13 . 1
n . a.
n . a .
n . a .
.,-81 . 9
8 1 . 9
110 . 1
107 . 9
-2 . l
44 . 6
65 . 4
2 . 2
-28 . 2
-37 . 8
7 . 5
2 . 6
-0 . 5
6 1 . 0 68 . 2
14 . 0 2 0 . 4
5 92 . 1 620 . 4
1984 ( P )
669 . 4
441 . 8
347 . 0
65 . 1
29 . 7
22 7 . 6
7 7 1 . 9
n . a .
n . a .
n . a .
-102 . 5
102 . 5
9 1 . 1
9 1 . 1
60 . 8
30 . 3
11 . 4
-5 . 7
5 . 0
7 . 8
4 . 0
74 . 4
2 7 . 8
674 . 6

Total pub lic debt outstanding k (end of period) 313. 9 3 15 . 0 341 . 2 350 . 2 411 . 8 480 . 4 544 . 2 645 . 7 806 . 5 n . a .
Foreign n . a . n . a . 255 . 1 253 . 1 2 70 . 3 304 . 2 389 . 9 485 . 4 660 . 5 n . a .
Domestic n . a . n . a . 86 . 0 9 7 . 2 141 . 5 176 . 2 154 . 3 160 . 3 146 . 0 n . a .
aThese years may include error s o f double-counting o f parts o f the Bougainville Copper Ltd contribut ion to revenue.
bFrom 1979 onwards , some item s of classi ficat ion may dif fer very s lightly from previous years .
fSpecial elements of Aus tralian expenditure included up to FY1975 / 7 6 ; f igures exclude appropriations for loan repayment s .
gNe t concessional borrowing from mul ti lateral and bilateral o f fical agencies . hlncludes Nat ional Debt Sinking Fund (NDSF) net budget contribution ( foreign
asset change only from 1979) . �ineral Resources Stab ilizat ion Fund, 1979 revenue and , especially , expenditure f igures are a puz zle. Four different versions in a range o f official and semi-of f icial sources have been found . Figures presented are most recent ones made availab le : they conform to the general view that real expenditure grew sharply between 1979 and 1980 but o ther sources suggest higher expenditure in 1979 . The problem may l ie in accounting for government transactions with public ent erprises in 1979 .
the j NDSF domestic asset changes . k
Bank o f Papua New Guinea , not fully cons istent with financing operations shown; does not include pub licly-guaranteed debt .
dExcluding revenues from Boungainville Copper Ltd , paid direc tlv into Mineral Resources Stabilizat ion Fund .
Sources : FY1972 / 7 3-FY1974 / 75 World Bank ( 1982 ) , Table 5 . 1 ; FY1975 / 76-1978 Garnaut and Baxter ( 1983) , Table 7 . 2 (with correct ions) ; 1979-1984 data supplied by Papua New Guinea Department of Finance , May 1984 . ' Debt outstanding ' from Garnaut and Baxter ( 1983) , Table 7. 2 and from Bank of Papua New Guinea , CJuar>ter>l!f Economic Bulletin , March 1984 .

1--' w °'
Table Al9 Mineral Resources Stabilizat ion Fund OEerations (MRSF) FY1973/ 74- 1984 (kina million)
FY1973/74 FY1974/75 FY19 75/76 FY19 7 6 / 7 7 1977 1978 1979 1980 1981 1982 1983 1984 (P) Jul-Dec
MRSF total receip ts (all from BCL) 28 . 0 3 4 . 7 62 . 9 2 4 . 6 2 3 . 8 2 1 . 1 39 . 4 108 . 7 7 1 . 5 2 5 . 7 25 . 0 64 . 4 Company income tax 9 . 1 54 . 1 15 . 6 2 0 . 5 13 . 5 2 3 . 1 7 3 . 4 5 1 . 7 19 . 5 1 3 . 0 41 . 8 Dividend withholding tax 9 . 5 8 . 6 3 . 1 3 . 0 1 . 1 2 . 7 6 . 0 12 . 7 6 . 4 2 . 4 3 . 8 8 . 5 Dividend on government
share 15 . 1 13 . 9 5 . 0 5 . 1 2 . 0 4 . 6 10 . 2 2 1 . 4 10 . 7 2 . 3 5 . 7 14 . 1 Investment income 0 . 7 0 . 8 0 . 2 0 . 3 0 . 1 1 . 2 2 . 4 2 . 5 2 . 5 Royalty 3 . 4 3 . 1 ( 2 . 3) b ( 2 . 5 ) ( 0 . 8) (2 . 1) ( 2 . 8) ( 4 . 2) ( 3 . 7 ) ( 3 . 4) (4 . 7) (5 . 4)
Flows to central government 28 . 0 34 . 7 45 . 0 35 . 0 17 . 0 3 2 . 0a 38 . 5 56 . 5 8 1 . 4 40 . 0 2 1 . 0 29 . 7
MRS F balance , end of pe riod 17 . 9 7 . 5 14 . 3 3 . 4 4 . 3 56 . 3 46 . 1 3 1 . 8 35 . 8 70 .5
aS light inconsistency with revenue tables , not reconciled . b
Paid directly to provincial government from FY 1 9 7 5 /76 onwards .
Source : Mineral Resouraes Stahi lization Fund Annua l Reports , and Department of Finance dat a .

Table A20 Central governmen t revenue2 FY19 7 2 / 7 3-1984 (kina million)
FY1972/73 FY 19 7 3 / 7 4a FY19 7 4 / 75a FY1975 / 76 FY1976/ 7 7 19 7 7 1978 19 7 9b 1980 1981 1982 198 3 1984 (P) July-Dec
Tax revenue 74 . 5 7 6 . 6 117 . 8 19 1 . 0 170 . 1 96 . 1 224 . 4 235 . 3 327 . 7 Ebi 313 . 6 337 . 0 365 . 8
Taxes on income and prof its 38 . 2 34 . 2 64 . 0 130. 3 9 1 . 8 49 . 7 136 . 0 135 . 3 2 14 . 6 201 . 3 176 . 4 183 . 4 186 . 4 Companies 14 . 1 8.0 34 . 5 98 . 0 61 . 4 3 3 . 5 62 . 7 6 3 . 9 120 . 9 95 . 3 61. 7 5 7 . 3 5 6 . 7
Bougainville Copper Ltd (-) (-) (9 . 1) ( 54 . 1) ( 15 . 6 ) ( 20 . 5) ( 13 . 5) ( 2 3 . 1) ( 7 3 . 4) ( 5 1 . 7) ( 19 . 5 ) ( 13 . 0) ( 14 . 6) Other ( 14 . 1) ( 8 . 0) ( 25 . 4) ( 4 3 . 9 ) ( 45 . 8) ( 13 . 0) ( 49 . 2 ) ( 4 0 . 8 ) ( 4 7 . 5 ) ( 4 3 . 6) ( 42 . 2) ( 44 . 3) (42 . 1)
Individuals 2 2 . 1 15 . 0 19 . 9 2 7 . 5 2 6 . 0 13 . 9 67 . 1 61 . 6 7 5 . 9 9 4 . 8 108 . 7 118 . 6 121 . 4 Dividend withholding 2 . 0 11. 2 9 . 6 4 . 8 4 . 4 2 . 3 6 . 2 9 . 8 17 . 8 11 . 2 6 . 0 7 . 5 8 . 3
Bougainville Copper Ltd (-) ( 9 . 5) ( 8 . 6) ( 3 . 1 ) ( 3 . 0) ( 1 . 1) ( 2 . 7) ( 6 . 0) ( 12 . 7) ( 6 . 4) ( 1 . 4) ( 3 . 8) ( 4 . 2) Other ( 2 . O) ( 1 . 7) ( 1 . 0) ( 1 . 7 ) ( 1 . 4 ) ( 1 . 2 ) ( 3 . 5) ( 3 . 8) (5 . 1) ( 4 . 8) ( 4 . 6) ( 3 . 7 ) ( 4 . 1)
F.xd.se cl.uti.es 11 . 4 17 . 1 2 0 . 3 25 . 7 32 . 6 18 . 5 36 . 3 4 1 . 0 46 . 1 47 . 2 49 . 8 51 . 5 58 . 2
Taxes on internat ional trade 22 . 5 2 2 . 9 30 . 8 31. 7 4 1 . 8 26 . 0 4 7 . 8 56 . 3 64 . 5 68 . 2 82 . 1 93 . 3 111 . 0 Import duties 2 2 . 5 2 2 . 9 2 9 . 7 2 9 . 6 35 . 3 20 . 8 4 1 . 7 48 . 0 55 . 1 63 . 7 7 7 . 6 88 . 4 9 9 . 8 Export taxes 1 . 1 2 . 1 6 . 5 5 . 2 6 . 1 8 . 3 9 . 4 4 . 5 4 . 5 4 . 9 11 . 2
Other taxes � � b.]_ hl � bi hl b1. hl hl hl hl 10 . 2
Non-tax revenue 18 . 8 60 . 1 61. 7 4 7 . 2 4 3 . 0 16 . 6 39 . 0 49 . 0 7 1 . 1 52 . 6 59 . 4 82 . 5 7 1 . 2 Revenue from investments --u 33 . 5 30 . 6 14 . 3 15 . 2 7-:-5 15 . 3 17 . 8 39 . 7 15 . 7 13 . 6 2 3 . 6 18 . 8
Bougainville Copper Ltd (-) ( 15 . 1) ( 13 . 9) (5. 7) ( 5 . 9) ( 2 . 2 ) ( 4 . 9 ) ( 10 . 3) ( 2 2 . 6) ( 13 . 1) ( 4 . 8) ( 5 . 7) ( 6 . 1) Other ( 4 . 3� ( 18 . 4� ( 16. 7� ( 8 . 6 ) ( 9 . 3) ( 5 . 3) ( 10 . 4) ( 7 . 5) ( 17 . 1) ( 2 . 6) ( 8 . 8) ( 17 . 9) ( 12 . 7 )
Other 14 . 5 26 . 4 3 1 . 1 32 . 9 2 7 . 8 9 . 1 2 3 . 7 31 . 1 31 . 4 36 . 9 45 . 8 58 . 9 52 . 4
Total revenue 9 3 . 3 136 . 7 179 . 5 238 . 2 2 1 3 . 1 112 . 7 26 3 . 4 284 . 3 398 . 8 374 . 0 37 3 . 0 419 . 5 437 . 0 Bougainville Copper Ltd 28 . 0 3CT 62.9 24 . 6 2 3 . 8 2 1 . 1 39 . 4 108 . 7 71.2 25:7 22 . 5 2 4 . 9 Other 9 3 . 3 108 . 7 144 . 8 175 . 3 188 . 5 88 . 9 2 42 . 3 2 44 . 9 290 . 1 302 . 8 347 . 3 39 7 . 0 412 . 1
Internal revenue to budget 9 3 . 3 136 . 7 179 . 5 220. 3 2 2 3 . 5 105 . 9 2 7 3 . 5 283 . 4 346 . 6 384 . 2 387 . 3 418 . 0 441 . 8 Mineral Resource
S tabilizat ion Fund 28 . 0 34. 7 45 . 0 35 . 0 17 . 0 3 1 . 2 38 . 5 56 . 5 8 1 . 4 40 . 0 2 1 . 0 29 . 7 Other 9 3 . 3 108 . 7 144 . 8 17 5 . 3 188 . 5 88 . 9 242 . 3 2 44 . 9 290 . 1 302 . 8 347 . 3 397 . 0 412 . 1
aPos s ib le double counting of some Bougainville Copper Ltd revenue in these years : to be checked . bMinor reclassi fication of tax items to non-tax revenue ( c irca K3 . 0 mi llion ) . cincluding Bougainville Copper Ltd royal ties so subsequently paid to provincial government : FY19 7 2 / 7 3 not available ; FY19 73/74 3 . 4 ; FY1974/75 3 . 1 .
S ources : FY19 7 2 / 7 3 and FY19 7 3 /7 4 , World Bank ( 1982) , Table 5 . 2 ; FY 1974/75-1978 Garnaut and Baxter ( 1983) , Table 7 . 3 ; FY 19 7 9-84 , data supplied by Depar tment of Finance , May 1984 . 1--'
VJ --..J

......
Table A21 guantitI of major e!J2orts w 00
FY1972/73 FY1973/74 FY1974/75 FY1975 /76 FY1976/77 1977 1978 1979 1980 1981 1982 1983
Copper concentrate ( ' OOO dry tonnes) 295 . 1 717 . 1 623 . 7 530 . 2 566 . 5 614 . 8 640 . 9 586 . 5 494 . 4 563 . 3 608 . 8 632 . 1
Gold ( alluvial and in concentrate) (kg) a 18 . 900 2 1 . ooo 19 . 500 17 . 100 19 . 900 22 . 928 23 . 357 20. 737 14 . 532 1 7 . 641 19. 071 19 . 05 3
Copper (contained in concentrate) ( ' OOO tonnes)a 82 . 7 183 . 5 179 . 6 155 . 1 167 . 7 182 . 0 193 . 1 172 . 0 142 . 2 164 . 0 173 . 2 181 . l
Cocoa ( tonnes) 22 . 071 28 . 742 35 .498 30 . 4 31 28 . 008 29 . 392 27 . 129 28 . 084 28 . 7 92 27 . 835 28 . 689 26 . 34 1
Coffee ( tonnes) 31. 158 32 . 7 13 36 . 769 3 7 . 182 49 . 797 36 . 965 45 . 801 49 . 586 5 1 . 007 47 . 05 7 41 . 105 52 . 15 9
Copra ( tonnes) 7 9 . 785 7 3 . 568 95 . 455 92 . 764 82 .542 88 . 932 9 7 . 056 90 .880 90 .820 99 . 389 7 4 .357 78 . 711
Copra oil and pellets ( tonnes) 44 , 7 02 40. 367 41 . 786 4 3 . 992 42 . 207 27 . 665 27 . 608 30.822 34 . 142 34 . 77 2 37 . 593 36 . 178
Tea ( tonnes) 2 . 792 3 . 965 4 .489 4 .871 6 . 058 6 . 192 6 . 979 6 . 978 7 . 915 6 . 956 6 . 475 7 . 2 3 3
Palm o i l ( tonnes) 8 . 066 8 . 7 34 18 . 438 27 . 087 2 6 . 883 25 . 517 33 . 492 34 . 537 33 . 347 44. 031 76 . 715 77 . 939
Rubber ( tonnes) 5 . 616 6 . 127 5 .474 4 . 956 4 . 453 4 . 152 4 , 135 4 . 026 4 . 02 7 4 . 537 2 . 337 2 . 733
Forest products
} Logs ( ' OOO m3 ) 468 704 427 418 539 { 412 421 476 618 749 1 . 063 1 . 003
Lwnber ( ' OOO m3 ) 59 32 64 44 25 21 16
Woodchip ( tonnes ) 233 230 119 133 102 103 117
Fish Tuna ( tonnes) 23 . 760 45 . 45 2 27 , 275 33 . 058 29 . 788 2 . 125 541
} 12 . 720 38 . 615 31 . 607 19 . 925 31.846 { Other ( tonnes) 1 . 222 1 . 178 1 . 719 1 . 368 1 . 419 1 . 161 1 . 17 7
aFY1972 /7 3-FY1976/77 Bougainville Copper Limited exports estimated from grade of concentrate produced in calendar years .
�: 197 7-83 . B ank of Papua New Guinea Quarter ly Economic Bul letin . March 1984 ; 1977-1978 . Bank of Papua New Guinea Quarterly Economic Bulletin. December 198 1 ; earlier figures World Bank 1982 (Table 3 . 2) .

Tab le A22 Value o f merchandise exEorts (kina thousand)
FY197 2 / 7 3 FY197 3 / 7 4 FY197 4 / 7 5 FY 1 9 7 5 / 7 6 FY 1 9 7 6 / 7 7 1 9 7 7 1 9 7 8 1 9 7 9 1980 198 1 1982 1983
Copper concentrates and alluvial gold 126 , 5 7 8 3 1 3 , 53 1 240 , 134 201 , 424 194 , 503 186 , 4 10 2 3 1 , 869 358 , 986 322 , 306 300 , 59 1 302 , 13 7 3 7 3 , 12 6
Copper } 1 1 1 , 028 122 , 549 183 , 958 139 , 2 9 0 134 , 59 2 122 , 75 5 161 , 040 Silver 125 , 62 5 3 1 1 , 909 236 , 660 199 , 46 1 192 , 14 9 4 , 646 5 , 544 1 1 , 98 7 10 , 15 4 7 , 05 3 7 , 5 3 3 ll , 15 5 Gold - BCL
2 , 354 } Gold - alluvial 9 5 3 1 , 62 2 3 , 474 1 , 963 70 , 7 36 103 , 7 7 6 163 , 04 1 1 7 2 , 862 158 , 94 6 17 1 , 84 9 200 , 93 1
Cocoa 1 1 , 1 7 5 2 3 , 3 38 40 , 067 28 , 645 55 , 131 8 6 , 34 9 62 , 955 60 , 8 7 2 46 , 493 34 , 13 5 3 1 , 822 4 1 , 37 6
Coffee 2 3 , 3 9 5 28 , 84 7 33 , 554 42 , 2 26 132 , 619 143 , 44 1 107 , 2 25 124 , 99 6 118 , 643 7 4 , 2 18 7 7 , 7 8 0 9 4 , 651
Copra 8 , 08 3 23 , 67 2 28 , 8 4 1 ll , 633 19 , 18 7 2 3 , 2 19 2 3 , 02 3 38 , 162 2 4 , 49 4 19 , 316 12 , 8 78 2 3 , 98 3
Copra oil and pelle ts S , 93 2 14 , 7 7 3 15 , 495 8 , 491 13 , 4 5 1 11 , 6 16 12 , 449 2 0 , 5 9 9 16 , 610 12 , 5 08 12 , 11 0 20 , 038
Tea 2 , 048 2 , 60 1 3 , 866 3 , 9 78 8 , 00 1 9 , 7 65 7 , 8 3 3 7 , 982 8 , 507 7 , 13 1 6 , 682 10 , 390
Palm oil 1 , 148 2 , 685 6 , 786 6 , 6 17 8 , 5 35 8 , 582 10 , 48 3 14 , 44 1 11 , 956 14 , 22 3 2 1 , 655 23 , 740
Rubber 1 , 998 3 , 5 63 2 , 585 2 , 65 3 3 , 128 2 , 896 2 , 630 3 , 49 7 3 , 75 1 3 , 40 3 1 , 4 06 2 , 167
Forest product s 10 , 7 02 2 0 , 308 1 3 , 5 7 6 12 , 790 2 6 , 445 2 3 , 695 24 , 67 7 36 , 5 6 1 45 , 746 4 3 , 8 7 1 6 1 , 65 3 5 4 , 65 4
Fish 4 , 6 61 14 , 1 7 6 10 , 3 74 9 , 07 7 1 8 , 666 2 0 , 199 2 5 , 03 3 2 1 , 8 7 8 3 1 , 69 1 2 7 , 38 2 8 , 2 64 9 , 11 1
Other domes tic exports 4 , 822 ll , 7 94 7 , 28 2 2 , 942 9 , 701 7 , 2 44 8 , 449 9 , 586 7 , 7 5 1 9 , 9 7 5 9 , 19 7 15 , 066
Total domestic exports 200 , 5 42 459 , 300 402 , 560 330 , 4 7 6 489 , 367 52 3 , 416 5 16 , 62 6 697 , 560 637 , 868 546 , 553 546 , 615 668 , 302
Re-exports 29 , 072 24 , 4 3 1 2 0 , 945 33 , 2 7 4 32 , 902 3 1 , 5 62 45 , 860 5 6 , 9 14 5 3 , 9 7 2 19 , 334 24 , 85 0 19 , 07 3
Total a l l exports 229 , 614 483 , 7 3 1 4 2 3 , 505 363 , 750 522 , 269 554 , 9 78 562 , 486 7 5 4 , 4 34 691 , 840 565 , 88 7 5 7 0 , 434 68 7 , 3 7 5
Source : As f or Table A20 (FY19 7 6 / 7 7 figure corrected ) .

140
Table A23 Shares in the value of d omestic exEort s
FY 19 7 2 / 7 3 FY197 6 /7 7 197 8 1983
C opper concen-trates etc . 63 . 1 39 . 7 44 . 9 5 5 . 8
Gold and si lver ( 21 . 2 ) ( 3 1 . 7 )
C opper ( 2 3 . 7 ) ( 2 4 . 1)
Cocoa 5 . 6 11 . 3 12 . 2 6 . 2
Coffee 11 . 7 2 7 . 1 20 . 8 14 . 2
C op ra and c op ra produc t s 7 . 0 6 . 7 6 . 9 6 . 6
Tea 1 . 0 1 . 6 1 . 5 1 . 6
Palm oil 0 . 6 1 . 7 2 . 0 3 . 6
Rubber 1 . 0 0 . 6 0 . 5 0 . 3
Forest produc t s 5 . 3 5 . 4 4 . 8 8 . 2
Fish 2 . 3 3 . 8 4 . 8 1 . 4
Other 2 . 4 2 . 0 1 . 6 2 . 3
To tal domes tic exports 100 . 0 100 . 0 100 . 0 100 . 0
Source : Table A22 .

Re f erences
Colclough , C . and Daniel , P . , 1982 . Wage incomes and wage cos ts in Papua New Guinea: cha l lenges for adjus tment, dis tribution and grc:M th. A rep ort prepared f or the Government of Papua New Guinea ( Commissioned S tudy No . 2 , IDS , Suss ex) .
Coopers and Lybrand , 19 8 3 . Papua New Guinea - Country of Cha llenge and Opportuni ty . A Briefing for overseas Businessmen and Investors , Por t Moresby .
Copes , P . , 1981 . Deve lopment and Management of Papua New Guinea 's Marine Fish Resources , INA Sp eech series No . 14 , P or t Moresby .
Corden , W .M . , 1981 . Inflation, Exchange Rates and the World Economy : Lectures on International Mone tary Economics , ( s econd edition) , Oxford Univer sity Pres s .
Fraser , A . I . , 198 1 . Issues in Papua New Guinea Forest Poliay , Ins t itute of National Affairs Discu s sion Paper No . 7 . Port Moresby .
Garnaut , R . , 1981 . ' The framework of econ omic p olicy-making ' in J .A . Ballard ( ed . ) , Policy Making in a New State: Papua New Guinea 1 9 7 2- 7 7 , St Lucia , Queensland , Univers ity o f Queen s land Press : 157 -2 11 .
�--- and Baxter , P . ( in consul t at ion with Anne Krueger) , 1983 . Exchange Rate and Macro-economic Policy in Independent Papua New Guinea , Port Moresby , Government Printer , February . Also pub lished as Pacific Research Monograph 11 , Nat ional Centre for Development S tudies , Canberra , Australian National University .
and C lunies Ros s , A . , 19 7 5 . ' Uncertainty , risk avers ion and the taxing o f natural resource p roj ects ' , Economic Journal , 85 ( 33 8 ) : 2 7 2-8 7 .
��� and , 1 9 83 . Taxation of Mineral Rents , Oxford , Clarendon Pres s .
141

14 2
Gregory , C . A . , 19 82 . Gifts and Commodi ties , London , Academic Press .
Jacks on , D . , 1981 . The Dis tribution of Incomes in Papua Nehl Guinea , Waigani , Nat ional P lanning Office , February .
Jackson , R . , 198 2 . Ok Tedi : The Pot of Go ld , P ort Moresby , Word P ub lishing .
Johnson , C . J . and Clark , A . L . , 1984 . ' Mineral Exp lorat ion in Developing Countries : The Botswana and P apua New Guinea cases ' unpub lished paper , Res ource Sys tems Ins t i tute , EastWe s t Cent er , Honolulu .
Kne t s ch , J . and Tr eb ilc ock , M . , 1981 . Land Po licy and Economic De ve lopment in Papua Nehl Guinea , Por t Moresby , Ins titute of Na t ional Aff airs .
Meade , J . , 1951 . A Theory of Internationa l Economic Po li cy , Vo l . 1 , The Ba lance of Payments , Royal Ins titute f or Internati ona l Af fairs , Oxf ord Univers ity Press .
Mikesel l , R . F . , 197 5 . Foreign Investment in Copper Mining : Case Studies of Mines in Peru and Papua Nehl Guinea , Baltimore and London , Johns Hopkins Univer sity Press f or Re sources for the Future .
Morauta , M . , 1 9 7 9 . ' PNG ' s Ec onomic Po licy Framework ' , Spee ch Series No . 3 , Inst itute of Nat ional Affairs , P or t More sby .
Overseas Deve lopment Group , 19 7 3 . A Report on Deve lopment Strategies for Papua Nehl Guinea , prepar ed by the Overs eas Development Group , Univer s ity of Eas t Anglia for IBRD /UNDP ( The Faber Rep or t ) , P or t Moresby , Of fice of Programming and Co- ordinat ion , Feb ruary .
Palmer , K . F . , 1 9 7 9 . ' Targe t s and ins trument s of economic policy in Papua New Guinea ' , Yag l-Ambu , Univer s i ty of Papua New Guinea , Journa l of Soc ial Services and Humanitie s , Waigani .
1980 . ' Mineral taxa t ion polic ies in developing countries : an app licat ion of resource rent tax ' , IMF Staff Papers , 2 7 Apr i l : 5 17-42 .
Papua New Guinea Resource Atlas , 19 74 . E . Ford (ed . ) , Queensland , Jacaranda Pre s s .
Papua New Guinea , 1 9 84 . Government White Paper on Industrial Deve lopment , Port Mo resby .
��� , 1 9 7 9 . Report by the Commit tee o f Review into the P lant at ion Redistribut ion S cheme , Port Moresby .
1 4 3
��� , Central Planning O f f ice , 19 76 . National Deve lopment Strategy , Papua New Guinea Government Whi te Paper , Waigani , 2 7 Oc tober .
Depar tment of Finance , 1 9 7 7 . Financial p o licies re lating to rrrining tax legis lation : Statement of in ten t , Waigani , Oc tober .
Na tional Inves tment and Deve lopment Author i ty , 1980 . Nationa i Inves tmen t Priori tie s Schedu le� Sixth Edi tion , Waigani .
��� , National P lanning Off ice , 1 9 7 8a . The Nationa l Puh lic Expendi ture Plan 1 9 7 8- 1 9 8 1 , Waigani , Feb ruary .
��� , Na t ional P lanning Office , 19 7 8b . The National Puh li c Expendi ture Plan 1 9 7 9- 1 9 82 , Waigani , November .
��� , Na tional P lanning Off ice , 1983 . The Nationa l Puh lic Expendi ture Plan 1 9 84 - 1 9 8 7 , Waigani , November .
Office of Fore s t s , 1 9 7 9 . Whi te Paper : Revised Nationa l Fore s t Po licy , Hohola .
Of fice of Fores ts , 1983 . Facts and Figures , Hohola .
Nat ional S tatis tical Off ice , 1 9 7 8 . Statis tica l Bu l le tin , ' Private Over seas Inves tment 197 6 / 7 7 ' , 3 Augus t 197 8 .
Pint z , W . S . , 1984 . Ok Tedi : Evo lution of a Third Wor ld Mining Proje ct , London , Mining Journal Books .
Radet zki , M . and Zorn , S . , 1 97 9 . Financing Mining Projects in Deve loping Countries , London , Mining Journal Books ( in cooperation wi th the Uni ted Nations ) .
Roge rson , R . , Will iamson , A . and Francis , G . , 1984 . ' Recent advances in the knowledge o f geology , energy resource s and me tal logenesis of Pap ua New Guinea s ince 1981 ' , Depar tment of Minerals and Energy , Geological Survey of Papua New Guinea , Report 84/1 P or t Moresby , March .
Smith , D . and Wel l s , L . J . , 1 97 5 . Negotiating Third World Minera l Agreements : Promises as Pro logue , Ballinger , Cambridge Mas s .
Treb ilc ock , M . , 1 9 83 . The Ro le of the Private Sector in the Econorrric Deve Zopment of Papua New Guinea , P or t Moresby , Ins titu te o f National Affair s .

144
Vernon , R . , 1967 . ' Long-run trends in c oncession contracts ' , American Society of International Law : PPoceedings : 8 1- 8 9 .
Woods , R . , 1981 . ' Legal Aspects of the P lantation Red i s tr ibu tion Scheme ' , in M . A . H . B . Wal ter ( ed . ) , What Do We Do About Plantations ? , Monograph No . 3 , IASER , Port Moresby .
Wor ld Bank , 1982 . Papua New Guinea : Se lected Issues in Deve lopment , ( Report of a 1981 economic mis sion) , Washing ton D . C .

�· ' ' '
;! . "\ ' � . . . . � • :, ;
�Aw�fttE o


ISBN 0 86784 761 1 ISSN 0155 9060
\ \