papua new guinea - home - department of foreign … new guinea research into the financing of...
TRANSCRIPT

Robert HorneKen NganganSimaima Tavil-MelachonJustin Brown
April 2014
Research into the Financing of Technical and Vocational Education and Training (TVET) in the Pacific
Managed by the Australian Council for Educational Research and Scope Global on behalf of the Australian Government
Country ReportPapua New Guinea

Research into the Financing of Technical and Vocational Education and Training (TVET) in the Pacific
Papua New Guinea Country Report Robert Horne Ken Ngangan Simaima Tavil-Melachon Justin Brown April 2014

First published 2015 by Australian Council for Educational Research Ltd
19 Prospect Hill Road, Camberwell, Victoria, 3124, Australia www.acer.edu.au Paperback ISBN [978-1-74286-270-5] EPUB ISBN [978-1-74286-271-2] © Commonwealth of Australia 2015 With the exception of the Commonwealth Coat of Arms and where otherwise noted all material presented in this document is provided under a Creative Commons Attribution 3.0 Australia (http://creativecommons.org/licenses/by/3.0/au/) licence. The details of the relevant licence conditions are available on the Creative Commons website (accessible using the links provided) as is the full legal code for the CC BY 3.0 AU licence (http://creativecommons.org/licenses/by/3.0/au/legalcode). This material must be attributed as Research into the Financing of Technical and Vocational Education and Training (TVET) in the Pacific: Papua New Guinea Country Report authored by Robert Horne, Ken Ngangan, Simaima
Tavil-Melachon and Justin Brown (Australian Council for Educational Research) under contract with the Commonwealth of Australia as represented by the Department of Foreign Affairs and Trade who is the copyright owner of the material. The terms of use for the Commonwealth Coat of Arms are available from the It's an Honour website (http://www.itsanhonour.gov.au/). Where a copyright owner, other than the Commonwealth, is identified with respect to this material, please contact that third party copyright owner directly to seek permission. The Department of Foreign Affairs and Trade (DFAT) does not guarantee, and accepts no legal liability arising from or connected to, the accuracy, reliability, currency or completeness of any material contained in this publication. DFAT recommends that readers exercise their own skill and care with respect to their use of this publication. This publication and any views or recommendations of third parties that may be included do not necessarily reflect the views of the Australian Government or DFAT or indicate its commitment to a particular course of action.
National Library of Australia Cataloguing-in-Publication entry
Creator: Horne, Robert Drake, author.
Title: Research into the financing of technical and vocational
education and training (TVET) in the Pacific.
Papua New Guinea country report / Robert Horne, Ken Ngangan,
Simaima Tavil-Melachon, Justin Brown.
ISBN: 9781742862705 (paperback)
9781742862712 (e-pub)
Subjects: Technical education--Economic aspects--Papua New Guinea.
Technical education--Papua New Guinea--Finance.
Vocational education--Economic aspects--Papua New Guinea.
Vocational education--Papua New Guinea--Finance.
Other Creators/Contributors:
Ngangan, Ken, author.
Tavil-Melachon, Simaima, author.
Brown, Justin Patrick, author. Dewey Number: 370.11309953

Research into the Financing of TVET in the Pacific PNG Country Report
iii
TABLE OF CONTENTS
LIST OF TABLES ................................................................................................................. vi
LIST OF FIGURES ............................................................................................................. viii
LIST OF ACRONYMS .......................................................................................................... ix
PREFACE ........................................................................................................................... xi
ACKNOWLEDGEMENTS ................................................................................................... xiii
EXECUTIVE SUMMARY .................................................................................................... xiv
PART I: INTRODUCTION ...................................................................................................... 1
CHAPTER 1. PURPOSES OF THE STUDY ......................................................................... 3
1.1 INTRODUCTION ...................................................................................................... 3
1.2 RESEARCH OBJECTIVES ...................................................................................... 4
1.3 RESEARCH QUESTIONS ....................................................................................... 5
1.4 STRUCTURE OF THE REPORT ............................................................................. 6
CHAPTER 2. RESEARCH APPROACH ............................................................................... 7
2.1 DEFINING TVET IN PNG ......................................................................................... 7
2.2 DATA REQUIREMENTS ........................................................................................ 12
2.3 AVAILABLE INFORMATION SOURCES ................................................................ 12
2.4 REVIEW OF SOURCE MATERIAL ........................................................................ 14
2.5 APPROACH TO FILLING INFORMATION GAPS .................................................. 15
PART II: COUNTRY BACKGROUND ................................................................................. 19
CHAPTER 3. COUNTRY BACKGROUND .......................................................................... 21
3.1 GEOGRAPHY AND POPULATION ........................................................................ 21
3.2 GOVERNMENT ..................................................................................................... 22
3.3 LANGUAGE, LITERACY AND EDUCATION .......................................................... 22
3.4 ECONOMY ............................................................................................................ 24
3.5 EMPLOYMENT AND THE LABOUR FORCE ......................................................... 26
3.6 PUBLIC SECTOR AND PUBLIC SECTOR FINANCES .......................................... 27
PART III: TVET IN CONTEXT ............................................................................................. 33
CHAPTER 4. OVERVIEW OF TVET IN PNG ...................................................................... 35
4.1 STRATEGIC FRAMEWORK FOR TVET ................................................................ 35
4.2 REGULATION AND QUALITY ASSURANCE ........................................................ 37
4.3 TEACHERS AND TEACHER TRAINING ............................................................... 40
CHAPTER 5. TVET PROVISION ........................................................................................ 42
5.1 TECHNICAL AND BUSINESS COLLEGES ........................................................... 42
5.2 UNIVERSITIES AND OTHER HIGHER EDUCATION INSTITUTIONS .................. 45

Research into the Financing of TVET in the Pacific PNG Country Report
iv
5.3 VOCATIONAL TRAINING CENTRES AND COMMUNITY COLLEGES ................. 48
5.4 EMPLOYMENT-BASED TRAINING ....................................................................... 53
5.5 PRIVATE PROVISION AND REGISTERED TRAINING ORGANISATIONS .......... 57
5.6 TRAINING FOR THE INFORMAL ECONOMY ....................................................... 61
CHAPTER 6. AID AND DEVELOPMENT PROGRAMS ....................................................... 66
6.1 AUSTRALIA-PACIFIC TECHNICAL COLLEGE (APTC) ......................................... 66
6.2 THE TVET SKILLS SCHOLARSHIPS PROGRAM (TVETSSP) ............................. 68
6.3 APTC AND TVETSSP COMPARED ...................................................................... 70
CHAPTER 7. ROLE OF TVET IN ECONOMIC AND SOCIAL DEVELOPMENT .................. 71
7.1 TVET IN ECONOMIC DEVELOPMENT ................................................................. 71
7.2 TVET AND SOCIAL DEVELOPMENT .................................................................... 72
PART IV: THE FINANCING OF TVET ................................................................................. 79
CHAPTER 8. FINANCIAL MECHANISMS AND TRENDS IN TVET FINANCING ................ 81
8.1 GOVERNMENT FINANCIAL AND PLANNING MECHANISMS .............................. 81
8.2 FINANCING MECHANISMS FOR THE TVET SYSTEM ........................................ 82
8.3 THE IMPACT OF FINANCIAL MECHANISMS ON PUBLIC PROVISION ............... 86
8.4 THE TRAINING LEVY ............................................................................................ 87
CHAPTER 9. OVERVIEW OF TVET BUDGETS ................................................................. 89
CHAPTER 10. FUNDING TVET INSTITUTIONS AND PROGRAMS .................................. 91
10.1 TECHNICAL AND BUSINESS COLLEGES ......................................................... 91
10.2 FUNDING FOR TVET IN THE UNIVERSITIES .................................................. 101
10.3 STUDENT SUPPORT ........................................................................................ 102
10.4 TVET IN OTHER PUBLIC COLLEGES .............................................................. 103
10.5 EMPLOYMENT-BASED TRAINING ................................................................... 105
10.6 VOCATIONAL TRAINING CENTRES ................................................................ 106
10.7 COMMUNITY COLLEGES ................................................................................. 109
10.8 STRUCTURED TRAINING FOR THE INFORMAL ECONOMY .......................... 111
10.9 FUNDING PRIVATE SECTOR TVET ................................................................. 111
CHAPTER 11. TVET BUDGETS AND AGGREGATE EXPENDITURE ............................. 114
11.1 OVERVIEW ........................................................................................................ 114
11.2 IMPLEMENTATION OF THE TVET SECTOR BUDGET .................................... 119
CHAPTER 12. UNIT COSTS OF TVET PROVISION ........................................................ 122
12.1 HOW UNIT COSTS WERE CALCULATED ........................................................ 122
12.2 UNIT COSTS AT DIFFERENT TYPES OF PROVIDER ..................................... 125
12.3 ‘FAMILIES’ OF PROVIDERS ............................................................................. 128
12.4 FIELDS OF TRAINING ....................................................................................... 130
12.5 PROVINCES ...................................................................................................... 133
12.6 ADDITIONAL COSTS OF BOARDING STUDENTS ........................................... 135

Research into the Financing of TVET in the Pacific PNG Country Report
v
PART V: ISSUES AND FUTURE DIRECTIONS ................................................................ 137
CHAPTER 13. ISSUES AND FUTURE DIRECTIONS ...................................................... 139
13.1 ISSUES .............................................................................................................. 139
13.2 FUTURE DIRECTIONS ...................................................................................... 144
ANNEXES (SUPPORTING INFORMATION) ..................................................................... 147
ANNEX 1. UNIT COSTS OF TRAINING ........................................................................... 149
ANNEX 2. PERSONS CONSULTED DURING THE FIELDWORK .................................... 174
ANNEX 3. ESTIMATES FOR THE SKILLS DEVELOPMENT TRUST FUND .................... 176
ANNEX 4. REGISTERED TRAINING ORGANISATIONS ................................................. 178
ANNEX 5. ROLE AND MEMBERSHIP OF THE NATIONAL REFERENCE GROUP......... 186
ANNEX 6. SURVEY OF TECHNICAL AND BUSINESS COLLEGES ................................ 188
ANNEX 7. ENTERPRISE TRAINING EXPENDITURE SURVEY ...................................... 193
ANNEX 8. CLASSIFICATION AND CODING SYSTEMS USED ....................................... 201
ANNEX 9. SURVEY FORM: PRIVATE TRAINING PROVIDERS ...................................... 205
ANNEX 10. REFERENCES .............................................................................................. 214

Research into the Financing of TVET in the Pacific PNG Country Report
vi
LIST OF TABLES
Table ES.1 Summary of recurrent expenditure and financing for TBCS and VTCs, 2012 (Kina millions) .................................................................................................... xvi
Table 1.1 Countries participating in the study ...................................................................... 3
Table 2.1 A skills/employment/training matrix for PNG ........................................................ 8
Table 2.2 TVET program details ........................................................................................ 12
Table 2.3 Comparison of ASIHE and NDoE data for enrolments in Technical and Business Colleges, 2011 ................................................................................... 14
Table 2.4 Clusters of TVET providers used to structure the data collections ...................... 17
Table 3.1 Projected population of 15-24 year-olds, 2010 to 2025 (‘000) ............................ 22
Table 3.2 Literacy classification for those who attended secondary school, by province .... 24
Table 3.3 Gross National Income per capita 2008-2012, selected countries ...................... 25
Table 3.4 The formal labour market of PNG in 2010 .......................................................... 27
Table 3.5 GoPNG budget balance 2012 to 2014 (Kina millions) ........................................ 28
Table 3.6 Total expenditure and net lending, 2013 to 2017 (Kina millions) ........................ 29
Table 3.7 Education – overall provision in the 2014 budget (Kina millions) ........................ 29
Table 4.1 GoPNG responsibilities relating to TVET ........................................................... 36
Table 5.1 Students and staff at the technical and business colleges, 2013 ........................ 43
Table 5.2 Student to staff ratios at the TBCs, 2008 to 2013 ............................................... 44
Table 5.3 Business and technical colleges: total graduations 2009 to 2011 ....................... 45
Table 5.4 Diploma and certificate enrolments and graduations at PNG universities, 2009-2010 ......................................................................................................... 47
Table 5.5 VTC Enrolments in ‘conventional’ programs, 2009 ............................................. 50
Table 5.6 Eight VTCs – basic data .................................................................................... 50
Table 5.7 Eight VTCs – types of course ............................................................................. 51
Table 5.8 Apprenticeship training intake by occupation, 2007-2012................................... 54
Table 5.9 NATTB data on apprenticeship terminations ...................................................... 55
Table 5.10 Numbers tested competent in NATTB trade tests, 2010-2012 ........................... 55
Table 5.11 Survey of private providers 2012: enrolments and graduations .......................... 58
Table 5.12 RTOs selected for survey in phase 2 ................................................................. 59
Table 5.13 Summary of enrolments and programs at IBS and DBTI, 2011 .......................... 60
Table 5.14 Summary of enrolments and graduations at RTOs surveyed ............................. 61
Table 6.1 Enrolments at APTC relating to PNG, 2011 ....................................................... 66
Table 6.2 Estimated costs of the PNG campus of APTC, 2011-12 (A$) ............................. 67
Table 6.3 TVETSSP cost elements 2012 (Kina 000s) ........................................................ 69
Table 7.1 Gross enrolment rates for primary and secondary schools, 2009-2010 .............. 72
Table 9.1 Budget provision for the administration of the TVET system (Kina 000s) ........... 89

Research into the Financing of TVET in the Pacific PNG Country Report
vii
Table 10.1 Recurrent funding provision for TBCs in the 2014 GoPNG budget (Kina 000s) ................................................................................................................. 91
Table 10.2 Fees at the NDoE technical and business colleges in 2013 (2012 fees in brackets) ............................................................................................................ 93
Table 10.3 Fees charged by TBCs surveyed ....................................................................... 94
Table 10.4 Income sources in 2012 of the 5 TBCs surveyed (Kina 000s) ............................ 95
Table 10.5 Expenditure patterns in 2012 of the 5 TBCs surveyed (Kina 000s) .................... 96
Table 10.6 TBC income, five colleges, 2012 ........................................................................ 97
Table 10.7 TBC income sources, 2010 ................................................................................ 97
Table 10.8 Boarding income and expenditure for two TBCs in 2012 .................................... 98
Table 10.9 Capital funding for TBCs, 2011-2014 (Kina 000s) .............................................. 99
Table 10.10 Recurrent funding for UNRE in the 2013 GoPNG budget ............................... 101
Table 10.11 University fees for undergraduates eligible for HECAS ................................... 102
Table 10.12 GoPNG-funded student support schemes ...................................................... 103
Table 10.13 Provision in the 2014 budget for PNGIPA, WIT and PNG Maritime ................. 104
Table 10.14 Apprenticeship support costs, TVETSSP (Kina) ............................................. 106
Table 10.15 Funding for VTCs in line with the 2013 GoPNG budget (Kina 000s) ............... 107
Table 10.16 VTC subsidies, 2012-2013 ............................................................................. 107
Table 10.17 Community college funding in the GoPNG budget .......................................... 109
Table 10.18 Expenditure on structured training for the informal economy, by provider (Kina 000s) ................................................................................... 111
Table 10.19 Income and expenditure of surveyed private providers, 2012 (Kina 000s) ...... 112
Table 11.1 Summary of budget provision for TVET in PNG, Kina 000s ............................. 115
Table 11.2 Ratio of recurrent expenditure to public funding for five TBCs in 2012 ............. 116
Table 11.3 Rough estimate of TVET expenditure in 2012 .................................................. 117
Table 12.1 Unit cost methodology ..................................................................................... 123
Table 12.2 Costs per enrolment, by provider types and provider name, Kina, 2012........... 126
Table 12.3 Estimated costs per full-time equivalent student .............................................. 127
Table 12.4 Unit costs, by type of provider, 2012 (Kina) ...................................................... 129
Table 12.5 Unit costs, by CEDEFOP field of training, Kina, 2012 ...................................... 131
Table 12.6 Unit costs, by provider type and CEDEFOP field of training, 2012 (Kina) ......... 132
Table 12.7 Unit costs, by provider type and province, Kina, 2012 ...................................... 134
Table 12.8 Impact of boarding on institutional unit costs, Kina, 2012 ................................. 136
Table 13.1 Proposed initiatives to improve TVET administration and data ......................... 146
Research into the Financing of TVET in the Pacific PNG Country Report
viii
LIST OF FIGURES
Figure 2.1 Providers of formal TVET in PNG ...................................................................... 10
Figure 2.2 Structure of the PNG educational system .......................................................... 11
Figure 2.3 Approach to filling information gaps ................................................................... 15
Figure 3.1 Geographic map of PNG .................................................................................... 21
Figure 3.2 Grade 10 and Grade 12 examination entrants, 2005-2012................................. 24
Figure 4.1 PNG National qualification framework (School education, FODE, TVET and tertiary education) .............................................................................................. 39
Figure 5.1 Apprenticeship completions, 2005-2012 ............................................................ 53
Figure 7.1 VTC enrolments per 1000 population, 2011 ....................................................... 73
Figure 8.1 Principal fund flows for technical and business colleges .................................... 83
Figure 8.2 Principal fund flows for vocational training centres ............................................. 84
Figure 11.1 Composition of TVET expenditure, 2012 (%) .................................................. 118
Figure 12.1 Unit costs per enrolment, by provider types and provider name, Kina, 2012 ... 128
Figure 12.2 Unit costs, by ‘family type’ and provider name, Kina, 2012 .............................. 130
Figure 12.3 Unit costs, by CEDEFOP field of training, Kina, 2012 ...................................... 131
Figure 12.4 Unit costs, by provider type and CEDEFOP field of training, Kina, 2012 ......... 133
Figure 12.5 Unit costs, by provider type and province, Kina, 2012 ..................................... 135
Figure 12.6 Unit costs, costs of boarding by provider, Kina, 2012 ...................................... 136

Research into the Financing of TVET in the Pacific PNG Country Report
ix
LIST OF ACRONYMS
ACER
ADB
AOFP
Australian Council for Educational Research
Asian Development Bank
Annual Operational and Financial Plan
APTC
ARB
Australia-Pacific Technical College
Autonomous Republic of Bougainville
ASIHE Annual Survey of Institutions of Higher Education
AusAID Australian Agency for International Development*
CEDEFOP European Centre for the Development of Vocational Training
CHE Commission for Higher Education
CIMC
DFAT
Consultation, Implementation and Monitoring Committee
Department of Foreign Affairs and Trade (Australia)
DfCD
DNPM
Department for Community Development
Department of National Planning and Monitoring
ENBP East New Britain Province
DoLIR
DWU
ETES
Department of Labour and Industrial Relations
Divine Word University
Enterprise Training and Expenditure Survey
GGBDF Ginigoada Business Development Foundation
GNI Gross National Income
GoPNG Government of Papua New Guinea
HECAS Higher Education Contribution Assistance Scheme
IATP Integrated Agricultural Training Program
IFS
IMA
Independence Fellowship Scheme
International Market Allowance
IRC Internal Revenue Commission
K Kina, the PNG currency
Kina PNG currency
MHERST
MDTP
Ministry of Higher Education, Research, Science and Technology
Medium-Term Development Plan
NATTB National Apprenticeship and Trade Testing Board
NCD National Capital District
NDoE National Department of Education
NRG National Reference Group
NTC
OCO
ODA
National Training Council
Overseas Contract Officer
Official Development Assistance
OHE
PEB
Office of Higher Education
Provincial Education Board
PNG Papua New Guinea
PNGNQF PNG National Qualifications Framework
PNGSDP
PoMBUS
PNG Sustainable Development Program
Port Moresby Business College

Research into the Financing of TVET in the Pacific PNG Country Report
x
PoMTECH
PoMCCI
Port Moresby Technical College
Port Moresby Chamber of Commerce and Industry
RTO Registered Training Organisation
SAAC Screening and Accreditation Committee
SDTF Skills Development Trust Fund
SHC School of Hospitality and Community Services
SSR Student to staff ratio
STT
TBCs
TEI
TESAS
TSC
School of Trades and Technology
Technical and Business Colleges
Tertiary Education Institution
Tertiary Education Student Assistance Scheme
Teaching Services Commission
TVET Technical and Vocational Education and Training
TVETSSP TVET Skills Scholarship Program
UNRE PNG University of Natural Resources and Environment
WHP Western Highlands Province
VTC
WNBTC
Vocational Training Centre
West New Britain Technical College
*AusAID was integrated into DFAT in October 2013. Citations of AusAID documents or programs in this report refer to the authorship or structure before that time.

Research into the Financing of TVET in the Pacific PNG Country Report
xi
PREFACE The project Research into the Financing of Technical and Vocational Education and Training (TVET) in the Pacific was managed by the Australian Council for Educational Research (ACER) and Scope Global on behalf of the Australian Government. The project was undertaken between 2012 and 2014 under contract to the Australian Government, initially through AusAID and then the Department of Foreign Affairs and Trade (DFAT). The study was conducted in seven Pacific countries: Fiji; Kiribati; Papua New Guinea; Samoa; Solomon Islands; Tonga; and Vanuatu. The aims of the research were to produce, in conjunction with host country governments and TVET stakeholders, comprehensive analyses of the systems for financing TVET and discussions of policies through which the financing of TVET could be made more efficient and effective. This volume is one of the seven country reports produced by the study. I am very appreciative of the assistance provided by Leo Maglen as Research Coordinator, Jim Jones as Operations Manager, and Justin Brown who worked across all seven studies. I am also very appreciative of all the work done by the members of the seven country teams: Fiji: Leo Maglen (Lead Researcher), Mark Weston Wall (Researcher), Manaini Rokovunisei (National Consultant), Daniel Lafu Taufaga (In-Country Manager) Kiribati: Prabir Majumdar (Lead Researcher), Teweiariki Teaero (Researcher), Linda Uan (In-Country Manager) Papua New Guinea: Robert Horne (Lead Researcher), Ken Ngangan (Researcher), Simaima Tavil-Melachon (National Consultant), Meghan Toka and Peter Mulligan (In-Country Managers) Samoa: Leo Maglen (Lead Researcher), Justin Brown (Researcher), Salā Perive T. Lene (National Consultant), Frances Soon-Schuster (In-Country Manager) Solomon Islands: Andrea Bateman (Lead Researcher), Elizabeth Cassity (Researcher), Judy Fangalasuu (National Consultant), Bob Pollard (In-Country Manager) Tonga: Andrea Bateman (Lead Researcher), Justin Brown (Researcher), Meleoni Uera (National Consultant), David Wyler (in-Country Manager) Vanuatu: Ray Powell (Lead Researcher), Julie Kos (Researcher), Henry Vira (National Consultant), Kathryn Nako (Consultant), Lou Cochrane (In-Country Manager)
The project benefited greatly from the engagement and input from the seven participating national governments, the National Reference Groups established in each country, the relevant DFAT country posts, TVET authorities and providers, NGOs, employers, regional organisations and a range of other TVET stakeholders. Without their contributions and willingness to work with the teams, the project would not have been possible.

Research into the Financing of TVET in the Pacific PNG Country Report
xii
I would also like to gratefully acknowledge the assistance provided by the Research Steering Committee chaired by Kaye Schofield, the reviewers of draft reports, and the DFAT managers of the project. The analyses, opinions and conclusions herein do not represent the views of DFAT, national governments, or any other organisation or individual, unless stated otherwise.
Phillip McKenzie Project Director ACER

Research into the Financing of TVET in the Pacific PNG Country Report
xiii
ACKNOWLEDGEMENTS In preparing this report we owe a great debt to the many PNG people who gave us their time, and welcomed us at their institutions, in order to inform us about TVET in PNG. A list of the stakeholders consulted is in Annex 2. A special burden fell upon staff concerned with TVET at the National Department of Education, the National Training Council, the Office of Higher Education and the National Apprenticeship and Trade Testing Board, and on the respondents to our surveys. We warmly thank them. We particularly acknowledge those who agreed to serve on the PNG National Reference Group (NRG) established to guide and facilitate the research, and to Mr Reichert Thanda (Assistant Secretary, Department of National Planning and Monitoring) for making the time to be the Chair. NRG members are listed in Annex 5 along with the meetings that were held. NRG members and others made valuable contributions at the national workshop held in Port Moresby on 6 March 2014. The team was very ably supported by Scope Global (formerly Austraining International). Particular thanks are due to Meghan Toka who was in-Country Manager until she went on leave in August 2013, and to Peter Mulligan who subsequently took on the ICM role. We also warmly thank those members of the DFAT staff in Port Moresby who advised and supported us, especially Jane Christie, Keith Joyce, and Prisca Mauve. Dr Ken Ngangan was a member of the team throughout the fieldwork but resigned in September 2013 on his appointment as Acting Secretary of the Department of Finance of Papua New Guinea. Ken was invaluable, especially in enabling contact with a wide range of people in PNG, advising on approaches, and assisting Simaima Tavil-Melachon and myself with the fieldwork. Justin Brown from ACER joined the team following Ken’s resignation to assist with the preparation of this report. The views expressed in the report are ours, as is responsibility for any errors and omissions. Robert Horne

Research into the Financing of TVET in the Pacific PNG Country Report
xiv
EXECUTIVE SUMMARY This report provides a detailed analysis of the financing of Technical and Vocational Education and Training (TVET) in Papua New Guinea (PNG). The report is part of the study Research into the Financing of TVET in the Pacific initiated through Australia’s aid program in 2012. As well as PNG, the overall study involves six other Pacific countries; Fiji; Kiribati; Samoa; Solomon Islands; Tonga; and Vanuatu.
The overall study team developed a general framework and set of data collection instruments to guide the work. Individual country teams adapted the general framework and instruments to meet national circumstances. PNG is by far the largest of the seven countries in population and land area, and has a great diversity of terrain, language and culture. To allow for this size and complexity, the PNG study was conducted in two phases:
Phase 1 (including 8 weeks of in-country fieldwork in 2012), focused on developing a methodology for calculating the level of private sector investment in TVET, and on planning the approach to the full country study in Phase 2; and
Phase 2 (including 12 weeks of in-country fieldwork in 2013) completed the PNG study using the overall project methodology as adapted in light of the detailed exploratory work undertaken in Phase 1.
The PNG work was guided and supported by a National Reference Group (NRG) established for the study.
The broad definition of TVET provided in the Research Brief for the purpose of the research was:
Post-secondary education and training programs designed to develop vocational skills. Degree and higher level programs, and subjects delivered as part of general education by secondary schools, are not included in this definition.
In PNG, four Government entities have significant stakes in the supervision and supply of TVET that falls within the study’s scope: the National Training Council (NTC); the National Department of Education (NDoE); the Office of Higher Education (OHE); and the National Apprenticeship and Trade Testing Board (NATTB). The team worked with all four organisations and through them with the training providers. Phase 1 overview Work in Phase 1 focussed mainly on the 200 or so Registered Training Organisations (RTOs) supervised by the NTC. Most of the RTOs are private, but a few public training providers that fall outside the responsibilities of the NDoE and OHE are also required to register. The limited data that was able to be collected from RTOs suggests the following broad picture of the sector.
RTOs are geographically concentrated. Two-thirds were located in the National Capital District (NCD) and a further 20% in the provinces of East New Britain and Morobe. In other provinces there were very few RTOs.
Most RTOs are small. Three-quarters are registered with five or fewer trainers, but the few large RTOS account for a disproportionate share of the students.
Most of the registered courses are in business and information technology, as well as special skills in demand in PNG such as security guarding. Trade technology accounts for about an eighth of registered courses.

Research into the Financing of TVET in the Pacific PNG Country Report
xv
Only a small minority of RTO courses were aligned with the PNG Qualifications Framework for TVET. Many providers issue their own qualifications. A few of the larger RTOS have partnerships with international providers that link their courses to qualifications issued by other countries, especially Australia.
In Phase 1 the team also developed detailed plans for the Phase 2 fieldwork. It was found that the limited data collections on TVET financing held by central authorities would need to be supplemented by first-hand data collections from providers of TVET. The exploratory work in Phase 1 also found that e-mail addresses were not available for many providers (public as well as private) and that postal surveys drew a very low response. Accordingly, Phase 2 was designed so that each provider to be surveyed would receive two visits – one to deliver and explain the survey form, and a second to review the entries and collect the material. Because the outlying provinces of PNG can only be reached by air, and in some cases security escorts are required for road travel, the need for these visits was highly significant for the study’s planning and budgeting. In order to provide economically for the visits, the Phase 2 fieldwork focussed on four clusters of providers located in: the NCD; Mount Hagen and Western Highlands Province; Lae, and the provinces of Morobe and Madang; and East New Britain. As the selection of providers in these clusters was not, and could not be, a random sample, the results are illustrative for PNG, not statistically representative.
Phase 2 overview
The NRG approved the Phase 2 plan in April 2013. It provided for fieldwork in the four clusters to cover the four principal types of TVET provider within the study’s scope:
The technical and business colleges (TBCs) which are the main public providers of diploma and certificate courses;
The universities which provide some diploma courses, and in some cases part-time courses for those in work;
The vocational training centres (VTCs) run by provinces which offer general education and basic instruction in crafts and skills; and
RTOs, which are mainly privately owned, relatively small, and provide a diversity of courses.
Five TBCs existing in 2013 were visited and surveyed, as were eight VTCs, two universities, and eight RTOs. As well as collecting data on programs, enrolments and finances, cross-cutting themes for the institutional visits were the role of TVET for people in the informal economy, and the work of industry trainers and apprenticeship schemes. In addition to the institutional surveys the team gathered information from government stakeholders and NGOs about financial mechanisms applicable to TVET including government budgets, fee-setting, training levies and training funds. Principal findings Public providers of TVET The best known providers of TVET are the TBCs and the VTCs. They are funded through a combination of support from the Government of Papua New Guinea (GoPNG) which is mainly for teacher salary costs, and tuition fees. Table ES1 summarises the estimates of recurrent expenditure and sources of financing in 2012.

Research into the Financing of TVET in the Pacific PNG Country Report
xvi
Table ES.1 Summary of recurrent expenditure and financing for TBCS and VTCs, 2012 (Kina millions)
Type of Institution Enrolments Recurrent
expenditure
Financed by
GoPNG support Fees
Technical and Business Colleges 5,000 K34.5m K15.4m K19.1m
Vocational Training Centres 22,000 K47.6m K40.4m K7.2m
In these estimates student support from public funds, and GoPNG VTC fee subsidies, are counted as GoPNG support, as well as the funding for teacher salary costs. In 2013 the GoPNG subsidy for VTC fees was raised to 100%. Capital expenditure for TBCs and VTCs is hard to estimate: perhaps about K8 million of actual expenditure from the GoPNG Budget in 2012, and a similar amount from donors. Almost all of this went on TBCs. GoPNG capital spending on VTCs is small: there may have been significant sums from provinces and districts. The latest estimate of capital expenditure on community colleges in 2012, funded by a loan from China, is K15 million. Other public providers of TVET (as defined for this study) include:
The universities, spending in 2012 about K13.6 million on around 1,000 TVET students on campus and 750 external, funded by about K10.6 million in GoPNG direct support and K3 million in fees;
Free-standing public providers. Among these in 2012 GoPNG allocated K3.2 million to the PNG Maritime College for 334 students, and K2.1 million to the Works Institute for 155 students.
Special initiatives that provide TVET to international standards are:
The Australia-Pacific Technical College (APTC) which enrolled 153 students at its PNG campus in 2011 at an estimated cost of K10.7 million funded by the Australian Government; and
The TVET Skills Scholarships Program (TVETSSP) which provided scholarships to 256 students in 2012 at an estimated cost of K24.8 million, funded by GoPNG.
Within the public sector there are large cost differentials between TBCs and VTCs, and between TBCs and institutions sponsored by other parts of Government which offer similar qualifications. The gap in the cost of the provision of TVET between PNG and international providers is very wide indeed. Part of this gap can be accounted for by the higher quality of the international provision, but part reflects the fact that it has higher cost structures. In general, the quality of most TVET provision in the public sector is below what the PNG economy requires. Infrastructure and teacher training do not yet match the requirements of the competency-based qualifications being implemented. There are important issues about the sustainability of parallel networks of VTCs and community colleges; and about VTCs offering free tuition in formal qualifications for which TBCs and private providers have to charge fees. Private providers of TVET The private sector in PNG offers a wide variety of TVET courses. In most cases, fees are by far the largest source of funding. Fees are generally paid by the students, although there are some contributions by employers and other sources. Access to student support is limited to the minority of private providers eligible for national or provincial support schemes.

Research into the Financing of TVET in the Pacific PNG Country Report
xvii
The private providers most directly comparable with the public providers are those which offer externally accredited formal qualifications. These are relatively few in number. Their fees per course week tend to be significantly higher than those of the public providers, partly reflecting the public subsidy supporting the latter. Fees per qualification obtained may be more closely comparable because some of the private providers aim to get students to qualification more quickly. Other private providers offer a local service, usually offering their own qualification. Their costs per student may be similar to those of VTCs, but they usually have to recover all or most of their costs through fees. It is the policy of the NTC that all private providers should move to qualifications under the PNG Qualifications Framework for TVET. The top tier private providers can deliver TVET of good quality for PNG, including qualifications within the Australian Qualifications Framework, at costs well below those of special initiatives such as APTC and TVETSSP. Their courses are mainly in the Business/IT/Hospitality fields of study where entry costs are lower. Some provinces are developing partnerships with the private sector so as to meet some of the demand for TVET expansion in ways which enlarge opportunities for students at moderate cost to government. Local private providers face a squeeze from the pressure to move to national qualifications and competition from fee-free VTCs. They watch their costs carefully and may be able to get through as long as the public doubts the quality of VTC provision – or simply can’t access it in their area. A few have help from local or national student support schemes. GoPNG needs to consider the equity of requiring local private providers to meet the requirements of National Certificates 1 and 2, and encouraging VTCs to do the same but on a tuition fee-free basis. TVET for employees PNG has a small but growing apprenticeship scheme. Both firms and TBCs offer the off-site training component – 8 week extension courses. The NDoE sets a fee limit - about K1200 for a day student in 2013 -for the TBC courses even though the fees are normally paid by employers. Employers are critical of the quality of the TBC courses. When employers run the courses themselves fees are much higher – up to K5000, illustrating that employers are willing to pay more for good quality. There is some provision for post-experience work-place training. Universities offer short courses, and at least one offers the opportunity to obtain a diploma through courses combining distance education and short periods of residential study, with fees set to recover full costs. There is also a public provider – PNG Institute of Public Administration – which has a large government subsidy to deliver courses mainly for government employees. GoPNG raises a training levy of 2% of payroll from employers whose payroll exceeds K200,000. Liability for the levy is calculated net of qualifying training expenses. Most employers record sufficient such expenses to extinguish their liability for levy. Over the years 2011-13 the yield of the levy was reported at amounts varying from K2.8 million to K4.7 million, of which the National Training Council received about K1.5 million to distribute to firms providing training. The levy is thus a very modest source of funds for training. Firms get some incentive to incur qualifying training expenses which they can off-set against their levy liability. Unit costs at TVET institutions The surveys yielded data on unit costs for 23 TVET institutions in PNG, spread across universities, colleges and vocational centres, both public and private. Some findings are:

Research into the Financing of TVET in the Pacific PNG Country Report
xviii
Unit costs at the TBCs are two to three times those at the VTCs, but significantly less than those of TVET courses at the universities;
Variations between providers seem to be driven mainly by salary structures, student to staff ratios and sectoral funding mechanisms. There is no systematic difference between providers specialising in trade technology and in business studies;
Private providers are widely spread. A large private business college had unit costs slightly higher than the public colleges. Some local providers had costs within the band observed for public VTCs, but there were outliers above and below that level; and
Firms surveyed did not track the cost of their TVET courses as such, but where courses are open to applicants from outside the firm, fees charged can be much higher than the fees charged by public providers.
Improving efficiency in the use of funding Responsibilities for the administration of TVET are fragmented within GoPNG, and so too are responsibilities for funding. An overarching body to administer TVET would be able to rationalise funding, produce a single, coherent qualifications framework, and consider the potential of the private sector alongside that of the public sector. Such a body might also have carriage of harmonising data standards and collections for the sector, and facilitating the information flows needed to produce an informed market for TVET. Funding for TVET is not sufficiently transparent. The report documents the work of two trusts with substantial resources for TVET at their disposal and which have not given account to the Government or the public. It is not easy to tell how much Government agencies have actually spent on TVET. Such accountability is needed to ensure that resources are used for the purposes intended. There are significant concerns about the procurement of capital works – delays, and waste. Government agencies may need to make more use of outside expertise to get value for money in capital procurement. More efficient use of resources is desirable in its own right but the overall quantum of resources also merits attention, having regard to PNG’s increasing population and participation in the higher school grades, and the demands of the PNG economy for a higher skills profile. GoPNG funding is not likely to accommodate the need for expansion on its own. A broader funding base is needed, including charges to employers which reflect the cost of the service, and encouraging expansion of the private provision of training.

PART I: INTRODUCTION


Research into the Financing of TVET in the Pacific PNG Country Report
3
CHAPTER 1. PURPOSES OF THE STUDY
1.1 INTRODUCTION
This report concerns the financing of Technical and Vocational Education and Training (TVET) in Papua New Guinea (PNG). The report forms part of the study Research into the Financing of TVET in the Pacific initiated by the Australian Agency for International Development (AusAID). In April 2012 AusAID and later DFAT contracted the Australian Council for Educational Research (ACER) to conduct the study. ACER led a consortium including Scope Global (which was responsible for logistics, in-country support and employment of national consultants) and specialist research consultants.
The study was conducted in seven countries: Fiji; Kiribati; PNG; Samoa; Solomon Islands; Tonga; and Vanuatu. The aims of the research were to produce, in conjunction with host country governments and TVET stakeholders, comprehensive analyses of the systems for financing TVET and discussions of policies through which the financing of TVET could be made more efficient and effective.
The research was guided two over-arching questions:
1) What are the current sources of post-secondary TVET finance? Will they sustain a quality TVET system? Why / Why not?
2) How efficient and effective is the current use of TVET funding? How could it be improved?
The individual country studies were based on a common conceptual framework and research approach, adapted to meet national circumstances. The timing of the fieldwork in participating countries is outlined in Table 1.1. Table 1.1 Countries participating in the study
Stage One (fieldwork in 2012) Stage Two (fieldwork in 2013)
Samoa Fiji
Tonga Kiribati
Vanuatu Solomon Islands
PNG (Phase 1) PNG (Phase 2)
PNG is the largest and most diverse of the countries in the overall study. Seven million people inhabit a land area of over 450,000 km2, spread across a mainland and numerous other islands. Because of the mountainous terrain, communities sprang up in isolation from one another. Road connections between the various parts of the mainland are still few. In all, about 800 indigenous languages are spoken. The most common languages are Melanesian Pidgin (colloquial), Motu, and English (in schools, government and bigger businesses).
Because of PNG’s size and complexity, the PNG country study was conducted in two phases in 2012 and 2013. The report of Phase 1 was finalised in April 2013.1 This second report is designed to be self contained and includes relevant information from the Phase 1 report.
1 Papua New Guinea, Report on Phase 1 and Proposed Plan for Phase 2, by Robert Horne, Ken
Ngangan, and Simaima Tavil-Melachon, ACER, April 2013.
Research into the Financing of TVET in the Pacific PNG Country Report
4
1.2 RESEARCH OBJECTIVES
Developing vocational and technical skills and enhancing employability are strategic objectives in the Pacific Islands Forum's Pacific Plan for Strengthening Regional Cooperation and Integration (2007), Australia's Port Moresby Declaration (2008) and the Forum Education Ministers' Pacific Education Development Framework (2009). Background research for the Research Brief developed by AusAID (2011) concluded that, to help achieve skills development and employability objectives, national governments, donors and other TVET stakeholders need a comprehensive understanding of public and private investment in TVET, taking into account the sources of funding, costs of services, size and patterns of expenditure, financing mechanisms, and outcomes delivered. Nevertheless, the background research concluded that there was a dearth of up-to-date information about these aspects of skill development in the Pacific. The research is intended to help fill this gap by:
a) identifying the current public and private sources of capital and recurrent funding for TVET and the relevant expenditure from each source;
b) identifying where expenditure is directed – taking account of the participation of females and males – and through what distribution mechanisms;
c) identifying the TVET outcomes provided for the funds allocated, including a comparison of the costs of TVET training between different types of providers, fields and level of training, duration, mode of delivery and geographic location; and
d) assessing the strengths and weaknesses in different contexts of different financing mechanisms being used and identifying directions for financing mechanisms that are more likely to ensure financially sustainable TVET systems.
The broad definition of TVET provided in the Research Brief for the purpose of the research is as follows:
‘Post-secondary education and training programs designed to develop vocational skills. Degree and higher level programs, and subjects delivered as part of general education by secondary schools, are not included in this definition.’
Chapter 2 discusses how this definition was applied in the PNG context. The PNG work has been guided by a National Reference Group (NRG) established for the study. The NRG comprised senior representatives of: the Department of National Planning and Monitoring; the Department of Education; the Office of Higher Education; the National Statistical Office; the National Training Council; the National Apprentice and Trade Testing Board; the National Polytechnic Institute; the Star Mountain Institute of Technology; the International Education Agency; the Port Moresby Chamber of Commerce; the Employers Federation; and the Port Moresby Post of the Australian Government. The NRG’s membership is set out in Annex 5.

Research into the Financing of TVET in the Pacific PNG Country Report
5
1.3 RESEARCH QUESTIONS
The Research Brief asks the study to address at a minimum the following questions:
Sources of funding
What are the current public and private sources of capital and recurrent funding for TVET?
What is the relative contribution from each source in terms of the overall funding of TVET?
What is the level of reliance on donor funding?
What is the level of reliance on foreign private funding, and are there strategies in place to limit risks if there is a danger of funding being removed at short notice as investment decisions change?
What non-financial inputs are provided for TVET, from what sources, and what is their estimated value?
Expenditure
What is the overall level of public and private expenditure on TVET?
What is the total government expenditure on TVET as a proportion of total government expenditure and what is the relative contribution of national and provincial governments?
What is TVET’s share of the education sector budget?
To what extent is there a gap between budget allocation to TVET and expenditure?
Where is expenditure directed, and through what allocative mechanisms?
What proportion of expenditure on TVET could be defined as quality related expenditures?
Cost of TVET Services
What is the most useful unit of analysis for assessing the costs of TVET services?
What are the TVET services provided for the recurrent funds expended, and can they be quantified?
What are the comparative costs of TVET between different types of providers?
What proportions of total costs are costs of wages and salaries, materials/consumables, and infrastructure?
What is the cost of capital?
What areas offer the greatest potential for improved cost efficiency?
Financing Mechanisms
What funding mechanisms are currently being used to finance or co-finance TVET?
How efficient and effective are these different mechanisms? To what extent are they responsive to demand from industry, communities and individuals? To what extent are they being used to promote inclusion of groups at risk of labour market and social exclusion?
How successful are these mechanisms in providing the country with a predictable and sustainable source of financing for skills development?
What policy measures are in place to improve diversification and sustainability in funding mechanisms?

Research into the Financing of TVET in the Pacific PNG Country Report
6
Is the existing funding model sustainable if access to TVET is to be expanded?
What changes would ensure more financially sustainable and demand-based national TVET systems?
This report addresses these questions for PNG to the extent possible with the time and resources available.
1.4 STRUCTURE OF THE REPORT
The report is structured in five main parts. The other country reports follow a similar structure. The broad structure for the country reports was developed in consultation with Australian Government representatives and the project’s Research Steering Committee. It is intended to produce country reports that address the questions in the Research Brief, and which facilitate comparative analysis across the seven country reports. Within the overall report structure the individual country reports have some different emphases that reflect national factors and the data available for analysis. Part I concludes with Chapter 2 which provides a detailed description of the research approach used in PNG, including the data collection instruments that were developed. Part II (Country Background) outlines the broad national context of PNG. In Part III (TVET in Context) the report provides a detailed description of TVET institutions and activities in PNG, and discusses access to educational opportunities, the contribution of TVET to economic development, and developments and issues concerning the quality of TVET. Part IV (The Financing of TVET) presents the main findings and analyses from the study. TVET funding and expenditure patterns and trends are presented and analysed. The financial mechanisms that channel resources into and throughout the TVET sector are identified and analysed. The unit costs of TVET delivery in different programs and institutions are estimated, and their implications discussed. Part V (Issues and Future Directions) summarises the overall conclusions of the study and identifies key issues identified, and broad policy directions identified for consideration by the Government of PNG, other TVET stakeholders, and development partners. Further details on the study are provided in the Annexes.

Research into the Financing of TVET in the Pacific PNG Country Report
7
CHAPTER 2. RESEARCH APPROACH
The Research Brief requires the systematic gathering and analysis of information under four broad headings:
sources of funding for TVET;
expenditure patterns and trends in TVET;
costs of TVET delivery; and
financing mechanisms.
This chapter describes the approach taken to these tasks in PNG. The approach is consistent with the general framework developed to guide the overall study, but with some modifications to reflect PNG’s circumstances and context. Because of PNG’s size and complexity the fieldwork was conducted in two phases:
Phase 1 (in 2012), which focused on developing a methodology for calculating the level of private sector investment in TVET, and on scoping the approach to the full country study in Phase 2; and
Phase 2 (in 2013) which completed the country study using the overall project methodology as adapted in light of the detailed exploratory work undertaken in 2012.
The results of the Phase 1 work were reviewed by external reviewers and the National Reference Group, revised in early 2013, and endorsed by the NRG in April 2013.
2.1 DEFINING TVET IN PNG
The first task was to determine the scope of TVET in PNG. The broad definition provided in the Research Brief for the overall study was:
Post-secondary education and training programs designed to develop vocational skills. Degree and higher level programs, and subjects delivered as part of general education by secondary schools, are not included in this definition.
A matrix (Table 2.1) was used in order to relate education provision in PNG to qualification levels and occupational skills. The matrix was based on the framework developed for the overall study. It is important to bear in mind that, as regards the classification of occupational skills, only about a quarter of PNG people of working age are in paid employment. Institutions identified as providing structured TVET programs are classified according to whether they are public, private or regional TVET providers based in the country, other Government line ministries and agencies that offer TVET-type programs, and employers in the state-owned enterprise (SOE) and private sectors. The provision shaded green and grey lies within the scope of the PNG study. It was agreed at the outset that training at those qualification levels for the armed forces, primary school teachers, nurses and the police were outside the scope.

Research into the Financing of TVET in the Pacific PNG Country Report
8
Table 2.1 A skills/employment/training matrix for PNG
PNG Qual. Framework
level of skills training
Occupational skills category
(ISCO 08)
Providers
Training institutions Govt. Ministries &
agencies, state-owned enterprises,
other employers
Public Private Regional
10 Doctoral
1/2
Managers
Professionals
Public universities
Private universities.
Other recognised institutions of higher education.
Legal Training Institute
9 Masters
8 Postgrad. Dip. Postgrad. Cert.
Hons. Degree
7 Bachelor degree
Grad. Dip. Grad. Cert.
6 Advanced Diploma
3
Technicians
Associate Professionals
Public universities
Technical and Business Colleges (TBCs)
RTOs
Registered Training Organisations (RTOs)
PNG Institute of Public Administration (PNGIPA) 5 Diploma
4/3
Certificate Level 4
Certificate Level 3
4 Skilled trades
TBCs
Public apprenticeship training providers
RTOs
Australia-Pacific Technical College
PNGIPA
PNG Maritime College
Dept of Finance Training Branch
Works Institute of Technology
Firms approved to provide apprentice training
Trade testing centres – Level 3
5 Skilled clerical
6 Skilled agricultural, forestry and fishery workers
7 Craft and related trades workers

Research into the Financing of TVET in the Pacific PNG Country Report
9
PNG Qual. Framework
level of skills training
Occupational skills category
(ISCO 08)
Providers
Training institutions Govt. Ministries &
agencies, state-owned enterprises,
other employers
Public Private Regional
2/1
Certificate Level 2
Certificate Level 1
4 Clerical support workers
TBCs
VTCs
Some apprenticeship training
RTOs Others
Trade testing at Levels 1 and 2
5 Service and sales workers
8
Plant and machine operators
Assemblers
N/A Basic manual
9 Elementary occupations
VTCs. RTOs
N/A Short / foundation programs
N/A
Enabling programs
VTCs NGOs
RTOs
Notes:
The scope of the study is shaded in grey and in green.
In PNG there are separate but overlapping qualification frameworks for higher education and for TVET. Qualifications
at Bachelor and above are governed by the higher education framework. Diploma and certificate qualifications are
mainly covered by the TVET framework, with some accredited to the HE framework.
Levels 1, 2 and 3 are used by the National Apprenticeship and Trade Testing Board to denote at Level 1 a basic level
of skill, at Level 2 semi-skilled, and at Level 3 a fully trained tradesman. These levels do not precisely align to the
TVET qualifications framework.
In the public sector legacy qualifications are common, and in the private sector certificates are issued by the provider
and some overseas qualifications. Assumptions have to be made about the equivalence of these qualifications with
the TVET framework.

Research into the Financing of TVET in the Pacific PNG Country Report
10
As is detailed in Part III of this report, TVET provision in PNG which falls within the scope of the study includes:
a) The Technical and Business Colleges which are national institutions under the National Department of Education (NDoE);
b) Courses within the universities below the level of Bachelor degree which have a vocational aim;
c) Certain colleges offering more specialist TVET, often supervised by Ministries other than NDoE and the Ministry of Higher Education, Research, Science and Technology (MHERST) ;
d) Vocational Training Centres, technical secondary schools and community colleges;
e) Private colleges and firms engaged in formal training;
f) Structured training for the informal economy.
Figure 2.1 illustrates the various forms of formal TVET provision. (The division of policy and governance responsibility among the main agencies involved is detailed in Part III of this report.) The numbers of institutions are given for each. There are some overlaps between categories of institution which are explained in the ensuing sections relating to individual categories. Figure 2.1 outlines only the principal relationships between institutions and government supervisory bodies. For that reason it omits one important player on the scene – the National Apprenticeship and Trade Testing Board (NATTB) which, like the National Training Council (NTC) is part of the Department of Labour and Industrial Relations (DoLIR).
Figure 2.1 Providers of formal TVET in PNG
Office of Higher Education
6 Universities 4 Other HE institutions
Department of Education
22 Provinces
8 Tech & and Bus Colleges
110 Vocational Training Centres
6 Technical high schools, 5 community colleges
National Training Council
204 Registered Training
Organisations
21 Industry trainers
19 larger, generalist RTOs
151 smaller RTO colleges
13 Public RTOs

Research into the Financing of TVET in the Pacific PNG Country Report
11
Figure 2.2 is the standard diagrammatic representation of the PNG education system as a whole, drawn from the NDoE website. It will be noted that vocational training centres enrol post-primary students, whereas the general definition of TVET applying in this study relates to post-secondary education and training. Specialist technical schools are within the scope of the study, and there are a few schools so named in PNG. However at present such schools have no formal status in PNG – the NDoE regards them as a development for the future. Accordingly, this report does not consider the work of technical secondary schools in PNG. Eight was the number of technical and business colleges during our fieldwork in 2012-13. A ninth college – on Bougainville Island – joined the network at the start of 2014.
Figure 2.2 Structure of the PNG educational system
Notes: There are three years of elementary school (Preparatory to Grade 2) taught in the local language of the area.
There are six years of primary school (Grades 6 to 8).
Students may complete their education at the end of Grade 8 and enter employment. Students continuing education after Grade 8 may enter Lower Secondary School (Grades 9 to 10), study for school grades through the College of Distance Education, or enter a Vocational Training Centre.
PETT Technical Colleges offer pre-employment technical training; they include the TBCs. Many of the courses in these colleges now have their main entry after Grade 12 rather than after Grade 10.
Community Teachers refers to the community-based system of training teachers for the elementary schools. It is outside the scope of this study.
Source: National Department of Education.

Research into the Financing of TVET in the Pacific PNG Country Report
12
2.2 DATA REQUIREMENTS
Analysis of financial flows and mechanisms, the estimation of unit costs of TVET provision and assessment of TVET program outcomes require a solid base of comprehensive, reliable, current and frequently up-dated information. The key data identified for the study comprised the fields and sub-fields shown in Table 2.2. Table 2.2 TVET program details
Area Details
Program offerings - course levels, fields, duration etc - fees and student assistance - maximum student contact hours
Student numbers
- enrolments, new and total - graduates (successful completions) - student training hours - student outcomes (tracer data)
Staffing
- staff numbers and categories - equivalent full-time staff - teaching loads, etc
Funding sources
- Government annual budget allocations - Targeted ODA grants - Student fees - Sale of products and services - Industry/employer contributions - Churches and community - Other sources
Expenditure categories – planned and actual
- Recurrent expenditure - Personnel – staff salaries and other emoluments - Direct operating expenses – utilities, teaching materials and
consumables, etc - Overhead expenses – for example, pro-rata share of general
institutional costs of administration - Development expenditure – staff development, curriculum
development, etc - Capital programs – civil works, equipment, etc
Scholarship and other student assistance programs
- Scholarships and other forms of student assistance (living allowances, rent assistance, subsidized accommodation, etc) are transfer payments
2.3 AVAILABLE INFORMATION SOURCES
The team conducted an extensive review of the data that are currently available for PNG during Phase 1 of the study in 2012. (Annex 10 lists all the references used in the study.) This review included desk analysis and discussion with the National Reference Group and key organisations. Its main purpose was to minimise the data burden on TVET stakeholders by making use of existing data and confining any new data collections to filling data gaps. PNG has forward plans for the whole of government which include the TVET sector, and the individual Government agencies most concerned with TVET have produced their own plans and policies for the sector. The principal documents are outlined in Chapter 4. As regards data, each of the main government agencies shown in Figure 2.1 maintains its own records about the part of the system for which it is responsible, and some publish statistics and reports. In outline the sources are:

Research into the Financing of TVET in the Pacific PNG Country Report
13
NDoE maintains records of enrolments at the TBCs and the VTCs. Statistics
prepared from these records are eventually published on the NDoE website.2 The
latest published Statistical Bulletin is for 2008, though the Team has a draft copy of
the 2009 Bulletin. For practical purposes the Team relied for the TBCs on summaries
prepared by TVET Wing of NDoE, which are available up to 2013. These cover
student numbers by gender and by course, and teacher numbers. For the VTCs,
information is collected through the annual school census. For years later that 2009
the Team had some access to the information used for school fee subsidy
calculations (no of subsidy-eligible students per centre, no of centres per province).
OHE conducts the Annual Survey of Institutions of Higher Education (ASIHE). ASIHE
applies by statute to all recognised IHEs – within our scope to the universities, both
public and private, to the TBCs, and to Don Bosco Technological Institute, the
Institute of Business Studies and PNG Maritime College. As well as student and
teacher numbers, it covers certain other fields, notably graduations and sponsorship
(whether a student is self-supporting or has a scholarship). ASIHE is not published
as such but is circulated, about 2 years after the survey date, to respondents. OHE
gave the 2009, 2010 and 2011 Surveys to the Team.
NTC has on its website3 lists of Registered Training Organisations which include
addresses, and registered trainers. There is a separate list of registered courses, not
classified by institution. There are no RTO statistics, as was discussed in our Phase
1 Report. A few of the larger private providers publish useful information on their own
websites.
NATTB maintains records of apprenticeships intakes and completions, and of trade
tests. No statistics are regularly published but NATTB compiled data for the Team.
NTC also requests firms to prepare 3-year training plans. The template for these
plans, the Three-Year Training Plan Submission, seeks substantial information about
the volume of training provided by firms in the previous three years, and its cost. The
information about individual firms is confidential, and there is no published summary.
As well as formal surveys, the NDoE and the NTC receive other reports and returns from the institutions in their area of responsibility. However, in general such material is not kept systematically and is not accessible. The GoPNG Budget Books are the only readily available current information about the financing of TVET. There are two good sources for historic financing and educational data:
Technical-Vocational Skills Development in Papua New Guinea, the ADB Report of 2007 has outlined financial data for the whole TVET sector as it was in 2006;
The Needs Analysis Study of PNG TVET Colleges, published in 2011, has valuable detail on finance for the TBC sector.
2 At http://www.education.gov.pg/QL_Reports/index.html
3 www.ntcwebsite5.com

Research into the Financing of TVET in the Pacific PNG Country Report
14
2.4 REVIEW OF SOURCE MATERIAL
The team conducted a review of source material in Phase 1, with the following conclusions:
statistical collections are limited in scope;
there are no education financial statistics;
up-to-date reports from institutions on their activities and income and expenditure
relating to them are seldom available from any national source; and therefore
systematic information to answer the research questions needed to be collected by
the team, in many cases directly from institutions.
These conclusions informed the planning for Phase 2. Within Phase 2 it became even more apparent that statistical data collected from the TVET system by different agencies suffer from a lack of common standards and inter-agency collaboration. Differences which emerge when such agencies collect data in similar fields can be marked. To illustrate this problem, Table 2.3 compares data about technical and business college enrolments in 2011, collected by two agencies: the Office of Higher Education, through ASIHE; and the TVET Wing of the National Department of Education which collects information from the colleges annually for administrative purposes.
Table 2.3 Comparison of ASIHE and NDoE data for enrolments in Technical and
Business Colleges, 2011
College Collecting agency
Full-time enrolments Part-time enrolments Grand total M F T M F T
Goroka Technical ASIHE 176 21 197 648 519 1167 1364
NDoE 515 214 729 15 20 35 764
Mt Hagen Technical ASIHE 133 7 140 421 50 471 611
NDoE 306 38 344 171 13 184 528
National Polytechnic, Lae
ASIHE No data 0
NDoE 907 404 1321 0 0 0 1321
Port Moresby Technical
ASIHE 218 49 267 279 33 312 579
NDoE 385 59 444 119 14 133 577
Madang Technical ASIHE 98 11 109 214 144 358 467
NDoE 235 98 333 23 30 53 386
Kokopo Business ASIHE No data 0
NDoE 316 336 652 20 25 45 697
Port Moresby Business
ASIHE 312 463 775 0 0 0 775
NDoE 317 492 809 0 0 0 809
Totals, five colleges ASIHE 937 551 1488 1562 746 2308 3796
NDoE 1758 901 2659 328 77 405 3064
Note. Totals are for five colleges only because in 2011 two TBCs did not make returns to ASIHE.

Research into the Financing of TVET in the Pacific PNG Country Report
15
The differences in the distribution of students between full-time and part-time are very wide. The NDoE data may be the more reliable, because the NDoE has the stronger relationship with the TBCs, including representation on their governing councils, and regular visits by TVET Inspectors. But the team has also made use of ASIHE for TBCs, because its coverage is wider. The issue of data standards is further addressed in Chapter 13 of this report. As regards the private sector, the National Training Council (NTC), which acts as Registrar of Training Organisations in PNG, has only small staff numbers to keep pace with changes in institutional contact details, trainers and courses. The reasons for poor quality of TVET data in PNG are systemic, not just a matter of the capabilities of the collectors. The team experienced at first hand the difficulties of getting in survey returns and achieving accuracy. Low levels of non-teaching staff and poor record-keeping make it hard for institutions to respond.
2.5 APPROACH TO FILLING INFORMATION GAPS
The approach taken to filling in the information gaps is outlined in Figure 2.3. As far as possible, the emphasis was on using available data but, as indicated in the previous section, there are major limitations the information currently available in PNG relating to the study’s brief.
Figure 2.3 Approach to filling information gaps
There are major data gaps in PNG relating to:
private training providers;
the financing and cost structures of public providers of TVET; and
expenditure by enterprises on workforce training
As well as drawing on whatever information was available, the team pursued other approaches to filling these information gaps.
Information
required
1 Currently collected
2 Not currently
collected
1a Available in
useful format
1b Not available in useful format
2a Feasible to collect
2b Not feasible to
collect
2c Survey (sample or population)
2d Interviews and case studies
4 Note reason(s)
for exclusion
1c Seek permission
1d Can be made
available
1e Cannot be made
available 3 Analysis and
reporting

Research into the Financing of TVET in the Pacific PNG Country Report
16
2.5.1 Survey of private TVET providers in 2012
In 2012 as part of its Phase 1 work the team undertook a survey of all 200 Registered Training Organisations (RTOs) on the register kept by the NTC. The survey forms were kept deliberately short and simple in an attempt to reduce the risk of non-response. The intention was to use the returns to form a broad picture of private provision, as a basis for planning more detailed study in 2013. Survey forms were issued by post; the few providers with a registered e-mail address also received them by e-mail. The team conducted follow-up visits and enquiries after the closing date. In the event, just 15 usable responses were received, and two other bodies responded that they no longer conducted registrable training. The survey of private training providers nevertheless yielded some useful information which is provided in Part IV of this report. The survey form is included in Annex 9.
2.5.2 Surveys of public TVET providers in 2013
The surveys of TVET providers undertaken in 2013 had a similar structure to the surveys used in the other countries participating in the overall study. The survey form used for Technical and Business Colleges is included as Annex 6 to this report. There were minor variations to the forms used for RTOs and VTCS. Because of the geography of PNG, quite a high proportion of TVET students are boarders. The survey therefore included questions about boarder numbers, board and lodging fees received, and boarding expenditure. Private providers were asked to record expenditure on rent where applicable. Since most provider locations were accessible only by plane trip, it was agreed with the NRG to conduct the survey with four clusters of providers, one for each of the four regions of PNG. The clusters selected and institutions surveyed within them are shown in Table 2.3. The pattern of institutions surveyed reflects two factors:
what was available in the province – e.g. there are few large private providers outside Port Moresby and no university in Western Highlands Province (WHP); and
surveys were not achieved for four providers included in the original plan.
At the first visit most respondents seemed confident that they could do the survey, but at the second visit it was quite common to find that the respondent was still working on the return, or handed over an incomplete one. Many of the providers had few or no non-teaching staff to keep records or assist with the return. So finalisation often involved further contacts after the second visit. For the three providers shaded grey in the table the data finally obtained was not sufficient for inclusion in the unit cost analysis. However 23 usable returns was a reasonable outcome, based on hard work by the respondents. The planned coverage of rural and remote providers was achieved, and included providers coping without mains electricity, and one on a small island with no roads. In each cluster area the team looked at TVET for the non-formal economy as well as TVET leading to accredited vocational qualifications. Most of the VTCs and some of the smaller RTOs make provision for TVET for the non-formal economy. Findings of the data collections are presented in Part IV of the report.

Research into the Financing of TVET in the Pacific PNG Country Report
17
Table 2.4 Clusters of TVET providers used to structure the data collections
Provider Type Cluster 1 – Papua
(including National Capital District and Central Province)
Cluster 2- Momase
(including Lae, Morobe Province and Madang)
Technical or Business College
Port Moresby Technical College, Port Moresby Business College.
National Polytechnic Institute Lae
University None Divine Word University, University of Technology, Lae
Other Public providers
Works Institute, PNG Institute of Public Administration
None
Large private provider
IEA College of TAFE IEA survey return includes Lae campus.
Industry trainer PNG Power
Smaller Private Provider
Talleres de Nazareth Innovative Training Centre
ADRA4
VTCs Badili, Limana , Kwikila Umi, St Therese
Provider Type5 Cluster 5 – Highlands (based on
Western Highlands Province) Cluster 6 – Islands
(based on East New Britain)
Tech/Bus Coll Mt Hagen Technical Kokopo Business College
University - University of Natural Resources and Environment.
Smaller Private provider
Highlands Youth Training and Rehab. Centre
OISCA6
Elirana Electronic Technology
VTCs Ogelbeng and Rebiamul Vunamami,
Milmila
Note. Providers in rural or remote areas are shaded green. Providers shaded grey did not provide sufficient
information for inclusion in the unit cost analysis.
4 Adventist Development and Relief Agency.
5 No Type 2 institutions in Clusters 5-6.
6 Organisation for Industrial Spiritual and Cultural Advancement.

Research into the Financing of TVET in the Pacific PNG Country Report
18
2.5.3 Survey of enterprise training and expenditure
When the team invited views on the use of the standard template of employer training and expenditure developed for the overall project at the NRG Workshop in April 2013,participants said that it would be very challenging to get PNG employers to complete it. Accordingly, the team prepared, in consultation with employer representatives on the NRG, a PNG Enterprise Training and Expenditure Survey (ETES) template which aimed to retain the essential features of the standard template within a substantially reduced length. The template, which is reproduced in Annex 7, was used in two ways:
The team trialled completion by a visit to a major employer; and
the Port Moresby Chamber of Commerce and Industry PoMCCI) circulated the
survey by e-mail to about 300 of its members, with an invitation to complete it and
return to the team.
PoMCCI advised that even with the shorter questionnaire the response rate from members was in doubt. Accordingly the team discussed with NTC, and reached in principle agreement on another way to get similar information, from a sample of the three-year training plans which firms submit to NTC. In the event despite several follow-up reminders, only one firm, with just six employees, responded to the PoMCCI mail-out, and NTC staff were not able to undertake the necessary data extraction. The team considered a phone follow-up to selected firms on the PoMCCI list but concluded that the better use of the time remaining for fieldwork would be to concentrate on getting in the institutional surveys. Accordingly there was little information available for this report on the volume and costs of training within enterprises. Such information could be collected at a future date by mining existing data within the three-year training plans and returns of qualifying training expenses to the Internal Revenue Commission,7 or by use of a modified form of the ETES survey template.
7 These returns are made by employers in relation to the PNG Training Levy, as discussed in Part IV of
this report.

PART II: COUNTRY BACKGROUND


Research into the Financing of TVET in the Pacific PNG Country Report
21
CHAPTER 3. COUNTRY BACKGROUND
3.1 GEOGRAPHY AND POPULATION
PNG occupies the eastern half of the large island of New Guinea (the mainland), and numerous other islands, of which the largest are New Britain, New Ireland, Manus and North Solomons. Much of the terrain is mountainous; there are also flat and swampy areas on the south side of the mainland. The land area is about 450,000 km2 and the population density is low – about 16 persons per km2. Travel is hard. There are very few roads through the mountains which form the central spine of the mainland. Planes, though expensive, are the main means of travel from Port Moresby to the Highlands and Islands. Barriers of mountain and sea have shaped the development of language and culture, and foster strong local loyalties.
Figure 3.1 Geographic map of PNG
PNG held a census of population in 2011. In November 2013 the National Statistical Office released Final Figures8 for population by gender and geographical units. The total population emerged as 7,275,364, 40% higher than at the previous Census in 2000. Population in the Highlands and Islands Regions grew faster than the national average, while Southern Region was close to average, and Momase well below it. The populat ion of the National Capital District (NCD) centred on Port Moresby grew by 110,000 over the 11 years, to a total of 364,125 in 2013. No other city had more than 100,000 people. PNG is still mainly rural. In line with its high birth rate, PNG is a young country. Within the Household Income and Expenditure Survey (HIES) sample just over 40% of the population was aged 0-14, 56% aged 15-64, and 3% aged 65 and over. From a public finance perspective, the age structure means that the cost of education in PNG is heavy relative to other services. There are however many fewer old people than in developed countries.
8 Final Figures, National Population and Housing Census, National Statistical Office of PNG, November
2013.

Research into the Financing of TVET in the Pacific PNG Country Report
22
The World Bank projects numbers in the age groups most relevant to TVET (15-24 year-olds) to grow by about 40% between 2010 and 2025 (Table 3.1). The World Bank made these projections in 2010, using standard assumptions about mortality, fertility and migration. At that time the consensus was that PNG’s population was growing at about 2.8% a year. Such projections may need to be revised upwards because the PNG Census 2011 indicated an average annual rate of growth of 3.1% from 2000 to 2011. Table 3.1 Projected population of 15-24 year-olds, 2010 to 2025 (‘000)
Age Gender 2010 2015 2020 2025 % Increase
2010-2025
15-19
Male 360 422 458 489 36%
Female 339 395 428 455 34%
Total 699 817 886 944 35%
20-24
Male 311 357 419 455 46%
Female 295 336 393 426 44%
Total 606 693 812 881 45%
Source: World Bank HNP Statistics
3.2 GOVERNMENT
PNG has four tiers of government:
The National government, the Government of PNG (GoPNG);
22 Provincial governments;
89 District governments; and
314 Local-level governments. The four-tier structure of government involves a range of complexities, including in the administration and funding of education and training. GoPNG is accountable to the PNG Parliament which has a single chamber comprising 89 members elected by constituencies which correspond to the Districts, and 22 provincial members elected by the Provinces. The provincial member is normally also the Governor of the Province concerned. In PNG elections for the national Parliament and for other tiers of government are vigorously contested. National elections usually involve thousands of candidates. Parties are numerous, so coalitions are arranged in order to form a government which commands a majority of seats. The coalitions are often highly fluid, and leaders and Ministers change frequently.
Two features of political life in PNG stand out as important for the allocation of portfolios and government funding: the need to accommodate the interests of a diverse coalition; and that the Provincial and District tiers are built into the membership structure of the national Parliament.
3.3 LANGUAGE, LITERACY AND EDUCATION
PNG people use three languages- the vernacular language of their home area (Tok Ples), Melanesian Pidgin (Tok Pisin) as a colloquial common language, and Standard English – the language of schools and colleges, Government and formal business. Some also speak Motu – the national Melanesian language.
Research into the Financing of TVET in the Pacific PNG Country Report
23
In 2011, the Asia South Pacific Association for Basic and Adult Education (ASPBAE) and the PNG Education Advocacy Network (PEAN) jointly published a report on Education Experience Surveys and Literacy Assessments based on data from five provinces. More than 70 percent of respondents in all five provinces self-declared confidence in their ability to read and write in a national language (ASPBAE, 2011). The researchers administered literacy tests in English, Tokpisin and Motu; literacy in vernacular languages was not tested. Actual literacy rates based on these tests given in four of the five provinces were less than 15 percent, while in New Ireland Province the literacy rate was 25 percent. It should be noted that official estimates of literacy in PNG are much higher at approximately 55-60 percent among persons 15 years and older (UNESCO, 2010).9
Table 3.2 shows the breakdown by province of results on the ASPBAE tests, just for those who had attended secondary school. Only a minority of secondary school students – who are themselves a minority of their age-group - had attained full literacy. Raising the quality of school education is fundamental to raising the quality and quantity of TVET in PNG. The Team learned that a prominent PNG employer offers literacy and numeracy training for new recruits, as well as technical instruction.
9 Source: United Nations Educational, Scientific, and Cultural Organization (UNESCO) Institute for
Statistics http://www.indexmundi.com/facts/papua-new-guinea/literacy-rate

Research into the Financing of TVET in the Pacific PNG Country Report
24
Table 3.2 Literacy classification for those who attended secondary school, by province
Province Non-literate Semi-literate Literate
NCD & New Ireland 37.5% 42.7% 19.8%
Chimbu 3.0% 63.9% 33.1%
Sandaun 2.9% 58.9% 38.2%
Gulf 7.9% 72.9% 19.2%
Overall (5 Province Rate) 26.7% 49.8% 23.5%
Source: Education Experience Surveys and Literacy Assessments, ASPBAE, 2011.
The school population has grown rapidly, both because of the underlying demographic trend, and because of increased participation. The National Education Plan10 published in 2004
projected a secondary school population of 93,000 by 2011; in the upshot it was 111,500 by 2009.11 The basic entry points for entry to tertiary education are completion of Grade 10
(lower secondary education) and Grade 12 (upper secondary). Figure 3.2 shows the increase in the numbers of students sitting for examinations at Grades 10 and 12 over the period 2005 to 2012.
Source of data: Measurement Services Unit, NDoE
Figure 3.2 Grade 10 and Grade 12 examination entrants, 2005-2012
We were not able to discuss these data with the source. The increase in Grade 10 numbers from 27,000 in 2005 to 74,500 in 2012 raises some questions. The increase in Grade 12 is more moderate but still rapid – from 8,433 in 2005 to 14,942 in 2012, or 77%. Such rapid expansion helps to explain the surge in the social demand for formal tertiary education, both TVET and university places. The trend is likely to continue, not least because parents are now fully relieved of the burden of paying school fees. At the same time the number of school leavers without formal qualifications is also increasing, adding to the demand for non-formal opportunities for continuing education.
3.4 ECONOMY 10
Achieving a Better Future; A national Plan for Education 2005-2014 – NDoE 2004 11
Table 33 of NDoE Statistical Bulletin 2009
0
10,000
20,000
30,000
40,000
50,000
60,000
70,000
80,000
2005 2006 2007 2008 2009 2010 2011 2012
Grade 10 Grade 12

Research into the Financing of TVET in the Pacific PNG Country Report
25
PNG’s economy has experienced fluctuations over the past twenty years, including periods of stagnation. However growth in the non-mining economy significantly in excess of PNG’s population growth has been achieved in each of the last five years; mining has been volatile, but there has also been a rising trend in total GDP.
Economic growth reached 8.0% in 2012. According to the 2014 Budget papers, the PNG economy is expected to grow at 5.1 per cent in 2013, an upward revision from the 2013 Budget estimate of 4.0 per cent. This upward revision is due largely to an expected rebound in the mining and quarrying sector, the ongoing PNG LNG construction phase and the higher than expected stimulus effect of the increased Government spending. The 2014 Budget papers give the following estimates for growth rates in 2013 in some key economic sectors:
14.7% in mining and quarrying. Some slow-down occurred in the second half of the years, because of lower commodity prices and other factors;
0.5% per cent in the agriculture forestry and fisheries sector, after a decline of 1.6% in 2012. Weak commodity prices, unfavourable weather, and crop disease have combined to depress the sector;
11.9% in the construction sector. Its growth is expected to be driven by the increase in Government spending on infrastructure, as well as continued medium size construction activities undertaken by the private sector. The PNG LNG construction phase on the other hand is about to be completed, hence its impact on growth is not as strong as in previous years.
Table 3.3 compares the growth of g r oss national income per capita in PNG with that of the other participating countries: Table 3.3 Gross National Income per capita 2008-2012, selected countries
Country 2008 2009 2010 2011 2012 Change, 2008-12
PNG 2,190 2,290 2,400 2,590 2,780 26.9%
Fiji 4,560 4,590 4,460 4,590 4,880 7.0%
Kiribati 3,670 3,310 3,520 3,480 3,380 -7.9%
Samoa 4,090 4,120 4,250 4,430 4,270 4.4%
Solomon Islands 2,250 2,010 2,200 2,360 2,170 -3.6%
Tonga 4,580 4,590 4,560 4,690 5,140 12.2%
Vanuatu 4,230 4,190 4,300 4,500 4,500 6.4%
Note: Income is expressed on a purchasing power parity basis. Source: World Bank
PNG emerges as having the second lowest Gross National Income (GNI) per capita among the seven countries, but over these five years achieving the highest growth rate. Economic forecasters stress the importance for the medium to longer term of balanced growth in PNG’s non-mining economy. The production phase of the LNG project will be a big boost for PNG exports, but is not necessarily transformative for the domestic economy. The implication is that PNG needs a broad skills base, and inward investment to attract more varied job opportunities for its growing population.

Research into the Financing of TVET in the Pacific PNG Country Report
26
In order to improve the effectiveness with which natural resource revenues can be translated into public goods and services the government has established a PNG Sovereign Wealth Fund (SWF). In principle the SWF will enable PNG to invest revenues accruing from the development of limited-life mineral assets, and spread the benefits over time, including through investment in tertiary education and other infrastructure. The SWF is expected to become operational in 2015, but significant benefits for services will come later, depending on the realisation of surpluses which can be transferred into the fund. Inflation in PNG continues to be difficult to forecast. The 2014 Budget papers estimate 4% for 2013, compared with a forecasts for of 8% in the 2013 budget, and 5.6% at mid-year 2013. The current Government forecast is for 6.5% in 2014, and around 5% a year over the period 2015-2018. As in many other developing countries, high and volatile inflation rates pose a challenge for the funding of TVET and other public services.
3.5 EMPLOYMENT AND THE LABOUR FORCE
There is no regular, ongoing collection of labour market statistics in PNG; limited data appear in the Quarterly Economic Bulletins of the Bank of PNG. More detailed data have to be pieced together from a variety of sources with differing dates and coverage. Gannicott’s12 is the latest
attempt in this line. As he brings out, most data relate to formal employment. Analysts have had up to now to derive non-formal employment as a residual, from knowledge of formal employment and from estimates of the size of the labour force. The traditional view of the PNG labour market contrasts a small formal sector with waged employment, self-employed professions, and farmers living off the income from their produce, with a much larger informal sector consisting of subsistence farmers, small-scale self-employed traders in the towns etc. In line with that view, the Labour Market Survey 2010 estimated the PNG workforce at that time as 3.8 million. The Survey indicated that 13% (496,923) of this labour force was within the formal labour market (see Table 3.4). The highest number of vacancies existed in three areas: Government Administration and Defence, Education and Health & Community Services. Table 3.4 is probably more significant for what it tells us about the distribution of formal employment between economic sectors than about vacancies. For a fast-growing economy the level of vacancies looks suspiciously low in many of the sectors of most interest to TVET. The 2009-2010 Household Income and Expenditure Survey (HIES) was addressed to about 4200 households in a stratified sample which covered the whole of PNG. Though its main objectives lay elsewhere, it included questions on employment, and deserves attention because of its recent date and national coverage. In particular, it asked respondents “Did you have a waged job in the last seven days?” There were 15,640 valid responses to the question, of which 22% were affirmative, suggesting a waged labour force significantly larger than the proportion found by the Labour Market Survey cited above to be working in the formal economy. Results from the 2011 Census may eventually yield enable outline data for the PNG labour force to be put on a more certain footing. But no such results were available to the team.
12
Labour Market Analysis for PNG, Revised Report by K. Gannicott, obtained from AusAid, Port Moresby

Research into the Financing of TVET in the Pacific PNG Country Report
27
Table 3.4 The formal labour market of PNG in 2010
Total Occupied Vacant
Industry No. % No. % No. %
1 Agriculture, Forestry & Fishing 105,863 21% 105,752 21% 111 0.02%
2 Mining, Natural Gas & Petroleum 13,978 3% 13,956 3% 22 0.00%
3 Manufacturing 43,073 9% 42,977 9% 96 0.02%
4 Electricity, gas & water supply 7,709 2% 6,959 1% 750 0.15%
5 Construction 35,655 7% 35,620 7% 35 0.01%
6 Wholesale trade 16,284 3% 15,789 3% 495 0.10%
7 Retail trade 47,994 10% 47,874 10% 120 0.02%
8 Accommodation 18,854 4% 18,703 4% 151 0.03%
9 Transport & storage 27,621 6% 27,591 6% 30 0.01%
10 Communication & related services 9,877 2% 9,873 2% 4 0.00%
11 Finance & insurance 9,459 2% 9,262 2% 197 0.04%
12 Property & Business services 17,214 3% 16,723 3% 491 0.10%
13 Government admin. & Defence 50,684 10% 37,734 8% 12,950 2.61%
14 Education 5,8621 12% 46,895 9% 11,726 2.36%
15 Health & community services 16,420 3% 15,054 3% 1,366 0.27%
16 Cultural & recreational services 5,710 1% 5,513 1% 197 0.04%
17 Personal & other services 6,364 1% 6,261 1% 103 0.02%
99 Not stated/applicable 5,543 1% 5,543 1% 0.00%
All industry groups 496,923 100% 468,079 94% 28,844 5.80%
Note: Vacancy percentages for individual industries are an apportionment of the All Industry vacancy rate of 5.8%. Source: Labour Market Assessment Report published by Office of Higher Education PNG in 2010.
3.6 PUBLIC SECTOR AND PUBLIC SECTOR FINANCES
This section outlines some basic information on public finances in PNG, drawn from GoPNG Budget papers. We should prefer to draw on audited accounts as well as budget papers, but no relevant and reliable audited accounts are available. The latest government accounts audited by the PNG Auditor-General are for 2008 and 2009, and he declined to express an opinion on them, as a result of defects outlined in his reports. PNG’s financial year is the calendar year. The budget for the year N is brought down around October or November of the year (N-1). The Budget papers set out to show Actual Expenditure in the year (N-2), a Revised Appropriation for year (N-1), which is drawing to a close at the time of the Budget, and an Appropriation for the year N which is the focus of the budget. The actual figures for year (N-2) should serve to anchor the budget to reality, but they are not based on audited accounts and need to be treated with some caution. A few instances where they might mislead are mentioned later in this report. PNG does multi-year planning, and some multi-year forecasts appear in the Budget papers, but for the time being the budget proper is a single-year cash budget. Up until 2013, the budget was split into the Recurrent Budget (most provision for regular operations of Government) and the Development Budget (most capital-expenditure, donor-funded programs and special projects). The 2014 Budget integrates the development and recurrent funding within a single budget. The budget balances achieved and planned over the period 2011-2014 are shown in Table 3.5.

Research into the Financing of TVET in the Pacific PNG Country Report
28
Table 3.5 GoPNG budget balance 2012 to 2014 (Kina millions)
2012 Actual 2013 Revised Appropriation
2014 Budget
Total Revenue and Grants 9,566.0 10,481.6 12, 688.5
Total expenditure and net Lending 10,046.9 13,218.7 15,041.5
Budget balance -480.9 -2737.0 -2,353.0
% of GDP -1.5% -7.9% -5.9%
Source: GoPNG Budget Book 2014, Volume 1, Table 3
The balances for 2013 and 2014 reflect the priorities of the present government headed by Prime Minister O’Neill. The Government lists its key priorities for 2013-2017 as tuition-free education, free health care, infrastructure investment, cover for natural disasters and police recruitment. In order to progress these priorities the present Government accepted a big deficit in its first budget (2013). The deficit is projected to reduce slightly in 2014 despite a further significant increase in spending, based on a big increase in revenue which includes K600 million of equity sales, and a further K600 million assumed to come from tax compliance measures. Prior to 2013 recent GoPNG budgets had been pitched closer to balance, in the interests of moderating the burden of loan repayments. GoPNG recognises that such high budget deficits are not sustainable in future years. Its Medium-Term Fiscal Strategy (MTFS) for the 2014 Budget13 envisages pulling back the deficit to 5.9% of GDP in 2014, and to 2.5% in 2015, when revenue is expected to be boosted by a full year’s production from the LNG project. Thereafter the Government seeks to reduce the deficit to below the 2% level. Within this fiscal discipline the Government plans to sustain its key priorities, including tuition-free schooling. About 82% of PNG’s revenue is projected to come from taxes. Tax revenue growth is projected to be moderate. The LNG project is expected soon to come on-stream, but to be partly offset by declines in other mineral revenues. Uncertainties over prices for commodities such as oil, gas, gold, copper, copra and palm oil are significant for PNG tax revenues. In 2014 grants from development partners are expected to be K1.55 billion, or 10.2% of total expenditure. PNG’s dependence on donor grants has decreased; 5 years ago 16% of expenditure was funded by donors, and ten years ago it was 20%. The Budget lays out expenditure plans by sector consistent with the achievement of the MTFS (see Table 3.6).
13
2014 Budget Strategy Paper, available at www.treasury.gov.pg , confirmed in PNG Budget Papers 2014, vol 1 p. 30.

Research into the Financing of TVET in the Pacific PNG Country Report
29
Table 3.6 Total expenditure and net lending, 2013 to 2017 (Kina millions)
Sector 2013 2014 2015 2016 2017 % change, 2013-2017
Administration 3,753.4 3,747.7 3,892.3 4,059.9 4,205.1 12.0
Economic and Agriculture 491.7 777.9 765.0 781.3 798.0 62.3
Education 1,343.0 1,501.7 1,468.4 1,501.7 1,535.8 14.4
Health 1,089.0 1,382.3 1,348.9 1,380.2 1,412.2 29.7
Infrastructure 1,882.0 2,723.3 2,655.9 2,712.0 2,768.6 47.1
Law and Order 1,022.6 1,296.0 1,264.3 1,293.8 1,323.9 29.5
Provinces 3,462.2 3,638.4 3,673.3 3,751.2 3,825.6 10.5
Social 174.8 227.1 222.9 227.7 232.7 33.1
Total Expenditure 13,218.7 15,294.5 15,291.1 15,707.8 16,101.9 21.8
Source: GoPNG Budget Book 2014, Volume 1, Table 11, with the percentage change column added by the authors.
There is a striking increase between 2013 and 2014 in provision for infrastructure, reflecting the priority assigned to the building of roads, and improvements to ports and airports in order to improve PNG’s transport infrastructure. The emphasis on capital investment in transport infrastructure is part of the rationale for the planned budget deficits. Table 3.6 indicates the expenditure discipline that would be needed to realise the Government’s Medium-Term Fiscal Strategy, rather than in the details of the sectoral allocation which the Budget Book does not explain in any detail. The standstill in 2015 reflects the planned transition to a much lower level of budget deficit. Clearly it will be very challenging to achieve. Table 3.6 is not a good guide to the proportion of the Budget to be devoted to expenditure on education because much of that falls within the Provinces Sector rather than the Education Sector, as the next section of the report will explain.
3.6.1 Government Expenditure on Education
There is no single table in the 2014 Budget papers which covers all expenditure planned for the Education Sector. Table 3.7 has been pieced together from different sources. Table 3.7 Education – overall provision in the 2014 budget (Kina millions)
National Agencies 2013 2014 2015 2016 2017
National Department of Education 1,116.8 1,082.3 1,055.6 1,080.2 1,105.4
Office of Higher Education 72.8 210.1 204.9 209.7 214.6
Universities 151.3 204.3 202.9 206.7 210.6
Miscellaneous 2.1 5.1 5.0 5.1 5.3
Sub-total national agencies 1,343.0 1,501.7 1,468.4 1,501.7 1,535.8
Provinces
Teachers’ Salaries and Leave Fares 733.3 733.3
Education Function Grant 78.4 96.3
Total Provinces 811.7 829.6
Total expenditure on education 2,154.7 2,331.3
Sources: GoPNG 2014 Budget Books Vol 1 Table 14 for national agencies, Vol 2, Part 2 for provinces.

Research into the Financing of TVET in the Pacific PNG Country Report
30
The figures above for national agencies derive from a table in the same format as Table 3.7, and their total equals the education sector line in that table. The figures for provinces derive from the Team’s summation of the relevant lines in the Provincial Budgets presented in Vol 2, Part 2. They are available for the years 2012-2014 only. In 2014 the Education total of K2,331,300,000 represents 15.2% of the all sectors total of K15,294,500,000. The Provinces Sector includes K1,492 million in each of the five years for Direct Investment in key provincial services The resources are distributed as:
Provinces, K5 million for each district in the province per year;
Districts, K10 million each annually;
LLGs, K0.5 million each annually. The Budget gives an indicative allocation of these resources between its key priorities. Each tier of government is guided to spend 20% of its allocation on education, making a total of K1492 million for education over five years if the guidance is followed. These direct investment amounts are not included in Table 3.7. People we spoke to appeared uncertain about how these funds could be accessed for education purposes. The most striking feature of the table is the planned increase in 2014 in spending by the OHE and the universities. That reflects a program to re-capitalise the universities, to be funded in large part by grants and loans from donors. The need for that has been acknowledged since the publication of the PNG Universities Review in 2010, but similar needs have been noted in the technical and business colleges. There does not appear to be a plan for balanced investment in the tertiary education sector as a whole. Provision for NDoE services in Table 3.7 is flat, following a period of rapid increases in school fee subsidies in order to achieve free tuition in schools in 2013. Provision for these subsidies was originally K652 million in the 2013 Budget, but the out-turn is expected to be closer to K610 million. Provision for 2014 is K605 million, but can be supplemented as necessary from the savings in 2013. NDoE pays these subsidies to schools and vocational training centres which are, save for a few exceptions, provincial institutions. So grants to provinces are in effect far higher as a proportion of the education budget than Table 3.7 suggests, as would be expected given that the great majority of students attend provincial institutions. Tuition-free schooling is a huge step forward for PNG. It incurs an immediate cost to the public purse as Government grants substitute for fees paid by households, and a long-run cost as free schooling boosts student numbers in schools, and the numbers seeking access to tertiary education. Table 3.7 shows Teacher Salary Grants to provinces held steady in 2014 at the 2013 allocation of K733 million. The 2014 Budget also features a standstill in Personnel Emolument costs for NDoE services, including TVET. The Budget makes a renewed commitment to cleanse the public sector payroll.
3.6.2 Official Development Assistance (ODA)
In 2014 Australia is expected to provide aid of about K1206 million to PNG, 78% of the total for all donors. Other donors active in delivering ODA to PNG for education purposes include the Asian Development Bank, the World Bank, the European Union, Japan and New Zealand. The ADB was a significant donor in relation to TVET in PNG in the recent past, but now concentrates on infrastructure.

Research into the Financing of TVET in the Pacific PNG Country Report
31
ODA relevant to TVET includes:
The Asian Development Bank funded the Employment-Oriented Skills Development Project up until 2007. Among other things the project established the Skills Development Trust Fund referred to below;
Over the period 2011-2016 the World Bank is supporting a Flexible and Open Distance Education Project in PNG. It focuses on the completion of school grades 10 to 12 rather than TVET as such;
Australian Aid relevant to TVET has recently included infrastructure projects through the Incentive Fund (those at Mt Hagen Technical College and PNG Maritime College are mentioned elsewhere in this report), and the ongoing work of the Australia-Pacific Technical College both in PNG and for PNG students attending its other campuses, as well as studies such as the Needs Analysis Study of PNG Technical Colleges and the present TVET-Pacific Study;
The European Union supported the Education Training and Human Resource Development Program (ETHRDP) from 2006 to 2011. ETHRDP originally had two TVET components: (4) community-driven non-formal education programs, and (5) community-based vocational education. The Program had its troubles. Component 4 was one of three dropped at mid-term review. Component (5) continued, and the EU claim some success in working with VTCs. But the main outcomes of ETHRDP lay elsewhere, lay elsewhere, particularly in the training of school teachers. The EU intends to begin a new program in PNG oriented towards TVET in July 2014 (HRDP2), but no detail was available at the time of writing;
Japan does not seem currently to be supporting work relevant to TVET but education infrastructure is eligible for the Yen Loans now available in PNG;
New Zealand supports agricultural extension work in PNG, and lists training to teach TVET as a priority area for its scholarships program.


PART III: TVET IN CONTEXT


Research into the Financing of TVET in the Pacific PNG Country Report
35
CHAPTER 4. OVERVIEW OF TVET IN PNG
This chapter provides an overview of the strategic framework for TVET, regulation and quality assurance arrangements, industry engagement, and teachers and teacher training.
4.1 STRATEGIC FRAMEWORK FOR TVET
A number of different documents at whole of government and departmental levels offer the elements of a strategic framework. At the higher level PNG has three strategic plans:
PNG Vision 2050 is a 40- year vision for the country’s development on a broad canvas. It is an important point of reference for more detailed documents with shorter horizons;
PNG Development Strategic Plan 2010-2030 (DSP) fleshes out the next 20 years in more detail. It sets out overall and sectoral strategies for the development of the PNG economy, and for public services. It seeks to relate plans for the expansion of tertiary education, including TVET, to projected labour market demand;
PNG Medium-Term Development Plan 2011-2015 is the five-year forward look and the most specific of these documents. It is clearly articulated to DSP goals, targets and deliverables.
These documents have been worked up with great care. The general tone is strongly expansionist as would be expected from PNG’s demography and state of development, and based on a belief that national planning, including manpower planning, can be worked through in some numerical detail for many years ahead. The plans emphasise infrastructure development and enrolment expansion across all types of public tertiary education currently in place – universities, technical and business colleges, nursing colleges, primary teachers colleges etc. The structural changes proposed are more modest. Treatment of private sector tertiary education is brief. Departments of GoPNG have issued number of documents relevant to the TVET system as a whole:
The NDoE document Technical and Vocational Strategic Management Plan 2011-2030 covers TVET under NDoE’s supervision – the TBCs, the VTCs and community colleges;
The National Human Resource Development Policy 2010, published by the National Training Council, covers mainly matters within their responsibility including the PNG Qualifications Framework for the TVET Sector;
The Office of Higher Education co-operated with the Department of National Planning and Monitoring on the National Labour Market Assessment which produced Demand Data and Supply Data Reports in 2010. These have been an important input to tertiary education planning. Also in 2010 the Commission for Higher Education produced the PNG National Qualifications Framework which attempts to draw the TVET and HE frameworks into a coherent whole.
The various agencies do work together on some topics, but it is not always clear how far these various documents have currency beyond the Department which produced them. Table 4.1 outlines the responsibilities of the main government agencies for TVET as they currently stand.

Research into the Financing of TVET in the Pacific PNG Country Report
36
Table 4.1 GoPNG responsibilities relating to TVET
Agency Main functions in relation to TVET
National Dept of Education (NDoE) Reports to Minister of Education
Establishment and funding of public technical and business colleges (TBCs), which are national institutions forming part of the NDoE;
Inspection of TBCs and vocational training centres (VTCs);
National qualifications delivered by TBCs and VTCs, with the National Training Council;
Provision of VTCs in the National Capital District;
Approval via the National Education Board of fee limits for TBCs and VTCs;
Collection and publication of statistics about TBCs and VTCs.
Office of Higher Education Reports to Minister of Higher Education, Research, Science and Technology.
Recognition of universities and other institutions of higher education.
Maintains the PNG National Qualifications Framework for higher education.
Support for students at recognised IHEs through the Tertiary Education Student Assistance Scheme.
Administration and Funding of the TVET Skills Scholarship Program.
Analysis of the labour market and demand for, and supply of, skilled manpower.
Preparation and publication of the Annual Survey of Institutions of Higher Education (ASIHE).
OHE does not fund the universities. The public universities are statutory authorities and receive grants direct from the Treasury.
The National Training Council (NTC) Reports to Minister of Labour and Industrial Relations (MoLIR)
Keeps the Register of Training Organisations. Training providers other than those under NDoE or OHE must be RTOs.
Approves courses and trainers at RTOs.
Maintains the PNG qualifications framework for TVET.
Approves 3-year training plans submitted by PNG firms.
Distributes the proceeds of the training levy to providers of eligible training.
Maintains the National Human Resource Development Plan
The National Apprenticeship and Trade Testing Board Reports to MoLIR.
Approves firms and colleges as apprenticeship training providers.
Supervises the national apprenticeship scheme.
Conducts Trade Tests for trainees and employees seeking formal recognition of skills.
Develops occupational standards as a basis for competency-based training.
Other Ministries/agencies
A number of other Ministries or agencies of GoPNG are involved in the provision of TVET, notably:
PNG Institute of Public Administration provides competency-based training for public servants and other employees;
PNG Maritime College provides training for the shipping industry, to the standards of the International Maritime organisation;
Works Institute of Technology (part of the Department of Works) offers training in the building trades.
The above examples lie within the scope of the Study. Outside our scope other important providers of TVET-style training include the colleges for nurses and community health workers, and the training establishments of the police, the defence forces and the prison service.
Staff numbers give a rough measure of the resourcing of these functions:
The TVET Wing of NDoE has 88 staff, organized in Divisions covering Operations and Management, Curriculum, Inspections, and a Secretariat for the Community Colleges;
NATTB has 19 staff to cover all its functions, and NTC has 18;
TVET work is a component of the functions of the Office of Higher Education, which has 71 staff.

Research into the Financing of TVET in the Pacific PNG Country Report
37
The TVET Wing staffing looks to be based on a reasonable assessment of what is needed to discharge its functions. The functions assigned to NTC and NATTB promise more than their staff could deliver. Resourcing issues are considered in more detail in the next part. The key points to emerge from this analysis of documentation and functions is that the TVET functions of NDoE, OHE, NTC and NATTB overlap. No one Minister or authority is in a position to provide co-ordinated leadership for the TVET sector as a whole. There is duplication between agencies which adds to the stress on the limited resources available. The need for a more unified structure has long been recognised within PNG. Efforts to achieve it continue. Figure 2.1 in Chapter 2 set out the main relationships between these Government agencies and the formal TVET providers.
4.2 REGULATION AND QUALITY ASSURANCE
It is not easy to summarise PNG’s arrangements under this head. What follows is based on the Team’s understanding of how the arrangements currently operate. In some respects the stakeholders have different views on how the arrangements ought to operate. Qualification Frameworks, Accreditation and Registration In PNG three ministries (NDoE, MHERST and DoLIR) share responsibilities for these matters, along with the NTC which is a statutory authority constituted on a tri-partite basis under DoLIR.
The NTC is the owner of the PNG Qualifications Framework for TVET (PNGQF-TVET) which covers the newer competency-based qualifications known as National Certificates and National Diplomas;
The Commission for Higher Education (CHE), an organ of MHERST, is the owner of the PNG National Qualifications Framework (PNGNQF). PNGNQF sets the qualification framework for higher education, and also purports to offer an over-arching scheme bringing together the HE framework and PNGQF-TVET;
NDOE is the accreditation body responsible for the accreditation, registration, auditing and inspection of the technical and business colleges which are national institutions, and shares these functions with the provinces in respect of the vocational training centres and technical schools, which are provincial institutions. The National Education Board, an organ of NDoE, approves School Certificates and similar qualifications, including the Vocational Training Centre Certificates, and the older qualifications in the technical and business colleges. NDoE’s accreditation functions span both those older qualifications and the newer ones introduced under PNGQF-TVET;
The CHE is the accreditation body for universities and other recognized institutions of higher education (IHEs). In law TBCs too rank as recognized IHEs but in practice NDoE remains their accreditation body;
NTC is the accreditation body for PNGQF-TVET qualifications for private providers, foreign providers, and government providers not accredited by NDoE or by the CHE. These are the bodies which are required to register as Registered Training Organisations (RTOs);
NATTB supervises the training of apprentices, including approving training colleges and firms as apprenticeship training providers. It also develops the occupational standards which underpin competency-based training in line with PNGNQF.

Research into the Financing of TVET in the Pacific PNG Country Report
38
The Structure of TVET Qualifications in PNG The PNG Qualifications Framework (PNGQF) includes 3 three sub-sectors: school, higher education, and technical and vocational education and training (TVET). Figure 4.1 depicts the PNG qualification system as the Commission for Higher Education14 conceives it. The figure shows Advanced Diploma, Diploma and Certificate qualifications as available in both HE and TVET versions, with different owners and different titles. The differences between the two frameworks go beyond ownership and titles, as the attempt15 to reference the PNG framework or frameworks against the Pacific Qualifications Register showed. In particular:
The descriptors for the diploma and certificate qualifications differ in the HE and TVET versions. The TVET descriptors are based on job levels, while the HE descriptors relate only to knowledge, understanding and skills;
The HE version indicates years of study required to attain the qualification, the TVET version does not. Neither version incorporates a credit accumulation system.
The Secretariat of the Pacific Board for Educational Assessment concluded that the current PNG arrangements were sectoral frameworks rather than a common national framework, and that the HE and TVET frameworks of PNG could not be aligned as they stood with the Pacific Qualifications Framework. The absence of duration and credit criteria can have surprising results. For example the national diplomas in the TBCs require two years of study, so do the university undergraduate diplomas. But PNG Institute of Public Administration offers a competency-based diploma for public servants approved by the National Training Council under the TVET Framework which can be completed in just three months. The references in Figure 4.1 to ‘bridging studies if required’ raise doubts about whether the qualification frameworks offer students a common pathway to progress to higher levels of study. In the TVET Sector that has not yet been much tested because almost all students on NC courses in the TBCs study for NC1 or NC2; as at June 2013 just 3 of the 672 students on NC courses were studying for NC3, and none for NC4.
14
PNG National Qualifications Framework, published by the CHE in March 2010. 15
Referencing the Papua New Guinea Qualifications Framework against the Pacific Qualifications Framework, paper by the Secretariat of the Pacific Board for Educational Assessment written in 2013.

Research into the Financing of TVET in the Pacific PNG Country Report
39
Source: Papua New Guinea National Qualifications Framework, CHE 2010
Figure 4.1 PNG National qualification framework (School education, FODE, TVET and
tertiary education)
PNG providers offer a variety of qualifications outside the formal frameworks just described. These include:
Legacy qualifications which antedate the introduction of competency-based National Certificates and Diplomas. These include the Technical Trade Certificates and some of the Diplomas in TBCs;
Training for employees based on Levels 1 (Basic), 2 (Semi-Skilled) and 3 (Fully-Qualified Tradesperson). Apprentice training is based on these levels, and so too are the trade tests. Ownership rests with NATTB;
Providers’ own qualifications. Many private providers still examine for their own courses, and a few ‘council-approved’ qualifications are offered in the TBCs. The NTC has set 31st Dec 2014 as the deadline for RTOs to meet the standards of the TVET framework, but it is not clear how that can be achieved;
Foreign qualifications. Some RTOS have arrangements with foreign counterparts to offer courses developed outside PNG, in particular under the Australian Qualifications Framework;
The Vocational Training Certificate endorsed by the NDoE, and offered in 1 and 2 year versions is still the staple course in the VTCs. Some VTCs also offer NC1 and NC2, if they have the necessary resources and suitably trained staff.
The variety of courses and qualifications on offer complicates the task of counting students and graduates at PNG providers, and costing the courses; and also calls for great care in making comparisons across the system.

Research into the Financing of TVET in the Pacific PNG Country Report
40
Quality Assurance, Audits and Inspection The NTC registers training organisations, trainers and courses in the light of standards prescribed in PNGQF-TVET. In Phase 1 the team used them to construct a profile of the RTO sector which is included in Annex 4 of this report. The NTC requires RTOs to carry out periodic Self-Inspections and complete Self-Assessment Reports (SARs), in the light of the standards prescribed in PNGQF-TVET. NTC officers review the SARs and conduct follow-up visits. The SAR Report Form16 documents the self-assessment process. NTC’s ability to supervise this process and assure its quality is limited by the Council’s meagre staffing. Through its Curriculum and Inspections staff NDoE sets out to:
Develop National Curriculum and course programs;
Facilitate course delivery;
Monitor and maintain standards at TVET institutions;
Measure, evaluate and maintain quality assurance.
4.3 TEACHERS AND TEACHER TRAINING
As regards public provision, as at June 2013 there were 348 approved positions for the eight TBCs then existing, and 248 staff on strength, giving a vacancy rate of 14%. Vacancy levels vary significantly between colleges. The vacancy rate at Lae Poly technic was over 20% in 2013. There were in 2013 about 1220 teachers in the VTCs (including some non-government VTCs). There are no regular statistics on staff other than these headcounts, but the TVET Needs Analysis by Hind et al. (2011) collected data for the TBCs relating to 2010. At that time of 225 staff surveyed, 112 had a bachelor or post graduate degree, and 104 had a diploma or certificate, with 9 not answering. 63% of staff were aged 41 or over, and 75% were male. There is no comparable information for VTCs, but qualification levels are lower. A VTC which was a trial site for the introduction of NC1 in VTCs mentioned to the team that they had had support to upgrade the qualifications of the trainers concerned to NC3 level. Provincial divisions of education and NDoE inspectors do in some cases arrange training opportunities for VTC teachers. The PNGQF-TVET sets out the qualifications and experience required for the various levels of trainer specified in the framework. In principle these requirements bite for trainers engaged in the delivery of National Certificates in both public and private sectors. One or two RTOs mentioned that they were arranging for trainers to get further qualifications in order to meet the PNGQF-TVET requirements. Certificate IV in Training and Assessment was cited in that context. Overall however the level of activity we heard of seemed low in relation to the aspiration that all RTOs conform to PNGQF-TVET by the end of 2014. The main provider of teacher training in PNG is the University of Goroka (UoG). UoG offers as mainstream programs.17
A Bachelor of TVET, with 34 students in 2011;
A Diploma in TVET oriented to trade technology, with 17 students in 2011; and
16
Download from http://media.wix.com/ugd/1d6894_c1e7b0fd5d0240f696b620fe1df35cc4.pdf 17
www.uog.ac.pg and ASIHE 2011.

Research into the Financing of TVET in the Pacific PNG Country Report
41
A Diploma in Business Education and Training, with 13 students in 2011;
NDoE’s main preoccupation for the TBCs at present is to assist teachers, most of whom enter TVET with a qualification in business or trade technology, to acquire a teaching qualification. Accordingly UoG has also prepared a customised Diploma in TVET for NDoE of 6 months duration. Over recent years NDoE has seconded about 280 teachers, mostly from TBCs to this course, at the rate of about 40 a year. NDoE estimates the cost at about K11,000 to K12,000 per trainee, to include course fees and travel costs but not replacement teachers – colleges have to carry that. As regards professional development, NDoE also supports 2-week financial management courses for principals and deputies, and a few other short, post-experience courses, notably in occupational health and safety. Stakeholders emphasised that TVET teachers needed to upgrade their trade skills, as well as to acquire teaching qualifications; and to learn the techniques of competency-based training. The TVET Wing acknowledges such needs in its planning, but in recent years has not consistently been able to fund the training associated with them. Teacher training is one of the priority sectors for the PNG allocation of New Zealand Pacific Scholarships in 2013.18 Diplomas in Management, Curriculum Development and Training and Trade Technology are covered. As there are 54 scholarships to share across four priority sectors numbers trained in TVET will be modest, but this kind of opportunity for future movers and shakers in the PNG TVET system is most welcome.
18
http://www.aid.govt.nz/funding-and-contracts/scholarships/eligible-countries/papua-new-guinea

Research into the Financing of TVET in the Pacific PNG Country Report
42
CHAPTER 5. TVET PROVISION Within the scope of the study, the TVET sector of PNG comprises:
The eight technical and business colleges run by NDoE;19
Vocational training centres and community colleges run mainly by provinces, with NDoE supervision;
Courses having a vocational aim and leading to qualifications below the level of a Bachelor degree offered by the universities;
The work of the Registered Training Organisations – mostly private but some public;
Apprenticeships and lower levels of formal training run by firms;
Non-formal TVET, whether delivered by providers in the formal sector, or by others.
5.1 TECHNICAL AND BUSINESS COLLEGES
These colleges, which are national institutions under NDoE, are the best known providers of formal TVET within PNG. The eight colleges operating in 2013 are: the technical colleges at Port Moresby, Goroka, Mount Hagen, Madang and in West New Britain; the National Polytechnic Institute at Lae; and the business colleges at Port Moresby and Kokopo. The National Education Board has approved the establishment of four more Technical Colleges. The college at Bougainville opened in 2014. Further colleges at Mendi in Southern Highlands, in the province of Enga and at Namatanai (in New Ireland) are expected in the not too distant future. These plans to expand the network have to be seen in the context of the surging demand for TVET, and NDoE’s long-term aspiration to have a technical college in every province and a polytechnic in every region. They do put stress on the finances of the system when existing colleges lack the funds and facilities to deliver their programs adequately, as documented in the Needs Analysis Study. Growth in the number of qualified school leavers has put severe pressure on places at the seven colleges. Between 2008 and 2011 student numbers grew by 69%, from 2829 to 5082, but teaching staff numbers increased by just 20%, from 234 to 280 FTE. Consequently the student to staff ratio (SSR) moved up from 12:1 in 2008 to 18:1 in 2011, on a headcount basis. Table 5.1 shows summary statistics for the eight colleges.
19
The team did not obtain data for the ninth TBC, Bougainville Technical College, which joined the system in 2014.

Research into the Financing of TVET in the Pacific PNG Country Report
43
Table 5.1 Students and staff at the technical and business colleges, 2013
As at June 2013 Student course enrolments and mode of
study
College TTC NC APP Diploma
Part-time*
Total Staff SSR
NATIONAL POLYTECHNIC 313 3 0 801 0 1,117 74 15.1
PORT MORESBY TECHNICAL
120 207 245 0 23 595 47 12.4
PORT MORESBY BUSINESS 124 0 0 470 0 594 41 14.5
GOROKA TECHNICAL 107 15 0 547 40 709 28 24.6
MT HAGEN TECHNICAL 227 114 34 0 114 489 33 13.1
MADANG TECHNICAL 87 153 0 153 68 461 38 11.2
KOKOPO BUSINESS 82 0 595 0 677 24 28.2
WEST NEW BRITAIN TECHNICAL**
156 130 0 0 97 383 31 10.8
TOTALS 1,134 704 279 2,566 342 5,025 316 15.2
Source: NDoE TVET Wing. In line with the source, part-time students have been counted as 1 in the total student population. In the staff column part-time staff are counted as 0.5, and to calculate the SSRs part-time students are also counted as 0.5. TTC = Technical Trade Certificate, NC = National Certificate aligned to the PNGQF for TVET, and APP = apprenticeship extension course. *Part-time courses are not classified by qualification aim. **Figures for this college are provisional.
At first sight enrolment growth seems to have paused despite the accession of WNB Technical College (WNBTC) – there are just over 5000 students in 2013, just as there were in 2011. The main reason is that both NPI Lae and Port Moresby Business show up has having 200 fewer students in 2013 than in 2011. These numbers may warrant a second look. Certainly NPI recorded 1350 students for the intermediate year 2012 on the survey form. However participants at the Dissemination Workshop in March 2014 confirmed the pause as genuine, and attributed it to capacity constraints in terms of accommodation, staffing and equipment. The two business colleges offer exclusively courses in the fields of business and tourism and hospitality. Two of the technical colleges – Port Moresby and Mt Hagen offer only courses in trade technology. NPI, Goroka Technical and Madang Technical offer courses in both business and trade technology. In 2011 the TBCs had 253 full-time teachers and 54 part-time. In 2013 the seven colleges existing in 2011 had 266 full-time teachers and 36 part-time; WNB Technical College added another 31 teachers to the system. The figures may indicate a slight easing of the staffing position as part-time staff are often hired to cover vacancies in full-time positions. As in previous years, SSRs in 2013 varied widely between colleges. Goroka Technical and Kokopo Business stand out as having much higher numbers of students per teacher in 2013 than the other colleges. Table 5.2 documents changes in enrolments and SSRs since 2008.

Research into the Financing of TVET in the Pacific PNG Country Report
44
Table 5.2 Student to staff ratios at the TBCs, 2008 to 2013
2008 2011 2013
College Enrolment SSR Enrolment SSR Enrolment SSR
NATIONAL POLYTECHNIC 978 16.9 1321 18.6 1,117 15.1
PORT MORESBY TECHNICAL 342 7.8 511 10.9 595 12.4
PORT MORESBY BUSINESS 448 14.0 809 20.0 594 14.5
GOROKA TECHNICAL 434 15.5 747 24.9 709 24.6
MT HAGEN TECHNICAL 206 9.8 436 14.8 489 13.1
MADANG TECHNICAL 140 4.7 360 9.9 461 11.2
KOKOPO BUSINESS 281 13.4 675 27.6 677 28.2
TOTALS 2,829 12.1 4,859.0 17.4 4,642 16.3
Sources: Data supplied by NDoE TVET Wing for 2011 and 2013, NDoE Statistical Bulletin 2008 for 2008. In 2011 and 2013 part-time teachers and students are counted as 0.5
The table shows that during the surge in TBC enrolments from 2008-2011, the numbers of students per teacher at PoM, Mt Hagen and Madang Technical Colleges rose to much more efficient levels, and there was a substantial increase in the SSR for the system as a whole. Already in 2011 Goroka Technical and Kokopo Business stood out as having much higher numbers of students per teacher than the other colleges. In 2008 Goroka had 28 teachers and Kokopo had 21; the corresponding numbers in 2011 were 30 and 24 – so teacher numbers had adjusted very little to the large increases in enrolments. In part the explanation may lie in teacher vacancies - Kokopo had 25% of its approved positions vacant in 2013. But a number of colleges with much lower SSRs also had significant vacancy levels. Budget constraints and slow adjustment of TSC-approved positions to enrolment changes are other significant factors. The above analysis is based on NDoE data. However using enrolment and teacher numbers from other sources can lead to very different SSRs. For example in 2012 the team’s survey using FTE student numbers found SSRs for the 5 TBCS surveyed as follows: PoMTech 13.2; NPI Lae 20.8, Kokopo Business 17.9, and Mount Hagen Technical 10.2. Until PNG has defined standards for counting TVET enrolments and methods for converting student and teacher numbers to FTE, SSR comparisons will remain fragile. Some key facts about the make-up of enrolments at the TBCs are:
About half the students study on 2-year diploma courses, mostly in business, IT and tourism and hospitality, though NPI also offers diplomas in trade technology. These are the courses most popular with female students;
Certificate courses are mostly in trade technology, but WNBTC brings a welcome new orientation towards agriculture. As intended, the shorter courses for National Certificates under the PNG Qualifications Framework for TVET are gradually replacing the older Trade Technology Certificates. In 2011 there were 2.2 TTC students for every NC student. In 2013 the ratio was down to 1.6.
Apprentice training is significant for just two of the technical colleges. Unlike other aspects of TBC work, it has not increased. An earlier study20 found that in 2003
numbers of apprentices on extension courses at PoMTech, Mt Hagen and Madang Tech were 246, 52 and 12 respectively, little different from the 2013 numbers in Table 5.1 above. There has however been significant growth in intakes to apprenticeships in PNG in recent years (see Table 5.8). Industry trainers must have met the extra demand for apprentice training.
20
Technical-Vocational Skills Development in PNG, ADB 2007, p.34, Table 11.

Research into the Financing of TVET in the Pacific PNG Country Report
45
Table 5.3 summarises available graduation data for business and technical colleges. Table 5.3 Business and technical colleges: total graduations 2009 to 2011
Graduations, 2009 Graduations, 2010 Graduations, 2011
M F Total M F Total M F Total
Business Colleges
Kokopo 297 296 593 92 94 186 -- -- --
Port Moresby 113 171 284 76 108 184 95 110 205
NDoE Technical Colleges
Goroka - - - -- -- -- 42 27 69
Mt.Hagen Technical 712 26 738 544 47 591 489 56 545
Lae - - - 341 148 489 -- -- --
Madang - - - -- -- -- 39 13 52
Port Moresby - - - -- -- -- 237 32 269
Other Technical Colleges
Don Bosco (DBTI) 150 25 175 -- -- -- 769 115 884
PNG Maritime College -- -- -- 311 8 319 311 8 319
Source: Annual Survey of Institutions of Higher Education (ASIHE).Blanks signify that there are no graduation data in ASIHE for the institution in the relevant year.
There are striking differences for some institutions between the numbers of graduates from one year to another, and in the ratios between graduations and enrolments between different institutions. These reflect lack of standards for what constitutes a graduation, as well as objective factors such as different course lengths. We were surprised to find such a dearth of reliable graduation statistics for the TBCs, but the finding is not new. The authors of the Labour Market Supply Data Report of 2010 had much difficulty in estimating TBC graduate numbers even up to 2005, and observed that records from institutions have not been reliably kept. Of the five TBCs we surveyed, three provided credible graduation data. Two recorded graduations as equal to enrolments.
5.2 UNIVERSITIES AND OTHER HIGHER EDUCATION INSTITUTIONS
In PNG recognised higher education institutions fall into six groups:
1) The universities;
2) Primary school teachers’ colleges;
3) Business colleges;
4) Technical colleges;
5) Nursing colleges;
6) Miscellaneous institutions. Of these groups, (2) and (5) – the teachers’ and nursing colleges – are outside the scope of this research. Groups (3) and (4) comprise the NDoE business and technical colleges just discussed, plus one independent church college – Don Bosco Technological Institute (DBTI). Summary figures for each university extracted from ASIHE are in Table 5.3. The table covers any university course below the bachelor level with a vocational aim. It therefore includes courses in fields of study such as education and health which we do not cover in TVET under NDoE because the non-university provision is in separate mono-technics outside our scope (nursing colleges, primary teachers’ colleges). University post-graduate diplomas are excluded from the figures. There are some significant gaps in the ASIHE data for graduations; no data for Goroka University in any year, and none for UPNG’s distance and

Research into the Financing of TVET in the Pacific PNG Country Report
46
external courses in any year. The latter omission means that the overall total for external and distance graduations is also substantially under-stated. The universities themselves see this work as higher education, and indeed it falls under PNGNQF. The Team had to explain the reasons why it fell within scope. Table 5.4 shows that:
all the universities except Pacific Adventist enrol and graduate significant numbers of students on campus for courses below Bachelor level with a vocational aim;
UPNG and Divine Word are also active in accrediting courses off-campus for such qualifications;
In 2010 the universities had about 2000 students enrolled on diploma and certificate courses on campus, and about 750 off campus. Almost 900 students graduated with diplomas; and
In 2011 on- campus diploma enrolments were significantly lower at 970, and off campus enrolments were about 650. There was a slight fall in diploma graduations;
Numbers on certificate courses are much lower, and also falling.
The most striking changes in the table are the disappearances in 2011 of:
on-campus enrolments in diploma courses at Divine Word University (DWU) which had hitherto been the largest single provider, and the
the certificate courses at the University of Goroka which mainly related to in-service education for teachers.
The Goroka courses were anyway at the border-line of our scope. DWU explained that, in the light of a Government steer to phase out courses below bachelor level for full-time students, they had decided to offer their diplomas only in flexible learning mode for persons already in employment. The OHE advised that there was not a formal policy to that effect, but it was a trend which some publications had encouraged.

Research into the Financing of TVET in the Pacific PNG Country Report
47
Table 5.4 Diploma and certificate enrolments and graduations at PNG universities, 2009-2010
University On Campus Distance and External
2009 2010 2011 2009 2010 2011
University of Papua New Guinea
Diploma enrolments 122 127 105 478 331 314
Diploma Graduations 125 97 97 - - -
University of Technology, Lae*
Diploma enrolments 751 299 274 0 0
Certificate and Below 77 38 36 0 0
Diploma Graduations 300 347 368 0 0
Certificate Graduations 27 28 18 0 0
Goroka University
Diploma enrolments 140 179 274 0 0
Certificate and Below 300 277 0 0 0
Diploma Graduations - 147 125 0 0
Certificate Graduations - 0 0
University of Natural Resources & Environment
Diploma 407 389 317 0 0
Diploma Graduations 57 87 64 0 0
Pacific Adventist University
Diploma 5 1 0 0 0
Diploma Graduations 1 8 3
Divine Word University
Diploma 628 659 0 354 364 339
Certificate and Below 6 74 30 103
Diploma Graduations 171 100 74 0 119 143
Certificate Graduations 1 1 9
Total Diploma Enrolments 2053 1654 970 831 695 653
Total Certificate Enrolments 383 315 36 74 30 103
Total Diploma Graduations 662 776 731 119 143
Total Certificate Graduations 28 29 18 9
Notes: 1. After 2009 Unitech ceased to list separately as diploma students those who were in years 1
and 2 of most of its 2+2 courses. 2. Post-graduate diplomas are excluded from the table. 3. ASIHE has no graduation data for the relevant Distance and External courses at UPNG.
Source: ASIHE.

Research into the Financing of TVET in the Pacific PNG Country Report
48
The style of engagement with courses within our scope varied markedly from one university to the next:
UPNG now has only one significant diploma course on campus below Bachelor level – in Accounting. It offers a Certificate in Tertiary and Community Studies much more widely but we classified it as mainly a non-vocational foundation course, and so outside our scope. UPNG’s external diploma students study largely at distance, using the course materials already developed for internal students;
UNITECH retains a 2+2 structure for some of its courses. Students can leave with a diploma after two years, or get a Bachelor degree at the end of four. Significant numbers do leave with the diploma, and sometimes return later to complete the degree. Because students leaving after two years with a diploma may originally have enrolled for a degree, the number of diploma graduates can exceed the numbers enrolled for diplomas, as in the table;
Divine Word University now offers 2-year diplomas only in its flexible mode to students in employment, who complete the diploma over two years through a combination of short residential courses and study at a distance;
UNRE’s staple undergraduate courses are 3-year diplomas in Tropical Agriculture and Tropical Fisheries.
UPNG and Divine Word franchise some diploma courses to independent institutions such as DBTI and the Institute of Business Studies. Other Recognised Higher Education Institutions Under this heading we consider three institutions:
1) Don Bosco Technological Institute had 466 students in 2011, of whom 260 were on Diploma courses and 206 on Bachelor courses. It has academic links with Divine Word University. Don Bosco is also an RTO.
2) PNG Maritime College had 334 students in 2011 on various courses approved by the International Maritime Organisation, and ranging up to one year in duration. It is a statutory authority and in 2012 its GoPNG grant is K3,179,000, yielding PFPS at K10,028. It also has support from the shipping industry and has in recent years had grants for equipment from the AusAID Incentive Fund.
3) Institute of Business Studies had 1240 students in 2011, on a mixture of Bachelor, Diploma and Certificate programs, including 619 on certificates and 565 on diplomas. IBS has academic links with Southern Cross University in Australia, as well as with UPNG. It is also an RTO.
5.3 VOCATIONAL TRAINING CENTRES AND COMMUNITY COLLEGES
These two forms of provision aim at the same audience, young people who leave school without high qualifications but wish to acquire trade and craft skills, often but not exclusively for work in the informal economy. But the means of delivery are different:
The vocational training centres are mainly provincial government institutions, though a minority are run independently by missions;
The community colleges are national institutions under NDoE but with distinctive governance arrangements.
Reflecting the common aim, the community college movement supports some parallel stream education in the VTCs. The section deals first with VTCs, then with community colleges.

Research into the Financing of TVET in the Pacific PNG Country Report
49
5.3.1 Vocational Training Centres
There is room for debate about whether to regard the work of the VTCs as schooling or TVET. NDoE’s arrangements seem to equivocate. On the one hand, the curriculum is craft-based, and responsibility for oversight and inspection rests with NDoE’s TVET Wing. On the other, the VTCs are classified in the National Education System as a pathway within secondary education, they admit students of lower secondary age and upwards, and get the same school fee subsidies as lower secondary schools. As will be seen, Government policy is steering the VTCs towards a closer alignment with TVET, but the ambiguity remains. It was agreed that the VTCs should be within the scope of this Study. VTCs offer several kinds of course:
a) courses of one or two years duration, which combine some general education with a skill or craft, such as business subjects, clothing, cookery, carpentry, automotive, metal fabrication etc These courses lead to the award of a VTC Certificate endorsed by NDoE;
b) school education in Grades ranging from 7-10;
c) at a minority of centres, NC1 courses;
d) shorter courses not leading to formal qualifications. These are more targeted to the needs of specific groups – often young adults – and may be paid for by non-formal education promoters.
Courses of types (a) and (b) are known as the ‘conventional programs’. The latest formal statistics for VTCs are in the NDoE Statistical Bulletin for 2009, as yet unpublished. They relate entirely to conventional programs. No figures are available for fields of study or graduations. Table 5.5 shows enrolments for 2009 on the conventional programs. It shows that 86% of these students were on the VTC certificate course, and 14% on school grades, and that the male to female ratio was 70:30. There were in total 1086 VTC teachers in 2009, yielding an SSR of 20.5:1. The 2012 School Subsidy Circular21 tabulates by province numbers of VTCs and other types of school, and student enrolments, based on the 2011 school census. The total enrolment on conventional programs in 2011 was 22,249, much the same as in 2009. The national average enrolment amongst the 110 VTCs was 204 students per VTC, but there is wide variation around the mean. There are striking variations between provinces in the degree of commitment to VTCs, and consequently in the opportunity to attend one, as was well illustrated by the ADB report22 in 2007. It is clear from the Subsidy Circular data that that remains true.
21
Implementation of 2012 tuition fee free education and tuition fee subsidy policy, NDoE 2012. Obtained from NDoE. 22
Technical-Vocational Skills Development in Papua New Guinea, ADB 2007. P.28 refers.

Research into the Financing of TVET in the Pacific PNG Country Report
50
Table 5.5 VTC Enrolments in ‘conventional’ programs, 2009
Vocational Training Certificate Males Females Total
Year 1 8,559 3,151 11,710
Year 2 5,102 1,791 6,893
Year 3 301 298 599
Total Years 1-3 13,962 5,240 19,202
School Grades
7-8 934 396 1330
9 93 379 472
10 798 494 1292
Total school grades 1,825 1,269 3,094
Grand Total Years 1-3 + School Grades 15,787 6,509 22,296
Source: NDoE Statistical Bulletin 2009
Since the 2011 School Census the impact of the large increase in school fee subsidies has made itself felt – both in VTCs’ ability to open their doors to more jobless young people eager to improve their skills, and in the temptation to boost numbers to get the subsidy payments. The first Subsidy payment for 2013 was based on a total of 26,877 VTC students. Following a validation exercise the NDoE based the second Subsidy payment for this year on a total of 23,799 at 107 VTCs, 6.7% higher than the 2009 total given in Table 5.5. Volatility in enrolments was certainly a feature of the VTCs we came to know. We visited five in Phase 1 and surveyed nine in Phase 2, two of which were among the Phase 1 visits. One Survey form did not lend itself to analysis; results for the other eight appear in Annex 1. A summary is provided in Table 5.6.
Table 5.6 Eight VTCs – basic data
Centre Province Enrolment No of Skill Areas SSR
Badili NCD 629 16 21.7
Kwikila Central 230 7 17.7
Milmila ENBP 154 7 14.0
Ogelbeng WHP 274 6 22.8
Rebiamul WHP 376 7 20.9
St Therese Morobe 147 4 12.3
Umi (on site) Morobe 175 6 23.3
Vunamami ENBP 824 10 24.2
Note. At Umi there were also 150 odd distance students, so that the calculation of an SSR required the Team to assume an allocation of teacher time between distance and on-site students.
Table 5.6 suggests that size is important for width of choice in skill areas. A VTC with a large enrolment has more teachers, and so can cover more skills – it is the number of teachers, not the SSR which matters. There is no clear relationship between size and SSR, where other factors are at play, one of them being staff vacancies which were higher in some areas than others, notably in WHP. The types of course offered are outlined in Table 5.6.

Research into the Financing of TVET in the Pacific PNG Country Report
51
Table 5.7 Eight VTCs – types of course
Centre VTC Cert NC 1 Other
Badili 2-year course 1-year course Community college – 1-year, 8-week short courses
Kwikila 1-year course Community college elements within VTC Certificate courses.
Milmila 2-year course
Ogelbeng 2-year course
Rebiamul 1-year course
St Therese 1-year course 1 and 1.5 year courses
Umi 20-week course Cert in Applied Technology*, School Grades by distance.
Vunamami 1-year course Six unspecified 1-semester courses.
*Qualification approved by the Council of Mt Hagen Technical College.
The variation in VTC course lengths seems remarkable – for example in Western Highlands 1 and 2-year VTC certificates exist side by side at Ogelbeng and Rebiamul. The 20 week VTC Certificate at Umi is as reported on the return; checking back with the Centre proved very difficult. St Therese had been a pilot centre for NC1, and received support for additional equipment and bringing staff qualifications up to NC3 standard. East New Britain Province (ENBP) has plans to introduce NC1 in suitable centres such as Vunamami but said it might not be feasible at its more remote sites like Milmila (on Duke of York’s Island). On our visits to the VTCs in Phase 1 we were struck by:
The very poor condition of most of the buildings, and the unsuitability of the equipment for teaching the trades and crafts offered;
The dedication of staff and students to make the most of their opportunities despite the challenging conditions.
Phase 2 visits confirmed these findings. But there was a substantial new building going up at Badili, funded by NDoE, and other centres were undertaking limited capital expenditure to re-equip or modify buildings, using money from their recently increased subsidy allocations, the community college trust etc. St Therese which is noticeably well maintained, received K100,000 a year from Lae District, the only instance reported to us of significant help from a district with facilities. With a few notable exceptions the buildings of the VTCs we visited were in poor condition. Typically they were in light construction, put up in the years before independence for some other purpose, then converted to a VTC. Many appeared to have deteriorated beyond repair. Equipment for teaching some of the technical subjects offered appeared wholly inadequate. The infrastructure in ENB appeared slightly better, and better kept, than in NCD and Central. One good new building was noted in NCD (attributed to intervention by the NCD Governor) and a second was nearing completion. A few buildings were in course of construction in ENBP. The VTC visited in Central Province had prepared plans for re-construction in the hope of attracting a donor.

Research into the Financing of TVET in the Pacific PNG Country Report
52
It is not clear what the VTC conventional programs are meant to achieve. If it were the intention to teach a range of craft and trade courses in these small centres in a practical way, unit costs would be very high. A study conducted in 2006-0723 estimated a normative unit cost of about K7000 per student/year for delivering a range of craft and trade courses in VTCs to standards based on professional advice in PNG. But setting the fee at the same level as that for lower secondary schools implies something more like the lower secondary school curriculum. Some clarification of objectives is needed to provide a standard against which to measure VTC resourcing. In a 2011 document NDoE envisaged VTCs offering three types of program:
1. Training in skills required for work in the formal economy, through one-year courses leading to NC1 or NC2, or trade tests at levels 1 and 2;
2. Modular training ranging from very short courses to up to three months for community-based skills, leading towards Statements of Attainment in skills modules;
3. A variant of (2) in which there is an orientation towards traditional arts and crafts, music and dance.
Some VTCs are already working towards this model through the range of courses they offer for students with varying needs. Others remain committed to longer courses with what appear to be uncertain aims. No-one pretends that it is easy to define, much less deliver, the menu of opportunities which will best meet the needs of PNG people marginalised by the formal education system, or simply trying to make their way in the non-formal economy. There is room for innovation and experiment.
5.3.2 Community Colleges
In 2008 the PNG Parliament passed an act24 to establish a trust charged with the development of community colleges intended to teach technical and vocational skills to disadvantaged students, in ways based on competency and appropriate to their local communities. The colleges were conceived as an alternative education pathway, for students pushed out from the ordinary schools. They were explicitly modelled on the community colleges established in India under the initiative of the Indian Centre for Research and Development of Community Education led by Dr Xavier Alphonse. The Government approved in 2008 an initial batch of 17 community colleges, with a view to the eventual opening of one in each of PNG’s 89 districts. This year five colleges were declared officially open. The most important factor in the slowness of the roll-out was the decision to go for green-field sites, many of which are still subject to land-owner disputes. Thinking seems now to have come round to the attractions of trying to grow community colleges out of existing VTCs, as well as green-field start-ups25. But colleges in the first batch are national institutions. The Team did not survey any of these colleges.
23
Papua New Guinea; a Study of the Unit Costs of Education, PDP Australia March 2007. 24
Inclusive Education for National Development of Community Education Act 2008. The trust’s web address is www.ite.org.pg 25
For example, the 2014 Budget gives as the performance indicator for community colleges “Number of vocational training centres converted to community colleges and operational in the country by 2030.” In the 2013 Budget the indicator was “By 2015, 20% of the rural populace will be trained, skilled and more independent.” At the Dissemination Workshop on 6
th March 2014, the NDoE confirmed that they
now wished to build community college concepts into VTC provision.

Research into the Financing of TVET in the Pacific PNG Country Report
53
The capital cost of the colleges was to be funded partly by grant from GoPNG and partly from a loan from China tied to the purchase of pre-fabricated units. We understand that China has delivered most of the units to PNG ports, but many of them remain stored in shipping containers, pending release of the sites for building work. Under the so-called ‘parallel stream’ the Trust has made grants to eleven existing VTCs over the years 2010 to 2012 amounting in all to K2.7 million. Three of these VTCs – Badili and Limana in NCD and Kwikila in Central Province – are included in the surveys and have reported on their use of the money, as follows:
Badili has a 52 week course in IT attended by 25 students. The fee is K500, same as other 1-year courses;
Limana has 60 week community college courses in Computing and in Hospitality, charging K700;
All VTC courses at Kwikila include four core elements - Agriculture, Life Coping Skills, Communication Skills and English – of which Life coping Skills are a community college trademark.
As we understand it, most of what is taught on these courses is taken over from the VTC curriculum. The Community College Secretariat in the NDoE is very small and has not the capacity to develop alternative curricula. It does have one valuable asset - equipment and a 50-metre transmission mast which would enable it to transmit televised instruction to community colleges throughout PNG.
5.4 EMPLOYMENT-BASED TRAINING
5.4.1 National data on apprenticeships and trade tests
We reproduce here, as Figure 5.1 and Table 5.8, data collected in Phase 1 on apprenticeship completions and intakes.
0
50
100
150
200
250
300
Series1
Source: Data supplied by NATTB in 2012.
Figure 5.1 Apprenticeship completions, 2005-2012
The apparent downturn in 2012 reflects the fact that completions for the last 5 months of 2012 were not to hand when the graph was made. The graph indicates a rising trend. In broad terms the same upward trend is observable in the pattern of intakes (see Table 5.8).

Research into the Financing of TVET in the Pacific PNG Country Report
54
Table 5.8 Apprenticeship training intake by occupation, 2007-2012
Occupation 2007 2008 2009 2010 2011
2012
Jan -05
Aug Total
Auto Electrical 2 10 26 21 38 16 113
Butchery
2
2
Cook 4 16 17 27 20 2 86
Cabinet Maker 2 1 12 10 8 4 37
Carpentry Construction 4 3 13 20 13 21 74
Compositor 2
2
Diesel Fitter 2 8 8 4 13 5 40
Electrical Fitter 1
4 18 5 28
Electrical Mechanic 12 23 45 64 46 69 259
Electronics Mechanic 1 3 8 12 10 5 39
Heavy Equipment Fitter 8 34 62 68 73 50 295
Instruments Mechanic 23
2
25
Lithographic Printer 1 1 2 3 6 1 14
Maintenance Fitting Machining 4 32 22 48 45 30 181
Metal Fabrication Welding 6 13 27 64 45 40 195
Motor Vehicle Mechanic 9 33 48 63 78 25 256
Panel Beater Spray Painter 1 7 15 5 31 10 69
Painter Sign Writer 1
1 1
3
Plumbing
5 12 22 12 11 62
Process Technician 2
11 20
33
Refrigeration Mechanic 1 3 7 18 18 22 69
Saw Doctor
1 1 1 1 4
Sheet Metal Worker
1
1
Wood Machinist
2 4
2
8
Total 86 194 331 469 498 317 1895
No.of Female 7 26 28 26 38 19 144
% Female 8% 13% 8% 6% 8% 6% 8%
No. of Male 79 168 303 443 460 298 1751
% Male 92% 87% 92% 94% 92% 94% 92%
Source: Data supplied by NATTB in 2012.
The low percentage of females training as apprentices is of concern to NATTB. It reflects a strong perception that trades like building, electrical, metal-working and vehicles are for men, which is also evident in patterns of pre-employment training and also the lack in PNG of apprenticeships in areas such as hairdressing. As regards drop-out rates, the NATTB data do not track individual students through their apprenticeships. We tried in Phase 1 comparing the annual data for intakes with the data for completions 4 to 5 years later, but no consistent pattern emerged. The degree of fluctuation in the intake to completion relationship raised doubts about the quality of the data. The NATTB produced the following table:

Research into the Financing of TVET in the Pacific PNG Country Report
55
Table 5.9 NATTB data on apprenticeship terminations
Year of Apprenticeship No. of Apprentices Dropping Out
2008 2009 2010 2011 2012
Year 1 3 0 2 2 1
Year 2 7 1 5 1 2
Year 3 0 2 1 6 1
Year 4 2 6 2 6 1
Total 12 9 10 15 5
Source: Data supplied by NATTB Table 5.9 tells us that formal, notified terminations are few but the Team doubts whether that is the full story on drop-out rates. In 2010 the NTC observed26 that the drop-out rate is high in the third and fourth years of apprenticeship, and the Team has received informal comment to the same effect. Ela Motors told us that tracking of one past cohort had found a yield of 18 fully qualified tradespersons from an intake of 60 apprentices. The firm has since taken action to improve retention. Table 5.10 Numbers tested competent in NATTB trade tests, 2010-2012
Trades
Levels
Total, all levels 1 2 3
Business Studies 64 66 48 178
Carpentry and Construction 127 38 27 192
Electrical Mechanic 118 61 64 243
Heavy Equipment Fitter 78 62 36 176
Maintenance Fitting Machining 43 26 22 91
Metal Fabrication Welding 255 55 37 347
Motor Vehicle Mechanic 107 26 48 181
Plumbing 27 14 20 61
Three-Year Totals 819 348 302 1469
Annual Averages 273 116 101 490
Source: Data supplied by NATTB Note: Level 1 is Basic Level of Competence, Level 2 is Semi-Skilled, and Level 3 is fully qualified tradesperson. Tests were also available for Community Development Worker and Electrical Fitter but none tested competent in those trades.
Over the three-year period 56% of the trade tests conducted were at Level 1 (Table 5.10). Trends over time are hard to tell because NATTB supplied the data in two time blocks – 2010-2012 and 1989 to 2012. Over the 23 years from 1989 to 2012, 3571 applicants tested competent, an annual average of 155. So the annual average of 490 for the last three years indicates some upward trend. Over the longer time period also a clear majority of successful tests were at Level 1.
26
National Human Resource Development Policy, NTC 2010, p.14.
Research into the Financing of TVET in the Pacific PNG Country Report
56
5.4.2 Training provided for employees
In Phase 1 we defined three types of training provider focussed mainly on training for people already in work:
a) Public or semi-public providers linked to Government Departments other than NDoE and OHE;
b) Providers approved by NATTB to undertake apprentice training. There are 14 of these, of which four are technical colleges and the rest are firms;
c) Industry trainers, i.e. firms in the private sector whose core business was not training but offered formal employee training requiring them to become RTOs. We found 22 of these.
A provider may fall into category (b) as well as category (a) or (c). The team selected for survey two providers in category (a) – Works Institute of Technology and PNG Institute of Public Administration (PNGIPA), and two in category (c) – PNG Power and Ela Motors, both of which were also apprenticeship training providers. Unit cost information for Works Institute and PNG Power Training College is given in Annex 1. Provision at all four establishments is described briefly below. The Works Institute of Technology (WIT) is situated within the GoPNG Department of Works (DoW) in Port Moresby, with an off-shoot in Lae. Up until about 20 years ago DoW used to run a large scale apprenticeship programme for public employees. When that programme was stopped, DoW found itself with trainers and facilities for which there was no clear role. Integration with PoMTech might seem the obvious solution, but in the event WIT kept its independence and evolved as provider of Level 1 and 2 training. The PNG Institute of Public Administration occupies its own campus in Port Moresby adjacent to UPNG, and also has a centre in East New Britain for the Islands Region. Although linked to the Department of Personnel Management, it is a Government department in its own right. Its main mission is to conduct training for the public service. In its former guise as the Administrative College it did that mainly through the provision of relatively long residential courses. It now sets out to offer competency-based training at the work-place through short modular courses leading to diplomas and certificates under the PNG Qualifications Framework for TVET. As indicated in Section 10.3 below, it enjoys substantial GoPNG funding, enabling it to employ 27 full-time trainers. All this made it appear of great interest to the Study. Alongside these two public providers should be mentioned a third – PNG Maritime College – which we did not survey on the grounds that it was too specialised. PNG Maritime College had 334 students in 2011 on various courses approved by the International Maritime Organisation, and ranging up to one year in duration. It is a statutory authority. In 2012 its GoPNG grant was K3,179,000, yielding public funding per student at K9,518. The college also enjoys support from the shipping industry, and has had help from the AusAID Incentive Fund to buy equipment. Its funding is further discussed in the next Part of the report. The PNG Power Training College is situated adjacent to the PNG Power HQ in Port Moresby. It is an RTO, also approved by the NATTB to conduct apprentice training and trade tests. Currently it trains Electrical Mechanics but has plans to extend to other trades. In Semester 2 2012 it conducted eight 8-week extension courses for a total of 220 students. A wide range of PNG companies send students to these courses. The college’s unit cost is for teaching only as PNG Power was not able to separate out its non-teaching costs from other costs of the Training Branch which supports other functions as well as the college. The College charges a fee of K5000 for an 8-week extension course. PoMTech’s fees for the same type of course are subject to limits set by the NEB – In 2012 the fee for a day student
Research into the Financing of TVET in the Pacific PNG Country Report
57
was K1115. In recent years firms and apprentices have complained much about the quality of extension training at the TBCs. The example of PNG Power indicates that some firms are ready to pay more for training which meets their requirements. Ela Motors is the main distributor of Toyota vehicles and Yamaha marine engines in PNG, employing 1,018 staff nationally. Toyota Motor Corporation is the major shareholder. Ela Motors provides training for apprentices at its HQ site in Port Moresby and other forms of training for all its staff. The company’s training courses are open to Ela Motors staff only. In 2012 training was provided for:
88 apprentices, in Motor Vehicle Maintenance, Heavy Equipment Fitting and Panel Beating;
A total of 385 employees in all forms of training, including all 196 staff who were new to the company that year. The total no of training hours was 94,500.
Ela Motors declined to provide most of the key cost information required. They did tell us that they had in the past used APTC to assist with training, but were now doing all the apprentice training in-house. The company’s strong training culture is characteristic of its Japanese parent, and may reflect a judgement that the ability to provide service through mechanics whom they have trained themselves is an important competitive advantage in the PNG market. The NATTB is responsible for the development of industry standards, which are the basic building block for competency-based training. NATTB is conscious that standards development is seriously behind schedule. That is a major obstacle in the way of developing more PNGQF for TVET courses. The NATTB argues that more resources are needed to speed up progress – quite small sums are lacking to bring in people from the outlying provinces to Port Moresby to work on standards development, and even to print completed work.
5.5 PRIVATE PROVISION AND REGISTERED TRAINING ORGANISATIONS
During Phase 1, the team devoted much effort to ascertain the distribution of RTOs by size and type, and their main characteristics. This work is included in Annex 4 of this report. It resulted in a classification of four types of RTOs:
1) Private colleges open to all comers, whether run for profit or to break even;
2) Semi-public providers with links to Government Departments other than NDoE or OHE;
3) The training branches of firms whose core business is not training industry trainers
4) Smaller private providers.
This section is about types (1), (2) and (4). Industry trainers have already been discussed under employment-based training. Table 5.11 lists the providers that were surveyed. Most of the information provided in this section derives from the few RTOs responding to the team’s surveys. The NTC’s resources are very stretched. It publishes the Register of Training Organisations, but very little other data about the sector. The Register currently comes as a list of RTOS with contact information and the names of the trainers registered at each RTO. There is a separate list of registered courses, but it is a national list, and does not indicate which RTOs offer the courses. The trainer names appear out-of-date, and clearly would be burdensome to keep up-to-date. It might be more useful if the published register was based on institutions’ names and contact details, and the courses they offer.

Research into the Financing of TVET in the Pacific PNG Country Report
58
Table 5.11 Survey of private providers 2012: enrolments and graduations
Provider Fields of Study
Enrolments 2012 Graduations 2011
Qualification Type Male Female Total Male Female Total
A
Business, ICT 694 627 1321 60 31 91 Diploma
144 119 263 TTC or similar
B
Business, ICT 329 299 628 199 141 340 PNGNQF Certificate
143 83 226 Diploma
C
ICT, Business, Tourism and Hospitality
170 190 360 35 18 53 Diploma
280 307 587 Certificate
72 79 151 Other
C Sub-total 387 404 791
D
Business, Tourism and Hospitality
16 39 55 16 39 55 PNGNQF Certificate
E
Trade Technology, Business Studies, ICT
176 33 209 151 19 170 Certificate
25 14 39 No formal qualification.
F
Business, ICT, Tourism and Hospitality
175 82 257 88 61 149 PNGNQF Certificate
11 4 15 Diploma
G Electronics 33 5 38 33 5 38 Certificate
H
Trade Technology
284 26 310 124 18 142 PNGNQF Certificate
72 12 84 Diploma
I Business, ICT 215 175 390 174 139 313 PNGNQF Certificate
J
Business, Trade Tech, ICT, Tourism & Hosp.
77 65 142 50 69 119 PNGNQF Certificate
K Business, unspecified
150 90 240 150 90 240 No formal
L Security 25 4 29 98 9 107 qualification
M Trade Technology
82 2 84 82 2 84 Other PNG formal qual
N
Agriculture, Fisheries, Forestry
81 17 98 81 17 98 PNGNQF Certificate
O Trade Technology
71 3 74 13 0 13 Apprenticeship
Totals
2,578 1,657 4,235 2,101 1,276 3,377
Notes: - Fields of study are listed in order of the number of enrolments in each recorded by the respondent. -Providers were asked to give enrolments at a point in time – 27th August 2012 – but graduations for the whole of the calendar year 2011. There may therefore be some mismatch of scale between the enrolment and graduation numbers, e.g. where courses last for one semester and there are two groups of graduates each year. -Provider C supplied enrolments for one campus and graduations for all its campuses. It indicated that its whole year enrolment for 2012 was 797. -Graduation numbers for providers D,E,G,M and N are in italics because they are the same as enrolment numbers These providers may have overlooked the request to enter August 2012 enrolments but graduations for the year 2011.
Providers are denoted by letter. It will be seen that:
Providers A,B and C are relatively large, and focussed mainly on training in Business and ICT;
Providers L and O are industry trainers and Provider M prepares employees for the trade tests;
The remainder are mainly smaller private providers.
For Phase 2 we selected RTOs from the four clusters – NCD and Central, Western Highlands, Morobe and East New Britain. We wanted to cover all four types of RTO. There

Research into the Financing of TVET in the Pacific PNG Country Report
59
was a wide choice in NCD, but fewer elsewhere, particularly in Western Highlands. Table 5.12 lists the RTOs selected for Survey in Phase 2, and the outcome of selection.
Table 5.12 RTOs selected for survey in phase 2
Provider Province Type Outcome
IEA College of TAFE NCD Private College Surveyed
Institute of Business Studies NCD Private College Declined, citing confidentiality.
PNG Power NCD Industry Trainer Surveyed
Talleres de Nazareth NCD Donor reliant Surveyed
Kingku HiTech Training Centre
WHP Private College Could not be contacted at NTC-registered address.
Highlands Youth Training and Rehabilitation Centre
WHP Private College Surveyed
Adventist Development & Relief Agency (ADRA)
Morobe Donor reliant Surveyed, but limited information obtained.
Innovative Training Centre Morobe Private College Surveyed
Ramu Agri-Industries Training College
Morobe Industry trainer Survey did not proceed – no training college there.
OISCA27
ENB Partly donor reliant
Surveyed
Elirana Electronic ENB Private college Surveyed
The IEA College of TAFE is owned by the International Education Agency, which also owns schools in PNG. The college operates on sites in both Port Moresby and Lae, with smaller off-shoots at Kimbe and Mt Hagen. It has a partnership with Kangan Institute in Melbourne and most of its courses are derived from the AQF. The range of subjects offered is similar to that of a public business college in PNG – Business, IT, Tourism and Hospitality, Management and so on. The levels of qualification differ. PoMBus and Kokopo Business are strongly focussed on two-year diplomas. The most popular courses at IEA College of TAFE are Cert III and Cert IV, with one-year diplomas also offered. IEA aims to put students through most certificate courses in one semester. It is thus aiming to work quicker than the majority of PNG providers, who allow a whole year for a certificate course. The comparison for diplomas is not straightforward because the public colleges may use the first year of their diploma courses to cover ground covered at IEA in Cert III and Cert IV. The ratio of 14.5 teachers for 527 FTE students in 2012 (SSR of 36:1) found in the Phase 2 Survey was confirmed with the college. Staff remuneration is also high, reflecting the high cost of recruiting and retaining good teachers with the rents prevailing in Port Moresby and Lae.
27
Organisation for Industrial, Spiritual and Cultural Advancement

Research into the Financing of TVET in the Pacific PNG Country Report
60
The Institute of Business Studies (IBS) and Don Bosco Technological Institute (DBTI) represent a different style of private college which combines TVET and higher education (HE) work (Table 5.13). Because these colleges are recognised institutions of higher education, student support through HECAS is available on the same terms as for TBCs. The Team did not survey them, but some information is available through ASIHE. Table 5.13 Summary of enrolments and programs at IBS and DBTI, 2011
Institute of Business Studies Don Bosco Technological Institute
Full-time students 1213 Full-time students 466
Part-time students 1240 Part-time students 0
Male:Female Ratio 1.23:1 Male:Female Ratio 3.9:1
Summary of Programs* Summary of Programs
Certificate in Accounting 342 Dip in Computer Technology 80
Certificate in Marketing 3 Dip in Electrical Technology 46
Certificate in Computing 274 Dip in Electronics Technology 44
Diploma in Accounting 110 Dip in Maintenance Fitting and Machining
42
Diploma in Business 177 Dip in Motor Vehicle Technology 48
Diploma in IT 203 Bachelor Students 206
Advanced Dip in Business and Accounting 55 (Don Bosco degrees are in the same 5 fields as their diplomas.)
Advanced Dip in Info Systems 3
Advanced Dip in IT 17
Bachelor Students 29
Other 27
Totals 1240 466
*Given in ASIHE for F-T students only.
IBS courses have varied durations and accreditation arrangements. For example the diploma in Accounting is UPNG-accredited and so is 2-years full-time, in line with the PNG Qualifications Framework for HE. The Diplomas in Business and IT are IBS Diplomas with links to courses at Southern Cross University Australia (Business) and the qualifications of the Australian Computer Society (IT). Don Bosco qualifications are accredited by Divine Word University. The Institute offers a pathway in trade technology through diplomas up to bachelor degree level. The Innovative Training Centre at Lae and the Highlands Youth Training and Rehabilitation Centre in Western Highlands are smaller business colleges offering their own qualifications. Summary information about programs is included in Annex 1. Innovative TC is in the centre of Lae, HYTRC about an hour out of Mt Hagen in Banz District. HYTRC was founded by the current principal in 2003 and is almost entirely dependent on fees from self-supporting students. Innovative TC also gets most of its income from fees but has a higher proportion of students on scholarships, including from Ok Tedi Mining. To run this type of college successfully requires close attention to the potential market and careful management of costs.

Research into the Financing of TVET in the Pacific PNG Country Report
61
OISCA and Elirana are both small providers, with 82 and 49 students respectively at the time of survey, and both in East New Britain. They have nothing else in common:
OISCA was established with strong Japanese input to provide training in agriculture, which it does through a one-year course which takes students through four modules – rice, vegetables, forestry and animal husbandry. The site is off-road (but on river) and all students board. Teachers are still trained in Japan. The impression is of a well-resourced, highly competent operation well-placed among the fertile soils of ENB;
Elirana is the creation of Elijah Turana who learned Electronics Technology with the Bougainville mine. It is in improvised premises which Mr Turana hopes to replace. He uses in contact mode a distance education curriculum from the American supplier Penn Foster. Mr Turana’s commitment to imparting his skills to the next generation came through very strongly. Equipment appeared to be sparse. We wondered about the acceptability of Penn Foster courses to prospective employers.
The smaller RTOs provide a service which PNG people are willing to pay for, and which may stand comparison with what they could get from a VTC. NTC’s capacity to supervise the 150 odd providers at issue is limited, and the challenge of aligning the sub-sector to the standards of the PNG Qualifications Framework for TVET appears steep. Table 5.14 summarises enrolment and graduation numbers at the RTOs we surveyed, plus PNG Maritime and DBTI so as to give an idea of overall RTO numbers, so far as we were able to ascertain them. Table 5.14 Summary of enrolments and graduations at RTOs surveyed
Enrolments Graduations
Survey date Colleges Male Female Total Male Female Total
Only in Phase 1 12 2,112 1,275 3,387 1,469 716 2,185
Phase 2 8 1,240 1,055 2,295 1,119 977 2,096
Totals 20 3,352 2,330 5,682 2,588 1,693 4,281
Other RTOs Cited
PNG Maritime 1 327 7 334 311 8 319
Don Bosco Technological Institute 1 371 95 466 479 52 531
Totals, surveyed and other RTOs 22 4,050 2,432 6,482 3,378 1,753 5,131
Notes:
The colleges listed as Only in Phase 1 are those which we surveyed in Phase 1, less three which were also surveyed in Phase 2. Numbers relate to enrolments as at August 2012, and graduations in 2011. Phase 2 data relate to enrolments in Semester 2 2012 and graduations in 2012. Data for DBTI and PNG Maritime are drawn from ASIHE 2011.
Table 5.14 relates to just 22 of over 200 RTOs. It covers most of the ones known to be large, and a selection of smaller ones. Fuller information on RTOs surveyed in Phase 2 is given in the data sheets at Annex 1.
5.6 TRAINING FOR THE INFORMAL ECONOMY
As discussed in Part I of this report, the majority of the adult population of PNG are within the informal economy. Through training, subsistence farmers, small traders and the unemployed can acquire skills which improve their earnings and enrich their lives. Typically such people lack the schooling and the purchasing power to get immediate access to formal TVET.

Research into the Financing of TVET in the Pacific PNG Country Report
62
Shorter courses, free or at low cost to the participant, are needed to engage them. As long as it is structured training, such provision is within the scope of the study. Non-formal TVET is hard to research. It leaves no footprint in the official statistics of PNG. The National Resource Directory of Informal Sector Training Providers drawn up by an NGO called the Consultation, Implementation and Monitoring Committee (CIMC) in 2005 has not been up-dated. Moreover GoPNG responsibility for this type of training is hard to pin down. Historically the Department for Community Development (DfCD) had the lead, and that may still be the case for training conducted to foster Community Development. However in 2011 DfCD published the National Informal Economy Policy Statement which assigned responsibility to NDoE in the following terms:
The Department of Education through the Technical and Vocational Division and in collaboration with NGOs and private education providers will be instrumental in ensuring that the majority of illiterate informal economy participants are given the opportunity to attain functional literacy levels. Its responsibilities will include:
Designing financial literacy programs in Technical and Vocational Education and
Training (TVET) programs;
Ensuring high-quality primary education that builds their literacy and numeracy skills,
along with a sense of the wider world in which PNG is placed;
Being attentive to the needs of rural and urban informal economy participants in
TVET programs;
Offering training to informal economy participants on the basis of the interest and
aptitude of participants, not for certification, and with the objective of opening
participants' eyes to new possibilities, equipping them with specific skills, and
increasing their capacity to handle money; and
Working in collaboration and partnership with other education service providers such
as churches and other NGOs to address the needs of informal economy participants.
The NDoE advised early in 2013 that:
NDoE in accordance with its functional statement is responsible for formal education
and training. However, in practice, vocational training is provided to the local
communities via short courses.
NDoE through the National Literacy Secretariat conducts training at the broader
community level.
In the light of the difficulties in conducting wide-ranging research into this type of training within the Study’s resources, and the uncertainty about GoPNG responsibilities, the NRG agreed at the Planning Workshop on 24th April 2013 to limited coverage of structured training for the informal economy in Phase 2 on the following basis:
The Team would look at all the provision made by the Vocational Training Centres to be visited, including short courses sponsored by non-formal sector providers as well as the conventional programs;
The Integrated Agricultural Training Program and the work of Ginigoada Business Development Foundation would be covered within the work on the East New Britain and NCD clusters;
The work of the Skills Development Trust Fund (SDTF) could in principle be covered, subject to further advice.

Research into the Financing of TVET in the Pacific PNG Country Report
63
In Phase 1 we also looked at the contribution of PNG Sustainable Development Program (PNGSDP) to the support of informal sector training. PNGSDP’s wealth derived from the Ok Tedi mine and its expenditure was allocated about one-third to Western province and two-thirds to the rest of PNG. On 18th October 2013 PNGSDP announced that following the passage of legislation by GoPNG to nationalise Ok Tedi Mining Ltd it was no longer in a position to continue funding social and economic development projects.
5.6.1 Provision by VTCs and RTOs of training for the informal economy
Among the VTCs we found short course provision at:
Badili and Limana VTCs in NCD -8 week courses in both cases. Badili charged a fee of K30 for courses in Carpentry, Plumbing, Seafaring, Upholstery, Basic Welding and Tourism and Hospitality, recording 240 students in Semester 2 of 2012. Limana offered Front Office, House-keeping, Food and Beverage and Cookery, apparently at a fee of K700, enrolments uncertain;
Vunamami in East New Britain offered 6 one-semester courses on unspecified topics in semester 2 2012 at a fee of K800, enrolling 135 students.
Except at Limana which is mainly for girls, the vast majority of places on these courses were taken by boys.
We surveyed two small RTOs which specialise in this type of provision:
Talleres de Nazareth is at Korobosea in the NCD and works with people in the adjacent settlements. It offers courses in cooking and sewing, aiming to give its trainees – mainly females – a skill they can use to earn income. In semester 2 2012 there were 137 trainees in cooking (including 18 males) and 92 in sewing (all females). Cooking is a 1-month course with a fee of K55, and sewing a 2-month course with a fee of K75. The difference in course length is partly a matter of sponsorship: Ginigoada Business Development Foundation (GGBDF) sponsors the cookery course and SDTF the sewing course. The premises were funded by grants from Japanese aid, and by Catholic charities in Europe.
The Adventist Development and Relief Agency, based in Lae, ran one week courses on 7 topics for a fee of K150 in 2011 and 2013 but not in 2012. Its work is largely funded by AusAID’s Church Partnership Program. ADRA’s 2011-2012 Report discloses training activity in fields such as HIV awareness, hygiene, family leadership, literacy and numeracy, and managing a micro business. Discussions with ADRA indicated an emphasis more on community development than skills instruction.
Scrutiny of the website of the DFAT-funded Strongim Pipol Strongim Nesen (SPSN) Program28 showed several other examples of training oriented towards community
development. Ginigoada Business Development Foundation (GGBDF) began in 2002 at the initiative of Dame Carol Kidu, a Port Moresby Member of Parliament and former Community Development Minister, and the PoM Chamber of Commerce and Industry. Its fundamental aim is to help unemployed young people through short-term skills development funding. Ginigoada sends specially equipped buses into the settlements around Port Moresby and begins the process of re-entry to education on the ground (literally). Three different skills programs are offered from the buses – Young Skills, Life and Business Skills and Financial Literacy. About 4000 students altogether undertook these very short programs in the first half
28
See http://www.spsnpng.com/projects/projects/directorydupe.html

Research into the Financing of TVET in the Pacific PNG Country Report
64
of 2013. About 670 students went on to short term skills training, usually of a month’s duration. GGBDF supports courses at a number of providers in the NCD, including the Morata and Badili VTCs and Talleres de Nazareth. Typically GGBDF pays VTCs about K8000 for a 4-week course for 20 students. GGBDF’s projected income for 2013 is about K1.7 million. Of that about 55% comes directly or indirectly from the NCDC, about 13% from Australian aid through the SPSN Program, and the remainder from a variety of donors both in PNG and overseas, plus about 2.5% from training participants. The Integrated Agricultural Training Program (IATP) is the principal activity of the Kairak Vudal Resource Training Centre (KVRTC), based at the University of Natural Resources and Environment in East New Britain. IATP works with subsistence and small cash crop farmers to develop skills in problem-solving, basic financial management and improved farming methods. Courses are delivered near the workplace and maybe very short and specific; for example, a current theme is how to combat the cocoa pod borer. The Australian Government Incentive Fund paid for the KVRTC premises on the UNRE site. IATP is now self-funding on the basis of grants from the provinces in the Islands Region, and fees from course participants. In 2011 it supplied 107 ‘training deliveries’ which reached 3439 farmers, spread across East New Britain (1749), West New Britain (840) and Bougainville (160).The balance of 690 farmers were trained at various mainland and island sites on the on special courses arranged through the Cocoa and Coconut Institute of PNG. Total expenditure was about K3.1 million and total income was K2.9 million, of which fees for training accounted for 84 per cent. IATP appears to be a very successful example of cooperation between a university and provincial governments to deliver training to farmers where they need it.
5.6.2 The Skills Development Trust Fund
SDTF is a training fund, originally endowed with capital (which in 2006 amounted to K53 million) by the ADB and the four provinces – NCD, West and East New Britain and Western Highlands – which participate in the Fund. The income from this capital is distributed to support training proposals put up by non-formal training providers. The team made every effort to work with SDTF because it is a well known example of a training fund.29
Three of the survey provinces – NCD, ENBP and WHP were also SDTF provinces. SDTF indicated that NCD was working well for them; we had included a long-term SDTF partner Talleres de Nazareth in the survey, and staff there spoke highly of the support given by SDTF. The data that SDTF provided indicated that over half the SDTF’s training expenditure relates to NCD. SDTF indicated that they did not have control over staff appointed to their provincial offices and that arrangements in other provinces were ‘fragile’. Our visits tended to confirm that – likely partners had either not heard of SDTF or had had no help from them in recent years. SDTF has a website with some useful literature but publishes no annual reports or financial statements. For research purposes the team asked for copies of recent financial statements and the Trust Deed. This material was not supplied.
29
A Review of National Training Funds by Richard Johanson, World Bank 2009, has some observations on the early years of SDTF.

Research into the Financing of TVET in the Pacific PNG Country Report
65
In the circumstances all we could do was to analyse the project approvals list to see what it indicated about levels of activity, and whether the trend in expenditure was consistent with the likely income of a fund which amounted to K53 million in 2006. The results of this analysis are in Annex 3. The conclusion is that SDTF’s current rate of spending seems far below what would be expected from the last known size of the Fund. Given that SDTF’s funds have their origin in official overseas aid and donations from provincial governments in PNG, the Fund needs to publish reports and accounts and make them available for audit.

Research into the Financing of TVET in the Pacific PNG Country Report
66
CHAPTER 6. AID AND DEVELOPMENT PROGRAMS GoPNG recognises that it cannot at present meet all its demands for skilled labour from the output of its own TVET system. This section explores two models for sourcing high quality skills from overseas-based suppliers:
a) The Australia-Pacific Technical College (APTC); and b) The TVET Skills Scholarship Program (TVETSSP).
6.1 AUSTRALIA-PACIFIC TECHNICAL COLLEGE (APTC)
This section uses data provided to the overall study by APTC’s regional headquarters. The overall study team made a single data request to APTC headquarters, rather than collect data from the individual country campuses where APTC operates. The central data enabled analysis for each campus. APTC’s PNG campus adjoins Port Moresby Technical College (PoMTech). Its courses are aligned to the Australian Qualifications Framework. APTC offers courses in two Schools; Trades and Technology (STT) and Hospitality and Community Services (SHC). In 2011 the PNG campus offered only STT courses, though it has since started some SHC courses. All courses offered in PNG in 2011 were at Certificate III. Table 6.1 summarises enrolments in 2011. It derives from fuller tables supplied by APTC which include enrolments by course and by gender, graduations and a time series from 2009 to 2012. Table 6.1 Enrolments at APTC relating to PNG, 2011
School
Campus
PNG (PNG students)
PNG (non-PNG students)
30 Fiji Samoa Vanuatu
All PNG students
School of Trades and Technology 107 46 3 9 0 119
School of Hospitality and Community Services 0 0 74 35 32 141
Totals 107 46 77 44 32 260
In 2011 the PNG campus had 153 students. The 46 students who were not from PNG were mostly from the Solomon Islands. Numbers in 2010 were similar, but in 2009 324 students were enrolled, including some with Ok Tedi Mining Ltd at Tabubil. The PNG enrolments included 1 female in 2010, and 5 in 2011. APTC management comment that the strong male bias mostly reflects employment patterns as students are drawn from existing workers. We do not have a gender breakdown for the SHC students from PNG, all of whom study in other countries. Graduations from the PNG campus were 193 in 2010 and 198 in 2011, higher than current enrolments because of the large intake in 2009. Table 6.2 summarises costs for the PNG campus of APTC, on the basis of direct costs supplied by APTC, and attribution of overheads according to a standard method applied to all APTC campuses by the overall study team.
30
This column counts students from foreign countries studying at the PNG campus. The cols for Fiji, Samoa and Vanuatu count students from PNG studying in those countries.

Research into the Financing of TVET in the Pacific PNG Country Report
67
Table 6.2 Estimated costs of the PNG campus of APTC, 2011-12 (A$)
School of Trades
& Technology Campus
management Total PNG campus
Pro-rata regional overheads
Total APTC PNG
Recurrent expenditure
personnel 720,266 474,627 1,194,892 592,111 1,787,003
operating expenditure 700,271 2,156,225 2,874,036 483,964 3,358,001
Total recurrent 1,420,537 2,630,851 4,068,929 1,076,075 5,145,004
Scholarship program 532,631
532,631
532,631
Capital expenditure 143,504 143,504 227,925 371,429
Total operations 1,953,168 2,774,356 4,745,064 1,304,000 6,049,064
Note. The totals include recurrent expenditure of A$17,540 attributable to the School of Hospitality and Community Services.
Beside the costs shown in Table 6.2, there is also the cost of education for PNG students at APTC campuses in other countries. As shown in Table 6.1, there were in 2011 153 students from PNG studying at overseas campuses of PNG, all but 12 of them in the School of Hospitality and Community Services which did not then have courses in PNG. As it happens, the number of PNG students studying at overseas APTC campuses in 2011 was the same (153) as the total number of number of students on the PNG campus, which is costed in Table 6.2. The cost would be less for the PNG students overseas because SHC courses cost less than STT courses to provide; on Fiji the cost ratio between the two schools is roughly 1.65:1. Taking the recurrent costs of the PNG campus and of the scholarship program – K4,601,560, the cost for the 153 students there in 2011 is A$30,075 per student or about K67,670 @ A$1=K2.25. Given the high weight of campus management in the total cost, unit costs might be considerably reduced as numbers at the PNG campus increase. APTC’s contribution to skills formation in PNG is small in quantity. Its value may reside in the high quality it brings to trade technology courses, the demonstration of what can be done at Cert III which is a gap at present in PNG’s own TBCs, and in the spin-off effects for PoMTech in terms of equipment, staff development etc of its presence on the campus. That said, 54% of all APTC students from PNG in 2011 were in SHC, split 86:55 between Tourism and Hospitality, and Community Services. The value for the aid dollar in providing for PNG students to attend APTC campuses overseas to follow courses in fields where both public and private sector TVET in PNG have been expanding in recent years might be questioned. To the extent that SHC courses are in future offered in PNG, costs might be reduced and PNG would get the spin-off effects. However, as long as APTC maintains its present style of operation the cost gap between APTC and local providers will be very large.

Research into the Financing of TVET in the Pacific PNG Country Report
68
6.2 THE TVET SKILLS SCHOLARSHIPS PROGRAM (TVETSSP)
TVETSSP is a GoPNG program initiated by the DNPM and implemented by the Office of Higher Education on the back of the 2009 Labour Market Assessment. The analysis at that time31 was that PNG’s TBCs were producing about 800 graduates a year at Certificate II (pre-
apprenticeship level), of which about 200 were in trade technology. It was argued that:
About one in three of the jobs in PNG requiring technical skills were fill by unqualified persons. The LNG project alone required about 7000 qualified tradespersons;
PNG’s own technical colleges lacked the capacity to fill this skills gap in the near term, and would need massive investment over a long period to supply the country’s needs more fully; and
Consequently it was necessary to procure pre-apprenticeship training of good quality from overseas, and place the graduates with PNG employers.
On this basis GoPNG agreed in 2010 to establish TVETSSP. The scheme provides for the selection of students from PNG to attend pre-apprenticeship courses (roughly NC2 level) of 21 weeks’ duration at the Queensland TAFE colleges in Cairns and Townsville. These are special courses for the PNG students run alongside the normal provision of the colleges. TVETSSP was originally intended to run from 2011-2015, with a policy target of about 2,000 graduates over that period, at a rate of about 400 a year. The five fields of study in 2011 were Automotive Mechanical, Civil Construction, Construction, Engineering (Fabrication) and Engineering (Mechanical). In 2012 Construction Pathways, Drainage, Automotive Vehicle Body, Air Conditioning, Electro Technology, Hospitality and Sustainable Energy were added. The invitation to apply for TVETSSP scholarships tenable in 2013 indicates that candidates may also apply for NC3 courses; and experienced TVET Instructors may also apply for a NC4 Training, Assessment and Evaluation course. The original budget for TVETSSP over the years 2011-2013 was K20 million a year. In the light of the costs of the scheme as they emerged through negotiations with TAFE Queensland and other parties, operational targets for graduate output were originally set at 150 in 2011 (pilot year), and 200 in 2012 and again in 2013. In the event:
For 2011 555 applicants apparently eligible were identified but the verification process brought the number down to 203, of which 150 were offered scholarships. Difficulties in obtaining visas and late withdrawals brought the final number of graduates down to 120;
For 2012, 482 eligible candidates were awarded scholarships but similar factors to 2011 brought the numbers travelling to Queensland on scholarships down to 241. Again in 2013 the first semester cohort was reduced to 61 students by slow processing of visas by the Australian High Commission. The deferred students were able to take up places in the 2nd cohort but the total number of graduates for 2013 was just 179.
Under the TVETSSP contract TAFE Queensland receives a fixed fee per class. In the first semester of 2012 there were 10 classes at A$166,600 per class. The average number of students per class was 15.7. The unit cost per student goes up when PNG is not able to fill the class. According to OHE, in 2011 and 2012 the unit cost was about K86,000 per student. In 2013 it was about K106,000 per student.
31
Current figures would be higher as a result of rapid growth in TBC enrolments in 2010 and subsequent years.

Research into the Financing of TVET in the Pacific PNG Country Report
69
When the graduates return to PNG the OHE pays a training wage for six fortnights as an incentive to employers to recruit them, plus a K1000 toolkit subsidy for graduates nominated by their employers for apprenticeship training. For those who become apprentices there is support continuing through the 4-year apprenticeship for on-site training supervision, the cost of attending extension training at institutions, and NATTB supervision. There is also assistance for TVETSSP graduates to get job placements. However OHE estimated that up to July 2013 only 36% of graduates had obtained formal employment. Others have had ad hoc employment. The OHE reached understandings in 2013 with several companies to engage graduates after training. The main cost elements of TVETSSP are as follows: Table 6.3 TVETSSP cost elements 2012 (Kina 000s)
Element Cost % of Total Cost
Course Fees 8,480 32.1
Student Allowances 1,230 4.7
Board and Lodging in Australia 9,481 35.9
Travel and subsistence in PNG 736 2.8
International travel 588 2.2
All other pre-graduation costs 996 3.8
Total pre-graduation costs 21,871 82.8
Apprenticeship Subsidy Scheme 4,547 17.2
Total Costs 26,418 100.0
TVETSSP is a bold initiative to accelerate skills formation for PNG. It has turned out more expensive per graduate than expected, partly because demand from qualified applicants was barely sufficient to fill the places available based on the original concept of pre-apprenticeship courses in trade technology, and partly because of difficulties in converting scholarship awards to trainees in Australia, owing in large part to visa delays outside PNG’s control. In the 2014 GoPNG Budget provision for TVETSSP is reduced from K20 million in 2012 and 2013, to K15 million for 2014, of which K12 million is for Training. However the Budget Performance Indicator for TVETSSP implies that the Program aims to produce at least 300 graduates in 2014, for K15 million, which would require a sharp reduction in unit cost. OHE advise that they hope to reduce the cost to GoPNG by persuading prospective employers to share the costs of training but that will take time. On present reckoning the unit cost in 2014 may be little different from the 2013 level of K106,000 per graduate. There is already a precedent for employer cost-sharing in the scheme. If it can be replicated, it will address two weaknesses of TVETSSP as it operated up to end 2013; insufficient employer engagement and excessive cost. However, getting sufficient employer support to sustain TVETSSP in its current form may prove challenging. Another option is to use special scholarships funding to improve the quantity and quality of training within PNG in skills which are of high priority for the PNG economy. That too is under active consideration.

Research into the Financing of TVET in the Pacific PNG Country Report
70
6.3 APTC AND TVETSSP COMPARED
Both APTC and TVETSSP offer certificate courses to Australian standard. The level of the APTC courses is slightly higher – Certificate 3 compared to about Certificate 2 for most TVETSSP courses. Unit costs in both schemes are highly sensitive to the number of students going through in a particular year, but on the data presented above:
APTC is less costly – an estimated K67,670 per student in 2011 compared to K86,000 per student for TVETSSP in 2011 and 2012, or K106,000 per student for TVETSSP in 2013;
Both schemes are many times more costly than the cost of trade technology courses delivered in PNG to PNG standards – e.g. the estimated cost per FTE student of PoMTECH, which is largely engaged in certificate courses in trade technology, was K6,843 in 2011.
The questions are whether the quality advantage justifies the cost of special interventions like APTC and TVETSSP, and how to set the mainstream PNG TVET system on a path towards sustainable improvements in quality. Another option employed by private providers in PNG is to teach courses accredited to the Australian Quality Framework in PNG and using largely PNG staff. This private provision is more common in the business and IT fields of study than in trade technology. Section 10.9 below considers the example of IEA College of TAFE where the cost per FTE student is about K10,000.

Research into the Financing of TVET in the Pacific PNG Country Report
71
CHAPTER 7. ROLE OF TVET IN ECONOMIC AND SOCIAL
DEVELOPMENT
7.1 TVET IN ECONOMIC DEVELOPMENT
TVET institutions are potential contributors to the economy of the nation. They offer vocational and technical courses which by virtue of their skills orientation can contribute to the growth of industries in both the formal and informal sectors. These skills can be used to exploit both the renewable and non-renewable resources of PNG, and/or maintain business activities, in primary, secondary, and tertiary production. Primary production skills produce minerals, agriculture, livestock, fishery and forest products, and contribute to downstream processing as well. Business skills activate trading and marketing, thus, creating a culture of entrepreneurship in the community. Against that background, what are the data about the stock of people with TVET qualifications in the workforce, and the annual inflows? As to stock, the HIES found that in 2009-10 9.4% of adult males and 5.0% of females held some kind of tertiary education qualification in 2009-2010. The figures are encouragingly higher than those for tertiary qualifications derived by Gannicott (2011) from the 2000 Census – 7.1% for males and 3.4% for females. But most sources indicate that the supply of skilled tradespeople in PNG still falls a long way short of demand, in quantity, in match of skills to jobs required and in the quality of skills. The 2010 Labour Market Assessment Demand Data Report, which covered 80% of all PNG firms, found a total of 53,100 trade skills positions across all industries and sectors. Of these positions about 37,900 were occupied by skilled tradespersons. So the stock of skilled tradespeople available in 2010 fell 29% short of the demand then current. The Labour Market Assessment and Gannicott (2011) both attempt to quantify the annual inflows of TVET graduates. Their attempts are to some extent vitiated by the very recent surge in enrolments in the public TVET colleges, and by very patchy data for graduations from both public and private sectors. The Vision 2050 referred to in Section 4.1 mapped a path for the development of PNG over the next 40 years. It highlighted that Technical/Vocational Education and Training must be improved and there must be an increase in quality training for a skilled workforce, as required by both private and public sectors. Vision 2050 identified opportunities for expansion in manufacturing and services and in agriculture, fisheries and eco-tourism in the rural areas. Seizing these opportunities will increasingly expose the local enterprises to global competition. To thrive in that environment the country needs a well-educated workforce – both in terms of workplace skills and motivation, and the attitudes which make for harmonious communities. PNG is looking for ways to flesh out its vision for economic development with labour market data which could inform decisions about investment in the tertiary education system and the choices of students. OHE designed a graduate tracer study not long ago but could not find resources to proceed with it. The team welcomes the current interest by NDoE in developing a tracer study for TVET.

Research into the Financing of TVET in the Pacific PNG Country Report
72
7.2 TVET AND SOCIAL DEVELOPMENT
This section successively explores the pathways into TVET and the numbers of people who have taken them, the accessibility of TVET facilities, and the availability of scholarships. Access for disadvantaged people is an important cross-cutting theme.
7.2.1 Pathways into TVET
To enter a conventional program at a VTC a student would normally need to complete at least Grade 8 (completion of primary education). Entry to TBCs normally requires completion of Grade 10 (lower secondary) or Grade 12 (upper secondary) depending on the level of the course. These are high hurdles in relation to the historic experience of school enrolment rates in PNG: Table 7.1 Gross enrolment rates for primary and secondary schools, 2009-2010
Gross primary enrolment ratio % National Rural Urban
Total 74.4 66.0 83.3
Male 77.3 70.2 85.0
Female 71.1 60.8 81.4
Gross secondary enrolment ratio %
Total 44.4 23.2 62.7
Male 49.7 26.7 70.1
Female 38.9 19.4 55.1
Source: PNG Household Income and Expenditure Survey (HIES), 2009-2010.
Table 7.1 shows substantial differences enrolment rates between:
Urban and rural areas. Urban is defined for HIES as town or city with minimum population density of 195 persons per km2. All other areas are rural;
Males and females. The gender gap in enrolment rates widens as students progress from primary to secondary school.
The most common reasons for not attending school given by HIES respondents were: No interest, Family did not Allow, School too Far or not Functional, Cannot Afford School Fees. Just over 1% of those who never went to school gave Disability as the reason. Asking why a child is not in school is a sensitive question, and answers may vary depending on how it is put. The ASPBAE study cited in Section 3.3 above found that the most commonly cited reason for not attending or completing primary and secondary school was school fees. Cost factors, poor access and parental expectations to help at home or to work, are other frequently listed barriers to completing primary and secondary school (ASPBAE). Differences in enrolment and completion rates bear strongly on students’ chances of entering TVET. But the outlook is improving. Completion rates for lower and upper secondary school, though still low, are rising strongly, and the move to tuition-free schooling should stimulate attendance. For the adult population HIES reported that for PNG as a whole 9% of males and 5% of females gave Tertiary Education as their highest level of qualification. There were big differences by region, and between metropolitan, urban and rural areas.

Research into the Financing of TVET in the Pacific PNG Country Report
73
7.2.2 Access to TVET Institutions
VTCs are maintained by provinces, and set out to provide a local service. Every province has one or more VTCs, but there are big variations in VTC enrolments per 1000 population, as shown:
Sources: PNG Census 2011 for population per province, PNG School Census 2011 for VTC students per province. The provinces of Hela and Jiwaka are treated in the figure as parts of Southern Highlands and Western Highlands respectively because the School Census data did not show them separately.
Figure 7.1 VTC enrolments per 1000 population, 2011
The NDoE’s aim is that there should be VTC and community college provision in each of PNG’s 89 districts. The TBCS are national institutions. There are nine of them, and until recently it was generally accepted that most students would need to attend a TBC outside their home province as a boarder. ASIHE does tabulate student enrolments by home province, but the data for TBCs are too patchy to permit analysis. In 2010 the previous government announced its aim of establishing one polytechnic in each of the four regions of PNG, and one technical college per province. The Team is not clear whether that is the policy of the present Government, but the momentum for other provinces to seek the establishment of new TBCs is documented elsewhere in this report. Meanwhile a high proportion of TVET students in PNG are boarders. Boarding adds substantially to the cost of education, and dormitories makes a large claim on the limited resources for capital investment. Facilities closer to home would somewhat reduce the need to board, but gaps in PNG’s road and transport systems means that day attendance can be a problem even if home is quite a short way from college. PNG also has nationwide networks of public training providers outside the scope of this Study. The colleges which train nurses and community health workers, and primary school teachers, for example, are a valuable source of training opportunities.

Research into the Financing of TVET in the Pacific PNG Country Report
74
Private sector provision for TVET is found in most provinces, but there is a marked concentration in NCD, Morobe and East New Britain. 65% of all RTOs have registered address in NCD.
7.2.3 Access to TVET for disadvantaged groups
Within the TVET system there is a marked preponderance of males in overall enrolments, and wide gaps between males and females in different fields of study. Overall females formed 35% of the TBC enrolments in 2013. By type of course they formed:
24% of students on technical trade certificates;
21% of students on National Certificate courses;
4% of students on apprentice extension courses; and
48% of students on diploma courses.
The strong differentiation by type of course reflects female uptake of courses in fields of study such as business, tourism and hospitality, and male predominance in trade technology. At the course level differentiation is still more marked. There are very few females training for the construction, vehicle, electrical and metal-working trades. Taking two colleges which specialise mainly in these trades, PoMTech reported in the survey that females comprised 11% of its students, and at Mt Hagen Tech the proportion was even lower (6%). The ratios of females to males vary among RTOs for much the same reasons as with TBCs. Taking all the RTOs for which data are available, Table 5.14 shows that the proportion of females enrolled was 37%. In 2009 about 6,200 females were enrolled at VTCs, 29% of the total. A breakdown of female participation by course was not available. There are significant variations by province in the gender balance at VTCs. There was even one province, Milne Bay, where females form the majority of the VTC enrolment. As the school enrolment rates show, living in a rural or remote area reduces the chance of completing schooling. The VTCs in these areas cope with problems such as no mains electricity, no or limited access to Internet, and family poverty when crop prices fall. Provinces face difficult choices in deciding whether they can move their rural VTCs onto NC courses. The community college movement was originally intended to combat rural and remote disadvantage.
7.2.4 People with disabilities
The PNG National Policy on Disability32 includes the following:
Strategies: Government and private sector employers are encouraged to employ people with disabilities.
Actions:
NCCD in collaboration with the Department of Labour and Employment develop a programme which encourages employers (government and NGOs, Churches, Chambers of Commerce etc), (i) to train people of special needs within the ordinary training programmes of their respective enterprises, and (ii) to employ people with special needs once they are trained;
Guidelines developed by NCCD in collaboration with relevant stakeholders for employment of graduates with disabilities.
32
Published by the Department for Community Development in 2005. NCCD is the National Co-ordinating Committee for Disabilities.

Research into the Financing of TVET in the Pacific PNG Country Report
75
The Team did not see provision for people with disabilities in the course of its visits. Much of it will depend on the initiative of NGOs and church organisations working with committed trainers.
7.2.5 Financial support for students
There are two Government schemes which support students in TVET, and a number of provinces have their own schemes. The Government schemes are:
The Tertiary Education Student Assistance Scheme (TESAS) run by the Office of Higher Education; and
The Independence Fellowship Scheme (IFS), run by the Department of Labour and Industrial Relations.
TESAS consists of four categories. The one of most interest for TVET is the Higher Education Contribution Assistance Scheme (HECAS). HECAS itself comes in two variants:
Variant 1 for universities is worth K4750 per award-holder per year; and
Variant 2 for non-university institutions is worth K1,875 per student per year. These rates have remained the same in cash terms for the last ten years. The rate depends on the type of institution attended, not the type of course. TVET students in universities may be eligible for Variant 1; and in TBCs and other TVET providers which OHE recognises as institutions of higher education (IHEs) they may be eligible for Variant 2. TESAS never set out to offer an award to every student admitted to a course of higher education. Self-sponsored students were always a part of the scheme. From 2000 to 2007 they were eligible for help from a Student Loan Scheme. No new loans have been issued since 2007 because no effective means was found to recover the repayments. The OHE issues quotas of HECAS awards to IHEs. The quotas for TBCs are much lower than for universities. About one-third of the students at TBCs have a HECAS award, which covers about one-third of the fees payable by a boarding student.33 Neither the OHE nor the NDoE nor of course the students regard this situation, which has come about through the impact of inflation and budget restrictions, as satisfactory. The OHE conducted a review of TESAS in 2012 and made recommendations for increases in the value of TESAS awards and the numbers of students supported, and for an investigation of options to revive the Student Loan Scheme. The cost to the GoPNG Budget would be very substantial. It is not reflected in the 2014 Budget provision for TESAS, but it is understood that the National Executive Committee endorsed the conclusions of the review, for implementation in 2015. No further details were available to the Team. Meanwhile a number of provinces, NGOs, MPs and other parties offer scholarships for students to study TVET. For the NCD scheme, the NCD Governor allocated K4 million in 2013, to cover about 700 scholarships for NCD school completers at eligible NCD TVET institutions.
33
HECAS awards are normally made to boarding students as the main element of the award is a board and lodging allowance.

Research into the Financing of TVET in the Pacific PNG Country Report
76
The list of these includes:
As Government providers, both the TBCs in NCD, all five VTCs and Works Institute of Technology. Presumably the VTCs are included for their short courses which do not get School Fee Subsidies;
five Catholic institutions including DBTI, and
eight private providers, including PNG Power and the Institute of Business Studies. The scheme pays 75% of fees for students attending Government and Catholic institutions, and 50% for students at private providers. As to administration, the Governor has allocated K1 million to each of the three NCD MPs and K1 million for the Motu Koitabuans.34 The MPs’ offices administer the scheme for their constituencies. Enga has a Loan Assistance Scheme for students of Engan descent or children of non-Engans who have lived in the province for more than three years. The scheme provides loans of up to 50 per cent of school fees. However, special consideration may be given for 100 per cent financing for students undertaking studies in specialised colleges and universities. Under the scheme, the successful applicants sign a loan agreement whereby they agree to repay the loan, after they complete their studies and are employed. The applicant also gives permission to the Ipatas Foundation in Enga to access academic results directly from the colleges or universities to monitor their academic progress. Morobe pays up to full fees for its students to study courses of tertiary education at the HE and TVET institutions in Lae, and at Divine Word University in Madang. The scheme costs the province about K5 million annually. The Independence Fellowship Scheme administered by the Department of Labour and Industrial Relations offers scholarships to rural people with a view to supporting projects which will promote the development of rural communities. It has a strong orientation towards combating rural disadvantage. In line with that it keeps entry requirements modest, accepting Grade 8 completion as sufficient for some courses. IFS operates as a kind of hybrid between a scholarship scheme and a training fund. It selects its own students and places them in IFS partner institutions rather than giving the institutions quotas of scholarships for students they admit. IFS focuses on placements in courses which offer clear prospects of a job or self-employment, with a preference for courses of 3 to 6 months. Preferred fields of study are those appropriate to rural areas, including agriculture, fishing, small business, textiles and tourism. IFS keeps in touch with trainees after course completion to check whether they have had success in the projects for which they sought training. Results appear encouraging. IFS partner institutions include some teacher, nursing and bible colleges as well as public and private TVET providers within the scope of this Study. The latter group comprises 2 TBCs, 12 RTOs, 4 VTCs and 1 technical high school. IFS pays full fees on behalf of its scholars. In 2011 and again in 2012 just over 750 scholarships were awarded, at average costs in the range K6000-K7000. With the budget going up from K5 million to K7 million in 2013 it should be possible to increase the number of scholarships.
7.2.6 Donor scholarships
It appears that donors now rarely offer scholarships for TVET courses in their home countries. We were advised that the Australian aid program no longer sets out to offer scholarships to study TVET in Australia, though a small number of students who go to Australia with a view to
34
Indigenous inhabitants of Port Moresby.

Research into the Financing of TVET in the Pacific PNG Country Report
77
studying a higher education course end up with a TVET qualification. There have been about 50 such cases in the last three years. A New Zealand initiative to offer scholarships for training to teach TVET has been mentioned under Teacher Training above.
7.2.7 Conclusion
This account by no means exhausts the range of scholarships which may be open to TVET students. Other provinces, NGOs and some MPs also offer awards. The variety certainly shows the width of support in PNG for young people seeking training. At the same time the different schemes all have their own eligibility criteria relating to students and institutions so that students in similar circumstances may get very different levels of support, and many TVET students get no support at all. In PNG eligibility for student support depends on the type of institution the student attends, not on the nature of the course. There is a case for considering whether eligibility should be common across all courses accredited under the PNG Qualifications Framework for TVET, whether supplied by the public or the private sector. This would enlarge student choice, and promote competition between providers. It would increase the cost to public funds of student support, but might enable PNG to meet the increased demand for TVET at lower overall cost, by stimulating the growth of the private sector.


PART IV: THE FINANCING OF TVET

Research into the Financing of TVET in the Pacific PNG Country Report
81
CHAPTER 8. FINANCIAL MECHANISMS AND TRENDS IN TVET FINANCING
This part presents an overview of the financial mechanisms, budget allocations, income sources and expenditure for the TVET sector in PNG, focussing mainly on the years 2011-2013, but up-dated as necessary to cover changes in the GoPNG Budget for 2014. It also describes PNG’s training levy.
8.1 GOVERNMENT FINANCIAL AND PLANNING MECHANISMS
GoPNG has three central Departments engaged in planning and finance:
The Treasury is responsible for economic and fiscal policy, and for the annual budget as a whole;
Finance is responsible for managing public finances including payments, receipts and trust accounts, and for financial reporting and audit; and
National Planning and Monitoring (DNPM) has oversight of medium-term planning, development spending and foreign aid.
In 2013 three agencies were housed in the same building. Staffing was tight. Up to 2013 the budget was split into the Recurrent Budget (most provision for regular operations of Government) and the Development Budget (most capital expenditure, donor-funded programs and special projects). The GoPNG Budget for 2014 is an integrated national budget. A key planning document is the medium-term development plan.35 Its influence is clearly seen at the high level, for example in the identification of health, education, law and order and infrastructure as critical enablers for PNG’s development, a setting reflected in the allocation to sectors of the new program of direct investment in provinces, districts and LLGs mentioned in Part II. At the sub-sector level the MTDP seems less influential. In recent years:
the key driver of TBC growth has not been the MTDP targets which were rapidly surpassed, but social demand; and
Resource allocation within the education sector has been driven more by the determination to phase out school tuition fees than by the MTDP priority to re-capitalise a number of sub-sectors, including TVET.
But medium-term planning is in place and is used as a reference point. Some enduring features of the PNG budget process are:
A multiplicity of items. The NDoE for example budgeted in 2013 for 47 different activities in the Recurrent Budget alone, grouped under 4 Main Programs and Ten Programs. The whole budget for 2013 was K857 million of which one activity – Education Subsidies - accounted for K652 million, so many of the other activities were very small. Technical Education is a Program with five activities, described later in this Part.
Line item budgeting. Each activity is analysed, where appropriate into Personnel Emoluments, Goods and Services, Utilities, grants and transfers etc. Some objectives and performance indicators appear but quality and relevance are patchy.
35
PNG Medium-Term Development Plan, DNPM, October 2010.

Research into the Financing of TVET in the Pacific PNG Country Report
82
Pre-dominance of Personnel Emoluments. Over time the relationship between Emoluments, and the other key items has become distorted in favour of personnel. The problem is well recognised but it has proved hard to get a better balance.
Uncertainty in budget execution. For a number of reasons budget allocations may be released later in the financial year than profiled, in smaller quantity, or even not at all. This problem is less acute than it was, but is still significant.
The large quantity of paper and the short supply of skilled staff shape the budgeting process. The staff in the Social Sectors Budget Division of the Treasury do not have time to engage closely with the rationale for the Technical Education program on a regular basis, even if it were presented to them more clearly than the budget paperwork permits. They focus on big picture issues, such as the need to bear down on Tertiary Education spending in order to accommodate the drive towards tuition-free schooling. Points they put to the Team included:
There are still too many ad hoc spending commitments announced outside the Budget process which devalue collective planning effort;
Commitments to offer new facilities on the basis of one per province or one per district are too readily given – they are expensive to implement and hard to withdraw given the structure of PNG’s Parliament;
Departments need to develop better plans for infrastructure projects before they are accepted for inclusion in the budget.
The Team found echoes of all these points in their work on TVET financing. Once the National Budget is brought down, the TVET Wing of NDoE is able to settle its Annual Operational and Financial Plan (AOFP). Through the AOFP the Wing plans its activities in the year ahead in some detail. The AOFP covers both program and running cost activities, and both GoPNG and donor-funded expenditure. It may draw in some resources not specifically allocated to TVET in the National Budget. For example the AOFP for 2013 included about K2 million of work funded by Quality Initiatives in Education (QIE) and about A$1 million from a DFAT source known as Direct Funding Support. QIE was itself funded by a carve-out from the provision in the NDoE budget for school fee subsidies.
8.2 FINANCING MECHANISMS FOR THE TVET SYSTEM
There are significant differences in the mechanisms for funding publicly provided TVET between the institutions under NDoE on the one hand and the universities and other free-standing institutions on the other. Institutions under NDoE The TBCs and VTCs have one important feature in common, namely the arrangements for teacher staffing. Established teachers are remunerated from the national payroll, not by the college or centre. The principal will have a staffing list which shows the positions held by staff members or vacant, and the pay levels. But the institution does not budget for teaching staff costs, and may have no close knowledge of what they are. After that the TBC and VTC arrangements diverge.

Research into the Financing of TVET in the Pacific PNG Country Report
83
The TBCs are national institutions in PNG education law. They have their own governing Councils but these are advisory. The colleges are not incorporated but are in effect parts of NDoE. Provision is made for TBC recurrent funding collectively through the Technical Schools Operations activity in the NDoE Budget. The bulk of it is Personnel Emoluments provision which covers the cost of TSC staffing but is not cash in the hands of NDoE or the colleges. Money allocated for Overseas Contract Officers is managed centrally by NDoE. A sum (K1.1 million in each year from 2012 to 2014) is distributed between the 8 colleges as funding for non-teaching costs to be used at the discretion of their councils. The bulk of funding for non-teaching costs is raised by Governing Councils through fees, which are subject to limits set by the National Education Board. The VTCs are provincial institutions. Notional allocations in respect of teacher staffing as a whole – schools as well as VTCs - are distributed to the provinces directly by the Treasury as TSC Grants. Fees for students on the main VTC programs are again subject to limits set by the NEB. The big difference from TBCs is that NDoE pays a School Fee Subsidy direct to the centres to reduce the cost of fees to families. In 2012 the subsidy was 75% of the fee. In 2013 it was 100%, meaning that tuition was free. The subsidy arrangements align with school funding, but contrast with the fees payable for what in some cases are similar courses in public or private TVET institutions. Fee-free tuition still permits VTCs to charge to students project fees of up to K200 a year. Tables later in this section of the report will set out the arrangements for the TBCs and the VTCs in money terms. Meanwhile Figure 8.1 (TBCs) and Figure 8.2 (VTCs) illustrate the principal funding flows between the Government, the colleges and their students.
Figure 8.1 Principal fund flows for technical and business colleges

Research into the Financing of TVET in the Pacific PNG Country Report
84
Figure 8.2 Principal fund flows for vocational training centres
8.2.1 Public universities and other tertiary education institutions
The public universities of PNG are incorporated as statutory authorities. A few other TEIs have the same status, of which PNG Maritime College is the most important for this report. The universities receive grants direct from the Treasury; the Director-General of OHE is a party to the budget negotiations, but the funds do not pass through OHE. Until the 2013 Budget the budget allocations to universities were presented as lump sum grants. In 2013 a line item classification was introduced, showing most of the funding allocated to Personnel Emoluments. Fees are set by the universities themselves but are influenced by the amounts of support payable through TESAS. If a student has a TESAS award, the OHE pays most of the award funding direct to the university. Because all their budget support comes to them as cash, the universities have greater freedom over the use of their resources than the TBCs.
8.2.2 Staffing establishments and salaries
We deal first with institutions within the National Education System – essentially the TBCs and VTCs. For these institutions the Teaching Service Commission (TSC), which is effectively part of the NDoE has the power to create or abolish teaching positions, and to set salary scales. Appointments to these positions are made by the Governors of TBCs or the managers of VTCs, subject to endorsement by the National Education Board (TBCs) or Provincial Education Board (VTCs). The TSC salary scales applicable to TBCs and VTCs have eleven overlapping pay ranges, known as pay levels. Each level has seven salary steps. TBC teachers are mostly on Levels 5 to 9, with Principals in larger colleges on Level 11. VTC managers are mostly at Level 5 or 6, with other staff on Levels 4 to 2. Salaries were raised by about 16% around 2011 in response to concerns about high levels of vacancies. Vacancies continue to be a problem at some institutions, as we found for example at NPI, Lae and some rural VTCs. As in some other

Research into the Financing of TVET in the Pacific PNG Country Report
85
countries, the national budget assumes a vacancy level – it provided for 298 teaching staff in TBCs in 2013, as against 348 approved positions. The Team understands that this is simply a budget assumption, and that TBCs are free to fill their vacancies if they can. Institutions can recruit part-time teachers and pay them from their own resources. Some institutions find they need to pay full-time recruits for a while until the recruits are added to the national payroll and their TSC salary comes through. These TSC arrangements are very centralised. They diminish local responsibility for staff management. Those concerned with operating the system at central and local levels struggle to keep up with the movements of teachers in and out of the system, and to keep ghosting and other abuses in check. The TVET Needs Analysis (Hind et al, 2011, p. 25) reports: During the study consultations the TSC advised the team that it would be happy to divest responsibility for TVET teachers to higher education or the public service. But for the time being the system continues. Institutions outside the National Education System make their own pay arrangements. For the surveys of TBCs and VTCs, the Team had to get data on teacher staffing costs from the payroll staff in NDoE. They gave us the salary level and step for each position at each institution as the payroll stood at August 2013, plus data for pay rates in 2011, 2012 and 2013. In most cases the numbers of positions shown as filled on the payroll was different from staff on strength as reported in the Survey by the institution for 2012. The Team used the data on pay rates to work out teacher employment costs for each of the three years, based on the payroll teacher numbers, and applied scaling factors to adjust the costs derived from payroll to align with the numbers of teachers reported in the Survey. Costs for part-time teachers employed by governing councils were shown separately in the Survey and added in. Average salaries for 2012 in the VTCs we surveyed were tightly bunched, in a band from about K18,500 to K20,000. Average salaries at the TBCs were higher and rather more dispersed, ranging from K24,500 to K28,900. Teacher unit costs at some TBCs are much higher than average salary costs, owing to the presence of Overseas Contract Officers (OCOs) who are paid salary supplements and substantial non-salary benefits. For the surveys of RTOs, respondents recorded their own teacher employment costs. The Team found a marked variation in average teacher unit costs:
IEA College of TAFE and PNG Power Training College had unit costs around, or in IEA’s case, above the level of those TBCs which have significant numbers of OCOs on staff;
Works Institute of Technology and Elirana Electronic Technology School were within the TBC/VTC range;
At about K12,000 per teacher, Highlands Youth Training and Rehabilitation Centre and OISCA were well below the VTC range.

Research into the Financing of TVET in the Pacific PNG Country Report
86
As well as salary, some staff at TBCs and VTCs get the benefit of a staff house at a moderate rent. Rental income is paid into Consolidated Revenue. The houses are greatly valued as open market rents in Port Moresby and Lae are high, and other suitable housing in rural areas is hard to come by. But over the years institutions have struggled to maintain their housing stock and to keep pace with the growth of teacher numbers.36 Staff housing is
therefore a significant call on capital resources.
8.3 THE IMPACT OF FINANCIAL MECHANISMS ON PUBLIC PROVISION
The mechanisms in use for TBCs offer a strong incentive to recruit students, through the heavy reliance on fee income. Since there is no differentiation in the fee structure or in grants from public funds by type of course, the incentive particularly encourages the recruitment of more students to the cheaper courses. Business courses are now an important part of the course offer of most of the technical colleges, as well of the business colleges. The colleges have done well to adapt to their cost environment, but whether GoPNG is sending them the right signals is debatable. It could be argued that public provision should focus more on trade technology, allowing the private sector to meet more of the increasing demand for business courses. In other respects the TBC mechanisms are supply driven. The budget is presented on an input basis. Staffing establishments are centrally determined, recurrent grants are very limited and not directed towards any specific objective. Funding for capital expenditure and staff and curriculum development remain heavily controlled by NDoE. Outputs do not appear to receive much attention; even basic information about TBC graduation rates is patchy, and the tracer studies of TBC graduates remain an aspiration. For VTCs much depends on the province. As Figure 7.1 shows, VTC students per 1000 population average about 7 for the 5 provinces which have most, about 1.5 for the 5 provinces who have least. There are no financial incentives for provinces to even up provision. For staffing the arrangements are essentially the same as for the TBCs – nationally determined staffing establishments and payroll. In very recent years the increase in the value of the school subsidies and the move to 100% subsidy has greatly enhanced VTC funding for non-teaching costs from its previous very low level, and offered a strong incentive to recruit students. VTCs seem to have been swept along with secondary schools in the move to fee-free tuition. The implications of abandoning cost-sharing in this sub-sector when it applies to all the rest of TVET need to be thought through. So too does the question of how to check that recruitment is genuine across these numerous and dispersed centres. As with the TBCs, incentives to reward course completion and good outcomes in employment or the informal economy are lacking.
36
See TVET Needs Analysis p 45 for details on the state of staff housing.

Research into the Financing of TVET in the Pacific PNG Country Report
87
8.4 THE TRAINING LEVY
In PNG employers with a payroll of K200,000 or more pay a training levy at 2% of their payroll. Its legal basis is Section 196 Z of the PNG Income Tax Act 1959 (as amended), as follows: (1) Subject to this Act, a tax by the name of training levy is imposed for–
a) the year of income that commenced on 1 January 1991; and (b) each subsequent year,
and shall be payable at the rate of 2% of the amount of the annual payroll payable by each employer.
(2) Notwithstanding anything in this Act, training levy is not payable by an employer whose payroll in a year of income is less than K200,000.00.
(3) The amount of training levy payable shall be reduced by any qualifying training expenses incurred by the employer. The wording of the Act is important. The training levy is a tax, and there is no legal obligation on the Government to allocate all or part of the proceeds for any specific purpose. However the liability to pay is reduced by the amount of qualifying training expenses which the employer incurs. In that sense the PNG levy is exemption-based. The training levy was a priority for our Phase 2 research. The Team discussed it at meetings with the Inland Revenue Commission (IRC), the Treasury and the NTC. The Team obtained a meeting on 29th May with the Assistant Commissioner in charge of the Assess and Prioritise Division of IRC. She:
gave us a copy of Form TL 2012, the training levy return which IRC required employers to complete for 2012;
gave an off-the-cuff estimate that about ¾ of employers claim expenses in excess of 2% of payroll and hence pay no levy; and
offered to get us a three-year run of figures for the yield of the levy, and the actual proportions of employers who paid some levy or none.
Form TL 2012 requires employers to:
1) supply the data need to calculate their annual payroll – the base for the 2% levy;
2) list amounts against 12 categories of qualifying training expense. These include apprentice wages, the salaries of citizen employees attending approved training courses, fees and expenses paid on their behalf, salaries of training officers, and the salaries of trainers and employees engaged in on-the-job training. Costs of training consumables and depreciation of training equipment are also allowable;
3) calculate levy payable as 2% of annual payroll less qualify training expenses. Despite several attempts over the ensuing three months we obtained no further contact with the IRC. The Budget Books were therefore our only source for the yield of the levy. The 2012 Budget Book gave K1,312,300 as the yield in 2010. The 2014 Budget Book37 gives the yield of the tax-related training levy as K2,754,700 in 2011, K4,717,200 for 2012, K2,890,000 for 2013 and K3,160,000 for 2014. We have not been able to ascertain why the yield for 2012 is so much higher than for any other year. The Inland Revenue Commission (IRC) pays the yield of the levy into Consolidated Revenue.
37
From Table A2 at page 2 of Vol 2 Part 1 of the 2013 Budget Papers

Research into the Financing of TVET in the Pacific PNG Country Report
88
The NTC said that in recent years the Treasury had given them about K1.5 million of levy proceeds annually to distribute. That is much less than the apparent yield of the levy, but the Treasury does not acknowledge a need for the amount allocated to NTC to equate to the levy proceeds – they regard the levy as a tax. Nonetheless the allocation of some of the proceeds to NTC to distribute to trainers reveals the PNG scheme as a hybrid, incorporating a levy-grant scheme as well as an exemption-based incentive. NTC invites firms to apply for grants of up to K20,000 from a Training Assistance Fund derived from the levy proceeds, based on their submission of a three-year training plan, and details of the training to be provided. Normally grants are made to firms with payrolls in excess of K200,000 but smaller firms can qualify if they train apprentices. NTC told us that applications are considered as they come in – there is no annual exercise to rank applications and fund the best of them. NTC were unable to respond to a request for documented examples of successful claims, but a number seem to come from repeat claimants who know the ropes, and can therefore apply for these small grants without great trouble. As it stands, the PNG 2% training levy seems to be directed towards three purposes:
to raise revenue for government, like any other tax;
to give employers liable to pay an incentive to train, through the deduction for qualifying training expenses;
to support training through the Training Assistance Fund operated by NTC.
There are tensions between these three purposes. In particular, the definition of qualifying training expenses is so wide that it is easy for employers to represent that their expenses exceed their liability to pay, and hard for IRC to check such claims. Hence the yield of the levy remains low, thus limiting its effectiveness as a revenue-raiser or resource for the Training Assistance Fund. Even if not very effective as a fund-raiser, this type of levy may operate to raise the amount of training supported by firms liable to pay it. Some firms might, for example, be encouraged to engage an apprentice by the thought that their wage, the costs of an on-the-job supervisor and off-site training could be offset against the firm’s levy liability. Training levies are common in other countries, including some developing countries. Why does this one appear ineffective in PNG? Confusion about the objective - whether it is a tax or a levy – is part of the answer. There is a lack of transparency about the yield of the levy, the allocation of proceeds partly to the Training Assistance Fund and partly to general government purposes, and about the operation of the Fund. More broadly, as Johanson (2009) put it, ‘levy success depends on a sufficiently wide economic base in the formal sector and reasonable administrative capacity. These schemes are more effective in countries with large formal sector, i.e. a large tax base.38 PNG, however, has a large informal sector. Accordingly IRC’s remit to collect taxes is an especially hard one in PNG – there are substantial tax arrears. It should be no surprise if IRC prioritises the key sources of revenue such as taxes on income and profits, as distinct from complex instruments which raise small sums, like training levies and student loan recoveries.
38
A Review of National Training Funds, by Richard Johanson, World Bank, 2009.

Research into the Financing of TVET in the Pacific PNG Country Report
89
CHAPTER 9. OVERVIEW OF TVET BUDGETS Chapters 9 and 10 provide an overview of the public sector budgets for TVET over the years 2011-2014. The span of years is dictated by the sources available. In the absence of published accounts for the TVET stakeholders, it is necessary to rely mainly on the GoPNG annual Budget Books for government expenditure. The 2014 Budget Books give ‘actual’ data for 2012, revised appropriations for 2013 and estimates for the focal year of the 2014 Budget. Earlier budget books follow the same pattern. But the ‘actual’ data for the first year covered is often the budget estimate for that year with little or no correction for actual expenditure incurred. So longer time series may not yield a better view of the trend of expenditure over time. In the tables which follow we reproduce Budget figures as they stand, with some notes about actual expenditure where we know it to have been different. Table 9.1 Budget provision for the administration of the TVET system (Kina 000s)
Agency 2011
Actual 2012 Actual
2013 Appropriation
2014 Estimate
2014 Staff Numbers
National Department of Education
Technical Education Co-ordination
1,645.0 1,880.1 1,530.6 1,700.0 18
Technical and Vocational Inspections
1,050.4 773.6 996.5 1,500.0 35
Co-ordination of TVET Curriculum
1,565.3 2,000.0 14
Vocational Education Co-ordination
578.7 611.8 625.5 700.0 12
Community College Co-ordination
65.7 181.0 370.2 500.0 9
NDoE Total 3,339.8 4,994.8 5,088.1 6,400.0 88
Department of Labour and Industrial Relations
National Apprenticeship and Trade Testing Board
590.7 921.9 1,094.8 1,102.0 19
Independence Fellowship Scheme Co-ordination
203.8 251.9 652.1 653.2 4
DoLIR Total 794.5 1,281.2 1,746.9 1,755.2 23
National Training Council 2,300.8 2,786.8 2,739.8 2,739.8 18
Grand Totals 6,435.1 9062.8 9,574.8 10,895.0 129
Office of Higher Education 3,130.7 7,304.0 5,910.0 5,914.5 77
Notes: 1. The NTC makes provision for Training as well as Administration. Provision for Training is
K1.32 million in 2014. On a basis comparable with the NDoE and DoLIR entities NTC has about K1.4 million for Administration in 2014.
2. OHE is placed below the Grand Total line because its TVET work on the Skills Scholarships, Student Support and Statistics is a relatively small part of the whole, and is not separately identifiable from its other work.
3. NDoE TVET Wing has advised the staff numbers which have been used for the table.

Research into the Financing of TVET in the Pacific PNG Country Report
90
The table conveys the impression that NDoE is better resourced to carry out its TVET functions than the DoLIR agencies or NTC. The Team’s experience bears that out. NDoE figures reflect expansion following the decision to establish a TVET Wing of the Department with its own Deputy Secretary and First Assistant Secretary. The Wing has a substantial cadre of professional staff with appropriate support staff. Up to 2014 as usual with GoPNG agencies funding for non-staff costs did not always match functions or staff numbers. For 2014 however provision was held steady for staff costs and substantially increased for non-staff costs. Other agencies are less well-placed. For example:
NTC has a manager, 3 professional staff and two assistants to carry out registration of institutions, courses and trainers in a RTO sector with 200 odd members. As a result registrations are often out-dated, and the task of moving the sector onto PNGQF-TVET courses by end 2014 has made a very slow start;
NATTB has its work cut out to supervise the apprentice scheme and conduct the trade tests. It is also responsible for the development of occupational standards, which are the basic building block for competency-based training. Delays in standards development are a major obstacle in the way of developing more PNGQF -TVET courses. The NATTB argues that more resources are needed to speed up progress – quite small sums are lacking to bring in people from the outlying provinces to Port Moresby for workshops, and even to print completed work.
Both NTC and NATTB charge fees for some administrative functions such as registering RTOs, courses and trainers, and the administration of apprenticeships and trade tests. Information was sought from these agencies on whether fee income is retained and adds to their resources, or is paid into Consolidated Revenue, but no response was received. Both agencies confirmed that they were able to retain the fee income collected in order to meet their own costs. Neither volunteered much information about how much was collected:
The NTC estimated off the cuff that fee income received was about K100,000 a year. That seems low. Re-registration is required every second year and fee lists on the NTC website indicate that it might cost K3000-K4000 a year for a mid-sized RTO, depending on numbers of courses and trainers. However arrears of fees seem to be a continuing feature of the relationship between NTC and RTOs. For example lists on the site in March 2014 seem to indicate that most RTOS were behind with fees at that time. So fees received may be much lower than fees billed.
The NATTB did not respond with figures to a renewed enquiry about their fee income. They did say that there were no arrears on trade tests fees because they have to be paid in advance of the test. Trade tests are currently running at about 500 a year, with fees ranging from K400 to K600. So fee income may be around K300,000 a year. This income may be devoted to direct costs of testing like venue hire, and fees and expenses for examiners. It does not necessarily yield a surplus to be devoted to other NATTB priorities such as standards development.

Research into the Financing of TVET in the Pacific PNG Country Report
91
CHAPTER 10. FUNDING TVET INSTITUTIONS AND PROGRAMS
10.1 TECHNICAL AND BUSINESS COLLEGES
The main sources of finance for the TBCs are:
For recurrent purposes, grants from the GoPNG Budget and student fee income;
For capital purposes, grants from the GoPNG Budget and from donors.
Table 10.1 Recurrent funding provision for TBCs in the 2014 GoPNG budget (Kina
000s)
Actual Actual Appropriation Estimate
Item 2011 2012 2013 2014
Personnel Emoluments 9,828.20 10,367.10 11,759.30 11,831.00
Goods and Services 183.8 124.2 206 289.8
Rentals of Property 1,890.30 1,364.00 2,299.50 2,769.20
Grants, and Transfers 1,043.90 1,103.00 1,117.50 1,110.00
Totals 12,946.20 12,958.30 15,382.30 16,000.00
Note. Provision for 2011 and 2012 is for 7 colleges. Provision for 2013 also includes WNBTC.
Personnel emoluments relates to the full-time teaching staff paid for from the Government payroll under the arrangements described earlier in this Part. Part-time teachers and non-teaching staff are not covered by the GoPNG budget, but paid for by the colleges out of their own resources. The 2012 provision covered 277 teaching staff at seven colleges. The 2013 provision covered 298 staff at 8 colleges. The new TBC on Bougainville opened in 2014 but there is no provision for additional teachers in the 2014 budget. In 2012 Personnel Emoluments were reported as follows:
K8,098,000 for Salaries and Allowances, yielding average salary provision of K29,235 per teacher. Salary matters are further discussed later in this Part;
K952,800 for Leave Fares, because every PNG teacher has a right to take leave periodically in his home village;
K593,000 for Retirement Benefits and Pensions;
K723,300 for Education Benefits for Overseas Contract Officers (OCOs).
Goods and Services appears to be token funding for items like travel and subsistence and office supplies. Rentals of Property relates to rent subsidies for OCOs employed to teach at the TBCs – see further below. Grants and Transfers are the grants which are received by the colleges from the GoPNG Budget for general recurrent purposes. The amount averages about K140,000 per college, so these grants cover a very small proportion of college non-teaching costs. There is nothing in GoPNG funding distributed to TBCs to underpin the quality of provision, though NDoE TVET Wing retains some resources for that purpose. There are currently about 30 OCOs in NDoE TVET – our surveys found 13 at PoMBus, 4 at PoMTech, and 5 at NPI Lae. No other TBC has OCOs, but there are also a few in Head Office. OCOs receive the same basic salary as teachers who are PNG nationals, plus:
An International Market Allowance (IMA) worth on average about K25,000 on top of basic salary;
Education Benefits to pay for their children’s education;
Rental subsidies.

Research into the Financing of TVET in the Pacific PNG Country Report
92
IMAs are paid alongside basic pay through the national payroll. NDoE manages Education Benefits and Rental Subsidies, and kindly provided data for expenditure in aggregate and at individual colleges over the years 2010 to 2012. The figures are not comprehensive but they indicate for example that the total spent on Rental Subsidies in 2011 was K680,995 compared with Budget Book ‘actual’ of K1,946,800.39 How can there be so large a difference
between Budget Book ‘actuals’ and the amount actually spent on the item in question? In PNG funds from underspent items are swept towards the end of the financial year to offset overspends on other budget items – as happens in other countries. But in PNG the next year’s budget books are not necessarily adjusted to take account of such transfers, and accounts are not readily available. Over-provision for OCO costs seems to have continued in the 2012 and 2013 budgets. If one takes the 2014 Budget Book actuals for 2012 as accurate, Rental Subsidies were underspent by K861, 000, and Education Benefits were overspent by K132, 000 – and yet provision for Rental Subsidies was raised again in the 2014 Budget. At first sight that may appear strange where resources for TVET are so tight. But spending departments may see it as prudent budget tactics to over-estimate for items which are accepted as contractual entitlements, and transfer the resulting surpluses later to budget items where the original budget allocations are insufficient. But the process lacks transparency. For example savings on Rental Subsidy for 2013 must have been foreseeable at the start of the year, but they were not built in to the AOFP for the year, as savings on school fee subsidies were. The essential point about GoPNG recurrent funding for TBCs is that it covers teaching staff salaries but very little else. If Rentals of Property are added to Personnel Emoluments in Table 10.1 on the grounds that these rentals are subsidies to OCOs, the proportion of GoPNG funding for TBCs devoted to staff benefits is about 90% in each of the years from 2011 to 2014. Many other public institutions in PNG, including some other national education institutions and the universities, are funded on a similar basis. It makes the role of fees all the more important. Student fees are the second, and larger, source of recurrent funding for TBCs. TBC fees are subject to certain limits set by the National Education Board (NEB). The 2013 fee limits are shown in Table 10.2.
39
The figure of K1,946,800 includes K56,500 allocated through Tech Ed Co-ordination Services and Tech and Voc Inspections as well as the K1,890,300 shown in Table 10.1.

Research into the Financing of TVET in the Pacific PNG Country Report
93
Table 10.2 Fees at the NDoE technical and business colleges in 2013 (2012 fees in brackets)
40 week courses Tuition
Fees
Board &
Lodging
Safety Uniform
Books & Equip
Admin
Fees
Total
Course Fees
Diploma Programs
3,235 (2,940)
2,175
(1,890)
220
(200)
300
(300)
5,930
(5,330)
TTC Program 3,235
(2,940)
2,175
(1,890)
220
(200)
300
(300)
5,930
(5,330)
National Certificates
3,235 (2,940)
2,175
(1,890)
220
(200)
300
(300)
5,930
(5,330)
10 week courses Tuition
Fees
Board &
Lodging
Safety Uniform
Books & Equip
Admin
Fees
Total
Course Fees
Extension Programs
847
(770)
543
(473)
220
(200)
150
(150)
1,760
(1,593)
NC Programs 847
(770)
543
(473)
220
(200)
150
(150)
1,760
(1,593)
Source: Secretary’s Circular 65/2012, dated 31-10-2012, obtained from NDoE.
The rates of increase over 2012 fees were 10% for tuition, books and equipment, 15% for board and lodging, and zero for administration. The then Secretary wrote that the increases were to compensate for the rise in the Consumer Price Index. Since this was the first fee increase since 2009, compensation for inflation is partial. Despite this inflation-proofing rationale, the Secretary recommended that 10% of the school fees component should be invested in a ‘sinking fund’ to be used to replace equipment and for capital development. Colleges need NEB approval to charge any fee outside the NEB limits. The tuition fee limits for 10 week courses are just over a quarter of the limits for 40 week courses, while for board and lodging they are exactly a quarter. There are no limits for courses of between 10 and 40 weeks. It appears from NDoE’s advice to NEB that it was their intention that tuition fees for these courses should be based on multiplying the 40-week tuition fee by the number of tuition hours on the course divided by the number of tuition hours on a 40-week course. However, the Secretary’s Circular is silent on the point. We were able to compare the fees reported by the four of the five TBCs40 surveyed with the
limits in Table 10.2. Colleges were asked to report the fee for a day student for each course which ran in Semester 2 of 2012, including all compulsory charges.
40
Mt Hagen Tech’s fee information did not lend itself to analysis.

Research into the Financing of TVET in the Pacific PNG Country Report
94
Table 10.3 Fees charged by TBCs surveyed
Institution Course Duration, weeks Fee
Reported
Port Moresby Business Diploma 40 K3755
Port Moresby Technical
Apprenticeship extension 8 K765
NC1, BTC 20 K2820
NC2 20 K3400
TTC 20 K3400
National Polytechnic Diploma & TTC courses 40 K5730
Kokopo Business
Diploma, TTC & NC courses, 2012
40 K2940
Diploma 2013 40 K3906
NC1 or NC 2 2013 6 months K1682
Duration is recorded on an annual basis.
Comparisons with the limits follow (as shown in Tables 10.2 and 10.3):
PoMBus at K3755 is slightly above the annual limit for a 40-week course in 2012 (K2940 tuition, K200 books and equipment, K300 administration = K3440). According to the PoMBus page on the NDoE website PoMBus charges K500 for books and equipment which explains the difference;
PoMTech’s fee for 8-week extension courses is K5 below the NEB limit of K770 for tuition on 10-week courses. As there are no 10-week extension courses, colleges probably construe the limit as applying to the 8-week course currently run. From the NDoE website it appears that the PoMTech fee for a 8-9 week extension course in
2013 is K1365;41
PoMTech’s fees for 20 week courses are close to K3400, or 18% below K2820; the NEB limit for a 40-week course (K3440);
NPI Lae seems to have reported a fee for a boarding student – K5730 lies midway between the boarding limits for 2012 and 2013;
Kokopo’s K2940 for 2012 is the same as the tuition fee limit for 2012, its K3906 for 2013 (K3266 for tourism and hospitality) is 4% above the 2013 limit for all compulsory charges for day students (K3755). The fee of K1682 for 6-month courses is less than half the K3755 NEB limit for a full-year course.
It appears that PoM Tech, and to a lesser extent PoMBus, have negotiated significant flexibilities to go above NEB limits. Those limits themselves are not explicit about fees for courses of about 20 weeks or one semester, which are growing in number. Tuition fees for pre-employment courses (the large majority at the TBCs) are a sensitive issue as many students do not have access to support for them, and they place a heavy burden on families. It is less easy to see why the Government needs to put limits on extension course fees which employers normally pay. GoPNG has taken a different approach. Early in 2014 the NEB raised the tuition fee for an apprenticeship extension course to K3527, almost four times the 2013 fee of K847. Their
41
K1365 is said to be for a day student without lunch. NEB limits for a day student in 2013 are (K847 for tuition + K220 for books and equipment + K150 for administration) = K1217.

Research into the Financing of TVET in the Pacific PNG Country Report
95
rationale was that fees for courses paid for by employers should be charged at commercial rates. The principle is welcome, but there is a risk that so sudden and steep an increase will drive employers to look elsewhere for training, unless their concerns about quality are addressed. Tables 10.4 and 10.5 indicate income and expenditure respectively at the five TBCs surveyed. Table 10.4 Income sources in 2012 of the 5 TBCs surveyed (Kina 000s)
Income
National Polytechnic
PoM Business
Kokopo Business PoM Technical
Mt Hagen Technical
A: FEE INCOME
Fees paid by self-sponsored students 5,248.8 2,211.8 1,335.9 1,182.0 1,434.0
Fees paid by scholarship providers 713.0 97.3 460.8 210.8 117.4
Fees paid by employers 0.0 0.0 30.3 625.0 199.7
Total Fee Income 5,961.8 2,309.1 1,827.1 2,660.9 1,751.0
(Amount of fees for boarding included in total above) 0.0 0.0 489.1 643.0 0.0
B: OTHER FINANCIAL SUPPORT
Support from industry 0 0 0 0 0
Teacher salary funding received through TSC 1,876.8 1,206.4 785.5 1,335.7 853.9
Overseas Contract Officer Funding 455.7 645.5 0.0 261.8 0.0
Total Other Financial Support 2,332.6 1,851.9 785.5 1,597.5 853.9
C: OPERATIONAL GRANTS FROM GOVERNMENT 105.0 132.1 0.0 137.7 129.7
D: GRANTS FROM DONORS & NGOS
Total donor & NGO grants for operating purposes 0
0 0 0
E: INTERNAL INCOME GENERATION 83.2 117.5 117.5 42.4 9.8
F: TOTAL RECURRENT INCOME ( A+B+C+D+E) 8,482.6 4,410.5 2,730.1 4,438.5 2,744.4
G: CAPITAL INCOME
GoPNG grants or loans for capital purposes 4,000.0 0.0 0.0 0.0 0.0
Donor grants or loans for capital purposes 0.0 0.0 0.0 2,774.5 0.0
TOTAL CAPITAL INCOME 4,000.0 0.0 0.0 2,774.5 0.0
TOTAL INCOME (F+G) 12,482.6 4,410.5 2,730.1 7,213.0 2,744.4
Sources: GoPNG payroll and NDoE for Part B, own Institutional Survey for all other Parts. Note. Income highlighted blue is money spent on behalf of the college, not cash received by it. Data for the funding of teacher salaries and OCO benefits was drawn from GoPNG sources and entered as both income in respect of the colleges and expenditure incurred on their behalf.

Research into the Financing of TVET in the Pacific PNG Country Report
96
Table 10.5 Expenditure patterns in 2012 of the 5 TBCs surveyed (Kina 000s)
Expenditure
National Polytechnic
PoM Business
Kokopo Business
PoM Technical
Mt Hagen Technical
H: SALARIES, WAGES AND OTHER EMOLUMENTS
Full-time lecturers- PNG nationals 1,876.8 1,206.4 785.5 1,335.7 853.9
Overseas Contract Officer (OCO) International Market Allowances 150.3 325.7 0.0 100.2 0.0
OCO Rentals 208.8 208.8 0.0 99.6 0.0
OCO Education Benefits 96.6 436.7 0.0 62.0 0.0
Part-time teaching staff paid by Governing Council 426.3 57.0 6.2 45.5 20.0
Non-teaching staff 411.7 288.6 298.8 420.1 189.7
Total staff emoluments 3,170.5 2,523.2 1,090.5 2,063.1 1,063.6
I: OTHER OPERATING EXPENDITURE 0 0.0 0.0 0.0 0.0
Boarding costs, including messing 1,823.8 0.0 613.6 785.8 1,300.0
All other operating expenditure, except emoluments 2,496.1 2,399.0 1,530.3 1,311.0 300.0
Total - other operating expenditure 4,319.9 2,399.0 2,143.8 2,096.8 1,600.0
Total recurrent expenditure (H+I) 7,490.5 4,922.3 3,234.4 4,159.9 2,663.6
J: STAFF AND CURRICULUM DEVELOPMENT EXPENDITURE 0 3.9 5.4 35.0 2.5
K: CAPITAL EXPENDITURE 0 104.5 712.8 0.0 0.0
Total Expenditure (H+I+J+K) 7,490.5 5,030.7 3,952.6 4,194.9 2,666.1
Sources: GoPNG payroll and NDoE for lecturer salaries and OCO benefits, own Institutional Survey for all other
data. Note. Expenditure highlighted blue is incurred on behalf of the college, not by it. The reliance on fee income is brought out in Table 10.6.

Research into the Financing of TVET in the Pacific PNG Country Report
97
Table 10.6 TBC income, five colleges, 2012
1 2 3 4 Source Fee Income
K000s Total Recurrent Income
Col 2 as % of Col 3
Kokopo Business 1,827.1 2,730.1 66.9%
Mt Hagen Technical 1,751.0 2,744.4 63.8%
National Polytechnic, Lae 5,961.8 8,482.6 70.3%
Port Moresby Business 2,309.1 4,410.5 52.4%
Port Moresby Technical 2,660.8 4,438.5 59.9%
Totals 14,509.8 22,806.1 63.6%
Table 10.7 illustrates the significance of fees for TBC income for the seven colleges existing in 2010. Table 10.7 TBC income sources, 2010
Source Income
K m % of Total Income
Fees 17.3 54.2%
GoPNG support for teacher salaries 11.0 34.5%
All other income sources 3.6 11.3%
Totals 31.9 100%
Source: Annex 9 of the TVET Needs Analysis (Hind et al., 2011)
The two sources are not exactly comparable but Table 10.6 seems to indicate even greater reliance on fee income in 2012 than in 2010. Other points to emerge from Table 10.4 include:
Only the apprenticeship training providers – PoMTech and Mt Hagen Tech - have significant fee income from employers;
Variations in salary funding per college are much greater than enrolment variations would explain. In part this is because of the uneven distribution of Overseas Contract Officers, but even excluding OCOs the variance is from K1,389 per enrolment at NPI to K2,556 at Mt Hagen Tech, largely driven by differences in SSR;
Operational grants from government and internal income generation are both very small as sources of income.
Some points of interest from the expenditure recorded in Table 10.5 are as follows.
Three of the five colleges had deficits in 2012 when recurrent income and expenditure are compared – NPI, PomBus and Kokopo. The other two had smaller surpluses. The deficits at PoMBus and Kokopo may have been due to lower enrolments resulting in loss of fee income. NPI had a high level of vacancies, and high expenditure on part-time staff, probably intended to cover the vacancies.
Non-teaching expenditure apart from boarding varied from K4100 per enrolment at PoMBus to K1,850 at NPI – no figure was calculated for Mt Hagen Tech where the allocation of non-teaching expenditure between boarding and non-boarding costs is suspect. PoMBus may gain some advantage here from having no boarders.
Staff and Curriculum Development expenditure reported by the colleges is very low, but some provision made by NDoE on their behalf is reported later in this Section under Quality-Related Expenditures.

Research into the Financing of TVET in the Pacific PNG Country Report
98
Boarding is a significant component of TBC costs. The Survey was designed to collect data on boarding income and expenditure, and the number of boarders at each college. In the upshot the boarding income and expenditure data reported in Tables 10.4 and 10.5 appear suspect in some cases, and some colleges did not report boarder numbers. The two colleges where the data look best are Kokopo Business and PomTech (see Table 10.8). Table 10.8 Boarding income and expenditure for two TBCs in 2012
Item PoMTech Kokopo Business
Boarding Income K643,005 K489,127
Boarding Expenditure K785,817 K613,555
Number of Boarders [1] 474 166
Boarding Income per Boarder K1,357 K2,947
Boarding Expenditure per Boarder K1,658 K3,696
Deficit on Boarding K142,812 K124,428
Deficit as % of boarding expenditure 18.2% 20.3%
Source: Institutional Surveys [1] Boarders count as one whatever the course length. PoMTech has many more boarders on short courses than Kokopo. Nearly all of Kokopo’s students in 2012 were on full-time courses lasting one or two years. It is interesting that its income per boarding student is about K1000 more than the boarding fee approved by the NEB (K1890 in 2012). Expenditure per boarder at K3696 amounts to just under K15 per boarder per day, assuming that boarders were at the college for about 250 days in the year. The figures for PoMTech are harder to interpret in the absence of a breakdown between short and long course students. Both colleges report significant deficits on provision for boarders, in the range 18-20%. Other colleges also complained of the inadequacy of the boarding fee in 2012 and previous years. For 2013 the NEB approved a 15% increase in the boarding fee. Until quite recently there was no regular source of Capital Funding for the TBCs. From time to time Government or donor initiatives provided limited funding, but it was not enough to sustain the stock of buildings and equipment, let alone to match new needs. The TVET Needs Analysis (Hind et al., 2011) documented the depletion of the capital stock. Recent initiatives are shown in Table 10.9.

Research into the Financing of TVET in the Pacific PNG Country Report
99
Table 10.9 Capital funding for TBCs, 2011-2014 (Kina 000s)
Source/ Colleges 2011 2012 2013 2014
TVET Sector Projects, GoPNG Budget
Funds Allocated 9,604.4 10,180.3 10,000.0 10,000.0
First Wave – NPI Lae, PomTech, Goroka Tech
Second Wave – Madang PoMBus and Kokopo
2014 Tranche - 5 TBCs + Enga Technical High School
Funds Spent 4,862.6 4,089.9
Education Infrastructure Grants, GoPNG Budget, 2012 only
West New Britain Tech
2,000.0
Australian Aid Grants
Mt Hagen Technical (Incentive Fund)
9,500.0
PoMTech
Totals, Funds Allocated
331.2
9,935.6
2,563.7
12,744.7
570.7
20,070.7
Sources: The TVET Sector Projects line is from the GoPNG Budget Books, 2013 and 2014. The figures for 2011 and 2012 are described as actuals, those for 2013 and 2014 are estimates. Funds Spent came from the Budgets Division of NDoE. They represent the amounts of the TVET Sector Projects which were spent on building works in the relevant year. The difference from the Budget Book actual is explained below. Australian Aid Grants are as stated by the institutions concerned. The Mount Hagen project extended over 2012-2013. We have put all the spending in the later year because we do not have a breakdown between years.
TVET Sector Projects (also known as Impact Grants) are intended to meet the most pressing capital needs of the colleges concerned, including dormitories, administration blocks and staff houses. The separate lines for Funds Allocated and Funds Spent require explanation. Funds Allocated are as set out in the Budget, where K9,604,400 appears as an ‘actual’ for 2011. In practice expenditure proceeded more slowly. K5,137,400 unspent in 2011 was placed in a Special Account at PoM Business College, and treated as spent for budget reporting purposes. Again in 2012 sums amounting to K7,617,121 went to Special Accounts at NPI Lae and PoMTech, so that K4,089,900 was the portion of the K11,707,000 spent in year. These arrangements reflect partly the lack of multi-year budgeting in PNG; and partly slow procurement. NDoE monitors these Special Accounts. Over time the money transferred to the Special Accounts is being spent on TVET Sector Projects. At the time of our visit in June 2013 PoMBus reported that there was about K2.5 million left in the Special Account there, from an original deposit of K5,137,400. Tables 10.4 and 10.5 illustrated the different timings of allocations and expenditure from an institutional perspective. NPI Lae shows a grant of K4 million from TVET Sector Projects as income in 2012, but no capital expenditure in that year. PoMTEch did not show its grant as either income or expenditure of the college, on the grounds that effective control of the money rested with NDoE under dual signature arrangements, and some of it was used for purposes extraneous to the college – housing on the PoMTech site for staff who worked elsewhere.

Research into the Financing of TVET in the Pacific PNG Country Report
100
The K2 million grant for West New Britain Tech was supplemented by a grant of K600,000 from the province. The money was used mainly to upgrade the dormitories which were built for the former Mora Mora VTC and were not up to TBC standard. The Incentive Fund grant of K9.5 million to Mt Hagen Tech covers a new training workshop as well as dormitories and staff housing. The facilities were opened on 27th Sept 2013. The AusAID grant to Port Moresby Technical covers ablution blocks and other infrastructure. The Team learned of a number of concerns about the timeliness and effectiveness of capital procurement on behalf of the TBCs, which is conducted by NDoE for projects of a value above K300,000, and by college councils for smaller projects.
Sometimes NDoE appears to the colleges to substitute its own judgment about what should be procured for that of the college;
Some questionable tendering practice. For example in one case NDoE appointed a contractor who put in a low bid but was not short-listed by the Expert Panel for the tender. This contractor walked off the job leaving little more than footings completed;
Lax contract management e.g. late progress payments causing the contractor to go slow.
Concerns of these kinds are not confined to NDoE procurements. The Principal at Kokopo Business College showed us uncompleted works which had been initiated by the former Council without sufficient thought for the funds available. These recent initiatives begin the task of renewing the TBC capital stock. Sustained capital funding over a period of years will be required to see it through. A particular issue is how to respond to the pressure from provinces to enlarge the TBC network. If that is done by adopting as national institutions premises which are unsuited to the demands of modern technical and business education, the problem of capital renewal will be aggravated. NDoE has argued that provinces who want local colleges approved as TBCs should assume responsibility for bringing their premises up to standard. That seems reasonable, especially when GoPNG has allocated very substantial funds for investment at province and district levels. It will however need sustained political support to persuade provinces to take on that responsibility. Funding for Quality-Related Expenditures such as curriculum development and teacher training is managed centrally by the TVET Wing. There is little or no regular provision within the TVET Budget for quality improvements, but the TVET Wing uses whatever opportunities occur to fund them year by year. Thus 2012 was a bumper year for TVET teacher training because there was a once-only project for System-Wide Vocational Reform funded by GoPNG which included K1 million for that purpose. In years prior to 2012 TVET Wing had to depend on funding of about K200,000 to K300,000 annually from the Australian aid program. Training priorities include:
The 6-month TVET Teaching Diploma at the University of Goroka, much the biggest claimant on the funds;
Two-week intensive financial management courses for principals and deputies;
OHS training;
Various short courses for VTC staff.

Research into the Financing of TVET in the Pacific PNG Country Report
101
The overall annual cost of teacher training for TVET also includes the cost of training for students on other relevant UoG courses. On the basis of the 64 students reported above and a unit cost of K20,000 a year, the total cost is about K1,280,000 a year. Adding in the TVET Wing course purchases above, the overall annual cost of training TVET teachers may be roughly K1.6 million. As described in Section 8.1, in 2013 TVET Wing had access to nearly K3 million for quality related expenditures, of which about 2/3 came from the NDoE fund for Quality Initiatives in Education,42 and about one-third from the Australian aid program of direct funding support. A variety of initiatives were supported, among which the development of National Certificate courses, and Evaluation and Quality Assurance absorbed most of the funding.
10.2 FUNDING FOR TVET IN THE UNIVERSITIES
In Part III we made the point that the style of commitment to courses classified as TVET for this Study varies markedly from one university to another. For all but one of the universities such courses are a minor part of their offer. TVET courses are not separately identified in the public funding of universities, and often not in the fees charged. Four of the universities – University of Papua New Guinea (UPNG), University of Technology, Lae (UNITECH), University of Goroka (UoG), and University of Natural Resources and Environment (UNRE) are public. Divine Word University (DWU) and Pacific Adventist University, which has no TVET courses, are private. The four public authorities are statutory authorities which receive grants direct from GoPNG. University funding used to be presented in the Budget as a single block grant, but the format for their budget entries is now similar to that for TBCs. However, the funding continues to be transferred to the universities as a cash grant. Table 10.10 illustrates this aspect in the case of UNRE. Table 10.10 Recurrent funding for UNRE in the 2013 GoPNG budget
UNRE, Program 515 K000s Actual Appropriation 2013 items as % of total
Item43
2011 2012 2013
Personnel Emoluments 13,623.4 89.1%
Goods and Services 865.3 5.7%
Utilities and Rentals 788.0 5.2%
Grants, and Transfers 10,454.8 14,245.8 -
Totals 10,454.8 14,245.8 15,276.7 100%
The overall level of budget funding for universities is much higher than for TBCs. K15,276,000 in 2013 for UNRE which has just over 600 students compares with K15,382,000 for the eight TBCs with about 5000 students. Because of its small size and dispersed sites, unit funding at UNRE is higher than for other universities. In our first report we calculated that GoPNG Budget funding per student at the four public universities in 2010 was almost four times that of the TBCs. The table appears to indicate that Personnel Emoluments take up an even higher proportion of university budgets than for TBCs. But there is an important difference: GoPNG personnel emolument funding for the universities covers all staff, while for the TBCs it covers teaching staff only. Universities are not flush with cash for goods and services. Both UPNG and
42
This money became available as a result of savings in the estimate for School Subsidies.
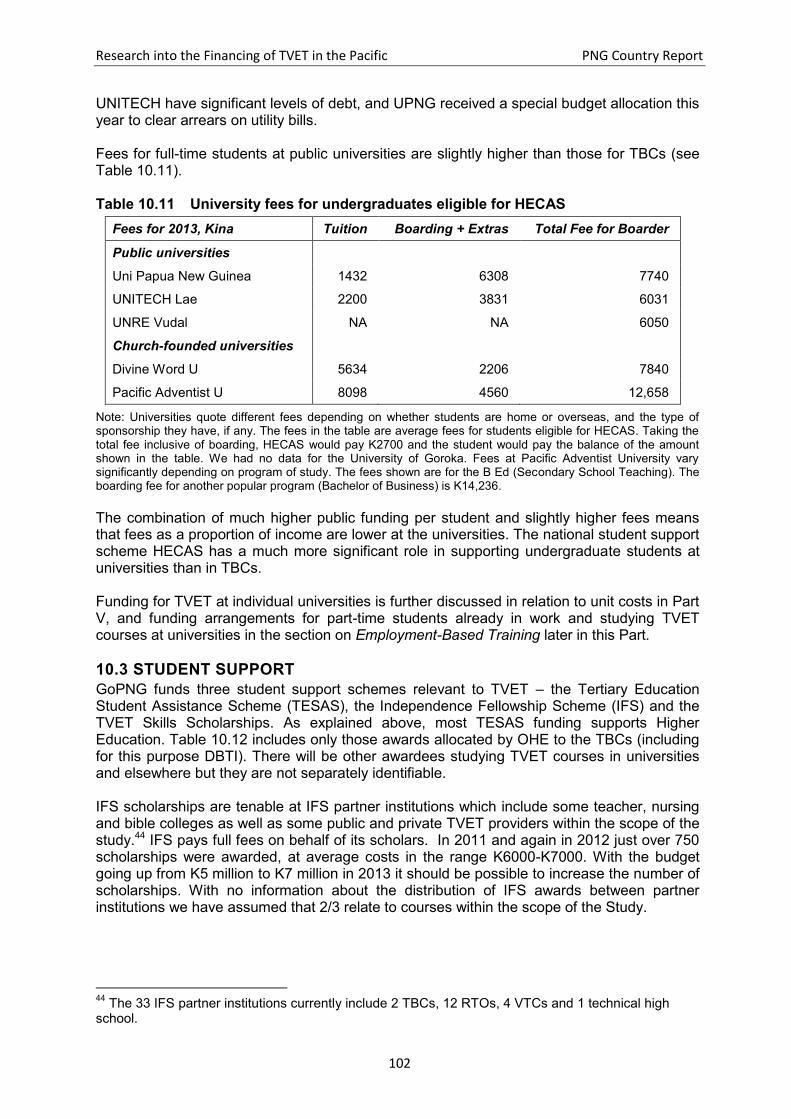
Research into the Financing of TVET in the Pacific PNG Country Report
102
UNITECH have significant levels of debt, and UPNG received a special budget allocation this year to clear arrears on utility bills. Fees for full-time students at public universities are slightly higher than those for TBCs (see Table 10.11). Table 10.11 University fees for undergraduates eligible for HECAS
Fees for 2013, Kina Tuition Boarding + Extras Total Fee for Boarder
Public universities
Uni Papua New Guinea 1432 6308 7740
UNITECH Lae 2200 3831 6031
UNRE Vudal NA NA 6050
Church-founded universities
Divine Word U 5634 2206 7840
Pacific Adventist U 8098 4560 12,658
Note: Universities quote different fees depending on whether students are home or overseas, and the type of sponsorship they have, if any. The fees in the table are average fees for students eligible for HECAS. Taking the total fee inclusive of boarding, HECAS would pay K2700 and the student would pay the balance of the amount shown in the table. We had no data for the University of Goroka. Fees at Pacific Adventist University vary significantly depending on program of study. The fees shown are for the B Ed (Secondary School Teaching). The boarding fee for another popular program (Bachelor of Business) is K14,236.
The combination of much higher public funding per student and slightly higher fees means that fees as a proportion of income are lower at the universities. The national student support scheme HECAS has a much more significant role in supporting undergraduate students at universities than in TBCs. Funding for TVET at individual universities is further discussed in relation to unit costs in Part V, and funding arrangements for part-time students already in work and studying TVET courses at universities in the section on Employment-Based Training later in this Part.
10.3 STUDENT SUPPORT
GoPNG funds three student support schemes relevant to TVET – the Tertiary Education Student Assistance Scheme (TESAS), the Independence Fellowship Scheme (IFS) and the TVET Skills Scholarships. As explained above, most TESAS funding supports Higher Education. Table 10.12 includes only those awards allocated by OHE to the TBCs (including for this purpose DBTI). There will be other awardees studying TVET courses in universities and elsewhere but they are not separately identifiable. IFS scholarships are tenable at IFS partner institutions which include some teacher, nursing and bible colleges as well as some public and private TVET providers within the scope of the study.44 IFS pays full fees on behalf of its scholars. In 2011 and again in 2012 just over 750 scholarships were awarded, at average costs in the range K6000-K7000. With the budget going up from K5 million to K7 million in 2013 it should be possible to increase the number of scholarships. With no information about the distribution of IFS awards between partner institutions we have assumed that 2/3 relate to courses within the scope of the Study.
44
The 33 IFS partner institutions currently include 2 TBCs, 12 RTOs, 4 VTCs and 1 technical high school.

Research into the Financing of TVET in the Pacific PNG Country Report
103
The NTC administers a National Scholarships Training Fund intended to provide training courses of up to three months for vulnerable Papua New Guineans. Exact funding is not known but believed to be of the order of K0.3 million a year. GoPNG funding for TVET scholarships is shown in Table 10.12. Table 10.12 GoPNG-funded student support schemes
Funding Agency 2011 2012 Award Nos.
in 2012
OHE, TESAS 2,335.9 2,109.1 1520
oLIR, Independence Fellowships 3,300.0 3,012.0 513
TVET Skills Scholarships 10,800.0 24,800.0 256
Total scholarships in PNG 5635.9 5121.1 2033
Total including TVETSSP 16,435.9 29,921.1 2,289
Source; Annual Management Reports for OHE for 2011 and 2012. Figures cover the seven TBCs + DBTI, and relate to 1337 awards in 2011, and 1520 awards in 2012. To this should be added provincial scholarship schemes. We know that Governor Parkop has allocated K4 million for the NCD TVET scholarships this year – probably about 700 scholarships. We understand that Morobe province is currently spending about K5 million a year on HE and TVET scholarships combined, and that Enga too has a significant scholarship scheme. The only donor scholarships for TVET for which we have financial information are those under the Australian aid program. Over the three years 2010 to 2012, 58 students from PNG completed a TVET qualification in Australia at an estimated cost of K9.7 million (A$4 million). The average cost per student was K167,900 over the full duration of the courses.
10.4 TVET IN OTHER PUBLIC COLLEGES
Other Public Colleges means colleges outside the NDoE and OHE domains but offering TVET qualifications similar to those offered by the TBCs, and funded by GoPNG. The three treated here are those discussed earlier: the Works Institute of Technology (WIT); the PNG Institute of Public Administration (PNGIPA); and the PNG Maritime College. Unlike the TBCs, these colleges cater mainly for part-time training of employees, or full-time training of persons seconded from employment. GoPNG Budget provision for these three providers is shown in Table 10.13.

Research into the Financing of TVET in the Pacific PNG Country Report
104
Table 10.13 Provision in the 2014 budget for PNGIPA, WIT and PNG Maritime
Agency 2011
Actual 2012
Actual 2013
Appropriation 2014
Estimate 2013 Staff Numbers
PNGIPA 5,879.9 5,959.4 6,523.7 6,523.7 68 (27
teaching)
Works Institute
2,836.3
2,200.0 2,120.3
1,074.6
35 (15
teaching)
PNG Maritime (Recurrent)
3,057.0 3,179.0 3,252.5 3,252.5 55
PNG Maritime (AusAID grant)
2,950.0
Total 11,773.2 16,408.7 10,850.8 158
Notes: Costs for PNGIPA relate to its Training Design and Delivery Activity, plus a K2.2 million ICT infrastructure grant in 2012 only. The Department of Works budget does not identify WIT separately. Provision has had to be taken from its survey return – hence no numbers for 2014.
Unit costs at WIT emerge as high, partly because it offers courses in ten different trades with a total enrolment of 155 in 2012, leading to an SSR of just 11:1. Non-teaching costs look abnormally high, but DoW explained that it was hard to separate these from costs incurred by its Training Branch for other functions, so the apportionment is to an extent arbitrary. WIT charges a standard fee of K5000 for a part-time Level 1 and 2 course offering 480 contact hours over 36 weeks, much higher than the fees charged by TBCs. However, because of WIT’s high unit costs, fee income covers well under half of its expenditure. PNGIPA enjoys substantial GoPNG funding, enabling it to employ 27 full-time trainers, as shown in Table 10.11. In 2011 and 2012 it earned over K800,000 in fees, perhaps from its legacy long-term residential courses. Volumes for the new-style competency-based short course training as reported in our survey were very low indeed. For Semester 2 2013 seven courses were reported, ranging in length from four days to three weeks. Contact hours were given for each course. The average fee per contact hour was K83, with a range from K127 to K48. These fees are very high by PNG standards. Through persistence we managed to get PNGIPA to respond to the RTO survey, but the training output reported seemed extraordinarily low relative to the resources apparently employed. The Team could not get an explanation of that from PNGIPA, and so decided not to include it in the unit cost analysis. PNG Maritime College is a statutory authority. Like the public universities it used to have a block grant. The 2013 and 2014 grants of K3.3 million are said to be all for Personnel Emoluments. If so they amount to an average of K59,127 across the 55 staff members declared in the Budget. PNG Maritime College had 334 students in 2011. Dividing that enrolment into the 2011 Budget provision of K3.1 million yields public funding per student of K9,152, similar to a PNG public university. This funding supports a variety of courses, ranging up to one year in length. We have no information on the college’s fees or support from the shipping industry. The Australian aid grant over 2011 and 2012 was the college’s second from the Incentive Fund. It paid for a girls’ dormitory and infrastructure upgrades.

Research into the Financing of TVET in the Pacific PNG Country Report
105
10.5 EMPLOYMENT-BASED TRAINING
The previous section covered some training delivered by public providers mainly for persons in employment. We were not able to conduct an Enterprise Training Expenditure Survey (ETES) in PNG, so we have limited new information on the funding of employment-based training. Section 8.4 above has addressed PNG’s training levy, and the expenditure of NTC’s Training Assistance Fund derived from the levy. This section provides information from two providers of apprentice training which we surveyed, and from TVETSSP about the costs of supporting apprenticeship more generally. PNG Power completed the institutional survey, and a data sheet for it is included in Annex 1. It was not able to seperate the College’s non-staff costs from other costs of the firm, so cost information was for teaching cost only. The teaching cost per student on an 8 week extension course was K1,682, compared with a teaching cost of K1,312 at PoMTech for similar courses. The explanation is likely to be mainly higher salary for the private provision (average teacher cost K46,700 at PNG Power, K35,300 at PoMTech). PNG Power’s fee for these courses was K5,000 which would have to cover non-staff costs also. At PoMTech for extension courses the total unit cost was 2.2 times the teaching cost.
Ela Motors did not to provide cost information for its in-house training operation. It did record training expenditure of K538,500 in 2012, split as follows: apprenticeship training fees K16,400; external structured training fees K51,200 for 10,080 hours of training; and travel and accommodation for training K471,000. K5 per hour for external training appears low, but much public training cost about that in 2012. The travel and accommodation cost is a reminder of the very high cost to nationwide firms in PNG of bringing employees together for training.
Most of the costs of apprenticeship training are borne by employers. There is direct evidence only for the cost of off-site extension training. Calculations made by the OHE for the likely costs of supporting TVETSSP graduates through their apprenticeship are included in Table 10.14.

Research into the Financing of TVET in the Pacific PNG Country Report
106
Table 10.14 Apprenticeship support costs, TVETSSP (Kina)
Place of training
cost Items Rates Weeks
Yearly totals Total, all years Year
1 Year
2 Year
3 Year
4
On-Job- Training
Safety equipment subsidy
500 Once only
500
500
Tool kit subsidy 500 Once only
500
500
Supervisors’ time cost on site
2,500 Annual 2,500 2,675 2,862 3,063 11,100
Extension Training at Institutions
Airfare subsidy 1,000 Annual 1,000 1,070 1,145 1,225 4,440
Living subsidy Rebate
250 8
2000 2,140 2,290 2,450 8,880
Totals 6,500 5,885 6,297 6,738 25,520
Notes: The table is adapted from a worksheet prepared by the Office of Higher Education for the TVET Skills Scholarships. Apprentice training wages are not included, on the basis that they are paid for by the work apprentices do. Fees for extension training are not included – they vary widely between public and private providers. Airfare and living subsidy costs are incurred only if the apprentice attends an extension course out of reach from his home. Outside of Port Moresby there are few facilities for training apprentices. Source: OHE.
Fees for extension courses are on top of these costs. For a boarding student at a TBC they amount to K1760 per course; for a private provider they could be K5000 per course – the fee reported as at PNG Power Training College. An apprentice will go through three such courses before completing his or her apprenticeship. Perhaps the high cost of apprenticeship in PNG is one factor in the low number of apprentices trained. The NATTB sets the fees for trade tests. Fees range from K400 to K800, depending on the trade and the level of the test. These fees are some-times paid by employers. The minimum wage in PNG is about K120 for a 44 hour week, so the cost of a test is considerable for those who pay from their own pockets.
10.6 VOCATIONAL TRAINING CENTRES
Only the VTCs in the National Capital District are specifically provided for in the GoPNG Budget, because NDoE administers education services in the NCD. The relevant Budget program makes provision for VTCs – mainly for their personnel emoluments – on lines very similar to that for the TBCs discussed above. Elsewhere in PNG GoPNG support for VTC staffing is funded through Teaching Service Commission (TSC) grants to provinces. TSC grants are made in support of the province’s school and VTC staffing as a whole. Using data about VTC teacher numbers and salary rates the team was able to impute a VTC share of TSC grant for VTCs. Such imputation would not be needed if provincial budgets regularly included planned and actual spending on teachers by type of institution – but those we saw did not. NDoE calculates a school fee subsidy for every eligible institution, so the amount of subsidy money spent on VTCs is ascertainable. Table 10.15 illustrates recurrent funding for VTCs.

Research into the Financing of TVET in the Pacific PNG Country Report
107
Table 10.15 Funding for VTCs in line with the 2013 GoPNG budget (Kina 000s)
Actual Appropriation
2011 2012 2013
VTC staffing in NCD 2,950.0 3,509.0 3,949.8
TSC grant for VTC staffing outside NCD*
17,468.0 19,002.3 20,955.1
VTC share of school fee subsidies
No data 17,946.1 30,497.7
Totals [20,418] 40,457.4 55,402.6
Notes: 1. TSC grant is calculated by multiplying the average pay cost per teacher at VTCs outside NCD
found in our surveys by 980 (the no of teachers in these VTCs in 2009). 2. NDoE supplied figures for school subsidies are in Table 10.16.
Table 10.16 VTC subsidies, 2012-2013
VTC Subsidies., Kina 000s 2012 2013
First payment 10,242.0 16,364.7
Second Payment 7,704.1 14,133.0
Total 17,946.1 30,497.7
Total provision for school subsidies in the years 2011, 2012 and 2013 in the GoPNG Budget is K171.9 million/K602.0 million/K652.0 million. For all but upper secondary schools and VTCs tuition became
free in 2012. The growth shown in Table 10.16 in provision for VTC subsidies from K17.9 million in 2012 to K30.5 million in 2013 is very striking. It relates to:
A growth in student numbers from 22,429 at the 2011 Census to 26,877 at the 2012 Census. The latter figure was used for the first subsidy instalment of 2013. After the validation of the 2012 school census the second instalment was based on 23,799 students;
A 10% increase in the fees which form the basis for subsidy, to values of K990 (day student), and K1430 (boarder) in 2013. This increase is intended to cover inflation;
An increase in the rate of subsidy from 75% of the fees in 2012 to 100% in 2013 meaning that tuition was free.
As regards income other than from GoPNG, VTCs may receive funds from:
a) Fees paid by, or on behalf of, students for mainstream courses;
b) Grants from provinces or lower tiers of Government;
c) Internal income generation, e.g. through provision of short courses for fees not subject to NEB limits, or sales of goods and services.
In 2012 the focal year for the survey, the NEB fee limits for VTCs were K900 for day students and K1300 for boarders, subsidised at 75%. Parents were required to pay K225 for day students and K325 for boarders. Project fees could be charged on top of that, subject to the approval of Provincial Education Boards. For 2013 GoPNG has determined a maximum of K200 per student for project fees approved by PEBs. For the Surveys we asked VTCs to list separately under Fees, Fees Paid by Students, NDoE School Fee Subsidies, and Fees paid

Research into the Financing of TVET in the Pacific PNG Country Report
108
by Employers and Other Course Purchasers. The results are discussed in the next Part. They are less clear-cut than we expected. Some VTCs did not show anything near the 75:25 ratio between subsidies and fees paid by students in 2012, and a number seemed still to be charging 25% of the fee to the student in 2013. Grants from provinces and lower tiers of Government for recurrent purposes seem to be mostly small as a source of VTC income. Morobe allocates about K20,000 to K30,000 to each of its VTCs with boarders to help with boarding costs. That must be very welcome as the difference between the day and boarding fees for VTCs was just K440 in 2013, about K1.60 per day if a boarder stays at the Centre for the whole of a 40 week school year. Some VTCs produce some of their own food, but the comparison with the TBCs is stark: the TBC Board and Lodging allowance for 2013 was K2,175, almost five times the VTC boarding allowance. Short courses seem to be the main source of other revenue and can be significant, especially in places where VTCs can form partnerships with providers like GGBDF and IFS who pay the fees on behalf of participants. Other forms of income generation are small at many VTCs, but there are stand-outs such as one using its cookery and hospitality students to cater for functions, and another offering construction students as a labour force for building work. Of the 9 VTCs we surveyed, three reported no Internal Income Generation in 2012, four reported internal income in the range of 0.5% to 3%, one reported it at 10% and one at 33%. The two VTCs with high internal income both admitted mainly girls, and catering was an important earner for them. One of the other VTCs which reported low internal income had substantial shot course activity and seems not to have recorded the income from it as Internal Income, as the Survey Form requested. As regards capital funding, we remarked in the previous part on the poor state of the VTC capital stock. Its renewal is essentially the responsibility of provinces and districts. In a policy statement circulated to provinces and districts early in 201345 the then Minister of Education
drew the attention of Provincial Governors and Open Members of Parliament (who represent Districts) to the funds available under the District Support Improvement Program (K2 million per district) for supporting education in each district. The Minister indicated the building of classrooms and teachers’ houses, and the funding of school libraries as priorities. VTCs were not specifically mentioned. VTCs are a small part of provincial education responsibilities and may be less persuasive than schools as a political priority. St Therese VTC at Lae which is noticeably well maintained, received K100,000 a year from Lae District, the only instance reported to us of significant help for a VTC from a district. The only large-scale new buildings we saw at VTCs were the new tourism and hospitality block at Morata VTC in NCD funded through the Governor of NCD, and a new teaching block in course of construction at Badili VTC which was said to be funded by a NDoE grant of K1.5 million, perhaps derived from the K30 million for Education Infrastructure allocated for 2012 only. Small-scale initiatives were more frequent. East New Britain has managed to carve out K600,000 in 2012 and 2013 from its Education Function Grant for tools and equipment for VTCs. Several of the VTCs responding to our survey were funding small-scale capital expenditure from revenue. After many years when they had almost no money to buy goods it makes sense to use some of the sudden increase in subsidies to buy tools and equipment, including computers. If incremental improvements to VTCs are all that can be afforded at the present time, it is right to make them because young people deserve better opportunities now. But incremental improvement within the current VTC model is not a sufficient strategy for the longer term.
45
Ministerial Policy Statement 02/2013 dated 5th March 2013, obtained from NDoE. K2m per district is
K178 million nationally. In the 2013 Budget allocated K10 million per district for Direct Investment with guidance that 20% of it should be spent on Education.

Research into the Financing of TVET in the Pacific PNG Country Report
109
We referred in Part III to NDoE’s attempt to define the roles which VTCs might in future play in relation to the different client groups they serve. Clearly there is much to do to build consensus around that or some other scenario for VTC development. The essential point is that if a substantial number of VTCs are to be brought up to the standard where they can offer students courses at NC1 or 2 and equivalent levels, as a preparation for work in the formal economy, investment in infrastructure and training will be needed on a scale similar to that undertaken for community colleges; and VTCs which will remain geared to the informal economy also need significant modernisation.
10.7 COMMUNITY COLLEGES
As reported in Section 5.3.2 above, community colleges were intended as another option for meeting the needs of disadvantaged PNG people, including those in rural areas and/or pushed out from the formal education system. Over the period 2007-08 GoPNG approved the establishment of 15 publicly funded community colleges and two privately funded. A rough estimate of K130 million to establish the pilot colleges was made, based on K10 million for each of 13 colleges. Effective control of finances for the community college program rests with the independently administered trust46 which had declined to provide NDoE with annual budgets or accounts at the time of our fieldwork. The financial framework for these colleges is unusual, and the key numbers are hard to ascertain. From the GoPNG Budget we obtained the costs of the small Community Education Secretariat in NDOE, and an entry for program funding as follows: Table 10.17 Community college funding in the GoPNG budget
Funding Source
Item 2011
Actual 2012
Actual 2013
Appropriation 2014
Estimate Department of Prime Minister, Program 203, Kina 000s
GoPNG Development Budget Other Operational Expenses
4,999.6 -
-
People’s Republic of China (PRC)
Grant
People’s Republic of China Loan 36,573.0 14,973.1 16,285.0 27,700.0
Totals 41,572.6 14,973.1 16,285.0 27,700.0
Sources: GoPNG Budget Book 2013 for 2011, GoPNG Budget Book 2014 for 2012-2014.
46
The Inclusive Education for National Development of Community Education Trust described in Section 5.3.2.

Research into the Financing of TVET in the Pacific PNG Country Report
110
The Community Education Secretariat of NDoE could not vouch for the numbers in the 2013 Budget, and were not aware that the Prime Minister’s Department was still actively involved in budgeting for community colleges. The inception of the community college program had had the personal backing of the former Prime Minister Sir Michael Somare, but NDoE did not think that the Prime Minister’s Department was still a leading stakeholder in 2013. Within Table 10.17 the Actual figures for 2012 drawn from the 2014 Budget Book are very different from the Appropriation figures in the 2013 Budget Book; the latter had China making a grant of K4 million in 2012 and expenditure from the loan of just K3,921,000. If the latest figures are correct, there was no grant from China. Expenditure from the Chinese loan over the 4 years 2011-2014 will sum to K95.5 million, or about US$38.2 million at an exchange rate of around K2.50 to the US dollar. The original value of this loan was US$35 million. Given that the community colleges are being built from scratch and the first have only recently opened, most of the spending to date would be capital expenditure. With only five of 17 colleges open in 2013 the rate of loan usage seems high, but much of the expense of building the later colleges may have been paid for through the pre-fabricated units already imported from China and stored at PNG ports. The buildings acquired for the colleges include police and aid posts as well as facilities for education, in line with the community college concept. The only Budget funding for community colleges held by NDoE is the small amount required for the running of the Secretariat – K500,000 in 2014. There does not appear to be any funding for community college recurrent expenditure in the Budget, apart from the K5 million for 2011 shown in Table 10.16. It seems that operating expenses would need to be met from balances held by the Trust. NDoE records indicate that over a longer time period much larger sums have been released for community college purposes. In 2010 K20 million was released by GoPNG to the Trust. A total of K15 million was released into separate trust accounts for the Marienburg and Wabag community colleges. No accounts of the use of these funds are available to NDoE. As at August 2013 the Secretariat in NDoE had about K2 million in overdue claims against the Trust. There were doubts about whether the Trust was able to pay them. If the trust was running out of money, it was not clear how legitimate community college expenditure to date could have used up the full K20 million released in 2010. We are on firmer ground about funding allocated for the parallel stream community college work. Over the years 2010 to 2012 the Trust paid a total of K2.7 million to a total of 11 VTCs, through annual grants mostly of K100,000. Community college students do not rank for NDoE school fee subsidies. VTCs which we surveyed charged community college students similar fees to other students, and used their Trust funding to subsidise the fees and for other purposes, such as equipment purchases. There is considerable frustration among those we spoke to about the funding and administration of the community college program. It is only fair to add that the Provincial Education Adviser of Morobe told us that the facilities on offer at the college opened at Finschhafen in 2013 were impressive, particularly for computing.

Research into the Financing of TVET in the Pacific PNG Country Report
111
10.8 STRUCTURED TRAINING FOR THE INFORMAL ECONOMY
Table 10.18 summarises expenditure by the three providers of training for the informal economy examined in the study.
Table 10.18 Expenditure on structured training for the informal economy, by provider (Kina 000s)
Provider 2010 2011 2012 2013
Ginigoada
1,700.
SDTF budget approvals 409 298 84
SDTF contributions 284 205 59
IATP
2,836
Sources: Material obtained from the providers.
Ginigoada operates in the National Capital District. Its projected income for 2013 is about K1.7 million. Of that about 55% comes directly or indirectly from the NCD Commission, about 13% from Australian aid through the Strongim Pipol Strongim Nesen Program, and the remainder from a variety of donors both in PNG and overseas, plus about 2.5% from training participants. Ginigoada is both a provider and a purchaser of training. As a purchaser, it procures training courses usually of about one month’s duration from some VTCs and RTOs in NCD. The Skills Development Trust Fund operates in NCD, East and West New Britain and Western Highlands. The Team does not have data for SDTF expenditure as such, only on projects approved for a start in a given year. The difference between budget approvals and SDTF contributions is made up by the contributions which course providers and trainees make to the expenses of the project. For further information, see Annex 3. The Integrated Agricultural Training Program (IATP) operates from its base at UNRE throughout Islands Region and in some mainland provinces. Its income in 2011 was K2,975,000, just ahead of the expenditure reported above. Its largest income source was training contracts delivered under the title Community Projects for government and private organisations (K1.4 million). A further K0.85 million was earned through other training programs delivered for the provinces of East and West New Britain. Work in other provinces, for commercial clients, and hires of its dedicated training facilities at UNRE, contributed most of the balance. For the purposes of an aggregated expenditure estimate we take the annual expenditure supported by these three bodies to be K5 million (ie K3 million for IATP, K1.7 million for Ginigoada, and K0.3 million for SDTF).
10.9 FUNDING PRIVATE SECTOR TVET
This section is about the funding of those RTOs which do not receive significant grants from public funds. The Team attempted in Phase 1 to gather information about income and expenditure of all RTOs through a postal survey, but the results were limited by a low response rate, and the financial information was often of lower quality than the non-financial. We were able to draw a general picture of the structure of private TVET in PNG from other sources, but not to draw a broad picture of the financing of private sector TVET.

Research into the Financing of TVET in the Pacific PNG Country Report
112
In Phase 2 we have obtained better financial information from the providers included in the institutional surveys. Table 10.19 summarises sources of income for these providers. Table 10.19 Income and expenditure of surveyed private providers, 2012 (Kina 000s)
Total fee income
Supported fee income
1
Total Recurrent Income
Total Recurrent Expenditure
IEA College of TAFE 4,961.8 325.0 5,126.6 5,079.4
Talleres de Nazareth 2.3 0.8 124.1 93.8
Innovative Training Centre 856.3 392.3 856.3 781.5
OISCA 380.0 365.0 1,008.3 1,043.1
Elirana Electronic Technology 120.0 0.0 120.0 121.4
Highlands Youth Training and Rehabilitation Centre 560.0 90.0 630.0 510.0
1. Supported fee income relates to fees paid by scholarship providers or employers. Source: Material from the survey.
IEA College, Innovative, Elirana and HYTRC rely wholly or mainly on fees for their income. Supported fees are important for Innovative which has links with mining companies, less so for the other three. As regards the remaining two:
Talleres de Nazareth relies mainly on fees paid by GGBDF and SDTF on behalf of trainees (K110,000), but has recorded these as NGO grants;
OISCA stands out as having the highest proportions of fees paid by scholarships, and of other income. Other income includes an overseas donor operating grant of K196,900 (probably from Japan), and internal income generation of K381,800 (probably sales of farm produce). HYTRC puts its internal income generation at K70,000.
Private providers are more ready to disclose fees than other financial information. The Team has fee information for 14 private providers from the Phase 1 and Phase 2 surveys. It is not easy to tabulate because it relates to courses of different lengths across numerous fields of study, and often the qualification aim is the provider’s own certificate rather than an independently accredited qualification. But some general points can be made:
for the general run of providers fees for certificate and similar courses usually fell in the range K90 to K130 per week;47
fees were often higher at the high status institutions and for foreign qualifications. K150 to K200 a week was quite common;
Diploma courses were more expensive than certificate courses because longer. The differential in terms of Kina per week however seems to be 20% or less;
Workshop courses offered by the smaller RTOs were little more expensive than classroom courses, but differentials increase sharply at the top end, and when it is expected that employers will pay. PNG Power Training College charged K5000 for their 8 week apprentice extension courses, and Hastings Deering K2650.
The fees of the larger private colleges preparing students for well accredited qualifications are of special interest because they lend themselves to comparison with the technical and
47
Fees were quoted in relation to the courses as a whole but with so many different course lengths it is convenient to summarise them in terms of kina per week.

Research into the Financing of TVET in the Pacific PNG Country Report
113
business colleges. Take for example the costs of getting a Diploma in Accounting at Port Moresby Business College and IEA College of TAFE at 2013 fee rates:
The student at PoM Bus faces fees of K3755 for each year of a 2-year Accounting Diploma – a total of K7510;
At IEA College of TAFE with its structure of one semester courses the student could study for a Cert III and a Cert IV in Year 1 at K4,900 and K5,200, a total of K10,100. In Year 2 he could take a Diploma and an Advanced Diploma @ K5900 and K6250, a total of K12,150.
Clearly the cash outlay for the student is much higher for the IEA option, but he needs also to ask himself whether he values the intermediate qualifications, and how his final qualification will stand in terms of acceptability to the accountancy professional bodies. PoMBus is cheaper to the student partly because of the public subsidy. For the PNG taxpayer the comparison looks different. According to our survey, the overall annual recurrent cost per student at PoMBus is K8,400, of which K3755 is covered by the student fee, and K4645 by public subsidy, while at IEA College of TAFE it is K9,913 without public subsidy. At K8,400 a year PoMBus is still significantly cheaper than the IEA fee cost of K10,100, but the price differential is much reduced. A value for money comparison would also take into account the quality of the qualification. This comparison is crude. In real life other things would come into play, including capital costs, the value of services provided to TBCs by NDoE TVET Wing, and public funding for student support. But it still points up the need for government to consider the option of purchasing places in the private sector as an alternative to expanding the public sector, especially in those fields of study where costs of entry are low, and the private sector can more readily compete. Expenditure on private sector TVET is very significant in PNG. Our surveys have enabled us to shed some light on the scene and to illustrate it with examples, but we have no basis for attempting nationwide estimates. The NTC requires financial information when an applicant seeks registration as a training organisation, and has powers to require annual reports from RTOs. But the NTC is not at present able to maintain a coherent data-base and keep it up-to-date. A stronger capacity in that regard is necessary if the Council is to guide effectively the planned transition to a register of assured quality, based on all courses conforming to the PNGQF for TVET.

Research into the Financing of TVET in the Pacific PNG Country Report
114
CHAPTER 11. TVET BUDGETS AND AGGREGATE EXPENDITURE
11.1 OVERVIEW
The Brief for this Study required the Team to address a number of questions including:
1) What is the overall level of public and private expenditure on TVET?
2) What is the total government expenditure on TVET as a proportion of total government expenditure, and what is the relative contribution of national and provincial governments?
3) What is TVET’s share of the education sector budget?
4) What proportion of expenditure on TVET could be defined as quality-related expenditures?
There are a number of different concepts here. To begin with, there are the amounts allocated in government budgets for TVET; then there are the amounts actually spent against those allocations; and the total expenditure of TVET providers taking into account their own fees, earnings from trade and fund-raising, as well as what they receive from the Government budget. Table 11.1 summarises information given earlier in this part about government allocations for TVET, including some official overseas aid built into the GoPNG Development Budget. In some cases provision for TVET is included within government allocations for broader purposes, and – as explained in the preceding sections – the Team has had to impute a share for TVET within these broader allocations. Within the table that applies principally to VTC Staffing, TVET Courses in the Universities and Independence Fellowships. The table understates publicly funded expenditure for capital purposes and on student support because we have little information on expenditure incurred by lower tiers of government. Where feasible, the figures in the 2011 and 2012 columns of the table are Actuals taken from the Budget Books for 2013 (2011 actuals) and 2014 (2012 actuals).

Research into the Financing of TVET in the Pacific PNG Country Report
115
Table 11.1 Summary of budget provision for TVET in PNG, Kina 000s
A. Recurrent Spending
Category Owner 2011 2012 2013 Source
System Administration
NDoE 3,339.8 4,994.8 5,088.1
DoLIR 794.5 1,281.2 1,746.9 Table 9.1
NTC 2,300.8 2,678.5 2,739.8
Total 6,435.1 8,954.5 9,574.8
Institutional Allocations
Technical and Business Colleges NDoE 12,946.2 13,290.6 15,382.3 Table 10.1
Vocational Training Centres- Staffing
Provinces + NCD 20,418.0 22,511.3 24,904.9 Table 10.15
Vocational Training Centres- Subsidies NDoE No data 17,946.1 30,497.7 Table 10.16
PNGIPA, PNG Maritime, Works Institute Various 11,773.2 11,258.7 10,850.8 Table10.13
TVET Courses in universities The 4 public universities 8,369.8 10,577.2 11,312.6 [1]
Institutional Allocations Total 53,507.2 75,583.9 92,948.3
Student Support
Tertiary Education Student AssistanceScheme OHE 2,335.9 2,109.1 2,109.1
Independence Fellowships DoLIR 3,300.0 3,012.0 4,666.7 Table 10.12
TVET Skills Scholarships OHE 10,800.0 24,800.0 20,000.0
Student Support
16,435.9 29,921.1 26,775.8
Total Recurrent Allocations
76,378.2 114,459.5 129,298.9
B. Capital Allocations
Technical and Business Colleges
GoPNG TVET Sector Projects NDoE 9,604.4 12,180.3 10,000.0 Table 10.9
Australian Aid
331.2 2,563.7 10,070.7 Table 10.9
PNG Maritime College
Australian Aid PNG Maritime 2,950.0 Table 10.13
GoPNG, PNGIPA PNGIPA 2,200.0 Table 10.13
VTCs and Community Colleges
GoPNG funding for VTCs NDoE
1,500.0
Loan from China for community colleges Trust 36,573.0 14,973.1 16,285.0 Table 10.17
Total Capital Allocations
46,508.6 34,867.1 37,855.7
Total Recurrent and Capital 122,886.8 149,326.6 167,154.6
[1] Detailed calculations of TVET spending at 4 universities not reproduced in the report.

Research into the Financing of TVET in the Pacific PNG Country Report
116
Even for 2011 and 2012 Table 11.2 is based mainly on government provision for TVET, not on the expenditure which those allocations finance, and for 2013 it is based wholly on provision. We have noted earlier in this Part some significant differences between provision and the expenditure it finances. But in the absence of accounts we have no option for aggregate purposes but to take provision as a proxy for expenditure. Where TVET providers are only part-funded by government, their expenditure may of course exceed their government allocations. It is easiest to illustrate this for the technical and business colleges. Table 11.2 indicates that among the five TBCs we surveyed recurrent expenditure was nearly 2.5 times GoPNG recurrent funding, broadly in line with the 2010 findings of the TVET Needs Analysis (Hind et al., 2011). Table 11.2 Ratio of recurrent expenditure to public funding for five TBCs in 2012
1 2 3 4
College Government Recurrent Funding K000s
Total Recurrent Expenditure
Col 3 divided by Col 2
Kokopo Business 1,246.4 3,324.4 2.67
Mt Hagen Technical 1,101.0 2,663.6 2.42
National Polytechnic, Lae 3150.5 7,490.5 2.38
Port Moresby Business 2,081.3 4,922.3 2.36
Port Moresby Technical 1,946.0 4,159.9 2.14
Totals 9,252.2 22,560.7 2.44
Note: Government funding includes teacher salaries paid through GoPNG payroll, NDoE operational grants, and fees paid by scholarship providers (on the grounds that most scholarships are publicly funded).
On the strength of the above table we propose to multiply government funding allocations to the seven TBCs in 2012 by 2.44 to get a rough estimate of TBC recurrent expenditure. The only university for which we have comparable information48 is UNRE. In 2012 UNRE
budgeted to spend K18,392,900, financed as to K14,245,800 by government grant, K3,788,182 by student fees and K270,000 of sundry income. In other words total spending is 1.29 X government grant. UNRE may well depend more on Government grant than the average PNG university but since Government funding for TVET courses at UNRE is 59% of the government funding for all such courses at the universities, it is probably adequate to use 1.29 as an overall factor for all university courses. We lack the information to calculate factors for PNGIPA, Works Institute and PNG Maritime. The sudden increases in Government subsidies complicated financial reporting by the VTCs for the Survey. For the 9 VTCs surveyed the Team summed the income items Fees Paid by Employers or Other Course Purchasers and Internal Income Generation. These amounted to K447,805, and would have funded 7.5% of total recurrent expenditure estimated for 2012 – K5,951,058. Where project fees of up to K200 are charged, there could still be an element under Fees Paid by Students which cannot be separated out in the Survey returns. For this 2012 calculation we need also to gross up for the 25% of fees still payable by families in that year. We have therefore allowed an overall factor of 40% for VTCs, applicable only to non-staff costs. From 2013 the policy is no tuition fee. Expenditure could only be greater than staffing allocations and subsidy income to the extent that VTCs charge project fees or obtain income from short courses, produce sales etc.
48
UNRE Consolidated Operating Budget Estimates 2012, attached to Bursar’s Report to the Council Meeting of 9
th April 2013.

Research into the Financing of TVET in the Pacific PNG Country Report
117
Table 11.3 shows the product of applying these factors and adding in other expenditure. Table 11.3 Rough estimate of TVET expenditure in 2012
Institutional Recurrent Expenditure Owner Allocations
Adjustment Factor Expenditure
Technical and Business Colleges NDoE 13,290.6 2.44 32,429.1
Vocational Training Centres- Staffing Provinces 22,511.3 1.00 22,511.3
Vocational Training Centres- Subsidies Provinces 17,946.1 1.40 25,124.5
PNGIPA, PNG Maritime, Works Institute Institution 11,258.7 1.00 11,258.7
TVET Courses in universities The 4 public universities 10,577.2 1.29 13,644.6
APTC Recurrent APTC
9,155.1
TVET for the Informal Economy Various
5,000.0
Total, Institutional Recurrent 119,123.3
Institutional Capital Expenditure
Technical and Business Colleges NDoE
14,744.0
PNG Maritime Institution
2,950.0
GoPNG, PNGIPA PNGIPA
2,200.0
APTC APTC
322.8
Community Colleges Trust
14,973.1
Total, Institutional Capital
35,189.9
Student Support
TESAS, IFS and TVETSSP OHE, DoLIR
29,921.1
APTC Scholarship Program APTC
1,198.4
Scholarships to Australia + training funding DFAT
4,846.6
Total, Student Support 35,966.1
System Administration NDoE, DoLIR, NTC 8,954.5
GRAND TOTAL 199,233.7
Notes: 1. Most of the data derive from Tables 11.1 and 11.2. 2. The APTC figures come from Table 6.2, and are converted from A$ at the rate A$1=K2.25. 3. Scholarships to Australia are as referred to under Student Support above, and training funding
is the special allocation of K1 million for 2012. 4. The K5 million for TVET for the non-formal economy is approximated from Table 10.18
This estimate of K199,233,700 does not include expenditure on TVET incurred by the private sector. Nor does it explicitly include expenditure by provinces and districts. Institutional expenditure by the provinces and districts will very largely be covered by TSC grants in respect of VTCs, which are factored into the table. Student support by some provinces is considerable – K4 million for NCD alone. But we cannot estimate it on a national basis. Figure 11.1 uses the sub-totals in Table 11.3 to illustrate the broad composition of TVET expenditure in PNG in 2012.

Research into the Financing of TVET in the Pacific PNG Country Report
118
Figure 11.1 Composition of TVET expenditure, 2012 (%)
Reverting to expenditure in the aggregate, GDP for PNG in 2012 is about K33,550,000,000, of which K199.2 million amounts to 0.59%. The Skilling the Pacific Report49 estimated PNG’s
expenditure on TVET in PNG as 0.5% of GDP, basing their estimate on TBCs and VTCs only. The base for our estimate is rather broader but there are still some important exclusions noted above. The Skilling the Pacific report estimate is derived from European Union work going back to the period 1999 to 2003. The most we can infer is that over the last decade public expenditure has roughly kept pace with the growth in PNG’s GDP. The most straightforward base for calculating TVET’s shares of total government expenditure and of the education sector budget is the Education Sector table from Vol 1 of the 2013 Budget Books because that is how GoPNG sees its overall commitment to education funding. It is based on the Recurrent Budget provision for NDoE and OHE, so we need to subtract from our summation of TVET spending in the table immediately above items which:
Are not the responsibility of either NDoE or OHE;
Are in the Development rather than the Recurrent Budget.
For 2012 that brings the total down from K199 million to K125 million which is:
2.0% of the corresponding GoPNG public expenditure aggregate50 for 2012; and
9.1% of the Revised Appropriation for Education in 2012 (K1,361 million). Calculations of TVET’s share of the Education Budget are much affected by the recent surge in provision for School Fee Subsidies which is much greater again in 2013, and will bring down TVET as a percentage share of the total.
49
Skilling the Pacific: Technical and Vocational Education and Training in the Pacific, Asia Development Bank and Pacific Islands Forum Secretariat, 2008. 50
Service delivery expenditure which is K6.123 billion for 2012 (see Budget Book 2013, Vol 1, Table 15). Service delivery expenditure excludes development expenditure and capital investment.
Institutional Recurrent 59.8% Institutional Capital 17.7%
Student Support 18.2% System Administration 4.5%

Research into the Financing of TVET in the Pacific PNG Country Report
119
There is another way to calculate TVET’s share of total Government expenditure which may align better with information available for countries participating in the overall study. As shown in Table 11.1, total GoPNG budget allocations to TVET (including allocations from donors) for 2012 were K149.3 million. The total GoPNG Budget for 2012 was K10,560 million. On this basis budget allocations to TVET were 1.4% of the total budget. The wide difference in TVET’s share between the two bases reflects the fact that the proportion of expenditure on development and capital investment which we can attribute to TVET is low. There may of course be more such expenditure on TVET than what we can attribute to TVET, but we just do not have the information about expenditures which provinces may have devoted to TVET from their own resources or non-specific GoPNG grants. For that same reason we cannot estimate the relative contributions of national and provincial governments to the support of TVET expenditure. The Research Brief gives as examples of quality related expenditures teaching and learning materials and assessment, and teacher/trainer professional development. The emphasis is thus probably mainly on non-staff expenditures. That said, we can identify some staff with a distinct quality role. The TVET Wing of NDoE has an inspections branch of 34 inspectors, and a budget of K773,000 in 2012. In 2013 it established a Co-ordination of Curriculum Branch with a budget of K1.5 million. The National Training Council has a Monitoring, Evaluation and Research Branch with an Assistant Director and four officers – but much of their time is taken up with maintenance of the register of training organisations. What the Team was able to find out about provision for quality-related non-staff costs is summarised at the end of Section 10.1 above. There is very little funding of this kind made available on a regular basis. The TVET Wing of NDoE scrapes together what it can from whatever GoPNG or donor sources happen to be available in a particular year. For that reason it does not seem feasible to calculate a specific proportion for quality related expenditure; it is low and variable.
11.2 IMPLEMENTATION OF THE TVET SECTOR BUDGET
The Research Brief requires us to address the question: To what extent is there a gap between budget allocation to TVET and expenditure? The obvious way to detect such gaps would be to compare the TVET budget for a given year with the accounts for the same year. So financial reporting is fundamental. It is most readily addressed in relation to NDoE responsibilities for TVET.
11.2.1 Financial reporting for TVET
In an ideal world NDoE would produce annual audited accounts. The accounts of the national institutions which form part of NDoE, including the TBCs, would be consolidated in the NDoE accounts. The accounts of the VTCs would be consolidated in the accounts of the provinces. There are no such accounts. So we have to rely on other sources of information. The NDoE does of course monitor the progress of expenditure each year against the Budget allocated to it. It conducts quarterly reviews of progress. So there is information there. In principle the actual expenditure as established at the end of the financial year is recorded in the Budget Book prepared in the following year.

Research into the Financing of TVET in the Pacific PNG Country Report
120
But as we have seen in the cases of Overseas Contract Officers and Capital Expenditure reported earlier in this Part the conventions under which Budget Actuals are prepared are looser than audited accounts would normally permit, or permit without disclosure. The unspent portion of the budget allocation for a capital program can be transferred to a trust account or special account and yet the Budget Book reports the whole allocation as spent; savings on the OCO budget lines can be transferred to other budget lines, but the Budget Book reports the whole OCO allocation as spent. In these two areas the Team happened to find significant gaps between budget allocations and expenditure, with actual expenditure in the budget year half or less than half the allocation. Two other sources of discontinuity between budget allocations for TVET and expenditure deserve mention:
Some of the donor funding for TVET is not earmarked as such in the Budget. For example Direct Funding Support from Australian Aid is a multi-purpose allocation, some of which may be spent on TVET but it is not so identified in the Budget;
NDoE may re-allocate savings on one Budget Head to another, for example creating in 2013 a fund for Quality Initiatives in Education which helped TVET from savings on School Subsidies. This type of re-allocation may be picked up in supplementary budgets and/or Annual Operational and Financial Plans, but the Team has not had access to supplementary budgets or actual-to-plan analyses for AOFPs.
Without improvements in financial reporting no-one can be confident about the width of the gap between budget allocations to TVET and expenditure. The previous paragraphs address the comparison between the GoPNG budget allocations for TVET and NDoE’s expenditure against those allocations. Institutional budgets and expenditures raise issues much wider than the GoPNG budget: TBCs fund the majority of their expenditure from fees, and VTCs also have other sources of income. So other means are needed to measure TVET expenditure in the system as a whole. The NDoE obtains from institutions returns of non-financial information, about student, and teacher numbers, and prepares and circulates statistics based on them. In principle some financials are also collected. The Team was given samples of monthly returns from VTCs which include expenditure, and understands that NDoE observers attending TBC governing council meetings also collect financial reports. But the material is not consolidated, or even systematically filed. It was not available for our research. We were not clear whether the TVET Wing uses it. As things stand, the only sources of consolidated information about institutional expenditure are special surveys like that done for the TVET Needs Analysis (Hind et al., 2011) or our own research. But these have their limits. Regular returns, with checking and feed-back, are needed to establish good record-keeping in institutions, as well as to monitor trends over time. In the absence of established routines institutions may just not have the information to respond accurately to surveys. Many institutions struggled to provide the basic information on income and expenditure called for through Tables 1 and Table 2 of the Study surveys.
11.2.2 Systemic risks relating to TVET expenditure
Even without financial reports it is possible to outline certain systemic risks relating to TVET expenditure in PNG. These risks are well known in PNG and considerable effort goes into mitigating them. But they remain significant.

Research into the Financing of TVET in the Pacific PNG Country Report
121
The team found significant differences between the numbers of teachers on the payroll and the numbers reported by the institutions. In our few Survey institutions the difference was generally in the direction of more teachers in the institution than on the payroll, but such large differences indicate risks of teachers not being paid, and scope to ghost the payroll. Centralised payroll arrangements also aggravate the risks that absenteeism will not be addressed, because local managements do not feel the same sense of responsibility to confront the problem when they are not paying for the teachers. Absenteeism was noted as an issue in the TVET Needs Analysis (Hind et al., 2011), and also to the Team by the Manager of a rural VTC. There is earlier literature about it in PNG. The NDoE pays per capita school fee subsidies direct to all Government schools in PNG, as well as to the VTCs. The risks of over-enrolment and fraud are obvious, especially given the recent steep rise in the value of subsidies. NDoE has taken a number of measures to mitigate the risk:
Electronic payments with banks required to match school account details to payment instructions;
Validation exercises to verify enrolment numbers;
Publication in the newspapers of supplements showing the amount of subsidy paid to every school and VTC.
Even so, the subsidy arrangements remain inherently vulnerable, as was illustrated by the very uneven knowledge of them found during the fieldwork in the provinces, and the differences between the national arrangements and the subsidy amounts reported as received.
11.2.3 Procurement of capital projects
Concerns about capital procurement are expressed in Sections 10.1 and 10.7 of the report. The Team are not capital procurement experts but it did appear to us that greater clarity about the roles and responsibilities of NDoE on the one hand, and the colleges on the other, and more procurement expertise need to be brought to bear if investment in the TBCs is to be increased. The parking in Special Accounts of funds unspent in year was expressly authorised by the Secretary of NDoE, but it remains unorthodox and risky. NDoE finance staff are taking steps to establish a trust deed and trust account, which, pending PNG’s adoption of multi-year budgeting, is the recognised way of safeguarding funds intended to be spent on capital development over a period of years.
11.2.4 Trusts
The Community Education Trust and the Skills Development Trust Fund both exercise control over substantial resources derived from official overseas aid and payments from PNG national and provincial governments, and given with a view to the provision of TVET for the disadvantaged in PNG. Neither trust is at present disclosing the financial information which would be needed to assess the propriety and efficiency of their expenditure. These trusts fall outside the normal arrangements by which the Department of Finance supervises trust accounts, but GoPNG may wish to consider requiring disclosure to safeguard the interests of the intended beneficiaries of the trusts. More broadly there seems to be an underlying rationale for a trust to run an endowment fund like SDTF which purchases TVET courses on behalf of people who do not have the resources to pay for them themselves. It is less easy to see why GoPNG needs a free-standing trust to build and fund community colleges when the NDoE provides similar services for other national education institutions.

Research into the Financing of TVET in the Pacific PNG Country Report
122
CHAPTER 12. UNIT COSTS OF TVET PROVISION This chapter provides a comparative analysis of the unit costs of TVET provision in PNG. These results are cross-tabulated against the following categories of TVET provider and course:
Provider types as they are traditionally recognised in PNG (e.g. Technical and
Business Colleges, Universities and other TVET providers, Registered Training
Organisations, Vocational Training Centres);
‘Families’ of TVET provider types as defined by the team (e.g. Universities, Business
Colleges, Trade technology, Pre-Apprenticeship & Apprenticeship Training, Smaller
Private Providers, Rural and Remote VTCs, Urban VTCs);
Fields of education as defined by the CEDEFOP Fields of Training; and
Province (e.g. National Capital District, Morobe, East New Britain, Western
Highlands, Madang, Central Province).
12.1 HOW UNIT COSTS WERE CALCULATED
Four unit cost measures were calculated for each of the TVET courses offered in 2012 by each of the providers covered by this survey:
Total / annual average cost per course
Cost per student enrolled in the course
Cost per student excluding boarding costs
Cost per graduate from the course
The tables and figures in this chapter are based on the information compiled by the institutions for the purposes of this study, using the data sheet templates provided. Whilst all providers were asked for the same core information, the templates included a few variations to allow for different circumstances e.g. boarding costs where boarders were present, use of rented premises in the private sector. Similar assumptions are made to convert the information provided by the institutions from their completed and returned data sheets:
Wherever possible teaching costs are allocated according to the distribution of teacher time between courses indicated by the Survey respondent. Where that is not possible, teaching costs are pro rata to the number of student hours or student weeks attributable to the course:
Non-teaching staff costs are allocated in proportion to teaching staff costs on the assumption that teaching / non-teaching staff ratios are common across courses;
Operating costs are allocated across courses on the basis of the number of student hours per course, on the assumption that these costs (teaching materials, consumables, utilities, etc) most directly relate to the demands of teaching; and
Development expenditure was allocated on the basis of teacher numbers, on the assumption that it was mostly on staff development.
Payroll data for the Technical and Business Colleges and Vocational Training Centres were provided for the period 2010-12 not by the institutions surveyed, but by the NDoE Payroll Division. The same scaling factors were applied in all years to adjust for differences in teacher numbers between the payroll and the survey of providers. The method by which unit costs were calculated for each provider is summarised in Table 12.1. There are minor variations in the method of calculation across providers and provider types owing to: availability of data; course structures, teaching arrangements etc. However, the same principles and rules were applied across the entire TVET system.

Research into the Financing of TVET in the Pacific PNG Country Report
123
Table 12.1 Unit cost methodology
Input data Process of calculating unit costs
All data is collected or estimated at course level Student data
Number of enrolments
Number of graduates
Course data
Number of weeks (where applicable)
Number of student contact hours
Teaching data
Number of teachers or FTE
Financial data
Teaching costs (including staff and curriculum development )
Non-teaching costs (e.g. general, admin)
Other operating expenditure (including or excluding boarding costs)
Step 1: Calculate share of student enrolment at course level, adjusted for course length (weeks or hours)
Number of students ÷ Number of weeks = Student week share
Step 2: Calculate average costs per teacher Expenditure on teaching staff ÷ Number of staff or Teaching staff FTE = Average costs per teacher
Step 3: Calculate teaching costs Number of teachers X Average cost per teacher = Teaching costs
Step 4: Calculate share of teachers at course level Number of teachers ÷ total number of teachers = Teacher share
Step 5: Calculate teaching on-costs Expenditure on general, admin staff + staff and curriculum development X teacher share = Teaching on-costs
Step 6: Calculate total staff costs Teaching costs + Teaching on-cost = Total staff costs
Step 7: Calculate Other operating expenditure (OOE) All other operating expenditure X Student week share (with or without boarding) = Other operating expenditure (OOE)
Step 8: Calculate Staff costs Other operating expenditure ÷ number of courses (if more than 1) = Cost per course
Step 9: Calculate cost per student/enrolment Cost per course ÷ number of students = Cost per student
Step 10: Calculate cost per graduate Cost per course ÷ number of graduates = Cost per graduate
PNG respondents generally had difficulty with the question about student contact hours. It was usually answered in terms of syllabus requirements that teachers be present during all periods of classroom and practical instruction. On that basis contact hours in public institutions emerged as long – 1200 hours per year was common and higher figures not infrequent. In response to questions institutions maintained that there was little or no scope for self-directed study. Some of the PNG survey returns permit the calculation of costs per training hour as declared by the respondent, but the data need further consideration and are not used in this report. Costs per graduate were obtained by dividing the total cost of the course in 2012 by the total number of graduates in 2012. For two year courses the total cost of the course was divided by two before division by the number of graduates: in other words our cost per graduate is an annual cost, not cumulative across the full duration of a multi-year course. Costs per graduate are expected to be higher than the cost per enrolment, reflecting numbers dropping out of the course and failures to qualify. However, some respondents recorded graduations for courses of one year or less as the same as enrolments. The team queried that where feasible. We have not given costs per graduate where the institution has recorded graduate numbers as the same as enrolments because they would be no different from costs per student. The costs per graduate which are given are less robust than cost per student.

Research into the Financing of TVET in the Pacific PNG Country Report
124
Boarding is common in public TVET institutions in PNG. Questions about boarder numbers and boarding costs were included in the TBC and VTC questionnaires and for one or two RTOs with significant boarder numbers. Some findings are reported below. For each provider who made a usable return to the Survey, the Team compiled a unit costs sheet for each provider grouped by provider type. These sheets appear as Annex 1. Costs per Enrolment and per Full-Time Equivalent Student
TVET institutions offer courses of varying lengths, and in full-time and part-time modes. The primary count of students is of enrolments – the sum of the students enrolled on all the courses offered over the period of the count. This can be used to derive costs per enrolment for each course, and by aggregation for the institution as a whole. The unit costs provided in the rest of this chapter are costs per enrolment. Where there are marked differences in course lengths and hours, enrolments and costs per enrolment can give a misleading impression of relative scale of training effort, and the funding required as between different institutions. Accordingly some countries have developed methods to assess the training load of students on short and part-time courses in terms of full-time equivalent (FTE) – the time taken by a full-time student to complete one year of study. FTE was not in use in PNG at the time of our surveys – and respondents had difficulty in converting part-time teachers to FTE where requested on the survey form. The Team could not systematically convert the enrolment data collected through our surveys to FTE, because:
The Survey data on student hours required for each course were of variable quality;
Enrolments were collected only for Semester 2 2012. Where courses lasting less
than a year were at issue, we could not accurately calculate the FTE for 2012 as a
whole.
However we have calculated as best we could from data on course lengths the number of FTE students for institutions recording short or part-time courses, and used that number in the data sheets at Annex 1 to provide costs per student and SSRs for the institutions as a whole. In this chapter Table 12.2 lays out the data on costs per enrolment at the providers surveyed, and Table 12.3 shows the difference arising from use of FTEs. Costs per enrolment are a valid measure for comparisons across courses of similar type delivered by different providers. If PNG wants in future to use student load as a means of measuring cost efficiency across institutions with different course patterns and as a basis for the equitable delivery of funding, a method to convert enrolments to FTE would be needed.

Research into the Financing of TVET in the Pacific PNG Country Report
125
12.2 UNIT COSTS AT DIFFERENT TYPES OF PROVIDER
Unit cost per student enrolment and graduate varies considerably by category of TVET provider:
For technical and business colleges the costs were K6,071 per student and K7,702
per graduate;
For registered training organisations they were K4,424 per student and K 4,194 per
graduate,51 bearing in mind that RTOs are a heterogeneous group;
For vocational training centres they were K1,905 per student and K3,228 per
graduate;
For the universities surveyed costs per enrolment emerged as K14,576. The cost
per graduate was K7,586 for the one university reporting graduate costs (DWU, for
courses conducted largely in distance mode, with short periods of residential study).
The university figures are largely driven by UNRE which has an unusual cost profile marked by very high numbers of non-teaching staff. There is other evidence that costs per student in universities are substantially higher. The University of Technology at Lae (UNITECH) was not surveyed, but gave the Team its own data about unit costs for field of study. Across six fields of study in which UNITECH had some diploma students the costs per student ranged from K17,800 to K21,100.
The cost per enrolment in the technical and business colleges is K6,071. Within this category of provider the range extends from PoMTech (K4,520).52 to Port Moresby Business College (K8,421). These rankings are not stable. In 2010 the TVET Needs Analysis found PoMTech the most expensive college, and Kokopo Business the cheapest. For our survey PoMBus turned out most expensive because we took full account of its unusually high costs for Overseas Contract Officers, and Kokopo Business was in the middle of the pack because of a temporary dip in enrolments in 2012.
Only three of the five TBCs surveyed – NPI Lae, Port Moresby Business and Kokopo Business supplied credible costs per graduate. At first sight those for Kokopo look anomalous; cost per student and cost per graduate are almost the same. But there is an explanation. There was a sudden dip in first year intakes in 2012 at Kokopo, following troubles at the college in 2011. As a result the college reported 511 students for 2012 and 296 graduates, despite offering mostly two year courses. Within their own categories, there is less variability across technical and business colleges and the vocational training centres than for registered training organisations. For RTOs, cost structures and the nature of course offerings are more variable than in other parts of the TVET sector.
51
The cost per graduate is less than the cost per student because one of the larger and higher cost providers – IEA College of TAFE – did not provide usable graduate data. 52
But PoMTech’s unit cost on an FTE basis is K6,843, as shown in Table 12.3.

Research into the Financing of TVET in the Pacific PNG Country Report
126
Table 12.2 Costs per enrolment, by provider types and provider name, Kina, 2012
Cost per institution
Cost per student
Cost per graduate
Technical and Business Colleges 22,517,405 6,071 7,702
National Polytechnic Institute, Lae 7,490,462 5,544 7,833
Kokopo Business College 3,239,794 6,340 6,343
Mt Hagen Technical College 2,666,104 7,982 6,645
Port Moresby Business College 4,926,170 8,421 10,178
Port Moresby Technical College 4,194,875 4,520 --
Universities and other TVET providers 13,992,630 14,576 7,586
Divine Word University 2,548,946 7,346 7,586
PNG UNRE 11,443,684 18,668 --
Registered Training Organisations 10,152,478 4,424 4,194*
Works Institute of Technology 2,125,133 13,711 17,858
OISCA 877,702 10,704 10,704
Innovative Training Centre 781,600 4,114 4,825
Elirana Electronic Technology School 129,960 2,652 2,652
PNG Power Training College 370,003 1,682 1,729
Highlands Youth Training & Rehabilitation Centre 509,999 1,203 1,594
Talleres de Nazareth 133,707 584 584
IEA College of TAFE 5,224,374 5,523 --
Vocational Training Centres 5,638,727 1,905 2,527
St Therese Vocational Training Centre 415,830 2,829 4,520
Vunamami Farmers Training Centre 1,632,008 1,981 4,132
Ogelbeng Vocational Training Centre 471,731 1,722 3,231
Kwikila Vocational Training Centre 498,564 2,168 2,432
Umi Vocational Training Centre 560,756 1,720 1,720
Badili Vocational Training Centre 834,914 1,327 1,432
Milmila Vocational Training Centre 479,198 3,112 --
Rebiamul Vocational Training Centre 745,726 1,983 --
Total 51,944,492 5,270 5,303
-- Data not provided * Cost per graduate for RTOs is less than cost per student because IEA data are included in the base for cost per student but not for cost per graduate.
Table 12.3 uses a similar format to show whole-of-institution enrolments and unit costs on an FTE basis. To explain some of the bigger differences:
PoMTech recorded 525 enrolments on apprenticeship extension courses lasting 8 weeks. As the semester was 20 weeks these were converted to FTE by multiplying by 8/20, making 210 FTE. The same conversion factor was used for PNG Power;
IEA College of TAFE reported all of its 2012 enrolments, of which far the most were on 1-semester courses. These were counted as 0.5 in the FTE calculation;
A number of institutions recorded some short courses which were reduced to FTE pro rata to course length. This effect was strong for e.g. Talleres de Nazareth which offers only courses lasting one or two months.

Research into the Financing of TVET in the Pacific PNG Country Report
127
Table 12.3 Estimated costs per full-time equivalent student
Cost per institution Enrolments
FTE Students
Cost per FTE Student
Technical and Business Colleges K22,517,405 3,709 3,386 K6,650
National Polytechnic Institute, Lae* K7,490,462 1351 1351 K5,544
Kokopo Business College* K3,239,794 511 511 K6,340
Mt Hagen Technical College K2,666,104 334 326 K8,178
Port Moresby Business College K4,926,170 585 585 K8,421
Port Moresby Technical College* K4,194,875 928 613 K6,843
Universities and other TVET providers K13,992,630 960 960 K14,576
Divine Word University K2,548,946 347
K7,346
PNG UNRE K11,443,684 613 613 K18,668
Registered Training Organisations K10,152,478 2,295 1,510 K6,723
Works Institute of Technology K2,125,133 155 135 K15,708
OISCA* K877,702 82 82 K10,704
Innovative Training Centre K781,600 190 156 K5,020
Elirana Electronic Technology School K129,960 49 49 K2,652
PNG Power Training College K370,003 220 88 K4,205
Highlands Youth Training & Rehabilitation Centre K509,999 424 409 K1,247
Talleres de Nazareth K133,707 229 64 K2,083
IEA College of TAFE K5,224,374 946 527 K9,913
Vocational Training Centres K5,638,727 2,960 2,816 K2,002
St Therese VTC K415,830 147 147 K2,829
Vunamami Farmers VTC* K1,632,008 824 824 K1,981
Ogelbeng VTC* K471,731 274 274 K1,722
Kwikila VTC* K498,564 230 230 K2,168
Umi VTC* (Campus students) K438,585 175 175 K2,506
Umi VTC (Distance students) K122,170 151 151 K809
Badili VTC K834,914 629 485 K1,721
Milmila VTC* K479,198 154 154 K3,112
Rebiamul VTC K745,726 376 376 K1,983
Total K51,944,492 9,924 8,672 K5,990
Notes:
Institutions marked with * admit boarders. See Table 12.6 for the impact of boarding on institutional unit costs.
Divine Word University offers diplomas which combine distance learning with short periods of residential study. We were not able to calculate a full-time equivalent. Similarly the distance students at Umi VTC are shown separately but with no attempt at conversion.

Research into the Financing of TVET in the Pacific PNG Country Report
128
Figure 12.1 Unit costs per enrolment, by provider types and provider name, Kina, 2012
Note. Works Institute of Technology sits within the Department of Works and had difficulty in separating its non-teaching costs from other costs of the DoW Training Branch, which may have led to overstatement of WIT’s costs. PNG Power Training College recorded teaching costs only because it could not separate out its non-teaching costs.
12.3 ‘FAMILIES’ OF PROVIDERS
To match providers with similar types of provision, the team assigned each provider to ‘families’ based on the type of course offerings, their scale of operations and their location. These groupings reveal a sub-division in the broader ‘Technical and Business College’ categorisation. Interestingly, there does not appear to be a marked difference between those categorised as ‘Business Colleges’ and those categorised as ‘Trade technology, pre-apprenticeship and apprenticeship training’ in terms of the unit cost per student and graduate. The per student cost in the business colleges was K6,436 compared to K5,647 in the trade category, while the per graduate cost in the business colleges K8,094 compared to K7,309 in the trades. Port Moresby Business College appears as an outlier mainly because half its teaching staff are Overseas Contract Officers paid much more than PNG nationals. Costs per student at IEA College of TAFE are mainly for 6-month courses.
0 10,000 20,000
National Polytechnic Institute, Lae
Kokopo Business College
Mt Hagen Technical College
Port Moresby Business College
Port Moresby Technical College
Divine Word University
PNG UNRE
Works Institute of Technology
OISCA
Innovative Training Center
Elirana Electronic Technology School
PNG Power Training College
Highlands Youth Training & Reh. Centre
Talleres de Nazareth
IEA College of TAFE
St Therese Vocational Training Center
Vunamami Farmers Training Centre
Ogelbeng Vocational Training Center
Kwikila Vocational Training Center
Umi Vocational Training Center
Badili Vocational Training Center
Milmila Vocational Training Center
Rebiamul Vocational Training Center
Cost per graduate
Cost per student
Vocational training centres
Registered training organisations
Universities
Technical and Business Colleges

Research into the Financing of TVET in the Pacific PNG Country Report
129
There is some difference when comparing rural and remote VTCs with urban VTCs. Not surprisingly, the costs in the rural and remote VTCs per student (K2,015) and graduate (K2,951) are higher than in urban VTCs. Size is significant. St Therese in Lae looks expensive for an urban VTC but at 150 students its enrolment is more typical of rural centres. Table 12.4 Unit costs, by type of provider, 2012 (Kina)
Total cost of
course Cost per student
Cost per graduate
Universities 13,992,631 14,576 7,586
PNG UNRE 11,443,685 18,668 --
Divine Word University 2,548,947 7,346 7,586
Business Colleges 14,593,771 6,436 8,094
IEA College of TAFE 5,224,374 5,523 --
Port Moresby Business College 4,926,170 8,421 10,178
Kokopo Business College* 2,883,046 6,340 6,343
National Polytechnic Institute, Lae 1,560,181 5,552 7,833
Trade tech, Pre-App. & App. Training 15,286,396 5,647 7,309
National Polytechnic Institute, Lae* 5,930,281 5,542 7,436
Port Moresby Technical College* 4,194,875 4,520 --
Mt Hagen Technical College 2,666,104 7,982 6,645
Works Institute of Technology 2,125,133 13,711 17,858
PNG Power Training College 370,003 1,682 1,729
Smaller Private Providers 2,432,968 2,498 2,890
OISCA 877,702 10,704 10,704
Innovative Training Centre 781,600 4,114 4,825
Highlands Youth Training & Rehab. Centre 509,999 1,203 1,594
Talleres de Nazareth 133,707 584 584
Elirana Electronic Technology School 129,960 2,652 2,652
Rural and Remote VTCs 3,642,257 2,015 2,951
Vunamami Farmers Training Centre* 1,632,008 1,981 4,132
Umi Vocational Training Centre* 560,756 1,720 1,720
Kwikila Vocational Training Centre* 498,564 2,168 2,432
Milmila Vocational Training Centre* 479,198 3,112 --
Ogelbeng Vocational Training Centre* 471,731 1,722 3,231
Urban VTCs 1,996,470 1,733 1,853
Badili Vocational Training Centre 834,915 1,327 1,432
Rebiamul Vocational Training Centre 745,726 1,983 --
St Therese Vocational Training Centre 415,830 2,829 4,520
Total 51,944,492 5,270 5,303
* Includes boarding costs -- Data not provided

Research into the Financing of TVET in the Pacific PNG Country Report
130
Figure 12.2 Unit costs, by ‘family type’ and provider name, Kina, 2012
12.4 FIELDS OF TRAINING
An analysis of course-level data codified by CEDEFOP field of training appears as Table 12.5. Taking courses delivered by all types of provider, it reveals differences in unit costs as follows:
For fields of study for which there are data for 20 or more courses, costs per student
range from K3,870 for Engineering, Manufacturing and Construction up to K5,557 for
Social Sciences, Business and Law;
For Education the unit cost is K7,557 based on two courses.
Only a few of the institutions surveyed offered training in Agriculture. In the university and RTO sectors Agriculture shows up as far the most expensive course, but that may be in part because of the cost structures of UNRE and OISCA rather than for reasons intrinsic to agricultural training. Among the VTCs the agricultural training provided by Vunamami Farmers’ Training Centre shows up as well above average in cost, but not nearly as much of an outlier.
0 10,000 20,000
PNG UNRE
Divine Word University
IEA College of TAFE
Port Moresby Business College
Kokopo Business College
National Polytechnic Institute, Lae
National Polytechnic Institute, Lae
Port Moresby Technical College
Mt Hagen Technical College
Works Institute of Technology
PNG Power Training College
OISCA
Innovative Training Center
Highlands Youth Training & Rehab. Centre
Talleres de Nazareth
Elirana Electronic Technology School
Vunamami Farmers Training Centre
Umi Vocational Training Center
Kwikila Vocational Training Center
Milmila Vocational Training Center
Ogelbeng Vocational Training Center
Badili Vocational Training Center
Rebiamul Vocational Training Center
St Therese Vocational Training Center
Cost per graduate
Cost per student
Urban VTCs
Rural and remote VTCs
Trade tech, Pre-App. & App. Training
Business Colleges
Smaller private providers
Universities

Research into the Financing of TVET in the Pacific PNG Country Report
131
Table 12.5 Unit costs, by CEDEFOP field of training, Kina, 2012
CEDEFOP field of training (count of courses)
Total cost of courses
Enrolments Graduates Cost per student
Cost per graduate
Agriculture (8 courses) 12,756,144 860 170 14,833 7,442**
Education (2 courses) 657,490 87 -- 7,557 --
Engineering, manufacturing and construction (106 courses)
17,350,743 4,483 2,315 3,870 4,844
Science (16 courses) 4,163,479 845 409 4,927 10,167
Services (22 courses) 3,852,976 1,087 819 3,545 4,586
Social sciences, business and law (50 courses)
13,041,490 2,411 1,637 5,557 8,073
Other / nfd (2 courses)* 122,170 151 151 809 809
Total (206 courses) 51,944,492 9,924 5,501 5,270 5,303
* Includes extension and TTC courses where field is not defined ** Data not provided for UNRE
These same data can be presented graphically:
Figure 12.3 Unit costs, by CEDEFOP field of training, Kina, 2012
However, much of the apparent variability between fields of study shown in Table 12.5 and Figure 12.3 is due to combining data for fields of study across different types of institution with different cost structures. By cross-tabulating provider type with CEDEFOP field as in Table 12.6, unit costs by field of training can be viewed more clearly. For example, there is a similar cost per student in the most offered field of training, Engineering, between the technical and business colleges (K5,782 per student) and the registered training organisations (K5,558) – although the cost in the VTCs is markedly lower (K1,783), reflecting more modest course aims and content in the VTCs. As noted above, there is little variation in unit costs per student by field of training within the TBC and VTC categories. The differences with the university and RTO categories are more marked. It could be expected that engineering-type courses would cost significantly more per student than program in the social sciences, business and law, because equipment and
0
2,000,000
4,000,000
6,000,000
8,000,000
10,000,000
12,000,000
14,000,000
16,000,000
18,000,000
20,000,000
0
2,000
4,000
6,000
8,000
10,000
12,000
14,000
16,000
Engi
nee
rin
g et
c
Soci
al s
cien
ces
etc
Agr
icu
ltu
re
Scie
nce
Serv
ices
Edu
cati
on
Oth
er /
nfd
Cost per student
Cost per graduate
Total cost of course

Research into the Financing of TVET in the Pacific PNG Country Report
132
accommodation are more expensive, and staffing ratios would generally be lower. No such systematic differentiation appears in the PNG data. Accommodation and equipment for workshop-type courses in PNG are often very basic, and staffing ratios do not seem to vary much between fields of training. Table 12.6 Unit costs, by provider type and CEDEFOP field of training, 2012 (Kina)
Cost per field Cost per student Cost per graduate
Technical and Business Colleges 22,160,657 6,071 7,702
Engineering, manufacturing and construction 11,449,066 5,782 8,407
Science 2,166,994 6,174 7,895
Services 1,960,144 6,556 7,575
Social sciences, business and law 6,584,453 6,433 7,145
Universities and other TVET providers 13,992,630 14,576 7,586
Agriculture 11,443,684 18,668 --
Services 351,526 10,044 7,989
Social sciences, business and law 2,197,420 7,043 7,525
Registered Training Organisations 10,152,478 4,424 4,194
Agriculture 877,702 10,704 10,704
Education 657,490 7,557 --
Engineering, manufacturing and construction 2,117,424 5,558 5,723
Science 1,880,574 4,236 3,283
Services 685,223 1,705 756
Social sciences, business and law 3,934,065 4,376 4,274
Vocational Training Centres 5,638,727 1,905 2,527
Agriculture 434,758 2,635 4,403
Engineering, manufacturing and construction 3,784,253 1,783 2,390
Science 115,911 2,318 2,696
Services 856,083 2,439 3,560
Social sciences, business and law 325,552 2,691 3,198
Other / nfd 122,170 809 809
Total 51,944,492 5,270 5,303
-- Data not provided / not of sufficient quality
The unit cost data are presented graphically in Figure 12.4.

Research into the Financing of TVET in the Pacific PNG Country Report
133
Figure 12.4 Unit costs, by provider type and CEDEFOP field of training, Kina, 2012
12.5 PROVINCES
Geographic spread of TVET provision is an important issue in PNG. By cross-tabulating provider type with PNG province, the cost of provision by geographic area is brought into focus. For example:
Within the Technical and Business Colleges category, the unit cost per student is
higher in the Western Highlands (K7,982) than in the National Capital (K6,028) and
Morobe (K5,544); and
Among the vocational training centres, the per student costs are highest in Central
Province (K2,168) and East New Britain (K2,159) and lowest in Western Highlands
(1,873) and the National Capital (K1,327).
No clear pattern emerges across the three categories TBCs, RTOs and VTCs as to which is the most, or least, expensive province in which to run a TVET institution. Numbers of institutions per category per province in our survey are so small that exogenous variations between individual institutions are likely to swamp any effect arising from location. Interpretation of cost differentials by province would in any event require care. GoPNG funding is fairly uniform across PNG. Cost differences between institutions can reflect differences in population density or educational participation (leading to variations in size of institutions), or differences in the capacity or willingness of provinces or districts to add to GoPNG funding; also ease of recruitment of staff, as vacancies depress costs. Factors of these kinds are probably the most significant for the differences observed in our surveys.
0 10,000 20,000
Engineering, manufacturing and construction
Science
Services
Social sciences, business and law
Agriculture
Services
Social sciences, business and law
Agriculture
Education
Engineering, manufacturing and construction
Science
Services
Social sciences, business and law
Agriculture
Engineering, manufacturing and construction
Science
Services
Social sciences, business and law
Other / nfd
Cost per graduate
Cost per student
Vocational training centres
Registered training organisations
Universities
Technical and Business Colleges

Research into the Financing of TVET in the Pacific PNG Country Report
134
In PNG price differentials between districts can be significant, mainly because of high transport costs. The National Economic and Fiscal Commission has developed a methodology for assessing these differentials. To some extent the distribution of GoPNG funding to provinces and districts takes account of this methodology. To give some idea of the width of differentials, the 2007 Study of School and VTC Unit Costs53 used the NEFC’s work to sort districts into Low, Medium and High Cost in terms of baskets of goods and services typically required in schools. The price level for the Low Cost Group was set at 100; for the Medium Cost Group it was 109, and for the High Cost Group it was 118. The absence of systematic differentiation between costs in Highlands and Islands compared with costs around NCD and Morobe, may indicate that the outlying areas are not fully compensated for higher costs. Table 12.7 Unit costs, by provider type and province, Kina, 2012
Total cost of course Cost per student
Technical and Business Colleges 22,160,657 6,071
National Capital District 9,121,045 6,028
Morobe 7,490,462 5,544
East New Britain 2,883,046 6,340
Western Highlands 2,666,104 7,982
Universities and other TVET providers 13,992,630 14,576
East New Britain 11,443,684 18,668
Madang 2,548,946 7,346
Registered Training Organisations 10,152,478 4,424
National Capital District 7,853,217 5,067
East New Britain 781,600 4,114
Morobe 1,007,662 7,692
Western Highlands 509,999 1,203
Vocational Training Centres 5,638,727 1,905
Central Province 498,564 2,168
National Capital District 834,914 1,327
Morobe 976,586 2,065
East New Britain 2,111,206 2,159
Western Highlands 1,217,457 1,873
Total 51,944,492 5,270
-- Data not provided / not of sufficient quality
53
Papua New Guinea, A Study of the Unit Costs of Education, PDP Australia March 2007.

Research into the Financing of TVET in the Pacific PNG Country Report
135
Figure 12.5 Unit costs, by provider type and province, Kina, 2012
12.6 ADDITIONAL COSTS OF BOARDING STUDENTS
Boarding costs are a significant component of the total costs of TVET provision in PNG. The sampled group of RTOs provided some indication of the additional costs of boarding to overall operational costs. Some of the answers originally returned to the Survey question about board and lodging expenditure appeared arbitrary. Exchanges with the providers indicated that some respondents were having great difficulty in estimating their boarding expenditure. With that caveat, the data indicate that the additional unit cost per student among the TBCs for boarding students ranges between K847 to K1,350. This is substantially higher than the surveyed VTCs where these additional costs ranged from K104 to K728 per student. The big differential between TBCs and VTCs reflects funding arrangements: for 2012 the NEB approved Board and Lodging Fees of K1890 for TBCs, and K400 for VTCs. This additional unit cost of boarding measures the amount of the total cost per enrolment which can be accounted for by the presence of some boarding students at the institution. It is not a measure of the additional cost of the individual boarder, which is discussed in Table 10.8
0 5,000 10,000 15,000 20,000
National Capital District
Morobe
East New Britain
Western Highlands
East New Britain
Madang
National Capital District
East New Britain
Morobe
Western Highlands
Central Province
National Capital District
Morobe
East New Britain
Western Highlands
Cost per student
Vocational training centres
Registered training organisations
Universities
Technical and Business Colleges

Research into the Financing of TVET in the Pacific PNG Country Report
136
Table 12.8 Impact of boarding on institutional unit costs, Kina, 2012
Cost per student including boarding
Cost per student excluding boarding
Cost of boarding
component
Technical and Business Colleges 5,350 4,194 1,155
Kokopo Business College 6,340 5,139 1,201
National Polytechnic Institute, Lae 5,544 4,194 1,350
Port Moresby Technical College 4,520 3,674 847
Vocational Training Centres 2,015 1,516 498
Kwikila Vocational Training Centre 2,168 1,646 522
Milmila Vocational Training Centre 3,112 2,653 459
Ogelbeng Vocational Training Centre 1,722 1,445 277
Umi Vocational Training Centre 1,720 1,616 104
Vunamami Farmers Training Centre 1,981 1,252 728
Registered Training Organisations 10,704 9,717 987
OISCA 10,704 9,717 987
Average of providers with boarding option 4,155 3,257 898
Figure 12.6 Unit costs, costs of boarding by provider, Kina, 2012
0 10,000 20,000
OISCA
Kokopo Business College
National Polytechnic Institute, Lae
Port Moresby Technical College
Kwikila Vocational Training Center
Milmila Vocational Training Center
Ogelbeng Vocational Training Center
Umi Vocational Training Center
Vunamami Farmers Training Centre
Cost per student excluding boarding
Additional cost per student of boarding
Vocational training centres
Registered training organisations
Technical and Business Colleges

PART V: ISSUES AND FUTURE DIRECTIONS


Research into the Financing of TVET in the Pacific PNG Country Report
139
CHAPTER 13. ISSUES AND FUTURE DIRECTIONS This chapter sets out some broad issues arising from the research, and suggests future directions for the development of policy of TVET funding, and on other issues relevant to funding effectiveness.
13.1 ISSUES
A. Expansion in demand
PNG is experiencing rapid growth in the age group most likely to seek pre-employment TVET, and in participation in the school grades which give access to TVET and to higher education. Taking the demographic effect alone, the numbers of people aged 15-24 is projected to grow by 40% between 2010 and 2015. The recent abolition of school tuition fees is likely to accelerate these trends. Older people, who did not have the chance to get vocational qualifications in their youth or need to renew their skills, also seek TVET. A number of enterprises see the need to upgrade workforce skills in order to take advantage of new opportunities. The costs of meeting the increased demand for tertiary education – in universities as well as TVET – will be very high. How those costs are shared between the taxpayers, the students and employers will have important implications for the level of demand, for equity and the effectiveness of training.
B. TVET pathways and qualification structures
Ideally young people seeking vocational qualifications would have clear pathways open to them so that they could proceed through entry-level courses in schools and VTCs, to higher levels of certification and diplomas at the technical colleges, and degrees in the universities, as well as having multiple points of entry to the labour market. The same framework of qualifications would apply to the private sector, so that students have choices between public and private provision as they climb the ladder of vocational qualification. This concept is well understood in PNG but the qualification structures to underpin it are not yet fully in place. The PNGQF-TVET, jointly owned by the NTC and the NDoE, offers competency-based training at the standard four levels of certificate and two levels of diploma, but:
NC1 and NC2 are not yet the standard entry-level qualifications either in VTCs or in the RTOs which cater for new entrants to the system;
there are very few courses as yet in the public colleges at National Certificate 3 or Certificate 4 levels. Certificate 2 completers find that their pathway has petered out; and
Alongside the PNGQF-TVET there is a parallel system (Level 1, Level 2 and Level 3) used for apprentice training and trade tests. Recommendations from previous studies to examine the alignment of apprenticeship training with PNGQF-TVET do not appear to have been implemented

Research into the Financing of TVET in the Pacific PNG Country Report
140
The PNGNQF, which applies to higher education, is owned by the Commission for Higher Education. It too offers four levels of certificate and two of diploma, but the level descriptors are different from those in the PNGQF-TVET. PNGNQF, unlike PNGQF-TVET, includes criteria for the length of course. Articulation from the one framework to the other is not assured, but subject to the caveat ‘Bridging Studies if Required’. These are in effect two separate sector-based qualification frameworks, neither of which is aligned to international qualifications frameworks. As reported by many stakeholders, the existence of separate qualification frameworks and their lack of international recognition causes confusion and limits opportunities for people from PNG. Within the TVET sector there are still major challenges to introduce PNGQF-TVET qualifications in all relevant levels and fields of study, and to fund the teaching of them by appropriately trained teachers using suitable accommodation, learning resources and equipment.
C. The boundaries of TVET
The public TVET system is usually thought of in PNG as TBCs and the VTCs, with the technical schools and community colleges as new entrants to field. The one national polytechnic at Lae combines the business and trade technology fields of study taught in the TBCs, but does not go much beyond them. The institutions are generally small by international standards. There are many publicly funded institutions delivering vocational qualifications below Bachelor level; primary teachers colleges, nursing colleges, specialist providers of ports training, maritime training and in some cases universities. Some of these are sited adjacent to members of the current TVET system. There are thus opportunities to explore whether the establishment of further polytechnics or centres of excellence which transcend the current institutional boundaries might deliver valuable synergies which would raise the quality of what could be delivered for any given level of funding. There is also a boundary issue relating to the vocational training centres, and potentially the community colleges. Are the VTCs a part of general education alongside the secondary schools, or are they TVET providers? The policy of the TVET Wing of NDoE is to steer them gradually towards the PNGQF-TVET courses characteristic of TVET providers. But within the standard depiction of the National Education System they appear as a pathway parallel to secondary schools. They are funded in the same way as lower secondary schools, including as from 2013 100% Government subsidy of tuition fees. If free tuition leads to a large expansion of lower secondary education, the original rationale for the VTCs is undermined. To re-establish the VTCs as providers of competency-based TVET will be expensive. There is also a competition issue. If courses for National Certificates1 and 2 are free at VTCs and subject to substantial fees at TBCs and private providers, there are risks of unfairness to private providers, and a loss of fee income which adds to the burden on the PNG taxpayer of sustaining the system. The risks are small at the moment, because there are not many PNGQF-TVET courses in the VTCs, but that is the direction in which the system is heading.
D. Governance of the TVET system and overview of funding priorities
We set out in Table 4.1 the complex arrangements through which the NDoE, NTC, OHE and NATTB share responsibilities for the supervision of the TVET system. The search for simpler and more unified arrangements has been going on for some years. The matter lay outside the scope of the present study. But it is pervasive, applying for example just as much to funding issues, as to qualification frameworks.

Research into the Financing of TVET in the Pacific PNG Country Report
141
Resources are allocated as they are as the result of ad hoc decisions taken by a number of different stakeholders responding to the pressures as they perceived them. PNG stakeholders recognise the rationale for the individual elements of the budget allocation, but no one party ever had the opportunity or power to look at the picture as a whole. Perhaps in consequence of this fragmentation of governance there is no sector-wide strategy for TVET which engages employers and builds on industry needs, includes the private sector, and defines the respective roles of GoPNG and provinces in the delivery and supervision of TVET. Responsibility for structured training for the informal economy remains unclear.
E. Access to TVET and the role of provinces
There is a growing demand for access to TVET nearer home. ‘A polytechnic in every region, a TBC in every province, a VTC and a community college in every district’ are all popular cries, and hard to gainsay within the PNG political system. There is much to be said for them in terms of equity for students, making TVET responsive to local needs, and reducing boarding and travel costs. But the sustainability of a much larger network of TVET institutions, and the roles of the provinces and other players, are at issue. If a province is able to get a TBC established in its area as a national institution simply by offering some unmodernised premises for the purpose and on the basis that GoPNG will take responsibility for all costs going forward, then it is an easy option for the province. That seems to be more or less what has been happening up to now. A province is more likely to assess the local demand for TVET carefully if it is required to take a larger financial stake in the new college, and such an approach is consistent with the current government’s initiative in resourcing provinces and districts to play a much bigger part in infrastructure investment. One large private provider has offered to establish campuses on a public-private partnership basis with provinces willing to provide premises and pay for their maintenance and utilities. Courses will be within the Australian Qualifications Framework. Teaching costs would be covered by fees, preferably with some input of scholarships by the province. Agreements have already been reached with two provinces to proceed on this basis. Such partnerships between provinces and the private sector offer another way to share responsibility and risk, rather than putting the whole burden on the national budget. The VTCs already constitute a wide network, though not yet one in every district. To judge from the data on VTC students per thousand population, there is much variation between provinces in their commitment to the VTC concept. Perhaps one thing which the community college pilots need to establish is what these colleges have to offer to their client group, including the rural disadvantaged and those seeking a second chance in education, and whether that offer is better delivered through a separate network of colleges, or main-streamed through the vocational training centres. The national roll-out of yet another institutional type and funding modality would need a firm rationale. Rural disadvantage is an important issue for PNG. So too is educational access for females. Women form about one-third of TVET students, varying from about half in business and hospitality, to very low proportions in some areas of trade technology, and in apprentice training. In part this is an issue which needs to be addressed earlier in the educational cycle – fewer girls obtain the school grades needed to enter the TVET system. But scholarships and other incentives may have a part to play in encouraging more female entrants to pre-employment training in trade technology, and to apprenticeships.

Research into the Financing of TVET in the Pacific PNG Country Report
142
F. Employers and demand-driven TVET
It lay outside our scope to examine how employers make input to TVET qualifications and the governance of TVET institutions. Those who have done so report a level of disengagement, which the response to our approaches to employers tends to confirm. We did observe that many employers seem unhappy with the quality of publicly funded TVET, some to the extent that they have organised their own extension courses for apprentices rather than send them to the technical colleges. Where these courses are open to apprentices from other firms, the fees are much higher than the TBCs are permitted to charge for such courses. This situation indicates that employers are willing to pay more for courses taught on modern equipment and by well-motivated, business-oriented staff.
G. The role of fees and student support
In 2013 the fee for a full year of study at a TBC was K5930 for a boarding student, K3755 for a day student. GDP per capita is about K5000. So fees are a heavy burden on the average family unless the student gets a scholarship. At a private college delivering qualifications equivalent to PNQF-TVET qualifications the fees would be similar to the TBC level or higher. University fees are slightly higher than TBC fees. As things stand about one-third of TBC students get HECAS support which covers about one-third of the boarding fee. Many more, and more valuable, HECAS awards are available to the university sector. Private colleges can offer HECAS scholarships only if they are recognised as institutions of higher education, which few are. Currently GoPNG spends three times as much on a special scheme – Independence Fellowships – for the rural disadvantaged as it does on HECAS for TVET students. Some students not on HECAS are able to obtain scholarships from their home province or other sources, but many cannot. In 2013 expenditure on TVET scholarships by provinces and other local sources was much greater than the cost to GoPNG of HECAS. In principle loans are an option for making student support more widely available and moderating the taxpayer cost. But an effective mechanism to recover loans in the PNG context has yet to be found. Meanwhile issues for GoPNG include:
to clarify whether support for TVET students is a national or local responsibility;
whether to base eligibility for support as now on the type of institution attended, or on the type of TVET course undertaken;
whether to put more resource into TVET student support, or keep it roughly at the present level, on the grounds that the priority for any additional resource should be teaching; and
whether to make access to student support more equal between universities, public TVET institutions and private TVET providers.
H. A broader base of funding
Governments seeking to broaden the funding base of a public service may rein back their own commitment, and then watch what happens; if the service is valued other parties may come in to support it, or supply alternatives. In effect, GoPNG has done that with TVET. The private sector has expanded its enrolments in business studies and allied fields, a number of employers have opened up courses for apprentices, and some provinces have started scholarship schemes. It would be consistent with such a strategy to deregulate TBC fees, or at least raise the fee limits annually in line with price changes. In practice the NEB has been reluctant to agree to fee increases because of the impact on families, which could be tempered by the introduction of additional needs-based scholarships. As things stand, with a squeeze on public funding and erosion of fees in real terms, the public colleges have suffered a loss of quality and esteem.

Research into the Financing of TVET in the Pacific PNG Country Report
143
The training levy has had modest success in its present form. It imposes on the IRC a heavy burden for the assessment of qualifying training expenses. There is a need for much greater transparency about the yield of the levy and about the procedures for allocating it, and for an analysis of whether it serves to increase the training undertaken by employers incurring qualifying training expenses. The Training Assistance Fund resourced from the levy is the only funding source for some TVET needs, notably to assist the smaller RTOs to retrain staff and re-equip for the introduction of courses under PNGNQF-TVET. The universities have found that it is feasible to put on distance education TVET courses and other provision for post experience students at fees which at least cover costs. The TBCs may have some scope to do the same.
I. Structured training for the informal economy
This kind of training depends for the most part on the initiative of non-government organisations and entrepreneurs, often working in partnership with VTCs and private providers. The NGOs source funding from the provinces (at least in NCD), directly from donors or, in the case of SDTF, via an endowment fund. IATP offers another model in the Islands Region, with provinces paying for training on behalf of farmers. In the main, GoPNG is not greatly involved in training for the informal economy – indeed it is not clear whose responsibility it would be to take the initiative. The exception is the Independence Fellowship Scheme which pays for longer courses than most other providers, designed to equip the rural disadvantaged to establish projects (in effect micro-businesses).
There is much more training of this type than we were able to see, and many more stakeholders are involved. The issue is how to replicate the good practice and make it more widely available in PNG. This needs strong backing to get going on a significant scale, as the GGBDF and IATP examples show. There may be a role for GoPNG in this regard by: publicising the achievements of the best schemes and working with donors to bring entrepreneurs and backers together in provinces where that is not yet happening; and assuring quality and accountability where GoPNG funds or overseas aid is used to support the sector.
J. Information and data
Good information and data about TVET are needed by:
governments, national and provincial, to formulate policies, and to carry them through;
institutions to manage their affairs and improve their operations;
students to make informed choices; and
employers to help recruit skilled employees.
Information gathering is conducted for public sector TVET by the NDoE and the OHE who are running parallel statistical collections which lack common standards and have uneven coverage. As a result it is difficult to get basic information on student, lecturer and graduate numbers, fields and levels of study. Simple indicators like SSR, cost per FTE student and cost per graduate are hard to generate. Obtaining data from the providers is not easy. Both NDoE and OHE have to run their data collections on slim resources. On the face of it, both organisations stand to gain from closer collaboration. TVET statistics should in principle cover the private as well as the public sector. As things stand, just keeping the Register of Training Organisations is an exacting task for the NTC.

Research into the Financing of TVET in the Pacific PNG Country Report
144
There is still much to do to publish a comprehensive register and keep it up to date. The NTC website is attractive and, within its limits, informative. But NTC staffing appears much tighter than that of NDoE TVET Wing or OHE. As well as statistics about TVET, the planning of TVET needs good labour market information. There are no regular statistics about the PNG labour market – a gap which needs to be filled for reasons which go much wider than TVET. Meanwhile NDoE and OHE have shown interest in tracer studies, to follow the progress of their graduates into their first destination after graduation. Tracer studies could be valuable in improving the fit between the output of the TVET system and the needs of employers. It is to be hoped that the data compiled and collected for this study can provide a baseline of key indicators that can be progressively added to over time. However, to achieve this objective will require data collection standards and methods to be properly resourced and managed at central, provincial and institutional levels. Ideally, data gathering and dissemination should be the responsibility of a single body, with an overview of the TVET sector and able to publish at least annual statistics for the whole sector. Information distribution remains hard in PNG. Mobile phones have made things easier than they used to be, but access to Internet, though much improved, is still difficult in some areas. The postal service can be unreliable. Information flows with the small network of TBCs mostly in the larger towns and supported by NDoE’s inspector network are reasonably good. It is harder to keep up with the VTCs and the RTOs. For example, the Team found that most of the VTCs visited in Morobe, East New Britain and Western Highlands did not know that tuition was free in 2013, and provincial governments were not always well-placed to advise them. It is hard for the small NTC staff in Port Moresby to be sure whether the smaller RTOs in the provinces are operating, and at what address. Websites are now a primary means of communication. Effort has been made through the NDoE website to inform the system and the public about TVET – each TBC has its own web-page on the site – but it is patchy and less effective than it could be. Websites alone will not reach the outlying providers. One way of doing that it would be to strengthen the role in TVET of the provincial divisions of education.
13.2 FUTURE DIRECTIONS
The TVET system needs to offer pathways and opportunities to obtain vocational qualifications of an assured quality and relevance to the national economy, in both its formal and informal sectors. To achieve that requires the active collaboration of employers, providers both public and private, and governments both national and provincial, as well as the engagement of students. With that end in view, the team suggests the following directions for the continuing development of a sustainably funded TVET system in PNG.
Simpler and more unified arrangements for GoPNG’s role in the regulation, funding and quality assurance of the TVET system need to be put in place, as the key stake-holders already acknowledge. Without that, piecemeal reforms may founder.
Resources for TVET appear dispersed across too many different initiatives. Unified supervision arrangements should include a capability to assess funding priorities for the TVET sector as a whole.
The contributions of government grants and course fees to the funding of higher-level pre-employment TVET need to be clarified. At present TBC grants cover a narrower range of items than university grants, and require TBCs to raise a higher proportion of their income through fees.

Research into the Financing of TVET in the Pacific PNG Country Report
145
There also needs to be a coherent policy on qualifications and fees across the VTCs, the community colleges and the smaller RTOs, all of whom cater for local demands for entry-level TVET. If all three kinds of provider are being pressed to standardise their offer around NC1 and NC2, it is inequitable and potentially costly to the taxpayer to pay subsidies to VTCs to make these courses fee-free, but not to the other providers.
There is scope to recover a higher proportion of the cost of TVET for people in work from their employers through higher fees, if quality concerns are met.
The existing training levy in PNG is not working well. But in other developing countries other forms of training levy have proved their worth in sharing the cost of training and increasing its quantity. PNG might review its training levy with a view to clarifying the objectives, simplifying the method of collection, and enhancing transparency.
The roles of GoPNG and provinces in providing scholarships for TVET might be reviewed, perhaps with a view to a locally administered scheme with a common structure. Resources for student support are limited. But it would promote competition and choice if government scholarships were open on equal terms for specified courses across public and private providers.
The funding of expenditures related to the quality of TVET – such as the development of occupational standards, training packages, curriculum and teacher training – is low and dependent on whatever opportunities are found from year-to- year. It needs to be put on a more secure basis.
The establishment of TBCs in more provinces has already begun, and offers strong potential. But it will be expensive, and GoPNG may wish to ensure that provinces seeking a TBC in their area pay a substantial share of the establishment cost.
Partnerships between provincial governments and private providers offering properly accredited qualifications are an alternative way to supply TVET in more provinces, particularly in fields such as business and tourism and hospitality. Such partnerships should be encouraged as promoting cost-sharing and diversity.
VTCs and private providers already supply TVET at district level, and community colleges are beginning to do so. Enhancements to provision need to be based on assessments of need and sustainability in the local context, including whether separate VTC and community college provision is effective and sustainable.
There is potential to enhance value for money by better planning and procurement of capital works, notably by giving institutions a fuller say in planning new buildings, and adherence to proper tendering procedures.
The information base for making TVET policy and monitoring progress is fragmented and particularly weak on data standards, and the whole field of financial statistics. Through collaboration the agencies concerned could make some improvements in data collection, dissemination and use now. Further opportunities would open up within more unified arrangements for GoPNG regulation of the TVET sector.
The report has also indentified a number of day-to-day improvements in data about TVET, and in administration, that could be implemented relatively quickly. These are listed in Table 13.1.

Research into the Financing of TVET in the Pacific PNG Country Report
146
Table 13.1 Proposed initiatives to improve TVET administration and data
Section of the Report
Issue Proposed initiative
3.3 and 3.5 Census data. NSO analyses age-structure from the PNG Census 2011, and labour market data. NDoE and NTC use such data to project future population in main TVET age-groups, and to clarify the structure of PNG work-force.
5.1 TBC enrolments and graduations
NDoE and OHE collaborate to align their collections of TBC enrolments, to improve graduation statistics, and to initiate tracer studies of the first destination of graduates.
5.3 VTC statistics NDoE publishes more up-to-date statistics for VTCs, and extend the collection to cover community colleges.
5.5 and 10.9
RTO statistics NTC focuses in the short term on preparing and posting an up-to-date register of institutions and courses. In longer term, NTC could aim for a statistics collection for RTOs on the same footing as for public providers
10.1 Overseas Contract Officers
NDoE reviews the deployment of OCOs which appears skewed towards one college.
10.1 Capital funding NDoE ensures that capital funds allocated in the budget for a specific year and expended over several years, are safeguarded for the intended use through rigorous trust accounts.
11.2 Financial data from institutions
NDoE makes the collection of financial information from TBCs and VTCs more systematic, and ensures the data are more extensively analysed and reported. NTC does likewise with financial data from RTOs.
11.2 Trusts GoPNG requires the Skills Development Trust Fund and the Community Education Trust to publish annual reports and audited accounts.

ANNEXES (SUPPORTING INFORMATION)


Research into the Financing of TVET in the Pacific PNG Country Report
149
ANNEX 1. UNIT COSTS OF TRAINING
This Annex gives a sheet of basic data and unit cost information for each of the twenty-three institutions successfully surveyed during Phase 2 of the Study in PNG, plus one for the University of Technology at Lae, which was not surveyed but volunteered some unit cost information calculated under its own methodology. The sheets are arranged by provider type:
1. Technical and Business Colleges 2. Vocational Training Centres 3. Registered Training Organisations 4. Universities

Research into the Financing of TVET in the Pacific PNG Country Report
150
TECHNICAL AND BUSINESS COLLEGES
Port Moresby Technical College National Capital District
1 Number of students (FTE) 613 2 Student to staff ratio 13.2 3 Cost per FTE student K6,843 4 Cost per student excluding boarding K5,561 5 Average cost per teacher K35,334 6 Total Fee Income as a percentage of Total Recurrent Income 59.9% 7 Fees paid by Self-Sponsored Students as a percentage of Total Fee Income 44.4%
TVET program/course name and description Duration,
weeks Cost per
course Cost per student
Cost per student exc
boarding
Apprenticeship Extension
Maintenance Fitting & Machining 8 K133,770 K4,224 K3,175
Motor Vehicle Mechanic 8 K155,396 K3,306 K2,607
Auto Body Repair & Refinishing 8 K107,037 K5,946 K5,597
Auto Electrician 8 K94,577 K3,569 K2,870
Metal Fabrication & Welding 8 K83,215 K2,560 K1,861
Electrical 8 K156,247 K2,921 K2,221
Electronics 8 K60,050 K7,506 K6,807
Refrigeration 8 K74,048 K4,777 K4,078
Carpentry Construction 8 K88,045 K3,828 K3,129
Apprentice course totals K107,306 K3,679 K2,928
National Certificate Course
NC1 Maintenance Fitting & Machining 20 K99,572 K24,893 K24,019
NC1 Motor Vehicle Mechanic 20 K150,100 K3,336 K2,461
Auto Body Repair & Refinishing 20 K160,227 K5,341 K4,467
NC1 Auto Electrician 20
NC1 Metal Fabrication & Welding 20 K91,778 K4,589 K3,715
NC2 Electrical 20 K259,003 K4,887 K4,013
NC2 Electronics 20 K148,562 K5,942 K5,068
NC2 Refrigeration 20 K70,782 K6,435 K5,560
NC1 Electrotechnology 20 K413,768 K4,138 K3,263
National Certificate Totals K174,224 K4,840 K3,965
Basic Training Certificate
BTC Carpentry Construction 20 K82,446 K5,153 K4,279
BTC Electronics 20 K108,108 K4,004 K3,130
BTC Refrigeration 20 K108,108 K4,004 K3,130
Basic Training Certificate Totals K99,554 K4,267 K3,392
Technical Training Certificate
TTC1 Printing 40 K320,453 K10,682 K8,933
TTC2 Printing 40 K250,467 K16,698 K14,949
Technical Training Certificate Totals K285,460 K12,687 K10,939
Totals/Averages K135,319 K4,520 K3,674

Research into the Financing of TVET in the Pacific PNG Country Report
151
National Polytechnic Institute, Lae Morobe
1 No of students 1351
2 Student to staff ratio 20.8
3 Cost per student K5,544
4 Average cost per teacher K42,444
5 Total Fee Income as a percentage of Total Recurrent Income 70.3%
6 Fees paid by Self-Sponsored Students as a percentage of Total Fee Income. 88.0%
TVET program/course name and description
Level Duration, weeks
Cost per course
Cost per student
Cost per student exc
boarding
Cost per graduate*
Business Studies-Accounting
Diploma 80 K425,871 K5,258 K3,851 K5,604
Business Studies-Management
Diploma 80 K409,208 K5,384 K3,977 K8,184
Business Studies-Computing
Diploma 80 K352,553 K5,975 K4,569 K7,345
Business Studies-Office Administration
Diploma 80 K372,549 K5,732 K4,325 K7,451
Architectural Drafting Diploma 80 K411,195 K6,741 K5,334 K11,422
Building Diploma 80 K467,849 K5,998 K4,591 K8,354
Civil Engineering Diploma 80 K624,483 K4,996 K3,589 K6,505
Electrical Diploma 80 K517,839 K5,568 K4,161 K7,846
Mechanical Engineering
Diploma 80 K381,201 K7,331 K5,924 K19,060
Applied Science Diploma 80 K527,837 K5,498 K4,091 K5,998
Hospitality Management
Diploma 80 K489,192 K4,892 K3,485 K5,966
TTC Metal Trade- MFW (Yr 2)
TTC 80 K317,881 K9,633 K8,226 K9,633
TTC Metal Trade- MFM (Yr 2)
TTC 80 K311,215 K10,039 K8,632 K13,531
TTC in Drafting TTC 80 K517,839 K5,568 K4,161 K6,639
TTC in Science Technology
TTC 80 K637,814 K4,944 K3,537 K6,785
TTC in Tourism & Hospitality
TTC 80 K514,506 K5,592 K4,185 K7,146
Business Studies Short Course (Various) [1]
20 K108,118 K4,325 K4,254 -
Totals/Averages K7,490,463 K5,544 K4,194 K7,833
* The graduate cost for the two year courses is calculated as half the cost of the course divided by the no of graduates.

Research into the Financing of TVET in the Pacific PNG Country Report
152
Kokopo Business College East New Britain
1 Number of students 511
2 Student to staff ratio 17.9
3 Cost per student K6,340
4 Cost per student excluding boarding K5,139
5 Average cost per teacher K27,781
6 Total Fee Income as a percentage of Total Recurrent Income 66.9%
7 Fees paid by Self-Sponsored Students as a percentage of Total Fee Income. 73.1%
TVET program/course name and description
Level Duration Cost per
course Cost per student
Cost per student exc
boarding
Cost per graduate**
Accounting Diploma 2 years K645,795 K5,616 K4,329 K5,766
Management Diploma 2 years K709,490 K5,815 K4,529 K5,912
Computing Diploma 2 years K303,445 K6,597 K5,310 K8,429
Office Administration Diploma 2 years K565,668 K6,285 K4,999 K10,475
Tourism & Hospitality Management
Diploma 2 years K344,668 K7,181 K5,894 K7,493
CBT* NC2 6 months
CBT NC1&NC2 1 year K313,980 K4,617 K3,974 K4,617
Technical Training Certificate
Certificate 2 years K356,748 K16,216 K14,930 K16,216
Totals/Averages K3,239,794 K6,340 K5,139 K8,416
* This course ran in Semester 1 2012 and produced 22 graduates. No other data as it did not run in Semester 2. ** The graduate cost for the two year courses is calculated as half the cost of the course divided by the no of graduates.

Research into the Financing of TVET in the Pacific PNG Country Report
153
Mt Hagen Technical College Western Highlands
1 No of students (FTE) 326
2 Student to staff ratio 10.2
3 Cost per FTE student K8,178
4 Average cost per teacher K27,309
5 Total Fee Income as a percentage of Total Recurrent Income 71.8%
6 Fees paid by Self-Sponsored Students as a percentage of Total Fee Income. 87.5%
TVET program/course name and description
Level Duration, weeks
Cost per course
Cost per student
Cost per graduate
TTC Yr.2 2 40 K489,835 K11,663 K11,663
TTC Yr.1 1 40 K1,037,984 K11,663 K0
DHEF Stage* 2 20 K122,459 K5,831 K5,831
MVM Stage* 2 20 K46,651 K5,831 K5,831
A/Elect Stage* 2 20 K29,157 K5,831 K5,831
National Certificate (NC)** 1 20 K309,063 K5,831 K5,831
Business Studies** 1 20 K169,110 K5,831 K5,831
Carpentry** 1 20 K29,157 K5,831 K5,831
Extension Blk 1 HEF*** 1 20 K110,796 K5,831 K5,831
Extension Blk 2 HEF*** 2 20 K157,447 K5,831 K5,831
Extension Blk 3 HEF*** 3 20 K134,122 K5,831 K5,831
Extension Blk 3 1 8 K30,323 K2,333 K2,333
Totals/ Averages
268 K2,666,103 K7,982 K10,882
* Certificate in Applied Technology ** NC. *** Extension normally 8 weeks. Boarding cost estimate looks too high. No estimate of boarding costs attempted. Unit costs per course largely uniform because the college provided no estimate of the distribution of teacher time per course. Hence all costs shared pro rata.

Research into the Financing of TVET in the Pacific PNG Country Report
154
Port Moresby Business College National Capital District
1 Number of students 585
2 Student to staff ratio 14.3
3 Cost per student K8,421
4 Cost per graduate K10,178
5 Average cost per teacher K54,503
6 Total Fee Income as a percentage of Total Recurrent Income 52.4%
7 Fees paid by Self-Sponsored Students as a percentage of Total Fee Income. 95.8%
TVET program/course name and description
Level Duration,
years Cost per
course Cost per student
Cost per graduate
Technical Trade Certificate Certificate 2 K1,104,383 K9,281 K30,677
Accounting Diploma 2 K974,772 K6,963 K5,356
Management Diploma 2 K917,359 K7,281 K9,174
Office Admin Diploma 2 K619,980 K10,164 K23,845
Information Technology Diploma 2 K697,898 K8,724 K9,970
Tourism and Hospitality Diploma 2 K611,778 K10,369 K8,740
Totals/Averages
K4,926,170 K8,421 K10,178
Course costs are annual: the total course cost in 2012 is divided by the total no of students in 2012, both Years 1 and 2. The graduate cost is calculated as half the cost of the course divided by the no of graduates. High average cost per teacher reflects presence at PoMBus of 13 Overseas Contract Officers.

Research into the Financing of TVET in the Pacific PNG Country Report
155
VOCATIONAL TRAINING CENTRES
Badili Vocational Training Centre National Capital District
1 No of students (FTE) 485
2 Student to staff ratio 16.7
3 Cost per student (FTE) K1916
4 Average cost per teacher K20,741
5 Total Fee Income as a percentage of Total Recurrent Income 58.0%
6 Fees paid by Students as a percentage of Total Fee Income 78.8%
TVET program/course name and description
Level Duration,
weeks Students Cost per
course
Cost per student
Cost per graduate
Information Technology (4hrs/day)
Community College
52 25 K61,046 K2,442 K2,544
Fishing Technology (5hrs/day)
VTC Cert 80 23 K43,201 K1,878 K2,057
Seamanship Safety (5hrs/day)
VTC Cert 80 20 K37,566 K1,878 K2,087
Sheet Metal VTC Cert 80 40 K75,133 K1,878 K1,977
Plumbing VTC Cert 80 41 K77,011 K1,878 K1,975
Electrical VTC Cert 80 43 K80,768 K1,878 K1,970
Electronics VTC Cert 80 32 K60,106 K1,878 K1,939
Brick Laying VTC Cert 80 25 K46,958 K1,878 K2,348
Refrigeration VTC Cert 80 32 K60,106 K1,878 K2,147
Refrigeration/Carpentry PETT 40 61 K114,578 K1,878 K2,491
Carpentry NC1 40 18 K33,810 K1,878 K1,878
Electrotechnology NC1 40 29 K54,471 K1,878 K2,017
Carpentry Short Course 8
Plumbing Short Course 8
Marine Short Course 8
Upholstery Short Course 8
Basic Welding Short Course 8
Tourism and Hospitality Short Course 8
Short course total
240 K90,160 K376 K389
Total - all programs
629 K834,915 K1,327 K1,432
Note: Teacher time was assigned to courses pro rata to student hours. Teaching costs are based on averages obtained from the GoPNG Budget provision for NCD vocational centres. New teaching accommodation was in course of construction at the time of the visit, funded by a grant of K1,500,000 from NDoE.

Research into the Financing of TVET in the Pacific PNG Country Report
156
Kwikila Vocational Training Centre Central Province
1 No of students 230
2 Student to staff ratio 17.7
3 Recurrent cost per student K2,168
4 Cost per student excluding Boarding K1,646
5 Capital expenditure per student K1,196
6 Average cost per teacher K19,505
7 Total Fee Income as a percentage of Total Recurrent Income 52.7%
8 Fees paid by Students as a percentage of Total Fee Income 14.9%
TVET program/course name and description
Level Student contact hours
Cost per course
Cost per student
Student cost exc boarding
Cost per graduate
Mechanics VTC- Cert 400 K104,947 K2,332 K1,810 K2,624
Welding VTC- Cert 400 K78,778 K1,576 K1,054 K1,751
Chainsaw Operation VTC- Cert 400 K45,299 K3,020 K2,498 K3,485
Carpentry VTC- Cert 400 K59,647 K1,988 K1,467 K2,386
Plumbing VTC- Cert 400 K59,647 K1,988 K1,467 K2,386
Tourism and Hospitality
VTC- Cert 400 K95,381 K2,725 K2,203 K2,510
Basic Computing VTC- Cert 480 K54,865 K2,195 K1,673 K2,888
Totals/Averages
K498,564 K2,168 K1,646 K2,432
All courses are VTC – Certificate and run for 40 weeks. The one-year certificate courses at Kwikila consist of four core elements - Agriculture, Life Coping Skills, Communication Skills and English which occupy over 80% of course hours + an optional element as above.

Research into the Financing of TVET in the Pacific PNG Country Report
157
Milmila Vocational Training Centre East New Britain
1 No of students 154
2 Student to staff ratio 14
3 Cost per student K3,112
4 Cost per student excluding Boarding K2,653
5 Average cost per teacher K19,628
6 Total Fee Income as a percentage of Total Recurrent Income 53.6%
7 Fees paid by Students as a percentage of Total Fee Income 16.0%
TVET program - all courses are VTC certificates
Duration Course cost Cost per student Cost per student
exc boarding
Garment Production 2yrs (80 wks) K94,545 K3,151.49 K2,693
Tourism & Hospitality 2yrs (80 wks) K97,782 K3,055.69 K2,597
Agriculture 2yrs (80 wks) K47,272 K3,151.49 K2,693
Steel Fabrication 2yrs (80 wks) K55,366 K2,768.30 K2,310
Small Engine Mechanics
2yrs (80 wks) K50,510 K2,971.17 K2,513
Carpentry 2yrs (80 wks) K55,366 K2,768.30 K2,310
Plumbing 2yrs (80 wks) K78,357 K3,917.86 K3,459
Totals/Averages K479,198 K3,112 K2,653

Research into the Financing of TVET in the Pacific PNG Country Report
158
Ogelbeng Vocational Training Centre
Western Highlands
1 No of students 274
2 Student to staff ratio 22.8
3 Cost per student K1,722
4 Cost per student excluding Boarding K1,445
5 Average cost per teacher K20,186
6 Total Fee Income as a percentage of Total Recurrent Income 43.0%
7 Fees paid by Students as a percentage of Total Fee Income 28.8%
TVET program/course name and description
Duration Total cost
per course
Course cost exc
boarding
Cost per student
Cost per student exc
boarding
Cost per graduate
Motor Mechanic 2years K96,228 K77,395 K1,415 K1,138 K2,601
Welding 2years K96,228 K77,395 K1,415 K1,138 K2,830
Carpentary 2years K63,906 K56,429 K2,367 K2,090 K3,550
Panel Beating 2years K65,483 K57,451 K2,258 K1,981 K3,852
Electrical 2years K67,848 K58,986 K2,120 K1,843 K4,523
Business Studies 2years K82,038 K68,191 K1,641 K1,364 K3,282
Totals/Averages
K471,732 K395,847 K1,722 K1,445 K3,231

Research into the Financing of TVET in the Pacific PNG Country Report
159
Rebiamul Vocational Training Centre
Western Highlands
1 No of students 376
2 Student to staff ratio 20.9
3 Recurrent cost per student K1,983
4 Average cost per teacher K21,263
5 Total Fee Income as a percentage of Total Recurrent Income 53.3%
6 Fees paid by Students as a percentage of Total Fee Income 48.3%
TVET program/course name and description
Duration, weeks Cost per course Cost per student
Motor Vehicle 40 K168,923 K1,942
Welding 40 K94,235 K1,745
Carpentry 40 K112,497 K2,250
Business study 40 K178,451 K3,569
Heavy Diesel Mechanic 40 K143,571 K1,342
Panel Beating 40 K48,049 K1,716
Totals/ Averages
K745,726 K1,983
Notes. Centre did not respond to queries. We had to assume that the entry in Table 1B under Staff Development should have been under Other Operating Expenditure. No graduate costs because Rebiamul's graduate numbers are identical with their student numbers.

Research into the Financing of TVET in the Pacific PNG Country Report
160
St Therese Vocational Training Centre Morobe
1 No of students 147
2 Student to staff ratio 12.3
3 Cost per student K2,829
4 Average cost per teacher K19,390
5 Total Fee Income as a percentage of Total Recurrent Income 64.9%
6 Fees paid by Students as a percentage of Total Fee Income 42.5%
TVET program/course name and description
level Duration,
weeks Students
Cost per course
Cost per student
Cost per graduate
Vocational Courses VTC Cert 40 98 K257,413 K2,627 K5,986
Commercial Cookery NC1 40 12 K34,350 K2,862 K2,862
Garment Textiles NC1 40 6 K27,078 K4,513 K4,513
Hospitality Operation NC1 60 10 K31,926 K3,193 K3,193
Office Administration (Secretary)
60 21 K65,063 K3,098 K3,098
Totals/ Averages
147 K415,830 K2,829 K4,520
Because the Team did not have payroll information on this centre, teaching costs are based on averages obtained from data about six other VTCs surveyed. Where a program lasts for more than one year, the course cost is for one year, not for the whole duration of the course.

Research into the Financing of TVET in the Pacific PNG Country Report
161
Umi Vocational Training Centre Morobe
On
campus Distance
1 No of students 175 151
2 Student to staff ratio 23.3 50.3
3 Cost per student on campus K2,506
4 Cost per distance student K809
5 Cost per campus student excluding Boarding K2,312
6 Average cost per teacher K19,217
7 Total Fee Income as a percentage of Total Recurrent Income n/a
8 Fees paid by Students as a percentage of Total Fee Income n/a
TVET program/course name and description
Cost per course
Cost per student per
course
Cost per course exc
boarding
Cost per student exc
boarding
Cost per graduate
Tourism and Hospitality K95,975 K2,399 K88,203 K2,205 K2,399
Motor Mechanic K74,474 K2,482 K68,645 K2,288 K2,482
Welding K52,973 K2,649 K49,087 K2,454 K2,649
Carpentry/Joinery K52,973 K2,649 K49,087 K2,454 K2,649
Agriculture K66,216 K2,649 K61,359 K2,454 K2,649
C.A.T. Carpentry K95,975 K2,399 K88,203 K2,205 K2,399
FODE K36,457 K911 K36,457 K911 K911
FODE K85,713 K772 K85,713 K772 K772
Totals/ Averages K560,755 K1,720 K526,755 K1,616 K1,720

Research into the Financing of TVET in the Pacific PNG Country Report
162
Vunamami Farmers Training Centre East New Britain
1 2
Number of students Student to staff ratio
824 24
3 Overall recurrent cost per FTE student K1,981
4 Cost per student excluding boarding K1,252
5 Average cost per teacher K19,310
6 Total Fee Income as a percentage of Total Recurrent Income 59.5%
7 Fees paid by Students as a percentage of Total Fee Income. 32.0%
Course Level Cost per
course
Cost per course exc
boarding
Cost per student
Cost per graduate
Agriculture 1 K247,634 K179,916 K2,663 K7,504
Auto Electrical 1 K110,446 K66,028 K1,811 K3,563
Auto Mechanical 1 K217,433 K130,782 K1,827 K3,245
Metal Fabrication 1 K216,280 K130,357 K1,833 K3,228
Carpentry 1 K207,057 K126,959 K1,882 K2,958
Garment Production 1 K125,434 K71,550 K1,695 K3,920
Tourism and Hospitality 1 K243,256 K152,965 K1,962 K3,475
Plumbing 1 K138,575 K89,061 K2,038 --
Panel Beating & Spray Painting 1 K95,458 K60,506 K1,989 K5,966
Fisheries 1 K30,435 K23,882 K3,382 K3,382
Totals/ Averages
K1,632,007 K1,032,007 K1,981 K4,132

Research into the Financing of TVET in the Pacific PNG Country Report
163
REGISTERED TRAINING ORGANISATIONS
Elirana Electronic Technology School East New Britain
1 No of students 49
2 Student to staff ratio 16.3
3 Cost per student K2,652
4 Average cost per teacher K19,600
5 Total Fee Income as a percentage of Total Recurrent Income 100%
6 Fees paid by Students as a percentage of Total Fee Income 100%
TVET program/course name and description
level student contact hours
Students Cost per
course Cost per student
Cost per graduate
Electronic Technician Penn Foster
1600 30 K59,095 K1,970 K1,970
Computer Technician Penn Foster
1600 14 K40,627 K2,902 K2,902
Telecommunication Technology Penn Foster
1600 5 K30,238 K6,048 K6,048
Totals/ Averages
49 K129,960 K2,652 K2,652
Elirana teaches courses supplied by the American distance education provider Penn Foster. All Elirana courses last 1 year. Graduate numbers recorded by Elirana are identical with enrolments. Costs vary because Elirana assigns one FTE teacher to each course whatever the enrolment.

Research into the Financing of TVET in the Pacific PNG Country Report
164
Highlands Youth Training & Rehabilitation Centre Western Highlands
1 No of students 409
2 Student to staff ratio 33
3 Recurrent cost per student K1,247
4 Capital expenditure per student K293
5 Average cost per teacher K12,000
6 Total Fee Income as a percentage of Total Recurrent Income 88.9%
7 Fees paid by Self-Sponsored Students as a percentage of Total Fee Income 83.9%
TVET program/course name and description
Level Duration, weeks
Cost per course
Cost per student
Cost per graduate
Accounting Certificate 24 K47,106 K725 K942
Accounting Diploma 48 K76,987 K1,571 K2,026
Management Certificate 24 K27,189 K971 K1,236
Management Diploma 48 K51,149 K2,046 K2,692
Sales Marketing Certificate 24 K34,187 K834 K1,140
Sales Marketing Diploma 48 K58,685 K1,834 K2,347
Information Technology Certificate 24 K28,804 K929 K1,252
Information Technology Diploma 48 K48,996 K2,130 K3,062
Tourism&Hospitality Certificate 24 K29,881 K905 K1,149
Tourism&Hospitality Diploma 48 K46,843 K2,231 K3,603
Human Resource Management Certificate 24 K23,960 K1,089 K1,711
MYOB Certificate 8 K8,484 K339 K424
Secretarial Certificate 24 K27,728 K956 K1,155
Totals/Averages 10
K510,000 K1,203 K1,594
Note. Apportionment of teacher time to courses needed to be done by the team.

Research into the Financing of TVET in the Pacific PNG Country Report
165
IEA College of TAFE National Capital District
1 Number of students (FTE) 527
2 Student to staff ratio 36.3
3 Overall recurrent cost per FTE student K9,913
4 Capital cost per FTE student K474
5 Average cost per teacher K94,502
6 Total Fee Income as a percentage of Total Recurrent Income 96.8%
7 Fees paid by Self-Sponsored Students as a percentage of Total Fee Income 93.4%
TVET program/course name and description Cost per course Cost per student
per course
Certificate II Information, Digital Media & Technology K257,656 K4,442
Certificate III Information, Digital Media & Technology K493,118 K4,443
Certificate IV Information Technology (Support) K466,463 K4,443
Diploma Information Technology (System Administration) K361,324 K5,923
Certificate II Business K244,338 K4,443
Certificate III Business Administration K186,585 K4,443
Certificate IV Business Administration K137,718 K4,443
Certificate III Accounts Administration K644,163 K4,443
Certificate IV Accounting K222,125 K4,443
Diploma Accounting K146,603 K4,443
Certificate II Hospitality (Kitchen Operations) K124,884 K5,430
Certificate III Hospitality Operations K97,735 K5,430
Certificate III Tourism Operations K10,859 K5,430
Certificate III Commercial Cookery K190,040 K5,430
Certificate IV Hospitality Supervision K32,578 K5,430
Certificate IV Training & Assessment (TAA) K284,320 K11,847
Training of Trainers (TOT) K373,170 K5,923
Diploma of Management K76,016 K10,859
Certificate IV Frontline Management K21,719 K10,859
Certificate III Frontline Management K462,020 K11,847
Diploma of Human Resources Management K325,784 K10,859
Certificate IV Human Resources K10,859 K10,859
Diploma of Library & Information Services K43,438 K10,859
Certificate III Library & Information Services K10,859 K10,859
Totals/Averages K5,224,374 K5,523
Note. Average cost per teacher and relationship between teacher and student numbers were queried with the college and confirmed.

Research into the Financing of TVET in the Pacific PNG Country Report
166
Innovative Training Centre Morobe
1 No of students (FTE) 190
2 Student to staff ratio 22.2
3 Cost per FTE student K5,020
4 Cost per student excluding Staff Development K4,237
5 Average cost per teacher K12,787
6 Total Fee Income as a percentage of Total Recurrent Income 100%
7 Fees paid by Self-Sponsored Students as a percentage of Total Fee Income 54.2%
TVET program/course name and description
Cost per course
Cost per student per
course
Cost per student per course exc
SD
Cost per graduate
Business Management K196,738 K5,177 K4,370 K5,962
Port & Shipping K72,975 K4,561 K3,849 K4,561
Occupational Health & Safety K18,696 K534 K451 K534
Accounting K248,511 K5,177 K4,370 K8,875
Information Management Systems K67,059 K4,191 K3,537 K4,790
Sales & Marketing K91,332 K5,372 K4,534 K5,708
Information Technology K86,289 K4,314 K3,641 K4,314
Totals/Averages K781,600 K4,114 K3,472 K4,825
Notes The Centre reported exceptionally high expenditure on staff development in 2012 (K122,000). Courses in Occupational Health and Safety last just four days.

Research into the Financing of TVET in the Pacific PNG Country Report
167
Organization for Industrial, Spiritual and Cultural Advancement OISCA East New Britain
1 2
Number of students Student to staff ratio
82 6.3
3 Cost per student K10,703.68
4 Cost per student excluding boarding K9,717.11
5 Average cost per teacher K11,719.23
6 Total Fee Income as a percentage of Total Recurrent Income 37.7%
7 Fees paid by Self-Sponsored Students as a percentage of Total Fee Income 3.9%
Course Unit Costs Cost per
course
Cost per student per
course
Cost per student exc
boarding
Cost per graduate
K877,702 K10,704 K9,717 K10,704
OISCA runs one course in which students are rotated through rice cultivation, vegetable growing, forestry and animal husbandry in the course of a 40 week year. All students board.

Research into the Financing of TVET in the Pacific PNG Country Report
168
PNG Power Training College National Capital District
1 Number of students (FTE) 88
2 Student to staff ratio 14.7
3 Cost per FTE student K4,205
4 Average cost per teacher K46,667
5 Total Fee Income as a percentage of Total Recurrent Income 100%
6 Fees paid by Self-Sponsored Students as a percentage of Total Fee Income 100%
TVET program/course name and description Cost per course Cost per student
per course Cost per graduate
Electrical K185,000 K1,542 K1,542
Mechanic K26,429 K2,033 K2,202
CBT1 K26,429 K1,762 K2,033
CBT2 K26,429 K1,555 K1,762
CBT3 K26,429 K1,652 K1,652
EXT1 K26,429 K1,555 K1,555
EXT2 K26,429 K2,643 K2,937
EXT3 K26,429 K2,202 K2,202
Totals/Averages K370,000 K1,682 K1,729
Note. All courses are 8 week extension courses for apprentices. This provider gave no details of apportionment of teachers between courses, or of other operating expenditure. Unit costs are therefore understated.

Research into the Financing of TVET in the Pacific PNG Country Report
169
Talleres de Nazareth National Capital District
1 Number of students (FTE) 64
2 Student to staff ratio 12.8
3 Cost per FTE student K2083
4 Average cost per teacher 7,490
5 Total Fee Income as a percentage of Total Recurrent Income 2.5%
6 Fees paid by Self-Sponsored Students as a percentage of Total Fee Income 74.6%
TVET program/course name and description
Duration in weeks
Staff costs Other
operating costs
Cost per course
Cost per student per
course
Cost per graduate
Basic Cooking/Baking
4 K29,216 K25,892 K55,108 K402 K402
Basic Sewing 8 K43,824 K34,775 K78,599 K854 K854
Totals/Averages K73,040 K60,666 K133,706 K584 K584
Talleres de Nazareth offers 4 and 8 week courses only. The number of enrolments in Semester 2 2012 was 229.

Research into the Financing of TVET in the Pacific PNG Country Report
170
Works Institute of Technology National Capital District
1 Number of students (FTE) 135
2 Student to staff ratio 9.7
3 Overall recurrent cost per FTE student K15,708
4 Average Cost per Teacher K22,883
4 Total Fee Income as a percentage of Total Recurrent Income 44%
5 Fees paid by Self-Sponsored Students as a percentage of Total Fee Income 69%
TVET program/course name and description
Level Cost per
course Cost per student
Cost per graduate
Electrical 1&2 K253,245 K12,059 K12,059
Maintenance Fitting & Machining 1&2 K226,533 K17,426 K18,878
Metal Fabrication & Welding 1&2 K195,323 K13,022 K15,025
Air-conditioning & refrigeration Module 1-4 K214,631 K12,625 K14,309
Carpentry Construction 1&2 K204,977 K12,811 K12,811
Plumbing 1&2 K214,631 K12,625 K12,625
Business Studies 1&2 K197,572 K19,757 K21,952
Auto Electrical 1&2 K216,879 K18,073 K18,073
Panel Beating & Spray Painting 1&2 K89,132 K22,283 K22,283
Civil Training Stages 1-4 K312,210 K10,407 N/A
Totals/Averages 10 K2,125,133 K13,711 K17,858
Note. The Department of Works was not able to separate the non-staff costs of WIT from those of related activities. The non-staff costs reported in the Survey were abnormally high, and that is reflected in the unit costs shown.

Research into the Financing of TVET in the Pacific PNG Country Report
171
UNIVERSITIES
Divine Word University Madang
1 No of students 347
2 Student to staff ratio 28.9
3 Average cost per student K7,346
4 Average cost per teacher K80,038
5 Total Fee Income as a percentage of Total Recurrent Income 46.1%
6 Fees paid by Self-Sponsored Students as a percentage of Total Fee Income 81.1%
TVET program/course name and description
Level Cost per course Cost per student
Cost per graduate
Project Management Diploma K441,896 K6,695 K11,943
Management Diploma K638,316 K5,699 K11,821
Human Resource Management Diploma K501,676 K6,271 K14,334
Business Studies Diploma K335,116 K10,472 K30,465
School Management and Leadership
Diploma K280,416 K12,746 K31,157
Emergency Medicine Adv Diploma
K351,526 K10,044 K15,978
Totals/Averages
K2,548,947 K7,346 K15,172
Note. The costs relate to diplomas delivered in flexible learning mode, through a combination of distance/workplace learning and short periods of residential study. No attempt has been made to convert to FTE.

Research into the Financing of TVET in the Pacific PNG Country Report
172
PNG University of Natural Resources & Environment East New Britain
1 No of students 613
2 Student to staff ratio 30.65
3 Average cost per student K18,668
4 Average cost per teacher K60,762
5 Total Fee Income as a percentage of Total Recurrent Income 74.3%*
6 Fees paid by Self-Sponsored Students as a percentage of Total Fee Income. 51.5%*
* 2011 data
TVET program/course name and description
Level Duration Total course cost Course cost per
student
Tropical Agriculture Diploma 26 wks per year, 3 years
K9,214,980 K16,604
Fisheries and Marine Resources
Diploma 26 wks per year, 3 years
K2,228,704 K38,426
Totals/Averages
K11,443,685 K18,668
Cost per graduate not calculated because of discrepancy in data returns.

Research into the Financing of TVET in the Pacific PNG Country Report
173
University of Technology at Lae Morobe
Department
Expense 2012
Student Number
Variable Expense
per student
Fixed Cost per
student
Total cost per
student
No of UG Dip
Students
14,055
Agriculture Department 3,008,484 211 14,258
28,313
Applied Physics Department
1,369,041 131 10,451
24,506
Applied Science Department
1,666,182 164 10,160
24,215
Architecture & Building Dept
1,089,923 217 5,023
19,078 104
Business Studies Department
2,212,276 607 3,645
17,700 330
Civil Engineering Department
1,148,122 193 5,949
20,004
Electrical & Communication Eng
1,546,042 254 6,087
20,142 34
Forestry Department 996,508 112 8,897
22,952
Communications for Development Studies (CDS)
1,238,050 266 4,654
18,709 73
Maths & Computer Science
1,760,041 342 5,146
19,201 69
Mechanical Engineering
1,504,030 179 8,402
22,457
Mining Engineering 1,369,666 316 4,334
18,389
Lands & Surveying Studies
1,973,890 278 7,100
21,155 179
Totals/Averages 20,882,255 3,270 8,423
22,501 789
Note. As advised by the university, the figures in the student no. column for Business Studies, Maths and CS, and CDS are raw full-time equivalents, not the actual student numbers, reflecting services provided to other Depts.

Research into the Financing of TVET in the Pacific PNG Country Report
174
ANNEX 2. PERSONS CONSULTED DURING THE FIELDWORK
Name Title Organisation
Jane Christie Program Director - Education Australian Agency for International Development (AusAID)
Keith Joyce Assistant Program Director- Education AusAID
Prisca Mauve Program Manager - Higher Education and TVET AusAID
Pakwasi Nyameke Second Secretary Scholarships AusAID
Reichert Thanda Acting First Assistant Secretary- Foreign AID Division
Department of National Planning & Monitoring (DNPM)
Loia Vaira Acting Assistant Secretary DNPM Joelson Anere Senior AID Cordinator DNPM
Uke Kombra First Assistant Secretary TVET National Department of Education (NDoE)
Monica Maluan Assistant Secretary TVET Division NDoE Noke Peng Budget Officer, TVET Wing NDoE Patrick Kobol TVET Wing NDoE Rosa Apelis Program Co-ordinator- TVET NDoE Betty Napil Research Officer -TVET NDoE Etwin Apai FAS, Finance and Budget NDoE Jack Amenesu Budget Officer, Finance Division NDoE
Anthony Madgwick Budget Planning Adviser, Finance Division NDoE
Stanislaus Motolova Director National Training Council (NTC) Joe Lokes Acting Assistant Director NTC Dianne Pakalu Research Officer NTC
Henry Aika Private Sector Training and Development Branch (PSTD) NTC
Kailou Manoi PSTD NTC Roger Giaruva PSTD NTC
Thomas Kipau Director National Apprentices & Trade Testing Board (NATTB)
Tommy Manu Assistant Director, Planning NATTB
David Conn Chief Executive Officer Port Moresby Chamber of Commerce & Industry (PomCCI)
Pastor Mike Field Acting Foundation Manager Ginigoada Business Development Foundation (GBDF)
Trevor Davison Director Star Mountain institute of Technology (SMIT)
Professor David Kavanamur Director General Office Of Higher Education (OHE) Jeanette Baird Advisor OHE
Lonnie Baki Assistant Director, Policy and Planning OHE
Stella Doboi Research Officer OHE Steven Research Officer OHE Jenny Kinandi TVETScholarships cordinator OHE George Bopi Consultant OHE
Boio Bess Daro Chairman of Trustees Skills Development Trust Fund (SDTF)
Steffen Wirth Adviser SDTF Rage Augerea National Capital District Office SDTF Lucy Katal National Co-ordinator SDTF Gordon Awatan Manager Badili Vocational Training Centre Ricardo Buela Deputy Manager Badili Vocational Centre Pius Siobuk Board Chairman Badili Vocational Centre Sr. Maria Goretti Leison Manageress Limana Vocational Centre
Phil Oakley Manager
International Education Agency - Tertiary & Further Education (IEA-TAFE)
Margaret Obi Academic Registrar IEA-TAFE
Graham Bidang Principal Lae Technical College (National Polytechincal Institute - NPI)
Henry Mambil Principal Mount Hagen Technical College Gabriel Pamel Principal Kokopo Business College Celestine Ponau Deputy Principal Kokopo Business College

Research into the Financing of TVET in the Pacific PNG Country Report
175
Name Title Organisation
Peter Baki General Manager Diwai Pacific- Divine Word University
Oli Mark TVET Inspector- Central NDoE Sister Elma Tuzon Manageress Talleres De Nazareth Kilage Anitali Manager Kwikila Vocational Centre
Pius Gawi ENB Provincial Education Advisor ENB Provincial Administration, Division of Education
Kevin Warpit ENB TVET Inspector ENB Provincial Division of Education
Henry Gioven University of Natural Resources & Environment (UNRE) Registrar Office Of Higher Education (OHE)
Hosea Turbarat Manager Kairak Vudal Resource Training Centre (KVRTC) @UNRE
Norbert Perry Deputy Director- Administration OISCA International- Rabaul Eco-Tech Training Centre
Daniel Joseph Farm Manager OISCA International- Rabaul Eco-Tech Training Centre
Herman Pius Manager Vunamami Farmers Training Centre
Rose Monalua Manager Milmila VTC Valerie Takun Deputy Manager Milmila VTC Elijah Turana Principal Elirana Electronics
Muriki Bihoro Morobe PEA Morobe Provincial Education Administration Division
Jonas Aneto Director Innovative Traing Centre, Lae
Tracy Yapi Manageress St. Theresa Vocational Training Centre
Yokea Guwo Manager Umi Vocational Training Centre
Darren Yorio Program Co-ordinator Adventist Develpoment and Relief Agency
Stanley Maip WHP PEA WHP Provincial Division of Education
Aikel Nentepa WHP Assistant Planner -Education Division
WHP Provincial Division of Education
Benny Tep WHP Reform Coordinator Education
WHP Provincial Division of Education
Benjamin Baidoo Hanson Deputy Director- Professional Community Education Secretariat Margaret Ieme Officer Community Education Secretariat
Trevor Birney Country Manager Australia-Pacific Technical College (APTC)
Eva Magaga Principal Malaguna Technical Secondary School
Francis Leba Principal OISCA Eco-Tech Training Centre Charlotta Rayner-Johansson Training & Development Manager Hastings Deering Limited Nelson Kaupa Principal Malahang Vocational Centre Alfred Hannetts Service Training Manager Ela Motors Limited Albert Rovi General Secretary PNG Council of Churches
John Kaewa General Secretary Baptist Union of Papua New Guinea
Ali Sadiq President Institute of Business Studies Peter Siopun (deceased) Assistant Director National Statistics Office (NSO)
Lawrence Stephens Program Manager Community and Social Investment Program
PNG Sustainable Development Program (PNGSDP)
Brad Shaw SMIT- Director of TVET and Research PNGSDP
Hilary Damke Manager Morata Vocational Training Centre Anna Apa (deceased) TVET Inspector-NGI NDoE
Fatima Manager Kabaira Girls Vocational Training Centre
Ronald ToPupul Manager Woolnough Vocational Training Centre
Neville Howcroft Head of Forestry Department University of Natural Resources and Environment (UNRE)
Dr. Alan Quartermain Dean of School of Natural Resources UNRE

Research into the Financing of TVET in the Pacific PNG Country Report
176
ANNEX 3. ESTIMATES FOR THE SKILLS DEVELOPMENT TRUST
FUND
This annex provides a rough estimate of the annual expenditure of SDTF, for comparison with the income likely to be available from the capital invested in the fund. A brief document prepared by SDTF in June 2013 lists every course approved, or recommended for approval, from the inception of SDTF in 2001 up until 2012. The list covers the following items:
The names of each course, the provider and the province;
The status of the course, with Awaiting Decision, Declined, Abandoned ,Approved, In Progress and Complete as the options;
The proposed start date;
The proposed budget, and the contributions to be made to it, by the provider, the trainees and SDTF; and
The amount of expenditure receipted.
The sources for the earlier history of SDTF are: Technical-Vocational Skills Development in PNG (ADB, 2007); PNG Employment-Oriented Skills Development Project, Project Completion Report (ADB, 2008); and A Review of National Training Funds (World Bank, 2009). This 2013 SDTF document lists 753 course records. SDTF summarises the financials for the 2001 to 2012 period as follows:
Total of budgets K4.11 million
Provider contributions K0.90 million
Trainee contributions K0.45 million
SDTF’s contribution K2.90 million
Total expenditure receipted K1.13 million
For the total of 753 courses these figures imply an average budget of just K5,500 per course. The procedure in issuing so many small approvals appears very labour intensive. Some providers appear repeatedly in the list, delivering several courses per year, but the number of such sustained partnerships is not great. Contribution proportions are often, but not always, 70% from SDTF, 20% from the provider, and 10% from the trainee. The figures in the above table relate to all courses listed in the 2013 SDTF document. The exclusion of courses classified as Awaiting Decision (projects can have this status for a considerable time) reduces the totals down to K3.2 million for budgets and K2.2 million for SDTF contributions. The key figures for estimating SDTF’s own expenditure are those for SDTF’s proposed contributions to the projects. The following diagram graphs the data compiled from the list of courses.

Research into the Financing of TVET in the Pacific PNG Country Report
177
SDTF proposed contributions for projects starting in the years 2001-2011
The diagram illustrates that in four years (2003, 2007, 2009 and 2010) SDTF contributions, as measured by the published list, were close to K300,000, but in other years they were much lower. Published information about SDTF’s resources is limited and out-of-date. According to ADB (2007), the capital of the trust fund amounted to K53 million in 2006-07. According to World Bank (2009), SDTF was limited to spending each year 10% of its capital base plus the annual income from the endowment. ADB (2007) found that by August 2006 accrued earnings were K4.6 million, of which only a small fraction had been spent. Accrued earnings of K4.6 million a year from K2001 to 2006 suggests an average annual accrual of about K900,000. That in itself seems relatively low. Investment returns fluctuate, but on average a fund of over K50 million should be able to sustain annual spending of K2-3 million a year (4-6% return on capital) without diminishing its base. Despite a number of initiatives by the research team, no further data or meetings were forthcoming from SDTF. In the absence any annual accounts of its income and expenditure, the Fund appears to be spending substantially less on training programs than the income that would be expected to flow from its reported capital base.

Research into the Financing of TVET in the Pacific PNG Country Report
178
ANNEX 4. REGISTERED TRAINING ORGANISATIONS About 65% of all RTOs are registered at an address in the NCD. Another 20% are in Morobe and East New Britain. In other provinces the numbers of RTOs are very small. Six of the provinces have no RTOs at all. These figures need to be taken with caution. An RTO registered in the NCD may have several campuses and deliver services elsewhere in PNG. A province may have few or no registrable RTOs either because it has little or no registrable training, or because trainers have failed to register. There may well be significant unregistered training provision but to discover it, and win the cooperation of unregistered trainers for research, lies beyond the time-frame of our study. The following figure shows RTOs according to the number of registered trainers.
Location of RTOs by Province
Source: Analysis by the PNG study team of the Register of Training Organisations
0
20
40
60
80
100
120
140

Research into the Financing of TVET in the Pacific PNG Country Report
179
RTOs classified by number of trainers
Source: Analysis by the PNG Case study team of the Register of Training Organisations
About three-quarters of all RTOs are registered with five or fewer trainers. We have no sector-wide enrolment data but the small number with 10+ trainers probably account for a large part of the student population. The list of courses has 1196 entries, classified by field of study. That total exaggerates the variety since from their titles many courses appear similar to others registered. Very few of these courses have titles within the PNGNQF. The NTC also gave us a list of courses newly accredited in the first half of 2012. It shows some progress with PNGNQF but covers only a few RTOs. The Team has seen no plan for reaching the target that all RTO courses should fall within PNGNQF by the end of 2014. The following table is derived from the NTC course list.
RTO Courses Classified by Field of Study, May 2012
Overseas qualifications are not classified in the list by field of study but many of them have codes within the Australian Training Framework. Pending the development of more PNGQF-
0
20
40
60
80
100
120
1_2 3_5 6_ 10 10_20 21 + Unrec
Field of Study Number of courses
IT and Computer 99 Soft Skills, inc Management, Business and Accounting 440 Hard Skills, inc Trade Technology, Engineering, Mining, Construction etc 123 Agriculture, Fisheries, Forestry 43 Garment and Textile 22 OHS, Safety, Security 95 Tourism, Hospitality, Cookery 26 Gardening 5 Theology 5 First Aid 18 Police, Military and Correctional 65 Aviation 11 HIV/AIDs 2 Overseas Qualifications by overseas RTOs 204 Overseas Qualifications by PNG RTOs 38
Total 1196

Research into the Financing of TVET in the Pacific PNG Country Report
180
TVET courses, they are a natural option for RTOs wishing to offer qualifications of verifiable quality and portability. Types of RTO The Team obtained an unpublished NTC list which shows RTOS, registered trainers and courses all in the one list, as at January 2010. For some RTOs on the list information may be significantly older than Jan 2010. But it was the only source of its kind we had in 2012. This list was used to classify RTOs into the four types shown at the end of this Annex. The significance of the four types is described in the following paragraphs. Type 1 consists of 19 institutions which either perform within the private sector functions which are broadly similar to those of the technical and business colleges, or in a few cases are themselves offshoots of public institutions. Type I is the point of closest intersection between private and public sectors. It is therefore of strong research interest. Type 2 contains just 13 institutions, of which three highlighted yellow are outside the scope of the study. In general institutions within this group are of limited interest to the study – their specialised nature and clientele limits the significance for broader public policy. But there are exceptions, among which Works Institute of Technology, PNG Institute of Public Administration and PNG Maritime College receive attention in this report of Phase 2. . Type 3 consists of 22 industry trainers. There is no marker in the NTC list for industry trainers – we have identified them simply by their names. There is therefore a bias towards big well- known firms in our list – there will be small firm industry trainers in Type 4 which we did not recognise as such. Industry trainers come from a wide variety of firms from sectors such as agriculture, mining, oil and gas, retailing, automotive maintenance, construction and public utilities. A few RTOs of this type are approved by the NATTB to provide apprentice training. Type 4 is a large group, containing about 150 trainers. Of these 15 are classified as uncontactable, on the grounds that our Phase 1Survey indicated that their post-boxes and phone lines were out of use. Two further sub-groups are highlighted – IT and security guard specialists. The research interest in Type 4 is less easy to pin down. It is probably low for specialists serving low-level training needs for a specific industry like security guarding. Some Type 4 institutions may effectively be meeting local training needs in ways similar to the VTCs. If both VTCs and smaller, local RTOs are teaching PNGQF TVET courses the intersection between them may increase. The following tables classify the 204 RTOS into these four types.

Research into the Financing of TVET in the Pacific PNG Country Report
181
Summary table of RTOs Type No. of RTOs
Type 1 19
Type 2 13
Type 3 22
Type 4 150
Disused Numbers54
5
Total 209
54
When an RTO is deregistered the NTC does not alter the numbers of the other RTOs. In 2012 nos. 6, 16, 29, 36, and 40 were disused.

Research into the Financing of TVET in the Pacific PNG Country Report
182
Types of RTOs with NTC Registration Numbers Type 1 (Colleges open to all and offering a wide range of courses)
Type 2 (Semi-public providers with links to Govt. Departments)
Type 3 (Industry trainers focussed on employee training, often which train wholly or mainly for their parent firms)
01 IBBCT 05 Newcrest
02 IEA 08 Correctional Service
Training
027 Ramu Agri Industries Training
Coll
07 Integrated Dev Serv 021 Timber and Forestry
Training College
035 Price Waterhouse
09 ITI 064 Works Institute 059 Deloitte
010 IBS 066 National Disaster Cent 070 Telikom Training College
014 Vunabosco Ag Tech
Schl
068 National Fisheries
College
079 Chemcare Group Ltd
019 Star Mountain Training
Inst
084 PNG Defence
Academy
081 Air Niugini TTC
089 PNG Ports Training
Coll
117 Star West Construction
026 Talleres de Nazareth 122 Works Dept, Madang 153 UMW Training Division
O38 Don Bosco Technical
Institute
152 Dept of Finance
Training Branch
166 Inter-Oil Training Division
044 Cambridge International 174 Bomana Police College 167 PNG Power Training
048 Coronation Training 185 Aust Pub Serv Comm 168 Morobe Mining Professional
Training Centre
060 Osi Tanata Business
Training
186 PNG IPA 176 Hastings Deering Institute of
Training
069 Don Bosco Technical
School
196 Dept of Commerce
Training Branch
179 Ela Motors
178 Porgera Joint Venture Training Centre
071 MDC at Unitech 182 Petroleum Manpower
074 ITI Lae 187 Exxon Mobil Train. Centre
093 Besenengka Voc Centre 188 OilMIN Field Services Ltd
094 NPI, Lae 192 Hargy Oil Palm
133 Caritas Tech Sec
School
193 Orion Project Services PNG
177 APTC 197 Bishop Bros Training

Research into the Financing of TVET in the Pacific PNG Country Report
183
Type 1 (Colleges open to all and offering a wide range of courses)
Type 2 (Semi-public providers with links to Govt. Departments)
Type 3 (Industry trainers focussed on employee training, often which train wholly or mainly for their parent firms)
203 Coca-Cola Amatil PNG
Total for Type 1: 19 Total for Type 2: 13 Total for Type 3: 22
Type 4 (providers usually smaller than Type 1 and sometimes specialising e.g. in computing or security guard training)
03 Maea 092 Innovative Training 148 Community Empowerment
04 Computrain 095 Panda Ratarai 149 Mega Institute
011 Sally’s Bus School 096 Pac Centre 150 Speko-Mirco
012 FPCD 099 Niolam 151 Education and Training Consultancy
013 New Britain Bus Stud 100 Work Link 154 Southern Training
015 PNG Garment and
Textile
101 Industrial Safety 155 Highlands Youth
017 Red Cross 102 PNG Associated
Industries TC
156 CTP Training
018 Peace Foundation
Melanesia
103 Super Staff Melanesia 157 IT Job Training
020 Konnen International 104 Bus Dev Training 158 IBO Training
02200022 Goroka
Agribusiness
105 Bismarck 159 Dept of Milne bay
023 Conxion 106 Paradise 160 Tusca Training
024 TGL Training 107 Secure Solutions 162 Quality Management Training
025 Entertrain 108 Life Food Handlers 163 ATD Consulting
028 Canossa School of Life 109 Integrated Training
Dev
164 Inter-act
030 Hohola Community coll 110 Deku Business College 161 Innovative Training
111 WNB Business coll 165 Nat Volunteer Services
031 Malaguna Tourist
Services
112 PNG Inst of
Management
169 SOS Security
032 Elirana Electronics 113 Oceania Con 170 Melanesia Training
033 ICTC 114Marie Elz Flower 171 Essellars Training
115 Adra PNG 172 Raluana Auto

Research into the Financing of TVET in the Pacific PNG Country Report
184
Type 4 (continued)
034 AON BETS 118 G4S 173 Fisher Training
037 Daltron 119 Pacific 175 Blue Waters
039 NGO Entrepreneurial 120 Eurest
041 Employee Assistance
Service
121 Kumul 180 Datec Learning Centres
042 PNG IVET 123 Central Open Learning 181 Pacific Maritime Training Services
043 NTI Lae 124 PNG Inst of Tech 183 Rabaul Bus Stud
045 Kikori Business 125 Education Milne Bay 184 PNG BAHA
046 Career Dev School
Madang
126 Yungu Emergency 189 SASTA PNG
046 City College of
Technology
127 Inst of Security 190. Uniforce Training
049 Career Dev School
Wewak
128 Peak Performance 191 MTO Training
050 Institute of Professional
Studies
129 Tanim Ston 194 Pacific Gas Training Centre
051 Star business College 130 St John Education 196 Kimbe Bay Hotel
052 Micro-training Institute 131 Asia-Pacific harvest
Ministry
198 Anitua Mining Training
053 Commercial Training
College PoM
132 Regional Aviation
academy
199 HR Bus Sol
054 IOBT 134 ANJ Man Train 200 Vanco Consulting
055 Multi Skills Training 135 A and G 201 Centre for Development and Success
056 Kingku Hi-Tech Train 136 Gouno Grass roots
Skill
202 National Corporate Training
057 - PSTC 137 Bes Consult 204 Ozi-K
058 NSTS 138 Cater Corp 205 Abel Computing PNG Training Branch
061 Tanorama 139 Sustainable Bus 206 More Skills Pacific
062 Fubilan Catering 140 CTC Lae 207 Mountain Catering
063 McCarthy 141 PNG EOSD 208 Emergency Medical Services Education and Training
065 Millennium 142 Archdiocese 209 Baptist Union of Papua New Guinea

Research into the Financing of TVET in the Pacific PNG Country Report
185
Type 4 (continued)
067 AOG Jubilee 143 New Image
072 Mapex 144 Kokopo Tours
073 ESE Bible 146 NGIT Training
075 New Guinea Business
and Man
147 Elly’s Sky
077 SouthPac
078 Selwin Consulting
080 Automotive TTC
082 Concept
083 Vakaka
085 Rafast
086 Institute of Crim
087 Prof Sec
088 PNG OHS
090 Dedicated Management
091 Pac Dev
Total for Type 4: 150
Key
Uncontactable Out of scope NATTB approved for apprentices
IT trainer Security guard trainer

Research into the Financing of TVET in the Pacific PNG Country Report
186
ANNEX 5. ROLE AND MEMBERSHIP OF THE NATIONAL REFERENCE GROUP
Role of the National Reference Group (NRG) The role of the NRG was to assist, advise and support the activities of the country study:
advise on country-specific TVET financing issues; the implementation of the research program in the country;
encourage and facilitate stakeholder engagement in the program;
provide feedback on data collection instruments and interview schedules, and on the draft country study report;
participate in the final dissemination workshop; and
assist with dissemination of the program’s findings and reports. Membership of the NRG
Position Name
DNPM Mr. Reichert Thanda
DNPM Ms. Loia Vaira
Kokopo Business College Mr. Gabriel Pamel
NPI Lae Mr. Graham Bidang
Divine Word University Mr. Peter Baki
Mt Hagen Technical College Mr. Henry Mambil
SMIT Dr. Trevor Davison
NTC Mr. Stanis Motolova
AusAID
AusAID
Mr. Keith Joyce
Ms Prisca Mauve
TVET NDoE Ms. Monica Maluan
TVET NDoE Dr. Uke Kombra
TVET NDoE Ms Betty Napil
DNPM Mr. Joelson Anere
OHE Professor David Kavanamur
OHE Mr Lonnie Baki
OHE Ms Jeanette Baird
IEA College of TAFE Mr. Phil Oakley
IEA College of TAFE Ms. Margaret Obi
NSO Mr. Joseph Yaramai
Employers’ Federation Ms. Florence Willie
POMCCI Mr. David Conn
Note. Included in this list are some alternates who attended more than once as well as full members.

Research into the Financing of TVET in the Pacific PNG Country Report
187
NRG meetings The NRG met four times, on 18th October 2012 and in 2013 on 24th April, 5th June and 23rd August. Special thanks are due to the out-of-town members – Graham Bidang, Trevor Davison, Henry Mambil and Gabriel Pamil who took time out of busy working lives to fly in for the meetings.

Research into the Financing of TVET in the Pacific PNG Country Report
188
ANNEX 6. SURVEY OF TECHNICAL AND BUSINESS COLLEGES
Note. This survey template was also used with slight modifications for Vocational Training
Centres and Registered Training Organisations.
Return number:
PROVISION AND COSTING SURVEY: TECHNICAL AND BUSINESS COLLEGES
COLLEGE NAME ……………………………………………………………..
ADDRESS
Location …………………………………………………………………………….
Telephone number………………………………………………………………...
Fax number…………………………………………………………………………
NAME OF COLLEGE CONTACT…………………………………………………………………..
ROLE/TITLE… ………………………………………………………………………….
Email address……………………………………………………………………….

Research into the Financing of TVET in the Pacific PNG Country Report
189
Table 1 Annual income and expenditure on the provision of training: FY 2010 to 2013
PNG Kina Financial Year (FY)
Income 2010 2011 2012 2013 (estimated)
A: FEE INCOME
Fees paid by self-sponsored students55
Fees paid by scholarship providers56
Fees paid by employers
Total Fee Income
(Amount of fees for boarding included in total above)57
B: OTHER FINANCIAL SUPPORT
Financial support from industry58
Teacher salary funding received through TSC59
Total Other Financial Support
C: OPERATIONAL GRANTS FROM GOVERNMENT60
D: GRANTS FROM DONORS & NGOS
Operating grant from official overseas aid61
Operating grant from churches, NGOs etc
Total donor & NGO grants for operating purposes
E: INTERNAL INCOME GENERATION62
F: TOTAL RECURRENT INCOME ( A + B + C + D + E)
G: CAPITAL INCOME
GoPNG grants or loans for capital purposes
Donor grants or loans for capital purposes
TOTAL CAPITAL INCOME
TOTAL INCOME (F+G)
[Table continues on next page]
55
Fees paid wholly by the student or his/her family. 56
Scholarship providers include TESAS, provincial or local governments and MPs, the Independence Fellowship Scheme and donors. If fees are paid partly by scholarship and partly by student, enter all the fees in this line. 57
Show separately here the total amount received each year as Board and Lodging fees. 58Any cash support from industry (other than payment of course fees for their workers), and support in kind if a money value can be assigned to it. 59
The cost of teacher salaries and other emoluments paid for by the Teaching Services Commission., The Study will obtain the cost information about any expatriate contract teachers from NDoE. 60
Include here operating grant from NDoE, and any grants received from the provincial government or local-level governments. Enter capital grants in Section G below. 61
Aid from an overseas government or multilateral aid organisation (egAusAID, World Bank, European Union). 62
Include here income generated by institution e.g. from short courses, hiring out facilities or vehicles, selling produce or services etc.

Research into the Financing of TVET in the Pacific PNG Country Report
190
Expenditure 2010 2011 2012 2013 (estimated)
H: SALARY, WAGES & OTHER EMOLUMENTS63
Full-time teaching/instructional staff- PNG nationals64
Part-time teaching staff paid by Governing Council
Administration, general and all other non-teaching staff
Total staff emoluments
I: OTHER OPERATING EXPENDITURE
Boarding costs, including messing65
All Other Operating Expenditure except boarding costs.
Total - other operating expenditure
Total recurrent expenditure H + I
J: STAFF & CURRICULUM DEVELOPMENT EXPENDITURE66
K: CAPITAL EXPENDITURE67
Total Expenditure H + I +J + K
63
Emoluments include salaries, wages, living allowances, and pension contributions. 64
Include here spending on teaching staff funded both from TSC payroll and by Governing Council. 65
The costs of feeding boarders and maintaining dormitories. 66
Annual expenditure on staff development, developing new courses, etc 67
Expenditure on the purchase of items costing K2000 or more and having a useful life of one year or more, e.g. building extensions, equipment purchases, purchase of vehicles.

Research into the Financing of TVET in the Pacific PNG Country Report
191
Table 2 Number of staff employed by training provider
Teaching year 2010 2011 2012
Staff category
Full-time
equivalent
(FTE)68
Full-time
equivalent
(FTE)69
Full-
time70
Part-
time71
Full-time
equivalent
(FTE)72
Teaching staff (PNG national
full-time lecturers and
instructors)
Part-time teachers paid by Governing Council
Expatriate contract teachers
Non-teaching staff
(administration and general
staff)
Total number employed
68
A staff member employed full-time = 1FTE; a staff member employed on a half-time basis = 0.5 FTE, etc 69
A staff member employed full-time = 1FTE; a staff member employed on a half-time basis = 0.5 FTE, etc 70
Employed for 35 hours or more per week 71
Employed for less than 35 hours a week or on a casual basis 72
A staff member employed full-time = 1FTE; a staff member employed on a half-time basis = 0.5 FTE, etc

Research into the Financing of TVET in the Pacific PNG Country Report
192
Table 3 TVET programs offered by the training provider in 201273
TVET program/course
name
and description
level74
course
fee for
day
student
(kina)75
max. no of
student
contact hours
Duration
(eg 1 year,
1 semester,
8 weeks)
no. of
teaching
staff
(f/t
equiv)
Total
enrolments
as at
Semester 2,
2012
graduations76
for year ended
31st December,
2012
M F T M F T
[Program name77
]
Total enrolments-all programs
No. of Boarders included in total enrolment
73
Please include short courses provided on a fee for service basis as well as programs leading to national qualifications. 74
State whether diploma, apprenticeship extension course, competency-based certificate (eg NC1 or NC2), technical trade certificate or PETT, or short course not leading to formal qualification . 75
Give here the full fee payable for the course including all compulsory charges. Exclude boarding fees. 76
Graduation occurs on successful completion of the course. Students on a multi-year course graduate only once. Course may have two lots of graduations in 2012 if its duration is 1 semester. 77
Name should be based on field of study – e.g. Accounting, Electrical Trade etc

Research into the Financing of TVET in the Pacific PNG Country Report
193
ANNEX 7. ENTERPRISE TRAINING EXPENDITURE SURVEY
The information you provide us will be treated with the strictest confidentiality, and will not be identifiable in any of the results of the survey.
ENTERPRISE NAME
ADDRESS
NAME OF CONTACT
ROLE/TITLE

Research into the Financing of TVET in the Pacific PNG Country Report
194
SECTION A: ENTERPRISE TYPE 1 What type of enterprise is this?
please tick
√
Government-owned business enterprise
Co-operative
Wholly PNG-owned private enterprise
Wholly foreign-owned enterprise
Joint venture company with mixed PNG and foreign ownership
Wholly PNG NGO
International NGO
Religious organisation
Other
2 What is the main industry in which the enterprise operates? Please tick
√
A Agriculture, forestry and fishing
B Mining
C Manufacturing
D Electricity, gas and water supply
E Construction
F Wholesale trade
G Retail trade
H Accommodation, cafes and restaurants
I Transport and storage
J Communication services
K Finance and insurance
L Property and business services
M Government administration
N Education
O Health and community services
P Cultural and recreational services
Q Personal and other services

Research into the Financing of TVET in the Pacific PNG Country Report
195
SECTION B: ENTERPRISE SIZE 3 What was the number of people employed as at end 2012?
Number of employees as at end 2012
Full-time employees
(35 hours or more per week on average)
Females
Males
Full-time Sub-total
Part-time employees
(Less than 35 hours per week on average)
Females
Males
Part-time Sub-total
Total employees
Females
Males
Total Number of Employees

Research into the Financing of TVET in the Pacific PNG Country Report
196
SECTION C: ENTERPRISE INVOLVEMENT WITH TRAINING 4a Is your enterprise approved by the National Training Council as a Registered Training
Organization? (Please tick)
√
Yes
No
4b Is your enterprise approved by the National Apprenticeship and Trade Testing Board as an
apprenticeship training provider?
(please tick) √
Yes
No
If you answered ‘Yes’ to 4a or 4b, go to 4c or 4d as appropriate. If you answered ‘No’ to both 4a and 4b, go to 5. 4c If yes to 4a, please list those courses registered with NTC which ran in 2012, and the numbers trained on each course in 2012.
Course registered with NTC, and which ran in 2012 Numbers trained in 2012
Course name -1 Please see attached list TOTAL NUMBER TRAINED
Course name - 2
Etc
Total
4d If yes to 4b, please list the trades in which apprentices were trained in 2012, and the number trained in each:
Apprenticeship training delivered in 2012 Numbers trained in 2012
Name of trade - 1
Name of trade - 2
Etc
Total

Research into the Financing of TVET in the Pacific PNG Country Report
197
5 How many of your employees participated in training in 2012?
All Employees New employees recruited in last 12 months (excluding
apprentices)
A B C D
Total number of employees
Number who participated in training in last
12 months
Number of new
employees recruited in
last 12 months
New employees who have
participated in training
78
Male
Female
Total
Check Numbers of Employees in Table 5 (Column A) match numbers in Table 3.
78
E.g. Staff development, accompanying the introduction of new systems, equipment, etc

Research into the Financing of TVET in the Pacific PNG Country Report
198
6. What is the estimated average duration of training per employee in hours in the last 12 months?
Note: To calculate hours, estimate average number of days per staff member in each category in the last 12 months then multiply by 8 (working hours per day).
Hours of training in last 12 months
For employees recruited in last 12 months
For all other employees
(not recruited in last 12 months)
In-house structured training79
Structured training using external training providers
Government provider (e.g. a tech. or bus. college)
Church provider
University
Private training provider
Industry or professional association
Equipment and/or product manufacturer/supplier
Overseas training provider
Other (please specify)
Unstructured training80
Total hours on average per employee
79
For example, internal workshops, lectures, etc; computer assisted training programs; other enterprise conducted training courses, etc 80
Includes on-the-job training as the need arises - reading manuals, journals or training notes, training through group discussion, computer-assisted unstructured training, etc

Research into the Financing of TVET in the Pacific PNG Country Report
199
SECTION D: ENTERPRISE EXPENDITURE ON TRAINING 7 What was the estimated gross amount spent on training by this enterprise in 2012 ?
Provider costs Kina
Salaries, wages and other emoluments for designated training staff, managers and instructors
200,000.00
Costs of equipping and operating dedicated training facilities, including training materials, utility charges, etc
Apprenticeship training fees
Industry association training fees, levies, etc
Fees to external training providers
Other, including in-kind (please specify)
Sub-total Provider Costs
Trainee support costs
Employees' wages and salaries while attending training
Employees' external structured training fees
Employees' training materials (e.g. tool kits)
Employees' travel or accommodation costs during training.
Other (please specify)
Sub-total Trainee Support Costs
Estimated gross training expenditure in 2012
8 The Government training levy at 2% of payroll
Circle Yes or No to 8.1 and 8.2
8.i Was the enterprise liable to pay the 2% levy in 2012? Yes No
8.ii Did the firm claim full exemption from the levy in 2012 on account of eligible training provided?
Yes No
8.iii If you answered Yes to 8.i and No to 8.ii, how much levy did the firm pay in 2012?
Enter amount in
Kina in box to right

Research into the Financing of TVET in the Pacific PNG Country Report
200
9 What funding sources were available in 2012 to enable the enterprise to reduce the net
cost of training?
Kina
Trainee fees
Government subsidies or incentive payments
Other (please specify)
None
Estimated Total Funding Available
END OF SURVEY - THANK YOU ………………………………………………………………………………………………………………… OFFICE USE ONLY Date of interview…………………………………………………………………………… …………………………………………………………………………………………………….. Questionnaire Completed…………………………………………………………Yes/No

Research into the Financing of TVET in the Pacific PNG Country Report
201
ANNEX 8. CLASSIFICATION AND CODING SYSTEMS USED This Annex records the systems for classifying fields of study and occupations. The commonly used International Standard Classification of Education (ISCED) does include a classification by field of education, however those fields have been considered too broad for the purpose of collecting and coding data on fields of vocational education and training. Thus, a sub-classification of the ISCED classification by field of education was created with the dual aim of providing more detail and precision, while simultaneously maintaining the logic and structure of ISCED. The new classification concerns ‘fields of vocational education and training’; the term ‘fields of training’ is used for short. It is used in this context to provide a general understanding of trends in unit costs across fields of training where costs at course level are not possible to determine. More information is available here: http://www.cedefop.europa.eu/EN/Files/5092_en.pdf International classification and coding systems were applied in this study for the following variables:
Fields of training
Occupations
Industries Fields of training 0. General Programs
010 Basic programs 080 Literacy and numeracy 090 Personal development
1. Education
141 Teaching and training 142 Education science
2. Humanities and the arts
211 Fine arts 212 Music and performing arts 213 Audio-visual techniques and media production 214 Design 215 Craft skills 221 Religion and theology 222 Foreign languages and cultures 223 Mother tongue 224 History, philosophy and related subjects

Research into the Financing of TVET in the Pacific PNG Country Report
202
3. Social sciences, business and law
310 Social and behavioural science 321 Journalism and reporting 322 Library, information, archive 341 Wholesale and retail sales 342 Marketing and advertising 343 Finance, banking, insurance 344 Accounting and taxation 345 Management and administration 346 Secretarial and office work 347 Working life 380 Law
4. Science
420 Life science 440 Physical science 460 Mathematics and statistics 481 Computer science 482 Computer use
5. Engineering, manufacturing and construction
521 Mechanics and metal work 522 Electricity and energy 523 Electronics and automation 524 Chemical and process 525 Motor vehicles, ships and aircraft 541 Food processing 542 Textiles, clothes, footwear, leather 543 Materials (wood, paper, plastic, glass) 544 Mining and extraction 581 Architecture and town planning 582 Building and civil engineering
6. Agriculture
621 Crop and livestock production and fishery 622 Horticulture 623 Forestry 624 Fisheries 640 Veterinary
7. Health and welfare
721 Medicine 722 Medical services 723 Nursing 724 Dental studies 761 Child care and youth services 762 Social work and counselling

Research into the Financing of TVET in the Pacific PNG Country Report
203
8. Services
811 Hotel, restaurant and catering 812 Travel, tourism and leisure 813 Sports 814 Domestic services 815 Hair and beauty services 840 Transport services 850 Environmental protection 861 Protection of property and persons 862 Occupational health and safety 863 Military
Source: European Centre for the Development of Vocational Training (CEDEFOP) Fields of Training Manual, Eurostat, 1999,
1. Occupations
1. Managers 11 Chief executives, senior officials and legislators 12 Administrative and commercial managers 13 Production and specialized services managers 14 Hospitality, retail and other services managers
2. Professionals 21 Science and engineering professionals 22 Health professionals 23 Teaching professionals 24 Business and administration professionals 25 Information and communications technology professionals 26 Legal, social and cultural professionals
3. Technicians and associate professionals 31 Science and engineering associate professionals 32 Health associate professionals 33 Business and administration associate professionals 34 Legal, social, cultural and related associate professionals 35 Information and communications technicians
4. Clerical support workers 41 General and keyboard clerks 42 Customer services clerks 43 Numerical and material recording clerks 44 Other clerical support workers
5. Service and sales workers 51 Personal service workers 52 Sales workers 53 Personal care workers 54 Protective services workers
6. Skilled agricultural, forestry and fishery workers 61 Market-oriented skilled agricultural workers 62 Market-oriented skilled forestry, fishing and hunting workers 63 Subsistence farmers, fishers, hunters and gatherers

Research into the Financing of TVET in the Pacific PNG Country Report
204
7. Craft and related trades workers
71 Building and related trades workers, excluding electricians 72 Metal, machinery and related trades workers 73 Handicraft and printing workers 74 Electrical and electronic trades workers 75 Food processing, wood working, garment and other craft and related trades
workers
8. Plant and machine operators, and assemblers 81 Stationary plant and machine operators 82 Assemblers 83 Drivers and mobile plant operators
9. Elementary occupations 91 Cleaners and helpers 92 Agricultural, forestry and fishery labourers 93 Labourers in mining, construction, manufacturing and transport 94 Food preparation assistants 95 Street and related sales and service workers 96 Refuse workers and other elementary workers
10. Armed forces occupations 01 Commissioned armed forces officers 02 Non-commissioned armed forces officers 03 Armed forces occupations, other ranks
Source: ILO International Standard Classification of Occupations, 2008 (ISCO-08) Industries
Agriculture, Forestry and Fishing
Mining
Manufacturing
Electricity, Gas and Water Supply
Construction
Wholesale Trade
Retail Trade
Accommodation, Cafes and Restaurants
Transport and Storage
Communication Services
Finance and Insurance
Property and Business Services
Government Administration and Defence
Education
Health and Community Services
Cultural and Recreational Services
Personal and Other Services
Source: ABS, Australian and New Zealand Standard Industrial Classification (ANZSIC), 1993

Research into the Financing of TVET in the Pacific PNG Country Report
205
ANNEX 9. SURVEY FORM: PRIVATE TRAINING PROVIDERS To The Principal From: the PNG Research Team
PO Box 1907 Port Moresby NCD E-mail: [email protected] Tel: 7125 9567 Xx August 2012
Dear Principal, Initial Survey of Private Training Providers in Papua New Guinea AusAID has contracted the Australian Council for Educational Research (ACER) to conduct a comparative study of the financing of technical and vocational education and training (TVET) in seven Pacific countries – Papua New Guinea, Samoa, Vanuatu, Tonga, Solomon Islands, Kiribati and Fiji over the period 2012-2013. We shall work very closely with the Government of Papua New Guinea on the PNG Case Study, through a Reference Group representing key stakeholders here, including the National Training Council. The Study aims to take a broad view of what constitutes TVET, and to look at both the public and private sectors, with a view to generating options for Pacific Island countries to develop TVET services to meet national needs, using whatever methods of funding may be most effective. PNG has a sizeable private sector of TVET but there is much less information about it than for the public sector. We have been asked in Phase 1 of our work in PNG (to take place in 2012) to develop a standard methodology for calculating the level of private sector investment in TVET. In order to do that we are undertaking, with the agreement of the National Training Council, a preliminary survey of private training providers in PNG. Our survey covers “mission” as well as private foundations. The aim of this initial survey is to get a broad picture of the scale of private and mission training in PNG, and how it is funded. We can then combine that with existing information on public sector training to map the overall scale and nature of TVET in PNG at the present time. We hope that the map will be of value in itself to participants in PNG’s TVET system; and it is essential for effective planning of the second, more detailed, phase of our work in 2013. In keeping with that aim the Study team will not release to any other party information which identifies individual institutions. All numerical information from the survey will be summarized and presented as statistics. The Survey is available in both paper and electronic formats. We will:
deliver a paper copy of the survey forms by post or hand to every provider asked to complete it, together with a reply paid envelope;
e-mail the forms in electronic format to providers for whom we hold e-mail addresses.
The electronic format includes Excel templates for the tables and should be easier to use. If you receive only a paper copy of the Survey but have an e-mail address, please e-mail us a request for the electronic version.

Research into the Financing of TVET in the Pacific PNG Country Report
206
Details of how to complete the survey are set out in the attachment and accompanying tables. If you need help, please contact Simaima Tavil-Melachon by phone or e-mail ([email protected], 7125 9567). We shall be most grateful for your co-operation with the survey. Please return the completed forms by e-mail to Simaima, or by post in the reply paid envelope provided, to reach us by 5th September 2012. Thank you for your co-operation with this survey; we trust that the outcome will make better known the contribution which the private and mission providers make towards meeting PNG’s needs for technical and vocational education and training. Robert Horne Lead Researcher

Research into the Financing of TVET in the Pacific PNG Country Report
207
Attachment Initial Survey of Private Training Providers in Papua New Guinea Guidance Notes, Questions and Tables
General
1. This survey is addressed to registered training organisations (RTOs) in PNG classified as private sector and included in the RTO list posted to the NTC website on 13th June 2012, and to certain other training organisations.
2. For the purpose of the survey, TVET is defined to include any structured education or training with a vocational aim, below the level of a Bachelor Degree, subject only to the exceptions listed at (3) below). It thus includes diplomas, and certificate courses, and any other structured training, including short courses.
3. TVET conducted with a view to preparing students to enter service with the PNG Defence Force, the Police, as a school teacher, nurse or community health worker, or as professional development for those sectors, is outside the scope of the study, and should not be included in your returns. A few RTOs known to specialise in these sectors have been excluded from the survey. Table 1
4. For enrolments the focus of the survey is on the numbers of students who were enrolled on courses which were active on Monday 27th August 2011. Any course which begins on or before the 27th August and ends on 27th August or later is “active” on 27th August. Please include all enrolments in active courses, whether or not the course actually met on 27th August, and include any enrolled students who happened to miss their classes on 27th August.
5. If your institution had no students enrolled in TVET on 27th August, please contact the Study Team to discuss whether to make a Nil Return to the survey, or to complete it for another period.

Research into the Financing of TVET in the Pacific PNG Country Report
208
6. Table 1 is divided into two parts:
Part A – for PNG providers -separates training leading to qualifications under the PNG Qualifications Framework for TVET from other training, but enables providers to record training for formal qualifications established before the PNGQF came into being. Training not leading to formal qualifications is divided between longer courses (200 hours or over) and shorter courses (less than 200 hours).
Part B – for foreign RTOs and foreign qualifications - allows you to list in the first three rows enrolments in courses leading to diplomas, certificates or units of competency within the Australian Qualifications Framework, or other foreign qualification system. The second two rows are for other foreign courses, subdivided into longer and shorter courses.
Providers who offer both PNG and foreign courses will need to complete both Parts A and B. Table 2
7. Table 2 is about the number of students who graduated in the calendar year 2011. Enter here only those students who successfully completed their course in that year.
Table 3
8. For income and expenditure, the focus is on income received, and expenditure incurred, during the calendar year 2011. Further guidance is in footnotes to the table.
Table 4
9. Please summarise here the fees currently charged to students or sponsors for the principal types of courses offered by the institution. There is no need to itemise fees for individual courses.

Research into the Financing of TVET in the Pacific PNG Country Report
209
Name of Institution: Table 1 – Enrolments by gender, type of course and field of study as at 27th August 2012 Part A – PNG Providers
Field of Study
Level of Course Business Studies, inc Accounting, HR, Management, Government
Information & Communications Tech.
Tourism and Hospitality, Food Handling, Cookery
Trade Technology inc Mining, Engineering, Construction
Agriculture Fisheries, Forestry
OHS, Safety, Security Services, First Aid
Any other field of study
Totals All Students
M F M F M F M F M F M F M F
PNG NQF Course81
Other PNG formal qualification82
Extension course for apprentices
Course of 200 or more hours not leading to formal qualification
Course of under 200 hours not leading to formal qualification
Totals
81
National Certificate, Statement of Attainment based on the criteria in the PNG National Qualifications Framework for the TVET sector. 82
Formal qualifications of types which preceded the NQF, such as the Technical Trade Certificate, and vocational qualifications below the level of Bachelor degree accredited by PNG universities.

Research into the Financing of TVET in the Pacific PNG Country Report
210
Table 1 Continued Part B – Foreign Providers and Qualifications
Field of Study
Level of Course Business Studies, inc Accounting, HR, Management, Government
Information & Communications Tech.
Tourism and Hospitality, Food Handling, Cookery
Trade Technology inc Mining, Engineering, Construction
Agriculture Fisheries, Forestry
OHS, Safety, Security Services, First Aid
Any other field of study
Totals All Students
Foreign providers83 M F M F M F M F M F M F M F
Diploma
Certificate
Unit of Competency
Any other foreign course of 200 hours or more
Any other foreign course of less than 200 hours
Total Foreign RTOs
Total All Courses in Parts A and B
83
Include here also foreign qualifications delivered by PNG RTOs.

Research into the Financing of TVET in the Pacific PNG Country Report
211
Table 2 – Graduations in 2011
Part A PNG Qualifications M F Total
PNG NQF Course84
Diploma85
Certificate (other than NC 1 and 2 under NQF)86
Extension course for apprentices
Other PNG Formal Qualification
Courses not leading to Formal Qualification
Totals
Part B Foreign Qualifications
Diploma
Certificate
Unit of Competency87
Other Formal Qualification
Courses not leading to a Formal Qualification
Totals
84
National Certificate, Statement of Attainment based on the criteria in the PNG Qualifications Framework for the TVET sector. 85
Ordinary or Advanced Diploma 86
Technical Trade Certificate or similar (not the NC1 and NC2 courses based on the PNG QF criteria). 87
Unit of competency recognised under the Australian Qualifications Framework or similar.

Research into the Financing of TVET in the Pacific PNG Country Report
212
Table 3: Income and Expenditure in 2011 Related to Provision of Registered Training
[Name of institution]
Revenue
Revenue Stream Total Revenue (Kina) Percentage of Revenue
Fees charged to students
Fees charged to employers
Financial support from industry88
Government grants89
Donor grants
Other income90
Total income
Expenditure
Item of Expense Expenditure (Kina) Percentage of Expenditure
Emoluments for teaching staff91
Emoluments for other staff
Rents and mortgages92
All other recurrent expenditure
Development expenditure93
Capital expenditure94
Total Expenditure
88
Any cash support from industry, and support in kind if a money value can be assigned to it. 89
Include here any grants from national, provincial or local-level governments. 90
Include here income from selling goods and services produced by the institution. 91
Emoluments include salaries, leave fares, pension contributions etc. 92
Cost of rental or loan repayments in respect of land and buildings. 93
Annual expenditure on staff development, developing new courses etc 94
Expenditure on the purchase of items costing K2000 or more and having a useful life of one year or more., e.g. building extensions, equipment purchases, purchase of vehicles.

Research into the Financing of TVET in the Pacific PNG Country Report
213
Table 4: Summary of current fees by Type of Course
Type of Course Duration95 Fee in Kina
Thank you for completing the survey. Please enter here the name and contact details of a person we can contact if we have any queries on the forms: Name: Phone No: E-mail address (if any): Date when you completed the forms:
95
Please specify duration– e.g. one year, one semester, 8 weeks, 20 hours.

Research into the Financing of TVET in the Pacific PNG Country Report
214
ANNEX 10. REFERENCES PNG government agency publications and documents National Department of Education of PNG, 2009 Education Statistics of Papua New Guinea
National Department of Education of PNG, Achieving a Better Future; A National Plan for Education
2005-2014, NDoE 2004
National Department of Education of PNG, Implementation of 2012 tuition fee free education and tuition
fee subsidy policy, NDoE 2012.
National Department of Education of PNG, Maximum Course Fee Limits for TVET Institutions for 2013,
Secretary’s Circular 65/2012, October 2012.
National Department of Education of PNG, Tuition Fee Free/Education Subsidy Fees and Commodity
Component for 2013, Ministerial Policy Statement 02/2013 dated 5th March 2013
National Education Board of PNG, 2014 Maximum School Fee Limits for TVET and Primary Teachers
Colleges, NEB Circular No. 01/2014, dated 14 Jan 2014.
Office of Higher Education of PNG, Annual Survey of Institutions of Higher Education, (volumes for
2009, 2010, 2011)
Office of Higher Education of PNG, Annual Management Report 2012
National Statistical Office of PNG, Final Figures, National Population and Housing Census, November
2013
National Statistical Office of PNG 2009-2010 Papua New Guinea Household Income and Expenditure
Survey Summary Tables.
Department of Treasury of PNG, 2013 National Budget, budget papers in three volumes.
Corresponding volumes for 2011, 2012 and 2014 also used.
Department of Treasury of PNG, 2014 Budget Strategy Paper
National Strategic Plan Taskforce, Papua New Guinea Vision 2050
Department of National Planning and Monitoring of PNG (DNPM), PNG Medium-Term Development
Plan 2011- 2015
DNPM, PNG Development Strategic Plan 2010-2030, Port Moresby March 2010
OHE and DNPM, PNG National Labour Market Assessment – Demand Data Report and Supply Data
Report, August 2010
Department of Labour and Industrial Relations of PNG, Independence Fellowship Scheme, a note by
the Director of IFS, 2013
National Training Council of PNG, The National Human Resource Development Policy 2010
National Training Council of PNG, PNG Qualification Framework TVET Sector, Revised Version
1.2/2013
Commission for Higher Education, Papua New Guinea National Qualifications Framework, March 2010
Law of Papua New Guinea, Inclusive Education for National Development of Community Education Act
2008
National Co-ordinating Committee for Disabilities of PNG, PNG National Policy on Disability,
Department for Community Development 2005

Research into the Financing of TVET in the Pacific PNG Country Report
215
University Of Natural Resources and the Environment, Consolidated Operating Budget Estimates 2012,
attached to Bursar’s Report to the Council Meeting of 9th April 2013
Pacific Regional Documents
Secretariat of the Pacific Board for Educational Assessment, Referencing the Papua New Guinea
Qualifications Framework against the Pacific Qualifications Framework, SPBEA 2013
Asian Development Bank, Skilling the Pacific: Technical and Vocational Education and Training in the
Pacific, Asian Development Bank and Pacific Islands Forum Secretariat, 2008
Australian Aid Documents
Papua New Guinea, Report on Phase 1 and Proposed Plan for Phase 2, by Robert Horne, Ken
Ngangan, and Simaima Tavil-Melachon, ACER, April 2013
Needs Analysis Study of PNG TVET Colleges, prepared by I. Hind, J. Larsen, D. Week and E. Peni,
July 2011.
Labour Market Analysis for PNG, Revised Report by K Gannicott March 2011
PNG Universities Review, Report to Prime Ministers Somare and Rudd, prepared by Professor Ross
Garnaut and Sir Rabbie Namaliu, May 2010
Papua New Guinea; a Study of the Unit Costs of Education, prepared by PDP Australia March 2007
Other International Agency Documents
Asian Development Bank, Technical-Vocational Skills Development in Papua New Guinea, ADB 2007
Asian Development Bank, PNG Employment-Oriented Skills Development Project, Completion Report,
December 2008
World Bank, A Review of National Training Funds by Richard Johanson, World Bank 2009
World Bank, Health, Nutrition and Population (HNP) Statistics, downloaded from
http://web.worldbank.org/WBSITE/EXTERNAL/TOPICS/EXTHEALTHNUTRITIONANDPOPULATION/E
XTDATASTATISTICSHNP/EXTHNPSTATS/0,,contentMDK:2173
Other
PNG Education Experience Survey and Literacy Assessment, A Report on Five Provinces by ASPBAE
Australia and PNG Education Advocacy Network, 2011

The project Research into the Financing of Technical and Vocational Education and Training (TVET) in the Pacific was managed by the Australian Council for Educational Research (ACER) and Scope Global on behalf of the Australian Government. The project was undertaken between 2012 and 2014 under contract to the Australian Government, initially through AusAID and then the Department of Foreign Affairs and Trade (DFAT).
The study was conducted in seven Pacific countries: Fiji; Kiribati; Papua New Guinea; Samoa; Solomon Islands; Tonga; and Vanuatu. The aims of the research were to produce, in conjunction with host country governments and TVET stakeholders, comprehensive analyses of the systems for financing TVET and discussions of policies through which the financing of TVET could be made more efficient and effective. This volume is one of the seven country reports produced by the study.
ISBN 978-1-74286-271-2
9 781742 862712