foreign firm characteristics, absorptive capacity and the
TRANSCRIPT

Policy Research Working Paper 6265
Foreign Firm Characteristics, Absorptive Capacity and the Institutional Framework
The Role of Mediating Factors for FDI Spillovers in Low- and Middle-Income Countries
Thomas Farole Deborah Winkler
The World BankPoverty Reduction and Economic Management NetworkInternational Trade DepartmentNovember 2012
WPS6265
Produced by the Research Support Team
Abstract
The Policy Research Working Paper Series disseminates the findings of work in progress to encourage the exchange of ideas about development issues. An objective of the series is to get the findings out quickly, even if the presentations are less than fully polished. The papers carry the names of the authors and should be cited accordingly. The findings, interpretations, and conclusions expressed in this paper are entirely those of the authors. They do not necessarily represent the views of the International Bank for Reconstruction and Development/World Bank and its affiliated organizations, or those of the Executive Directors of the World Bank or the governments they represent.
Policy Research Working Paper 6265
Using a cross-section of more than 25,000 domestic manufacturing firms in 78 low and middle-income countries from the World Bank’s Enterprise Surveys, this paper assesses how mediating factors influence intra-industry productivity spillovers to domestic firms from foreign direct investment. It identifies three types of mediating factors: (i) foreign direct investment spillover
This paper is a product of the International Trade Department, Poverty Reduction and Economic Management Network. It is part of a larger effort by the World Bank to provide open access to its research and make a contribution to development policy discussions around the world. Policy Research Working Papers are also posted on the Web at http://econ.worldbank.org. The authors may be contacted at [email protected] and [email protected].
potential, (ii) domestic firm absorptive capacity, and (iii) the host country’s institutional framework. It finds that all three affect the extent and direction of foreign direct investment spillovers on domestic firm productivity. However, the impact of mediating factors depends significantly on the level of domestic firms’ productivity and the structure of foreign ownership.

Foreign Firm Characteristics, Absorptive Capacity and
the Institutional Framework
The Role of Mediating Factors for FDI Spillovers
in Low- and Middle-Income Countries
Thomas Farole* and Deborah Winkler†
Key words: foreign direct investment, spillovers, productivity, firm characteristics, absorptive capacity, institutions JEL: F1, F2
* Senior Trade Specialist, International Trade Department, The World Bank. Email: [email protected]. † Consultant, International Trade Department, The World Bank. Email: [email protected]. This paper is part of a wider study on the spillover effects of foreign direct investment and their mediating factors conducted by the International Trade Department of the World Bank. The authors would like to thank Holger Görg, Bernard Hoekman, Beata Javorcik, and Ben Shepherd for valuable comments on a previous version of this paper and Torfinn Harding, Daniel Lederman, Minh Cong Nguyen, Federica Saliola, and Murat Seker for assistance with the data. The authors gratefully acknowledge funding from the Bank-Netherlands Partnership Program (BNPP). The views expressed in this paper are those of the authors and should not be attributed to the World Bank, its executive directors, or the countries they represent.

2
1 Introduction
Most countries devote considerable attention and resources to attracting foreign direct
investment (FDI). This is done in the hope not only of generating benefits like jobs, foreign
exchange, and tax revenues, but perhaps more importantly in realizing dynamic benefits to the
domestic economy through so-called “spillovers” from FDI. These “spillovers” generally refer to
productivity improvements resulting from knowledge diffusion – both in the form of unintentional
transmission or intentional transfer – from multinational affiliates to domestic firms, encompassing
both technology and all forms of codified and ‘tacit knowledge’ related to production, including
management and organizational practices. The existence of spillovers is based on the assumption
that multinational firms enjoy technological and other advantages and have, therefore, higher levels
of productivity (Hoekman and Javorcik 2006).
Spillovers can diffuse from foreign firms to local producers within the same industry (intra-
industry or horizontal spillovers) or to another industry (inter-industry or vertical spillovers).3 In
the latter case, they can affect local input or services suppliers in upstream sectors (backward
spillovers) and local customers in downstream sectors (forward spillovers). But clearly the firms,
sectors, and countries involved in this process vary substantially, and therefore, the nature and
scale of productivity spillovers should also be expected to vary in different contexts. In this paper,
we are concerned with identifying and understanding the mediating factors that determine intra-
industry productivity spillovers from FDI in low- and middle-income countries.
A vast set of empirical evidence has been amassed over the past decade on the existence and
direction of FDI-generated horizontal and vertical spillovers (for a review of the literature, see for
example Görg and Greenaway 2004; Lipsey and Sjöholm 2005; Smeets 2008; and Havranek and
Irsova 2011). Overall, the results are mixed, and suggest that the postulated spillover effects often
do not materialize automatically. As a result, more and more research has been devoted to
understanding the various conditions that may explain these mixed results. Three major types of
mediating factors have been identified, including (i) characteristics of foreign firms, which shape
spillover potential; (ii) characteristics of domestic firms, which shape absorptive capacity to
internalize spillovers; and (iii) differences in host country factors (Castellani and Zanfi 2003; Lipsey 3 The terms horizontal and vertical spillovers can be used analogously if sectors are narrowly defined. If sectors are defined at a more aggregated level, some intra-industry spillovers can, in reality, present vertical spillovers.

3
and Sjöholm 2005), which shape both domestic and foreign firm characteristics as well as the
transmission channels for spillovers (Paus and Gallagher 2008).
Using a cross-section of more than 25,000 domestic manufacturing firms in 78 low- and
middle-income countries from the World Bank’s Enterprise Surveys Indicator Database, we assess
how mediating factors influence intra-industry productivity spillovers to domestic firms from FDI.
This paper contributes to the growing body of research on mediating factors for FDI spillovers in
several ways:
First, most studies are limited to examining a single mediating factor, with the majority
focusing on the absorptive capacity of domestic firms. Fewer studies analyze the role of foreign
investors or host country characteristics and the institutional context for FDI-enhanced
productivity spillovers. To our knowledge, only Havranek and Irsova (2011) control for all three
types of mediating factor. Their meta-analysis uses the t-statistic of existing FDI spillover estimates
from other studies as the dependent variable. In contrast, this study estimates the impact of FDI
directly on productivity, and introduces all three types of mediating factors in the form of
interaction terms with the FDI presence variable. While the methodological approach of this study
is similar to Blalock and Gertler (2009), their study focuses only on a domestic firm’s absorptive
capacities.
Secondm related to the relatively low number of studies that take into account the
characteristics of foreign investors is the fact that studies have neglected the specific dynamics
within global value chains (GVCs). Global production networks are “led by large firms based
typically in the industrialized countries, and relying often on complex networks of suppliers around
the world” (Milberg and Winkler, forthcoming). The potential for FDI spillovers, however, is
determined by the GVC in which foreign firms operate and by the specific GVC dynamics, including
the FDI motive and sourcing strategy, among others (Paus and Gallagher 2008). This study
addresses this gap in the literature by including two measures that proxy for foreign investors’ FDI
motive and sourcing behavior.
Third, most studies adding mediating factors focus on one or a few variables only. Even the
meta-analysis by Meyer and Sinani (2009) covers only seven institutional variables4. This study
takes a more comprehensive approach, focusing on four variables reflecting the FDI spillover
4 In addition, their study also differs in terms of methodology, as it uses the t-statistic of FDI spillover estimates from existing research as the dependent variable.

4
potential, six variables representing a domestic firm’s absorptive capacity, and eleven variables
covering national characteristics and the institutional framework.
Fourth, as mentioned above, most studies – with the exception of meta-analyses (e.g. Meyer
and Sinani 2009; Havranek and Irsova 2011) – tend to focus on a specific country setting. While
such studies have the advantage of examining a specific locational context, using a cross-section of
78 low and middle-income countries allows for the possibility of more generalizable results.
Fifth, it might be possible that mediating factors, such as firm size or exporting capabilities, are
a reflection of heterogeneous firm-level productivity (Melitz 2003). Girma and Görg (2007, p. 220),
for example, point out that “[i]n the presence of heterogeneous productivity processes, it is more
appropriate (and arguably more interesting) to examine the dynamics of productivity at different
points of the distribution rather than ‘average’ properties (i.e. conditional means).” Acknowledging
the fact that firms are heterogeneous in terms of their productivity, we also examine if the role of
mediating factors for FDI spillovers is a function of domestic firms’ productivity.
And finally, studies have pointed to the higher spillover potential of foreign affiliates with
partial foreign ownership (Javorcik 2004, Javorcik and Spatareanu 2008, Abraham, Konings, and
Slootmaekers 2010, Havranek and Irsova 2011), confirming the view that the likelihood of
technology leakages and knowledge spillovers are higher from foreign firms with local
participation. To our knowledge, this paper is the first paper to show that foreign ownership
structure not only matters for FDI spillovers, but also for the impact of other mediating factors.
This paper is structured as follows. In section 2, we identify the mediating factors we use in our
empirical analysis and refer to other empirical studies that have used these variables. Section 3
introduces the data and econometric model. In section 4 we present our regression results, while
section 5 concludes.
2 Mediating Factors
Farole, Staritz, and Winkler (2012) develop a conceptual framework which depicts various
mediating factors, as identified in the literature (see Appendix 1). At the foreign investor level,
mediating factors include the FDI motive, sourcing strategy, degree of foreign ownership, and
technology intensity, among others, which all can influence the FDI spillover potential. The role of
these mediating factors is discussed in section 2.1. At the domestic firm level, studies identify, e.g.,
research and development (R&D), human capital, technology gap, firm size, export behavior, firm

5
location, and sectoral competition, as mediating factors, which we examine in section 2.2. These
factors determine the local firm’s absorptive capacity. Factors at the host-country and institutional
level can influence foreign and domestic firm characteristics as well as the transmission channels
through which knowledge diffuses from multinational to local firms. Such factors include a
country’s income per capita, learning and innovation infrastructure, trade policy, business and
investment climate, access to finance, labor market regulations, among others. Their role is
discussed in section 2.3.
2.1 Factors Influencing a Foreign Firm’s Spillover Potential
The degree of foreign ownership impacts on local firms’ potential to absorb FDI spillovers. A
higher share of foreign ownership, and, thus, larger control over management and lower potential
for knowledge leakages, correlates positively with the parent firm’s incentive to transfer
knowledge, e.g., in the form of technology which has been confirmed by empirical studies for Greece
(Dimelis and Louri 2002) and Indonesia (Taaki 2005). On the other hand, a larger domestic
ownership share could also be beneficial for local firms, since the foreign investor’s interests are
less-well protected making technology leakages more likely (demonstration effect). A larger
domestic participation might further increase the likelihood to rely on domestic suppliers (Crespo
and Fontoura 2007). Toth and Semjen (1999) confirm that a larger domestic ownership share led to
more inter-sectoral linkages (reported in Crespo and Fontoura 2007).
Empirical studies controlling for different structures of foreign ownership tend to support the
the more positive spillover effects of joint ventures. Explanations include the possibility of more
vertical linkages as well as stronger technology leakages for partially-owned foreign firms (Javorcik
and Spatareanu 2008). For example, Havranek and Irsova (2011) find evidence for lower spillovers
in fully-owned foreign affiliates, and Javorcik (2004) and Javorcik and Spatareanu (2008) find a
positive vertical spillover effect on domestic firms in supplying industries from multinationals with
partial foreign ownership, but not from multinationals with full foreign ownership. Abraham et al.
(2010) find for a sample of Chinese manufacturing firms that foreign ownership in a domestic
firm’s sector only results in positive horizontal spillovers when foreign ownership is organized as a
joint-venture. By contrast, the presence of fully-owned foreign firm is found to have a negative
impact on local firms, due to technology intensity of multinationals crowding-out local producers
within the same sectors (Abraham et al. 2010).

6
Different motivations for undertaking FDI – i.e. resource-seeking, efficiency-seeking and
market-seeking – are likely to mediate spillover potential. The conventional wisdom is that
resource-seeking FDI is that it has less potential for spillovers, due to its capital and technology
intensity and limited time horizons, while FDI in manufacturing and services (especially retail) offer
greater potential for spillovers. However, evidence remains ambiguous, suggesting that the
situation may be context-specific.
Analogously, a multinational firm’s sourcing strategy may affect the FDI spillover potential. If a
multinational firm sources on a global scale, it may follow a co-sourcing strategy, resulting in an
increased reliance on imported inputs from established suppliers abroad. Alternatively, a
multinational firm might follow co-location strategies requiring an established foreign input
supplier to also enter the host country. Both could render the entrance of new local suppliers more
difficult. This is particularly common for multinationals in the clothing, footwear, electronics and
automotive sector (Paus and Gallagher 2008).
FDI spillovers also depend on the technology intensity of the multinational’s goods produced in
the host country. More technology- or R&D-intensive products generally contain a greater element
of knowledge and broader set of skills. However, the production of high-tech products might also
involve low-tech processes which could offset this effect (Paus and Gallagher 2008). Focusing on
FDI in technology-intensive industries, Buckley, Wang, and Clegg (2007) find positive spillovers on
Chinese firms to be stronger if originated by Western-owned multinationals compared to affiliates
from Taiwan, China; Hong Kong SAR, China; and Macau which they relate to the higher technology
intensity in Western-owned affiliates. Analogously, Lin, Liub, and Zhanga (2009) the positive
horizontal and vertical spillovers for FDI from other countries, while FDI from Taiwan, China; Hong
Kong SAR, China; and Macao, results in positive forward FDI spillovers only, but in no backward
spillovers and negative horizontal FDI spillovers. This is also explained with the more labor-
intensive nature of foreign affiliates from Taiwan, China; Hong Kong SAR, China; and Macao (Lin et
al. 2009).
2.2 Factors Influencing a Domestic Firm’s Absorptive Capacity
The technology gap between foreign and domestic firms has been identified as one the most
important mediating factors for FDI spillovers (Kokko 1994; Kokko, Tansini, and Zejan 1996;
7
Grünfeld 2006)5. Views on the role of the technology gap for FDI spillovers conflict. Some studies
find that a large technology gap is beneficial for local firms since their catching-up potential
increases (Findlay 1978; Wang and Blomström 1992; Smeets 2008). Other studies argue that local
firms might not be able to absorb positive FDI spillovers if the technology gap between the
multinational and local producers is too big or too small (e.g. Blalock and Gertler 2009).
The literature suggests that there is solid evidence for the supportive role of R&D in local firms
in high income countries, e.g. Spain (Barrios and Strobl 2002; Barrios, Dimelis, Louri, and Strobl
2004), the US (Keller and Yeaple 2009), Ireland (Barrios et al. 2004), and Sweden (Karpaty and
Lundberg 2004), among others. There are also studies confirming the supportive role of R&D in
domestic firms for developing or emerging countries, including the Czech Republic (Kinoshita
2001), India (Kanturia 2000, 2001, 2002), Hungary and Slovakia (Damijan, Knell, Majcen, and Rojec
2003), and Indonesia (Blalock and Gertler 2009), among others. One exception is Damijan et al.
(2003) finding a negative role of firm-level R&D on FDI spillovers for Estonia and Latvia (reported
in Crespo and Fontura 2007).
A domestic firm’s ability to absorb foreign technology might also be positively related to its
share of skilled labor. Blalock and Gertler (2009), for example, find that the proportion of employees
with college degrees significantly increases domestic firms’ productivity gains from FDI in
Indonesian manufacturing. However, Girma and Wakelin (2007) only confirm such a finding for
smaller firms in the U.K. – they find that FDI does not affect large firms with a high proportion of
human capital, as these firms are probably the most similar to multinationals in terms of technology
and market share. In contrast, Sinani and Meyer (2004) find for a sample of Estonian firms that a
larger share of human capital reduces the positive spillover effects for domestic firms, but increases
it for large firms. Their explanation for this contradicting result is that the competition effect might
reduce workers’ possibility to extract additional rents from local firms, since multinationals tend to
pay better wages. The competition effect might also enable larger firms to keep skilled workers
compared to smaller firms who might lose skilled workers to foreign firms.
Firm size has been positively related to a domestic firm’s capacity to absorb FDI spillovers (e.g.
Jordaan 2011b for Mexico). Larger firms may be better positioned to compete with multinationals
and to imitate their tools (Crespo and Fontoura 2007). Analogously, larger firms may pay better
5 The technology gap is usually measured as a domestic firm’s productivity level relative to a benchmark productivity level within the same sector – often of the leading firms (Griffith, Redding, and Simpson 2002; Girma 2005; Girma and Görg 2007) or of foreign firms (Castellini and Zanfei 2003).

8
wages and therefore find it easier to attract workers employed by multinational firms. Larger firms
might also be more visible, e.g. organized in associations, and, thus, more likely selected as local
suppliers by foreign firms. While Aitken and Harrison (1999) find negative spillovers from FDI on
domestic plants in Venezuela, these effects are only significant for firms with less than 50
employees. This suggests that smaller firms are less competitive and less capable of absorbing
positive spillover effects. In contrast, other studies find that small and medium-sized firms benefit
more strongly from FDI spillovers, especially those firms with a higher proportion of skilled labor
(e.g. Girma and Wakelin 2007; Sinani and Meyer 2004).
Several aspects of domestic firm location have shown to be important for the extent of
productivity spillovers from FDI. Barrios, Luisito, and Strobl (2006) find evidence that foreign firms
collocating (agglomeration) in the same sector and region significantly increase productivity and
employment of local manufacturing firms in Ireland. Some studies contest the positive role of
agglomeration for a firm’s absorptive capacity. For example, while Sjöholm (1999) confirms
positive spillover effects when FDI is measured at the country-sector level in Indonesia, he finds
negative spillovers when foreign presence is measured at the region-sector level. Aitken and
Harrison (1999) and Yudaeva, Kozlov, Malentieva, and Ponomareva (2003) find similar results for
Russia.
Besides agglomerations, studies focused on other aspects of location. Firm location in special
economic zones, for example, can have a negative impact on FDI spillovers if the zone focuses on
export processing combined with a high percentage of imported inputs (Abraham et al. 2010). More
regional development (e.g. Ponomareva 2000, Torlak 2004, Girma 2005, Girma and Wakelin 2007)
and a domestic firm’s geographical proximity to multinational firms (Girma and Wakelin 2007,
Resmini and Nicolini 2007) seem to have a positive effect.
Exporting has been linked to a domestic firm’s absorptive capacity for at least two reasons.
First, local exporting firms are generally characterized by a higher productivity, be it via learning-
by-exporting or self-selection into exporting, rendering them more competitive to bear up against
negative rivalry effects created by multinationals (Crespo and Fontoura 2007). Second, the more a
local firm exports, the lower will competitive pressures from multinational firms be felt (assuming
that the multinational firm does not enter the same export market), hence, the incentive to improve,
which lowers the extent of positive FDI spillovers. However, studies show no clear evidence
whether exporting increases or lowers the productivity gains from FDI. While several studies find
evidence for lower productivity gains for exporters (e.g. Blomström and Sjöholm 1999,

9
Ponomareva 2000, Sinai and Meyer 2004, Abraham et al. 2010, and Du, Harrison, and Jefferson
2011). In contrast, some studies find that the gains from FDI are larger for exporting firms (e.g.
Barrios and Strobl 2002, Schoors and van der Tol 2002, Lin at al. 2009, Jordaan 2011b).
2.3 Host Country Characteristics and Institutional Framework
Labor market regulations can influence the effect of FDI on domestic firms via various channels,
including the amount and type of FDI being attracted in the first place, the domestic firm’s
absorptive capabilities, and the frequency of labor turnover as a transmission channel of spillovers.
Using firm-level data for 19 Western and Eastern European countries between 1998 and 2001
Javorcik and Spatareanu (2005), for instance, find that higher absolute and relative labor market
flexibility compared with the foreign investor’s home country has a positive impact on the
likelihood of foreign investment. Besides the amount of FDI, labor market regulations also affect
domestic firm’s absorptive capacities. In a recent study, Hale and Long (2011) conclude that labor
market regulations in general, and wage constraints in particular, affect the level of skills in a firm
and, thus, their absorptive capacity. Labor market regulations directly affect the frequency of labor
turnover and, thus, the transmission channel. Overly rigid labor markets can reduce the possibility
for labor turnover and FDI spillovers. However, overly flexible labor markets may result in frequent
labor turnover, lowering the possibility of domestic workers to acquire skills and knowledge in
foreign firms.
A few studies stress the role of financial markets in developing countries as a mediating factor
for the absorption of spillovers (Alfaro, Chanda, Kalemli-Ozcan, and Sayek 2010; Havranek and
Irsova 2011). Multinationals can have an ambivalent impact on access to finance for local firms.
They might ease access to finance by bringing in scarce capital to developing countries, but if
multinationals borrow from local financial institutions, they might increase local firms’ financing
constraints (Harrison, Love and McMillan, 2004). This, in turn, can influence a local firm’s
absorptive capacity and, thus, actual FDI spillovers. Harrison et al. (2004) find evidence for the
second effect using firm-level data for a cross-section of 38 high- and low-income countries.
Other studies look explicitly at the role of financial development – representing access to
finance – for FDI spillovers. Studies find that well-developed financial markets may facilitate a
domestic firm’s absorptive capacity linkages. Agarwal, Milner, and Riaño (2011), for instance, find
that FDI spillovers are lower or even negative for Chinese manufacturing firms that are credit-
constrained. Javorcik and Spatareanu (2009) find that less liquidity-constrained firms are more

10
likely to self-select into supplying multinationals. Havranek and Isrova (2011), in contrast, find
evidence for lower FDI spillovers in more developed financial systems. This implies that while
access to finance in general should be easier for local suppliers, competition with foreign investors
for limited financial resources might also increase with financial development, reducing local firms’
absorptive capacity (second effect above).
The share of human capital at the firm-level is influenced by the local innovation and learning
infrastructure. Meyer and Sinani (2009), for instance, include three measures of a country’s
availability of human capital and show evidence that the share of workers with tertiary education,
the R&D intensity in the private sector, and the number of patents per billion US dollars granted to
host country residents significantly affect FDI spillovers. This relationship takes a U-shaped form,
i.e. only below or above certain threshold levels of human capital does the extent of spillovers
increase (Meyer and Sinani 2009). Tytell and Yudaeva (2007) find evidence for Romania that
productivity spillovers from FDI in manufacturing are significantly lower in regions with a low
share of education.
Most countries have established special policies to attract FDI, including the establishment of
investment promotion agencies and a wide range of fiscal incentives. Du et al. (2011) find for China
that foreign firms enjoying investment subsidies generate positive backward spillovers, whereas
foreign firms not enjoying such subsidies actually generate negative spillovers. In addition, this
study finds that foreign firms enjoying tax exemption from value added taxes generate higher
forward spillovers than foreign firms that are not exempt from these taxes.
A country’s trade policy shapes the amount and type of foreign investment and, thus, influences
the potential of FDI spillovers. Open trade regimes may be more likely to attract foreign investors
than inward-oriented regimes, since they are less constrained by the size and efficiency of the local
market in the first case (Crespo and Fontoura 2007). Foreign investors might also be more export-
oriented in an open setting, increasing chances for local suppliers to become exporters, too.
Moreover, foreign investors in an open trade setting are globally more integrated and therefore
adopt the newest technologies (Meyer and Sinani 2009). Others, however, argue that foreign
investors in an outward-oriented trade setting might focus more strongly on international
distribution and marketing, while foreign firms in an inward-oriented policy regime might bring
newer technologies to the host countries (Crespo and Fontoura 2007).
Trade policy also affects domestic firms. Local firms in an open trade regime are more exposed
to competitive pressures through international trade competition which will prepare them to better

11
absorb FDI spillovers. Overall, studies confirm that FDI spillovers are larger in countries that are
more open towards trade (Meyer and Sinani 2009; Du et al. 2011, Havranek and Irsova 2011).
Weak institutions – including corruption, red tape, or intellectual property rights – are linked to
protectionism with regard to local firms, network-driven business practices, and inefficient
markets. Foreign investors may, in such cases, be constrained from exploiting fully their
competitive advantages. This may influence the type of FDI attracted in the first place, as well as the
domestic firms’ absorptive capacities. Empirical evidence is mixed. Using firm-level data for 17
emerging countries over the period 2002-2005, Gorodnichenko, Svejnar, and Terrell (2007) find no
evidence that the extent of FDI spillovers is affected by the degree of corruption (measured as
bribes) or red tape (measured as manager’s time spent with officials). Measuring transparency with
a corruption perception index, Meyer and Sinani (2009) find evidence that a country’s level of
transparency has a U-shaped effect on FDI spillovers, i.e. countries with a medium level of
transparency benefit the least from FDI, while countries with a low and high level of transparency
benefit show stronger FDI spillovers.
Finally, competitive pressures from multinational firms might be lower if the local firm already
faces a high level of competition at the sectoral level. As in the case of exports, local firms in
competitive sectors might have a lower incentive to improve, resulting in lower benefits from FDI
spillovers. Sinani and Meyer (2004) confirm that more sectoral competition both of foreign firms
and of domestic firms have a positive impact on the growth of sales of local firms in Estonia, but do
not control for the interaction of competition with FDI. On the other hand, local firms could be
better equipped to benefit from positive demonstration effects. Barrios and Strobl (2002) find that
less sectoral competition, captured by a higher Hirschman-Herfindahl index (HHI), increases the
productivity gains from FDI for Spain, pointing towards a lower incentive to improve.

12
3 Empirical Model
3.1 Econometric Model and Estimation Strategy
Following Blalock and Gertler (2009), we define the following equation:
0ln *irst sct sct r s t irstprod FDI FDI MF D D Dα β γ ε= + + + + + + (1)
where subscript i stands for firm, r for (sub-national) region, s for sector, c for country, and t
for year. 0α designates the constant, rD region fixed effects, sD sector fixed effects, tD year fixed
effects, and irstε the idiosyncratic error term. lnprod is a measure of productivity in logarithms, FDI
a measure of FDI presence at the sectoral level in a country, and *sFDI MF the interaction term of
FDI with a mediating factor MF. The total effect of FDI on productivity is given by MFβ γ+ . Our
coefficient of interest is γ. The total effect of FDI on productivity will be larger (smaller resp.) than β
if the coefficient of the interaction term is positive (negative resp.), i.e. γ > 0 (γ < 0 resp.).
Following the literature, we use the share of foreign output as percentage total output at the
sectoral level as our measure of intra-industry FDI presence.6
foriY i sct
sctii sct
YFDI
Y∈
∈
= ∑∑
(2)
where i sc∈ indicates a firm in a given sector s of country c, Yi is firm-level output in a given
sector of country c, and foriY is output if the firm is foreign. As common in the literature on FDI, we
only consider firms as foreign with a foreign ownership of 10 percent or higher.
The foreign output share variable in the strict sense captures only horizontal spillovers.
However, since sectors are defined at a broad level (see Appendix 3), the foreign output share
variable is likely to capture some vertical spillovers. For example, ‘auto and auto components’
includes both final automotive producers and suppliers of automotive components – thus, FDI in
this sector could impact on both domestic final producers of cars as well as domestic suppliers of
6 Blalock and Gertler (2009) calculate FDI spillovers at the region-sector level due to the geographical specificities of Indonesia (i.e. many islands). We follow the majority of studies that calculate FDI at the sectoral level.

13
auto components. Similar situations are also likely in sectors such as food, electronics, and
chemicals and pharmaceuticals.
To capture firm-level productivity, we use labor productivity, LP, defined as value added per
worker. LP measures are only available for manufacturing sectors.7 Since labor productivity is
mainly determined by capital intensity, we add firm-level capital intensity, defined as capital stock8
per worker, in logarithms as an explanatory variable to each specification in order to avoid an
omitted variable bias. This yields the following estimation equation:
0ln * lnY Yirst sct sct irst r s t irstlp FDI FDI MF capint +D D Dα β γ ε= + + + + + + (3)
Since we are only interested in spillovers from foreign to domestic firms, we run the
regressions across domestic firms only. In a first step, we run the baseline regressions as specified
in equation (3) using ordinary least squares (OLS).
The cross-sectional nature of our dataset (see section 3.2), however, renders the identification
of a causal relationship between foreign output share and domestic firm productivity difficult.
Foreign firms may be attracted into a specific sector in a country because of some unobserved
characteristics that are correlated with domestic firm productivity. Aitken and Harrison (1999) find
that controlling for such unobservable effects at the country-sector level leads to negative
spillovers, while not controlling for fixed country-specific sector effects reserves the impact.
To control for such effects adequately, we would need to include fixed country-sector effects,
which is not possible using cross-sectional data, as those would be perfectly correlated with the
spillovers variable. One alternative approach to address this issue is to instrument for foreign
output share. Only few studies to date have used instruments to address the potential endogeneity
between FDI presence and domestic firm productivity. Haskel et al. (2007) instrument their
sectoral FDI presence variable for the UK with sectoral inward FDI data from the US. Similarly, in
his study on Mexican manufacturing firms, Jordaan (2011a) uses the US sectoral foreign
employment share as instrument for his sectoral FDI spillover measure. In their study on FDI
spillovers in the US, Keller and Yeaple (2009) use contemporaneous changes in shipping costs and
tariffs and lagged levels of the real exchange rate interacted with industry dummies to instrument
7 Our cross-sectional dataset is not suited to calculate total factor productivity using the standard methodologies that control for the endogeneity of input demand (e.g. Olley-Pakes 1996 or Levinsohn-Petrin 2003). 8 Capital stock is defined as the replacement value of machinery, vehicles, and equipment. Information on the replacement value of buildings and land was very incomplete and was, thus, not included.

14
for sectoral FDI presence and imports. In a second step, we estimate the regressions using an
instrumental variables two-stage least squares (IV 2SLS) approach.
3.2 Data and Instruments
The World Bank Enterprise Analysis Unit recently published the Enterprise Surveys Indicator
Database.9 This publication covers 215 enterprise surveys for 126 countries over the period 2006
to 2010. Enterprise surveys represent a comprehensive source of firm-level data in emerging
markets and developing economies. One major advantage of the enterprise surveys is that the
survey questions are the same across all countries. Moreover, the Enterprise Surveys represent a
stratified random sample of firms using three levels of stratification: sector, firm size, and region.
Sectors are based on the ISIC Rev. 3.1 classification, but in some cases are further aggregated.
The Enterprise Surveys Indicator Database covers a wide range of indicators on firm
characteristics, the business environment, innovation and technology, and workforce and skills
among others. We merged this dataset with data on firm-level output, value added, and capital
stock obtained from the Enterprise Analysis Unit of the World Bank.10 All local currencies have
been converted into US dollars and deflated using a GDP deflator in USD (base year 2000).
Exchange rates and GDP deflators have been obtained from the World Development Indicators.
We apply the following rules to the dataset: (i) We include only the most recent Enterprise
Surveys for each country; (ii) We include only countries that cover foreign firms in the surveys11;
(iii) We drop high-income countries to cover only emerging or developing countries12; and (iv) We
drop countries for which we cannot calculate foreign output share due to unavailable output data.
We focus only on the effects of productivity spillovers on domestic manufacturing firms, since
productivity measures were unavailable for services firms.
The procedure above results in more than 25,000 domestic firms and 3,400 foreign firms in 78
countries covering eleven manufacturing sectors. The list of countries, year of most recent survey
and number of domestic and foreign manufacturing firms by country can be found in Appendix 2.
9 See http://www.enterprisesurveys.org/~/media/FPDKM/EnterpriseSurveys/Documents/Misc/Indicator-Descriptions.pdf for a description of the indicators. Our analysis is based on the October 2011 release of the Enterprise Surveys Indicator Database. 10 We thank Federica Saliola and Murat Seker for making these data available to us. 11 Only Kosovo did not fulfill this criterion. 12 We drop these, as the database only included eleven high-income countries which were not representative of high-income countries (some OECD countries, some non-OECD countries, and one oil exporter).

15
We combine these firm-level data with country-level data to control for national
characteristics, including a country’s institutional framework. The data source for each variable is
indicated in section 3.5. Data for the national variables are aligned with the survey year of a
country’s enterprise survey (see Appendix 2 for information on survey years). In a few cases where
national data were unavailable for the specific survey year, we choose the observation of the
nearest available year.
We include three different instruments for foreign output share. The selection of these
instruments is based on the assumption that the instruments are correlated with the foreign output
share variable, but not with domestic firm productivity in the country of interest. First, we take
advantage of the fact that for many countries the Enterprise Surveys Indicator Database publishes
surveys for more than one year. Based on the previous survey year for such countries, we are able
to calculate the foreign output share variable as defined in equation 2 to be used as an instrument.
For some countries we have to rely on the previous version of the Enterprise Surveys Indicator
Database which covers the period 2002-2005.13 In most cases, the time lag between the original
and lagged foreign output share variables covers between two and four years. Therefore, it is safe
to assume that the instrument is correlated with the foreign output share variable in t, but not
correlated with domestic firm productivity in t.
Second, we add a sectoral measure of sector targeting by investment promotion agencies.14
The measure equals 1 if a sector has been targeted by a country’s investment promotion agency in a
certain year and 0 if not. As foreign output share rather reflects longer-term FDI presence, we
aggregate the dummies over the period 2000 to 2004 to obtain a measure of total length of sector
targeting in the early 2000s. The sum can range from 0 (no targeting over this period) to 5
(continuous targeting over this period). To control for non-linearities, we use the measure in
natural logarithms, i.e. ln(total sector targeting + 1). We believe that total sector targeting is well-
suited as an instrument, as it is correlated with the foreign output share variable, but not with
domestic firm productivity – especially since there is a time lag between these two measures.
Finally, following Keller and Yeaple (2009), we include sectoral tariffs obtained from the World
Bank WITS Database. The data are based on the WTO NAMA method (effectively applied rates).
13 We thank Minh Cong Nguyen for making an older version of the Enterprise Surveys Indicator Database available to us. 14 The authors are grateful to Torfinn Harding, Beata Javorcik and Daniel Lederman for making this dataset available to us. For more information on the dataset, see Harding and Javorcik (2011).

16
Since some of our sectors are more aggregated than the original ISIC Rev. 3.1 classification, we
aggregate tariffs up using import shares as weights. Tariff data are aligned with the survey year of a
country’s enterprise survey. In a few cases where tariff data are unavailable for the specific survey
year, we choose the observation of the nearest available year before the survey year.
3.3 Measures of Foreign Spillover Potential
We now turn to the mediating factors MF. In a first step we present measures of FDI spillover
potential at the sectoral level based on available data in the Enterprise Surveys Indicator Database.
All of the following variables are averages across all foreign firms within a specific sector of a
country.
• own = a sector’s average percentage of foreign ownership in a country;
• market = a sector’s average percentage of FDI sales to the domestic market in a country.
This measure serves as a proxy for a sector’s average FDI motive in a country, whereby a
higher share is associated with market-oriented FDI;
• inp = a sector’s average percentage of domestic input purchases of FDI firms in a country.
This measure captures a sector’s average sourcing strategy of foreign firms in a country,
whereby a higher share is associated with more local sourcing;
• tech = iso + tech_for + website + email with 0 <= tech <= 4, where iso = 1 if firm owns
internationally-recognized quality certification and 0 otherwise, tech_for = 1 if firm uses
technology licensed from foreign firms and 0 otherwise, website = 1 if firm uses own
website to communicate with clients or suppliers, email = 1 if firm uses email to
communicate with clients or suppliers. The technology indicator serves as a proxy for a
sector’s average FDI technology intensity in a country.
3.4 Measures of Absorptive Capacity
In a second step, we include the following measures of absorptive capacity that were available
in the Enterprise Surveys Indicator Database.
• gap = domestic firm’s LP relative to median LP of multinational firms in sector in natural
logarithms;
17
• tech = domestic firm’s technology indicator as defined in previous section, where tech ϵ {0,
1, 2, 3, 4}. The technology indicator serves as a proxy for R&D intensity which is
unavailable;
• skills = domestic firm’s share of high-skilled labor in firm’s total labor force;
• size = domestic firm’s total number of permanent and temporary employees in natural
logarithms;
• aggl = region’s total number of manufacturing and services firms as percentage of a
country’s total number of manufacturing and services firms. This measure is a proxy for
urbanization economies (locational advantages) and covers both domestic and foreign
firms15;
• exp = domestic firm’s share of direct or indirect exports in firm sales.
3.5 Measures of National Characteristics and Institutions
In a third step, we turn to mediating factors at the national level. We include the following
country-level variables into the model.
• labor = measure of labor freedom in natural logarithms from the Heritage Foundation
and captures labor market institutions. The variable ranges from 0 to 100 (highest
labor freedom) and includes various aspects of the legal and regulatory framework of a
country’s labor market, such as minimum wages; laws inhibiting layoffs; severance
requirements; and measurable regulatory burdens on hiring, hours, etc. The measure is
mainly based on data from the World Bank’s Doing Business study;
• finance = measure of financial freedom in natural logarithms from the Heritage
Foundation. The variable measures banking efficiency as well as a measure of
independence from government control and interference in the financial sector with
scores ranging from 0 to 100 (highest financial freedom). This measure relies on
various underlying data sources, including (in order of priority) the Economist
Intelligence Unit, the International Monetary Fund, the Organisation for Economic Co-
15 We included services and foreign firms in this measure as urbanization economies refer to spillovers due to the proximity of firms from all types of sectors and ownership.

18
operation and Development, and official government publications of each country,
among others;
• educ1 = government spending on education as percentage of GDP from the WDI
database;
• educ2 = people with completed secondary and tertiary education as percentage of
population aged 15 and over from Barro and Lee (2010);
• rd = a country’s expenditures on research and development as percentage of GDP from
the WDI database;
• investment = measure of investment freedom in natural logarithms from the Heritage
Foundation and serves as a proxy for investment promotion. The score ranges from 0
to 100 (highest investment freedom) and measures the ability of individuals and firms
to move their resources in and out of specific activities both internally and across the
country’s borders. This variable is mainly based on official government publications of
each country on capital flows and foreign investment;
• trade1 = a country’s share of exports of goods and services as percentage of GDP from
the WDI database;
• trade2 = measure of trade freedom in logarithms from the Heritage Foundation, which
is a composite measure of the trade-weighted average applied tariff rate and non-tariff
barriers with scores ranging from 0 to 100 (highest trade freedom), reflecting the
absence of trade protectionism. The measure is based on various underlying sources
including data from World Bank, the World Trade Organization, and the Economist
Intelligence Unit, among others;
• business = measure of business freedom in natural logarithms from the Heritage
Foundation as an outcome-based indicator of a country’s institutional development. It
is a measure reflecting the ability to start, operate, and close a business with scores
ranging from 0 to 100 (highest business freedom). The measure mainly relies on the
World Bank’s Doing Business study;
• hhi = HHI of sector concentration to capture competition in a domestic firm’s sector.
The HHI of sector concentration is defined as the sum of squares of firm’s output share
by sector. If only one firm operates in a sector, the HHI would be 1. A lower HHI reflects
a higher sectoral diversity. This measure includes both domestic and foreign firms;

19
• income = a country’s per capita GDP (USD at 2000 prices) in natural logarithms from
the World Bank’s World Development Indicators (WDI) database. It captures national
competition, but also other aspects of the national and institutional environment.
4 Regression Results
4.1 FDI Spillover Potential
Overall Results
In the following, we apply OLS and IV 2SLS regressions. All regression results follow equation
(3) and include sector, subnational region, and year fixed effects. Standard errors are robust to
heteroscedasticity and clustered at the country-sector level.16 Foreign output share is defined as in
equation (2). The summary statistics are reported in Appendix 4. Our data sample only includes
domestic manufacturing firms, i.e. all firms with a foreign ownership share of less than 10 percent
(see Appendix 2). Table 1 shows how the FDI spillover potential influences domestic firm
productivity. Columns 1 to 4 report the OLS regression results, while columns 5 to 10 report the IV
2SLS regression results17. Foreign firm characteristics are averages across all foreign firms within a
specific sector of a country. To rule out the possibility that the impact of a foreign firm
characteristic on FDI spillovers which we observe is not the result of another foreign firm
characteristic for which we do not simultaneously control, we assess the correlation of foreign firm
characteristics with each other. The correlation matrix (available upon request) reassures us that
foreign firm characteristics show a very low correlation of at most 0.26.
As could be expected, capital intensity shows a positive and significant effect on labor
productivity. More importantly for this paper, intra-industry foreign output share mostly shows a
negative effect on labor productivity of domestic firms, although in Table 1 the impact is only
significant in column 2. What may explain the negative FDI spillovers? In the short term, local firms
might face losses in their market share due to increased competition (competition effect). Loss of
market share, in turn, requires them to produce at higher average unit-costs, as a declining amount
16 We partial out fixed sector, subnational region and year effects in the IV 2SLS regressions to avoid that the covariance matrix of orthogonality conditions is not of full rank, which is common when using the cluster option. This also allows us to perform overidentification tests. 17 The number of observations is lower in the IV 2SLS regressions since not all instruments are available for all countries (see summary statistics in Appendix 4).

20
of output shifts them left on the economies-of-scale curve (Harrison 1994; Aitken and Harrison
1999; Crespo and Fontoura 2007). It is also more likely in the short term that foreign firms bid
away high quality labor from domestic firms by offering higher wages and benefits (labor turnover
effect), resulting in a potentially negative spillover effect (Sinani and Meyer 2004; Hoekman and
Javorcik 2006; Crespo and Fontoura 2007).
Both effects can reverse in the medium to long term, if domestic firms become more productive
due to increased competition and start to absorb skilled workers from multinationals. Given that
our data sample only allows us to control for short-term effects, the negative coefficients on the
foreign output share variable are not surprising. Moreover, they are in line with other studies
rejecting the existence of positive intra-industry FDI spillovers (Havranek and Irsova 2011) or
studies that find negative intra-industry spillovers (e.g. Aitken and Harrison 1999; Djankov and
Hoekman 2000; Konings 2001, among others).18
A sector’s average share of foreign ownership in a country (own) shows a positive coefficient
sign, but is insignificant (columns 1 and 5). The interaction terms with a sector’s average
percentage of FDI sales to the domestic market in a country (market) has a significantly positive
effect on domestic firms’ productivity in the OLS regressions (column 2), confirming the hypothesis
that market-seeking FDI is more likely not only to provide a higher spillover potential, but also to
translate into more positive actual spillovers.
Since the market variable might be influenced by the productivity of domestic competitors, we
additionally instrument for the interaction term of foreign output share with the market variable in
column 7. We choose the sectoral average number of days to clear direct exports through customs
in a country (in natural logarithms) from the Enterprise Surveys Indicator Database as an inverse
instrument. One could argue that longer waiting times at customs motivate foreign firms to rely
more strongly on the host market for sales. The coefficient signs in the IV 2SLS regressions are also
positive, but insignificant (columns 6 and 7). However, the Hansen J-test of over-identifying
restrictions implies that the instruments are not accepted in these specifications.
Analogously, a sector’s average percentage of domestic input purchases of FDI firms in a
country (inp) might be endogenous, as the sectoral share of inputs purchased locally might be 18 Görg and Strobl (2001) and Görg and Greenaway (2004), however, argue that studies using cross-sectional data tend to find positive FDI spillovers, which they relate to potential time-invariant effects across units (firms or sectors) that are correlated with the FDI presence variable without being caused by it. Interestingly, we find negative FDI spillover effects regardless of whether we control for this potential endogeneity (IV 2SLS) or not (OLS).

21
influenced by domestic firm productivity. We therefore additionally instrument for the interaction
term of foreign output share with the inp variable in column 9, using the sectoral average number of
days to clear imports through customs in a country (in natural logarithms) from the Enterprise
Surveys Indicator Database as an inverse instrument. The argument for this choice of instrument
would be that longer waiting times at customs may motivate foreign firms to source more inputs
from the domestic market. The IV 2SLS regressions show that the interaction term with inp has a
positive coefficient sign (columns 8 and 9), while it is negative in the OLS regression (column 3).
Both interaction terms are insignificant. The interaction term with sectoral FDI technology intensity
in a country (tech) has a negative but insignificant impact in both regressions (columns 4 and 10),
rejecting the findings of a positive impact (e.g. Buckley et al. 2007; Lin et al. 2009).
Unfortunately, many results fall short of the thresholds of statistical significance, which could
be related to heterogeneous productivity levels of domestic firms (Girma and Görg 2007). We
therefore examine the dynamics of productivity at different points of the distribution in a next step.
The Role of Domestic Firm Productivity
We split our sample into three productivity groups: LP <= 33.33 percentile (low-productivity
firms); 33.33 percentile < LP <= 66.67 percentile (medium-productivity firms); and LP > 66.67
percentile (high-productivity firms). The IV 2SLS regression results by productivity level are shown
in Appendices 5 to 7. We detect clear differences across the three types of domestic firms. The
foreign output share variable mostly shows negative coefficient signs for all types of firms, but is
rarely significant. However, the coefficients decline with firm productivity, suggesting that higher
productivity reduces negative FDI spillovers. Capital intensity shows a constantly positive effect on
labor productivity, but the impact is strongest for high-productivity firms, followed by low-
productivity firms and medium-productivity firms.
The interaction term with foreign ownership share (for) is insignificant for all types of firms
(column 1). The interaction term with FDI sales to the domestic market is positive and significant
for both low- and medium-productivity firms, but more so for low-productivity firms (columns 2
and 3). While market-seeking FDI provides a higher spillover potential, the underlying transmission
channels, however, seem to be different for both types of firms. It is more likely that medium-
productivity firms benefit from competition and demonstration effects, while low-productivity
firms may rather benefit from potential integration in supply chains and labor turnover.

22
Table 1: FDI Spillover Potential, FDI Spillovers, All Domestic Firms Dependent variable: lnlpirst
Ordinary Least Squares Instrumental Variables Two-Stage Least Squares
(1) (2) (3) (4) (5) (6) (7) (8) (9) (10)
FDIYsct
FDIYsct*ownsct FDIYsct*marketsct FDIYsct*inpsct FDIYsct*techsct
lncapintirst
-0.3300 -0.3243** -0.0341 0.1777 (0.134) (0.012) (0.790) (0.360) 0.3158 (0.228) 0.3979** (0.028) -0.0844 (0.700) -0.1050 (0.147) 0.2726*** 0.2727*** 0.2734*** 0.2728*** (0.000) (0.000) (0.000) (0.000)
-0.5360 -0.6277 -1.4594 -0.7505 -2.2952 0.2180 (0.680) (0.201) (0.112) (0.129) (0.187) (0.643) 0.5961 (0.680) 0.8586 2.1830 (0.141) (0.123) 1.1346 4.0729 (0.114) (0.198) -0.1177 (0.479) 0.2664*** 0.2661*** 0.2665*** 0.2660*** 0.2643*** 0.2665*** (0.000) (0.000) (0.000) (0.000) (0.000) (0.000)
Observations R-squared Endog. var. Instruments F-stat. FDI F-stat. market_int F-stat. inp_int Hansen p-val.
15,137 15,137 15,106 15,137 0.62 0.62 0.62 0.62
5,193 5,193 5,152 5,193 5,162 5,193 0.14 0.14 0.13 0.13 0.11 0.14 1 1 2 1 2 1 3 3 4 3 4 3 2.81 4.81 19.62 5.35 17.28 4.99 13.89 10.82 0.1133 0.0805 0.0967 0.3629 0.8662 0.1458
Note: p*<0.1, p**<0.05, p***<0.01 (p-values in parentheses). All regressions include sector, subnational region, and year fixed effects. Standard errors are clustered at the country-sector level.

23
A sector’s average percentage of domestic input purchases of FDI firms in a country (inp) also
shows a positive and significant impact for low- and medium-productivity firms (column 4). Our
results suggest that more local sourcing is associated with more positive FDI spillovers to domestic
firms. Various transmission channels between foreign firms and domestic suppliers are plausible,
e.g. the demand and assistance effect, diffusion effect, availability and quality effect as shown in
Appendix 1 (see Farole et al. 2012 for more details). Again, the effects are stronger for low-
productivity firms which may be the result of their higher catching-up potential.
The interaction term with foreign technology intensity (tech) is negative, but insignificant for
all types of firms (column 6). However, the p-value is lower for high-productivity firms, implying
that a smaller technology gap between high-productivity domestic firms and foreign firms renders
it more difficult for the former to absorb foreign technology.
In sum, the results show that low- and medium-productivity firms benefit more positively from
foreign presence than high-productivity firms.
The Role of Foreign Ownership Structure
In a next step, we also assess whether the results depend on the structure of foreign
ownership, as discussed in section 2.1. We therefore calculate two variants of the foreign output
share variable in equation two: (i) foreign output share based on firms with full-foreign ownership,
defined as a foreign participation of 100 percent, and (ii) foreign output share based on firms with
partial foreign ownership, defined as foreign participation of at least 10 percent but less than 100
percent. Appendix 3 shows the number of foreign firms by structure of foreign ownership. It is
worth noting that in all countries of our data sample but one (Yemen) there exists a mix of both
fully and partially foreign-owned firms, suggesting that there is no substantial impact of investment
policy (i.e. requirements for local participation) on foreign ownership structure19.
Analogously, we also calculate the average foreign firm characteristics in a sector and country,
as described in section 3.3, based on fully-owned and partially-owned foreign firms only. Appendix
8 shows the results for full foreign ownership (columns 1 to 6) and partial foreign ownerships
(columns 7 to 12). While foreign firms in a country’s sector sell on average 67.5 percent to the
domestic market (market), this share is 69 percent for partial FDI versus 65 percent for fully-owned
19 This may be explained by the fact that this analysis focuses on the manufacturing sector, where restrictions on full foreign ownership are much less common than in services sectors.

24
FDI. Similarly, average purchases from local sources in a country’s sector (inp) are 57 percent for all
foreign firms, but the split sample shows it is almost 60 percent for partially-owned FDI and only 55
percent for fully-owned FDI (see summary statistics in Appendix 4). All differences are statistically
significant at the 1 percentage level. These summary statistics alone suggest that partially-owned
foreign firms are more integrated into domestic markets that fully foreign-owned firms, and may
indicate a higher spillover potential for partially-owned foreign firms.
Appendix 8 shows the regression results by foreign ownership structure. Note that the model
dropped the sectoral foreign ownership variable (own) for fully-owned FDI, as the value, by
definition, is 100 percent for every sector. The interaction term with foreign firms’ sales to the
domestic market (market) is positive but only significant for fully foreign-owned FDI (column 3),
implying that spillovers from market-oriented FDI are more beneficial from foreign firms with full
ownership, possibly due to their higher willingness to transfer technology (Dimelis and Louri 2002,
Taaki 2005).
The interaction term with foreign firms’ share of local inputs (inp) is positive and significant
for partially foreign-owned FDI (column 10), suggesting that local sourcing increases the
productivity spillovers from foreign firms with local participation, possibly due to the existence of
more vertical linkages (Javorcik and Spatareanu 2008). On the other hand, more local sourcing
reduces the spillovers from fully-owned FDI which is insignificant.
Overall, the results cannot give a clear answer whether full or partial foreign ownership
translates into higher FDI spillovers, since the latter also depend on the foreign firm’s FDI motive
and sourcing strategy.
4.2 Absorptive Capacity
Overall Results
Table 2 shows the regression results for domestic firms’ absorptive capacities. Columns 1 to 6
report the estimates using OLS, while columns 7 to 12 show the results using IV 2SLS. Again, we
need to rule out the possibility that the observed impact of a firm’s absorptive capacity on FDI
spillovers does not pick up another absorptive capacity for which we do not simultaneously control.
The correlation matrix (available upon request) shows that in almost all cases absorptive capacities
have a correlation which is lower than 0.33. Only firm size and technology intensity show a
correlation of 0.52, which still lies within an acceptable range.

25
Foreign output share shows a negative and often significant impact on labor productivity,
except for columns 1 and 7. Interestingly, the results clearly indicate that FDI spillovers in the OLS
estimates are upward biased compared to the IV 2SLS estimates, confirming the results by Aitken
and Harrison (1999) who find that foreign firms might be attracted to more productive industries
which OLS estimates using cross-sectional data cannot adequately control for. Capital intensity has
a positive and significant effect in all specifications.
Absorptive capacities are measured at the domestic firm level and interacted with our FDI
measure. The results show that absorptive capacity influences FDI spillovers, regardless of the type
of estimator being used. In particular, the interaction term with productivity gap (gap) shows a
significantly positive impact (columns 1 and 7)20. This argues against the findings of other studies
claiming that a large technology gap is beneficial for local firms, since their catching-up potential
increases (Findlay 1978; Wang and Blomström 1992; Smeets 2008), and instead supports the idea
that too large a gap hinders absorption potential (Blalock and Gertler 2009).
The interaction with a domestic firm’s technology (tech) has a significantly positive effect on
domestic labor productivity (columns 2 and 8). This confirms the high number of studies pointing
towards a positive effect of R&D (see section 2.2). The interaction term with skills, however, does
not influence domestic labor productivity (column 3). Firm size, measured by number of employees
(size), shows a positive interaction with foreign output share which is significant (columns 4 and
10). Our results confirm the majority of studies which positively relate firm size to a domestic firm’s
capacity to absorb FDI spillovers.
The proximity to other firms in a subnational region (aggl) also shows a positive productivity
effect in interaction with foreign output share (columns 5 and 11), which is in line with Barrios et
al.’s (2006) findings. Finally, the interaction with exports, measured as export share (exp), also
shows a significantly positive productivity effect (columns 6 and 12) which is in line with other
empirical studies (e.g. Barrios and Strobl 2002, Schoors and van der Tol 2002, Lin at al. 2009,
Jordaan 2011b) supporting the hypothesis that exporting renders domestic firms more competitive
to bear up against negative rivalry effects created by multinationals (Crespo and Fontoura 2007).
20 Recall that our variable gap measures the ratio of domestic firm productivity to the median foreign firm productivity, so a higher number indicates a lower gap.

26
Table 2: Absorptive Capacity, FDI Spillovers, All Domestic Firms Dependent variable: lnlpirst
Ordinary Least Squares Instrumental Variables Two-Stage Least Squares
(1) (2) (3) (4) (5) (6) (7) (8) (9) (10) (11) (12)
FDIYsct
FDIYsct*gapisct FDIYsct*techirst
FDIYsct*skillsirst FDIYsct*sizeirst FDIYsct*agglrct FDIYsct*expirst lncapintirst
1.3735*** -0.6764*** -0.0375 -1.0001*** -0.2646** -0.1391* (0.000) (0.000) (0.674) (0.000) (0.018) (0.052) 1.6451*** (0.000) 0.4660*** (0.000) -0.0178 (0.840) 0.2758*** (0.000) 0.5346** (0.046) 0.6344*** (0.000) 0.1524*** 0.2578*** 0.2683*** 0.2665*** 0.2701*** 0.2701*** (0.000) (0.000) (0.000) (0.000) (0.000) (0.000)
0.8201*** -0.4614** -0.1304 -1.0139*** -0.5029 -0.1528 (0.005) (0.015) (0.565) (0.001) (0.120) (0.367) 1.7388*** (0.000) 0.4674*** (0.000) 0.1205 (0.425) 0.3184*** (0.000) 1.0066* (0.054) 0.9274*** (0.000) 0.1310*** 0.2495*** 0.2607*** 0.2585*** 0.2636*** 0.2626*** (0.000) (0.000) (0.000) (0.000) (0.000) (0.000)
Observations R-squared Endog. var. Instruments F-stat. FDI p-val.
13,994 15,936 15,753 15,936 15,936 15,878 0.79 0.63 0.62 0.63 0.62 0.62
4,763 5,307 5,256 5,307 5,307 5,304 0.56 0.16 0.13 0.15 0.14 0.14 1 1 1 1 1 1 3 3 3 3 3 3 22.90 22.76 13.60 15.77 8.20 21.98 0.6221 0.5144 0.3824 0.5017 0.1800 0.5526
Note: p*<0.1, p**<0.05, p***<0.01 (p-values in parentheses). All regressions include sector, subnational region, and year fixed effects. Standard errors are clustered at the country-sector level.

27
Overall, the coefficients of the interaction terms are larger for the IV 2SLS estimates compared
to the OLS regressions. In other words, absorptive capacities seem to have a bigger impact on FDI
spillovers when the potential endogeneity between foreign output share and domestic firm
productivity is controlled for.
The Role of Domestic Firm Productivity
In a next step, we evaluate the role of domestic firm-level productivity for their absorptive
capacity. Appendices 9 to 11 show the IV 2SLS regression results for domestic firms by productivity
level. FDI spillovers are negative in most specifications across all firms, but only rarely significant.
The coefficient sizes, however, seem to be larger for low-productivity firms, suggesting that
negative FDI spillover effects are smaller for more productive firms. Capital intensity again is
significant and positive across all types of firms. The positive interaction term with technology gap
(gap) is most important for firms with a low productivity level, almost equally high for high-
productivity firms, whereas firms with a medium-productivity level benefit less from a lower
technology gap (column 1). The positive interaction terms with technology (tech) are only
significant for low-productivity firms (column 2), while medium- and high-productivity firms fall
short of the 10 percent significance level. The interaction term with skills (skills) is also positive and
narrowly misses the 10 percent significance level for low-productivity firms (column 3).
The interaction term with firm size (size) is positive and significant for low-productivity firms
(column 4). Similarly, agglomeration (aggl) shows a significant and positive effect for low-
productivity firms only (column 5). This may reflect firm size and the fact that smaller firms tend to
benefit more from urbanization externalities, while larger firms are more self-sufficient (Jacobs
1961). While the interaction terms with export share (exp) are insignificant across all types of firms
(column 6), the p-values and coefficient sizes reveal that export behavior matters more for highly
productive firms, confirming that exporters are more productive (Bernard and Jensen 1999). Note
that the effects on all domestic firms were significant (see Table 2).
In sum, the results tend to suggest that absorptive capacities are more important for low-
productivity firms than for medium- and high-productivity firms, in terms of both statistical
significance and in most cases also coefficient size. The results imply that firm productivity is a
major mediating factor of FDI spillovers, as negative spillover effects tend to be smaller for more
productive firms (although they are not significant). Once domestic firms reach a certain
productivity level, other firm characteristics become less important as mediating factors. The high

28
statistical significance of the technology gap variable across the three types of firms confirms the
importance of domestic firm productivity for FDI spillovers, not only relative to other domestic
firms, but also relative to foreign firms.
The Role of Foreign Ownership Structure
In this section, we examine if foreign ownership structure influences the role of absorptive
capacities of domestic firms in facilitating spillovers. Appendix 12 shows the IV 2SLS regression
results for FDI from fully-owned firms (columns 1 to 6) and partially-owned firms (columns 7 to
12). Interestingly, FDI spillovers tend to be negative and significant for partial foreign ownership,
while the foreign output share variable often shows positive coefficient signs for full foreign
ownership which are mostly insignificant. Capital intensity shows a positive and significant effect
across both types of foreign ownership structure.
The results indicate clearly that absorptive capacities more strongly influence spillovers from
FDI with local participation (partial FDI). A domestic firm’s lower technology gap (gap, columns 1
and 7), technology level (tech, columns 2 and 8), size (size, columns 4 and 10), and export share
(exp, columns 6 and 12) have a significantly stronger beneficial impact on productivity spillovers
from partial FDI compared to full FDI. Proximity to other firms (aggl) shows a significantly positive
productivity effect from partial FDI, whereas there is no effect from agglomeration in the presence
of fully-owned FDI (column 5).
The findings suggest that FDI that includes partial domestic ownership participation better
facilitates firms with absorptive capacity to reap the benefits of productivity spillovers, perhaps
because partial-FDI firms offer greater opportunities for technology diffusion.
4.3 National Characteristics and Institutions
Overall Results
Finally, we focus on the role of host country characteristics and institutions. The OLS
regression results are shown in Table 3, while the IV 2SLS estimates are presented in Table 4. To
rule out the possibility that the impact of an institutional factor on FDI spillovers does not pick up
another institutional characteristic for which we do not simultaneously control, we assess the
cross-correlation of all national characteristics. Reassuringly, the correlation matrix (available upon
request) shows that in all cases institutional factors have a correlation lower than 0.50. Moreover,
only in three cases does the correlation exceed 0.40.

29
FDI spillovers mostly have a negative effect on labor productivity which is rarely significant,
while capital intensity shows a consistently positive impact. The interaction of FDI with financial
freedom (finance) shows a significantly positive effect on domestic firm productivity in the OLS
regression (column 2). This supports studies finding that well-developed financial markets might
ease the domestic firm’s absorptive capacity and facilitate linkages (Agarwal et al. 2011, Javorcik
and Spatareanu 2009).
The interaction of our FDI measure with a country’s government spending on education as
percentage of GDP (educ1) has a strongly positive and significant productivity effect (column 3) in
the OLS and IV 2SLS regressions, confirming the positive role of the local innovation infrastructure
for FDI spillovers (e.g. Meyer and Sinani 2009; Tytell and Yudaeva 2007).
Both trade indicators, namely a country’s export share (trade1), and the absence of trade
protectionism (trade2), are significant and interact positively with foreign output share (columns 7
and 8). This supports the view that FDI spillovers are larger in countries that are more open
towards trade (Meyer and Sinani 2009; Havranek and Irsova 2011; Du et al. 2011). However, the
interaction terms with the trade indicators are only significant in the OLS regressions.
While all other variables have no impact in the overall sample, the effect varies depending on
the level of productivity of domestic firms as well as on the foreign ownership structure, as we
show in the next two sections.
The Role of Domestic Firm Productivity
Appendices 13 to 15 show the IV 2SLS regression results by type of domestic firm productivity.
The impact of FDI spillovers is insignificant across all specifications. The positive impact of capital
intensity matters most for firms with a high- and low-productivity level, followed by medium-
productivity firms.
The interaction term with a country’s government spending on education as percentage of GDP
(educ1) has a significantly positive productivity effect only for low-productivity firms (column 3). It
is also interesting to take a look at the coefficient sizes and p-values across the three types of firms,
suggesting that skilled labor becomes more important the less productive domestic firms are.

30
Table 3: National Characteristics, FDI Spillovers, All Domestic Firms, OLS
Dependent variable: lnlpirst
(1) (2) (3) (4) (5) (6) (7) (8) (9) (10) (11)
FDIYsct
FDIYsct*laborct
FDIYsct*financect FDIYsct*educ1ct
FDIYsct*educ2ct FDIYsct*rdct FDIYsct*investmct FDIYsct*trade1ct FDIYsct*trade2ct FDIYsct*businessct FDIYsct*hhisct FDIYsct*incomect
lncapintirst
-0.0927 -1.7358* -0.8046*** -0.0069 -0.0178 (0.929) (0.072) (0.003) (0.961) (0.893) 0.0087 (0.972) 0.4316* (0.080) 3.9472** (0.013) -0.1922 (0.680) -35.1017 (0.141) 0.2707*** 0.2709*** 0.2772*** 0.2754*** 0.2717*** (0.000) (0.000) (0.000) (0.000) (0.000)
0.9202 -0.2461** -2.7521** 1.1780 -0.1221 -0.1388 (0.175) (0.027) (0.026) (0.411) (0.172) (0.749) -0.2561 (0.140) 0.5713** (0.031) 0.6309** (0.029) -0.3019 (0.384) 0.2488 (0.316) 0.0113 (0.848) 0.2706*** 0.2706*** 0.2705*** 0.2706*** 0.2701*** 0.2707*** (0.000) (0.000) (0.000) (0.000) (0.000) (0.000)
Observations R-squared
15,884 15,884 11,696 14,330 10,356 0.62 0.62 0.49 0.61 0.46
15,884 15,788 15,884 15,884 15,936 15,884 0.62 0.62 0.62 0.62 0.62 0.62
Note: p*<0.1, p**<0.05, p***<0.01 (p-values in parentheses). All regressions include sector, subnational region, and year fixed effects. Standard errors are clustered at the country-sector level.

31
Table 4: National Characteristics, FDI Spillovers, All Domestic Firms, IV 2SLS
Dependent variable: lnlpirst
(1) (2) (3) (4) (5) (6) (7) (8) (9) (10) (11)
FDIYsct
FDIYsct*laborct
FDIYsct*financect FDIYsct*educ1ct
FDIYsct*educ2ct FDIYsct*rdct FDIYsct*investmct FDIYsct*trade1ct FDIYsct*trade2ct FDIYsct*businessct FDIYsct*hhisct FDIYsct*incomect
lncapintirst
3.5634 3.5825 -2.2114* 0.0837 0.0570 (0.466) (0.584) (0.095) (0.787) (0.949) -0.8772 (0.465) -0.8907 (0.585) 12.3485* (0.087) -0.6653 (0.544) -53.2774 (0.691) 0.2629*** 0.2632*** 0.2498*** 0.2664*** 0.2502*** (0.000) (0.000) (0.000) (0.000) (0.000)
0.3838 -0.8501 -2.7243 -5.9113 -0.1886 -0.3773 (0.913) (0.260) (0.665) (0.642) (0.415) (0.720) -0.0952 (0.913) 2.6208 (0.205) 0.6313 (0.664) 1.4287 (0.642) 0.5884 (0.293) 0.0468 (0.736) 0.2638*** 0.2646*** 0.2638*** 0.2644*** 0.2641*** 0.2639*** (0.000) (0.000) (0.000) (0.000) (0.000) (0.000)
Observations R-squared Endog. var. Instruments F-stat. FDI Hansen p-val.
5,307 5,307 4,329 5,098 3,326 0.13 0.13 0.13 0.14 0.14 1 1 1 1 1 3 3 3 3 3 4.05 1.48 3.27 11.75 0.40 0.4752 0.3871 0.5092 0.3384 0.2747
5,307 5,271 5,307 5,307 5,307 5,307 0.13 0.14 0.13 0.13 0.13 0.13 1 1 1 1 1 1 3 3 3 3 3 3 6.31 3.06 12.35 1.54 14.99 8.39 0.3281 0.2774 0.3527 0.4370 0.3905 0.3898
Note: p*<0.1, p**<0.05, p***<0.01 (p-values in parentheses). All regressions include sector, subnational region, and year fixed effects. Standard errors are clustered at the country-sector level.

32
A country’s export share (trade1) positively interacts with foreign output share for low-
productivity firms (column 7). While the effect is statistically insignificant for medium- and high-
productivity firms, the coefficient sizes and p-values across the three types of firms suggest that an
open trade regime is less important for more productive firms. The interaction term with the
absence of trade protectionism (or openness to imports) (trade2) also shows a positive effect for
low-productivity firms, but narrowly misses the 10 percent significance level (column 8).
Finally, the interaction term with sector concentration (hhi) shows a positive and significant
impact on labor productivity for firms with low productivity levels (column 10). Our findings
confirm the results of Barrios and Strobl (2002) showing that higher concentration of sectoral
activity has positive productivity effects that are stronger for low-productivity firms. The
interaction term with income per capita (income) is positive, but falls short of the threshold levels
of statistical significance for low-productivity firms (column 11).
In sum, the interaction terms are only significant for low-productivity firms, confirming the
previous finding that mediating factors matter more for lower-productivity firms. Among the
various institutional variables we test, only a country’s education spending, trade openness and
sector concentration seem to mediate the spillover effects from FDI.
The Role of Foreign Ownership Structure
Finally, we focus on the role of foreign ownership structure for national characteristics.
Appendices 16 and 17 report the IV 2SLS regression results for FDI spillovers from fully-owned
versus partially-owned firms. The results show that national mediating factors influence FDI
spillovers differently, depending on the type of foreign ownership.
More flexible labor markets (labor) positively affect them from partially-owned firms, but
negatively influence productivity spillovers from fully-owned firms (column 1). Both effects,
however, fall short of the threshold levels of statistical significance. Fully-foreign owned firms
might be more constrained to transfer technology in a flexible labor market due to the risk of
technology diffusion. Foreign firms with domestic participation, in contrast, tend to be
characterized by more supply-linkages with the host country. In a flexible labor market, this could
be beneficial to knowledge and productivity spillovers due to higher labor turnover.
A country’s financial market openness (finance) positively and significantly mediates the
productivity effect from partially-owned FDI, but has no effect on the productivity effect generated
by fully-owned FDI (column 2). It is possible that partially-owned foreign firms bring in scarce

33
capital to developing countries (Harrison et al. 2004), which seems to be facilitated by more open
financial markets. This would ease access to finance for local firms and strengthen their absorptive
capacities.
Government spending on education (educ1) significantly increases the productivity effect from
partial foreign ownership, while there is no effect from fully-owned FDI (column 3). This supports
earlier findings that absorptive capacities contribute to greater productivity spillovers in the
presence of partially foreign-owned firms than fully foreign-owned firms. A higher share of people
with completed secondary and tertiary education as percentage of population (educ2) also interacts
positively with spillovers from partially-owned foreign firms, although the effect is not statistically
significant (column 4). Both interaction effects suggest that economies with higher skill availability
benefit more strongly from partially-owned FDI, possibly due to more labor turnover of skilled
labor to domestic firms.
Interestingly, higher skill availability in a country (educ2) significantly lowers the spillovers
from fully-owned foreign firms. It may be possible that economies with a higher share of skilled
people attract more fully-foreign owned firms whose higher technology intensity could crowd-out
domestic producers, supporting the findings of Abraham et al. (2010). Such firms could also bid
away high quality labor from domestic firms, resulting in negative spillover effects.
A country’s openness to investment (investm) positively and significantly interacts with the
output share of partially-owned foreign firms, while the effect from fully-owned foreign firms is
negative but narrowly misses the 10 percent level of significance (column 6). More investment
openness could attract more partially-owned FDI and thus increase the spillover potential due to
technology leakages and more linkages to the host country. At the same time, it could also
contribute to greater ‘footloose’ fully foreign-owned firms, with fewer linkages to the local economy
and crowding-out potential.
Interestingly, a country’s export share in GDP (trade1) significantly increases the spillover
impact from partial foreign ownership, while the effect from full foreign ownership is negative but
insignificant (column 7). Analogously, trade freedom (trade2) – reflecting the absence of trade
protectionism including imports – positively moderates the productivity impact from partial
foreign ownership, while the effect from fully-owned FDI is negative but again insignificant (column
8). Partially-owned foreign firms have a higher spillover potential because they are more integrated
into their host countries in terms of sales and local sourcing (see Appendix 4). Nevertheless, they
may still depend on exports or imported inputs, hence, trade openness and freedom positively
34
interact with the sectoral output share of such firms. Fully-owned FDI, in contrast, is more likely to
be an export-platform with fewer local linkages and technology leakages.
Finally, income per capita (income) positively mediates the FDI spillover effect on domestic
labor productivity from partially-owned FDI, while there is no effect for fully-owned FDI (column
11). This reflects the importance of national competitiveness and development, given the possibility
of more local linkages for partially-owned foreign firms.
Overall, the results clearly indicate that spillovers from partially-owned FDI are positively
mediated by various national and institutional factors. In contrast, national and institutional
characteristics exert no or even a negative effect on spillovers from fully-owned FDI.
5 Conclusions
In this paper, we use a cross-section of more than 25,000 manufacturing firms in 78 low- and
middle-income countries from the World Bank’s Enterprise Surveys Indicator Database to identify
the mediating factors that determine intra-industry productivity spillovers. Besides OLS, this paper
also applies an instrumental variables approach to addresses the potential endogeneity between
FDI spillovers and domestic firm productivity. We differentiate between major types of mediating
factors, namely the FDI spillover potential, domestic firms’ absorptive capacity, and differences in
host country factors and institutions. This is the first study to our knowledge that interacts FDI with
all three types of mediating factors against productivity outcomes.
We find evidence for negative FDI spillovers overall, which we relate to increased competition
in the short term for market share (both domestic and export) and skilled labor. Regarding the FDI
spillover potential, we find a positive and significant impact in the overall sample for market
orientation in the OLS regressions – the higher the share of FDI output sold domestically, the
greater productivity spillovers to domestic firms. Splitting the sample into three productivity
groups, we find that larger output share sold to the domestic market and larger share of local inputs
contributes to higher spillovers for low- and medium-productivity firms.
Regarding a domestic firm’s absorptive capacity, almost all variables show the expected
coefficient signs, suggesting that a lower technology gap, firm technology, firm size, proximity to
other firms, and export behavior interact positively with foreign output share, although results vary
by type of firm. In sum, the mediating factors are more significant for low-productivity firms. The
results imply that firm productivity is a major mediating factor of FDI spillovers, as negative

35
spillover effects tend to be smaller for more productive firms (although they are not significant).
Once domestic firms reach a certain productivity level, other firm characteristics become less
important as mediating factors. The high statistical significance of the technology gap variable
across the three types of firms confirms the importance of domestic firm productivity for FDI
spillovers, not only relative to other domestic firms, but also relative to foreign firms.
The overall results for national and institutional mediating factors suggest that a country’s
spending on education as well as trade openness and openness in financial markets (the latter two
can only be confirmed in the OLS regressions) matter most. However, again the results vary
significantly depending on the productivity levels of domestic firms. The positive interaction with
education spending and trade is only significant for low-productivity firms and tends to fall with
higher firm-level productivity. Splitting the sample into three productivity levels reveals that a
country’s institutional framework only seems to benefit low-productivity firms. A country’s
spending on education, export share, and sector concentration significantly increase FDI spillovers.
In sum, all three types of mediating factors have an influence on domestic firms, although the
actual effect is clearly related to domestic firm productivity. Low-productivity firms tend to benefit
from FDI spillover potential and the institutional framework and also exhibit the highest absorptive
capacity. The mediating factors might help them counterbalance some of the negative spillover
effects from FDI despite their productivity disadvantage. Medium-productivity firms seem to be
disadvantaged in terms of the institutional framework and also show lower benefits from FDI
spillover potential and absorptive capacity. High-productivity firms only benefit from absorptive
capacities – in particular a low productivity gap – while the FDI spillover potential and the
institutional framework have a negative or no influence on FDI spillovers for those firms.
We also assess whether the results depend on the structure of foreign ownership. Across all
three types of mediating factors, we find strong evidence that partial foreign ownership shows
more positive FDI spillovers on domestic firm productivity. While we have no specific information
on investment policy in our sample, our data sample suggests that the majority of partially-owned
firms have the legal status of a joint venture. However, joint venture participation seems to be
overwhelmingly driven by market considerations rather than policies which require local
participation. Regarding the FDI spillover potential, the spillovers from partially-owned foreign
firms are larger the higher the share of local sourcing is, which does not hold for fully-owned firms.
On the other hand, foreign firms’ sales to the domestic market exert a positive effect on FDI
spillovers which is only significant for fully foreign-owned firms.

36
Our results also show clearly that a domestic firm’s absorptive capacities, in particular a
smaller technology gap, higher technology level, larger size, more agglomeration and higher export
share, more strongly influence spillovers from FDI in the presence of FDI that includes local
partners (partial foreign-owned) than they do in the presence fully foreign-owned FDI.
Finally, the role of local participation for the moderating effects of national characteristics is
clearly positive. Government spending on education, openness in trade, investment, and financial
markets, trade integration, and income level interact positively with FDI from partially-owned
firms. In contrast, national and institutional characteristics exert no or even a negative effect on
spillovers from fully-owned FDI, suggesting that fully foreign-owned firms may operate largely as
enclaves in their host countries.
Overall, these findings suggest that policies designed to promote greater spillovers from
foreign investment need to take into account not only these three important mediating factors – FDI
spillover potential, absorptive capacity of domestic firms, and the host country environment – but
also, critically, heterogeneity of firms in the host country. The effectiveness of interventions is likely
to vary significantly depending on the characteristics of domestic firms, as well as the form of
foreign investment.
While there has been substantial empirical work in the field of FDI spillovers over the past
decade, much promising ground for research remains. Our findings suggest three areas in
particular. First, this paper highlights the importance of firm heterogeneity in mediating spillover
potential, both from the perspective of domestic firms and FDI. Improving our understanding of the
mechanics of FDI spillovers, including positive knowledge diffusion and also negative competition
effects, can help identify the impact of heterogeneity in domestic firm productivity and foreign
ownership structure on spillovers. This will help guide policies designed to attract FDI and perhaps
encourage domestic participation as well as policies intending explicitly to promote spillovers,
including the increasingly popular supplier linkage programs.
Second, and related to the previous point, our findings on the importance of the structure of
foreign investment – specifically on the positive impact of local participation– suggest a need to
understand better the specific mechanisms within firms and supply chains which lead to this result.
In particular, researchers should examine the role of spillovers from joint ventures versus other
forms of partial ownership. Moreover, there is a need to understand what, if any policies can play a
positive role in facilitating conducive local participation.

37
Finally, research on mediating factors should focus more on understanding better FDI spillover
potential, particularly in the context of global value chain dynamics. Upstream of the form of FDI, a
multinational’s global production strategy can influence the FDI spillover potential. If production is
highly internalized, e.g., because a large share of value added is considered a core competency, the
multinational firm may have little interest in local sourcing beyond non-tradable services and
standardized inputs like packaging. If production of inputs requires a high degree of technological
sophistication, a multinational firm may opt to purchase inputs from existing global suppliers with
whom it already has developed long-standing relationships. In both cases, the opportunity for
positive local spillovers from FDI will be limited from the start. Given the increasing importance of
global production chains and export platform FDI, understanding how spillover potential differs in
this growing category of FDI is likely to become an important policy priority, particularly for small
and low-income countries that rely increasingly on this type of investment.

38
References Abraham, F., J. Konings, and V. Slootmaekers (2010), “FDI spillovers in the Chinese manufacturing
sector, Evidence of firm heterogeneity”, Economies of Transition, Vol. 18, Issue 1, pp. 143-82. Agarwal, N., C. Milner, and A. Riaño (2011), “Credit Constraints and FDI Spillovers in China”, China
and the World Economy Research Paper Series, No. 21/2011, University of Nottingham. Aitken, B. and A. Harrison (1999) “Do domestic firms benefit from direct foreign investment?
Evidence from Venezuela”, The American Economic Review, Vol. 89, Issue 3, pp. 605-18. Alfaro, L., A. Chanda, S. Kalemli-Ozcan, and S. Sayek (2010), “Does foreign direct investment
promote growth? Exploring the role of financial markets on linkages”, Journal of Development Economics, Vol. 91, Issue 2, pp. 242-56.
Barrios, S. and E. Strobl (2002), “Foreign direct investment and productivity spillovers: Evidence from the Spanish experience”, Review of World Economics, Vol. 138, Issue 3, pp. 459-81.
Barrios, S., B. Luisito, and E. Strobl (2006), “Coagglomeration and Spillovers”, Regional Science and Urban Economics, Vol. 36, Issue 4, pp. 467–81.
Barrios, S., S. Dimelis, H. Louri, and E. Strobl (2004), “Efficiency spillovers from foreign direct investment in the EU periphery: a comparative study of Greece, Ireland and Spain”, Review of World Economics (Weltwirtschaftliches Archiv), Vol. 140, Issue 4, pp. 688-705.
Barro, R. and J.-W. Lee (2010) “A New Data Set of Educational Attainment in the World, 1950-2010”, NBER Working Paper No. 15902.
Bernard, A. and J. Jensen (1999), “Exceptional Exporter Performance: Cause, Effect or Both?”, Journal of International Economics, Vol. 47, Issue 1, pp. 1-25.
Blalock, G. and P. Gertler (2009), “How firm capabilities affect who benefits from foreign technology”, Journal of Development Economics, Vol. 90, Issue 2, pp. 192–99.
Buckley, P., C. Wang, and J. Clegga (2007) “The impact of foreign ownership, local ownership and industry characteristics on spillover benefits from foreign direct investment in China”, International Business Review, Vol. 16, Issue 2, pp. 142-58.
Castellani, D. and A. Zanfei (2003), “Technology Gaps, Absorptive Capacity and the Impact of Inward Investments on Productivity of European Firms”, Economics of Innovation and New Technology, Vol. 12, Issue 6, pp. 555–76.
Crespo, N. and M. Fontoura (2007), “Determinant Factors of FDI Spillovers – What Do We Really Know?”, World Development, Vol. 35, Issue 3, pp. 410-25.
Damijan, J., M. Knell, B. Majcen and M. Rojec (2003), “The role of FDI, R&D accumulation and trade in transferring technology to transition countries: evidence from firm panel data for eight transition countries”, Economic Systems, Vol. 27, Issue 2, pp. 189-204.
Dimelis, S. and Louri, H. (2002), “Foreign ownership and production efficiency: a quantile regression analysis”, Oxford Economic Papers, Vol. 54, Issue 3, pp. 449-69.
Djankov, S. and B. Hoekman (2000), “Foreign Investment and Productivity Growth in Czech Enterprises,” World Bank Economic Review, Vol. 14, Issue 1, pp. 49-64.
Du, L., A. Harrison, and G. Jefferson (2011), “Do Institutions Matter For FDI Spillovers? The Implications Of China's "Special Characteristics"”, NBER Working Paper 16767, February 2011.
Farole, T., C. Staritz, and D. Winkler (2012), “FDI Spillovers and the Role of Mediating Factors in Global Value Chains – A Conceptual Framework”, The World Bank.
Findlay, R. (1978), “Relative Backwardness, Direct Foreign Investment, and the Transfer of Technology: A Simple Dynamic Model”, Quarterly Journal of Economics, Vol. 92, Issue 1, pp. 1–16.
Girma, S. (2005), “Absorptive Capacity and Productivity Spillovers from FDI: A Threshold Regression Analysis”, Oxford Bulletin of Economics and Statistics, Vol. 67, Issue 3, pp. 281–306.

39
Girma, S. and H. Görg (2007), “The Role of Efficiency Gap for Spillovers from FDI: Evidence from the U.K. Electronics and Engineering Sectors”, Open Economies Review, Vol. 18, Issue 2, pp. 215–32.
Girma, S. and K. Wakelin (2007), “Local Productivity Spillovers from Foreign Direct Investment in the U.K. Electronics Industry”, Regional Science and Urban Economics, Vol. 37, Issue 3, pp. 399–412.
Görg, H. and D. Greenaway (2004),“Much ado about nothing? Do domestic firms really benefit from foreign direct investment?”, The World Bank Research Observer, Vol. 19, Issue 2, pp. 171–97.
Görg, H. and E. Strobl (2001), “Multinational Companies and Productivity Spillovers: A Metaanalysis”, Economic Journal, Vol. 111, Issue 475, pp. F723–F739.
Gorodnichenko, Y., J. Svejnar, and K. Terrell (2007), "When Does FDI Have Positive Spillovers? Evidence from 17 Emerging Market Economies," IZA Discussion Papers No. 3079, Institute for the Study of Labor (IZA).
Griffith, R., S. Redding, and H. Simpson (2002), “Productivity Convergence and Foreign Ownership at the Establishment Level”, Institute for Fiscal Studies Working Paper 22, London.
Grünfeld, L. (2006), “Multinational Production, Absorptive Capacity, and Endogenous R&D Spillovers”, Review of International Economics, Vol. 14, Issue 5, pp. 922-40.
Hale, G. and C. Long (2011), “Did Foreign Direct Investment Put an Upward Pressure on Wages in China?”, IMF Economic Review, Vol. 59, Issue 3, pp. 404-30.
Harding, T. and B. Javorcik (2011), “Foreign Direct Investment and Export Upgrading”, University of Oxford, Department of Economics, Economics Series Working Papers 526, forthcoming in The Review of Economics and Statistics.
Harrison, A. (1994), “Productivity, imperfect competition and trade reform”, Journal of International Economics, Vol. 36, Issues 1-2, pp. 53-73.
Harrison, A., I. Love, and M. McMillan (2004), “Global capital flows and financing constraints”, Journal of Development Economics, Vol. 75, Issue 1, pp. 269-301.
Haskel, J., S. Pereir, and M. Slaughter (2007), “Does Inward Foreign Direct Investment Boost the Productivity of Domestic Firms?”, The Review of Economics and Statistics, Vol. 89, Issue 3, pp. 482-496.
Havranek, T. and Z. Irsova (2011), “Estimating vertical spillovers from FDI: Why results vary and what the true effect is”, Journal of International Economics, Vol. 85, Issue 2, pp. 234–244.
Hoekman, B. and Javorcik, B. (2006), “Lessons from Empirical Research on Technology Diffusion through Trade and Foreign Direct Investment”, in Hoekman, B. and Javorcik, B. (eds.) Global Integration and Technology Transfer, pp. 1-28, Washington, DC: World Bank; New York: Palgrave Macmillan.
Jacobs, J. (1961), The Death and Life of Great American Cities, New York: Vintage Books. Javorcik, B. (2004), “The composition of foreign direct investment and protection of intellectual
property rights: evidence from transition economies”, European Economic Review, Vol. 48, Issue 1, pp. 39–62.
Javorcik, B. and M. Spatareanu (2008), “To share or not to share: Does local participation matter for spillovers from foreign direct investment?”, Journal of Development Economics, Vol. 85, Issues 1-2, pp. 194–21.
Javorcik, B. and M. Spatareanu (2009), “Liquidity constraints and firms' linkages with multinationals”, World Bank Economic Review, Vol. 23, Issue 2, pp. 323-46.
Jordaan, J. (2011a), “Cross-sectional estimation of FDI spillovers when FDI is endogenous: OLS and IV estimates for Mexican manufacturing industries”, Applied Economics, Vol. 43, Issue 19, pp. 2451-63.
Jordaan, J. (2011b), “Local Sourcing and Technology Spillovers to Mexican Suppliers: How Important are FDI and Supplier Characteristics?”, Growth and Change, Vol. 42, Issue 3, pp. 287-319.

40
Kanturia, V. (2000), “Productivity spillovers from technology transfer to Indian manufacturing firms”, Journal of International Development, Vol. 12, Issue 3, pp. 343-69.
Kanturia, V. (2001), “Foreign firms, technology transfer and knowledge spillovers to Indian manufacturing firms: a stochastic frontier analysis”, Applied Economics, Vol. 33, Issue 5, pp. 625-42.
Kanturia, V. (2002), “Liberalisation, FDI, and productivity spillovers – an analysis of Indian manufacturing firms”, Oxford Economic Papers, Vol. 54, Issue 4, pp. 688-718.
Karpaty, P. and L. Lundberg (2004), “Foreign direct investment and productivity spillovers in Swedish manufacturing”, FIEF Working Paper Series No. 194.
Keller, W. and Yeaple, S. (2009), “Multinational enterprises, international trade, and productivity growth: firm-level evidence from the United States”, The Review of Economics and Statistics, Vol. 91, Issue 4, pp. 821-831.
Kinoshita, Y. (2001), “R&D and technology spillovers through FDI: innovation and absorptive capacity”, CEPR discussion paper 2775. London: Centre for Economic Policy Research.
Kokko, A. (1994), “Technology, market characteristics, and spillovers”, Journal of Development Economics, Vol. 43, Issue 2, pp. 279-93.
Kokko, A., R. Tansini, and M. Zejan (1996), “Local technological capability and productivity spillovers from FDI in the Uruguayan manufacturing sector”, Journal of Development Studies, Vol. 32, Issue 4, pp. 602-11.
Konings, J. (2001), “The effects of foreign direct investment on domestic firms, Evidence from firm-level panel data in emerging economies”, Economics of Transition, Volume 9, Issue 3, pp. 619–633.
Levinsohn, J. and A. Petrin (2003), “Estimating production functions using inputs to control for unobservables”, Review of Economic Studies, Vol. 70, Issue 2, pp. 317-342.
Lin, P., Z. Liub, and Y. Zhanga (2009) “Do Chinese domestic firms benefit from FDI inflow?: Evidence of horizontal and vertical spillovers”, China Economic Review, Vol. 20, Issue 4, pp. 677-91.
Lipsey, R. and F. Sjöholm (2005), “The Impact of Inward FDI on Host Countries: Why Such Different Answers?”, in Moran, T., E. Graham, and M. Blomström (eds.), Does Foreign Direct Investment Promote Development?, pp.23–43, Washington, D.C.: Institute for International Economics and Center for Global Development.
Melitz, M. (2003), “The Impact of Trade on Intra-Industry Reallocations and Aggregate Industry Productivity,” Econometrica, Vol. 71, Issue 6, pp. 1695-1725.
Meyer, K. and E. Sinani (2009), “When and where does foreign direct investment generate positive spillovers? A meta-analysis”, Journal of International Business Studies, Vol. 40, Issue 7, pp. 1075–1094.
Milberg, W. and D. Winkler (forthcoming) Outsourcing Economics: Global Value Chains in Capitalist Development, New York: Cambridge University Press.
Olley, G. and A. Pakes (1996), “The dynamics of productivity in the telecommunications equipment industry”, Econometrica, Vol. 64, Issue 6, pp. 1263-1297.
Paus, E. and K. Gallagher (2008), “Missing Links: Foreign Investment and Industrial Development in Costa Rica and Mexico”, Studies of Comparative International Development, Vol. 43, Issue 1, pp. 53-80.
Ponomareva, N. (2000), “Are there positive or negative spillovers from foreign-owned to domestic firms?”, Working paper BSP/00/042, Moscow: New Economic School.
Resmini, L. and M. Nicolini (2007), “Productivity spillovers and multinational enterprises: in search of a spatial dimension”, Dynamic Regions in a Knowledge-Driven Global Economy: Lessons and Policy Implications for the EU (DYNREG) Working Paper No. 10.
Resmini, L. and M. Nicolini and (2007), “Productivity Spillovers and Multinational Enterprises: In Search of a Spatial Dimension”, DYNREG Working Paper 10, Economic and Social Research Institute, Dublin.

41
Schoors, K., and B. van der Tol (2002), “Foreign direct investment spillovers within and between sectors: evidence from Hungarian data”, Working paper 2002/157, University of Gent.
Sinani, E., and K. Meyer (2004), “Spillovers of technology transfer from FDI: the case of Estonia”, Journal of Comparative Economics, Vol. 32, Issue 3, 445-66.
Sjöholm, F. (1999), “Productivity growth in Indonesia: the role of regional characteristics and direct foreign investment”, Economic Development and Cultural Change, Vol. 47, Issue 3, pp. 559-84.
Smeets, R. (2008), “Collecting the pieces of the FDI knowledge spillovers puzzle”, World Bank Research Observer, Vol. 23, Issue 2, pp. 107-38.
Takii, S. (2005), “Productivity spillovers and characteristics of foreign multinational plants in Indonesian manufacturing 1990–1995”, Journal of Development Economics, Vol. 76, Issue 2, pp. 521–42.
Torlak, E. (2004), “Foreign direct investment, technology transfer, and productivity growth in transition countries – empirical evidence from panel data”, Cege Discussion Paper 26.
Toth, I. and A. Semjen (1999), “Market links and growth capacity of enterprises in a transforming economy: the case of Hungary”, in Toth, I. and A. Semjen (eds.) Market links, tax environment and financial discipline of Hungarian enterprises, Budapest: Institute of Economics, Hungarian Academy of Sciences.
Tytell, I. and K. Yudaeva (2007), “The Role of FDI in Eastern Europe and New Independent States: New Channels for the Spillover Effect”, in Liebscher, K., J. Christl, P. Mooslechner, and D. Ritzberger-Grünwald (eds.), Foreign direct investment in Europe: a changing landscape, Edward Elgar, Cheltenham, UK and Northampton, MA, USA.
Wang, J. and M. Blomström (1992), “Foreign Investment and Technology Transfer. A Simple Model”, European Economic Review, Vol. 36, Issue 1, pp. 137–55.
Yudaeva, K., K. Kozlov, N. Malentieva, and N. Ponomareva (2003), “Does foreign ownership matter? The Russian experience”, Economics of Transition, Vol. 11, Issue 3, pp. 383-409.

42
Appendix 1: The role of mediating factors for FDI spillovers – a conceptual framework
Source: Farole, Staritz, and Winkler (2012).
Foreign firm characteristics Domestic firm characteristics
Absorptive capacity FDI spillover potential
• Degree/structure of foreign ownership
• FDI motive • Global production and
sourcing strategy • Technology intensity • FDI home country • Entry mode
Actual FDI spillovers
Host country factors and institutional framework
Transmission channels
Market restructuring • competition effect • demonstration effect
Labor turnover Supply chains
• demand effect • assistance effect • diffusion effect • availability and quality effect
• Labor market regulations • Intellectual property rights • Access to finance • Learning and innovation infrastructure • Investment promotion agencies • Trade policy • Institutions and governance • Competition
• Technology and productivity gap
• Research and development • Human capital • Scale • Firm location • Exporting • Sector dynamics • Type of ownership

43
Appendix 2: Survey Year and Number of Domestic and Foreign Manufacturing Firms by Country
Country Survey year
Dom. mfg. firms
For. mfg. firms
Country Survey year
Dom. mfg. firms
For. mfg. firms
Albania 2007 87 23 Malaysia 2007 773 321
Algeria 2007 374 10 Mauritania 2006 112 16
Argentina 2010 681 111 Mauritius 2009 157 18
Armenia 2009 102 12 Mexico 2010 1,046 110
Azerbaijan 2009 95 23 Moldova 2009 86 22
Belarus 2008 86 13 Mongolia 2009 115 15
Bosnia Herzeg. 2009 113 10 Morocco 2007 354 103
Bolivia 2010 118 22 Mozambique 2007 284 56
Brazil 2009 851 59 Namibia 2006 114 37
Burkina Faso 2009 81 16 Nepal 2009 124 4
Burundi 2006 110 28 Nicaragua 2010 115 10
Cameroon 2009 87 29 Nigeria 2007 938 10
Chile 2010 673 102 Pakistan 2007 763 20
Colombia 2010 641 65 Panama 2010 101 14
Costa Rica 2010 272 53 Paraguay 2010 108 17
Cote d'Ivoire 2009 144 49 Peru 2010 673 87
Croatia 2007 364 47 Philippines 2009 692 262
Ecuador 2010 97 22 Poland 2009 137 14
Egypt 2008 1,103 36 Romania 2009 143 36
El Salvador 2010 104 20 Russia 2009 660 39
Ethiopia 2006 337 22 Rwanda 2006 54 14 Form. Yugoslavia 2009 98 23 Senegal 2007 243 16
Georgia 2008 109 14 Serbia 2009 117 19
Ghana 2007 271 19 South Africa 2007 579 101
Guatemala 2010 315 40 St. Vincent & Gr. 2010 124 24
Guinea 2006 122 15 Swaziland 2006 68 38
Guinea-Bissau 2006 72 9 Tajikistan 2008 98 15
Honduras 2010 130 18 Tanzania 2006 247 39
India 2006 2,134 37 Thailand 2006 800 230
Indonesia 2009 1,067 89 Turkey 2008 866 29
Jamaica 2010 103 16 Uganda 2006 276 58
Jordan 2006 305 48 Ukraine 2008 523 46
Kazakhstan 2009 169 14 Uruguay 2010 327 32
Kenya 2007 331 65 Uzbekistan 2008 87 34
Kyrgyzstan 2009 80 16 Venezuela 2010 71 14
Latvia 2009 65 24 Vietnam 2009 649 130
Lithuania 2009 85 19 Yemen 2010 238 5
Madagascar 2009 125 79 Zambia 2007 236 68
SUM 25,199 3,440

44
Appendix 3: Number of Domestic and Foreign Manufacturing Firms by Sector
Domestic
firms Foreign firms
All All Full foreign ownership
Partial foreign ownership
Sector No. % No. % No. % No. %
Manufacturing 25,199 100.0% 3,440 100.0% 1,789 100.0% 1,651 100.0%
Textiles 2,051 8.1% 194 5.6% 106 5.9% 88 5.3%
Leather 275 1.1% 42 1.2% 25 1.4% 17 1.0%
Garments 3,439 13.6% 373 10.8% 217 12.1% 156 9.4%
Food 5,098 20.2% 632 18.4% 309 17.3% 323 19.6%
Metals and machinery 3,878 15.4% 534 15.5% 286 16.0% 248 15.0%
Electronics 697 2.8% 188 5.5% 103 5.8% 85 5.1%
Chemicals and pharmaceuticals 1,986 7.9% 391 11.4% 198 11.1% 193 11.7%
Wood and furniture 715 2.8% 46 1.3% 16 0.9% 30 1.8%
Non-metallic and plastic materials 2,653 10.5% 446 13.0% 218 12.2% 228 13.8%
Auto and auto components 370 1.5% 75 2.2% 37 2.1% 38 2.3%
Other manufacturing 4,037 16.0% 519 15.1% 274 15.3% 245 14.8% NB: Full foreign ownership: foreign participation = 100 percent.
Partial foreign ownership: 10 percent >= foreign participation < 100 percent.
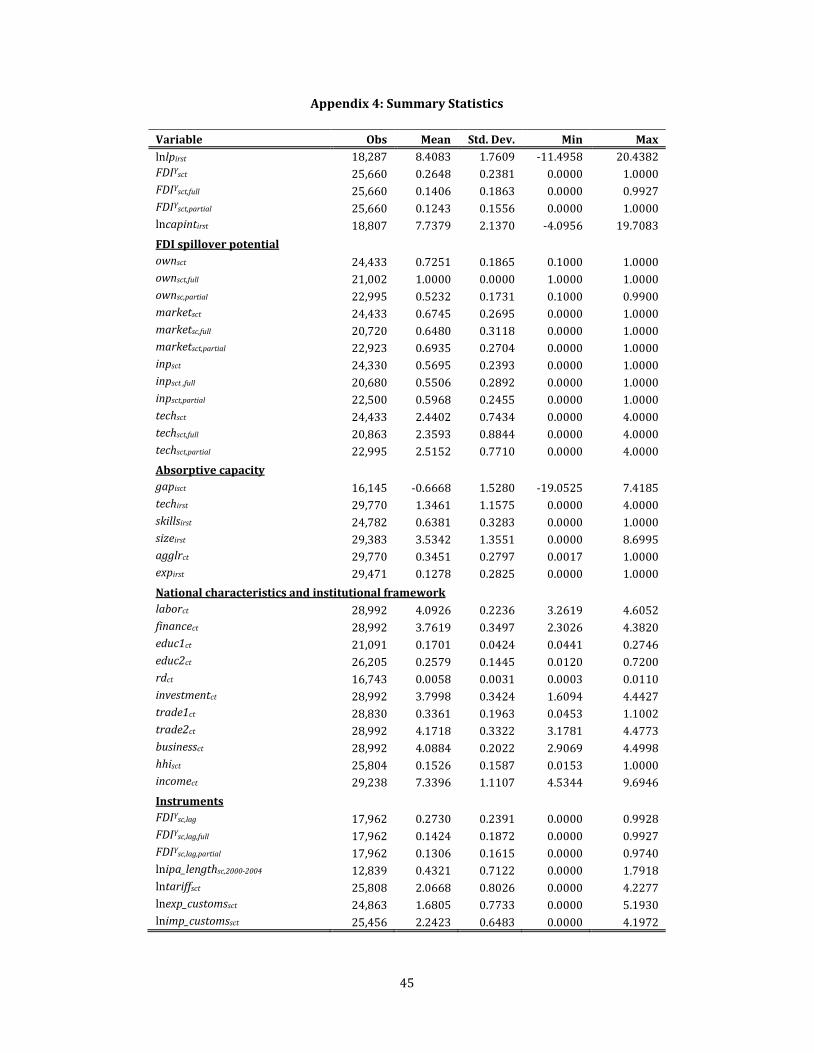
45
Appendix 4: Summary Statistics
Variable Obs Mean Std. Dev. Min Max lnlpirst 18,287 8.4083 1.7609 -11.4958 20.4382 FDIYsct 25,660 0.2648 0.2381 0.0000 1.0000 FDIYsct,full 25,660 0.1406 0.1863 0.0000 0.9927 FDIYsct,partial 25,660 0.1243 0.1556 0.0000 1.0000 lncapintirst 18,807 7.7379 2.1370 -4.0956 19.7083 FDI spillover potential ownsct 24,433 0.7251 0.1865 0.1000 1.0000 ownsct,full 21,002 1.0000 0.0000 1.0000 1.0000 ownsc,partial 22,995 0.5232 0.1731 0.1000 0.9900 marketsct 24,433 0.6745 0.2695 0.0000 1.0000 marketsc,full 20,720 0.6480 0.3118 0.0000 1.0000 marketsct,partial 22,923 0.6935 0.2704 0.0000 1.0000 inpsct 24,330 0.5695 0.2393 0.0000 1.0000 inpsct ,full 20,680 0.5506 0.2892 0.0000 1.0000 inpsct,partial 22,500 0.5968 0.2455 0.0000 1.0000 techsct 24,433 2.4402 0.7434 0.0000 4.0000 techsct,full 20,863 2.3593 0.8844 0.0000 4.0000 techsct,partial 22,995 2.5152 0.7710 0.0000 4.0000 Absorptive capacity gapisct 16,145 -0.6668 1.5280 -19.0525 7.4185 techirst 29,770 1.3461 1.1575 0.0000 4.0000 skillsirst 24,782 0.6381 0.3283 0.0000 1.0000 sizeirst 29,383 3.5342 1.3551 0.0000 8.6995 agglrct 29,770 0.3451 0.2797 0.0017 1.0000 expirst 29,471 0.1278 0.2825 0.0000 1.0000 National characteristics and institutional framework laborct 28,992 4.0926 0.2236 3.2619 4.6052 financect 28,992 3.7619 0.3497 2.3026 4.3820 educ1ct 21,091 0.1701 0.0424 0.0441 0.2746 educ2ct 26,205 0.2579 0.1445 0.0120 0.7200 rdct 16,743 0.0058 0.0031 0.0003 0.0110 investmentct 28,992 3.7998 0.3424 1.6094 4.4427 trade1ct 28,830 0.3361 0.1963 0.0453 1.1002 trade2ct 28,992 4.1718 0.3322 3.1781 4.4773 businessct 28,992 4.0884 0.2022 2.9069 4.4998 hhisct 25,804 0.1526 0.1587 0.0153 1.0000 incomect 29,238 7.3396 1.1107 4.5344 9.6946 Instruments FDIYsc,lag 17,962 0.2730 0.2391 0.0000 0.9928 FDIYsc,lag,full 17,962 0.1424 0.1872 0.0000 0.9927 FDIYsc,lag,partial 17,962 0.1306 0.1615 0.0000 0.9740 lnipa_lengthsc,2000-2004 12,839 0.4321 0.7122 0.0000 1.7918 lntariffsct 25,808 2.0668 0.8026 0.0000 4.2277 lnexp_customssct 24,863 1.6805 0.7733 0.0000 5.1930 lnimp_customssct 25,456 2.2423 0.6483 0.0000 4.1972

46
Appendix 5: FDI Spillover Potential, FDI Spillovers, Domestic Low Productivity Firms, IV 2SLS
Dependent variable: lnlpirst
(1) (2) (3) (4) (5) (6)
FDIYsct
FDIYsct*ownsct FDIYsct*marketsct FDIYsct*inpsct FDIYsct*techsct
lncapintirst
-0.9337 -1.1489 -3.2765** -1.1940 -3.5573 0.3386 (0.594) (0.103) (0.046) (0.101) (0.168) (0.649) 1.4043 (0.469) 1.9283** 5.2864** (0.018) (0.035) 2.2108** 6.7001 (0.038) (0.152) -0.0793 (0.750) 0.0862*** 0.0848*** 0.0798*** 0.0846*** 0.0770*** 0.0865*** (0.000) (0.000) (0.001) (0.000) (0.001) (0.000)
Observations R-squared Endog. var. Instruments F-stat. FDI F-stat. market_int F-stat. inp_int Hansen p-val.
1,789 1,789 1,772 1,789 1,776 1,789 0.02 0.02 -0.06 0.01 -0.11 0.03 1 1 2 1 2 1 3 3 4 3 4 3 3.04 4.83 19.61 5.49 17.07 4.75 14.29 10.20 0.0662 0.1335 0.0800 0.4404 0.3427 0.1421
Note: p*<0.1, p**<0.05, p***<0.01 (p-values in parentheses). All regressions include sector, subnational region, and year fixed effects. Standard errors are clustered at the country-sector level.
Low productivity: LP <= 33.33 percentile.
Appendix 6: FDI Spillover Potential, FDI Spillovers, Domestic Medium Productivity Firms, IV 2SLS
Dependent variable: lnlpirst
(1) (2) (3) (4) (5) (6)
FDIYsct
FDIYsct*ownsct FDIYsct*marketsct FDIYsct*inpsct FDIYsct*techsct
lncapintirst
0.7886 -0.9243 -3.2378** -0.8447 -2.5559 0.1298 (0.593) (0.136) (0.037) (0.114) (0.171) (0.825) -0.8388 (0.601) 1.2940* 5.0172** (0.078) (0.025) 1.3829* 4.7339 (0.070) (0.171) -0.0700 (0.728) 0.0367*** 0.0371*** 0.0333*** 0.0373*** 0.0341*** 0.0367*** (0.000) (0.000) (0.000) (0.000) (0.000) (0.000)
Observations R-squared Endog. var. Instruments F-stat. FDI F-stat. market_int F-stat. inp_int Hansen p-val.
1,772 1,772 1,757 1,772 1,761 1,772 0.01 0.03 -0.39 0.03 -0.25 0.03 1 1 2 1 2 1 3 3 4 3 4 3 2.55 4.72 17.65 5.50 14.10 4.45 12.81 8.85 0.2266 0.2529 0.1372 0.3833 0.3441 0.2242
Note: p*<0.1, p**<0.05, p***<0.01 (p-values in parentheses). All regressions include sector, subnational region, and year fixed effects. Standard errors are clustered at the country-sector level.
Medium productivity: 33.33 percentile < LP <= 66.67 percentile.

47
Appendix 7: FDI Spillover Potential, FDI Spillovers, Domestic High Productivity Firms, IV 2SLS
Dependent variable: lnlpirst
(1) (2) (3) (4) (5) (6)
FDIYsct
FDIYsct*ownsct FDIYsct*marketsct FDIYsct*inpsct FDIYsct*techsct
lncapintirst
-0.1559 -0.1603 -0.5486 -0.5291 -1.1922 0.1884 (0.937) (0.857) (0.644) (0.454) (0.586) (0.793) -0.1703 (0.938) -0.1809 0.5402 (0.868) (0.760) 0.4191 1.7521 (0.677) (0.657) -0.2219 (0.385) 0.1067*** 0.1069*** 0.1073*** 0.1061*** 0.1050*** 0.1064*** (0.000) (0.000) (0.000) (0.000) (0.000) (0.000)
Observations R-squared Endog. var. Instruments F-stat. FDI F-stat. market_int F-stat. inp_int Hansen p-val.
1,621 1,621 1,612 1,621 1,614 1,621 0.06 0.06 0.06 0.06 0.06 0.06 1 1 2 1 2 1 3 3 4 3 4 3 2.05 3.94 17.06 4.04 15.89 4.09 12.67 10.38 0.9437 0.9482 0.7816 0.9814 0.9514 0.9582
Note: p*<0.1, p**<0.05, p***<0.01 (p-values in parentheses). All regressions include sector, subnational region, and year fixed effects. Standard errors are clustered at the country-sector level.
High productivity: LP > 66.67 percentile.

48
Appendix 8: FDI Spillover Potential, FDI Spillovers by Type of Foreign Ownership, All Domestic Firms, IV 2SLS
Dependent variable: lnlpirst
FDI spillovers from firms with full foreign ownership FDI spillovers from firms with partial foreign ownership
(1) (2) (3) (4) (5) (6) (7) (8) (9) (10) (11) (12)
FDIYsct
FDIYsct*ownsct FDIYsct*marketsct FDIYsct*inpsct FDIYsct*techsct
lncapintirst
-0.0155 -2.6314 -4.8399 0.1259 0.2271 0.3878 (0.908) (0.388) (0.111) (0.829) (0.804) (0.327) 3.6360 7.0625* (0.363) (0.098) -0.1213 -0.3045 (0.889) (0.852) -0.1679 (0.212) 0.2579*** 0.2572*** 0.2560*** 0.2581*** 0.2593*** 0.2585*** (0.000) (0.000) (0.000) (0.000) (0.000) (0.000)
-0.0965 -0.7897 -0.9031 -1.5220* -1.1513 0.5652 (0.934) (0.284) (0.461) (0.053) (0.219) (0.769) 0.1544 (0.938) 0.8028 1.2382 (0.321) (0.494) 2.3147** 1.5365 (0.039) (0.339) -0.2242 (0.721) 0.2638*** 0.2637*** 0.2634*** 0.2641*** 0.2638*** 0.2635*** (0.000) (0.000) (0.000) (0.000) (0.000) (0.000)
Observations R-squared Endog. var. Instruments F-stat. FDI F-stat. market_int F-stat. inp_int Hansen p-val.
4,493 4,493 4,463 4,493 4,470 4,493 0.13 0.12 0.07 0.13 0.13 0.13 1 1 2 1 2 1 3 3 4 3 4 3 . 0.26 16.96 6.49 16.61 9.13 16.56 8.94 0.2633 0.4526 0.6866 0.1685 0.1711 0.1525
4,876 4,876 4,865 4,876 4,868 4,876 0.13 0.13 0.13 0.13 0.13 0.13 1 1 2 1 2 1 3 3 4 3 4 3 3.30 6.15 11.44 2.36 10.75 1.88 7.01 5.84 0.0355 0.1483 0.0599 0.2933 0.3562 0.0927
Note: p*<0.1, p**<0.05, p***<0.01 (p-values in parentheses). All regressions include sector, subnational region, and year fixed effects. Standard errors are clustered at the country-sector level.
Full foreign ownership: foreign participation = 100 percent. Partial foreign ownership: 10 percent >= foreign participation < 100 percent.
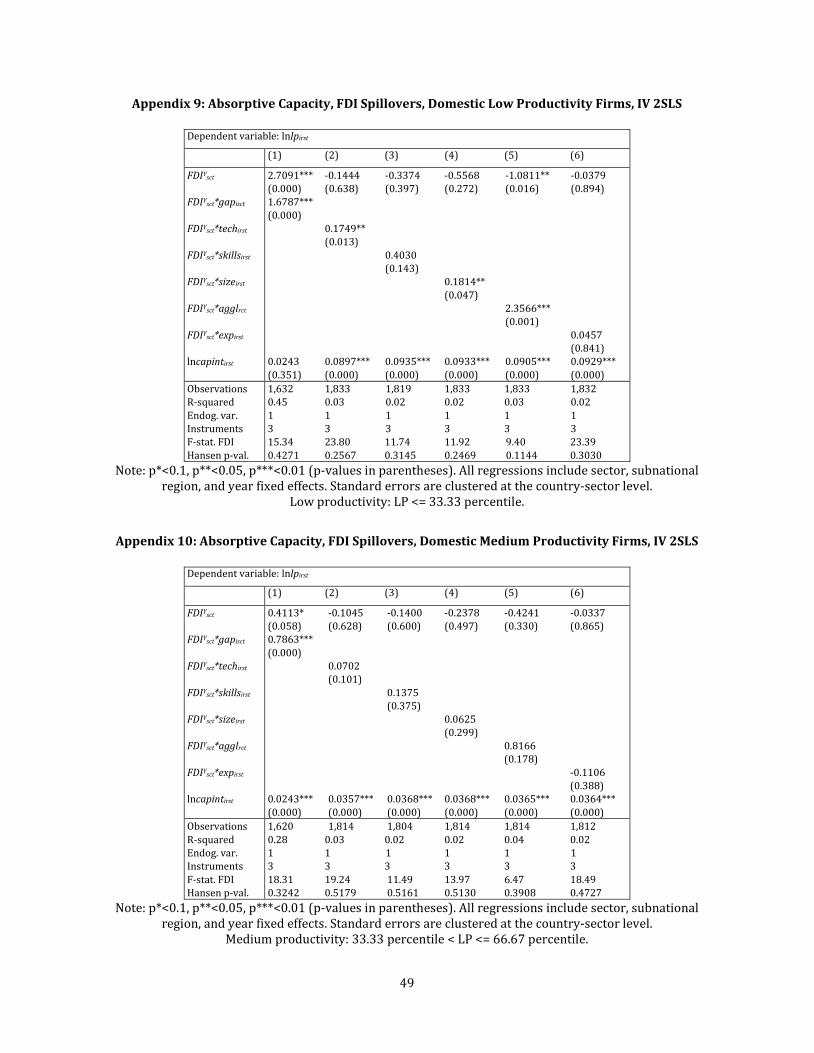
49
Appendix 9: Absorptive Capacity, FDI Spillovers, Domestic Low Productivity Firms, IV 2SLS
Dependent variable: lnlpirst
(1) (2) (3) (4) (5) (6)
FDIYsct
FDIYsct*gapisct FDIYsct*techirst
FDIYsct*skillsirst FDIYsct*sizeirst FDIYsct*agglrct FDIYsct*expirst lncapintirst
2.7091*** -0.1444 -0.3374 -0.5568 -1.0811** -0.0379 (0.000) (0.638) (0.397) (0.272) (0.016) (0.894) 1.6787*** (0.000) 0.1749** (0.013) 0.4030 (0.143) 0.1814** (0.047) 2.3566*** (0.001) 0.0457 (0.841) 0.0243 0.0897*** 0.0935*** 0.0933*** 0.0905*** 0.0929*** (0.351) (0.000) (0.000) (0.000) (0.000) (0.000)
Observations R-squared Endog. var. Instruments F-stat. FDI Hansen p-val.
1,632 1,833 1,819 1,833 1,833 1,832 0.45 0.03 0.02 0.02 0.03 0.02 1 1 1 1 1 1 3 3 3 3 3 3 15.34 23.80 11.74 11.92 9.40 23.39 0.4271 0.2567 0.3145 0.2469 0.1144 0.3030
Note: p*<0.1, p**<0.05, p***<0.01 (p-values in parentheses). All regressions include sector, subnational region, and year fixed effects. Standard errors are clustered at the country-sector level.
Low productivity: LP <= 33.33 percentile.
Appendix 10: Absorptive Capacity, FDI Spillovers, Domestic Medium Productivity Firms, IV 2SLS
Dependent variable: lnlpirst
(1) (2) (3) (4) (5) (6)
FDIYsct
FDIYsct*gapisct FDIYsct*techirst
FDIYsct*skillsirst FDIYsct*sizeirst FDIYsct*agglrct FDIYsct*expirst lncapintirst
0.4113* -0.1045 -0.1400 -0.2378 -0.4241 -0.0337 (0.058) (0.628) (0.600) (0.497) (0.330) (0.865) 0.7863*** (0.000) 0.0702 (0.101) 0.1375 (0.375) 0.0625 (0.299) 0.8166 (0.178) -0.1106 (0.388) 0.0243*** 0.0357*** 0.0368*** 0.0368*** 0.0365*** 0.0364*** (0.000) (0.000) (0.000) (0.000) (0.000) (0.000)
Observations R-squared Endog. var. Instruments F-stat. FDI Hansen p-val.
1,620 1,814 1,804 1,814 1,814 1,812 0.28 0.03 0.02 0.02 0.04 0.02 1 1 1 1 1 1 3 3 3 3 3 3 18.31 19.24 11.49 13.97 6.47 18.49 0.3242 0.5179 0.5161 0.5130 0.3908 0.4727
Note: p*<0.1, p**<0.05, p***<0.01 (p-values in parentheses). All regressions include sector, subnational region, and year fixed effects. Standard errors are clustered at the country-sector level.
Medium productivity: 33.33 percentile < LP <= 66.67 percentile.

50
Appendix 11: Absorptive Capacity, FDI Spillovers, Domestic High Productivity Firms, IV 2SLS Dependent variable: lnlpirst
(1) (2) (3) (4) (5) (6)
FDIYsct
FDIYsct*gapisct FDIYsct*techirst
FDIYsct*skillsirst FDIYsct*sizeirst FDIYsct*agglrct FDIYsct*expirst lncapintirst
-1.1134*** -0.2980 -0.2113 -0.1641 -0.3685 -0.2222 (0.001) (0.237) (0.468) (0.662) (0.535) (0.298) 1.5133*** (0.000) 0.0869 (0.148) 0.0655 (0.732) -0.0109 (0.865) 0.3288 (0.702) 0.1904 (0.286) 0.0729*** 0.1026*** 0.0982*** 0.1045*** 0.1044*** 0.1039*** (0.000) (0.000) (0.000) (0.000) (0.000) (0.000)
Observations R-squared Endog. var. Instruments F-stat. FDI Hansen p-val.
1,500 1,649 1,623 1,649 1,649 1,649 0.45 0.06 0.05 0.05 0.06 0.06 1 1 1 1 1 1 3 3 3 3 3 3 18.63 19.06 12.94 15.05 5.95 17.75 0.5736 0.9349 0.9187 0.9570 0.9612 0.9453
Note: p*<0.1, p**<0.05, p***<0.01 (p-values in parentheses). All regressions include sector, subnational region, and year fixed effects. Standard errors are clustered at the country-sector level.
High productivity: LP > 66.67 percentile.

51
Appendix 12: Absorptive Capacity, FDI Spillovers by Type of Foreign Ownership, All Domestic Firms, IV 2SLS Dependent variable: lnlpirst
FDI spillovers from firms with full foreign ownership FDI spillovers from firms with partial foreign ownership
(1) (2) (3) (4) (5) (6) (7) (8) (9) (10) (11) (12)
FDIYsct
FDIYsct*gapisct FDIYsct*techirst
FDIYsct*skillsirst FDIYsct*sizeirst FDIYsct*agglrct FDIYsct*expirst lncapintirst
0.5679** -0.3110 0.2305 -0.6730 0.1505 0.0169 (0.022) (0.238) (0.477) (0.140) (0.785) (0.932) 2.1221*** (0.000) 0.4432*** (0.000) -0.1315 (0.626) 0.2635** (0.011) -0.0537 (0.950) 0.9621*** (0.001) 0.1735*** 0.2568*** 0.2605*** 0.2615*** 0.2641*** 0.2631*** (0.000) (0.000) (0.000) (0.000) (0.000) (0.000)
3.2370*** -1.1048*** -0.7602 -2.4945*** -0.9759** -0.4183* (0.000) (0.000) (0.122) (0.000) (0.015) (0.083) 2.8656*** (0.000) 0.8403*** (0.000) 0.6816 (0.131) 0.7147*** (0.000) 1.8956*** (0.008) 1.8191*** (0.000) 0.1677*** 0.2521*** 0.2610*** 0.2590*** 0.2635*** 0.2636*** (0.000) (0.000) (0.000) (0.000) (0.000) (0.000)
Observations R-squared Endog. var. Instruments F-stat. FDI Hansen p-val.
4,763 5,307 5,256 5,307 5,307 5,304 0.46 0.15 0.13 0.15 0.13 0.14 1 1 1 1 1 1 3 3 3 3 3 3 33.37 23.91 13.17 15.28 6.08 27.12 0.8953 0.4200 0.2998 0.3618 0.3364 0.4162
4,763 5,307 5,256 5,307 5,307 5,304 0.37 0.15 0.13 0.15 0.14 0.14 1 1 1 1 1 1 3 3 3 3 3 3 5.94 10.65 5.29 6.72 6.44 13.11 0.3706 0.6914 0.3186 0.5514 0.1804 0.4056
Note: p*<0.1, p**<0.05, p***<0.01 (p-values in parentheses). All regressions include sector, subnational region, and year fixed effects. Standard errors are clustered at the country-sector level.
Full foreign ownership: foreign participation = 100 percent. Partial foreign ownership: 10 percent >= foreign participation < 100 percent.

52
Appendix 13: National Characteristics, FDI Spillovers, Domestic Low Productivity Firms, IV 2SLS
Dependent variable: lnlpirst
(1) (2) (3) (4) (5) (6) (7) (8) (9) (10) (11)
FDIYsct
FDIYsct*laborct
FDIYsct*financect FDIYsct*educ1ct
FDIYsct*educ2ct FDIYsct*rdct FDIYsct*investmct FDIYsct*trade1ct FDIYsct*trade2ct FDIYsct*businessct FDIYsct*hhisct FDIYsct*incomect
lncapintirst
1.3192 -0.4678 -4.3143* 0.0624 0.7216 (0.850) (0.956) (0.097) (0.906) (0.657) -0.2702 (0.874) 0.1801 (0.931) 24.7543* (0.078) 0.1000 (0.953) -141.2323 (0.549) 0.0921*** 0.0928*** 0.0622*** 0.0920*** 0.0874*** (0.000) (0.000) (0.005) (0.000) (0.000)
-3.7942 -2.2549* -13.9303 -13.3786 -0.4258 -1.9672 (0.463) (0.062) (0.142) (0.565) (0.266) (0.250) 0.9992 (0.429) 7.2220** (0.026) 3.2760 (0.133) 3.2913 (0.560) 1.5837** (0.038) 0.2871 (0.196) 0.0934*** 0.0962*** 0.0922*** 0.0956*** 0.0919*** 0.0938*** (0.000) (0.000) (0.000) (0.000) (0.000) (0.000)
Observations R-squared Endog. var. Instruments F-stat. FDI Hansen p-val.
1,833 1,833 1,485 1,757 1,152 0.03 0.03 0.02 0.03 0.03 1 1 1 1 1 3 3 3 3 3 3.92 1.33 3.25 12.07 0.39 0.0904 0.0567 0.1934 0.2176 0.3544
1,833 1,822 1,833 1,833 1,833 1,833 0.02 0.02 0.02 -0.02 0.02 0.01 1 1 1 1 1 1 3 3 3 3 3 3 6.03 3.25 12.19 1.13 13.61 8.65 0.0988 0.2051 0.2085 0.2057 0.4278 0.3528
Note: p*<0.1, p**<0.05, p***<0.01 (p-values in parentheses). All regressions include sector, subnational region, and year fixed effects. Standard errors are clustered at the country-sector level. Low productivity: LP <= 33.33 percentile.

53
Appendix 14: National Characteristics, FDI Spillovers, Domestic Medium Productivity Firms, IV 2SLS
Dependent variable: lnlpirst
(1) (2) (3) (4) (5) (6) (7) (8) (9) (10) (11)
FDIYsct
FDIYsct*laborct
FDIYsct*financect FDIYsct*educ1ct
FDIYsct*educ2ct FDIYsct*rdct FDIYsct*investmct FDIYsct*trade1ct FDIYsct*trade2ct FDIYsct*businessct FDIYsct*hhisct FDIYsct*incomect
lncapintirst
4.6217 3.1890 -2.0509 0.1474 0.7821 (0.481) (0.712) (0.138) (0.699) (0.583) -1.1407 (0.479) -0.7939 (0.713) 11.9357 (0.110) -1.1456 (0.381) -126.9857 (0.541) 0.0344*** 0.0362*** 0.0305*** 0.0373*** 0.0338*** (0.000) (0.000) (0.000) (0.000) (0.000)
0.3670 -0.9205 -2.4525 2.8917 -0.1564 -0.2367 (0.931) (0.270) (0.723) (0.808) (0.593) (0.836) -0.0908 (0.930) 2.9364 (0.196) 0.5712 (0.720) -0.7000 (0.808) 0.5752 (0.417) 0.0298 (0.841) 0.0364*** 0.0358*** 0.0363*** 0.0362*** 0.0368*** 0.0364*** (0.000) (0.000) (0.000) (0.000) (0.000) (0.000)
Observations R-squared Endog. var. Instruments F-stat. FDI Hansen p-val.
1,814 1,814 1,475 1,741 1,135 0.06 0.01 0.09 0.04 -0.04 1 1 1 1 1 3 3 3 3 3 3.40 1.34 3.32 10.22 0.32 0.4630 0.3752 0.5422 0.4605 0.2824
1,814 1,800 1,814 1,814 1,814 1,814 0.03 0.05 0.02 0.04 0.02 0.02 1 1 1 1 1 1 3 3 3 3 3 3 5.78 2.81 11.90 1.77 14.24 7.30 0.4389 0.4437 0.4845 0.4302 0.4845 0.4960
Note: p*<0.1, p**<0.05, p***<0.01 (p-values in parentheses). All regressions include sector, subnational region, and year fixed effects. Standard errors are clustered at the country-sector level. Medium productivity: 33.33 percentile < LP <= 66.67 percentile.

54
Appendix 15: National Characteristics, FDI Spillovers, Domestic High Productivity Firms, IV 2SLS
Dependent variable: lnlpirst
(1) (2) (3) (4) (5) (6) (7) (8) (9) (10) (11)
FDIYsct
FDIYsct*laborct
FDIYsct*financect FDIYsct*educ1ct
FDIYsct*educ2ct FDIYsct*rdct FDIYsct*investmct FDIYsct*trade1ct FDIYsct*trade2ct FDIYsct*businessct FDIYsct*hhisct FDIYsct*incomect
lncapintirst
1.4855 0.8961 -1.3108 -0.0027 0.2877 (0.833) (0.922) (0.408) (0.995) (0.847) -0.4435 (0.797) -0.2961 (0.896) 6.0911 (0.466) -1.6284 (0.314) -135.8625 (0.548) 0.1041*** 0.1040*** 0.1083*** 0.1050*** 0.0920*** (0.000) (0.000) (0.000) (0.000) (0.000)
1.7890 -0.3449 5.1011 -0.0480 -0.1529 0.8588 (0.709) (0.765) (0.551) (0.998) (0.643) (0.551) -0.5215 (0.662) 0.4347 (0.890) -1.2510 (0.527) -0.0656 (0.987) -0.2433 (0.793) -0.1582 (0.402) 0.1043*** 0.1048*** 0.1042*** 0.1044*** 0.1042*** 0.1045*** (0.000) (0.000) (0.000) (0.000) (0.000) (0.000)
Observations R-squared Endog. var. Instruments F-stat. FDI Hansen p-val.
1,649 1,649 1,359 1,589 1,036 0.06 0.05 0.07 0.06 0.05 1 1 1 1 1 3 3 3 3 3 4.62 1.47 2.21 11.37 0.44 0.7204 0.8060 0.9950 0.8839 0.8712
1,649 1,638 1,649 1,649 1,649 1,649 0.05 0.06 0.05 0.06 0.05 0.06 1 1 1 1 1 1 3 3 3 3 3 3 6.71 3.06 12.34 1.48 12.49 7.58 0.8508 0.9585 0.9252 0.6768 0.9535 0.9403
Note: p*<0.1, p**<0.05, p***<0.01 (p-values in parentheses). All regressions include sector, subnational region, and year fixed effects. Standard errors are clustered at the country-sector level. High productivity: LP > 66.67 percentile.
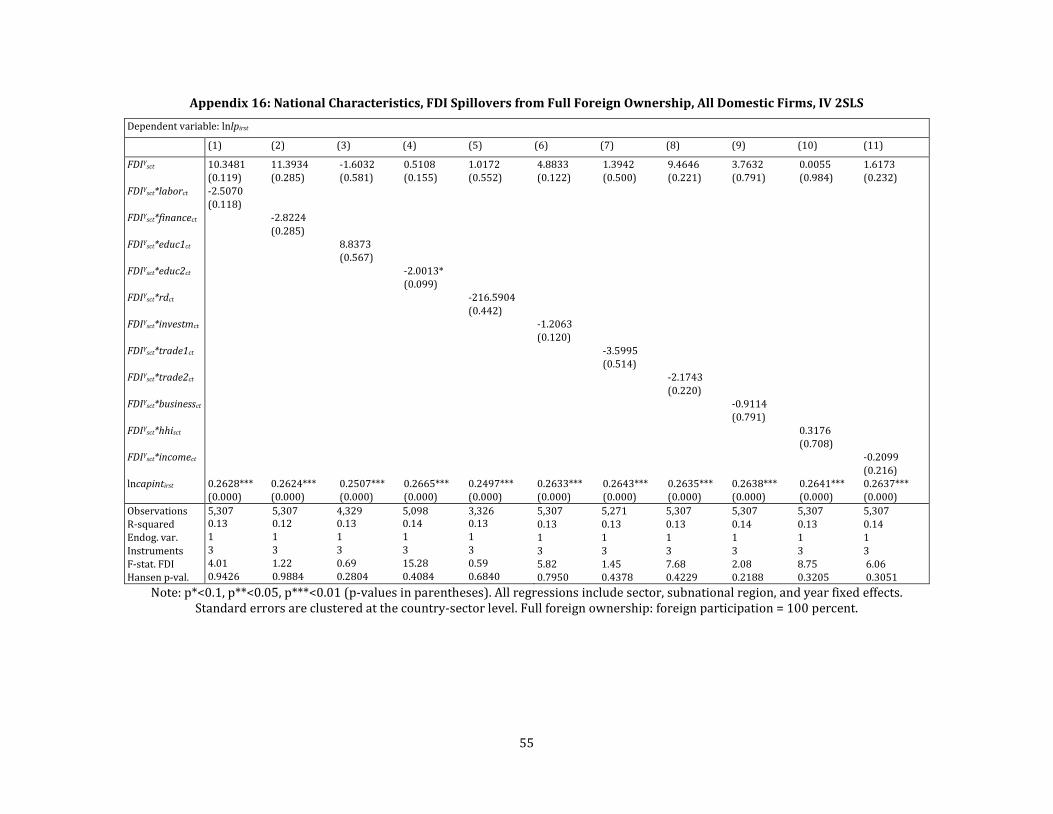
55
Appendix 16: National Characteristics, FDI Spillovers from Full Foreign Ownership, All Domestic Firms, IV 2SLS
Dependent variable: lnlpirst
(1) (2) (3) (4) (5) (6) (7) (8) (9) (10) (11)
FDIYsct
FDIYsct*laborct
FDIYsct*financect FDIYsct*educ1ct
FDIYsct*educ2ct FDIYsct*rdct FDIYsct*investmct FDIYsct*trade1ct FDIYsct*trade2ct FDIYsct*businessct FDIYsct*hhisct FDIYsct*incomect
lncapintirst
10.3481 11.3934 -1.6032 0.5108 1.0172 (0.119) (0.285) (0.581) (0.155) (0.552) -2.5070 (0.118) -2.8224 (0.285) 8.8373 (0.567) -2.0013* (0.099) -216.5904 (0.442) 0.2628*** 0.2624*** 0.2507*** 0.2665*** 0.2497*** (0.000) (0.000) (0.000) (0.000) (0.000)
4.8833 1.3942 9.4646 3.7632 0.0055 1.6173 (0.122) (0.500) (0.221) (0.791) (0.984) (0.232) -1.2063 (0.120) -3.5995 (0.514) -2.1743 (0.220) -0.9114 (0.791) 0.3176 (0.708) -0.2099 (0.216) 0.2633*** 0.2643*** 0.2635*** 0.2638*** 0.2641*** 0.2637*** (0.000) (0.000) (0.000) (0.000) (0.000) (0.000)
Observations R-squared Endog. var. Instruments F-stat. FDI Hansen p-val.
5,307 5,307 4,329 5,098 3,326 0.13 0.12 0.13 0.14 0.13 1 1 1 1 1 3 3 3 3 3 4.01 1.22 0.69 15.28 0.59 0.9426 0.9884 0.2804 0.4084 0.6840
5,307 5,271 5,307 5,307 5,307 5,307 0.13 0.13 0.13 0.14 0.13 0.14 1 1 1 1 1 1 3 3 3 3 3 3 5.82 1.45 7.68 2.08 8.75 6.06 0.7950 0.4378 0.4229 0.2188 0.3205 0.3051
Note: p*<0.1, p**<0.05, p***<0.01 (p-values in parentheses). All regressions include sector, subnational region, and year fixed effects. Standard errors are clustered at the country-sector level. Full foreign ownership: foreign participation = 100 percent.

56
Appendix 17: National Characteristics, FDI Spillovers from Partial Foreign Ownership, All Domestic Firms, IV 2SLS
Dependent variable: lnlpirst
(1) (2) (3) (4) (5) (6) (7) (8) (9) (10) (11)
FDIYsct
FDIYsct*laborct
FDIYsct*financect FDIYsct*educ1ct
FDIYsct*educ2ct FDIYsct*rdct FDIYsct*investmct FDIYsct*trade1ct FDIYsct*trade2ct FDIYsct*businessct FDIYsct*hhisct FDIYsct*incomect
lncapintirst
-18.9813 -30.3412* -5.8866** -0.7804 -2.8057 (0.122) (0.066) (0.042) (0.234) (0.628) 4.7343 (0.117) 7.7047* (0.065) 35.4614** (0.041) 2.6142 (0.257) 367.1298 (0.655) 0.2663*** 0.2647*** 0.2484*** 0.2678*** 0.2516*** (0.000) (0.000) (0.000) (0.000) (0.000)
-13.6193** -3.1069*** -17.8079* 19.4574 -0.4316 -4.1389** (0.030) (0.007) (0.069) (0.383) (0.254) (0.042) 3.3987** (0.029) 10.3784*** (0.004) 4.1490* (0.070) -4.7106 (0.381) 0.8914 (0.276) 0.5708** (0.036) 0.2633*** 0.2649*** 0.2627*** 0.2625*** 0.2642*** 0.2639*** (0.000) (0.000) (0.000) (0.000) (0.000) (0.000)
Observations R-squared Endog. var. Instruments F-stat. FDI Hansen p-val.
5,307 5,307 4,329 5,098 3,326 0.12 0.12 0.12 0.13 0.11 1 1 1 1 1 3 3 3 3 3 1.73 1.06 3.40 4.55 0.17 0.4391 0.7750 0.4592 0.3266 0.6192
5,307 5,271 5,307 5,307 5,307 5,307 0.13 0.13 0.13 0.14 0.13 0.13 1 1 1 1 1 1 3 3 3 3 3 3 5.25 2.03 5.78 0.77 5.88 7.22 0.6694 0.4852 0.4546 0.1213 0.2003 0.5893
Note: p*<0.1, p**<0.05, p***<0.01 (p-values in parentheses). All regressions include sector, subnational region, and year fixed effects. . Standard errors are clustered at the country-sector level. Partial foreign ownership: 10 percent >= foreign participation < 100 percent.