foreign competition the uk pharmaceutical · foreign competition and the uk pharmaceutical ... 14...
TRANSCRIPT

FOREIGN COMPETITION AND THEUK PHARMACEUTICAL INDUSTRY
Arthur W. Lake
Working Paper No. 155
NATIONAL BUREAU OF ECONOMIC RESEARCH, Inc.261 Madison Avenue
New York, N.Y. 10016
November 1976
Preliminary; Not for Quotation
The research reported on in this paper was financed by a grantfrom the National Science Foundation to the National Bureau of EconomicResearch for a study of The Impact of Multinational Firms on Technologyand Trade Flows. Any opinions, findings, conclusions, or recommenda-tions expressed herein are those of the author and do not necessarilyreflect the views of the National Science Foundation.
NBER working papers are distributed informally and in limitednumber for comments only. They should not be quoted without writtenpermission.
This report has not undergone the review accorded official NBERpublications; in particular, it has not yet been submitted for approvalby the Board of Directors.

CONTENTS
Page
1. Introduction ia) Basic Issues and Approach 1b) The Data 3
2. Characteristics of Imitation Cycles in Pharmaceuticals 8a) Competition and Research Plateaus 8b) The Antihistamines 11c) Types of Imitation Cycles 13d) Technology Transfer and Transnational Market Entry 22
3. A Model of the Imitation Cycle 22a) Methodology 22b) Estimation and Results 26
4. Market Entry Activity in Pharmaceuticals 43a) Transnational Operations of American Companies 43b) The Competitive Response of British Companies 60
5. Positions of Companies Within Imitation Cycles 67a) Characteristics of Leading Firms 67b) American and Host—Country Comparisons 71c) Positions of Other Foreign Companies 72
6. Summary and Conclusions 73
Bibliography 76
Appendix Tables 79
Appendix Graphs 88

FOREIGN COMPETITION AND THE UK PHARMACEUTICAL INDUSTRY
1. Introduction
a) Basic Issues and Approach. The British pharmaceutical industry has had
an enviable record of innovation throughout the post—war period.' Nevertheless,
review of British innovative activity is contained in NEDO [1973, U.
a substantial number of new ethical drugs issued in the United Kingdom have
arisen from research of foreign companies who by their operations have in-
fluenced British firms.2 The stimulating effects of transnational market—entry
[1973, 1], p. 30.
activity on British companies in the industry have contributed substantially
to its structural change and growth. It is thus of interest to economists to
inquire how much competitive pressure is put on host—country firms, how they
respond, and with what speed they can enter newly emerging markets. This
paper, which seeks to identify factors contributing to the rate and character
of technical transfer and to assess host—country research and development
effort in response to foreign competition, is one of three examining the im-
pact of technically—advanced companies, particularly American, on British
industries.3 Beginning first with an analysis of imitation cycles in
31n this connection, the reader may find it useful to read he first
study of the series, which covers the British semiconductor industry, Lake
[1976). The paper by Cohen, Katz and Beck [1975] is also very relevant in
this regard.
—2—
pharmaceuticals and making use of a model of these, the study proceeds to
examine the transnationa]. operations of American and other foreign companies,
showing the connection between company size, sales and new product introduc—
tions.
The competition among firms selling ethical products, which form the most
technically advanced part of the pharmaceuticals market, is based primarily
on new product introductions consisting of new chemical entities and permuta-
tions of the specific qualities or combinations of drug components. Research
activity in the post—war period appears to have concentrated primarily in the
creation of new and substitute products with less attention devoted to the
improvement of the economies of manufacture as through automation in order to
reduce costs.4 Manufacturing economies frequently have been achieved not so
4McDonald [1973], pp. 23—27. Only a few of the very major products are
manufactured in bulk form, such as the antibiotics, penicillin, the tetra—
cyclines, neomycin, and the cortisones. Thus among ethical products only a
small percentage provide scope for substantial economies of scale. In the
case of over—the—counter proprietary products the proportion of the total
number is much larger.-
much by mechanization or scaling—up production throughputs, but by the creation
of new material sources for chemical entities or the replacement of natural
sources with synthetics.5 These technical advances in their final useful forms
5Many of the discoveries in pharmaceuticals of the post—war period are
associated with the development of synthetic substitutes for natural products.

—3—
The synthetics permit greater control over quality and more easily lend them-
selves to the scaling up of production runs.
constitute new products. Our approach is to treat them individually, placing
them within the time scale and competitive situation of the imitation cycle.
b) The Data. Considerable time has been spent in the collection and
classification of data and information for the studies undertaken. The work
was divided into four groups: 1) individual pharmaceutical products, over one
thousand in all, 2) companies introducing pharmaceutical products into the UK,
numbering in excess of one hundred and fifty over the twenty—three year period,
3) company patent rights over the sale of individual pharmaceutical products,
including products patented before 1950, in order to ascertain how "new" the
medicinal substances were, and 4) classifications of medicinal substances into
therapeutic groups, into chemical—action groups, and into families of chemical
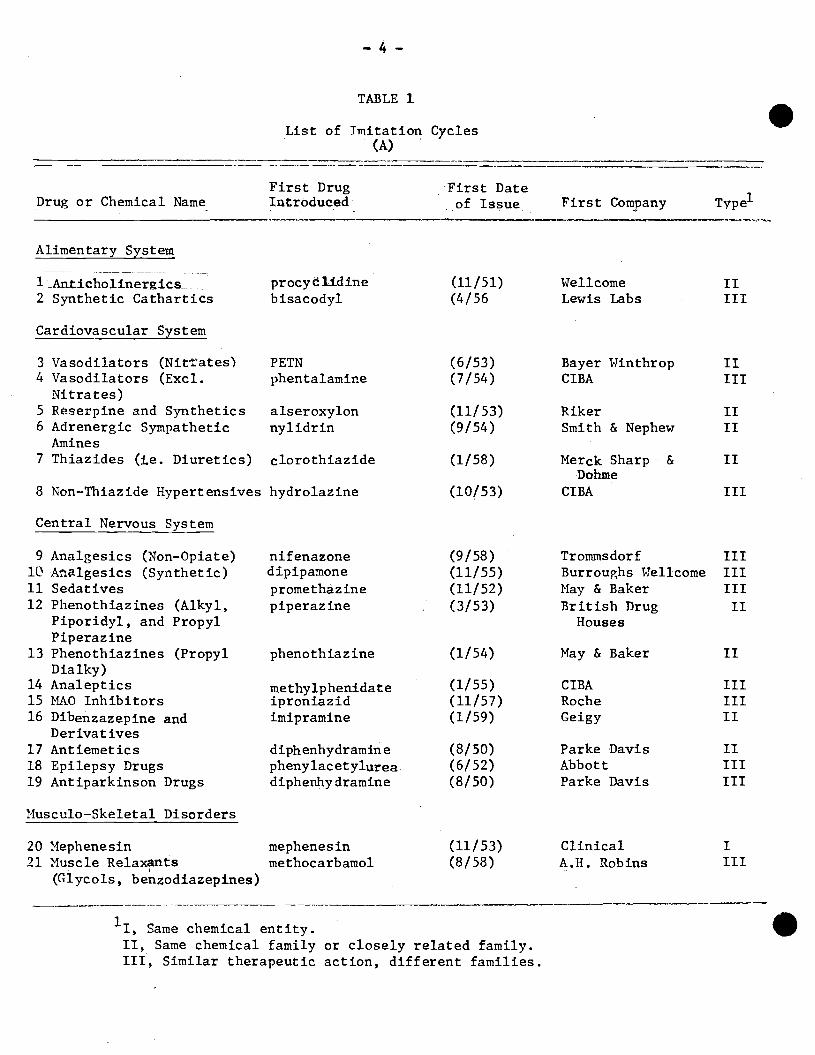
substances. The data are employed to establish imitation cycles as outlined
in Tables 1 and 2 and as described in the following section 2c. Table 4 gives
the original therapeutic classes, used. Information on products introduced
into the UK covered the period from January 1950 to December 1972. The study
made use of standard references such as the Martindale Extra Pharmacopea, the
Monthly Index of Medical Specialties (MIMS), the NEDO (Centre for the Study of
Industrial Innovations, CSII) list of 466 new chemical substances 1958—70,
journals such as the Pharmaceutical Journal, the Chemist and Druggist, and
standard texts.6 We also employed information for American products given in the
6See Wilson, Grisvold, and Doerge [1971].
—4—
TABLE 1
List of Imitation Cycles(A)
First DrugDrug or Chemical Name Introduced
First Dateof Issue First Company Type1
Alimentary Systen
lAntitholfnergjcs procyelidine (11/51) Wellcome ii2 Synthetic Cathartics bisacodyl (4/56 Lewis Labs III
Cardiovascular System
3 Vasodilators (Nitates' PETN (6/53) Bayer Winthrop II4 Vasodilators (Exci. phentalamine (7/54) CIBA III
Nitrates)5 Reserpine and Synthetics alseroxylon (11/53) Riker II
6 Adrenergic Sympathetic nylidrin (9/54) Smith & Nephew IIAmines
7 Thiazides (I.e. Diuretics) clorothiazide (1/58) Merck Sharp & IIDohme
8 Non—Thiazide Hypertensives hydrolazine (10(53) CIBA III
Central Nervous System
9 Analgesics (Non—Opiate) nifenazone (9/58) Trommsdorf III
11) Aftalgesics (Synthetic) dipipamone (11/55) Burroughs Weilcome III11 Sedatives promethãzine (11/52) May & Baker III12 Phenothiazines (Alkyl, piperazine (3/53) British Drug II
Piporidyl, and Propyl HousesPiperaz me
13 Phenothiazines (Propyl phenothlazine (1/54) May & Baker II
Dia iky)
14 Analeptics methyiphenldate (1/55) CIBA III15 MAO Inhibitors iproniazid (11/57) Roche III
16 Dibenzazepmne and imipramine (1/59) Geigy IIDerivatives
17 Antiemetics diphenhydramine (8/50) Parke Davis II
18 Epilepsy Drugs phenylacetylurea (6/52) Abbott III
19 Antiparkinson Drugs diphenhydramine (8/50) Parke Davis III
Musculo—Skeletal Disorders
20 Mephenesin mephenesin (11/53) Clinical I21 Muscle Relaxants methocarbamol (8/58) A.H. Robins III
(Glycois, berizodiazepines)
Same chemical entity.
II, Same chemical family or closely related family.III, Similar therapeutic action, different families.

—5
TABLE 2
List of In,ttion Cycles(B)
First DrugDrug or Chemical Name Issued
First Date1of Issue First Comanv Type
Hormones
22 Modified Progestins norethynodrel (ll/5) Searle II23 Oral Contraceptives same (2/62) Searle II24 Androgens and nor—androstenolone (9/57) Organon II
Modifications phenyl propionate25 Hydrocortisone same (11/55) Merck Sharp & I
Dohme26 Prednisolone same (6/55) Upjohn I27 ModIfied ACTH fluorohydrocortisone CR156) Squibb II
acetate28 Sulfonylureas carbutamide (10/56) Boots II
Genito—Urinary System
29 Non—Thiazide Diuretics spironolactone (4/60) Searle III
Infections and Infestations
30 Pherxymethyl Penicillin same (2/56) Lilly I
(V)31 Semi—synthetic Penicillins Zanthocillin (2/59) Distillers II32 Neomycin Sulfate same (7/53) Squibb
(Dermat.)
33 Streptomycin Family kanamycin (11/59) Bayer Winthrop II34 Polypeptide Antibiotics polymixin B (4/54) Wellcome II35 Other Antibiotic tyrothricin (1/53) Warner III36 Antituberculosis Drugs PAS (5/50) Wander III37 Anthelmintids diethylcarbamazine (6/53) British Drug III
-
HousesOther Groups
38 Non—Narcotic Antitussives carbetapentone citrate (10/55) Pfizer III39 New Local Anesthetics amethocaine (3/56) Allied II40 New Xanthine Derivatives acepiphylline (11/55) Rona II
1I, Same chemical entity.II, Same chemical family or closely related family.III, Similar therapeutic action, different families.

—6—
déHaen lists for the period January 1963 to December 1972. Data on patents
were obtained through the Merck Index. Data on individual companies were
derived from annual reports of individual companies, through telephone calls,
and publications such as Standard and Poor (America), and Dun and Bradstreet
(United Kingdom). Ownership of companies was derived from Who Owns Whom for
the UK and Europe. The most complete coverage of company data relates to the
year 1971.
The products of the ethical drugs group of the pharmaceutical industry may
be classified in a number of ways dependent on the forms in which individual
substances are marketed. In the deHaen index pharmaceutical products are
grouped according to chemical form: 1) single chemical entities: new drugs
marketed for the first time in America by any manufacturer; 2) duplicate
products: single entity drugs that have been previously sold by another
manufacturer in America; 3) combination products: containing more than one
active ingredient; and 4) new dosage forms. The deHaen type of index is in-
adequate for use as an index of innovation since such lists frequently contain
minor new drug improvements, or competitive introductions, weighted equally,
i.e., numerically, with the major new drug discoveries representing significant
therapeutic advance. A genuine index of innovation should include only new
drugs of major medical importance, hence "unculled" data, such as provided by
deHaen, needs to be whittled down according to strict exclusion rules. The
classifications employed in this study used forms of both "raw" and "culled"
data.
Table 3, which follows, outlines the main therapeutic groups that formed
the first classification of the data. Tables 7, 8, and 9 identify the princi-
pal American, British and European firms included in the data sample. Appendix
Table A6 lists other firms operating in the United Kingdom.

-.7
TABLE 3
List of Major Therapeutic Groups1
1. Alimentary System
2. Cardiovascular System
3. Central Nervous System
4. Musculo Skeletal Disorders
5. Hormones
6. Genito—uTinary System
7. Infections and Infestations
8. Nutrition
9. Respiratory System
10. Ear, Nose and Oropharynx
11. Eye
12. Allergic Disorders
13. Skin
14. Metabolism
15. Surgical
16. Diagnostic Agents
'For a more detailed breakdown see appendix Table Al

—8—
2. Characteristics of Imitation Cycles in Pharmaceuticals
a) Competition and Research Plateaus. The nature of rivalry in the pharina—
ceuticals industry, particularly in ethical drugs, is such that economists are
consistently in the dark or in disagreement about the extent of competition or
monopoly actually prevalent. The objectives and strategy of research and de-
velopment activity towards new products and product differentiation are
somewhat different from those underlying the price competition in nonresearch—
intensive industries. For example, the ethical drug company may enhance its
competitive position with the exchange of the use of a discovery for a cross—
licencing agreement if it is not directly interested in exploiting its dis-
covery.7 Because the activity of product introduction is so important, we have
7Writers such as Steele [1964] suggest that the extent of competition
amongst drug companies is much less than generally thought.
established a framework by which new product competition can be examined and
which easily relates to the analysis of transnational market entry. The result
of our work is the concept of the imitation cycle, which is based on the fre-
quently observed pattern of competition within ethical product groups.
The term imitation is used principally to denote the competitive activity
within a commercial or scientific area that appears to be directly in response
to, or related to, a major advance in knowledge. As the term imitation cycle
suggests, the competition between companies in the period following a major
discovery often takes the form of a burst of rival activity.
The speed with which firms can respond to the commercial possibilities
opened up by the discovery can determine their share of the eventual markets
created. Once the leaders have introduced a wide range of new products making

—9—
use of the new technology, subsequent firms may increasingly find that
technical limitations are obstacles to profitable market entry. Furthermore,
once the leaders have taken the easier markets, the pool of potential new
entrants may become smaller. These and other factors often lead to a slowing—
down of the pace of imitation and to a progressive diminishing of the numbers
of new entrant firms. The period over which the slackening of the pace of
market entry takes place can be referred to as the plateau period. Generally,
an imitation cycle, if measured in terms of new market entrants or with respect
to time, will, in its cumulative form, tend to level off, and to form a plateau.
This gives the imitation ttcycl&t a characteristic "S" shape as illustrated In
Figure 2. The independent research and development efforts which lead to market
entries may also, If aggregated, be seen to plateau.
The imitation cycle in pharmaceuticals constitutes a set of new products
which are substitutes in therapy or in usage. Although no actual measurements
of this substitution have been undertaken we have tried to establish what drugs
were most frequently prescribed within therapeutic areas. This was done with
the aid of the Nartindale Extra Pharmacopea, the Monthly Index of Medical
Specialties (NIMS), and other publications. In the course of this work, it was
found that very important chemical groups frequently overlapped each other in
their therapeutic applications, or that they developed into chemical or
therapeutic branches which could be examined on their own. The classifications
eventually arrived at Involved a judgment concerning the type of imitative or
innovative activity most probably undertaken by firms that entered the markets
defined by the groups. Three main types of imitation cycle emerged which are
described in a later part of this section.

— 10 —
Pharmaceutical companies go to great lengths to protect their monopoly
advantages. The very successful company may be able to limit the numbers of
rival entries significantly. Our analysis shows the importance of technical
advantages reflected in the number of firms eventually entering therapeutic,
chemical, or market groups. To understand the industry more fully the econo-
mist may seek to disentangle whether limits to the number of entrants are the
result of physical factors, monopoly advantages, strategies or collective
welfare decisions. This is not a simple task.8 Our examination of imitation
8Some of the problems are mentioned in the paper by Steele [1964].
cycles covers those regions of competitive activity where many of the monopoly
advantages, for the most part, have broken down.
Our work revealed considerable cross—licencing between companies, sometimes
rivals in similar markets. It may be prcposed, though by no means established,
that such activity amongst larger firms, especially the international ones, con-
stitute the bargaining and exchange of concessions between rival companies for
"safe" markets. Such arrangements could operate providing competitors hold key
patents to rivals' markets or areas of prospective expansion.
The licericing of British companies was found to be very significant. The
impact of the licencing of smaller British companies needs to be considered
within the market framework of their competitive activity. The concept of
the imitation cycle assisted us in analyzing licencing activity on this basis.
Various explanations of the plateau pattern, that is, the deceleration in the
rate of introduction of new chemical entities following an initial burstof activit

— 11 —
have been put forward in the literature.9 The particular case of the
9See Jennings (1971], pp. 247—256; and Cohen, Katz and Beck [1975],
pp. 19—26.
antihistamine—based family of drugs is worth special attention in this regard,
since it represents one of the most fruitful sources of new drugs of the post-
war period. It is also a key to understanding various competitive aspects of
the pharmaceuticals industry. The following part looks briefly at the anti-
histamine group and its bearing on developments in the industry.
b) The Antihistamines. One of the most prolific chemical groups of the
post—war period for new drugs has been the antihistamines. By the early 1960s
most of the new chemical entities derived from this group, in excess of five
hundred in number, had been tested. Those of therapeutic value, about fifty
in total, had been patented. The imitation cycle of antihistamine drugs con-
tains chemical entities of the same basic family. The antihistamines have a
number of actions on living organisms branching into a wide range of therapeutic
ones as shown in Figure 1. They exhibit the properties of local anesthetic,
adrenergic blocking, antispasmodic, sympathomimetic, analgesic, cholinergic
blocking, and quinidine (like))°
10See Wilson, Grisvold and Doerge [1971].
To examine the imitation cycle of this drug group it is necessary to treat
all its members as part of a flurry of research activity that in this case has
been international. Having done that, it is then possible to consider the

— 12 —
FIGURE 1
Research Into Antihistamines Giving Way to New thernica1
Entities in a Wide Number of Therapy Areas
Source: Biel and. 4artr 11971], p 87-
S
.
— 13 —
sub—groups of chemical entitles which go to make up the whole imitation cycle.
The sub—groups will often display a particular chemical, as well as therapeutic
property, and so a sub—imitation cycle neatly follows. The phenothiazine sub-
groups can be considered in this way. The competitive cycle in any one
therapeutic group may not be dominated by a given family of chemical entities,
and in such cases the term imitation Implies competitive activity in the search
for chemical entities with certain therapeutic properties, but of a different
chemical make—up. Such imitation cycles do not display the same consistency
in the pattern of new product timing as cycles within a chemical group, but
greater consistency if found if the size of end market is substantial than if
It is small. A large market attracts greater numbers of companies to search
for new drugs over a wider range of chemical groups, and to concentrate efforts
for a solution within a shorter space of time.
The imitation cycle of antihistamine drugs marketed in the States is re-
flected in the timing of patents issued for the drugs as represented in Figure 2.
It is apparent that while patent data on Its own may be of limited value, it can
be useful when supplemented, and culled, by data on the drugs actually marketed.
One of the interesting aspects of the cycle represented In Figure 2 is that the
plateau in the discovery of new antihistamines was reached well before the 19 62—
FDA rule changes. In fact the plateau effects were really being felt as early
as 1953. Data art the introduction of new antihistamine products for the post—62
period would, nevertheless, catch the plateau period of antihistamine derivatives,
perhaps, as part of the "legislative" effects (i.e., in terms of new drugs intro-
duced).
c) Types of Imitation Cycles. An imitation of a new chemical entity means
that the same new substance may be introduced into the host—country by more than
one company. Such imitations, identical imitations, are to be distinguished


— 15 —
from imitative substances, that are part of the same chemical family, but
whose chemical makeup is slightly different. Imitations can be derivatives
of an original substance, which when modified through chemical change, lead
to a new substance. They can be analogs of an original discovery, and this
means that, though chemically different, the original substance and its analogs
have similar structure, or parallel structure. Analogs often show similar
chemical activity so that a rival firm, that finds an analog to another company's
drug, may have the key to a better or equal substitute for its product.
The flurry of competitive activity to find substitutes within a chemical
group or across groups tends to display cycle characteristics, i.e., the move-
ment towards a plateau following a rapid period of discoveries. The plateau can
frequently be explained as a saturation effect. If a chemical family yields
relatively few new drugs, but these are sufficient therapeutically, progress
within the therapeutic group may be dominated by the one chemical family, with
its best derivatives accounting for the greatest share of the market. A larger
market and a less satisfactory therapeutic solution can result in a search for
new substitutes in other chemical groups. Then again, a chance discovery in
another group may lead to competition In the search for and testing of new
derivatives.
Three types of imitation cycle are included in our analyses. The first
involves the single chemical entity that is widely imitated. This imitation
might be facilitated because there is no patent protection to any particular
company, or the discovery is freely licenced by a company that has the patent.
Generally when such a cycle is large the scope of the market for which the
chemical entity is used is also large. For an example of this type of imitation
activity consider Figure 3, which illustrates the imitation cycle for prednisolone,

FIG
UIE
3
Pre
dnis
o].o
ne
(Hormones)
100
X
Logn
orm
al estimate
I
XI
60
Equation:
50
First Issued
in MS =
1.56
9 ÷
0.8898 z
(p2= 0.97)
40
in'tlieUIC
0
30
.:
i. 20
10 54 5556 5758 5960.616216364656667 68,6970
71
72.73
.
0
0 'C

— 17 —
a modified hormone derivative of ACTH and hydrocortisone.
brief coverage of the corticorteroid hormone discoveries is given
in Henry Steele [1964], PP. 202—212. For a more detailed examination see
Applesweig [1962], pp. 9—52.
The second type of imitation cycle studied is that of closely related
derivatives of a newly emerging chemical group. A good example of such a
cycle, illustrated in Figure 4, is that of the thiazides, developed for both
hypertensive and diuretic treatment. All the thiazides belong to the same
chemical family, and many of the analogs of the thiazide molecule represent
little structural change, but the dihydrochlorothiazide derivative has a
stronger potency (10 times more than chlorothiazide) and less toxicity. The
benzothiadjazjne derivatives, as otherwise known, are a substitute for meralluride,
a parenteral drug developed in the early 1940s. The thiazide drugs owe their
discovery to research carried out on sulfonamides of which they are a subgroup.
Like the antihistamine group the sulfonamide group has been a prolific source
of new chemical entities, but in both the pre— and post—war periods.
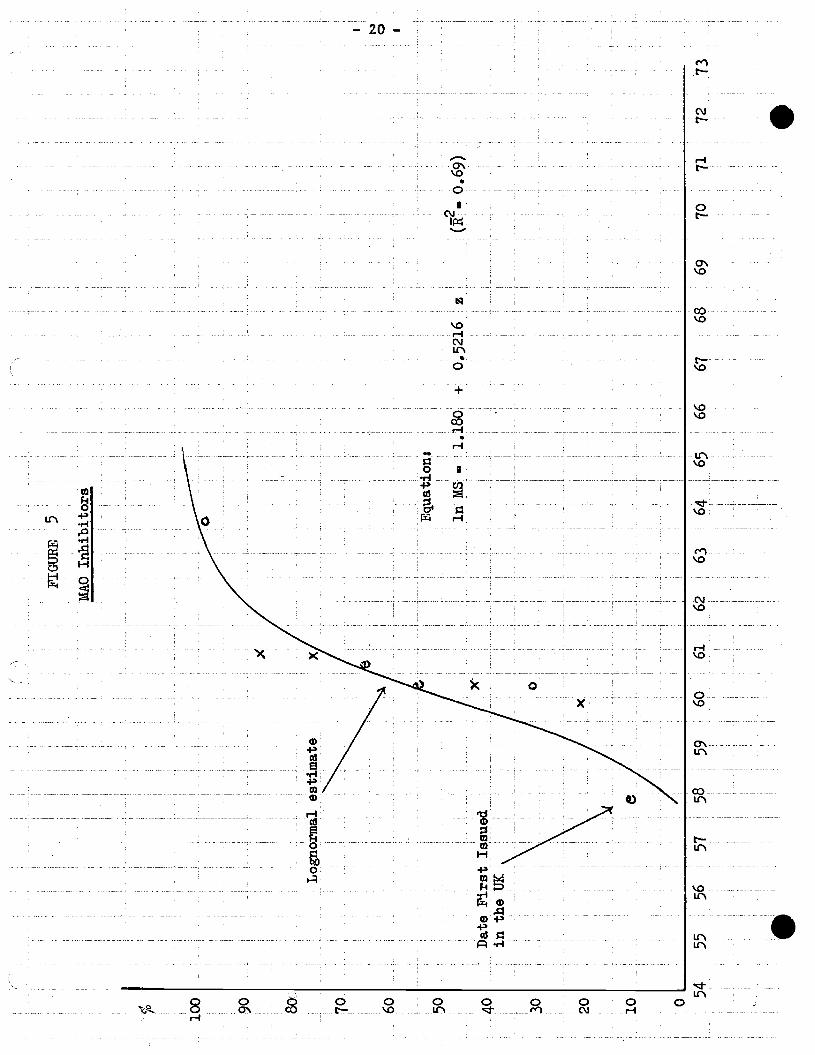
The third type of imitatinn cycle includes new chemical entities of more
than one chemical group, but having similar therapeutic value. The MAO in-
hibitors are just such a collection of drugs. The original impetus to discovery
of this group came from the drug iproniazid, studied for its anti—tuberculosis
activity. A related drug isoniazid was found to be more suitable for tuber-
culosis treatment, since iproniazid tended to have the side effect of exciting
patients treated. This stimulant quality of iproniazid was researched at greater
depth, and the drug was found to be very useful in psychotherapy applications.
The drug is a member of the hydrazine group, and other hydrazines were explored

100 90k'
FIG
UR
E
4
The
Thi
azid
es
(1yp
erte
nsiv
es, D
iure
tics)
Lognormai estimate
70
50
30
20
Equ
atio
n:
Firs
t Is
sued
in the UK
in M
S 1.
360
+
O.6
i87
z
(2 0
.96)
0
62
56
57
58
59
60
61
63
64
65
66
. 68
67
69
70
71
72
.

— 19 —
for the same use. The chemical process by which these hydrazines have their
stimulant effect was termed MAO inhibition. In a very short time drugs out-
side the hydrazines were found that could act in the same way, and in the
early 1960s several non—hydrazines were tested. The imitation cycle of the
MAO inhibitors introduced into the UK is shown in Figure 5.
All three of the above types of imitation cycle are amenable to experi-
ments using the smooth time profile created with the lognormal model which
is developed in the next section. The patent protection offered to new chem-
ical entities can, however, lead to a slightly different pattern of imitative
activity. This can occur because of a chemical structure that is not easily
imitated, or to which there are few analogs or readily obtainable derivatives.
Occasionally, all the derivatives that are found are much less effective than
the innovator's patented chemical entity (les). Once the patent of the drug
expires, i.e., after sixteen years in the UK, and if the market for the drug
is very large, then a period of intensecompetitive activity normally results.
During this period host—country firms, where the innovator is a foreign company,
can share in the drug's market through close imitation.Nothwithstanding this
fact, the innovating company may have a reserve strategy, or contingency plan,
already in motion. One such strategy involves delaying of the patenting of
the original drug's successor, which can be both a costly and risky process.
The firm has first to find a superseding drug, and then to delay the patent
so as to derive a continuous form of protection forits proprietary expertise.
The tetracycline group of drugs illustrate the intense competitive acti-
vity following the period of patent protection. A number of tetracycline drugs
have been marketed in the UK byAmerican—owned companies, i.e., Lederle of
Cyanamid, and Pfizer. Carlo Erba, an Italian company, has also marketed a drug
of the tetracycline family. The period of Intense competitive activity following
the period of patent protection is shown in Figure 6. It would appear that the
more remarkable the original drug the stiffer thecompetitive situation when the
FIG
UR
E
5 Equ
atio
n:
in M
S =
1.
180
+
0.52
16
z (=
0.69
)
0 54
55
56
57
58
59
. 65
66
67
68
69
70
71
72
73
MA
O In
hibi
tors
Log
norm
al
estim
ate
90 8 70
60
50
40
30
20
10
Dat
e Fi
rst
Issu
ed
in t
he U
K
e
Xi
0
'C
.1
60
61
62
63
64

. .
PIG
UR
6
Tetracyc1ines
(Antibiotics)
Dirninisbii'ig ra
te of market entry
100
90
e
0 0
80
X
0 70
::
__
I
_ —
-
Per
iod
of patent protection for chlorte-tracycline
Period of intense competition
(Patented in 1947 by Lederle)
(Higher proportion of British-owned.
30
Pfizer's oxytetracycline followed very quickly
com
pani
es imitating Lederle, Pfizer,
and Carlo Erba)
20
10
x
x 0
I
53
54
55
56
57
58
59
60
61
62
63
64
65
66
67
68
69
70
7].
72

— 22 —
patent expires. The imitations, as represented in the graph, do display a
pattern similar to the cycles already discussed, but with the monopoly (or
oligopoly) period preceding.
d) Technology Transfer and Transnational Market Entry. It becomes
apparent from our analysis that the rivalry between leading pharmaceutical
companies in the postwar period was rarely confined to national economies.
For competitive reasons, many of the leading companies have operations in
more than a dozen countries, often marketing on a worldwide basis, and fre-
quently creating new technology or improving existing processes in more than
one country. Progressive drug companies, developing new markets or technical
areas, often established foreign subsidiaries or made supply and licencing
arrangements with foreign companies. Furthermore, very novel pharmaceutical
products tended to require a significant marketing and therapeutic effort,
which normally called for an increased local presence.
Some of the key factors behind the transfer of drug technology between
the United Kingdom and the United States are discussed in section 4. The
important aspects of technology transfer considered relate to the direction
in which it takes place, the lead or lag between market entry in source and
recipient countries, and the firms responsible for technology transfer and
creation. A sample of 74 new drug products is used.
3. A Model of the Imitation Cycle
a) Methodology. The experiments carried out on the imitation data are
of three basic kinds. The first examines the overall time pattern of market
entry taking the imitation lags MS as observations. These are the lags found
between the date of the first introduction of a drug into the UK and introductionS
by imitating companies, and are measured to the month. The lognormal model is
used for estimating the characteristics of the time pattern of market—entry

— 23 —
introductions MS. The regressions for the model are based on the following
formulation where MS takes its natural log form:
in MS ji (i.e., mu) + a (i.e., sigma) Z + e (1)
Z normal equivalent deviates
e = error terms
Each equation estimated thus has two parameters, mu and sigma, which vary
from cycle to cycle, and are indicative of the time pattern of each imita-
tion cycle. Variations in mu generally are indicative of forward or backward
shifts in the average timing of market entries, while variations in sigma are
indicative of bunching or clustering of imitative market—entry activity. A
low value for mu thus tells us that firms are generally early in their intro-
ductions (the imitation lags on average are short), while a low value for
sigma suggests that firms tend to enter together rather than being spread out
over the imitation cycle. These parameters of the lognormal model have several
other useful properties)2
more detailed explanation of the model is given in Lake [1976].
The second kind of experiment is designed for the purpose of assessing
individual company positioning within the cycle. Three types of index are
used for this purpose, and all pertain to the individual company's activity.
The first index, the unweighted index, is a count over all the imitation cycles
of the numbers of chemical entities that the particular firm has introduced.
The second index, a weighted index, assigns a weight to the participation in
individual cycles depending on the positions held by drugs of the company.
If the position held is 1st then the weight value (w1) assigned is 12, 2nd is 11,

— 24 —
and so on to the 12th, which, along with subsequent introductions, is weighted
by 1. The index for the jth company thus is compiled as follows:
w1m +w2m2
+w3m3j
+ ... + wm i 1,..., (2)
= number of cycles in which company j was in rank i.
= weight value assigned to rank I (w1 = 12, w2 = 11, w3 10
1, q13 1 ...).
The final value of the index is W. The weighted index gives an estimate of
the timing of new chemical entity introductions that is characteristic of
the company involved. A company that is consistently first to introduce new
drugs in new chemical areas will have a high index value.
A further refinement, index three, makes use of the weight values
described above. The sum of these for an imitation cycle k, which is (Ewi)k,
can be used to "normalize" the weights for individual market entries, the Vjk•
Aggregation of these "normalized" values, i.e., the XK for the firm, provides
us with another measure of performance of the firm for the imitation cycles
in which it has participated.13 Moreover, this "normalized" performance index
13For example, a firm that is second in imitation cycle three and ninth
in imitation cycle twenty—five, receives the index three value: 11/81 + 4/93
= .179. Imitation cycle number three has fourteen participants, and number
twenty—five has twenty—six participants; thus (lw1)3 81 and (Ew)25 93.
takes into account the eventual number of firms participating in the imitation
cycles where market entry is made. Computation of index three is as follows:
Index three ZXk = 1[ik/(i)k (3)

— 25 —
Furthermore, a measure of average performance can also be derived based on
the average values of the "normalizedtt weights comprising index three. This
measure, denoted as , is derived as follows:
Ex/N
where,
Xk = wikWi)kN = the number of market entries made by the firm.
Associated with the average performance of the firm is the standard deviation
value s, of the consistency with which the average x was maintained. It
enables us to examine another important aspect of the individual firm's per-
formance.
The third set of experiments makes use of the dates of market entry
within imitation cycles for each company to build up a performance profile
based on the imitation lags (for ith company), of the jth imitation cycle.
The formulations employed are as follows:
L =t —tii ii oj
= imitation lag for the ith company within the jth imitation cycle
where:
date that the first product of the jth imitation cycle was intro-
duced into the UK (month/year)
date the product of the ith company was issued (month/year) in
the jth imitation cycle.
The average imitation lag for each company i over the imitation cycles is
then:
n
i= EL1, (4)j=l
n = number of imitation cycles

— 26 —
The values for are then used to compare differences between companies
and groups of companies on the grounds of nationality of ownership, size,
or scope of operation.
b) Estimation and Results. The results of the first two sets of experi-
ments are summarized in this section and those of the third set make up the
analysis of section 5. The new drugs covered represent the glamour markets
of the pharmaceutical industry. The analysis that follows examines the parti-
cipation by host—country and foreign—owned firms in these markets in the UK.
The companies of the study have been divided into three groups: American—
owned companies, British—owned companies, and companies of other nationality
of ownership. Where possible an attempt has been to take the original company
rather than the merged enterprise in attributing product introductions, e.g.,
drugs introduced by Parke Davis are attributed to that company, and a final
picture brings together all the drugs under Warner—Lambert with those of
William Warner. The sample of imitation cycles covers most of the pharmaceu-
tical markets since an attempt was made to get as complete a coverage as possible
given time and resources.13
13Where omissions have occurred, as in the cases of cancer chemotherapy,
metal antagonist, and virus drugs, this has been partly due to insufficient
data and partly because of the extremely specific nature of the therapy areas.
Furthermore, many of the products excluded do not represent profit—making intro-
ductions.
.

— 27 —
The results of the lognormal estimation of imitation cycles given in
Table 4 show great variation in values of mu and sigma.14 It became immediately
'4Norrnal curves were also estimated, but are not presented in this paper.
A modified lognormal model with the base observation, i.e., the first observa-
tion, given the values ranging from in 2, i.e., 0.693, to in 4, i.e., 1.386,
was tried with improvements to the regression coefficients resulting in many
cases. These results are also not given in this paper so as to keep the re—
suits along the line of the usual lognorrnal experiments with in 1, i.e., 0.0,
as the base observation. This viii permit comparisons to be made with results
for imitation cycles estimated in other industries.
apparent that the analysis of the pharmaceutical industry would have to differ
in important respects from that of other industries because of regulations
governing a large part of its competitive behavior. At an early stage the
cycles for the post—62 period were examined to see if fundamental differences,
such as a marked slowing up of imitative behavior, were characteristic. No
definitive conclusion could be reached, but it did appear that new imitation
cycles for the post—62 period were remarkably few in number: the oral contra-
ceptives, the post—thiazide diuretics, non—narcotic antitussives (to a limited
extent), cancer chemotherapy, the prostagiandins, drugs for rheumatism and
arthritis (still few real successes), are some of these. It was also thought
that the post—62 period might show itself with an effect on the mature phases
of the imitation cycle, making the slowing—up period of new introductions more
pronounced, but on this point no definitive answer came. It appeared that no
discernible effect of the post—62 period could be found on the imitation cycles
already in progress, even for the tranquilizer group. The answer must most

TA
BL
E
4
Res
ults
of
Log
norm
al C
urve
Est
imat
ion
Drug or Chemical Name
No.
Mu
Sigma
Drug or Chemical Name
No.
Mu
Sigma
Alimentary System
Antioholinergics
Synthetic C
atha
rtic
s
Car
diov
ascu
lar
Syst
em
Vas
odila
tors
(Nitrates)
Vasodilators (Exci. Nitrates)
Reserpine and Synthetics
Adrenergic Sympathetic Amincs:
Thi
azid
es (
Diu
retic
s)
Non
—T
hiaz
ide
Hyp
erte
nsiv
es
Cen
tral
Nervous System
Analgesics (Non Opiate)
Analgesics (Synthetic)
Sedatives
Phenothiazines (Alkyi Pi
peri
—
dyl, and Propyl Piperazine)
Phenothiazines (Propyl Dlalkv
lamino
Analeptics
MAO In
hibi
tors
Dibenzazepine and Derivatives
Antiemetics
Epilepsy Drugs
Ant
ipar
kins
on D
rugs
Mus
culo
—Sk
elet
al Disorders
Hor
mon
es
Mod
ifie
d Proges tins
Oral C
ontr
acep
tives
A
ndro
gens
and Modifications
Hydroc o
r tie o
ne
Predrilsolone
Modified ACTH
Sulf
onyl
urea
s
Genito—Urinary System
Non—Thiazide Diuretics
Infections and Infestations
Phenoxymethyl Penicillin (v)
14
Sem
i—sy
nthe
tic Penicillins
14
eomycin Sulfate (Dermato1ogic 23
Streptomycin Family
10
Polypeptide Antibiotics
18
Other Antibiotics
38
Ant
itube
rcul
osis
Drugs
25
Anthelmintics
10
Other Groups
. 8
.915
.896
7 I
21
0 • 9
3
1.619
.8133
i
0.92
.
24
1.91
2 .7
330
9 1.
823
.912
0
14
17
21
14
19
20
1.82
5 1.
938
1.57
6 2 • 1
00
1 • 3
00
1.98
3
16
1.89
1 16
1.
301
14
1.35
8 26
1.574
27
1.569
21
1.905
8
1.50
7
.925
6 .9
283
.898
8 .9
857
• 889
8 .7
897
1.00
9
i 0.
83
0.92
i 0.
95
i 0.
94
i 0.
97
i 0.
94
0.74
I 0.
90
I 0.
77
I
0.90
$
0.88
I
0.91
I
0.77
I
0.96
I
0.84
I 0.
88
I 0.
80
I 0.
85
0.85
I
0.93
I
0.91
I
0.68
I
0.88
I
0.86
I
0.90
I
0.91
.9822
.9341
.891
3 .9343
.618
7 .8589
.917
5 .7
959
.905
6 .7
664
.994
3 .7
214
.5216
.8723
1.026
.9648
.972
6
9 1.
601
.9311
0.92
11
1.78
8 13
2.054
28
1.95
1 19
2.187
9
1.44
1 23
1.920
9
1.18
0 10
1.710
13
1.917
10
1.79
9 13
1.
335
00
1.376
1.545
1.98
0 1.
409
1.65
5 1.
991
2.092
1.60
6
Mephenesin
Muscle Relaxants (Glycols,
Benzodlazeplnes.)
.996
1 .8
260
.672
7 1.
072
.947
5 .7
663
.7319
1.268
.8632
6834
.9
032
i 0,
93
i 0.
93
I 0.
88
I 0.
88
I 0.
95
I 0.
95
I 0.
91
I 0.
93
I 0,
97
I 0.
79
I 0.
95
Non—Narcotic Antitus elves
New Local Anesthetics
New Xanthine Derivatives
19
1.43
5 16
1.952
10
1.317

— 29 —
likely lie in the numbers of really new chemical groups being tested, fewer
in number, and tried with more thoroughness.
The parameters estimated by the lognormal model were used in a regression
analysis with selected variables measuring market participation to ascertain
whether an association could be found between the shape of the imitation cycles
(as measured by mu and sigma) and the composition and numbers of firms making
them up. Would, for example, a larger number of American firms making up an
imitation cycle significantly determine its characteristics? The results of
this regression study, though inconclusive, suggest that competition between
companies may marginally shorten the time profile of imitation cycles through
competitive pressure, with a clustering of introductions reflected in a negative
sigma coefficient. This has happened when relating numbers of the ten American
firms with the largest foreign sales that have entered the market, or numbers
of the world's largest twenty pharmaceutical firms, to sigma as follows:'5
15The correlation between USFS and WLF is sufficiently large for them
not to be included together in the same equation.
= 0.5513 — 0.0087 USFS 2 = 0.06 (5)(16.93) (—1.11)
USFS number of the ten U.S. firms with largest foreign sales (1971)
or,
a 0.5633 — 0.0066 WLF = 0.04 (6)(18.19) (—1.596)
WLF = number of the world's twenty largest firms (by sales 1971)
When the composition of firms making up the imitation cycles included larger
numbers of British or foreign companies, this tended only marginally to lengthen
the imitation entry period, thereby influencing mu.

— 30 —
p — 2.078 + 0.0144 BF + 0.0207 EF. 0.09 (7)
(31.27) (2.013) (1.526)
BF number of British companies in the imitation cycles.
EF number of European or other non—American foreign companies in theimitation cycles.
The effect of having more of the world's largest ten firms in the imitation
cycles was similar.
p = 2.044 + 0.0135 BF ÷ 0.0210 WL 2 — 0.11 (8)
(27.33) (1.908) (1.792)
WL = number of the world's largest ten firms by sales 1971, making upthe imitation cycles.
None of the independent variables showed significant associations with either
p or a at the 5% level. The results are therefore only suggestive.
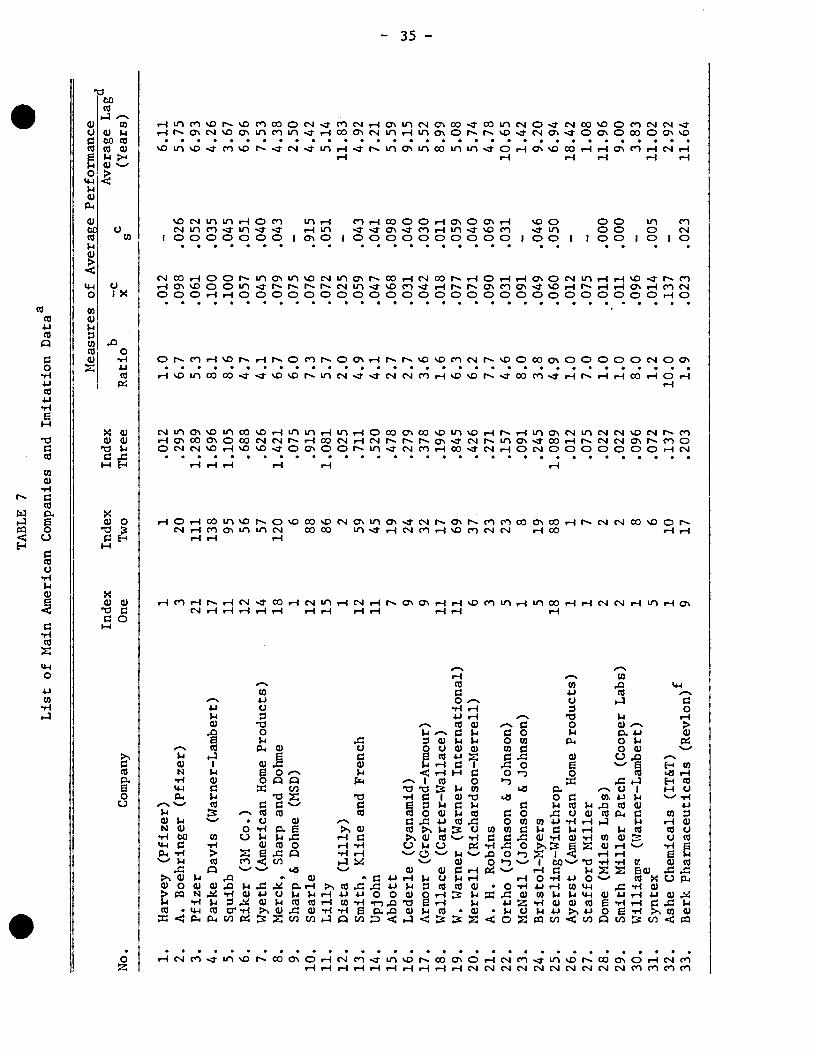
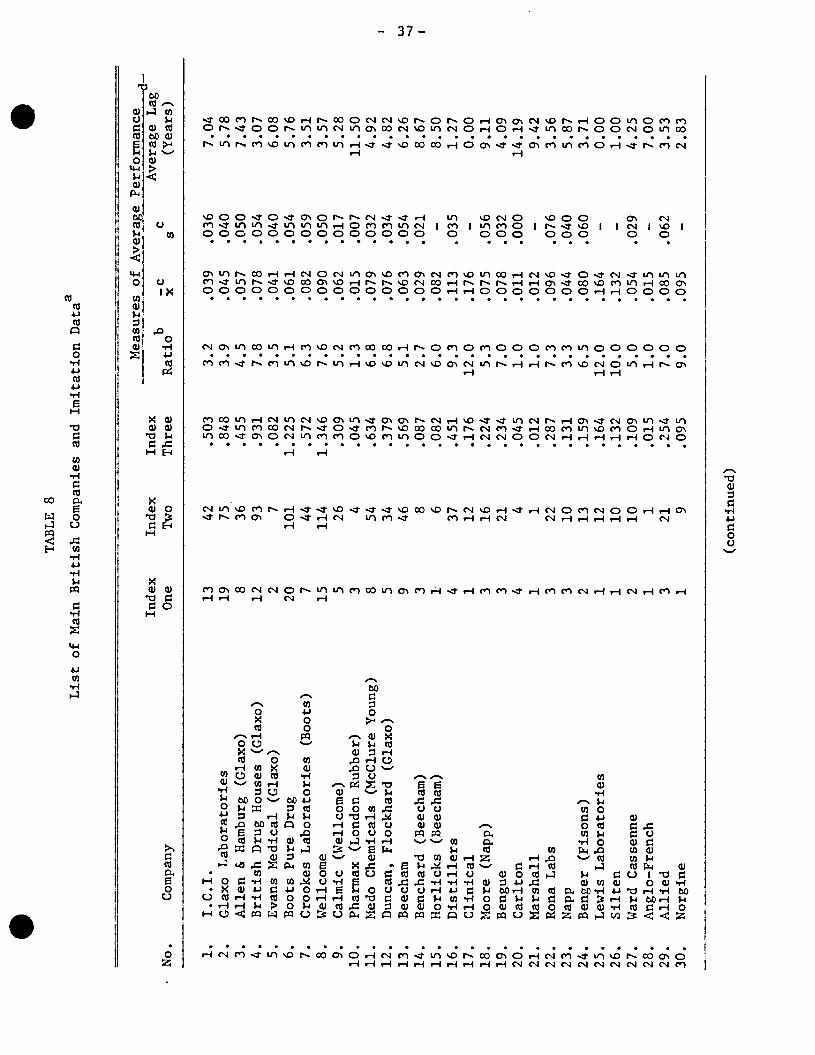
The second approach to the analysis of the impact of foreign firms on
the UK industry makes use of the indices, already described, for participation
frequency, i.e., number of new chemical entities, and imitations, and timing
of introductions within imitation cycles. Taking the sales of individual
companies in the UK for 1971 as the dependent variable and the indices as
independent variables, the regression results given in Table 5 were obtained.
The relationships in all cases between sales and the indices individually are
significant at 5%; however, in no cases were the constants significant. The
strongest association between innovative activity, as measured by the indices,
and sales was found for the European and other foreign company groups. The
t statistics suggest a more consistent relationship in the case of the indices
weighted by the position the firms hold in introducing products within the
cycles, than for the unweighted index Nevertheless, both types of index
illustrate the importance of innovative activity to market performance

— 31 —
TABLE 5
The Introduction and Timing of New Pharmaceutical ProductsReflected in Company Sales (Period — 1950 to 1973)
Dependent Variable: Sales in the United Kingdom (L mn)
ProductCompanies Covered Constant Index
Independent VariablesNos:One
Timing:Index Two
CombIndex
ined:Three
—2R
British—Owned —.11 +1.08 .55
(23 observations) (—.04) (+3.53)
+1.00 +19 .38
(+.42) (+3.80)
+.84 +16.85 .36
(+36) +3.88
American—Owned —.88 +.89 .47(21 observations) (—.35) (+4.30)
+.73 +.15 .50(+35) (+4.57)
1.12 +11.85 .45(+.54) (+4.40)
European and Other —2.37 +1.13 .76(16 observations) (—1.15) (+4.30)
—1.35 +2]. .80(—.74) (+7.59)
—2.60 +19.00 .83(—1.54) (+8.79)
All Companies —.95 +1.01 .52
(60 observations) (—.68) (+8.05)
+.23 +.18 .54
(+.19) (+8.44)
+.02 +15.35 .54
(+.02) (+8.54)

— 32 —
A comparison of the performance of the leading US, UK and European firms
over the 40 Imitation cycles, can be made by taking the index averages for the
10 firms scoring highest in each category. The results of this computation for
the three indices are presented in Table 6. The group averages of three in-
dices give US subsidiariesthe highest scores in each case. Furthermore, as
indicated by the standard deviations for each group average, the 10 leading US
subsidiaries have tended to have a high consistency of performance.
The market entry activity of US subsidiaries is illustrated in Figure 7
by means of the cumulative frequency distribution based on the positions of
entry in UK imitation cycles. Although comprising a smaller group in terms
of numbers of firms, US subsidiaries made more market entries and held more
of the leading positions than UK firms.
In addition to the three indices of the total performance of individual
companies, two measures of average performance were calculated and are pre-
sented in Tables 7, 8 and 9. The first is the ratio, index two/index one,
and is a measure of the average weight assigned to the market entries of an
individual firm. The second, , was described in section 3a, and has the ad-
vantage that it also takes into account the eventual number of participants
of those imitation cycles in which the firm participated, assigning a higher
weight where this number was lower.
The measures of average innovative performance were used as independent
variables in regressions which are presented in Table 10. Since the variables
for average performance tended to be correlated with those of total performance,
the regression analysis of these was conducted separately. Furthermore, an
association between company size, as measured by UK sales, and average performance
became apparent from the regression results. Thus, average performance, as an
explanatory variable of company sales, could not be used generally, its usefulness
as an explanatory variable itself tending to increase with the size of sales.

— 33 —
Table 6
Indices of Market Entry'
Comparisons of Averages for Groups of Leading Firms2
Ten Leading:—IndexOne
IndexTwo
IndexThree
US Subsidiaries 15(3.4)
91(26.2)
1.084(.318)
UK Firms 12.3
(4.5)
65.4(28.3)
.770
(.310)
European Subsidiaries ii.(7.)
68.5(38.5)
.824
(.452)
'See section 3a.
2Standard. deviations are given in brackets below each average figure.

. I
I I
I 5
10
15
20
25
30
40
Rank, or Position,
of Market Entry
n
Main US Subsidiaries (32 Companies)
Main UK Firms
(44
Com
pani
es)
umulative
re quency
150
140
120
100
90
70
50
40
30
20 0
Main European Subsidiaries (25 Companies)
FIGURE 7
Cum
ulat
ive Frepiency Distributionsfor
(arket Entry Positions of Companies Making Up the
Three Major Groups
0
35
(V(V
(V
01JCV4J•1-4
(V
U)C)r4
N-CV
E01-4
(VU
•rl)-1C)
•rl
1-104JU,
(V
U)all-I(Va)C) S.—.
—SI-'C)N'-4'4.4
l.1all-INC)rICOrI
S.—.
WoCt,
CC'—SU U1.1C) 0E 5.1CV
I C)5.1 E0.—.C)
U,1-4 t1CV sCV(V'.-' .C) C)0 4 EU)r1 C)CVO;'.Cd c)ciuS.-"-'
.. C)C) I1 , .r-4 .C) 43 U 1-i SH5.1 C) 1-i CV cVr-4CV tTrl C) C) H
CIfLrc\Lr
—S2-i i—..
U OUC)$-I rI(V C1Gj
'-S.C),4r4rIr-
S.-,.5—. C) U
.5 1-) .—I 5.1 UJ 1-i Ct,44 4.4 0 0 C) 0 '-4U) -1-4 •-,.a -H E PO C) 1-i CV
,00100
O H N. H lfl O\ C'4 Uc-ODHr--r-40C'J000H
'4-4'-S
0'-4
C)
5-,U)HCVU
-'-I43
C)UCV
(V
5.1C)
— 35 —
H
Hr—QcflCO0p5.-
.O C'4 Lt in H 0 CC54 Ifl C') s -20000000
U
CV
0'4-45.1C)p-i
CVI-iC)
"-40U)U2.4
U)Ct,C)
CCO-0O0C'1-rO00O'i0OD0CDCO OH HHCC)HHH H H H H
UH CflHCo00HQ0C\HH in - - m H in - ¼) Cic,0 1000000000000 in C.-,00 0 c•-111001010
C' CO H 00 N. Lfl 0 Ui 4 in 0's N. Co H C'4 0) N. H 0 H H C's 0 in H H '.0 ' N. C)H00N.N.N.HN.HN.HHC',—4Cflc000HH00000000000000000000000000H0
0N.CflH%.0N.HN.OcflN.00'sHr—N.'.OH '.0 ifl c CO -- - '.0 '.o N. in ci - - c-.i C'4 cn
OHHUiH0CO'.0Ln0H0O'sO0N.CnHCoHHH H H
N.%0000000C'100'sH'.0'.0N.,-1N.HHcOr--40r-4H
0000r-IC'
H 0 H CO ifl '.0 N. 0 '.0 CO '.0 C'4 O in 0'. - N. 0'. N. C'i (f CO 0'. 0)NHinLn COcO HCflH'.0CC' HcO'-I
UI
0H43Ctj
CIa)d 2-iHI-I
x0)0)
H
I
0z
C..IHHHHH HH HH
H-C'JC4CO'.0CN.
N. 0'. 0'. H H '.0 in H in COHH H
'-SH(V
0•rIH43 H(Va)1.45.101W
01.4CCC) '1-i5.4 CVCV,c
H1-1 '— .0C) 05-i H
5-i.C)
—5U)4-IU
05-ip-i
C)E0
p.01.iCV5.i.UC)
U) 44 H H14C) H C) •,-4
I bO'-'H 5.40 H 1-4 01-1 H Ci) (1-4Ci) 1-1 5-414.4HC)CJcVI-i 1.1 4J
5-4
C)NH
• 14.4
'—S'-S0CC
.00I-,
0(/)CO.00I-)'-,5—'
HOH.00)1-)Z).IU
'-5CC
.0CV
54C) —'
0)-iOW0.0 '-'"-E (-.4
CV 'V(-.4i—UI I-.45—,
..DCVC)U)
5-i H54cV cVU)W UC)H'-' 4
Er4C C)EC) .0'—
.0-i-I C)C) 4-I i-I 44 C)rIH0 H '.U)
H cn - in '.0 N- a) c's 0 i—I -- in '.o N- CO 0'. 0 ,-4 c'1 cn - lfl '.0 N- CO 0'. 0 H c-I C',HHHHHHHHHHin

— 36 —
NOTES TO TABLE 7
aThe indices are described in section 3a.
bRatio of Index Two over Index One.
CSee section 3a and note on Index Three.
dSee section 3a.
e
Non—American, but America principal market.
f
Excluded from Figure 7 and some of the analyses.
.
. S
TABLE 8
List of Main British Companies and Imitation Dataa
Measures of
Ave
rage
Per
form
anc
Inde
x In
dex
Inde
x A
vera
ge L
ag
b —
c C
N
o.
Company
One
Two
Three
Ratio
x
s
(Years)
1.
I.C.I.
13
42
.503
3.2
.039
.036
7.04
2.
Glaxo Laboratories
19
75
.848
3.9
.045
.040
5.78
3.
Allen & Hamburg (Glaxo)
8
36
.455
4.5
.057
.050
7.43
4.
British Drug Houses (Glaxo)
12
93
.931
7.8
.078
.054
3.07
5.
Evans Medical (Glaxo)
2
7
.082
3.5
.041
.040
6.08
6.
Boots Pure Drug
20
101
1.225
5.1
.061
.054
5.76
7.
Crookes Laboratories (Boots)
7
44
.572
6.3
.082
.059
3.51
8.
Welicome
15
114
1.346
7.6
.090
.050
3.57
9.
Cairnic (Welicome)
5
26
.309
5.2
.062
.017
5.28
10.
Pharmax (London Rubber)
3
4
.045
1.3
.015
.007
11.50
11.
Medo Chemicals (McClure Young)
8
54
.634
6.8
.079
.032
4.92
12.
Duncan, Flockhard (Glaxo)
5
34
.379
6.8
.076
.034
4.82
13.
Beecham
9
46
.569
5.1
.063
.054
6.26
14.
Benchard (Beecham)
3
8
.087
2.7
.029
.021
8.67
15.
Horlicks (Beechain)
1
6
.082
6.0
.082
—
8.50
16.
Distillers
4
37
.451
9.3
.113
.035
1.27
17.
Clinical
1
12
.176
12.0
.176
—
0.00
18.
Moore (Napp)
3
16
.224
5.3
.075
.056
9.11
19.
Bengue
3
21
.234
7.0
.078
.032
4.09
20.
Canton
4
4
.045
1.0
.011
.000
14.19
21.
Marshall
1
1
.012
1.0
.012
—
9.42
22
. Rona Labs
3
22
.287
73
.096
.0
76
3.56
23
. Napp
3
10
.131
3.3
.044
.040
5.87
24.
Benger (Fisons)
2
13
.159
6.5
.080
.060
3.71
25.
Lewis Laboratories
1
12
.164
12.0
.164
—
0.00
26.
Silten
1.
10
.132
10.0
.132
—
1.00
27.
Ward Cassenne
2
10
.109
5.0
.054
.029
4.25
28.
Anglo—French
1
1
.015
1.0
.015
—
7.00
29.
Allied
3
21
.254
7.0
.085
.062
3.53
30.
Norgine
1
9
.095
9.0
.095
—
2.83
(continued)

TA
BL
E 8
(con
clud
ed)
No.
Company
Index
One
Index
Two
Index
Three
Measures of Average Performance
Average Lag
(Years)
Ratio b
x
8c
31.
Fletcher and Fletcher
1
1
.015
1.0
.015
—
12.17
32.
Smith & Nephew
11
51
.614
4.6
.056
.053
7.14
33.
Genatosan (Fisons)
3
6
.070
2.0
.023
.021
4.79
34.
Dales
1
6
.079
6.0
.079
—
5.25
35.
Lloyds Amphor
2
2
.022
1.0
.011
.000
9.13
36.
Reckitt and Colman
1
3
.039
3.0
.039
—
17.92
37.
Carisoma
1
1
.011
1.0
.011
—
5.32
38.
Camden Labs
2
8
.093
4.0
.047
.015
6.79
39.
London Rubber Company
2
•
5
.067
2.5
.033
.030
6.25
40.
Rendall
2
3
.036
1.5
.018
.009
7.79
41.
Meñley and James
2
18
.194
9.0
.097
.027
1.38
42.
Norton
2
3
.037
1.5
.019
.011
10.75
43.
Mycoform
1
1
.010
1.0
.010
—
11.92
44.
Fisons
1
1
.010
1.0
.010
—
13.83
he indices are described in section 3a.
b Ratio of Index Two over Index One.
CSee section 3a, and note on Index Three.
d5
section 3a.
.
.

S
TABLE 9
List of Main European Companies and Imitation Dataa
(continued)
.
No.
Index
Company
One
Index
Two
Index
Three
Measures of Average Performance
b
Ratio
xC
5c
Average Lag
(Years)
GE
RM
AN
Y
1.
Bay
er P
harm
aceu
tical
s (Bayer, AG)
2
10
.134
5.0
.067
.017
9.92
2.
Schering Chemicals (Schering, AG)
9
43
.529
4.
8 .0
59
.050
4.
40
3.
Hoechst Pharmaceuticals(Farbwerke Iloechst)6
43
.560
7.2
.093
.049
4.44
4.
Knoll
1
1
.013
1.0
.013
—
9.58
5.
Geistlich Sons Ltd.
2
15
.191
7.5
.095
.042
7.75
6.
Boehringer Ingelheim
4
33
.420
8.3
.105
.051
5.63
7.
E. Merck Ltd.
1
1
.011
1.0
.011
—
20.5
0 8.
Wulfinger
1
1
.012
1.0
.012
—
16.8
3 9.
R
icht
er
1 10
.1
11
10.0
.1
11
—
1.58
SW
ITZ
ER
LA
ND
10
. C
IBA
23
12
9 1.
434
4.8
.062
.0
46
5.47
11
. G
eigy
Pha
rmac
eutic
als
(CIB
A—
Gei
gy)
6 28
.3
62
4.7
.060
.0
54
6.01
12.
Sandoz Products Ltd.
5
17
.213
3.
4 .0
43
.032
11
.55
13.
Roche
21
104
1.245
5.0
.050
.050
5.98
14.
Wander Pharmaceuticals (Sandoz A, Glaro)
5
36
.420
7.2
.084
.029
4.73
FRANCE.
15.
May & Baker (Rhóne Poulenc)
21
127
1.590
6.1
.076
.052
5.52
16.
Roussel Laboratories (Roussel—UCLAF)
15
76
.899
6.1
.060
.042
5.88
17.
Lepetit Pharmaceuticals (Gruppo Lepetit)
2
2
.020
1.0
.010
.001
18.00
18.
Concept Pharmaceuticals (Pierre Fabre)
1
1
.013
1.0
.013
—
15.5
8
SWEDEN
19.
Astra
7
12
.146
1.7
.021
.016
10.98
20.
Pharmacia
1
1
.011
1.0
.011
—
15.6
7
'4

TABLE 9 (concluded)
No.
Company
Index
One
Index
Two
Index
Three
Measures of Average P erformance
Average Lag
(Years)
Ratio b
8C
ITALY
21
Carlo Erba (Montedison)
1
1
.011
1.0
.011
—
12.83
22.
Pharmatilia (Montedison)
3
5
.063
1.7
.021
.016
12.83
DENMARK
23.
Leo Laboratories
9
19
.218
2.1
.024
.021
8.89
THE NETHERLANDS
24.
Brocades (Gist—Brocades)
1
1
.011
1.0
.011
—
16.67
25.
Organon Laboratories (AKO)
9
69
.776
7.7
.085
.035
3.09
he indices are described in section 3a.
bRti of Index Two o
ver Index One.
CSe
e section 3a and note on Index Three
section 3a.
.
.

— 41 —
TABLE 10
The Introduction of New Pharmaceutical Products asReflected in Company Sales (Period — 1950 to 1973)
Dependent Variable: Sales by Company in the UnitedKingdom (T inn)
Independent Van.Measures of Average
ables:Innovative
CompaniesCovered
Performance—2RConstant
aRatio
—ax
1.1 Firms with +11.05 +316.58 .57
Sales > 20 imi (+1.64) (+3.17)(6)
+11.95 +3.69 .52
(+1.70) (+2.90)
1.2 Firms with +2.60 287.45 .10Sales > 10 inn (+.28) (+1.99)(17)
+4.07 +3.13 .07
(+.,44) (+1.80)
1.3 All Firms +4.73 +56.79 .02
(60) (+1.59) (+1.21)
+3.90 +.87 .04
(1-.03) (+1.59)
2.1 Selected Firms +.11 +134.50 .26(36) (+.05) (+3.79)
—.11 +1.64 .30
(—.06) (+4.19)
2.2 Selected U.S. —2.03 187.10 .33Firms (16) (—.55) (+3.17)
—2.24 +2.10 .40(—.74) (+3.54)
2.3 Selected UK +1.20 89.56 .01Firms (U) (+.39) (+1.44)
+1.89 +.89 —.02(+.67) (1.33)
2.4 Selected European +3.01 +71.79 —.05Firms (9) (+.44) (1.24)
+.82 +1.33 .08(-1-.17) (+1.67)
aTh indices are described in section 3a.

— 42 —
Those large firms, which not only tended to make more market entries, but
were also more consistent in leading within imitation cycles, tended to
have larger sales. Notwithstanding this limitation, average performance
was a most useful explanatory variable in the case of the US subsidiaries.
The factors influencing their participation within UK imitation cycles are
considered in the following section.
.

— 43 —
4. Market Entry Activity in Pharmaceuticals
a) Transnational Operations of American Conpanies. A number of factors
go to make the foreign investment activity in the pharmaceutical industry a
special case even though much of its patterns are similar to other research
and marketing—intensive industries. The special qualities of the industry
derive primarily from the extent to which it is regulated. The food industry,
e.g., sausage making, is regulated internationally by laws of individual
countries, or trading areas, to control qualitative aspects of manufacture,
and indeed, qualities of the final product, e.g., permitted amounts of food
preservative or meat substitute. The pharmaceutical industry, however, is
remarkable in the extent of regulation.
International differences regarding the character of the restrictions
and requirements for production, testing, and sale of pharmaceutical products
are probably an important explanatory variable in the levels and qualities of
activity in different countries. Marginal differences or changes in legisla—
tion can influence company behavior in a number of ways: cause a company to
devote more expenditure and manpower to certain aspects of drug research,
development (testing), or manufacture; influence the timing of activities
by the company, the extent to which it can simultaneously carry out several
aspects of drug introduction; influence the type of companies that will be
able to innovate successfully, e.g., by raising standards and costs of research.
Three kinds of tests were carried out on data collected on the product—market
activity of US subsidiary firms in the UK. The first considers various aspects
of technology transfer within and between US companies, and between US companies
and ather foreign companies. The channels of technology transfer used by com-
panies can be assessed on the basis of the frequency of use, direction, and the
lags involved.
— 44 —
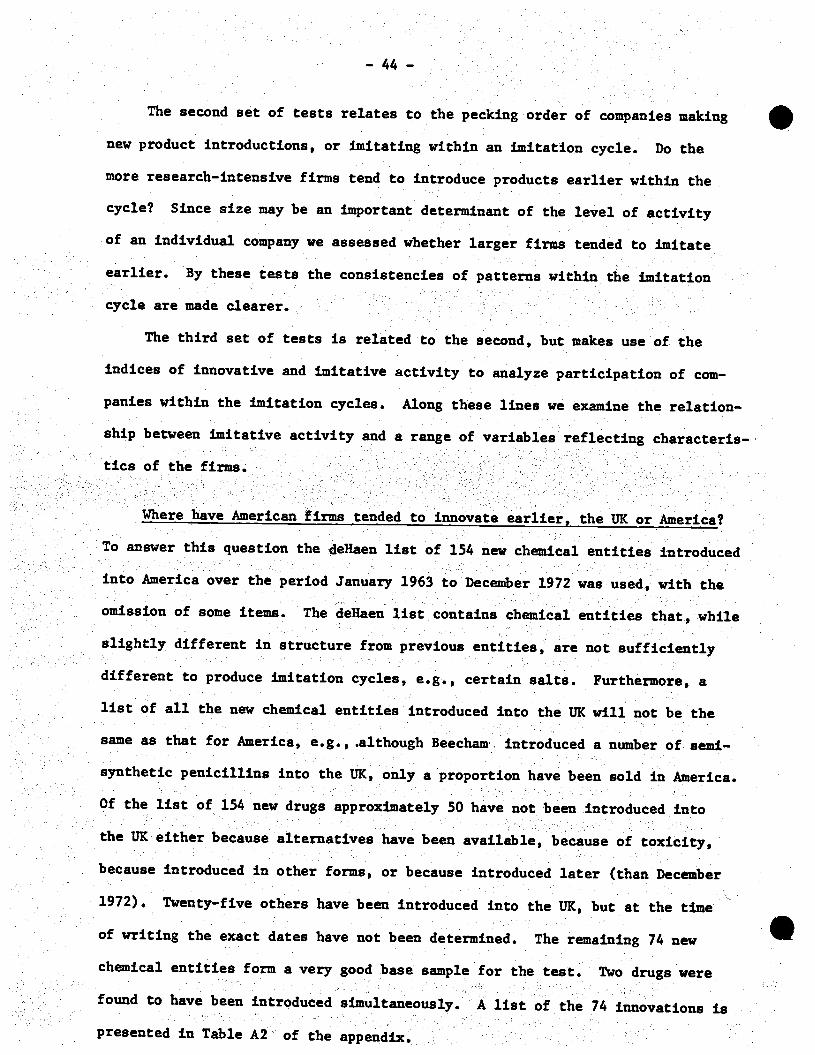
The second set of tests relates to the pecking order of companies making
new product introductions, or imitating within an imitation cycle. Do the
more research—intensive firms tend to introduce products earlier within the
cycle? Since size may be an important determinant of the level of activity
of an individual company we assessed whether larger firms tended to imitate
earlier. By these tests the consistencies of patterns within the imitation
cycle are made clearer.
The third set of tests is related to the second, but makes use of the
indices of innovative and Imitative activity to analyze participation of com-
panies within the imitation cycles. Along these lines we examine the relation-
ship between imitative activity and a range of variables reflecting characteris-
tics of the firms.
Where have American firms tended to innovate earlier, the UK or America?
To answer this question the dellaen list of 154 new chemical entities introduced
into America over the period January 1963 to December 1972 was used, with the
omission of some items. The deHaen list contains chemical entities that, while
slightly different in structure from previous entities, are not sufficiently
different to produce imitation cycles, e.g., certain salts. Furthermore, a
list of all the new chemical entities introduced into the UK will not be the
same as that for America, e.g., .although Beecham introduced a number of semi—
synthetic penicillins into the UK, only a proportion have been sold in America.
Of the list of 154 new drugs approximately 50 have not been introduced into
the UK either because alternatives have been available, because of toxicity,
because introduced in other forms, or because introduced later (than December
1972). Twenty—five others have been introduced into the UK, but at the time
of writing the exact dates have not been determined. The remaining 74 new
chemical entities form a very good base sample for the test. Two drugs were
found to have been introduced simultaneously. A list of the 74 innovations is
presented in Table A2 of the appendix.

— 45 —
A new chemical entity introduced into the UK earlier than into America
represents a lead for the UK. Of the 74 drugs comprising the test, 52 were
found to have been introduced into the UK earlier than into America. Of
the remaining 22 drugs, 20 were introduced earlier into America while 2 were
introduced simultaneously. This timing of new chemical entity introductions
is further illustrated by Figure 8, which divides the timing of introduction
according to half—yearly intervals. The leads of market entry in the UK prior
to introduction in America tend, on occasion, to be substantial, e.g., twenty—
one percent of the drugs have been introduced with a UK lead of greater than
3 1/2 years. The overall average lead (all drugs) to the UK has been 1.34
years (16 months).
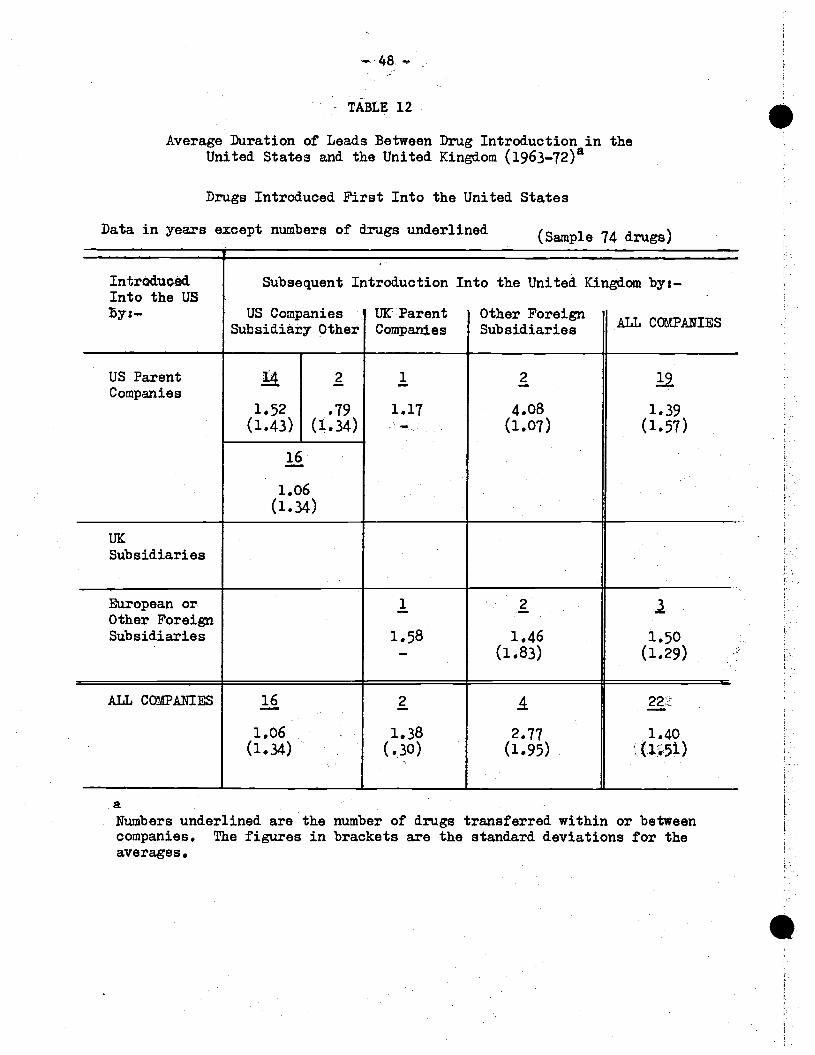
An analysis of the drug introductions In the US and the UK,presented in
Tables 11 and 12,reveals that a major share, 49%, of the transfers between
countries were made within US companies, a further 6% between, and another
18% to US companies. Of the remaining drugs, 27% were transferred outside
US companies, 24% were exchanged within or between European companies, and
only 3% were exchanged within UK companies.
The figures given in Tables 11, 12, and 13 suggest that transfers within
and to US companies were generally more rapid than In the case of European
companies. Transfers between companies tended also to be slower, particularly
in the few cases between US companies where introduction of a new drug is first
made in the UK.
Given the lead that the UK has had for the introduction of new drugs,
apparent from Table 13, it might be suggested that many of the transfers of
technology occur from the UK to the US. However, while some US firms are known
to conduct research and development in the UK, it is more likely that the market
entry there was more for marketing reasons than because the original research
was carried on in the UK. Nevertheless, it is apparent that US companies have

(
FIG
UR
E
8
The Timing of New Drug I
ntro
duct
ion
Leads a
nd. L
ags in Issuing the Same Drugs in America and the UK
(Sample: 74 New Drugs i
ssue
d Since December, 1962)
20 new drugs i
ssue
d earlier in
America of which the lead. w
as:
52 new drugs i
ssue
d earlier
of which the lead was:
Total: 27.4%
Average Lead: 18.5 months, or 1.54 years
in the UK
Total:
73.6
%
Ave
rage
a'
8.2%
Lead.: 29.4
2.45 months, or
years
8.2%
Al
) L
Yea
rs L
ead
A
Lf
•y;T
5.5%
S
3 22
1•
- 1
1 2 1 ' 2
2*
3
3-
4 4
5-'-
Yea
rs Lead.
1.34
Overall Average
S

— 47 —
TABLE 11
Average Duration of Leads Between Drug Introduction in theUnited Kingdom and the United States (1963_72)a
Drugs Introduced. First Into the United Kingdom
Data in years_except numbers of drugs underlined (Sample 74 drugs)
IntroducedInto the UK
By:—
Subsequent Introduction Into the United States By:—
US Companies UK Foreign Other ForeignALL COMPANIESParent Other Subsidiaries Subsidiaries
USForeignSubsidiaries
22
1.91(1.63)
3
3.83
(1.71)
- 1
3.83—
26
2.21
(1.72)
2.14(i • 68)
UKParentCompanies
6
2,82(.81)
2
2.29(1.31)
1
4.17—
2
2,85(1.32)
European or
—
Other ForeignSubsidiaries
72.04(i.5)
— 2*3.40(1.96)
i**
.58—
17
2.61(1.83)
10
3.37(2.11)
ALL COMPANIES 38
2.23(1.57)
2
2.29(1.13)
12
3.26
(1.88)2.47(1.69)
aNumbers underlined are the number of drugs transferred within or betveencompanies. The figures in brackets are the standard deviations for theaverages.
* Transferred to subsidiary.** Transferred to foreign subsidiary of another foreign company,
—48 —
- TABLE 12
Average Duration of Leads Between Drug Introduction in theUnited States arid the United Kingdom (1963_72)a
Drugs Introduced. First Into the United States
Data in years except numbers of drugs underlined(Sample 74 drugs)
Intrd.uced.Into the US
by:—
Subsequent Introduction Into the United Kingdom by:—
US Companies UKParent Other ForeignCOMPANIES
Sub sidia.ry Other Companies Subsidiaries
lJSParent
Companies1.52(1.43)
2
.79(1.34)
1
1,17—.
2
4.08(1.07)
21.39
(1.57)
16
1.06
('.34)
UKSubsidiaries
European orOther ForeignSubsidiaries
1
1.58—
2
1.46(1.83)
3
1.50(1.29)
ALL COMPAI'IIES 16
1.06
(i.)
2
1.38(.30)
4
2.77(1.95)
22.i
1.40(i.5.)
Numbers underlined are thecompanies. The figures inaverages.
number of drugs transferred within or betweenbrackets are the standard deviations for the

— 49 —
TABLE 13
The Average Duration of' Leads (+) and Lags (_) Between Drug aIntroduction in the United Kingdom and the United States (1963—72)
Drug Introductions in the United States
Data in years except numbers of drugs underlined
IntroducedFirst by:—
Subsequent Introduction Overseas by:—
US Companies UK Companies Other Firms ALL COMPANIES
US Companies
—.74(2.14)
5**
—1.98(2.81)
1
-1.17—
3
kl.47(4.58)
—.69(2.43)
41
—.89(2.23)
UK Companies §—2.82(.31)
.—2.29(1.31)
!—4.17—
..—2.85(1.32)
Other Firms 7
—2.04(1.35)
1
1.58—
11*
—2.53(2.69)
1**
—.58—
—2.05(2.3,)
ALL COMPANIES
—1.25(2.11)
4
—.46(2.70)
16
—1.75(3.26)
74
—1.34(2.44)
a
Numbers underlined are the number of drugs transferred within or betweencompanies. The figures in brackets are the standard deviations for the
averages.
* Transferred within an international company, either from subsidiary to
parent or parent to subsidiary.** Transferred to subsidiary of another foreign company or in the case of
US companies to other US companies or their subsidiaries.

— 50 —
utilized market entry in the United Kingdom as a preliminary to entry in
the United States.
The channels, direction and lags of technology transfer may have changed
over the period 1963—72. An examination of the results of an analysis for two—
year periods is given in Table 14. It is readily observable that the numbers
of drugs transferred within the sample has tended to fall. Moreover, the
leads enjoyed by U.S. and other foreign companies introducing drugs first into
the United Kingdom have tended to fall. It would thus appear that the dis-
parities of leads or lags of drug introduction have tended to decline, as well
as the frequence although the latter may be a general effect of fewer drugs,
as measured by the sample, being transferred. However, it may be a limitation
of the sample that more transfers for the most recent years were not found.
What characterizes the American companies that innovate or lead within
the imitation cycles in the host country? Those American coipanies that
have subsidiaries in the UK represent only part of the U.S. pharmaceutical
industry. By the fact that they have foreign operations they are already a
select group.
This second test of American companies operating in the UK pharmaceutical
industry involved ananalysis of those imitation cycles where the proportion
of American companies was sufficiently high for the methodology adopted, i.e.,
six or more U.S. companies. This criterion resulted in a sample of thirteen
imitation cycles.
The positions of individual American companies within the imitation cycles
were determined according to the products introduced by the subsidiary. The
ranks so derived were suitable for rank correlation analysis with other variables.
In selecting the variable to be tested, a number of variables such as the foreign
sales of American companies and their total r and d spending were found to be

S
TABLE 14
The Average Duration of Leads (+)
and Lags (
..). B
etw
eer
Dru
g In
trod
uctio
n in the United Kingdom and the United States (1963_72)i
.
Data in years except numbers of drugs un
derl
ined
(Sample 74 dr
ugs)
Period.
Drugs Introduced. First into
the United States:—
. Subsidiaries
Other
ALL(l)
-
Drugs Introduced. First into the
United Kingdom Classified According to:—
ALL
(1
+ 2
) 1 + 3)
Date Introduced into
the United Kingdom:-
US Firms
Oth
er
ALL(2)
Date Introduced into
the United States -
US
Firms Other
ALL(3)
Pre 1963,
1963, 1964
.l.63
(.96)
1
+2.75
—
6
+1.82
(.97)
14
—2.51
(1.72)
16
—3.02
(1.55)
30
—2.75
(1.63)
9
—1,
66
(.94)
2
—2.00
(.71)
11
—1.72
(.88)
36
—1.99
(2.31)
17
—.47
(1.9
6)
1965
, 19
66
6
42.50
(2.17)
1
41.58
—
7
+2.
37
(2.01)
4
—2.
52
(1.92)
6
—2.
21
(2.05)
10
—2.
33
(1.89)
10
—1.
81
(1.12)
—2.23
(1.67)
—1.95
(1.28)
17
—.4
0 (3.04)
22
—.5
8 2.55)
1967, 1968
3
+.17
(.14)
- —
3
i-.l7
(.14)
6
—1,85
(1.80)
3
—2.97
(1.21)
—2.22
(1.65)
—2.32
(1.99)
2
—4.08
(.35)
11
—2.69
(1.85)
12
—1.63
(1.77)
14
—2.08
(2.03)
1969, 1970
+.67
(.54)
1
*.17
(.52)
+.5
7 (.
52)
1
-.92
—
1
-.58
—
2
-.75
(.24
)
4
-2,96
(1.6
5)
3
-5.19
(2.04)
7
-3.9
2 (2.04)
7
+.1
9 (.78)
12
-2.0
5 (2.78)
1971, 1972
1
+-
- —
1
+0
1
—.17
—
- -.
1
—.17
—
—2.90
(2.23)
3
—2.92
(2.03)
8
—2.91
(2.01)
2
—.17
(.12)
—2.58
(2.11)
'Num
bers
und
erlin
ed are the number of drugs tr
ansf
errs
d w
ithin
or
beuv
een
com
pani
es,
Stan
dard
dev
iatio
ns a
re i
n br
acke
ts.

— 52 —
correlated with Index Two (part of the third type of tests carried out), and
are thus related to an American subsidiary's innovative activity in the UK.
Research intensiveness, as measured by the ratio of r and d expenditure to
total company sales, was found to be very poorly related to Index Two, and
was therefore not used. However, an alternative variable, the quality of research
effort for the period 1963—72, was used, and was defined as the number of r and d
personnel (1969) in the U.S. per new drug introduced in the U.S. during 1963—72.
Furthermore, total company r and d spending in 1971 was eventually chosen as a
variable. The reason for this choice in preference to the foreign sales variable
comes from the analysis of the timing of innovation between America and the U.K.
above. Foreign sales would reflect innovative activity, and so are probably
best represented as a dependent, rather than independent variable, in relation
to innovative activity. A company's r and d spending, though related indirectly
to sales, i.e., through profit savings, provides a better independent variable
for innovative activity.
The ordinary rank correlations derived from rankings of r and d spending
in 1971 and the quality of r and d with respect to company positions in the
imitation cycles are given in Table 15. They show a tendency for those firms
leading in r and d spending and in the quality of r and d to be early within
the imitation cycles. Two contrasting reasons for this pattern might be
offered. The first is that r and d spending and a high quality of r and d
reflects the companies' desire not only to introduce a new product, but to
introduce it earlier. Increases in r and d spending can be reflected in the
numbers of new products introduced, but it can also be reflected in the timing
of the introductions. A company's savings, and future r and d spending, are
probably related to the timing of its introductions. This leads us to the al—
ternative reason for the pattern to be observed, as in Table 15. The r and d
figures for spending relate to 1971, and may therefore reflect the performance

— 53 —
TABLE 15
Rank Correlations for American Companies in the UK
Variables Related: (1) Size of Research and DevelopmentExpenditure (1971)
(2) R & D Personnel (1969) in the USA perNew Drug Introduced (1963—72) in theU.S.a
-- -
Positions of Individual Companies in Introducing PharmaceuticalProducts for Imitation Cycles With Six or Moje Arrerican Companies
(1) (2)
1. Anticholinergics +.50 +.7l 12 Companies
2. Vasodilators (Nitrates) +.82 +.46 7
3. Reserpine and Analogs — .17 —.05 9
4. Thiazides +76 +07 8
5. Phenothiazines (Propyl Piperazineand Alkyl Piperidyl) +.26 —.31 6
6. Antjetnetjcs +.60 +.31 6
7. Muscle relaxants (Glycols andBenzodiazepines) +.21 —.07 7
8. Rydrocortjsone +.42 +.60 10
9. Prednisolone +53 +.60 9
10. Modified ACTIJ +.49 +.77 6
11.-
Neomycin Sulfate +.62 +.60 8
12. Other antibiotics +.03 —77 6
13. Antihjstarnjnes +.78 +.l5 10
Average +.45 +.24 8
(Standard deviation) (+.30) (+.45) (1.91)
--------.
aSee Cohen, Katz and Beck [1975], who developed this variable for theirStudy of U.S. pharmaceutical companies.
— 54 —
of the company in introducing products earlier. The earlier a firm introduces
an innovation the higher its profits and saving, and hence the higher its
future r and d spending.
The, circularity between r and d spending, the timing and numbers of the
innovations, and the extent of the foreign sales of American companies operating
in the UK is again seen in the following tests, using indices of innovative be-
havior to reflect the timing and numbers of innovations. In the discussion so
far the qualitative aspects of the products introduced have not been related
to the timing of product introductions. Two assumptions have been made. The
first is that the products of late entrants may be qualitatively better than
that of the innovator, but where the qualitative difference is substantial we
have a beginning to a new imitation cycle. Put together the two imitation
cycles form a double cycle or "wave." This effect can be seen in Figure A4,
where the imitation cycle of oral contraceptives has been drawn. The beginning
of a second cycle in the autumn of 1972 is clearly apparent. The new products
introduced then were the single hormone contraceptives. Earlier pills consisted
of two hormones.
The second assumption relates to the definition one assumes for assessing
the quality of a product. An innovation has the quality of being available
early, rather than late. In a commercial sense this quality of the good can
enable profits and savings to be made by a company even though later products
may be superior in other qualitative features. This time—related quality
of pharmaceutical products is an important element in company research strategy,
not only in terms of where a product is introduced first, but how soon.
I

— 55 —
What structural patterns can be detected_ben4oyy_prformance
and a corn ants_production and sales n the host_count? We have already
been reminded that the relationship between sales and research activity is
circular. A high level of r and d, relative to other firms and absolutely,
when judiciously spent, tends to reflect itself in innovative performance,
more new products, and earlier market entry. This can mean larger sales,
and more foreign sales (perhaps as a necessary rather than sufficient condi-
tion). Larger sales can mean greater corporate savings, which can lead to
higher r and d expenditure, and so on. This pattern may be termed as "benign."
The indices of innovative performance have been designed so as to permit
an analysis of the "benign pattern" by means of regression tests. Additional
data used for this purpose were based on information on individual companies
giving total expenditures on r and d, foreign (outside USA) sales, UK sales,
total company sales, employees in the UK. All data, as presented in Table 16,
apart from the indices and employment figures, were for the year 1971. From
these basic variables composite variables were derived: 1) r and ditotal
company sales, a measure of research intensiveness, 2) UK/foreign (outside
USA) sales, an estimate of the relative importance to the company of UK sales
compared to other foreign markets, 3) Tj}(/ company sales, giving the
relative importance to each company of UK sales. Apart from the two indices
of innovative performance by each company in the UK market, the variables and
derived composite variables were employed as independent estimators. In a
structural sense the first index, that describes the numerical value of new
product introductions (as well as the second index measuring the timing of
company product introductions), forms an interdependent relationship to many
of the variables mentioned above. Thus r and d spending can be thought of
both as a result of innovative performance and as an important determinant
of future innovative performance.

TABLE
Data on Selected American Companies
16
Operating in the United Kingdom
—
* —
No.
Company
UK Em-
ployment
Index
: O
ne"
Index
Two'
(1972)
Total a
R & D
(1971)
UK b
Sales
(1971)
Foreigz
a
Sales
(1971)
Total a
Sales
(1971)
$mn.
Tjmn.
$mn.
$mn.
.
15.
7.
Abbott
American Home Products—Wyeth
28.8
53.0
3.99
12.9
145.9
388.7
458.1
568.0
550
1,034
'
7
15
19
58
24.
Bristol—Myers
40.0
6.02
1098.9
263.5
550
5
19
16.
Cyanamid—Lederle
21.8
10.63
150.0
257.1
1,020
9
36
11.
Lilly
67.5
12.90
224.9
723.4
2,100
16
88
8.
Merck, Sharp & Dohme
70.5
19.45
331.4
847.
9 1,200
19
126
28. Miles Labs
12.2
41i5
72.8
288.3
550
2
2
22.
Johnson & Johnson — O
rtho
46.8
1.83
355.0
1140.5
275
6
31
3.
20.
Pfizer
Richardson Merrell
37.2
18.0
14.60
5.54
462.6
172.1
992.9
408.5
2,800
600
25
6
132
37
10.
Searle
27.1
18.83
87.4
226.9
2,600
12
88
13.
Smith, Kline & French
35.8
7.37
85.2
367.5
770
12
59
5.
Squibb
33.1
6.14
221.6
674.8
700
• 11
95
25.
Sterling—WInthrop
23.0
30.71
263.5
625.4
2,903
18
88
14.
Upjohn
45.4
3.88
148.4
438.4
390
11
45
19. W. Warner
55.6
10.38
498.3
1346.0
1,250
12
74
31. Synte*
11.6
0.79
46.5
117.4
200
5
6
* Non
—A
mer
ican
.
d See sects 3
a.
apoorts company and industry reports.
bExtract Services; Extel Services. CKompass, Companies.
.
0'
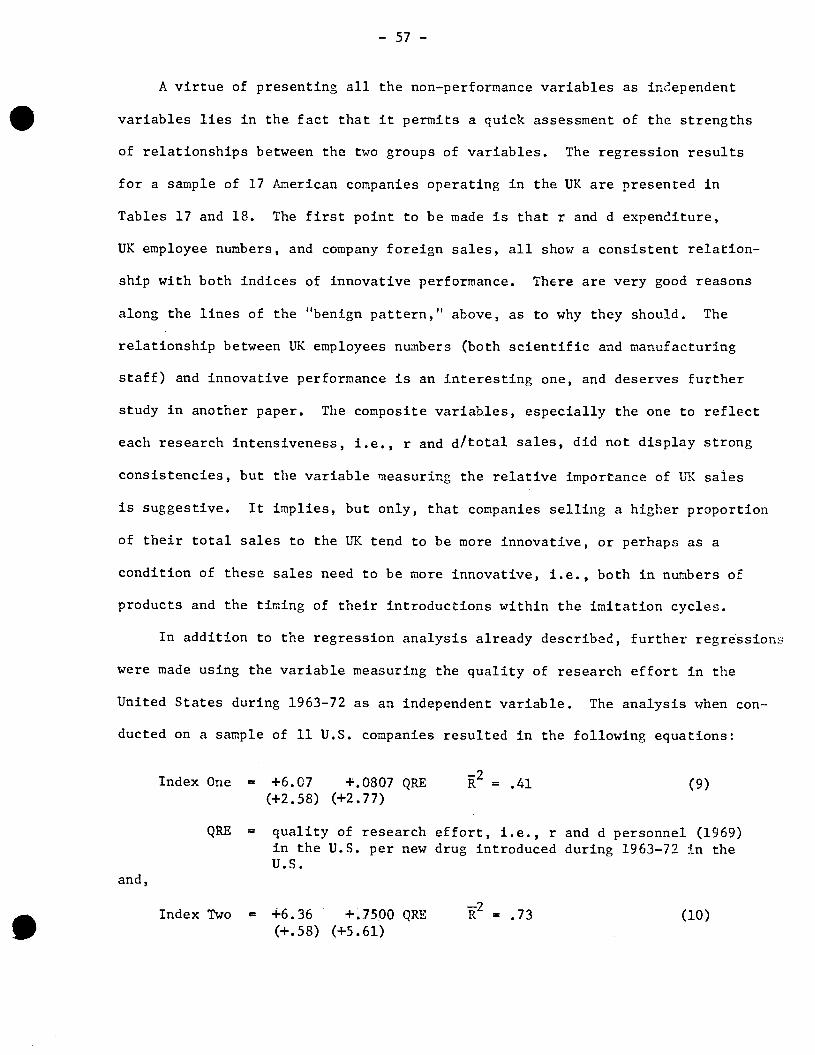
— 57 —
A virtue of presenting all the non—performance variables as independent
variables lies in the fact that It permits a quick assessment of the strengths
of relationships between the two groups of variables. The regression results
for a sample of 17 American companies operating in the UK are presented in
Tables 17 and 18. The first point to be made is that r and d expenditure,
UK employee numbers, and company foreign sales, all show a consistent relation-
ship with both indices of Innovative performance. There are very good reasons
along the lines of the "benign pattern," above, as to why they should. The
relationship between UK employees numbers (both scientific and manufacturing
staff) and innovative performance is an interesting one, and deserves further
study In another paper. The composite variables, especially the one to reflect
each research intensiveness, i.e., r and d/total sales, did not display strong
consistencies, but the variable measuring the relative importance of UK sales
is suggestive. It implies, but only, that companies selling a higher proportion
of their total sales to the UK tend to be more Innovative, or perhaps as a
condition of these sales need to be more innovative, i.e., both in numbers of
products and the timing of their introductions within the imitation cycles.
In addition to the regression analysis already described, further regressions
were made using the variable measuring the quality of research effort in the
United States during 1963—72 as an independent variable. The analysis when con-
ducted on a sample of 11 U.S. companies resulted in the following equations:
Index One = +6.07 +.0807 QRE = .41 (9)
(+2.58) (+2.77)
QRE = quality of research effort, i.e., r and d personnel (1969)In the U.S. per new drug introduced during 1963—72 In theU.S.
and,
Index Two = +6.36 +75OO QRE R2 = .73 (10)
(+.58) (+5.61)

TA
BLE
17
New
Pro
duct
In
trod
uctio
ns
by A
mer
ican
Companies
(Period Covered — 1
950 to 1973)
Dependent Variable: New ?roduct Introductions Either Under Patent or Licencing Agreement
mn
(17 Companies)
Form of
Dependent
Variable
Constant
Total
R&D
(1971)
UK
Sales
(1971)
Foreign
Sales
(1971)
Total
Sales
(1971)
R&D/Total
Sales
(1971)
UK/Foreign
Sales
(1971)
UK/Total
Sales
(1971)
UK
Employment
—2
H
Index One
+.15
(+.34)
+.0049
(+6.12)
0.73
ti +.153
(+4.36)
+.22
(4.64)
0.62
It +.0O5
(+5.08)
. +.022
(+4.12)
- 0.
64
'I +5.36
(+3.36)
+.005
(+4.61)
0.56
'I +
4,66
(+
1.48
) ,
0.23
(+
3.91
) ÷
14.0
0 (+
.37)
0.46
it +
.23
(+6.
05)
. ÷19.47
(+2.20)
0.30
" +
1.20
(+
5.36
) +321.3
(+2.41)
0.42 Ln
'

S.
TA
BLE
18
New Product Introductions by American Companies
(Period Covered — 1
950
to 1973)
Dependent Variable: Now Product Introductions Either Under Patent or Licencing Agreement
mn (17 Companies)
Form of
Dependent
Variable
Constant
Total
R&D
(1971)
UK
Sales
(1971)
Foreign
Sales
(1971)
Total
Sales
(1971)
R&D/Total
Sales
(1971)
tflc/Foreign
Sales
(1971)
UK/Total
Sales
(1971)
15K
Employment
2
R
Index Two
÷.783
(+3.86)
+.028
(+4.82)
0.68
" +.797
(÷3.36)
+1.26
(+3.93)
0.60
H
÷.029
(+4.26)
÷.108
(+2.94)
0.60
,, +.034
(+2.64)
÷.032
(+4.95)
0.57
" ÷21.21
(÷.98)
+1.48
(÷3.58)
+31.10
(÷.12)
0,40
" +1.20
(÷5.19)
+122.0
(+2.25)
0.40
" .
÷,23
(+6.31)
54.3
4 (+
2.54
) 0.35
UI

— 60 —
The inclusion of additional observations in the case of Index Two reduces
the R values in the case of Index Two very sharply so that with 14 observa-
tions .31 while l 27.08 and 2 = .536. A number of firms, particularly
Pfizer, William Warner, and Sterling—Winthrop excluded from equations (9) and
(10) above, appear to have been highly innovative despite a significantly lower
quality of research effort as measured by the variable QRE.16 The results
16The average QRE value for 14 companies including the three mentioned was
61.4 employees per new drug with a standard deviation of 38.9 employees. How-
ever, the average for these three companies was 25.7 employees.
otherwise support the conclusion that a high quality of research effort inwith
the United States is associated/ better market entry performance in the United
Kingdom.
In summary we can say that the evidence tends to support the concept of
the "benign pattern." American firms tend to introduce products into the
UK earlier than into the USA. Companies with a higher relative expenditure
on r and d and a higher quality of research effort in the United States tend
to be the leaders in introducing products within the UK imitation cycles.
b) The Competitive Response of British Companies. In what ways does the
entry of multinational companies into the host—country industry influence the
strategies or native companies? One possible view is that the large inter-
national company is primarily responsible for all the really major innovations
in the industry. This can be explained on the basis of their size, their
access to investment or research capital, the proprietary skills they possess
in marketing, in organizing for successful research and development, and in
carrying through the whole tangent of activities that go to make for commercial

— 61 —
success. Along these lines of thinking the host—country firms are generally
characterized as being responsive to the initiatives taken by the innovators,
the large international firms, who are very large because they know how to inno-
vate. An alternative view is that the large international companies, while
they hold a major share of the commercial markets in the host country, do not
necessarily lead it with their innovations, but in contrast make great use of
local initiatives taken to stimulate their own research and marketing efforts.
Along this argument the host—country firms could be the innovators from which
the large companies get their inspirations. Taken one step further, an argu-
ment might claim that when the larger firm innovates it is because it is led
rather than leader, but owing to its superior resource capabilities, power to
acquire, as well as develop, an idea, it has the greater ability to follow
through with commercial products at an earlier date.
It Is apparent from the figures of total r and d activity in the United
Kingdom that the British pharmaceutical industry spends considerably less
than the U.S. In 1972 it amounted to only L28 million compared to a U.S.
figure of $726 million or approximately ten times that amount.'7 Several
17See Wood [1973]. Direct comparisons of research expenditure are apt
to be misleading. In real terms UK spending is higher than implied. See
MacDonald [1973], pp. 477—494.
American companies, Lilly, Merck, Sharp and Dohme, Warner—Lambert, allocated
almost as much individually on r and d as the UK industry as a whole. In
1973 Roche claims to have spent $280 million on research and development,
and recently opened a 2 1/2 million UK research facility.

— 62 —
The value of having foreign subsidiaries in Britain as a stimulant to
host—country industry must take into account the extent to which this makes
the British industry increasingly dependent on foreign technology)8 Foreign
'8Dr. F. A. Robinson, president of the biomedical sciences division of
the British Association for the Advancement of Science, is one of several
authorities who view the current developments of the UK industry with alarm.
See Wood [19731.
companies have benefited from the liberal attitude of British firms towards
the publishing of scientific results, and by transnational activity have in-
creased their access to new ideas.19 There are signs that British companies
19The Welcome Foundation has long been transnational, while Id, Beecham,
Glaxo, and Fisons are emerging with international pharmaceutical operations.
See Pharmaceutical Industry Report, "Weilcome Sharpens Image, Doubles Profit,"
The Pharmaceutical Journal, January 17, 1970, pp. 62—3.
are raking greater Interest in an international approach to future research
and growth.2° Part of the strategy underlying British response to foreign
20American companies have found it especially useful to conduct clinical
testing from a UK laboratory, as well as using it as an outpost for scanning
European developments. See Shedden [1973], p. 48.
.
— 63 —
market—entry would appear to be by reciprocal investment in source—country
markets, particularly in the case of America. Many view the international
deployment of activities as a basic aspect of surviving, given the lead of
foreign competitors. Host—country companies, especially those that are not
capable of mounting a large research program, can eventually make use of a
proportion of the products originally introduced into the UK by foreign firms
for which patents have expired, but which have not been totally superseded.
Our work suggests that in the later stages of the product cycles (which make
up the imitation cycles), manufacturing cost and marketing tend to become in-
creasingly important aspects of competition while the uniqueness of individual
chemical entities is diminished through the increasing availability of combina-
tions and permutations of existing drugs representing no significant medical
advance.
The analysis that follows suggests the means toinnovation available to
the host—country firm. Let us suppose, for the moment, that because the costs
of developing really new chemical entities, i.e., those that would form the
basis of an imitation cycle, and that would go on to take a large share of
the relatively large markets, are very high, these are largely the prerogative
of the large international company. It is now fruitful to speculate as to
what products the local industry can survive on, or if fortunate, grow on.
By and large, we are probably forced to accept that host—country firms, at
least the bulk of companies, will be resigned to follow the lead of the inno-
vators, which, we assume, tend to be the larger firms in any significant product
area.
There are at least four types of imitative activity that can be undertaken
by late—corners. The first is the easiest, and involves simply finding those
products for which patent protection has run out, i.e., over 16 years old in the.
UK, such products as some of the barbitones, the early penicillins, many of the

— 64 —
plant drugs of the pre—war period, a number of sulfa drugs, and a few of the
post—war synthetics, and there are other possibilities. The imitator "simply
ascertains a more economical means for manufacturing or distributing these
products. In recent years, firms that have adopted this approach to market
entry have sometimes made use of the slow speed with which officialdom can
force the infringer of a patent to stop production. An imitator, of the less
scrupulous variety, can, if it wants, begin production and sales of a product
still under the legal protection of the patent. It needs only to calculate
the speed with which the courts can operate to stop its production, and to
see if this is longer than the duration of patent protection.
The second method of imitation is more resourceful, and requires that
the firm have sufficient know—how to be able to produce an already successful,
or tested, product, and in exceptional cases, an untried product, under a
ilcencing agreement. Such firms may be the subsidiaries of large international
companies but be relatively new to the industry. This can pose a problem for
the smaller firm that wants to produce under licence, since the licensor may
insist on previous production experience, or research and development capability,
that smaller firms tend not to have.
British—owned companies have made considerable use of the licencing facility
in their introduction of new chemical entities into the UK market. An estimate
of this method of participatIon Is given in Table 19. It is likely that the
method has just as much application in the case of direct imitations as in
introducing new entities for the first time. The estimates shown in Table 19
suggest that licences are, more or less, evenly distributed in number between
American and other foreign companies.
.

S
S
TA
BLE
19
Num
bers
of New Chemical Entities (of Study) Introduced Into the United Kinom b
y British—Owned Companies
Conditions of Introduction: Licencing or Internal R&D
Therapeutic Groups
Patent
Internal R&D
No
Expired
Patent
Patent
Under
•
with
A
mer
ican
Licencing Agreement
witn
Firm
Other Firms
TOT
1. Alimentary System
3
6
1
2
3
15
2. Cardiovascular System
6
4
1
5
4
20
3. Central Nervous System
8
6
0
10
8
32
4. Musculo—Skeletal Disorders
0
1
0
0
1
2
5. Hormones
5
5
0
2
2
14
6. Genito—Urinary System
0
0
0
0
0
0
7. Infections and Infestations
13
6
0
7
- 3
29
8. Respiratory System and
Allergic Disorders
5
3
0
3
6
17
9. Other (Carcinochemotherapy,
Surgical)
5
2
0
0
1
8
(Study)
Total
45
33
2
29
28
TT
C'
Lfl

— 66 —
The third form of imitative activity requires a fairly high level of re-
search and development capability. This is to scan the existing range of manu-
factured products, preferably those that are in large markets and are selling
well (under the patent period). It involves the firm deriving the same chemical
entity, but by a new chemical route, and a patentable one. Since many of the
larger firms try to guard against this type of imitation by finding and patenting
all the easy routes, the small firm that engages in this type of imitation needs
to know what it is doing, for the risks are great. Some of the products introduced
by BritIsh—owned companies involve this kind of imitative or innovative research
and development. Beecham, for example, was able to come up with the synthetic
penicillin, Penbritin, i.e.. ampicillin, and this involved finding the synthetic
route to penicillin.
The fourth form of imitative activity can require almost as much technical
skill as a major innovation, but generally represents a mid—way house between
the research of completely unchartered areas, and areas that are fairly well
known. It consists primarily in carrying out parallel research to that already
performed elsewhere and already resulting in a major innovation. The research
is based on the hope of finding a derivative or analog to the entity that has
been found (and probably tested before it is revealed). The "imitator" may
attempt to find a substitute for the discovery by means of a chemical entity with
the same site of action but of a dissimilar structure. This is not always
possible, depending on the uniqueness of the innovation.
Firms embarking on the fourth form of imitative research strategy will
usually have strong research teams competing with them. They may find nothing
of use, and a great deal to go through. Even when a suitable chemical entity
has been isolated, the firm will need to keep its momentum. When competing
against a larger firm in the same area, it may find the task of protecting its
discovery and creating a market for its product a major challenge.

— 67 —
Many of the innovations introduced by British companies have been by
research of the fourth type of "imitative activity described above. In Table 19
the numbers of new chemical entities introduced first by a British—owned company
are outlined. The success of host—country firms is noticeable in the infections
and infestations groups, i.e., antibiotics, antimalarials, anthelmintics, anti—
tuberculosis drugs.
Licencing has been an important means whereby British—owned companies intro-
duce a new chemical entity first into the UK market; however, the more important
route has been that of internal r and d. The greater use of licencing has come
with product introductions by British companies for chemical entities already
issued. A number of the new drugs introduced first by British companies have
not been under patent. These are rediscoveries of new uses for chemical entities
that are known, or chemical entities for which patent protection adds nothing
to the market life of the chemical entity,since, for example, it competes against
other readily available substitutes possibly superior, or it is of relatively
minor medical importance and small commercial value. We now turn to the product—
market activity of American companies in the UK pharmaceutical industry.
5. Positionsofcompanies WI In Imitation qe.sa) Characteristics of Leading Firms. The following analysis was based on
the record of 35 leading companies in UK ethicals markets as given in Table 20.21
leading company by our definition has, at least, an Index—One value of 5,
and an Index—Two value of 32.
There was considerable variation in the nationality of ownership for this group.
Of the 35 firms, 14 (40%) were American, 12 (34%) were British, and 9 (26%) European.
The five leading companies were Parke Davis of Warner—Lambert, CIBA, May and Baker

TABLF 20
The 35 Leading Companies in the Imitation Cycles
Index
Company
One
Index
Two
Average
Lag
(Years)
' Average
Performance
b
, U K
Employcesa
(1972)
U K
Nationality
Sales,
of
(1971)
Ownership
1. Parke Davis (Warner—Lambert)
17
138
L,.2E
.100
1,250
NA
American
2. CIBA
23
129
5.47
.062
6,000 (0)
35.0 (G)
Swiss
3.
May
an
d Baker
21
127
5.52
.076
6,700
34.6
French
4. Merck, Sharp and Dühme
18
120
•
4.38
.079
1,200
19.5
American
5. The Weilcome Foundation
15
114
3.57
.090
6,750
40.0*
British
6. Pfizer
21
111
6.93
.061
2,500
14.6
American
7. Roche
21
104
5.98
.050
NA
18.1
Swiss
8. Boots Pure Drug
20
101
5.76
.061
59,000 (G)
4.0*
British
9. Squibb
11
95
3.67
.100
700
6.1
American
10. British Drug Houses
12
93
3.07
.078
1,000
4.4
British
11. Sterling—Winthrop
18
88
6.94
.060
NA
30.7
American
12. Searle
12
I 88
4.42
.076
2,600
18.8
American
13.
14. Eli Lilly
Roussel—UCLAF
15
15
86
76
5.14
5.88
.072
.060
2,100
850
12.9
9.4
Anierican
French
15. Glaxo
19
75
5.78
.045
17,000 (c,)
25.0*
British
16. W. Warner
11
69
5.08
.077
NA
10.4
American
17.
18. Organon
Smith, Kline & French
9
12
:
69
59
3.09
4.92
.085
.059
500
770
3.6
7.4
Dutch
American
19. Wyeth
14
57
.
7.53
.045
NA
8.5
American
20. Riker
12
56
6.96
• .057
750 (0)
5.3
American
21. Medo Chemicals
8
54
4.92
.079
NA
NA
British
22. Smith & Nephew
11
51
7.14
: .056
NA
13.0
British
23. Beecham Labs
9
46
6.26
.063
14,380 (G)
26.0*
British
24.
25. Upjohn
Crookes Labs
11
7
45
44
7.21
3.51
.047
.082
. 390
25
0 3.
9 0.
9 American
British
26.
27. Schering A.G.
Hoechst A,G.
9
6.
43
43
4.40
4.44
. .059
.093
NA
700
: . 2.
9 6.0
West German
West Grman
28. ICI Pharmaceuticals
13
42
7.04
. .039
3,400
9•5*
British
29. Merrell
6
37
5.74
• .071
600
5.5
American
30. Distillers
4
37
1.27
.113
NA
NA
British
31. Wander
5
36
4.73
.084
800 (G)
10.4
Swiss
32. Allen & Hanbury
8
36
7.43
.057
1,870
11.2
British
33. Duncan Flockhart
5 34
4.82
.076
NA
NA
British
34.
35.
B. Ingelheim
Armour Chemicals
4
9
33
32
5.63
5.52
•
.105
.042
NA
NA
2.2
1.9
West German
American
C'
co
aCompanjes and company indices such as that of Dun &
*Estimat
NA = n
ot available.
(G) Data relates to group or associate companies.
Bradstreet.
b5
section 3a.
C co
mpa
nies
, Extract services.
.

— 69 —
of Rhone Poulenc, Merck, Sharp and Dohme, and The Weilcome Foundation. Each
had a value of 15 or more for Index One, measuring the frequency of imitation
activity, and 110 for Index Two, measuring the weighted total for each company's
market entries within imitation cycles.22
22As calculated according to the formulation in section 3a.
Entry Concentration. Of the 431 chemical entities introduced by the
leaders, 187 (43%) were from American subsidiaries, 131 (30%) from British
companies, and the remaining 113 (26%) from European firms. CIBA alone intro—
duced 23, almost one—fourth of the total number from European companies. To-
gether the three companies CIBA, May and Baker of Rhone Poulenc, and Roche
have accounted for almost 60% of the introductions from the leaders of European
firms. The contributions by American and British firms were more widely dis-
tributed with the largest values for individual members of each group being
not much greater than 10% of the American and 15% of the British leaders. The
concentration of market entries measured by Ipdex One suggests that European
firms were the most concentrated and American firms the least concentrated of
the groups.
Enty Positioning. The aggregate value of Index Two for the 35 leaders
was 2,468 and when divided according to nationality of ownership came to 1,081
(44%) American, 854 (35%) British, and 533 (21%) European. The concentration
of the European group was again apparent with CIBA, May and Baker of Rhone
Poulenc, and Roche comprising two—thirds of the European value. The three
leading American and British firms took 34% and 36% of their totals respectively.
— 70 —
Imitation Lags. Earlier we considered leads and lags associated with the
introduction of the same chemical entity into the United States and the United
Kingdom. In this section we consider for individual firms the lags that occur
following a major innovation in the UK and which leads to subsequent imita-
don within what we have defined as imitation cycles. Discussion of how these
lags are calculated has been given in section 3a.
The average imitation lag, which is measured according to the valuation
of ,23 of the 35 leaders given in Table 20 was 5.37 years. Of the same group
23See the note in section 3a, equation 4.
of firms the 14 American subsidiaries averaged 5.62 years, higher than either
of the British or European groups, with averages of 5.05 years and 5,02 years
respectively. The shortest average lags for individual firms were recorded
for Distillers, 1.27 years; British Drug Houses, 3.07 years; Organon, 3.09 years;
Crookes Labs, 3.51 years; The Welicome Foundation, 3.57 years; and Squibb, 3.67
years. As expected, the companies with lower values of Index rwo had longer
imitation lags on the average. The mean for the first ten leaders was 4.86
years, second ten, 5 57 years, and last 14 companies, 5 62 years, I e , excluding24
Distillers.
24lncluding Distillers the figure was 5.33 years.
Taking just the first five leaders of each nationality group, the British
companies did well with a mean of 4.62 years. The average lags for the first
five of American and European groups were 5.24 years and 5.19 years respectively.

— 71 —
Average Performance. Where the average performance of the leaders was
measured by the values for x, the measure of average performance weighted by
company positions within the imitation cycles (and accounting for the total
number of market entries),we found an overall average value of .0703. In the
case of the ten leading U.S. subsidiaries the average value was .0729; (higher
than the UK average value of .0705 (including Distillers) or .0650 (excluding
Distillers), but lower than the average value for European subsidiaries which
was .0734. Although it can be said generally that the larger leading firms
would tend to have better average performance values, it is also apparent that
small companies have innovated or led in imitation cycles. However, companywith
size is associate&/consistency of the firm over the longer period whereby pre-
vious successes are the basis for a growth in company sales.
b) American and Host—Country Comparisons. The analysis of this section
compares two groups of ten leading firms, one group American and the other
British,25 and is partly based on results given in Table 6. It was found that
25They are the ten leading firms in Tables 7 and 8 and as measured by
Index Two (see section 3a).
the average value of Index One for the American group was 15 and for the British
12.3. The American firms thus tended to be more active in introducing new
products into the IlK ethicals markets.26 Similarly, in the case of Index Two,
was also apparent that more of the American introductions were based
on internal research rather than licencing compared to the leading UK companies
(however, no data are given here).

— 72 —
American firms outperformed their British rivals with an average of 91.0
per firm; that of the host—country group was 65.4 per firm or 39.1% lower.
Leading American firms thus not only entered the markets with more new
products, but also tended to have better positions (numerically) for entries,
than British companies. The average lag for the ten leading American companies,
overall, was approximately 5.33 years, compared to 4.83 years (including Dis-
tillers) or 5.45 years (excluding Distillers) in the case of the leading UK
companies.
c) Positions of Other Foreign Copanies. The following analysis is based
primarily on the results for ten leading European firms operating in the United
Kingdom.27 The average value for Index One of these companies was 11.9,
27Aspro—Nicholas, which deserves special mention, recently decided to dis-
continue r and d activity in the UK. Its values for Index One and Two were 6
and 25 respectively, and its subsidiary, British Schering, 3 and 18.
marginally lower than that of the ten leading host—country firms. However,
the mean value for Index Two of this European group was 68.5 or 4.7% higher
than the ten leading UK firms. The average lag was 5.12 years, representing
the shortest for the three nationality groups.
The performance of this group of ten European firms representing four
countries was slightly better than that of ten leading UK firms (in terms
of numbers of introductions, positioning (numerically), and average imitation
lag. However, the concentration of activity by a few firms is more pronounced
within the European group.
.

— 73 —
6. Summarj and Conclusions
The influence of American and other foreign companies on the UK pharmaceu—
tical industry as a whole and on the performance of individual UK companies, has
been considerable. With its estimation and analysis of imitation cycles, our
study shows that the transfer of technology at the market level has stimulated
UK companies both to conduct research of a high quality and to perform competi—
tively within a very wide range of new drug technologies. Moreover, at the
production level, British companies have made great use of licenses from American
and other foreign companies in order to participate earlier within imitation
cycles, although the results of domestic research and development generally have
been adequate to meet the challenge of transnational market entry. Despite the
fact that leading American companies have on average performed better than their
UK counterparts, a number of British firms have maintained very high levels of
performance and have remained competitive.
The study succeeded in developing and estimating three types of imitation
cycle characteristic of ethical drug markets. It was marginally successful in
establishing an association between the composition by nationality or size group
of firms making up the imitation cycles and the time profiles of market entry.
In the case of the largest U.S. firms with foreign sales and the largest 20
international companies, there was a slight association, but not significant,
between numbers of these and the clustering of drug introductions. Larger
numbers of British and European companies had the effect, but not significant,
of lengthening the time profile of market entries.
A strong association was found to exist between innovative activity in
the UK and company sales. In the case of Index Two accounting for the frequency
and timing of new drug introductions, significant associations were also found
between it and size of U.S. r and d programmes measured in millions of U.S. dollars
and size of operation in the UK measured by UK employment. Furthermore, a variable

— 74 —
measuring the quality of r and d effort in the U.S. was strongly associated with
innovativeness in the UK.
American companies thus have been very active in the UK pharmaceuticals
industry, and for the post—1962 period, at least, they introduced many new
products into the UK market prior to market entry in America. Moreover, from
an analysis of 74 new chemical entities, it was discovered that the number of
drugs transferred appeared to have fallen as well as the length of the UK
leads for transnational market entry by U.S. and other companies (introducing
first in the United Kingdom). Various estimates of lags associated with inter—
firm and intra—firm technology transfer were made and it was concluded that
intra—firm transfers, as expected, generally were shorter.
Our study established that British companies have tended to rely fairly
heavily on foreign technology, both as a stimulus to domestic r and d activity
and as a source of know-how for marketable products. Moreover in terms of the
composition of the 35 leading firms in UK ethical markets, British companies
were not exceptional (34% being British). American and European companies
on the other hand were highly competitive. However, the activity of continental
European firms was concentrated in a few very substantial companies. It could
be concluded, nevertheless, that British firms were capable of carrying out the
full idea—to—market cycle necessary for independent market entry, and were also
capable of a quick response to innovationthrough the development of a competitive
product (or imitation).
The pressure on host—country firms to undertake research and development was
considerable. Local firms which were not innovative quickly lost their position
within the ethicals market. Competition between drug companies appears to be
intense though only a "moderate" proportion of market entry activity was truly
innovative. Rivalry between U.S. companies and other foreign companies as well
as host—country firms accelerates the rate of technology transfer within imitation

— 75 —
cycles. Although the overall number of new imitation cycles being created
appears to have diminished a few major companies are innovative despite the
general trend for a slower pace of new drug introduction.

76 —
Bibliography
Anplezweig, N., Steroid Drugs (McGraw—Mill, London), 1962, PP. 9—52.
Association of the British Pharmaceutical Industry (ABPI), SuppleffentayMemorandum of Evidence to the Committee to Examine the Patent Systemand Patent Law, December 1968.
Bailey, Martin N., 'Research and Development Costs and Returns: The U.S.Pharmaceutical Industry, Journal of Political Economy (January!February 1972), pp. 70—85.
Bathe, Peter, Major Expansion of ICI Pharmaceutical Production Capacity,"Manufacturing Chemist and Aerosol News, January 1972, PP. 44-45.
Belloc, Paola, "Assolutamente insufficienti l'innovazione e la ricencanell 'Industria Farnaceutica Italiana," Quadrante Scientifico,Quaderni ISRIL, Anno II, n 1, Gen.—Mar. 1971, PP. 43—53.
Bid, John and Yvonne Martin, 'Organic Synthesis as a Source of New Drugs,'in B. Bloom and G. Iiilyot, Eds. (1971).
Bloom, Barry 11., 'The Rate of Contemporary Drug Discovery," in B. Bloom and
C. Ullyot, Eds. (1971), pp. 176—184.
Eloom, B. and C. Ullyot, Drug Discovery, Science, and Development in a ChangingSoc (American Chemical Society, Washington, D.C.), 1971.
Burger, A., Medicinal Chemistry (Wiley—Tnterscience, New York), Parts 1 and 2,1970.
l3urstall, Mike, "Multinational Enterprises in the Pharmaceutical Industry,"OECD/EAG Working Paper, 1975/76 (unpublished).
Carpenter, J.G.D., 'Innovation in Chemical Structure in a Group of 267Recently Marketed Drugs" [referred to iii tile EDC Chemicals study (below)
as a private communication].
Cohen, Benjamin, Jorge Natz and William Beck, 'Innovation and Foreign InvestmentBehavior in the U.. Pharmaceutical Industry," NBER Working Paper 101,August 1975.
Cooper, M.H., Prices and Profits in the Pharmaceutical Industry (Pergamon
Press, Oxford), 1966.
CoDlanor, W.S., "Research and Technical Change in the Pharmaceutical industry,'Review of Economics and Statistics, May 1965, pp. 182—90.
Cox, William B., "Product Life Cycles as Marketing Models," Journal of Business,Vol. 40 (Oct. 1967), No. 4, Pp. 375—384.
.

— 77 —
Davey, D. G., "The Concern Over Drug Safety and Its Implications for theIndustry's Innovation and Growth," NEDO Conference (1973), PP. 31—42.
deHaen, Paul, New Products_Parade, Annual Review of New Drugs.
Douglas, R. D., "Commercial Implications of Patents for the PharmaceuticalIndustry," NEDO Conference (1973), pp. 20—30.
Farm, Peter, and Derek Riley, "The West European Pharmaceutical Industry,"(Eurofinance—Economic Research Department Report), 1971.
Fishburn, A. G., "Pharmaceutical Research Laboratories' Role," The PharmaceuticalJournal, Jan. 3, 1970, pp. 19—21.
Gay, Paul, "Automation Aids the Repeatability of Batch Process," ManufacturingChemist and Areosol News, Nov. 1973, pp. 44—45.
Grabowski, Henry G., "The Determinants of Industrial Research and Development:A Study of the Chemical, Drug, and Petroleum Industries," Journal ofPo1iticalEcono,, Vol. 76 (1968), pp. 292—366.
INS Pharmaceutical Market Letter, "Nicholas Closes its Major Research Unit,"Vol. 2, No. 23, June 9, 1975.
Jennings, John, "Government Regulations and Drug Development, FDA," in B. Bloomand G. Ullyot, Eds. (1971), PP. 247—256.
Kipling, Stewart W. and Robert H. Jones, "Marketing Strategies," in Teeling—Smith (1969), pp. 51—70.
Lake, Arthur, "Transnational Activity and Market Entry in the SemiconductorIndustry," NBER Working Paper 126, March 1976.
Lall, Sanjaya, "International Pharmaceutical Industry and Less—Developed
Countries," Oxford Bulletin_of Economics and_Statistics, Aug. 1974.
Lees, K. A., "Advances in Pharmaceutical Technology," The Pharmaceutical Journal,Feb. 21, 1970, Pp. 180—183.
MacDonald, A. S., "Exchange Rates for National Expenditures on Research andDevelopment," Economic Journal, June 1973.
McDonald, D. P., "Pharmaceutical Plant—A Question of Small Scale Equipment,"Manufacturj Chemist and Aerosol News, Aug. 1973, pp. 23—27.
Mansfield, E., J. Rapoport, and J. Schnee, "Innovation and Discovery in theEthical Pharmaceutical Industry," in Research_and Innovation in the ModernCororatjon (W. W. Norton, U.S.A.), 1971, pp. 187—185.
Markham, Jesse W., "Market Structure, Business Conduction and Innovation,"American Economic Review, Vol. 55 (May 1965), pp. 323—32.
Moxey, Patrick, "More Automation in Packaging Machines and Processes,"
Manufacturing Chemist and Areosol News, Sept. 1972, pp. 21—22.

— 78 —
NEDO (National Economic Development Office), Chemicals Economic DevelopmentCommittee, Innovative Actiytyjn the Pharmaceutical_Industry (H.M. S .0.,London), 1973.
______ Spe_ehsCiven at the NEDO Conf erence Held at the Royal Co liege ofPhysicians, London,_on3ryji, 1973.
OECD, Gaps in Technology—Pharmaceuticals, 1969.
Reekie, Duncan W., "Barriers to Entry and Competition," in Teeling—Sinith (1969),pp. 1—20.
_____ Economics of Innovation with Special Reference to the PharmaceuticalIndustry, Ph.D. Thesis, University of Strathclyde, 1969.
Ross, Walter, "The Prostaglandins are Coming," Readers Digest, July 1975, pp. 51—54.
Scheindlin, Stanley, "New Developments in Plant Drugs," American Journal_ofPharmacology, September—October 1964, pp. 216—226.
Sheddon, W.I.H., "The Global Deployment of Research and Development Resources,"NEDO Conference (1973), pp. 43—49.
Smith, C. Teeling, "Cost Effectiveness in Pharmaceuticals Research and Develop-ment," NEDO Conference (1973), pp. 1—13.
Smith, C. Teeling, Ed., Economics and Innovation In the Pharmaceutical Industry,Office of Health Economics, 1969.
Star, Steven H., "Pfizer International," in Vernon (1973), pp. 333—364.
Steele, Henry, "Patent Restrictions and Price Competition in the Ethical DrugsIndustry," Journal of Industrial Economics (July 1964), pp. 198—223.
Stockbrokers report, "Industry's Status May Deteriorate'," ChemIst_and Drug1st,March 20, 1971, p. 317.
Vernon, John H. and Peter Gusen, "Technical Change and Firm Size: The Pharmaceu—tical Industry," Review of Economics and Statistics, August 1974, pp. 294—302.
Vernon, R., "International Investment and International Trade in the Product
Cycle," Quy Journal of Economics, Vol. 80 (May 1966), pp. 190—207.
Wilson, C. 0., G. Grisvold and R. F. Doerge, Textbook of Organic,_Medicinal, and
Pharmaceutical_Ch (J. B. Lippincott Company, Philadelphia), 1971.
Wood, Robin, "Is Pharmaceutical Research in the U.K. Without a Future?",Manufacturing Chemist and Aerosol News , November 1973, p. 51; "TheIndustrial Slum," same, April 1973, p. 43.
Wor tzel, L • H., Technologyjansfer in the_Pharmaceutica1Industy, U.N • T .A. R., S1972.

1. Antacids2. Castro—intestinal sedatives3. Laxatives, purgatives and
lubricants4. Drugs acting locally on the
r ec turn
5. Antidiarrhoeals6. Pancreatic preparations
Cardiovascular System
7. Cardiac disorders
8. Anginal drugs and coronaryva sod i la tors
9. Peripheral vasodilators10. Anti—hypertensives11. Vasoconstrictors arid migraine
treatments12. Anticoagulants13. Miscellaneous cardio-
vascular drugs
Central Nervous System
—79 —
Analgesics and antipyreticsHypnoticsSedatives and tranquilizersAntidepressant sAnti—emetics and anti—nauseantsAnticonvulsantsRigidity and tremor controllersC.N.S. stimulants
Musculo—Skeletal Disorders
22. Non—steroid anti—inflammatory
drugs23. Muscle relaxants24. RUbefacients25. Neuromuscular drugs
Hormones
26. Conadal hormones and related
synthetic compounds27. Oral contraceptives28. Corticosteroids and related
drugs29. Trophic hormones and related
drugs30. Insulin preparations; hyper- and
hypo—glycaemcs31. Thyroid and antithyroid drugs32. Other hormones
Genito-Uriryys tern
33. Diuretics and antidiuretics34. Urinary anti—Infectives and anti-
spasmodic s35. Local and systemic drugs for
vaginal and urethral infections36. Drugs acting en the uterus
37. Sperinlcidal contraceptives
Infections and Infestations
38. Antibiotics39. Sulphonamides and other anti-
bacterial s
40. Antituherculous drugs41. Antileprocics42. Antifungals43. Anti—arnoebics44. Antimalarials45. Anthelmint!c.s and other anti—
infestive drugs46. Antivirals47. Vaccines
(continued)
TABLE Al
List of Theraneutic Groups1
A1imenySys tern
14.15.16.17.
18.
19.
20.
21.

— 80 —
TABLE Al (concluded)
Tonics: apet1te stimulants
Iron; erythro tropic drugsMineral and nutritional additivesVitamins
Anti—obesity drugsAnaholic drugsFood products
Resoiratorv System
55. Respiratory stimulants56 Bronchospasm relaxants57. Expectorants, cough suppressants,
niUcOlytics, decongestant
Ear,NoseandOrrnx
58. Local reactants on the nasopharynx
59. Oropharyngeal preparations60. Aural preparations
61. Anti—infective preparations62. Anti—Inflarrimatorv and anti—allergic
preparations (steroid and non—steroid)63. Glaucoma64. Mydratics and cycioplegics65. Diagnostic and miscellaneous
ophthalmic preparations
Allergic DIsorders
66. Anti—allergic drugs67. Desensitizing preparations
Skin
68. Soothing and protective preparations69. Keratolytics and cleansers70. Topical non—steroid antipruritic and
anti—inflammatory preparations71. Topical antifungal and anti—infestive
preparations72. Topical anti—infective preparations73. Psoriasis (non—steroid preparations)74. Acne (including steroid preparations)75. Topical steroid preparations76. Miscellaneous skin preparations
Metabolism
77. Carcino—chemotherapeutic drugs78. lirmunosuppressants79. Gout80. Poisoning and metabolic dysfunction
81. Drug dependence (tolerance, physiologicaland psychological dependence)
Surgical
82. Anaesthetics and agents for pre—medication
83. Surgical antibacterial84. Mucolytic, proteolytic and other
enzymes85. Plasma expanders86. Haemostatics
87. Surgical dressings
Diagnostic Agents
88. Same
1
Source: Monthly Index of Medicalecjjies (MIMS).
.
Nut ntion
48.
49•
50.51.
52.
53.
54.

TABLE AZ
The Sample of New C
hem
ical
Entities of Study Introduced into America and the United Kingdom
U.S
. D
ate of
U.K.
Date of
Therapeutic
Trade Name
Chemical Name
Group
Firm in
America
Intro—
ductior
Firm
in
United Kinp,doe
Intro—
ductior
Lag
(Months)C
1,
Eutonyl
pargyline
hypotensives
Abbott
2/63
Abbott
11/63
9
2.
Jectofer
iron sorbitex
hematinics
Astra (Sweden)
1/65
Astra—llewlett
10/61
(39)
3.
Citanest
prilocaine HC1
anesthetics
Astra (Sweden)
1/66
Astra
3/65
(9)
4.
Atroraid
clofibrate
cholestrol reduction
Ayerst (USA)
4/67
I.C.I.
3/63
(69)
5.
PolycIllin
ampicillin
penicillin
Bristol
12/63
Beecham
7/61
(29)
6.
Tegopen
cloxacillin
penicillin
Bristol
4165
Beecham
10/62
(30)
7.
Zyloprim
allopurinol
antiarthrftics
B. Wellcozie
9/66
Weilcome
6/66
(3)
8.
Tre
at
mot
hixi
ne li
d antispasrzodics
Dor
sey.
Sandoz
(Sw
itz.)
5/
64
Wan
der
11/6
2 (1
8)
9.
Syt
aotr
a1
aman
tadi
rie
antis
pasi
rodi
cs
flu Pont (USA)
12/66
Gei
gy
14/7
0 40
10.
Tri
sora
len
inet
hixe
ne H
C1
pigm
ent—
enha
ncer
E
lder
(U
SA)
3/65
W
ande
r 11
/62
(25)
11
. Lasix
furs
emid
e di
uret
ics
Hoe
chst
9/
66
Hoe
chst
12
/63
(33)
12.
Am
icar
Int
rave
.nus
ar
ninc
zipr
oic
acid
co
agul
ant
Led
erle
6/
64
AD
K
abi
(Sw
eden
) 12
/63
(6)
13.
Mya
mbu
tol
etha
mbu
tol
antit
uber
culo
sis
Lederle
12/67
Lederle
10/67
(2)
14.
Anhydron
cyclothiazide
diuretics
Lilly
11/63
CIBA
3/61
(33)
15.
OncovIn
vincristine sulfate
cancer chemotherapy
Lilly
7/63
Lilly
2/66
31
16.
Dymelor
0
acet
ohex
arild
e hypoglycaemic
Lilly
3/64
Lilly
9/62
(18)
17.
Aventyl HC1
nortriptyline
psychostirnulant
Lilly
1/65
Lilly
9/63
(16)
18.
liald
ol
halo
peri
dol
atar
axic
s M
cNei
l 6/
67
Sear
le
9/61
(6
7)
19.
Mucoziyst
acetylcysteine
mucolytiagent
Head Johnson (USA)
10/63
British Drug Houses
1/65
14
20.
Aldomet
nethyldopa
hypotensive
Merck Sharp & Dohme
1/63
Merck Sharp & Dohme
4/62
(9)
21.
Indocin
indomcthacjn
nntiinflarnatory
Merck Sharp & Dohme
6/65
Merck Sharp & Dohire
12/64
(6)
22.
Edecrin
ethacrynic acid
diuretics
Merck Sharp & Dohme
2/67
Merck Sharp & Dohme
10/65
(16)
23.
Mintezol
thiabendazole
anthelmintics
Merck Sharp & Pohme
7/67
Merck Sharp & Dohme
8/67
1
24.
Haxibolin
ethylestrenol
anabolics
Organon
7/64
Organon
1/62
(30)
25. Ponstel
infenamic acid
analgesic
Parke Davis
8/67
Parke Davis
11/63
(45)
26.
Vas—rneasles—K
vaccine
biologicals
Pfizer
6/63
Pfizer
3/66
33
27.
Rondomycin
methacycline ILC1
antibiotic
Pfizer
9/66
Pfizer
10/63
(35)
28.
Vibrainycin
doxycycline
antibiotic
Pfizer
9/67
Pfizer
1/68
4
(continued)
.

TABLE .
42
(continued)
.
U.S
. D
ate of
U.K.
Date of
Therapeutic
Trade Name
Chemical Name
Group
Firm in
America
Intro—5
ductlon
Firm in
b
United Kingdom
Intro_b
duotion
Lag
(Months)C
29.
Hiprex
methenamine
antibacterials
Riker
11167
Warner
9/65
(26)
30.
Dopram
doxaprain
analeptics
Robins
9/65
Robins
9/71
60
31.
Navane
i
thiothixene
antaraxics
Pfizer
9/67
Pfizer
10/67
1
32.
Quaalude
mechaqualone
sedative
Rorer
11/65
Roussl
9/65
(2)
33.
Afrln
oxnetazoline
nasal decongestant
Scharing (West Germany) 3/64
Allen & Hanbury
11/62
(21)
34.
Celestone
betamethasone
hormone
Roussel
3/65
Glaxo
2/6].
(50)
35.
Tinactin
tolnaf tote
dermatological fungi— Japan
3/65
Glaxo
10/66
19
dde
36.
Caramycin
gentamicin sulfate
antibiotics
Schering (West Germany)
6/66
5eherng (Australia)
7/66
1
37.
Candeptin
candicidin
topical fungicide
Schmid
11/64
J. Schmid (W. Germany) 8/67
33
33.
Flagyl
metronidazole
antibacterials
Searle
7/63
May & Baker
7/60
(36)
39.
Ovulen
hormone
birth control
Searle
5/66
Searle
12/63
(29)
40.
Dyreniurn
triamterene
diuretics
SKF
9/64
SKF
11/62
(21)
41.
Osnitrol
mannitol
diuretics
Travenol, Baxter (
USA)
6/64
Smith Miller Patch
5/65
11
42.
Serc
betahistine MCi
vasodilators
Unimed (
USA)
12/66
Duphar (Holland)
10/70
38
43.
Lincocin
lincomycin IIC1.
antibiotic
Upjohn
1/65
Upjohn
11/63
(14)
44.
Tolinase
tolazamide
hypoglycemics
Upjohn
7/66
Upjohn
4/65
(15)
45.
Solecen
tybamate
ataraxics
Wallace
5/65
Wallace
5/66
12
46.
Presate
chlorphentermir.e MCi
antiobesity
Warner
4/65
Upjohn
7/61
(4
5)
47.
Negram
nalidixic acid
antibiotic
Winthrop
3/64
Winthrop
9/63
(6)
43.
Taiwin
pentazocine
analgesic
Winthrop
7/67
Bayer Winthrop
4/67
(3)
49.
Sertax
oxazepan
antiaraxics
Wyeth
6/65
W
yeth
3/
66
9 50
. Velsapen
hetacillin
penicillin—derivative Bristol
1/71
Bristol
1/67
(48)
51.
moran
azathioprine
inmunosuppresant
Wollcorne
4/68
Welicorne
12/63
(52)
52.
Desferal Maysilate
deferoxamine mysilate
antidotes—chelating
CIBA
8/68
Wallace
10/64
(46)
agent
53.
Locorten
flumethasone bivalate
corticoids—local
CIBA
1/70
CIBA
4/65
(57)
54.
Rimactane
rifarnpin
antitubercular
CIBA; Dow
5/71
Lepetit (France)
10/70
(7)
55.
Tridesilon
desonide
cortiebids—local
Dome (Miles)
4/72
D
oma
(Mile
s)
2/72
(2)
56.
Aristospan
triancinolone
corticoids—local
Lederle
9/69
Squibb, Lederle
5/64
(64)
trexacetonide
57.
Loridine
cephalorLdin
antibiotics
Lilly
3/68
Glaxo
11/64
(40)
58.
C'apastat Sulfate
capreomycin
antituberculars
Lilly
9/71
Lilly
5/66
(64)
(continued)
.

TABLE A2
(concluded)
Trade Name
Chemical Name
Therapeutic
Group
Firm in
America
U.S.
Date of
Intro—
dUCiOfla
Firm
in
b
United Kingdom
U.K.
Date of
Introb
duction
Lag
(MOflhS)c
59.
Dar
von—
N
prop
oxyp
hene
ha
psyl
ate
anal
Ges
ic
Lill
y 10
/71
Dic
ta
(Lilly)
9/67
(49)
60.
Keflex
cephalexin monohydrate
antibiotics
Lilly
3/71
Lilly
2/70
(11)
61.
Inapaine
droperidol
antaraxics
McNeil
7/70
Janssen (Denmark)
9/68
(22)
62.
Meruvax
rubella vaccine
biologicals
Merck Sharp & Dohme
6/69
SKF
2/70
8
63.
Cortrosyn
cosyntropin (syn. ACTI!)
hormones
Organon (Holland)
8/71
CIBA (Switzerland)
9/66
(67)
64.
Pavulon
pancuroniun bromide
muscle relaxants
Orranon (Holland)
11/72
Orp,anon (Holland)
9/68
(51)
65.
Mlthracln
nithramycin
cancer chemotherapy
PfIzer
5/70
Pfizer
5/70
0
66.
Matulane
procarhazine
cancer chemotherapy
Roche
10/69
Roche
5/66
(61)
67.
Levodopa
levodopa
mus
cle
rela
xant
s Roche
6/70
Roche
8/70
2
68.
Ceoperi
carbenicillin
penicl1in
Roerlp (Pfizer)
8/70
Beecham
10/67
(34)
69.
Diapid
lypressin
ontidiuretics
Sandoz (Switzerland)
9/70
Sandoz (Switzerland)
5/63
(89)
70.
!Jrispas
flav
cxat
e H
C1
mus
cle
rela
xant
S}F
5/71
Syntex (Panama)
5/71
0
71.
Hydrea
hydroxyurea
leukemia
Squibb
1/68
Squibb
4/67
(9)
72.
Cytostar
cytarabino HC1
cancer
Upjohn
11/69
Upj
ohn
7/70
8
73. Clocin IIC1
clindamycin HC1
antibiotics
Upj
ohn
8/70
U
pjoh
n 12/71
16
74.
Talwin
pentazocine lICl
analgesic
Winthrop
2/69
Winthrop
4/67
(22)
a0 Haen.
bspe Data section.
cFigures in parentheses indicate U} lead, otherwise US lead.
.

— 84 —
TABLE A3
Numbers of New Chemical Entities (of Study) Introduced. Intothe United. Kingdom
First Issue Number Percentage(1950 — 1972)
1/1953 — 12/1957 145 27.8
1/1958 — 12/1962 183 35.1
1/1963 — 12/1967
1/1968 — 12/1972
117
51
22,6
10.0
.

— 85 —
TABLE A4
Numbers of New Chemical Entities (of Study) Introduced Thtothe United Kingdom
Therapeutic Groups Period(MIMS Classification) 1950—62 1963—72 1950—70
1. Alimentary System 25 10 I 35
2. Cardiovascular System 51 27 I 78
3. Central Nervous System 69 43 I 112
4. Musculo-.Skeletal Disorders 8 3 11
5. Horraones 48 17 I 65
6. Gonito—Urinary System 5 10 15
7. Infections and Infestation 75 33 I 108
8. Respiratory System, and AllergicDisorders
51 11 I 62
9. Other (Carcino—chemotherapy,Surgical)
21 14 I 351
(Study) Total 353 168 I 521

— 86 —
TABLE A5
Numbers of New Chemical Entities (or Study) Introduced. Intothe UK by Nationality of Company
Coverage: From January 1950 to December 1972
Nationality of Company Number Percentage
American 206 39.5
British 137 26.3
Swiss 70 13.4
French 37 7.1
German 25 4.8
Dutch 11 2.1
Italian 6 1.2
Swedish 5 1.0
Danish 3 0.6
Other 18 3,4
Total (Sample) 521 100.0
.
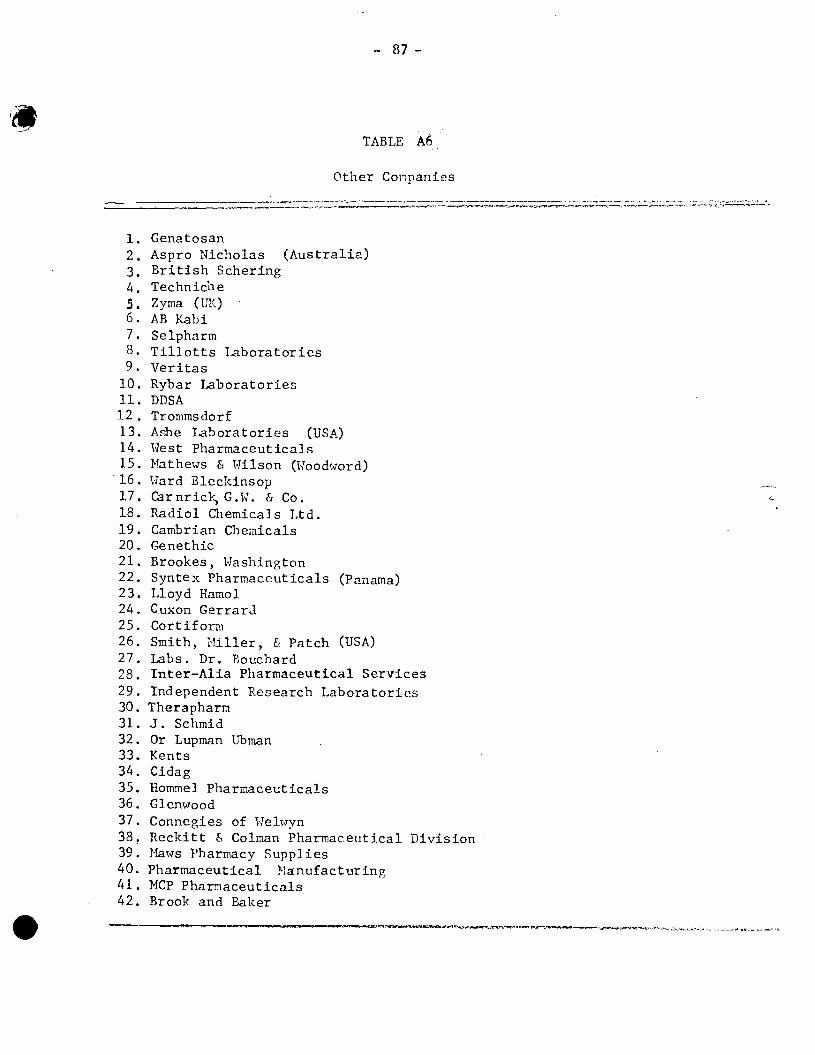
— 87 —
TABLE A6
Other Cormanies
1. Genatosan2. Aspro Nicholas (Australia)3• British Schering4. Techniche5. Zyma (UK)6. AB Kabi7. Seipharm8. Tillotts Laboratories9. Veritas10. Rybar Laboratories11. DDSA12. Trommsdorf13. Ashe Laboratories (USA)14. West Pharmaceuticals15. Mathews & Wilson (Woodword)16. Yard Bleckinsop17. Carnrick, G.W. & Co.18. Radiol Chemicals Ltd.19. Cambrian Chemicals20. Genethic
21. Brookes, Washington22. Syntex Pharmaceuticals (Panama)23. Lloyd Hamol24. Cuxon Cerrard25. Cortiform26. Smith, Miller, & Patch (USA)27. Labs. Dr. Bouchard28. Inter—Alia Pharmaceutical Services
29. Independent Research Laboratories30. Therapharm31. J. Schmid32. Or Lupman Ubman33. Kents34. Cidag35. Hommel Pharmaceuticals36. Glenwood37. Connegies of Welwyn38. Reckitt & Colman Pharmaceutical Division39. Maws Pharmacy Supplies40. Pharmaceutical Manufacturing41. MCP Pharmaceuticals42. Brook and Baker

ci
/0 90
80
70
60
50
40
30 0
First Issued
in the UK
FIGUPJi
Al
Reserpine and Synthetic Analogs
(Hypertensives)
52
53
54
55
56
57
58
59
60
61
62
63
Lognormal estimate
'C.
0
0
0
q C
e.
3(
0 x
Equation:
20
10
'C
in MS
=
1.57
6 +
0.
8913
z
(2 0
.91)
64
65
66
67
68
69
70
71

5'
100
90
70
.
Logriormal estimate
FIGURE A2
Antiemetics
C
60
50
Date Antihistamine
Derivative First
Issued. in the UK
e
Equation:
in MS =
1.91
7
58
59
60
61
62
63
80
x
'C
+
1.02
6 z
(2
0.86)
0
51
52
53
54
55
56
57
64
65
66
67
68
69
70
71
7

First Issued.
in the UK
FIGURE
A3
Penicillin V
(Antfbiotics)
0 54
55
56
57
58
59
60
61
62
63
64
65
66
67
68
69
70
71
72
73
. 0
L ognormal
x
100
90
80
70
60
50
40
30
20
10
0
e
Q
Equation:
in MS =
1.37
6 +
0.
9961
z
0
0
(2
0.93)
x

100
90
80
70
60
50
40
30
20
10
0
I FI
GU
RE
A
4
Ora
l Contraceptives
60
61
62
63
64
65
66
67
68
69
70
71
72
73
(2 0.92)
Lognormal estimate
First Issued
intheUK
x
Equ
atio
n:
in MS =
1.
301
+
0.92
83
z
x 0
x

Date Antihistamine
Derivative First
Issued in the UK
48
49
50
51
52
53
54
55
56
57
58
59
60
61
62
63
64
65
66
67
.
FIGURE A5
Anti?arkinon D
rugs
0
Lognormal estimate
e
100
90
80
70
60
50
40
30
20
10
0
e
x
.0
x
Equation:
in MS = 1.
335
+
0.97
26
z
(2
0.91)
e.