foreign assets and liabilities survey report file2.2.3 structure of the questionnaire ... 3.1...
TRANSCRIPT
1
FOREIGN ASSETS AND
LIABILITIES SURVEY REPORT
Balance of Payments Section
Statistics Division
Bank of Mauritius
August 2011

2
TABLE OF CONTENTS
List of Charts................................................................................................................ 3
List of Tables ................................................................................................................ 3
Foreword ....................................................................................................................... 4
EXECUTIVE SUMMARY ......................................................................................... 6
DEFINITIONS ............................................................................................................. 9
SECTION 1 ................................................................................................................ 12 INTRODUCTION ............................................................................................................ 12
1.1 Background .............................................................................................. 12
1.2 Objectives of the Survey .......................................................................... 12
1.3 Organisation of the Survey ...................................................................... 13
1.4 Organisation of the Report....................................................................... 14
SECTION 2 ................................................................................................................ 15 SURVEY SCOPE AND METHODOLOGY .................................................................. 15
2.1 Survey Frame ........................................................................................... 15
2.2 Survey Scope and Implementation Methodology.................................... 16
2.2.1 Training and Sensitisation ................................................................... 16
2.2.2 Survey Tool and Techniques ............................................................... 17
2.2.3 Structure of the Questionnaire ............................................................. 17
2.2.4 Data Entry, Processing and Analysis ................................................... 17
2.3 Response Rate .......................................................................................... 18
2.3.1 Response Rate by Sector ..................................................................... 19
2.4 General Information: Entity Accounting Periods .................................... 20
SECTION 3 ................................................................................................................ 21 FINDINGS AND ANALYSIS .......................................................................................... 21
3.1 Foreign Liabilities Stock and Flows ......................................................... 22
3.1.1 Foreign direct investment in Mauritius by sector ................................ 23
3.1.2 Portfolio Investment ................................................................................ 25
3.1.3 Private External Debt ........................................................................... 26
3.2 Foreign Assets Stock and Flows .............................................................. 30
3.2.1 Total Assets by Sector ......................................................................... 31
3.2.2 Direct Investment Abroad.................................................................... 31
3.2.3 Portfolio Assets .................................................................................... 33
3.3 Retained Earnings and Dividends Paid..................................................... 34
3.4 Retained Earnings and Dividends Received ............................................. 35
SECTION 4 ................................................................................................................ 36 COMPARISON WITH THE INTERNATIONAL TRANSACTION REPORTING
SYSTEM (ITRS) RECORDS .......................................................................................... 36 4.1 Foreign Direct Investment ....................................................................... 36
4.2 Direct Outward Investment...................................................................... 38
4.3 Private Sector External Debt ................................................................... 39
4.4 Preliminary Observations ........................................................................ 39
SECTION 5 ................................................................................................................ 41 FALS 2011 ......................................................................................................................... 41

3
List of Charts
2.1 Survey Response
2.2 Response Rate by ISIC
3.1 Type of debt as a proportion of Foreign Liabilities
3.2 Composition of Private External Debt by Maturity
3.3 Type of Claims as a proportion of Foreign Assets
List of Tables
2.1 Returned Questionnaire by ISIC
2.2 Entity Financial Statements End-Periods
3.1 Foreign Assets and Liabilities
3.2 Foreign Liabilities Outstanding for 2008 and 2009
3.3 Foreign Direct Investment in Mauritius
3.4 Equity Foreign Direct Investment in Mauritius by Source Country
3.5 Stock of Portfolio Investment Liabilities by Sector
3.6(a) & (b) Stock of Private External Debt by Type and Sector as at 31 December
2008 and 31 December 2009
3.7(a) & (b) Private External Debt Transactions by Type of Debt as at 31
December 2008 and 31 December 2009
3.8(a) & (b) Private External Debt Transactions by Sector as at 31 December 2008
and 31 December 2009
3.9 Foreign Assets Outstanding for 2008 and 2009
3.10 Foreign Assets Outstanding by Sector
3.11 Stock of Direct Investment Abroad by Sector – Equity Holdings
3.12 Stock of Direct Investment Abroad by Sector and by Type
3.13 Stock of Direct Investment Abroad by Geographical Destination
3.14 Stock of Portfolio Investment Assets by Sector
3.15 Retained Earnings Due to and Dividends Paid to Non-Residents
3.16 Retained Earnings Due to and Dividends Received by Residents
4.1(a) & (b) Comparison of ITRS Banking Records and Survey Data for Foreign
Direct Investment Inflows during 2008 and 2009
4.2(a) & (b) Comparison of ITRS Banking Records and Survey Data for Foreign
Direct Investment Outflows during 2008 and 2009
4.3(a) & (b) Comparative data on Private Sector External Debt for 2008 and 2009
4.4(a) & (b) Grossed-up FDI in Mauritius for 2008 and 2009

4
Foreword
The Bank is responsible for the preparation of the balance of payment
accounts and the external assets and liabilities position of Mauritius. The Bank is
empowered under 51A of the Bank of Mauritius Act 2004 to require any person to
furnish such information and data as it may require for fulfilling its responsibility.
Failure to comply with this requirement is an offence.
The Bank currently uses an international transaction reporting system (ITRS),
which records cash transactions that pass through domestic banks, as its primary data
source for the compilation of balance of payments (BOP) statistics. Over time,
however, the use of the ITRS as a comprehensive data source has diminished with the
increasing complexity of financial account transactions. Moreover, because it is a
cash transaction-based reporting system, it cannot provide information on the
country’s position of foreign assets and liabilities. The latter, known in the
International Monetary Fund (IMF) statistical jargon as a country’s International
Investment Position (IIP), is a prescribed data category in the IMF’s Special Data
Dissemination Standard (SDDS) to which Mauritius is seeking to subscribe by the
end of 2011.
Reflecting these concerns and in line with international best practice as well as
with the recommendations from the International Monetary Fund’s technical
assistance missions, the Bank has embarked on a statistical programme to improve its
data sources for the collection of BOP statistics. The main objective is to encourage
direct data reporting through a survey-based approach. In this respect, the Bank had
conducted an exploratory Foreign Assets and Liabilities Survey (FALS) in November
2007 but did not disseminate the results to the public.
In April 2010, the Bank launched a second survey (FALS 2010), which
requested selected enterprises, other than banks and real estate firms, to report
transactions and stock data on external assets and liabilities for calendar years 2008
and 2009. The main findings of the FALS 2010 are presented in this report. The
response rate of 68 per cent, which was a big improvement on the 2007 survey but
5
still insufficient by internationally acceptable standards, is a major explanatory factor
of the under-measurement of both foreign direct investment (FDI) and portfolio
investment when compared with the imputed stock position derived from the flow
data of banking returns. Despite these shortcomings, the survey exercise has enabled
the Bank to come up with preliminary hard data on reinvested earnings, trade credit,
and private external debt, among others, which the current system of BOP data
reporting was unable to identify.
The Bank takes this opportunity to thank the respondents who provided
information for the FALS as well as the participants in the sensitisation workshops
for their observations and contributions. The Bank reiterates its obligation to uphold
the confidentiality of entity-specific information. The Bank undertakes not to publish
such information without the written consent of the enterprise. The data presented in
the report are in aggregated form and where there is a high risk of indirect or residual
disclosure of confidential information, the information has been deliberately withheld
and a “c” inserted for confidential in line with international practice.
The survey data will be incorporated in the revised BOP statistics and the
International Investment Position statement for 2008 and 2009. While public or
private use of the survey results is encouraged for analysis and research purposes, the
data presented in the report should not be interpreted as official statistics until such
time that the revised BOP and IIP statistics are published.
Head – Statistics Division
Bank of Mauritius
August 2011

6
EXECUTIVE SUMMARY
In April 2010, the Bank of Mauritius undertook the second FALS, which covered
data for the years 2008 and 2009. The survey, similar to the first FALS (FALS 2007)
launched in November 2007, was aimed at gathering information on resident
enterprises’ claims on non-residents and their liabilities to non-residents.
FALS 2007 was an important step in the development of a survey-based approach to
measure foreign assets and liabilities of enterprises. FALS 2007 was treated as an
exploratory survey (ES). The results of FALS 2007, of which a poor response rate of
around 55 per cent (of the 132 enterprises in the survey frame), were below
expectations. Out of 73 respondents, only 48 enterprises (66 per cent) reported
foreign assets and/or liabilities. These 48 enterprises along with the non-respondents
were retained in the business register for FALS 2010 while the 25 respondents, which
did not report any foreign assets and/or liabilities, were removed from the register.
Efforts were stepped up for FALS 2010 to identify enterprises which were likely to
hold foreign assets and liabilities, and an additional 88 new enterprises were
identified. The survey frame was increased to 195 enterprises.
The FALS 2010 was launched on 9 April 2010 and a press communiqué was posted
on the Bank’s website to create public awareness while pre-survey sensitisation
meetings were held at the Bank. The workshop was aimed at providing background
information on the underlying BOP concepts and methodology as well as on the
purpose of the survey. The Bank invited representatives from all the 195 enterprises
surveyed of which 85 attended the sensitisation meetings. In all, the Bank hosted 15
sensitisation meetings.
The main survey tools, i.e., the questionnaire and the accompanying guidelines, were
mailed out to the 195 enterprises with the provision that they could return the
completed questionnaires electronically. Nearly all enterprises have reported
electronically and have attached their annual reports or financial statements with the
completed questionnaires. In some cases, respondents filled more than one
questionnaire for subsidiaries that were not included in the survey frame, which
eventually brought the number of enterprises surveyed to 204.

7
For the FALS 2010, 138 questionnaires were received reflecting a response rate of 68
per cent. At the official closing date of the survey on 30 April 2010, the response rate
was only 18 per cent. A reminder followed on 21 May 2010 and the response rate
increased to 30 per cent. Follow-up reminders by phone calls raised the response rate
to 68 per cent, higher than the 55 per cent attained for the FALS 2007.
Data entry, validation, processing, and analysis were conducted by staff of the BOP
section in the Statistics Division. A second technical assistance mission under the
GDDS II External Sector Module visited the Bank in September-October 2010 and
worked closely with the staff to validate the data in a sample of completed
questionnaires.
Data in the reporting forms were adjusted in conjunction with the financial statements
and annual reports of some of the enterprises. Several validation routines were
carried out on the data to check for consistency by country, sector, type of debt and
retained earnings. Data gaps were filled in certain cases based on financial statements.
For certain components within the foreign assets and foreign liabilities, for direct
investment in particular, the ITRS provided superior results relative to the survey
results largely because of the sampling and non-response. In certain economic
sectors, however, the survey results yielded better estimates. The difference could be
due to a mix of factors, including possible misclassification of sectors in the banking
records and under-reporting.
Despite the low response rate of 68 per cent, the survey results showed superior
coverage over the ITRS on some data categories such as private external debt flows
and trade credit. Direct data reporting indicated higher private sector external debt
stocks for both 2008 and 2009. However, the diverging data sets on disbursements
and capital repayments were of much greater concern given their different
implications for the domestic economy. The survey results provided evidence of
significant under-coverage of private external debt.
As a first concluding remark, it seems that the way forward for the Bank in the
collection of BOP financial account data is to retain the ITRS while carrying out
surveys in parallel rather than abandoning one in favour of the other.

8
The FALS 2011 calling for end-December 2010 foreign assets and liabilities position
and transactions data for the year 2010 will be launched shortly. The FALS
questionnaire has been amended, based on the recommendations of Mr. Simon Quin,
IMF Expert, when he visited the Bank in September 2010.
Among the changes proposed to the FALS 2011 questionnaire is the treatment of
fellow enterprises. On outward direct investment, lessons drawn from the analysis of
responses point to the need for greater clarity in the FALS questionnaire to enable
respondents to report data for each subsidiary abroad on the basis of the accounts of
the subsidiary. This would help in providing a more accurate picture of the stock of
outward direct investment held by the parent company residing in Mauritius and
enable the calculation of retained earnings for the BOP.
Although the FALS 2010 Questionnaire called for reverse direct investment data
(when a subsidiary has claims on the parent company) with regard to debt claims, no
provision was made to include reverse direct investment in the form of equity
holdings of the subsidiary in the parent company. This omission has been addressed
in the FALS 2011 Questionnaire.
The classification of debt instruments was changed to bring it in line with BPM6 and
to ensure a more accurate reporting of total external debt. The opportunity was also
taken to simplify reporting by requiring that the valuation of the stock of
shareholders’ capital be reported at book values only (i.e., following the accounting
practice of the enterprise) rather than reporting both book and market values as in the
FALS 2010. The request for supplementary data at market values can be revisited in
later surveys.
The new Questionnaire is intended to support the participation of Mauritius in the
IMF’s Coordinated Direct Investment Survey (CDIS) and will be tabled for
discussion with participating enterprises at the sensitisation meetings following the
launch of FALS 2011.
9
DEFINITIONS
Book Value:
Refers to historical cost of authorised and issued share capital plus any share
premium reserves, retained earnings, and any other reserves also referred to as
Shareholder funds.
Direct Investment:
Direct investment is a category of international investment between a resident and a
non-resident in which the investor (the direct investor) acquires a lasting interest in,
or a significant degree of influence on the management of, an enterprise in another
economy (the direct investment enterprise). In practice, a direct investment link is
established between the two parties involved (a resident and a non-resident) when the
direct investor owns 10 percent or more of the ordinary shares or voting power (for an
enterprise incorporated locally), or the equivalent (for an enterprise not incorporated
locally). Once a direct investment link is established, all financial transactions
occurring between the two parties involved should be classified under direct
investment; in the absence of such a link, all financial transactions should be
classified under portfolio investment and other investment. Direct investment
comprises equity capital, reinvested earnings and other capital such as inter-company
loans.
Direct investment enterprise:
A direct investment enterprise is an entity subject to control or a significant degree of
influence by a direct investor. In some cases, a single entity may be a direct investor,
a direct investment enterprise, and a fellow enterprise depending on the different
relationships it has with other enterprises.
Dividends:
Income on equity in an enterprise based on equity participation.
Equity:
Shares in enterprises and equivalent ownership interest in an enterprise (branches).

10
Fellow enterprises:
Fellow enterprises are those enterprises that are under the control or influence of the
same immediate or indirect investor, but neither fellow enterprise controls or
influences the other fellow enterprise. Often the direct investor and fellow enterprises
are all in different economies, but sometimes the direct investor is in the same
economy as one of the fellow enterprises (in which case, it is not a direct investor in
that fellow enterprise). This situation is more likely to arise in economies that do not
use a local enterprise group as the statistical unit for direct investment purposes.
Foreign assets:
Claims on non-resident enterprises/ institutions.
Foreign liabilities:
Obligations to non-resident enterprises/ institutions.
Market value:
The amount of money that a willing buyer pays to acquire something from a willing
seller based on commercial consideration only.
Non-equity:
All other financial instruments including loans, bonds, money market instruments,
currency and deposits
Non-resident:
An individual (enterprise) is a non-resident if his/her principal residence (main centre
of economic interest) is in a country other than Mauritius. Mauritius branches and
subsidiaries of non-resident companies are residents of Mauritius. Similarly, foreign
branches and subsidies of Mauritius companies are non-residents. Exceptions are
embassies, consulates, military bases, scientific stations, information or immigration
offices, aid agencies, and central bank representative offices with diplomatic status.
Portfolio Investment:
Portfolio investment is defined as cross-border transactions and positions involving
debt or equity securities, other than those included in direct investment or reserve
11
assets. In practice, portfolio investment pertains to equity holdings of strictly less than
10 per cent in an enterprise.
Resident:
An individual or enterprise ordinarily living or operating (or intends to live or
operate) in Mauritius for one year or more. In other words, the centre of economic
activity is in Mauritius regardless of the nationality of the individuals or shareholders.
Retained Earnings:
Investment or shareholder’s income on equity net of taxes that is not distributed
during a particular accounting period.
Securities:
Securities are debt and equity instruments that have the characteristic feature of
negotiability. That is, their legal ownership is readily capable of being transferred
from one unit to another unit by delivery or endorsement. While any financial
instrument can potentially be traded, securities are designed to be traded, usually on
organized exchanges or “over the counter.”
Trade credit:
Commercial credit extended by exporters to importers and prepayment made by
importers to exporters.

12
SECTION 1
INTRODUCTION
1.1 Background
In April 2010, the Bank of Mauritius undertook the second FALS, which covered
data for the years 2008 and 2009. The survey, similar to the first FALS launched in
November 2007, was aimed at gathering information on resident enterprises’ claims
on non-residents and their liabilities to non-residents.
By virtue of section 51A(1) and section 51A(2) of the Bank of Mauritius Act 2004,
the Bank has the responsibility for the preparation of the balance of payment accounts
and the external assets and liabilities position of Mauritius and is empowered by law
to require, by notice in writing, any person to furnish, within such time and in such
form and manner as the Bank may determine, such information and data as the Bank
may require for fulfilling its responsibility. The Bank has also the obligation to
preserve confidentiality and in that respect, it presents and publishes results generated
from the survey in aggregate form.
The law also makes provision to sanction non-compliance. Section 51A(5) of the
Bank of Mauritius Act states that any person who fails to comply with a requirement
under subsection 51A(2) and knowingly furnishes information which is false or
misleading in any material particular; or wilfully or recklessly withholds any material
information, shall commit an offence and shall, on conviction, be liable to a fine not
exceeding 50,000 rupees for each day on which the offence occurs or continues.
1.2 Objectives of the Survey
This survey exercise covers cross-border financial transactions between residents and
non-residents and helps establish a reporting system for these transactions. The
objectives of the survey are highlighted below:
(a) To collect information on private financial flows, stocks and related income
variables from entities in Mauritius, which have significant foreign assets and

13
foreign liabilities. The focus is on investment made by non-residents in
Mauritian entities (foreign liabilities) as well as on investment made by
Mauritian entities abroad (foreign assets);
(b) To determine statistically the scale and nature of these private financial flows;
(c) To provide baseline data for addressing the issue of data gaps in our BOP and
hence improve statistical coverage;
(d) To compile a complete IIP statement that will give the stock of foreign assets
and liabilities of Mauritius.
1.3 Organisation of the Survey
FALS 2007 was an important step in the development of a survey-based approach to
measure foreign assets and liabilities of enterprises. The results of FALS 2007, of
which a poor response rate of around 55 per cent (of the 132 enterprises in the survey
frame), were below expectations. Some of the shortcomings of FALS 2007 have been
addressed in FALS 2010 while the other issues would be addressed at a later stage.
Survey Frame
The survey frame used for FALS 2007 had a significant number of enterprises
without foreign assets and liabilities and that affected the outcome of the survey. To
address this problem, more effort was put in for FALS 2010 to identify enterprises
which were likely to hold foreign assets and liabilities. Enterprises, which did not
report any foreign assets or liabilities in FALS 2007, were removed from the frame.
The survey frame was increased to 195 enterprises. While the Statistics Division
recognises that the sampling method may be inadequate, it is also aware that this
problem cannot be addressed unless a census is carried out to obtain the population of
enterprises having foreign assets and liabilities, which is currently beyond scope.
Pre-Survey Meetings
The low response rate for FALS 2007 was also partly due to the lack of pre-survey
high-level sensitisation meetings and field work, including meeting with the people
filling in the questionnaire, to encourage enterprises to respond. Following the launch
of FALS 2010 in April 2010, the Bank invited all 195 enterprises, out of which 85
14
responded positively, to sensitisation meetings. In all, the Bank conducted 15
sensitisation meetings.
Survey Method
While many developing countries undertaking such surveys make use of enumerators
for delivery of questionnaires and for collection of completed questionnaires, the lack
of budgetary and human resources were the main constraints hindering the Bank from
employing enumerators. Instead a mail-out system was used, which included the
option of completing and returning questionnaires electronically. Nearly all
enterprises have reported electronically and have enclosed their annual reports or
financial statements with the completed questionnaires. The problem with a mail-out
system is that it takes longer to process and resources have to be employed to send
out follow-up reminders. Overall, the response rate improved and reached 68 per
cent. Finally, there were major improvements in streamlining processes for data
management and analysis.
1.4 Organisation of the Report
The report is divided into 5 sections, structured as follows: Section 1 introduces the
Report. Section 2 explains the survey scope, methodology and outcome in terms of
response rate. The survey results are analysed in Section 3. Section 4 provides a
comparison between the survey results and the data from banking records. Section 5
highlights the new features as well as the changes made in the survey questionnaire
for FALS 2011.

15
SECTION 2
SURVEY SCOPE AND METHODOLOGY
This section presents the methodology which includes sampling, survey instruments,
data processing and analytical techniques.
2.1 Survey Frame
A survey frame is at the foundation of every survey program. To start with, the survey
frame is based on a business register that has been regularly populated and maintained
primarily from four different sources as demonstrated in Figure 1.
Figure 1: Data sources used to maintain the business register
Unlike other statistical surveys which randomly select a sample from a known
population, the Bank used judgement sampling to develop its business register for
both FALS 2007 and FALS 2010. This type of sampling technique is more
appropriate and less resource-intensive when the population is not known. Potential
enterprises with foreign assets and liabilities were identified, based on information
Press Articles
Top 100
Companies
2009 Edition
of Business
Magazine
Board of
Investment
Banking
Records
Business
Register;
Central Survey
Frame

16
collected over time in the compilation of the balance of payments and expert
judgement. The process of updating the business register is ongoing and relies heavily
on the sources of information identified in Figure 1.
FALS 2007 was treated as an exploratory survey (ES). The ES showed that out of 73
respondents, only 48 enterprises (66 per cent) reported foreign assets and/or
liabilities. These 48 enterprises along with the non-respondents were retained in the
business register for FALS 2010 while the 25 respondents, which did not report any
foreign assets and/or liabilities, were removed from the register. In view of the survey
results, which showed that coverage of specific areas of business activity was
inadequate when compared with the current database derived from banking returns,
an additional 88 enterprises were identified. The selection process of these enterprises
was carried out at two levels, namely clustered and stratified. Thus, business entities
from different industry classification1 (cluster) were selected from the existing
database and categorized by the known size of investments (stratified) according to
flow data culled from banking records. Given resource constraints, the frame was
limited to the 195 entities.
2.2 Survey Scope and Implementation Methodology
The survey is designed to collect data on:
1. General entity data, amongst others, location, shareholding structures, sector
(industrial classification); and
2. Flow and stock data for calendar years 2008 and 2009 on foreign assets and
liabilities (FAL) between residents and non-residents.
2.2.1 Training and Sensitisation
The FALS 2010 was launched on 9 April 2010 on the Bank’s website and a press
communiqué2 was posted on the Bank’s website to create public awareness, while
pre-survey sensitisation meetings were held at the Bank. The workshops were aimed
to provide the enterprise surveyed with the background information on the underlying
BOP concepts and methodology as well as the purpose of the survey.
1 Industry classification is based on the structure of the fourth revision of the United Nations’
International Standard of Industry Classification (ISIC 4.0) 2 Refer to Appendix 1

17
2.2.2 Survey Tool and Techniques
The main survey tool is the questionnaire
3 and its accompanying guidelines, which
were discussed at the sensitisation meetings. The survey questionnaire was designed
with the assistance of the IMF technical experts and the objective was to collect basic
data on foreign assets and liabilities. The questionnaire is a semi-structured self
administered questionnaire.
2.2.3 Structure of the Questionnaire
The questionnaire comprises of three main sections:
Section 1: Characteristics of the enterprise.
This part ensures that all respondents provide general information on their companies
mainly for the purpose of updating and maintaining the database.
Section 2: Investment in your enterprise.
This section obtains information on the market/book value of the enterprise, non-
resident equity holdings of the company by way of purchases or sales of shares,
source country, related profitability as well as details on debt liabilities (external
borrowing) to non-residents.
Section 3: Investment by your enterprise abroad.
In this section, respondents are required to provide details on assets holdings and
retained earnings in non-resident entities as well as claims on non-residents.
2.2.4 Data Entry, Processing and Analysis
Data entry, validation, processing, and analysis were conducted by staff of the BOP
section in the Statistics Division. A second technical assistance mission under the
GDDS II External Sector Module visited the Bank in September-October 2010 and
worked closely with the staff to validate the data in a sample of completed
questionnaires.
3 Refer to Appendix 2.
18
Data in the reporting forms were adjusted in conjunction with the financial statements
and annual reports of some of the enterprises. Each officer was responsible for a
specific sector to ensure follow-up with the respondents whenever there were issues
that required more information.
Several validation routines were carried out on the data for consistency by country,
sector, type of debt and retained earnings. Data gaps were filled in certain cases based
on financial statements.
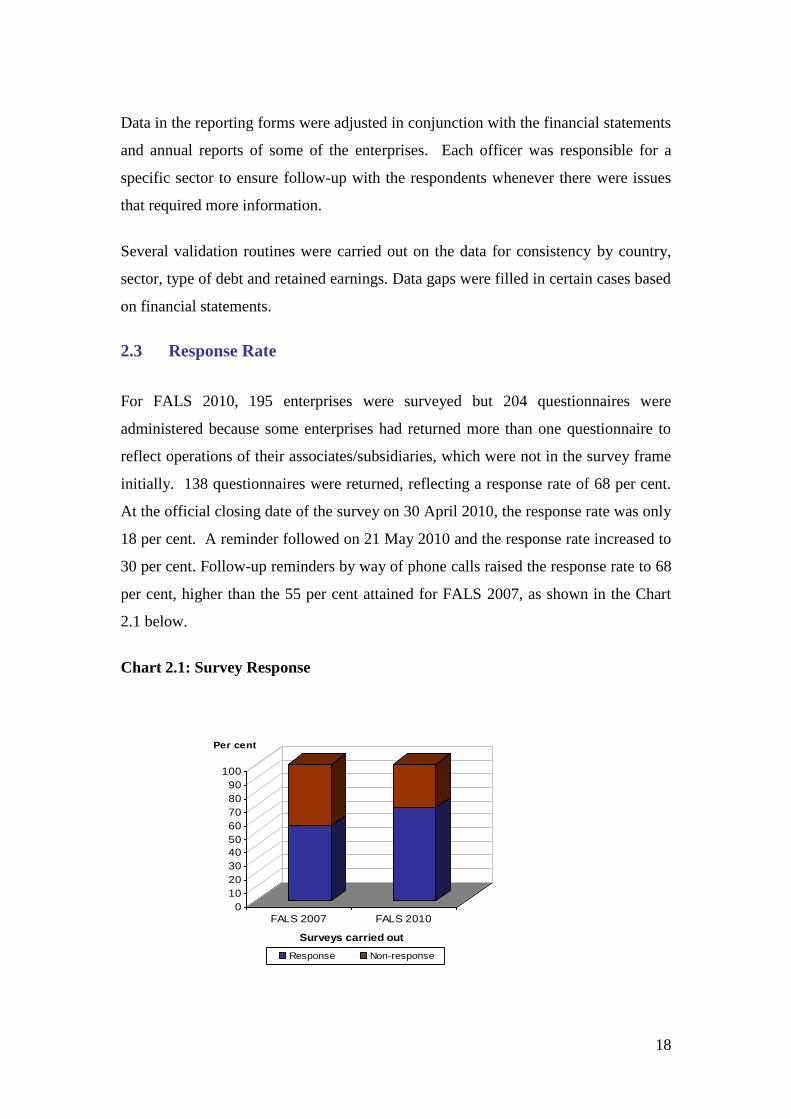
2.3 Response Rate
For FALS 2010, 195 enterprises were surveyed but 204 questionnaires were
administered because some enterprises had returned more than one questionnaire to
reflect operations of their associates/subsidiaries, which were not in the survey frame
initially. 138 questionnaires were returned, reflecting a response rate of 68 per cent.
At the official closing date of the survey on 30 April 2010, the response rate was only
18 per cent. A reminder followed on 21 May 2010 and the response rate increased to
30 per cent. Follow-up reminders by way of phone calls raised the response rate to 68
per cent, higher than the 55 per cent attained for FALS 2007, as shown in the Chart
2.1 below.
Chart 2.1: Survey Response
0
10
20
30
40
50
60
70
80
90
100
Per cent
FALS 2007 FALS 2010
Surveys carried out
Response Non-response

19
2.3.1 Response Rate by Sector
The industry classification used for FALS 2010 is not strictly comparable with FALS
2007 because the structure has been recast based on the International Standard of
Industrial Classification (ISIC) Rev. 44, which has replaced the ISIC Rev. 3.1 used
previously. Table 2.1 shows the number of questionnaires dispatched, collected and
the percentage response by sector.
Table 2.1: Returned Questionnaire by ISIC (Number of Entities)
A Agriculture, forestry and fishing 7 6 4 86
C Manufacturing 45 34 25 76
D Electricity, gas, steam and air conditioning supply 1 1 1 100
F Construction 7 6 4 86
G Wholesale and retail trade; repair of motor vehicles 33 19 13 58
H Transportation and storage 24 23 17 96
I Accommodation and food service activities 22 13 9 59
J Information and communication 11 6 4 55
K Financial and insurance activities 32 22 16 69
P Education 1 1 1 100
Q Human health and social work activities 3 1 1 33
R Art, entertainment and recreation 4 1 1 25
S Other service activities 14 5 4 36
204 138 100 68
Response
Rate
(per cent)
Percentage of
Total
Returned
DescriptionEntities
Administered
Entities
Responded
Sector
(ISIC 1
digit)
TOTAL
Chart 2.2: Response Rate by ISIC (Per cent)
8676
100
70
5896
59
60
68
100
33 25 38
A
C
D
F
G
H
I
J
K
P
Q
R
S
4 Details on ISIC Rev. 4 are available on United Nations Statistics Division website at
http://unstats.un.org/unsd/cr/registry/isic-4.asp.

20
2.4 General Information: Entity Accounting Periods
Out of the 138 respondents, 63 per cent had their accounting year ended 31
December, while the rest had different accounting year-ends, as shown in Table 2.2.
Given that 37 per cent of the entities had their accounting year-end other than 31
December, the financial statement figures from these entities were taken “as is” to
provide for the closest estimates for 31 December position, as opposed to adjusting
their financial positions to match the required 31 December-end period. For such
entities and wherever possible, the respondents were requested to provide figures
from their respective management accounts.
Table 2.2: Entity Financial Statements End-Periods
31 March 9 7
30 April 1 1
30 June 27 19
30 September 13 9
31 October 1 1
31 December 87 63
Total 138 100
End-PeriodNumber of
Entities
Percentage of
Total
21
SECTION 3
FINDINGS AND ANALYSIS
This section presents the findings on flows and stock of foreign assets and liabilities
attributable to the entities that responded to the survey. Direct investment data
reported in Table 3.1 are not comparable with the official BOP statistics because the
survey frame excludes banks and the real estate sector, i.e. RES/IRS projects, and the
survey low response rate.
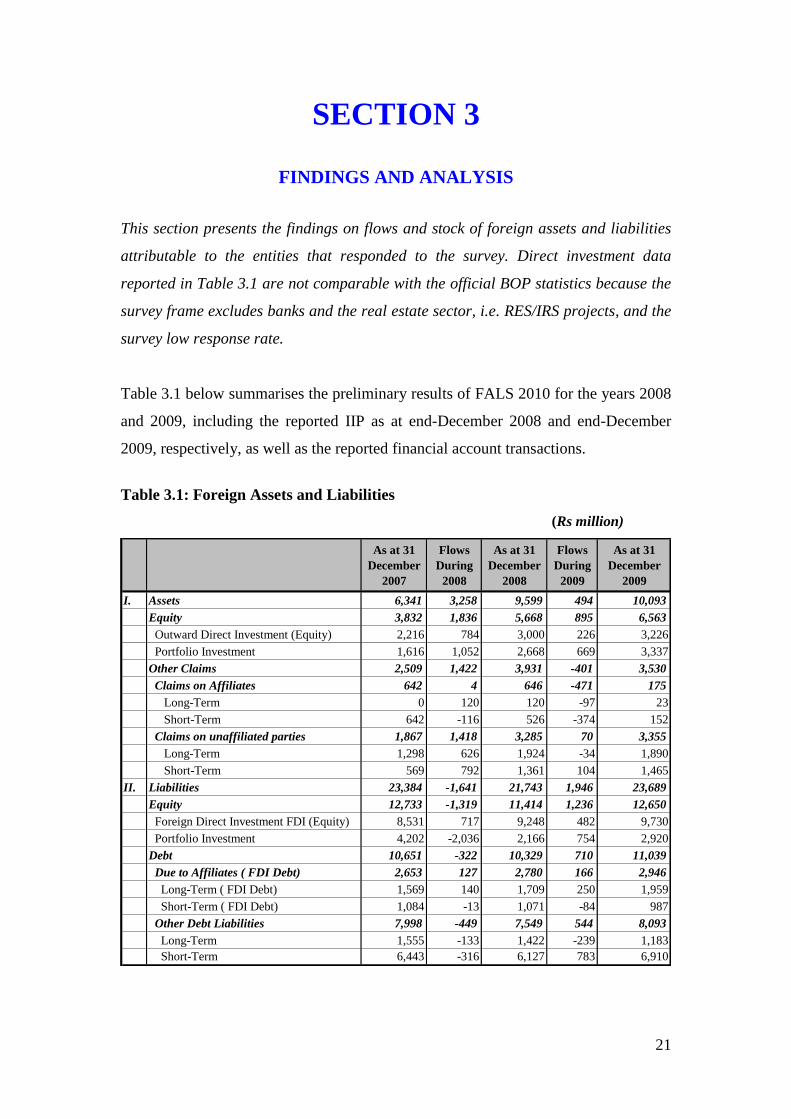
Table 3.1 below summarises the preliminary results of FALS 2010 for the years 2008
and 2009, including the reported IIP as at end-December 2008 and end-December
2009, respectively, as well as the reported financial account transactions.
Table 3.1: Foreign Assets and Liabilities
(Rs million)
As at 31
December
2007
Flows
During
2008
As at 31
December
2008
Flows
During
2009
As at 31
December
2009
I. Assets 6,341 3,258 9,599 494 10,093
Equity 3,832 1,836 5,668 895 6,563
Outward Direct Investment (Equity) 2,216 784 3,000 226 3,226
Portfolio Investment 1,616 1,052 2,668 669 3,337
Other Claims 2,509 1,422 3,931 -401 3,530
Claims on Affiliates 642 4 646 -471 175
Long-Term 0 120 120 -97 23
Short-Term 642 -116 526 -374 152
Claims on unaffiliated parties 1,867 1,418 3,285 70 3,355
Long-Term 1,298 626 1,924 -34 1,890
Short-Term 569 792 1,361 104 1,465
II. Liabilities 23,384 -1,641 21,743 1,946 23,689
Equity 12,733 -1,319 11,414 1,236 12,650
Foreign Direct Investment FDI (Equity) 8,531 717 9,248 482 9,730
Portfolio Investment 4,202 -2,036 2,166 754 2,920
Debt 10,651 -322 10,329 710 11,039
Due to Affiliates ( FDI Debt) 2,653 127 2,780 166 2,946
Long-Term ( FDI Debt) 1,569 140 1,709 250 1,959
Short-Term ( FDI Debt) 1,084 -13 1,071 -84 987
Other Debt Liabilities 7,998 -449 7,549 544 8,093
Long-Term 1,555 -133 1,422 -239 1,183
Short-Term 6,443 -316 6,127 783 6,910

22
3.1 Foreign Liabilities Stock and Flows
The survey results indicate that foreign liabilities transactions decreased by Rs1.6
billion during 2008 but increased by Rs1.9 billion in 2009. This resulted into a
growth of the stock of foreign liabilities of around 9.0 per cent from Rs21.7 billion as
at end-December 2008 to Rs23.7 billion as at end-December 2009.
The decrease in the stock of foreign liabilities as at end-December 2008 was mostly
on account of significant outflows recorded under portfolio investment. Table 3.2
shows position and flow data for the different components within foreign liabilities.
Table 3.2: Foreign Liabilities Flows and Outstanding for 2008 and 2009 (Rs million)
Interestingly, the survey results, summarised in Table 3.2, reveal that enterprises have
both short-term and long-term external debt - a breakdown, which was not captured
by the ITRS. The stock of short-term external debt largely exceeded the stock of
long-term external debt. Transaction-wise, the respondents seemed to be relying more
on short-term debt finance and less on long-term. The stock data on portfolio
investment even at book value reported by the respondents were significantly lower
than the actual data for all the three years.
Chart 3.1 shows the stock of foreign liabilities by component. Of the total amount
reported, around 40 per cent represented inward FDI while 30 per cent was in the
form of short-term debt at year-end for 2007 through to 2009. Portfolio investment
represents the smallest share of foreign liabilities for 2008 and 2009 while as at end
of December 2007, long-term borrowing was the lowest.
Equity 12,733 -1,319 11,414 1,236 12,650
Inward FDI (Equity) 8,531 717 9,248 482 9,730 Portfolio Investment 4,202 -2,036 2,166 754 2,920 Debt 10,651 -322 10,329 710 11,039 Long Term 3,124 7 3,131 11 3,142 Short Term 7,527 -329 7,198 699 7,897 TOTAL 23,384 -1,641 21,743 1,946 23,689 * Transactions during the year = Purchases during the year less Sales during the year plus any revaluation during the yea.r
Transactions during 2009*
As at 31 December
2009
As at 31 December
2007
Transactions during 2008*
As at 31 December
2008
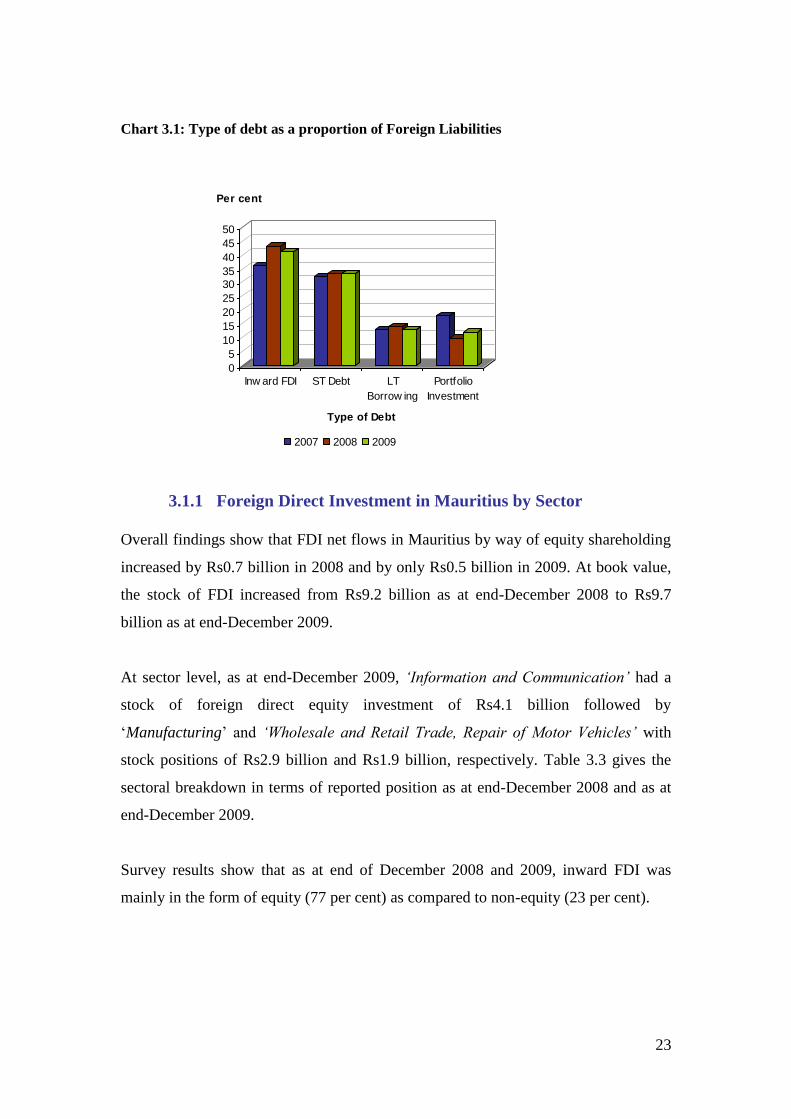
23
Chart 3.1: Type of debt as a proportion of Foreign Liabilities
0
5
10
15
20
25
30
35
40
45
50
Per cent
Inw ard FDI ST Debt LT
Borrow ing
Portfolio
Investment
Type of Debt
2007 2008 2009
3.1.1 Foreign Direct Investment in Mauritius by Sector
Overall findings show that FDI net flows in Mauritius by way of equity shareholding
increased by Rs0.7 billion in 2008 and by only Rs0.5 billion in 2009. At book value,
the stock of FDI increased from Rs9.2 billion as at end-December 2008 to Rs9.7
billion as at end-December 2009.
At sector level, as at end-December 2009, ‘Information and Communication’ had a
stock of foreign direct equity investment of Rs4.1 billion followed by
‘Manufacturing’ and ‘Wholesale and Retail Trade, Repair of Motor Vehicles’ with
stock positions of Rs2.9 billion and Rs1.9 billion, respectively. Table 3.3 gives the
sectoral breakdown in terms of reported position as at end-December 2008 and as at
end-December 2009.
Survey results show that as at end of December 2008 and 2009, inward FDI was
mainly in the form of equity (77 per cent) as compared to non-equity (23 per cent).

24
Table 3.3: Foreign Direct Investment in Mauritius
(Rs million) per cent (Rs million) per cent
A Agriculture, forestry and fishing - - c c
Equity - c
Non-Equity - -
C Manufacturing 2,820 24 2,889 23
Equity 2,624 2,636
Non-Equity 196 253
D Electricity, gas, steam and air conditioning supply c c c c
Equity c c
Non-Equity - -
F Construction c c c c
Equity c c
Non-Equity - -
G Wholesale and retail trade; repair of motor vehicles 2,341 20 1,873 15
Equity 1,180 1,081
Non-Equity 1,161 792
H Transportation and storage 296 2 232 2
Equity 149 116
Non-Equity 147 116
I Accommodation and food service activities 1,286 10 1,713 13
Equity 276 308
Non-Equity 1,010 1,405
J Information and communication 3,449 29 4,131 33
Equity 3,306 3,988
Non-Equity 143 143
K Financial and insurance activities 744 6 991 8
Equity 744 991
Non-Equity - -
P Education c c c c
Equity c c
Non-Equity c c
Q Human health and social work activities c c c c
Equity c c
Non-Equity - -
S Other service activities c c c c
Equity c c
Non-Equity - -
12,028 100 12,676 100
Equity 9,248 77 9,730 77
Non-Equity 2,780 23 2,946 23
ShareAs at 31
December 2009Share
TOTAL
Sector
(ISIC 1
digit)
Description
As at 31
December 2008
A "c" for confidential is inserted to protect the confidentiality of data.
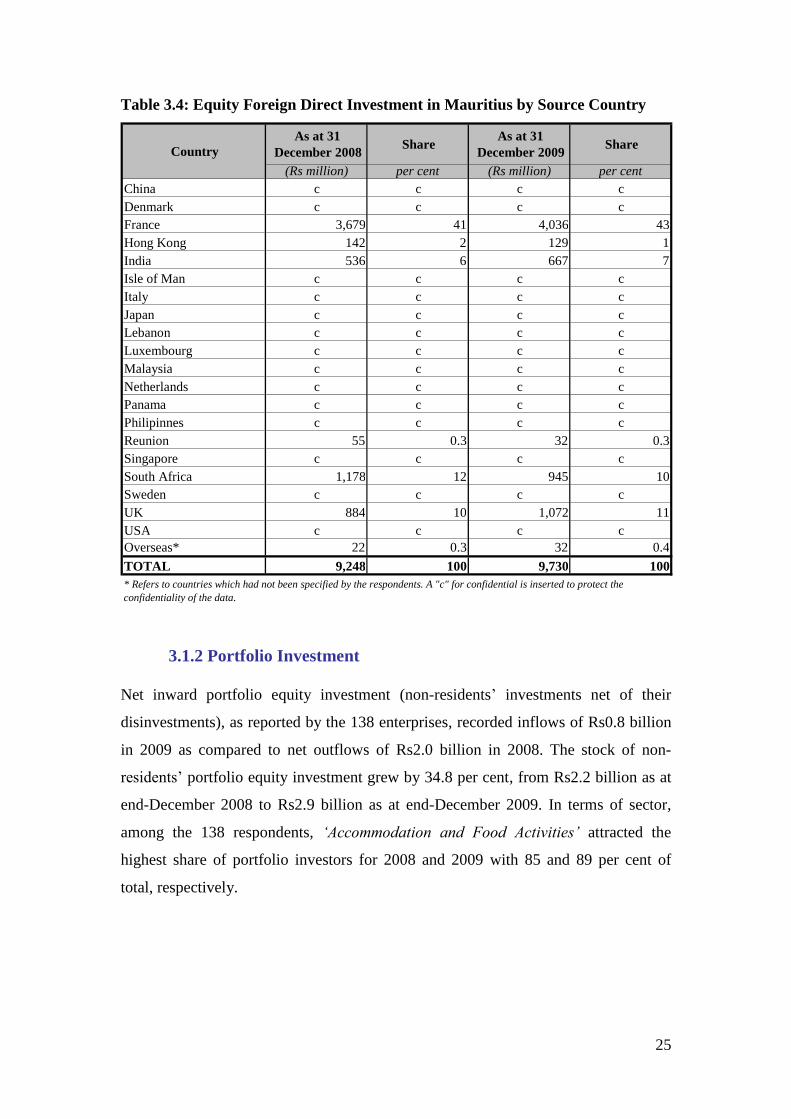
France was the main source of inward FDI in the form of equity participation in both
2008 and 2009, accounting for respective share of 41 per cent and 43 per cent. United
Kingdom and South Africa were other important sources of equity FDI in Mauritius
with 11 per cent and 10 per cent, respectively, of total as at end-December 2009.
Table 3.4 below gives the geographical source of FDI in Mauritius.
25
Table 3.4: Equity Foreign Direct Investment in Mauritius by Source Country
3.1.2 Portfolio Investment
Net inward portfolio equity investment (non-residents’ investments net of their
disinvestments), as reported by the 138 enterprises, recorded inflows of Rs0.8 billion
in 2009 as compared to net outflows of Rs2.0 billion in 2008. The stock of non-
residents’ portfolio equity investment grew by 34.8 per cent, from Rs2.2 billion as at
end-December 2008 to Rs2.9 billion as at end-December 2009. In terms of sector,
among the 138 respondents, ‘Accommodation and Food Activities’ attracted the
highest share of portfolio investors for 2008 and 2009 with 85 and 89 per cent of
total, respectively.
(Rs million) per cent (Rs million) per cent China c c c c Denmark c c c c France 3,679 41 4,036 43 Hong Kong 142 2 129 1 India 536 6 667 7 Isle of Man c c c c Italy c c c c Japan c c c c Lebanon c c c c Luxembourg c c c c Malaysia c c c c Netherlands c c c c Panama c c c c Philipinnes c c c c Reunion 55 0.3 32 0.3 Singapore c c c c South Africa 1,178 12 945 10 Sweden c c c c UK 884 10 1,072 11 USA c c c c Overseas* 22 0.3 32 0.4
TOTAL 9,248 100 9,730 100
Share Country
As at 31 December 2008
Share As at 31
December 2009
* Refers to countries which had not been specified by the respondents. A "c" for confidential is inserted to protect the
confidentiality of the data.

26
Table 3.5: Stock of Portfolio Investment Liabilities by Sector
(Rs million) per cent (Rs million) per cent
C Manufacturing 77 3.6 77 2.6
G Wholesale and retail trade; repair of motor vehicles 11 0.5 11 0.4
H Transportation and storage 147 6.8 97 3.3
I Accommodation and food service activities 1,843 85.1 2,601 89.1
K Financial and insurance activities 87 4.0 132 4.5
Other 1 0.05 2 0.1
2,166 100 2,920 100
Figures may not add up due to rounding
Share
As at 31
December
2009
Share
TOTAL
Sector
(ISIC 1
digit)
Description
As at 31
December
2008
In terms of geographical origin, most of the enterprises surveyed did not specify the
source country of the portfolio investment. For those enterprises that reported the
country of origin, France and the United Kingdom were the main sources of portfolio
investment in Mauritius.
3.1.3 Private External Debt
The 138 enterprises reported a stock of private sector external debt, which declined
by 3.0 per cent, from Rs10.7 billion (US$368 million) as at end-December 2007 to
Rs10.3 billion (US$317 million) as at end-December 2008. The decline was mostly
due to higher net repayments of other debt liabilities. As at end-December 2009,
private external debt outstanding (including debt of FDI entities) had reached Rs11.0
billion (US$360 million). The increase of 6.9 per cent was largely attributable to
higher short-term ‘other debt’ liabilities to non-affiliates and long-term debt liabilities
to affiliates. In US dollar terms, the stock of private external debt fell by 13.8 per cent
as at end-December 2008 relative to end-December 2007, but showed an increase of
13.6 per cent as at end-December 2009.
By type of debt, liabilities to affiliates as a percentage of total private external debt
increased from 26.1 per cent in 2008 to 26.5 per cent in 2009. Trade credit to non-
resident unaffiliated enterprises remained virtually unchanged at around 21.1 per cent
for both years, while the share of other external debt liabilities owed to non-resident
unaffiliated enterprises as a percentage of total private sector external debt decreased
marginally from 52.8 per cent in 2008 to 52.5 per cent in 2009.

27
Chart 3.2: Composition of Private External Debt by Maturity
Tables 3.6(a) and 3.6(b) provide the breakdown by sector and by type of debt as at
end of December 2008 and 2009.
Table 3.6(a): Stock of Private External Debt by Type and Sector as at 31 December
2008
(Rs million)
A B D E
C Manufacturing 196 1,294 86 - 1,576
G Wholesale and retail trade; repair of motor vehicles 1,161 196 - - 1,357
H Transportation and storage 147 32 4,315 - 4,494
I Accommodation and food service activities 504 3 243 420 1,170
J Information and communication 143 19 183 - 345
S Other service activities - 500 - - 500
Other 123 141 623 - 887
2,274 2,185 5,450 420 10,329
Sector
(ISIC 1
digit)
TOTAL
TotalDescriptionType of Debt
Table 3.6(b): Stock of Private External Debt by Type and Sector as at 31 December
2009 (Rs million)
A B D E
A Agriculture, forestry and fishing - 272 - - 272
C Manufacturing 253 1,118 102 - 1,473
G Wholesale and retail trade; repair of motor vehicles 792 164 - - 956
H Transportation and storage 116 29 4,785 - 4,930
I Accommodation and food service activities 892 - 55 489 1,436
J Information and communication 143 11 134 - 288
K Financial and insurance activities - - 218 - 218
S Other service activities - 619 - - 619
Other 237 111 499 - 847
2,433 2,324 5,793 489 11,039 TOTAL
Sector
(ISIC 1
digit)
DescriptionType of Debt
Total
A. Affiliated Enterprises: Borrows and/or receives trade credits from non-resident affiliated enterprises that hold 10% or more
of your enterprise’s shares or equivalent or is owned by another enterprise which has such a holding in your enterprise.
“Affiliates” (also known as associated or related enterprises) are enterprises in a direct investment relationship and include parent companies, branches, associate companies, subsidiaries, etc.
B: Trade Credit from non-affiliated enterprises: Receives commercial trade credits from unaffiliated exporters or
prepayments made by unaffiliated importers. “Non-affiliates” are non-resident entities, which have less than 10 percent equity in your enterprise (including those with zero) or vice versa.
D: Other Borrowing (Non-Marketable): This comprises borrowings from non-resident non-affiliates and includes instruments
like financial leases, mortgages and loans. A financial lease is a means by which the lessee finances the purchase (as opposed to taking out a loan for the purchase) of the good.
E: Liabilities to affiliated enterprises abroad: This comprises funds placed by affiliated enterprises abroad with their parent
company in Mauritius.
0 2,000 4,000 6,000 8,000
10,000 12,000
Rs million
2008 2009 Year
Short- term Long- term

28
During 2008, total disbursements of private external debt exceeded total repayments
but significant differences were noted across the debt portfolio with repayments to
unaffiliated enterprises exceeding disbursements. During 2009, significant
disbursements of loans in excess of repayments between unrelated entities, i.e., debt
of type D, more than offset the higher repayments relative to disbursements effected
for debt of types A, B, and E. Foreign currency valuation losses, as reported by the
138 enterprises, although lower than in 2008, also contributed to reduce the external
debt in rupee terms. Tables 3.7(a) and 3.7(b) provide details on the above.
Table 3.7(a): Private External Debt Transactions by Type of Debt as at 31
December 2008 (Rs million)
A 2,610 2,264 -295 51
B 2,325 2,348 -8 -31
D 1,248 1,298 -299 -349
E 50 43 0 7
TOTAL 6,233 5,953 -602 -322
Type of Debt Disbursement Repayment
Foreign
Currency
Revaluations
Flows
Table 3.7(b): Private External Debt Transactions by Type of Debt as at 31
December 2009 (Rs million)
A 3,317 3,930 -34 -647
B 2,714 3,125 3 -408
D 2,486 386 -254 1,846
E 0 81 0 -81
TOTAL 8,517 7,522 -285 710
Type of Debt Disbursement Repayment
Foreign
Currency
Revaluations
Flows

29
Table 3.8(a): Private External Debt Transactions by Sector as at 31 December 2008
(Rs million)
3,284 630 793 10 3,131
C Manufacturing 305 30 102 39 272
D Electricity, gas, steam and air conditioning supply c c c c c
F Construction c c c c c
G Wholesale and retail trade; repair of motor vehicles 886 20 3 - 903
H Transportation and storage 403 250 344 -32 277
I Accommodation and food service activities 584 146 33 5 702
J Information and communication 240 - 75 -46 119
P Education c c c c c
Q Human health and social work activities c c c c c
S Other service activities c c c c c
7,367 5,603 5,160 -612 7,198
C Manufacturing 1,108 1,308 996 -7 1,413
D Electricity, gas, steam and air conditioning supply c c c c c
F Construction c c c c c
G Wholesale and retail trade; repair of motor vehicles 419 2,606 2,408 -358 259
H Transportation and storage 4,637 1,022 1,373 -266 4,020
I Accommodation and food service activities 515 54 125 - 444
J Information and communication 78 491 219 19 369
R Art, entertainment and recreation c c c c c
S Other service activities c c c c c
10,651 6,233 5,953 -602 10,329
Sector
(ISIC 1
digit)
As at 31
December
2007
Repayment
Foreign
Currency
Revaluations
Description
Short Term Loans
Long Term Loans
Total
As at 31
December
2008
Disbursement
A "c" for confidential is inserted to protect the confidentiality of data.
Table 3.8(b): Private External Debt Transactions by Sector as at 31 December 2009 (Rs million)
3,131 1,256 1,735 74 2,726
C Manufacturing 272 28 9 -75 216
D Electricity, gas, steam and air conditioning supply c c c c c
F Construction c c c c c
G Wholesale and retail trade; repair of motor vehicles 903 13 488 1 429
H Transportation and storage 277 190 394 67 140
I Accommodation and food service activities 702 667 488 111 992
J Information and communication 119 - 40 -1 78
K Financial and insurance activities - 212 - 6 218
P Education c c c c c
Q Human health and social work activities c c c c c
S Other service activities c c c c c
7,198 7,261 5,787 -359 8,313
A Agriculture, forestry and fishing - c c c c
C Manufacturing 1,413 1,534 1,476 -2 1,469
D Electricity, gas, steam and air conditioning supply c c c c c
F Construction c c c c c
G Wholesale and retail trade; repair of motor vehicles 259 2,466 1,181 1 1,545
H Transportation and storage 4,020 2,102 1,949 -319 3,854
I Accommodation and food service activities 444 3 135 -19 293
J Information and communication 369 390 504 -20 235
K Financial and insurance activities 14 12 14 - 12
R Art, entertainment and recreation c - - - -
S Other service activities c 422 403 - c
10,329 8,517 7,522 -285 11,039
As at 31
December
2009
Short Term Loans
Total
Long Term Loans
Sector
(ISIC 1
digit)
Description
As at 31
December
2008
Disbursement Repayment
Foreign
Currency
Revaluations
A "c" for confidential is inserted to protect the confidentiality of data.

30
3.2 Foreign Assets: Stock and Flows
Out of the 138 respondents, 56 reported having foreign assets, which were worth
Rs10.1 billion as at end-December 2009, i.e., an increase of 5.1 per cent from the
outstanding stock level at end-December 2008. Between end-December 2007 and
end-December 2008, the stock of foreign assets had risen by 51.4 per cent, i.e., from
Rs6.3 billion to Rs9.6 billion. Table 3.9 summarises the net change in position in
foreign assets during the years ending 31 December 2008 and 2009, respectively.
Table 3.9: Foreign Assets Flows and Outstanding for 2008 and 2009 (Rs million)
Equity 3,832 1,836 5,668 895 6,563
Outward FDI (Equity) 2,216 784 3,000 226 3,226
Portfolio Investment 1,616 1,052 2,668 669 3,337
Other Claims 2,509 1,422 3,931 -401 3,530
Long Term 1,298 746 2,044 -131 1,913
Short Term 1,211 676 1,887 -270 1,617
TOTAL 6,341 3,258 9,599 494 10,093
* Transactions during the year = Purchases during the year less Sales during the year plus any revaluation during the year
Transactions
during 2009*
As at 31
December
2009
As at 31
December 2007
Transactions
during 2008*
As at 31
December
2008
Chart 3.3 shows claims on non-residents by type of investment. FDI was the main
source of outward investment throughout all the three years under review (35 per
cent, 31 per cent and 32 per cent as at 31 December 2007, 2008 and 2009,
respectively).
Chart 3.3: Type of Claims as a proportion of Foreign Assets
0
10
20
30
40
50
Per cent
Outward FDI Portfolio
Investment
ST Claim LT Loan
Type of Claim
2007 2008 2009

31
The level of direct investment reported by resident enterprises as at end-December
2008 in the form of equity holdings in non-resident enterprises was Rs3.0 billion and
as at end of December 2009, the stock of residents’ direct investment abroad had
risen to Rs3.2 billion. Claims on non-resident affiliates held by residents decreased
from Rs0.6 billion as at end-December 2008 to Rs0.2 billion as at end-December
2009.
3.2.1 Total Assets by Sector of Activity
By sector of activity, the share of ‘Manufacturing’ came down from 17 per cent as at
end-December 2008 to 15 per cent as at end-December 2009. From 10 per cent as at
end-December 2008, the share of ‘Wholesale and retail trade, repair of motor
vehicles’ increased to 14 per cent as at end-December 2009. The share of ‘Finance
and insurance activities’ also went up to reach 11 per cent of all foreign assets
reported as at end-December 2009. Table 3.10 gives a breakdown of total assets by
sector of activity.
Table 3.10: Foreign Assets Outstanding by Sector
(Rs million) per cent (Rs million) per cent
C Manufacturing 1,644 17 1,493 15
D Electricity, gas, steam and air conditioning supply c c c c
F Construction 672 7 456 5
G Wholesale and retail trade; repair of motor vehicles 941 10 1,390 14
H Transportation and storage 870 9 329 3
I Accommodation and food service activities c c c c
J Information and communication c c c c
K Financial and insurance activities 655 7 1,081 11
S Other service activities c c c c
9,599 100 10,093 100TOTAL
Sector
(ISIC 1
digit)
ShareDescription
As at 31
December 2008Share
As at 31
December 2009
A "c" for confidential is inserted to protect the confidentiality of data
3.2.2 Direct Investment Abroad
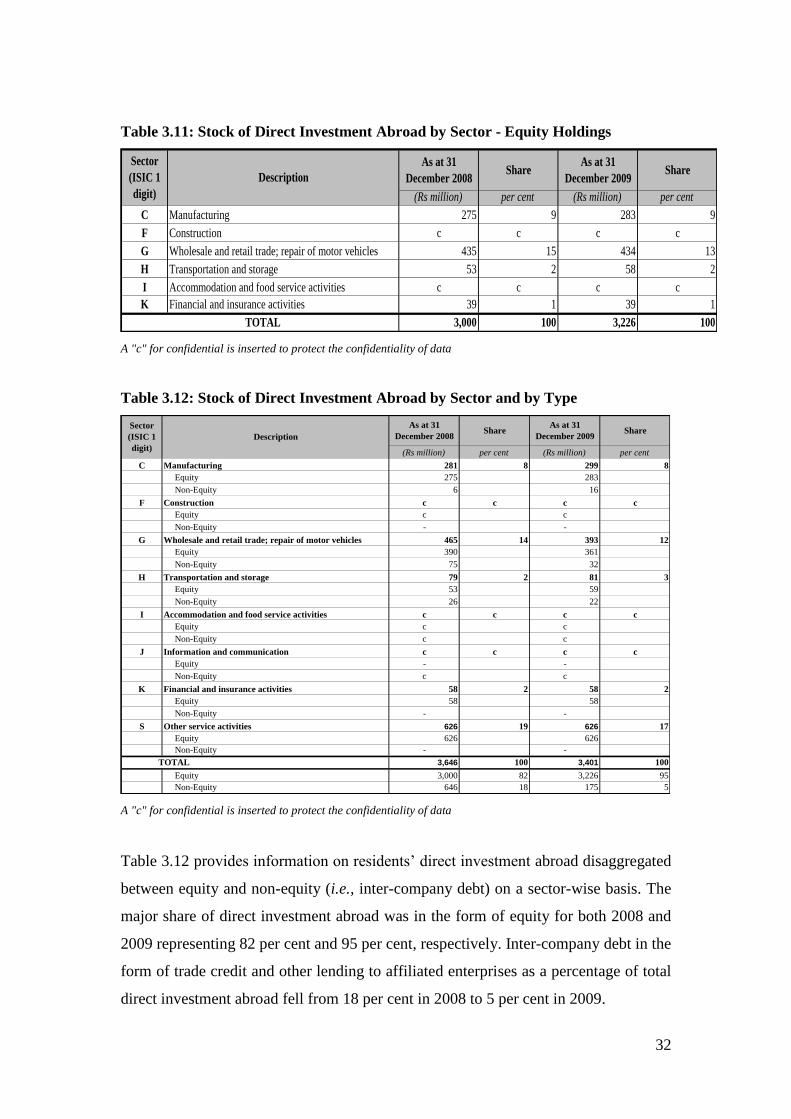
Table 3.11 shows that the share of the ‘Wholesale and retail trade, repair of motor
vehicles’ in total FDI abroad in the form of equity participation has declined
marginally from 15 per cent as at end-December 2008 to 13 per cent as at end-
December 2009 while the share of the ‘Manufacturing’ sector remained unchanged
at 9 per cent.
32
Table 3.11: Stock of Direct Investment Abroad by Sector - Equity Holdings
(Rs million) per cent (Rs million) per cent
C Manufacturing 275 9 283 9
F Construction c c c c
G Wholesale and retail trade; repair of motor vehicles 435 15 434 13
H Transportation and storage 53 2 58 2
I Accommodation and food service activities c c c c
K Financial and insurance activities 39 1 39 1
3,000 100 3,226 100
Description
Sector
(ISIC 1
digit)
TOTAL
ShareAs at 31
December 2008Share
As at 31
December 2009
A "c" for confidential is inserted to protect the confidentiality of data
Table 3.12: Stock of Direct Investment Abroad by Sector and by Type
(Rs million) per cent (Rs million) per cent
C Manufacturing 281 8 299 8
Equity 275 283
Non-Equity 6 16
F Construction c c c c
Equity c c
Non-Equity - -
G Wholesale and retail trade; repair of motor vehicles 465 14 393 12
Equity 390 361
Non-Equity 75 32
H Transportation and storage 79 2 81 3
Equity 53 59
Non-Equity 26 22
I Accommodation and food service activities c c c c
Equity c c
Non-Equity c c
J Information and communication c c c c
Equity - -
Non-Equity c c
K Financial and insurance activities 58 2 58 2
Equity 58 58
Non-Equity - -
S Other service activities 626 19 626 17
Equity 626 626
Non-Equity - -
3,646 100 3,401 100
Equity 3,000 82 3,226 95
Non-Equity 646 18 175 5
Share
TOTAL
Sector
(ISIC 1
digit)
Description
As at 31
December 2008Share
As at 31
December 2009
A "c" for confidential is inserted to protect the confidentiality of data
Table 3.12 provides information on residents’ direct investment abroad disaggregated
between equity and non-equity (i.e., inter-company debt) on a sector-wise basis. The
major share of direct investment abroad was in the form of equity for both 2008 and
2009 representing 82 per cent and 95 per cent, respectively. Inter-company debt in the
form of trade credit and other lending to affiliated enterprises as a percentage of total
direct investment abroad fell from 18 per cent in 2008 to 5 per cent in 2009.

33
Although enterprises reported holdings of FDI in a wide range of countries, FDI was
rather concentrated in the region with Madagascar and the Seychelles accounting for
more than two-third of total, both in 2008 and 2009. Table 3.13 provides details of
outward FDI by geographical destination.
Table 3.13: Stock of Direct Investment Abroad by Geographical Destination
(Rs million) per cent (Rs million) per cent
Australia c c c c
British Virgin Island 0 0 0 0
Comores 0 0 0 0
Cyprus c c c c
France c c c c
India c c c c
Ivory Coast c c c c
Kenya c c c c
Luxembourg c c c c
Madagascar 290 10 300 9
Malaysia c c c c
Maldives c c c c
Mayotte c c c c
Morocco c c c c
Mozambique 29 1 40 1
Philippines c c c c
Reunion 5 0.2 6 0.2
Senegal 0 0 0 0
Seychelles 1,763 58 1,876 58
South Africa c c c c
Spain c c c c
United Kingdom 30 1 30 1
TOTAL 3,000 100 3,226 100
ShareAs at 31
December 2008Share
As at 31
December 2009
A "c" for confidential is inserted to protect the confidentiality of the data.
3.2.3 Portfolio Assets
The stock of portfolio investment assets for the 138 respondents as at end-December
2008 and end-December 2009 stood at Rs2.7 billion and Rs3.3 billion, respectively.

34
Table 3.14: Stock of Portfolio Investment Assets by Sector
(Rs million) per cent (Rs million) per cent
C Manufacturing 193 7 218 7
F Construction c c c c
G Wholesale and retail trade; repair of motor vehicles 426 16 867 26
H Transportation and storage c c c c
I Accommodation and food service activities c c c c
K Financial and insurance activities 18 0.7 25 0.8
2,668 100 3,337 100
Sector
(ISIC 1
digit)
Description
TOTAL
ShareAs at 31
December 2008Share
As at 31
December 2009
A "c" for confidential is inserted to protect the confidentiality of the data
3.3 Retained Earnings and Dividends Paid
According to the Balance of Payments Manual (BPM 5), FDI is subdivided into
equity capital investment, retained earnings and other capital (inter-company loans).
For the period ended 31 December 2008 and 2009, retained earnings due to non-
residents amounted to Rs0.6 billion and Rs1.3 billion, respectively. The amount of
dividend income paid to non-resident investors fell from Rs2.4 billion in 2008 to
Rs2.1 billion in 2009.
Table 3.15: Retained Earnings Due to and Dividends Paid to Non-Residents
(Rs million)
2008 2009 2008 2009
C Manufacturing 1,161 290 297 284
D Electricity, gas, steam and air conditioning supply c c c c
F Construction c c c c
G Wholesale and retail trade; repair of motor vehicles 433 -549 256 322
H Transportation and storage -3,515 -337 53 34
I Accommodation and food service activities 996 509 1,051 624
J Information and communication 241 207 492 373
K Financial and insurance activities 194 156 43 140
P Education c c c c
Q Human health and social work activities c c c c
R Art, entertainment and recreation c c c c
S Other service activities 962 968 71 48
640 1,275 2,390 2,130
Dividend PaidSector
(ISIC 1
digit)
TOTAL
Description
Retained Earnings
A "c" for confidential is inserted to protect the confidentiality of the data.

35
3.4 Retained Earnings and Dividends Received
Retained earnings due to residents increased to Rs0.2 billion in 2009 although the
amount of dividend income received from outward FDI declined marginally from
Rs1.4 billion in 2008 to Rs1.3 billion in 2009.
Table 3.16: Retained Earnings Due to and Dividends Received by Residents
2008 2009 2008 2009
C Manufacturing 30 45 6 6
F Construction -99 -103 1,237 1,212
G Wholesale and retail trade; repair of motor vehicles -749 62 0 0
H Transportation and storage 95 100 13 18
I Accommodation and food service activities 202 128 161 74
K Financial and insurance activities 0 3 3 0
-521 235 1,420 1,310
Dividend ReceivedSector
(ISIC 1
digit)
TOTAL
Description
Retained Earnings
(Rs million)

36
SECTION 4
COMPARISON WITH THE INTERNATIONAL TRANSACTION
REPORTING SYSTEM (ITRS) RECORDS
This section compares the survey results with the data culled from the Bank’s primary
data source, which are cash-based BOP transactions that pass through banks.
The banking returns - which capture the individual BOP cash transactions passing
through domestic banks - form the core component of the Bank of Mauritius ITRS
and are the primary source of financial data for the compilation of the BOP and the
IIP. These banking returns are statements of Inward and Outward Remittances
recording the cash transactions between residents and non-residents and are submitted
by banks to the Bank of Mauritius on a monthly basis. FDI transactions data on a
gross basis are drawn from the banking records and released on the Bank’s website as
well as published separately from the BOP statistics in the Monthly Statistical
Bulletin of the Bank according to the sector of investment and by geographical
destination/country of origin. Portfolio investment and external debt data are,
however, published as BOP aggregates.
4.1 Foreign Direct Investment
Year 2008
According to the banking records, for the period January to December 2008, gross
FDI in Mauritius stood at Rs11.4 billion. However, this figure comprised FDI in
banks and real estate activities, inclusive of IRS/RES. For the sake of comparison
between the inward gross FDI culled from the FALS data and the FDI data compiled
from banking records, all direct investment flows into IRS and banks in the latter data
set have been excluded. Banking records showed that gross inward FDI, excluding
inflows into banks and real estate, amounted to Rs2.5 billion in 2008 while the survey
results indicated gross FDI inflows of Rs0.7 billion during the same period.

37
Table 4.1(a): Comparison of ITRS Banking Records and Survey Data for Foreign
Direct Investment Inflows during 2008
A "c" for confidential is inserted to protect the confidentiality of the data
Table 4.1 shows that, on average, the ITRS provides superior data relative to the
survey results largely because of the survey’s lower coverage and high rate of non-
response. However, for the ICT and Manufacturing sectors, the survey results showed
higher FDI. The difference may be due to a mix of factors, including possible
misclassification of sectors in the banking records and under-reporting. As a first
concluding remark, it seems that the way forward for the Bank in the collection of
financial account BOP data is to retain the ITRS while carrying out surveys in parallel
rather than abandoning one in favour of the other.
Year 2009
For 2009, excluding direct investment in the banking and real estate sectors, inclusive
of IRS/RES, from the gross inward FDI of Rs8.8 billion, the remaining amount
comes to Rs3.3 billion. Survey results for 2009 show only Rs0.5 billion, which
represents under-reporting of Rs2.8 billion compared to the banking records.
ITRS Survey
A Agriculture, forestry and fishing 447 c C Manufacturing 149 285 D Electricity, gas, steam and air conditioning supply 0 c F Construction 68 c G Wholesale and retail trade; repair of motor vehicles 103 81 H Transportation and storage 14 -4 I Accommodation and food service activities 1,348 -261 J Information and communication 8 424 K Financial and insurance activities 207 71 P Education 74 c Q Human health and social work activities 120 c S Other service activities 0 c
2,538 717
(Rs million)
Description
TOTAL
Data Source Sector (ISIC 1 digit)

38
Table 4.1(b): Comparison of ITRS Banking Records and Survey Data for Foreign
Direct Investment Inflows during 2009
A "c" for confidential is inserted to protect the confidentiality of the data.
4.2 Direct Outward Investment
Table 4.2(a): Comparison of ITRS Banking Records and Survey Data for Foreign
Direct Investment Outflows during 2008
A "c" for confidential is inserted to protect the confidentiality of the data.
Table 4.2(b): Comparison of ITRS Banking Records and Survey Data for Foreign
Direct Investment Outflows during 2009
A "c" for confidential is inserted to protect the confidentiality of the data.
ITRS Survey
A Agriculture, forestry and fishing 0 c C Manufacturing 485 312 D Electricity, gas, steam and air conditioning supply 0 c F Construction 211 c G Wholesale and retail trade; repair of motor vehicles 291 -147 H Transportation and storage 10 -33 I Accommodation and food service activities 1,850 19 J Information and communication 0 316 K Financial and insurance activities 174 6 P Education 125 c Q Human health and social work activities 145 c S Other service activities 0 c
3,291 481
Sector (ISIC 1 digit)
TOTAL
Data Source
(Rs million)
Description
ITRS Survey
C Manufacturing 205 201 F Construction 2 c G Wholesale and retail trade; repair of motor vehicles 22 10 H Transportation and storage 13 -1 I Accommodation and food service activities 920 c K Financial and insurance activities 209 c
1,371 784
Data Source
(Rs million)
Sector (ISIC 1 digit)
Description
TOTAL
ITRS Survey
C Manufacturing 114 8 F Construction 4 c G Wholesale and retail trade; repair of motor vehicles 34 -1 H Transportation and storage 9 5 I Accommodation and food service activities 711 c K Financial and insurance activities 209 c
1,081 226 TOTAL
Data Source
(Rs million)
Description Sector (ISIC 1 digit)
39
4.3 Private Sector External Debt
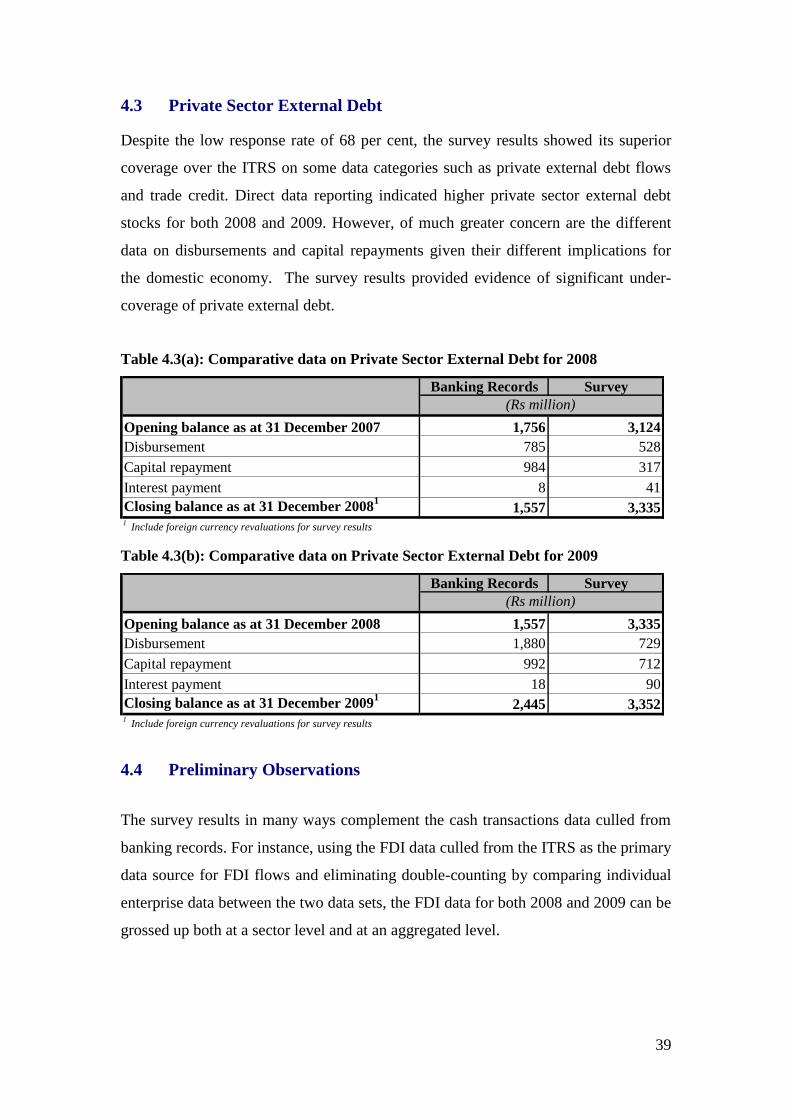
Despite the low response rate of 68 per cent, the survey results showed its superior
coverage over the ITRS on some data categories such as private external debt flows
and trade credit. Direct data reporting indicated higher private sector external debt
stocks for both 2008 and 2009. However, of much greater concern are the different
data on disbursements and capital repayments given their different implications for
the domestic economy. The survey results provided evidence of significant under-
coverage of private external debt.
Table 4.3(a): Comparative data on Private Sector External Debt for 2008
Banking Records Survey
Opening balance as at 31 December 2007 1,756 3,124
Disbursement 785 528
Capital repayment 984 317
Interest payment 8 41
Closing balance as at 31 December 20081
1,557 3,3351
Include foreign currency revaluations for survey results
(Rs million)
Table 4.3(b): Comparative data on Private Sector External Debt for 2009
Banking Records Survey
Opening balance as at 31 December 2008 1,557 3,335
Disbursement 1,880 729
Capital repayment 992 712
Interest payment 18 90
Closing balance as at 31 December 20091
2,445 3,3521
Include foreign currency revaluations for survey results
(Rs million)
4.4 Preliminary Observations
The survey results in many ways complement the cash transactions data culled from
banking records. For instance, using the FDI data culled from the ITRS as the primary
data source for FDI flows and eliminating double-counting by comparing individual
enterprise data between the two data sets, the FDI data for both 2008 and 2009 can be
grossed up both at a sector level and at an aggregated level.

40
The grossed-up figures for 2008 and 2009, as shown in Tables 4.4(a) and 4.4(b), point
to higher FDI inflows by 24 per cent and 12 per cent, respectively.
Table 4.4(a) Grossed-up FDI in Mauritius for 2008
A "c" for confidential is inserted to protect the confidentiality of the data.
Table 4.4(b): Grossed-up FDI in Mauritius for 2009
A "c" for confidential is inserted to protect the confidentiality of the data.
ITRS Grossed-up
Survey
A Agriculture, forestry and fishing 447 447 C Manufacturing 149 285 D Electricity, gas, steam and air conditioning supply 0 c F Construction 68 68 G Wholesale and retail trade; repair of motor vehicles 103 103 H Transportation and storage 14 14 I Accommodation and food service activities 1,348 1,348 J Information and communication 8 424 K Financial and insurance activities 207 207 P Education 74 74 Q Human health and social work activities 120 120 S Other service activities 0 c
2,538 3,146
Data Source
Description
TOTAL
Sector (ISIC 1 digit)
(Rs million)
ITRS Grossed-up
Survey
A Agriculture, forestry and fishing 0 c C Manufacturing 485 485 D Electricity, gas, steam and air conditioning supply 0 c F Construction 211 211 G Wholesale and retail trade; repair of motor vehicles 291 291 H Transportation and storage 10 10 I Accommodation and food service activities 1,850 1,850 J Information and communication 0 316 K Financial and insurance activities 174 174 P Education 125 125 Q Human health and social work activities 145 145 S Other service activities 0 0
TOTAL 3,291 3,682
(Rs million)
Data Source Sector (ISIC 1 digit)
Description

41
SECTION 5
FALS 2011
The questionnaire for the Foreign Assets and Liabilities Survey to be launched this
year calling for end-December 2010 positions data and transactions for the year 2010
has been amended on the recommendations of Mr. Simon Quin, IMF Expert, when he
visited the Bank in September 2010. The proposed questionnaire is enclosed in
Appendix 3.
Among the changes proposed to the FALS 2011 questionnaire is the treatment of
fellow enterprises. The questionnaire includes inward investment in Mauritius by
non-resident subsidiaries of direct investors abroad (which might otherwise be
included under portfolio or other investment should the 10 percent threshold for
determining a direct investment relationship not be met) and outward investment by
resident subsidiaries of a Mauritian enterprise group (which, if included in the survey
frame, might be included under portfolio or other investment should the 10 percent
threshold for determining a direct investment relationship not be met).
On the basis of available information, it is not possible at present to determine
whether fellow enterprises are important channels for inward or outward direct
investment in or by Mauritius. Because BPM6 recommends the reporting of direct
investment in the form of equity and debt instruments without further instrument
detail, the FALS 2011 questionnaire has been simplified.
On outward direct investment, lessons drawn from the analysis of responses pointed
that greater clarity should be brought to the FALS questionnaire for respondents to
ensure that they should report data for each subsidiary abroad on the basis of the
accounts of the subsidiary. This would help in providing a far more accurate picture
of the stock of outward direct investment held by the parent company residing in
Mauritius and enable the calculation of retained earnings for the BOP.

42
Finally, although the FALS 2010 Questionnaire called for reverse direct investment
data (when a subsidiary has claims on the parent company) with regard to debt
claims, no provision was made to include reverse direct investment in the form of
equity holdings of the subsidiary in the parent company. This omission has been
addressed in the FALS 2011 Questionnaire to be in line with the directional principle
followed in BPM6.
For financial account transactions that are excluded from direct investment, the FALS
2010 Questionnaire called for a classification by instrument, contractual maturity, and
country together with a reconciliation of holdings, transactions, revaluations and
information on interest payable by type of instrument. For enterprises with more than
one or two instruments to report, the Questionnaire did not allow for aggregation by
each type of instrument. Changes are proposed to the design of the Questionnaire to
facilitate aggregate reporting under each instrument category, with a view to making
the reporting system more robust.
The reporting of trade credit by country of creditor (on the inward side) or debtor (on
the outward side) has been deleted. The classification of debt instruments was
changed to bring it in line with BPM6 and to ensure a more accurate reporting of total
external debt. The opportunity was also taken to simplify reporting by requiring that
the valuation of the stock of shareholders capital be reported at book values only (i.e.,
following the accounting practice of the enterprise) rather than reporting both book
and market values in the FALS 2010. Market price valuations in addition to book
valuations are encouraged by BPM6 and in the IMF CDIS Guide should such
information be available. The request for supplementary data at market values can be
revisited in later surveys.
The Questionnaire is intended to support the participation of Mauritius in the CDIS
and will be tabled for discussion with participating enterprises at the sensitisation
meetings planned after the launch of FALS 2011.

Appendix 1
BANK OF MAURITIUS website: http://bom.intnet.mu
PRESS RELEASE
By virtue of Section 51A(1) of the Bank of Mauritius Act 2004, the Bank of Mauritius has
responsibility for the preparation of the balance of payments accounts and the external assets and
liabilities position of Mauritius.
The Bank conducted the 1st Foreign Assets and Liabilities Survey (FALS) in late 2007 and
the survey was treated as an exploratory survey. The Bank is now proceeding to conduct the 2nd
FALS. The FALS aims to gather information from resident enterprises on their claims on non-
residents and their liabilities to non-residents. The survey is expected to improve the statistical
coverage in the Balance of Payments and to compile a complete International Investment Position
statement for Mauritius. Given the openness of the economy, the nature of transactions and positions
between residents and non-residents has become much more complex and increasingly difficult to
measure. Consequently, the Bank is moving towards a survey-based approach to collecting data for
the compilation of external sector statistics.
The Bank benefited from technical assistance missions on balance of payments statistics
from the International Monetary Fund (IMF), which recommended the use of surveys for compiling
balance of payments and international investment position statements. The missions also assisted the
Bank in designing the questionnaire and drawing the survey frame.
This initiative is also in line with the recommendations of IMF on data dissemination
standards and the Bank’s commitments to the international community. The graduation of our
country to the IMF’s Special Data Dissemination Standards (SDDS) in fact calls for data to be in
conformity with internationally accepted methodologies, including concepts and definitions, and
disseminated within a specific time frame.
This survey covers resident enterprises in diverse fields of economic activities. Information
provided in the questionnaire will be treated with confidentiality and will not be accessible to any
other person or organisation. The information supplied will only be published by the Bank in
aggregated form. Once this exercise is completed, the findings of this survey will be communicated
to the enterprises and will also be posted on the Bank’s website.
An electronic version of the questionnaire is available on the Bank’s website at
http://bom.intnet.mu.
9 April 2010 Bank of Mauritius
FOREIGN ASSETS AND LIABILITIES SURVEY 2009

44
Appendix 2
FFOORREEIIGGNN AASSSSEETTSS AANNDD LLIIAABBIILLIITTIIEESS
SSUURRVVEEYY ((FFAALLSS)) 22001100
SSTTAATTIISSTTIICCSS DDIIVVIISSIIOONN
BBAANNKK OOFF MMAAUURRIITTIIUUSS
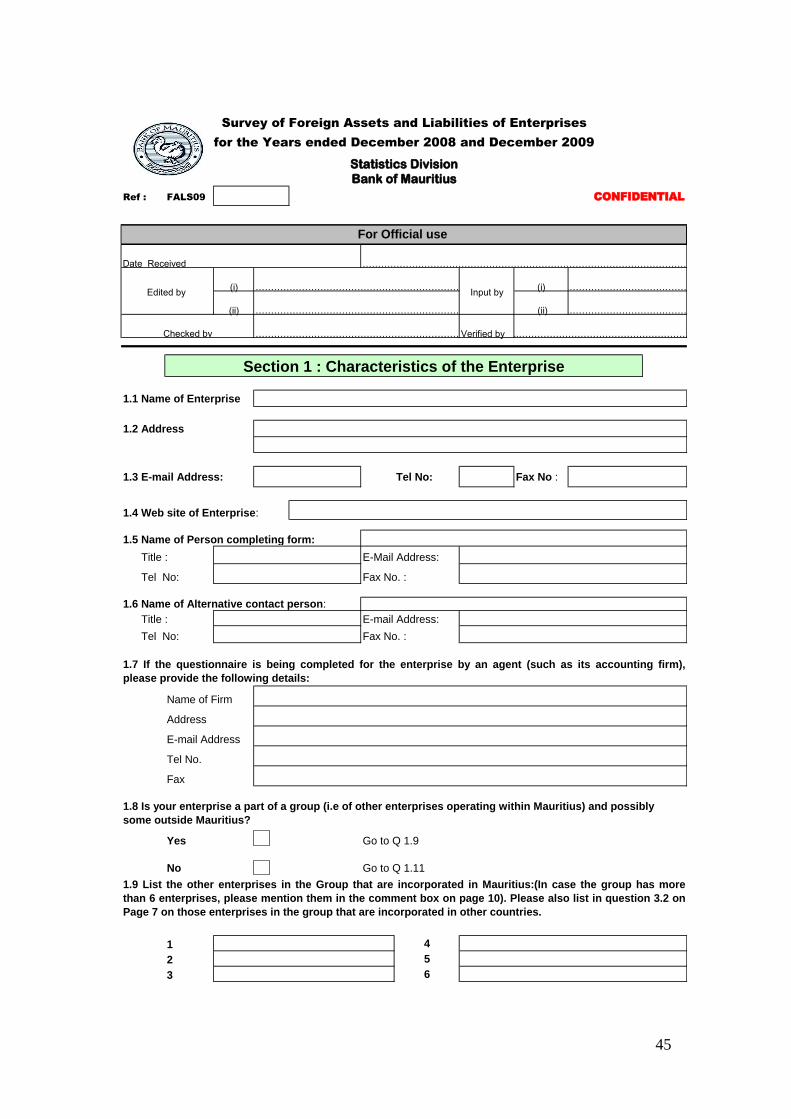
45
Ref : FALS09
(i) (i)
(ii) (ii)
Verified by
1.1 Name of Enterprise
1.2 Address
1.3 E-mail Address: Tel No: Fax No :
1.4 Web site of Enterprise:
1.5 Name of Person completing form:
Title : E-Mail Address:
Tel No: Fax No. :
1.6 Name of Alternative contact person:
Title : E-mail Address:
Tel No: Fax No. :
Name of Firm
Address
E-mail Address
Tel No.
Fax
Yes Go to Q 1.9
No Go to Q 1.11
1 4
2 5
3 6
Input by
…………………………………………………………………………………………………
………………………………………………….
………………………………………………….
……………...……………………………………………………………..
Section 1 : Characteristics of the Enterprise
Checked by …………………………………………………………………………………………………
1.7 If the questionnaire is being completed for the enterprise by an agent (such as its accounting firm),
please provide the following details:
Date Received …………………………………………………………………………………………………………
1.9 List the other enterprises in the Group that are incorporated in Mauritius:(In case the group has more
than 6 enterprises, please mention them in the comment box on page 10). Please also list in question 3.2 on
Page 7 on those enterprises in the group that are incorporated in other countries.
1.8 Is your enterprise a part of a group (i.e of other enterprises operating within Mauritius) and possibly
some outside Mauritius?
Edited by …………………………………………………………………………………………………
Survey of Foreign Assets and Liabilities of Enterprises
for the Years ended December 2008 and December 2009
Statistics Division
Bank of Mauritius
For Official use
CONFIDENTIAL

46
1.10
You are supplying (tick one ):
1.11
A. Agriculture, hunting, and forestry G Wholesale and retail
B. Fishing H. Hotels, restaurants, and bars
C. Mining and quarrying I. Transport, storage, communication
D. Manufacturing J. Financial intermediation, insurance, pensions
E. Electricity, gas and water K. Real Estate, renting, business activities
F. Construction L. Other (Specify)………………………
1.12 Please indicate your Accounting Year?
1.13 Can you complete the questions in this return on a
Monthly Basis Quarterly Basis (Tick one)
1.14
1.15
NO
1
2
3
4
Data for the group on a consolidated basis should be reported only if this questionnaire is being
completed on a consolidated basis for all enterprises in the group that are incorporated in
Mauritius, otherwise tick 1 or 3 as appropriate.
What is the principal area of activity of your enterprise based on turnover? (tick one):
1. Unconsolidated for this enterprise only on this questionnnaire (or for enterprises within one line
of business)
2. Consolidated for the group on this questionnaire.
3. Unconsolidated for each enterprise in the group on separate enclosed questionaires
Has your enterprise lent funds to non-resident enterprises or
individuals or has any unpaid amounts outstanding? If yes,
please complete questions 3.8 and 3.9
The table below contains filtering questions that will help you decide which parts of the
questionnaire to answer.
With respect to Sections 2 and 3, please list below questions you can only complete on an
accounting year basis
YES
Do non-resident entities, governments or individuals hold
shares (equity or other than equity) in your enterprise? If yes,
please complete questions 3.2 through 3.7
Does your enterprise own shares (equity or other than equity in
non-resident enterprises (i.e. abroad). If yes, please complete
questions 2.4 and 2.5
Does your enterprise borrow from non-resident
enterprises/individuals or have outstanding commitments or
have any other liabilities (i.e., other than shares and loans). If
yes, please complete question 2.7

47
2.1 Methods of Estimating the Market Value of Equity of Your Enterprise
2008 2009
Commercially motivated share transaction in your enterprise
Estimate by Director / Financial Manager / Auditor
Net Asset Value
Other (Please Specify)……………………………………………………
2.2 Please indicate the Market Equity of your enterprise? (Please report in thousands of Mauritian Rupees )
2.3 Shareholders Capital
Rupees ('000)
2.4
Rupees ('000)
Share of Book
Value as at 31
December 2007
Purchases of
shares in your
enterprise
during 2008
Sales of shares
by your
enterprise
during 2008
Share of Book
Value as at 31
December 2008
Rupees ('000)
Share of Book
Value as at 31
December 2008
Purchases of
shares in your
enterprise
during 2009
Sales of shares
by your
enterprise
during 2009
Share of Book
Value as at 31
December 2009
Please report the book value of Shareholders' Capital, which is made up of the authorised and issued share capital
(i.e., paid-up share capital) + share premium + retained earnings + other reserves
Country
Please list all nonresident investors (or group of investors) who hold equity or equivalent voting rights in your
enterprise equal to 10% or more of equity in your enterprise by country and their share of book value of
shareholders' capital.
3. Closing Balance (Market Value as at 31 December 2009)
Book value at 31
December 2007
Book value at 31
December 2008
Book value at 31
December 2009
Country
Rupees ('000)
2. Closing Balance (Market Value as at 31 December 2008)
Section 2 : Investment in Your Enterprise
Please indicate the method that you use to estimate the Market Value of Equity of your enterprise. This is what you
would sell your enterprise for, to a willing buyer, based on commercial considerations alone. (Tick one)
Stock market price (if your enterprise is listed on the Stock
Exchange of Mauritius )
Valuation of a similar sized enterprise in a similar sector
1. Closing Balance (Market Value as at 31 December 2007)

48
2.5
Market Value
as at 31
December 2007
Purchases of
shares in your
enterprise
during 2008
Sales of shares
by your
enterprise
during 2008
Market Value
as at 31
December 2008
Market Value
as at 31
December 2008
Purchases of
shares in your
enterprise
during 2009
Sales of shares
by your
enterprise
during 2009
Market Value
as at 31
December 2009
2.6 Dividends, Branch Profits Remitted, and Retained Earnings
f. Net holding gains/losses and provision for exchange rate changes (included in net income)
during the period 01 January 2009 to 31 December 2009
f. Net holding gains/losses and provision for exchange rate changes (included in net income)
during the period 01 January 2008 to 31 December 2008
a. Net Income (after tax) for the period 01 January 2009 to 31 December 2009.
b. Dividends paid/branch profits remitted for the period 01 January 2009 to 31 December 2009.
c. Retained earnings during the period 01 January 2009 t0 31 December 2009.
d. Interest payable to non-residents during the period 01 January 2009 to 31 December 2009e. Dividends/branch profits declared payable to non-residents during the period 01 January
2009 to 31 December 2009
e. Dividends/branch profits declared payable to non-residents during the period 01 January
2008 to 31 December 2008
Rupees ('000)
c. Retained earnings during the period 01 January 2008 to 31 December 2008.
b. Dividends paid/branch profits remitted for the period 01 January 2008 to 31 December 2008.
a. Net Income (after tax) for the period 01 January 2008 to 31 December 2008.
d. Interest payable to non-residents during the period 01 January 2008 to 31 December 2008
Rupees ('000)
Please report net income for the period, that is, gross operating and financial revenue (including any
interest or dividends receivable from both residents and non-residents) less operating and financial costs
(including any charges for depreciation and any interest payable to residents and nonresidents) less any
corporate taxes and other charges payable to the Government of Mauritius.
Country
Please indicate the market value of shares held by nonresidents holding less than 10% of equity or
equivalent voting rights in your enterprise. If market values are not available, please use book values.
Country
Rupees ('000)

49
2.7
Yes No Yes No
If Yes at A, B, C, D & E, please complete the tables below.
Opening
balance at
31-Dec-07
Disburse-
ments
received
during
2008
Principal
repayments
during 2008
Foreign
currency
revaluations
during period 1
Closing
balance at
31-Dec-08
Opening
balance at
31-Dec-08
Disburse-
ments
received
during
2009
Principal
repayments
during 2009
Foreign
currency
revaluations
during period 1
Closing
balance at
31-Dec-09
1 If you cannot complete this column, please provide a breakdown of disbursements and repayments reported according
Interest Payable
Source
Country
Type of
Debt
(Write A,
B, C, D &
E as
defined
above )
Type of
Debt
(Write A,
B, C, D &
E as
defined
above )
E : Liabilities to affiliated enterprises abroad. This comprises funds placed
by affiliated enterprises abroad with their parent company in Mauritius.
F: No debt
Source
Country Interest Payable
Rupees ('000)
Original
Maturity
(Write G for
12 months
or more and
H for Less
than 12
Rupees ('000)
1 If you cannot complete this column, please provide a breakdown of disbursements and repayments reported according
Original
Maturity
(Write G for
12 months
or more and
H for Less
than 12
B: Trade Credit from non-affiliated enterprises: Receives trade credits from
non-affiliated exporters or prepayments made by non-affiliated importers. “Non-
affiliates” are nonresident entities, which have less than 10 percent equity in
your enterprise (including those with zero). You will need to complete this
question if your enterprise imports goods and services from unaffiliated
enterprises.
Does your enterprise have the following debt liabilities to NON-RESIDENTS?
2008 2009
A. Trade Credit from Affiliated Enterprises: Borrows and/or receives trade
credits from non-resident affiliated enterprises that hold 10% or more of your
enterprise’s shares or equivalent or is owned by another enterprise which has
such a holding in your enterprise. “Affiliates” (also known as associated or
related enterprises) are enterprises in a direct invstment relationship and
include parent companies, branches, associate companies, subsidiaries, etc.
C. Other Borrowing (Marketable) : This comprises borrowings from non-
resident non-affiliates (i.e., excluding the information supplied for A and B
above) and includes bonds, bills, notes, etc.
D: Other Borrowing (Non-Marketable): This comprises borrowings from non-
resident non-affiliates (i.e., excluding the information you supplied for A, B and
C above) and includes instruments like financial leases, mortgages and loans.
A financial lease is a means by which the lessee finances the purchase (as
opposed to taking out a loan for the purchase) of the good.

50
3.1 Investment by your Enterprise Abroad
Yes Go To 3.2
No Go To 3.7
3.2
3.3
Share of Book
value as at 31
December 2008
Name of
enterprise Country
Share of Book
value as at 31
December 2009
Name of
enterprise CountryRupees('000)
Equity Investment in
your
subsidiaries/affiliates
abroad
Share of Book
Value as at 31
December 2008
Purchases of shares
by your enterprise
during 2009
Sales of shares by
your enterprise
during 2009
Rupees('000)
Please report the share of book value held by your enterprise in its subsidiaries or affiliates abroad in
which your enterprise holds 10% or more of the outstanding shares.
Share of Book
Value as at 31
December 2007
Purchases of shares
by your enterprise
during 2008
Sales of shares by
your enterprise
during 2008
Equity Investment in
your
subsidiaries/affiliates
abroad
Section 3 : Investment by your Enterprise Abroad
Does your enterprise have any Equity investment in any non-resident enterprises (i.e. in any enterprises
located outside the territory of Mauritius)?
Please list all subsidiaries and affiliates that your enterprise has incorporated abroad and the country in
which they are incorporated.
Name of Enterprise Location (Country) Is the enterprise a subsidiary or an affiliate?

51
3.4 Method of estimating equity investment in your subsidiaries/affiliates abroad
2008 2009
Stock market price (if your enterprise is listed)
Valuation of a similar sized enterprise in a similar sector
Estimate by Director /Financial Manager/Auditor
Net Asset Value
Other (Please Specify)…………………………………………
3.5
Name of
Enterprise
Shares of
equity (%)
Name of
Enterprise
Shares of
equity (%)
Purchases of
shares by your
enterprise during
the year 2008
Sales of shares by
your enterprise
during the year 2008
Closing balance
( Market Value of
equity as at 31
December 2008)
Please indicate the method that you use to estimate the market value of equity in your
subsidiaries/affiliates abroad ? Tick one :
Commercially motivated share transaction in your enterprise
Please indicate the market value of the shares held by your enterprise in companies abroad . Use book
values if market values are not available.
Equity Investment in your
subsidiaries/affiliates
abroad
Rupees('000)
Opening balance
(Market value of
equity as at 31
December 2007)
Equity Investment in your
subsidiaries/affiliates
abroad Opening balance
(Market value of
equity as at 31
December 2008)
Purchases of
shares by your
enterprise during
the year 2009
Sales of shares by
your enterprise
during the year 2009
Rupees('000)
Closing balance
( Market Value of
equity as at 31
December 2009)

52
3.6
3.7 Other Foreign Assets Held by Your Enterprise AbroadDoes your enterprise have the following claims on NON-RESIDENTS?
Yes No Yes No
D. Has deposits with non-resident banks
A. Lends and/or provides trade credits to affiliated enterprises abroad
in which your enterprise (or your enterprise and other enterprises
acting in concert) hold(s) 10% or more of the shares or equivalent.
“Affiliates” (also known as associated or related enterprises) include
parent companies, branches, associate companies, subsidiaries etc.
C. Has other lending to non-affiliates (i.e., excluding the information
supplied in A and B above). This includes holding of bonds and loans.
F. Holds any debt or Equity securities issued abroad
1 Should reflect your share holding in each direct investment enterprise e.g, for an associate in Country X in which you have a 40 percent share, 40 percent of net
income after tax after payments of dividends should be included as retained earnings.
E. Claims on direct investors abroad. This comprises funds placed by
afiliated enterprises in Mauritius with their parent company abroad
B. Provides trade credits to unaffiliated exporters abroad or
prepayments made by unaffiliated importers abroad. “Non-affiliates”
are entities with which your enterprise holds less than 10%, or zero, of
the equity shares or equivalent voting rights. It is highly likely that you
will need to complete this question if your enterprise exports goods
and services.
2008 2009
Retained Earnings 1
for nonresident
enterprises in which your enterprise holds
10 percent or more of the equity during
2009
Name of EnterpriseNet Income after
Tax during 2009
Dividends / Profits
received during 2009
Rupees ('000)
Profits and Dividends Receivable by your enterprise from non-resident enterprises, and Retained Earnings of
nonresident enterprises in which your enterprise holds 10 percent or more of equity.
Rupees ('000)
Name of EnterpriseNet Income after
Tax during 2008
Dividends / Profits
received during 2008
Retained earnings 1
for nonresident
enterprises in which your enterprise holds
10 percent or more of the equity during
2008
1 Should reflect your share holding in each direct investment enterprise e.g, for an associate in Country X in which you have a 40 percent share, 40 percent of net
income after tax after payments of dividends should be included as retained earnings.
53
3.8
Disburse-
ments
made
Principal
Repayments
received
Disburse-
ments
made
Principal
Repayments
received
1 If you cannot complete this column, please provide a breakdown of disbursements and repayments reported according to the currency of denomination if other than Mauritian
Rupee
Interest
received
during
the year
2009
Rupees ('000)
Opening
balance as
at 31
December
2008
Transactions during the
year 2009
Closing balance as
at 31 December
2009
Foreign currency
revaluati-ons
during period 1
Recipient
Country
Loan types
(Write A, B, C,
D, E & F)
Original
maturity
( Write G
for 12
months or
more and
H for less
than 12
months )
Please provide the information by country of debtor and report revaluations in each category according to your accounting
practice.
Recipient
Country
Loan types
(Write A, B, C,
D, E & F)
Original
maturity
(Write G
for 12
months or
more and
H for less
than 12
months )
Rupees ('000)
Closing balance as
at 31 December
2008
Transactions during
the year 2008
Foreign currency
revaluations
during period 1
Opening
balance as
at 31
December
2007
Interest
received
during
the year
2008
Please provide the information by country of debtor and report revaluations in each category according to your accounting
practice.
1 If you cannot complete this column, please provide a breakdown of disbursements and repayments reported according to the currency of denomination if other than Mauritian
Rupee

54
Comments to support your information
End of Questionnaire
After completing this form, please retain a duplicate for reference purposes.
Thank You.

55
Appendix 3
FFOORREEIIGGNN AASSSSEETTSS AANNDD LLIIAABBIILLIITTIIEESS
SSUURRVVEEYY ((FFAALLSS)) 22001111
SSTTAATTIISSTTIICCSS DDIIVVIISSIIOONN
BBAANNKK OOFF MMAAUURRIITTIIUUSS

56
Ref : FALS2011
(i) (i)
(ii) (ii)
Verified by
1.1 Name of Enterprise
1.2 Address
1.3 E-mail Address: Tel No: Fax No :
1.4 Web site of Enterprise:
1.5 Name of Person completing form:
Title : E-Mail Address:
Tel No: Fax No. :
1.6 Name of Alternative contact person:
Title : E-mail Address:
Tel No: Fax No. :
Name of Firm
Address
E-mail Address
Tel No. Fax No.
Yes Go to Q 1.9
No Go to Q 1.11
1 4
2 5
3 6
Survey of Foreign Assets and Liabilities of Enterprises
for the Year ended December 2010
Statistics Division
Bank of Mauritius
For Official use
CONFIDENTIAL
…………………………………………………………………………………………………………
Checked by
Edited by …………………………………………………………………………………………………………………………………………………….
Section 1 : Characteristics of the Enterprise
……………...……………………………………………………………..…………………………………………………………………………………………………
…………………………………………………………………………………………………
Date Received
………………………………………………….
Input by
1.7 If the questionnaire is being completed for the enterprise by an agent (such as its accounting firm), please
provide the following details:
1.8 Is your enterprise a part of a group (i.e of other enterprises operating within Mauritius) and possibly some
outside Mauritius?
1.9 List the other enterprises in the Group that are incorporated in Mauritius:(In case the group has more than 6
enterprises, please mention them in the comment box on page 21). Please also list in question 3.2 on Page 14
those enterprises in the group that are incorporated in other countries.

57
1.10
You are supplying (tick one ):
1.11
A. Agriculture, forestry and fishing
C. Manufacturing K. Financial and insurance activities
L. Real estate activities
F. Construction M. Professional, scientific and technical activities
P. Education
H. Transportation and storage Q. Human health and social work activities
R. Arts, entertainment and recreation
1.12 Does your enterprise have an associate/ subsidiary, which is an offshore entity ?
Yes No Go to Q1.13
If yes, please report your assets in the offshore entity below
Rs 000
1.13 Is your enterprise an associate/subsidiary of an offshore entity ?
Yes No Go to Q1.14
If yes, please report your liabilities to the offshore entity below
Rs 000
1.14 Name of offshore entities:
Please state whether the offshore entities relate to questions 1.12 or 1.13
1.15 Please indicate your Accounting Year?
(e.g Year ending December)
1.16 Can you complete the questions in this return on a quarterly basis ?
Yes No
S. Other service activities (Please specify) ……………………………………………………………..
I. Accommodation and food service activities
D. Electricity, gas, steam and
air conditioning supply
Assets
Equity
Debt
Other
Liabilities
Equity
Data for the group on a consolidated basis should be reported only if this questionnaire is being completed on a
consolidated basis for all enterprises in the group that are incorporated in Mauritius, otherwise tick 1 or 3 as
appropriate.
1. Unconsolidated for this enterprise only on this questionnnaire (or for enterprises within one line of business)
3. Unconsolidated for each enterprise in the group on separate enclosed questionaires
What is the principal area of activity of your enterprise based on turnover? (tick one):
G. Wholesale and retail trade; repair of motor
vehicles and motorcycles
J. Information and communication
2. Consolidated for the group on this questionnaire.
Other
Type of Instruments
Type of Instruments
Debt
If the offshore entity is a fully-owned subsidiary of your entrprise, please fill in a separate questionnaire.

58
2.1 Total Shareholders' Capital
Rupees ('000)
2.2
Country of
Residence
% Ownership of
issued share capital
As at accounting
year end 2009
% Ownership of
issued share capital
As at accounting year
end 2010
All must be resident outside Mauritius.
2.3
Country of
Residence
% Ownership of
issued share capital
As at accounting
year end 2009
% Ownership of
issued share capital
As at accounting year
end 2010
(2) (3) (4)
1 Non-residents and the non-resident parent companies should reside in different economies.
Investors holding 10 percent or more of Total Issued Share Capital
Name of non-resident Shareholders *
^Complete this row if your company has subsidiaries/affiliates abroad (in which your company holds 10% or more of the total issued share
capital) which have equity in your company. For example, if you have a wholly owned subsidiary abroad that holds equity in your company
equal to 5% of issued share capital as at accounting year end 2009, then enter 5% in column 3. This represents a liability of your company
to its subsidiary abroad.
Non-residents subsidiaries/affiliates of your
nonresident parent company 1
Name of non-resident Shareholders*
Non-residents subsidiaries/affiliates abroad of
your enterprise^
*Shareholdings by non-residents who are subsidiaries/ affiliates abroad of your enterprise and by non-residents who are subsidiaries
/affiliates of your non-resident parent company are requested separately because they are treated as direct investment. Please note that
enterprises with no entries to report should complete a nil entry.
(1)
Related companies holding less than 10 percent of Total Issued Share Capital
*Shareholders reported here can be an individual, or group of individuals resident in the same country, or an enterprise.
Other equity capital
Revaluations
Accumulated earnings
Please report the book value of Shareholders' Capital, which comprises authorised and issued share capital (i.e.,
paid-up share capital + share premium + retained earnings + other reserves)
Section 2: Investment in Your Enterprise
Share Premiums
Paid-up capital
Book value of Shareholders' Capital at
accounting year end
2010
Book value of Shareholders' Capital at
accounting year end
2009

59
2.4 Inward Direct Investment
Share of Book
Value
of shareholders
capital as at
accounting
year end 2009^
Purchases of
shares by your
enterprise
during 2010 '
Sales of shares
by your
enterprise
during 2010
Share of Book
Value of
shareholders'
capital as at
accounting year
end 2010^
(2) (3) (4) (5) (6)
1 Non-residents and the non-resident parent companies should reside in different economies.
2.5 Inward Portfolio Investment
Market
Value as at
accounting
year end 2009
Purchases of
shares in your
enterprise
during 2010
Sales of shares
in your
enterprise
during 2010
Market
Value as at
accounting year
end 2010
Please list all non-resident investors (or group of investors) who hold equity or equivalent voting rights in your enterprise equal to 10%
or more of equity in your enterprise by country and their share of book value of shareholders' capital, together with holding by related
companies.
*Investors holding 10 percent or more of the Total Issued Shareholders' Capital.
^Calculated by applying the percentage of ownership of Issued Share Capital as reported in 2.2 to Total Issued Shareholders Capital as
reported in 2.1
' Purchase of shares include all equity provided by the parent company in the reporting period.
Note that all funding provided by the parent company in the form of debt instruments should be reported in question 2.7
Rupees ('000)
Non-Resident Investors Country
Direct Investors*
Non-residents
subsidiaries/affiliates of your
nonresident parent company 1
(1)
>Complete this row if your company has subsidiaries/affiliates abroad (in which your company holds 10% or more of the total issued share
capital) which have equity in your company.
For example, if you have a wholly owned subsidiary abroad that holds equity in your company equal to 5% of issued share capital as at
accounting year end 2009, then enter 5% of the book value of shareholders' capital in column 3. This represents a liability of your company to its
subsidiary abroad.
Non-residents
subsidiaries/affiliates of your
enterprise>
Rupees ('000)
Country of Non-Resident Investors
Please indicate the market value of shares held by other nonresidents holding less than 10% of equity or equivalent voting rights in
your enterprise. If market values are not available, please use book values.

60
2.6 External Debt with related companies
Stock of External Debt
as at accounting year
end 2009
Net Transactions in
2010
Other changes
including revaluations
Stock of External Debt
as at accounting year
end 2010
(1) (2) (3) (4) (5)
Total Debt obligations due to direct
investors
Total Debt obligations due to
related companies abroad (A)*
Total Debt obligations due to
related companies abroad (B)
2.7 Currency of denomination of External Debt with related companies
US Dollar
Euro
Pound Sterling
Mauritian Rupee
Other Currencies
*Converted in Mauritian Rupees at end of period exchange rate
Stock of External debt as at accounting year
end 2010*
Rupees('000)
Related Non-resident investors
Currency of denomination
Rupees('000)
Stock of External Debt as at accounting year
end 2009*
Separate rows are included for creditors who are subsidiaries/affiliates abroad of your enterprise (A) and creditors who are subsidiaries/affiliates abroad of
your non-resident parent company(B).
Data for the second and fifth columns should be available from your balance sheet.
Data for the third column should be available from your Cash Flow account. Includes net transactions in all debt obligations due to the non-resident
investors listed. A breakdown by type of instrument is not required.
Debt obligations comprise debt securities (bills and bonds), loans, trade credits and advances, and other debt liabilities (financial leases, liabilities of
insurers and pension funds, provision for calls under standardised guaranteed given to non-residents (such as on export credits), and other accounts
payable which include payment arrears).
The column for other changes including revaluations can be calculated residually as the difference between the opening and closing values of external
debt and net transactions.
*Complete this row if your company has subsidiaries/affiliates abroad (in which your company holds 10% or more of the total issued share capital) which
have claims in the form of debt instruments on your company. For example, if your company has a wholly owned subsidiary abroad which has lent Rs 1
million to your company, then enter Rs 1 million in column 3. This represents a liability of your company to its subsidiary abroad.

61
2.8
2.9
Dividends, Branch Profits Remitted and Retained Earnings
a. Net Income (after tax) for 2010 accounting year.
Rupees ('000)
Please report net income for the period, that is, gross operating and financial revenue (including any interests or
dividends receivable from both residents and non-residents) less operating and financial costs (including any
charges for depreciation and any interest payable to residents and non-residents) less any corporate taxes and
other charges payable to the Government of Mauritius.
d. Realised holding gains/losses included in your Net Income reported in (a)
e. Interest paid to non-residents
b. Dividends paid/branch profits remitted for 2010 accounting year.
c. Retained earnings during 2010 accounting year. (a-b)
D: Other external debt comprise financial leases, liabilities of insurers
and pensions funds, provision for calls under standardised guarantees
given to non-residents (such as on export credit) and other accounts
payable (including payments arrears)
C. Trade Credit and advances comprises credit extended by the
suppliers of goods and services to the customers and advances for the
work that is in progress or yet to be undertaken and prepayments for
goods and services not yet provided.
B. Loans
f. Interest received from non-residents
External Debt with unrelated companies
2009 2010
Yes No Yes No
A. Debt securities: comprises issues of debt securities by your
company such as debentures, bonds, bills and notes that are held by
non-residents. They include international issues and non-residents
participation in domestic issues.

62
2.10 Debt Liabilities with unrelated companies: Stock and Flows
Opening
balance as
at
acounting
year end
2009*
Disburse-
ments
received
during
2010^
Principal
repayments
during 2010^
Foreign
currency
revaluations
during
period<
Closing
balance as
at
acounting
year end
2010*
Interest
Payable
Long Term Debt Securities
Short Term Debt Securities
Short term means less than 12 months
Long term means 12 months or more
*The opening and closing balances can be found from the Balance Sheet
^The disbursements and the repayments can be found from the Cash Flow account
2.11 Debt Liabilities with unrelated companies: by Creditors' country*
Long Term
Debt
Securities
Short
Term Debt
Securities
Long Term
Loans
Short Term
Loans
Other
Long Term
external
debt
Other
Short
Term
external
debt
2.12 Debt Liabilities with unrelated companies by Currency Denomination
US Dollar EuroPound
Sterling
Mauritian
RupeesOther
Stock of External Debt Liabilities as at
accounting year end 2010
Rupees ('000)
Short Term Loans
Stock of External Debt Liabilities as at
accounting year end 2010 by creditor
country
Rupees ('000)
*A creditor country breakdown of trade credits and advances is not required
Trade Credits and Advances
Other Long Term external debt
< The revaluation figure is calculated residually
Other Short Term external debt
Trade Credits and Advances
Other Long Term external debt
Long Term Debt Securities
Short Term Debt Securities
Long Term Loans
Short Term Loans
Rupees ('000)
Type of instruments
Long Term Loans
Other Short Term external debt

63
3.1 Investment by your Enterprise Abroad
Yes Go To 3.2
No Go To 3.9
3.2 Total Shareholders' Capital by Subsidiary and Affiliate
Name of
Enterprise
Location
(Country)
Retained earnings
in 2010 3
Revaluations in
2010 4
Book value of
Total
Shareholders'
Capital as at
accounting year
end 2010
3.3 Ownership of issued Share Capital by Subsidiary and Affiliate
3.4
Sales of shares by
your enterprise
during 2010
Share of Book
value of Total
Shareholders
capital as at 31
December
2010*
3 Comprises retained earnings as shown in the income account for the reporting period
4 Comprises any revaluations to shareholders capital that are made in the reporting period
1 comprises authorised and issued share capital (i.e., paid-up share capital + share premium + retained earnings + other reserves)
2 Comprises changes in paid-up share capital, share premiums, and other reserves in the reporting period
Section 3 : Investment by your Enterprise Abroad
Does your enterprise have any Equity investment in any non-resident enterprise (i.e. in any enterprises located
outside the territory of Mauritius)?
Please list all subsidiaries and affiliates (in which your company holds 10% or more of Total Share Capital1) that your
enterprise has incorporated abroad and the country in which they are incorporated.
Changes in share
capital in 2010 2
Book value of
Total
Shareholders'
Capital as at
accounting year
end 2009
Location (Country)Name of Enterprise
Please list all subsidiaries and affiliates (in which your company holds 10% or more of Total Issued Share Capital)
that your enterprise has incorporated abroad and the country in which they are incorporated.
% Ownership of issued
share capital as at
accounting year 2009
% Ownership of issued share
capital as at accounting year 2010
Share of Book
Value of Total
Shareholders'
capital as at 31
December 2009*
Purchases of
shares by your
enterprise during
2010^
The share of book value of shareholders' capital held by your enterprise in its subsidiaries or affiliates abroad (in
which your enterprise holds 10% or more of Total Issued Share Capital).
Name of enterprise
Rupees('000)
^Purchase of shares include all equity provided by the parent company in the reporting period.
Note that all funding provided by the parent company in the form of debt instruments should be reported in question 3.9
*Calculated by applying the percentage of ownership of Issued Share Capital as reported in 3.3 to Total Issued Shareholders' Capital as
reported in 3.2

64
3.5
Name of EnterpriseNet Income after Tax
during 2010
Dividends / Profits
paid during 2010Retained earnings
3.6 Profits and Retained Earnings Receivable by your enterprise from your Subsidiaries and Affiliates Abroad*
Name of Enterprise
3.7 Other Equity Claims on Related Companies Abroad in which you hold less than 10 percent of issued share capital
Book value of total
shareholders' capital
as at accounting year
end 20091
Changes in equity in
2010 2
Retained earnings in
2010 3 Revaluation in 2010
4
Book value of total
shareholders' capital as
at accounting year end
2010 1
Non-resident parent
company
Non-resident
subsidiaries/affiliates of
resident parent company
3 Comprises retained earnings as shown in the income account for the reporting period
2 Comprises changes in share capital, share premiums, reserves and other equity in the reporting period
1 Comprises authorized and issued share capital (i.e., paid up capital + share premium + retained earnings + other reserves)
Rupees('000)
4 Comprises any revaluations to shareholders' capital that are made in the reporting period
Answer questions 3.7 and 3.8 should your company have equity claims on your non-resident parent company or equity claims on any non-
resident subsidiaries/affiliates of your resident parent company. If your company has no such claims, please proceed to question 3.9
Income Account of your Subsidiaries and Affiliates Abroad
*Calculated by applying the percentage of ownership of issued share capital as reported in 3.3 to Total Dividends paid as reported in 3.5
Dividends / Profits received during 2010* Retained earnings during 2010^
Rupees('000)
Rupees('000)
^Calculated by applying the percentage of ownership of issued share capital as reported in 3.3 to Total Retained Earnings as reported in 3.5
65
3.8
Value of equity held with
related companies
abroad as at accounting
year end 20091
Net purchases/sales of
shares in related
companies abroad2
Other changes including
revaluations3
Value of equity held with
related companies
abroad as at accounting
year end 20101
(1) (2) (3) (4)
Equity Claims on your non-
resident parent company
Equity Claims on non-
resident
subsidiaries/affiliates of your
resident parent company
3.9
*If possible, please report the current market values; if not available use the Net Book Value
^The net purchases of shares can be found from the Cash Flow account
Other Equity Claims on Related Companies Abroad in which you hold less than 10 percent of equity
Holdings of other equity by your entity in non-resident entities in which you hold less than 10 percent of equity
Country of residence of non-
resident entities in which you
hold less than 10 percent of
equity
Rupees('000)
Aggregate value of
shareholdings at end of
accounting year 2009.*
Net purchases/sales of
shares^
Other changes including
revaluations.1
Aggregate value of
shareholdings at end of
accounting year 2010.*
For example, if at end-year 2009 your company holds 5 per cent of issued share capital in a non-resident company (company B) that is wholly owned by your
resident parent company, then 5 per cent of the shareholders capital of company B should be reported in column 1
1 The other changes including revaluations figure can be calculated residually.
These comprise equity claims your enterprise may have on its non-resident parent company (should you have one) and equity claims
on any non-resident subsidiaries/affiliates of your resident parent company (should you have one). If you have no such claims, please
proceed to the Table 3.9
Rupees('000)
1 Calculated as your company's share of issued share capital applied to Total shareholders capital of the related company as shown in question 3.2
2 Net purchases of shares and any other equity by your company should be taken from the balance sheet of the related company
3 Calculated as your company's share of issued share capital applied to revaluations shown in question 3.7

66
3.10
Aggregate value of
external lending to
subsidiaries/affiliates
abroad as at
accounting year end
2009
Net Lending
in 2010
Other changes
including
revaluations
Aggregate value of
external lending to
subsidiaries/affiliates
abroad as at
accounting year end
2010
Interest
receivable in
2010
(2) (3) (4) (5) (6)
3.11 External Lending to Related Companies Abroad in which your entity holds less than 10 percent of equity
Aggregate value of
external lending to
subsidiaries/affiliates
abroad as at
accounting year end
2009
Net Lending
in 2010
Other changes
including
revaluations
Aggregate value of
external lending to
subsidiaries/affiliates
abroad as at
accounting year end
2010
Interest
receivable in
2010
(2) (3) (4) (5) (6)
External Lending comprises debt securities (bills and bonds), loans, trade credit and advances, other claims (financial leases, claims of insurers and
pension funds, provisions for calls under standardised guarantees given to non-residents (such as on export credits), currency and deposits, and other
accounts receivable including arrears).
Data for the second and fifth columns should be available from your balance sheet accounts.
Data for the third column should be available from your cash flow accounts.
The column for other changes including revaluations can be calculated residually.
*For example if your company holds 5% of issued share capital in a non-resident company (Company B) that is wholly owned by your resident parent
company, and your company lends Rs 1 million to Company B, then Rs 1 million should be reported in column 2.
Claims in the form of debt
instruments on your non-resident
parent company
Claims in the form of debt
instruments on non-resident
subsidiaries/affiliates of your
resident parent company by
subsidiary*
(Name of enterprise)
(1)
External Lending to Subsidiaries/Affiliates abroad in which your entity holds more than 10 percent of Total Issued
Share Capital
Rupees('000)
Rupees('000)
Claims in the forms of debt
instruments by subsidiary
(Name of enterprise)
Claims in the forms of debts
instruments
External Lending comprises debt securities (bills and bonds), loans, trade credit and advances, other claims (financial leases, claims of insurers and
pension funds, provisions for calls under standardised guarantees given to non-residents (such as on export credits), currency and deposits, and other
accounts receivable including arrears).
Data for the second and fifth columns should be available from your balance sheet accounts.
Data for the third column should be available from your cash flow accounts.
The column for other changes including revaluations can be calculated residually.
(1)

67
3.12 Other Foreign Assets Held by Your Enterprise Abroad
Does your enterprise have the following claims on NON-RESIDENTS?
Yes No Yes No
3.13 Holdings of Debt instruments issued by unrelated companies: Stock and Flows
Disbursements/
Purchases
during 2010^
Principal
repayments
during 2010^
Short term means less than 12 months
Long term 12 months or more
*The opening and closing balances can be found from the Balance Sheet
^The disbursements and the repayments can be found from the Cash Flow account
The revaluation figure is calculated residually
D : Deposits with non-resident banks
Short Term Debt Securities
Other Short Term external debt
Long Term Loans
Short Term Loans
Trade Credits and Advances
Other Long Term external debt
E: Other debt instruments comprise financial leases, liabilities of insurers and
pensions funds, provision for calls under standardised guarantees given to non-
residents (such as on export credit), other accounts receivable (including payments
arrears).
Type of instruments
Rupees ('000)
Long Term Debt Securities
Transactions during the year
2010
Opening
balance as at
accounting
year end
2009*
Interest
Receivable
during the
year 2010
Closing
balance as at
accounting
year end
2010*
Foreign
currency
revaluations
during period
2010'
C: Trade Credit and advances comprises credit extended by the suppliers of goods
and services to the customers and advances for the work that is in progress or yet to
be undertaken and prepayments for goods and services not yet provided.
B. Loans:
2009 2010
A. Debt securities : This comprises holdings of debentures, bonds, bills and notes
issued by non-residents.

68
3.14 Holdings of Debt instruments* issued by unrelated parties: by Debtor country^
Long Term
Debt
Securities
Short Term
Debt
Securities
Long Term
Loans
Short Term
Loans
Other Long
Term external
debt
Other Short
Term external
debt
3.15 Holdings of Debt instruments issued by unrelated companies: by currency denomination
US Dollar EuroPound
Sterling
Mauritian
RupeesOther
Rupees ('000)1
Holdings of Debt instrument as at
accounting year end 2010 by debtor
country
1 Converted at end-period exchange rates
*Converted into Mauritian Rupees at end of period exchange rates
Other Long Term external debt
Other Short Term external debt
Trade Credits and Advances
*Debt securities includes purchases of bills and bonds issued by foreign governments
^Conversions from the currency of denomination to Mauritius rupees should be at end-of-period exchange rates
Stock of External Debt instrument
as at accounting year end 2010*
Long Term Debt Securities
Short Term Loans
Long Term Loans
Short Term Debt Securities
Rupees ('000)
69
4.1 Financial Derivatives contracts with non-residents
Outstanding marked- to-
market position as at
accounting year end 2009
Cash receipts/payments
relating to derivatives
contracts in 2010
Outstanding marked- to-
market position as at
accounting year end 2010
Cash receipts/payments relating to financial derivatives includes the purchases
and sales of options, margins payments and settlements
Rupees ('000)
Section 4 : Supplementary Information

70
Comments to support your information
End of Questionnaire
After completing this form, please retain a duplicate for reference purposes.
Thank You.