ford2002 global forest ownership
TRANSCRIPT

Global Forest Ownership:Country Statistics and Discussion of Iand and Resource Tenure
Submitted to FAO for publicationinUnasylva lanuary,2002
Loren B. FordUSDA Forest Service
Cooperative Forestry, Stop 1123
1400 Independence Avenue, S.W.Washington, D.C. 20250-1123 USA
Phone: 202-205-0416Fax: 202-205-0975
e-mail : lbford(rDfs.fed.us
Abstract
Country-specific data collectedby the UnitedNations Food and Agriculture Organization (FAO) on
ownership of forest land worldwide are presented, where available, for both general forest areas and
forest plantations. Forest property rights and tenure are among the criteria and indicators ofsustainable forest management developed by several different initiatives, including the Forest
Stewardship Council, the Montreal Process, and tle Intemational Tropical Timber Organization.
Forest ownership and the complexity of tenure and access to forest resources are explored. Care
must be exercised to correctly interpret and appropriately use national statistics on forest ownership.
Rights of access to forest resources on public land are discussed, ranging from traditional gathering
rights of indigenous people to rights of concessionaires to harvest timber. Govenrments frequentlyregulate apivate landowner's use of her or his forest in the public interest, because many of the
amenities and services provided by forests, such as watershed protection, aquifer recharge, habitat forbiological diversity, carbon storage, and scenic vistas, benefit the general public, are impossible for aland owner to control access to, and therefore lack markets that would motivate land owners toprovide these environmental services. Recent initiatives to market previously unmarketable
amenities, such as scenic vistas, watershed protection, and carbon sequestration, are described. Inconclusion, forest ownership is a nebulous term, so care must be taken in interpreting tabular data on
forest ownership. It is recommended that the FAO Forest Resources Assessment continue to collect
data on forest ownership. Tools developed by the FAO Community Forestry Unit to describe
community-specific forest resource tenure relationships should continue to be used in capacity
building and policy analysis as part of national forest prograames.
Note: The research for this article was cartied out during a consultancy by the author to the Forest
Policy and Institutions Branch of the FAO Forestry Deparhent, paid for by the USDA Forest
Service Huron-Manistee National Forests. Disclaimer: The views expressed in this paper are those
of the author and do not necessarily represent those of the U.N. Food and Agiculture Organization or
the USDA Forest Service.

Global Forest Ownership:Countrv Statistics and Discussion of land and Resource Tenure
Loren B. FordUSDA Forest ServiceCooperative Forestry
Washington, D.C. USA
This paper presents data collected by the United Nations Food and Agriculture Organization(FAO) on ownership of forest land worldwide and discusses the need to carefirlly consider such
data in the context of sustainable forest management. FAO is responsible for providing
worldwide leadership and coordination in sustainable forest management, \Mith the objective offurthering the improvement of the quality of life of current generations through management and
use of forests and trees without compromising the potential of future generations to improve theirquality of life using the same resources. FAO periodically receives inquiries about forest
ownership on a global, regional, and national scale. This paper addresses the question of forest
ownership, discussing the complexity of tenure and access to a resource with so much physical,
biological, spatial, and spiritual significance. Care must be exercised to correctly interpret and
appropriately use national statistics on forest land ownership.
Global Forest Resource Assessment 2000
In its capacity as a global leader in sustainable forest management, FAO carries out periodic
assessments of the state of global forest resources. Information is collected from member nations
and other sources, compiled, reconciled among sources, and published in a decadal Global Forest
Resources Assessment. FAO has directed substantial focus toward monitoring changes inworldwide forest cover, in part because of global concerns over tropical deforestation and the rolethat forests play providing habitat for a major share of global biological diversity and storingglobal carbon, but also because of the importance of forests for contributing to the livelihood ofrural people. Monitoring of forest cover has increasingly been accomplished using data collected
from space-based remote sensing platforms.
Part of FAO's strategy to collect information for the Global Forest Resources Assessment 2000
(FRA) included a series of tables for which countries were asked to provide detailed statistical
information. Table 7 addressed ownership of plantations, and table 17 addressed forest ownership
generally. Categories of ownership were: (1) public, i.e. land belonging to the State or other
public bodies; (2) private, which included forests owned by individuals, families, cooperatives, or
corporations; and (3) other forest ownership, which included indigenous and tribal groups (see
FAO 1998). Many countries either chose not to or were unable to fill out all statistical tables. In
many cases, countries, instead, provided copies of national forest assessments and statistical
reports, which did not necessarily provide statistics on forest ownership. The high priority given
to monitoring changes in forest cover, much of which is accomplished through interpretation ofremotely sensed data, has meant that little follow-up has been given as yet to filling gaps in
information provided by countries through the FRA tables, including information on forest
ownership. It should be obvious that information on forest ownership, much less forest resource
tenure, cannot be collected from space-based platforms, and that more traditional methods must
be followed to collect the information. This paper proposes to address the topic of forest
ownership as a contribution toward development by FAO of a strategy to collect, analyse, and
report on global forest ownership and forest resource tenure.

Global Forest Ownership Page2
Forest Ownership
The purpose of collecting information on forest ownership is not stated in the Global Forest
Resources Assessment 2000. The objectives of forest management vary depending on the owner,
so data on ownership might shed light on the purposes for which forest land is managed.
Presumably public forests are managed for the public good, although that can vary along a
continuum from preservation of forests to protect watersheds, maintain scenic vistas, conserve
biological diversity, and maintain carbon stores to intensive management of forests for public
recreation or production of forest products. Public forests can also be a reserve of land for future
alienation to individuals for agricultural or urban development. The management objectives ofprivate forest owners probably vary even more than those for public forests, but presumably are
focused on the maintenance or improvement of the quality of life of the owner and her or his
family. Distribution of forest ownership type is a poor predictor of production of forest products;
in some countries such as Chile, Sweden and the United States, the majority of forest products
come from private land, whereas in other countries such as Canada,lndonesia and Russia forest
production is predominantly from public forests.
Forest land use rights are among the principles and indicators of sustainable forest management
developed by the Forest Stewardship Council (8S9,2000). Criterion 7 of the Santiago
Declaration on the Montreal Process addresses policy and legal mechanisms, including
clarification of property.ights (MBUC.I!!D, but national statistics on forest land ownership do
not directly apply. Indicator 1 . 1 of Criterion 1 Enabling Conditions for Sustainable Forest
Management of the International Tropical Timber Organzation's Criteria and Indicators at the
national level also addresses land tenure and property rights relating to forests OTTO. 1998).
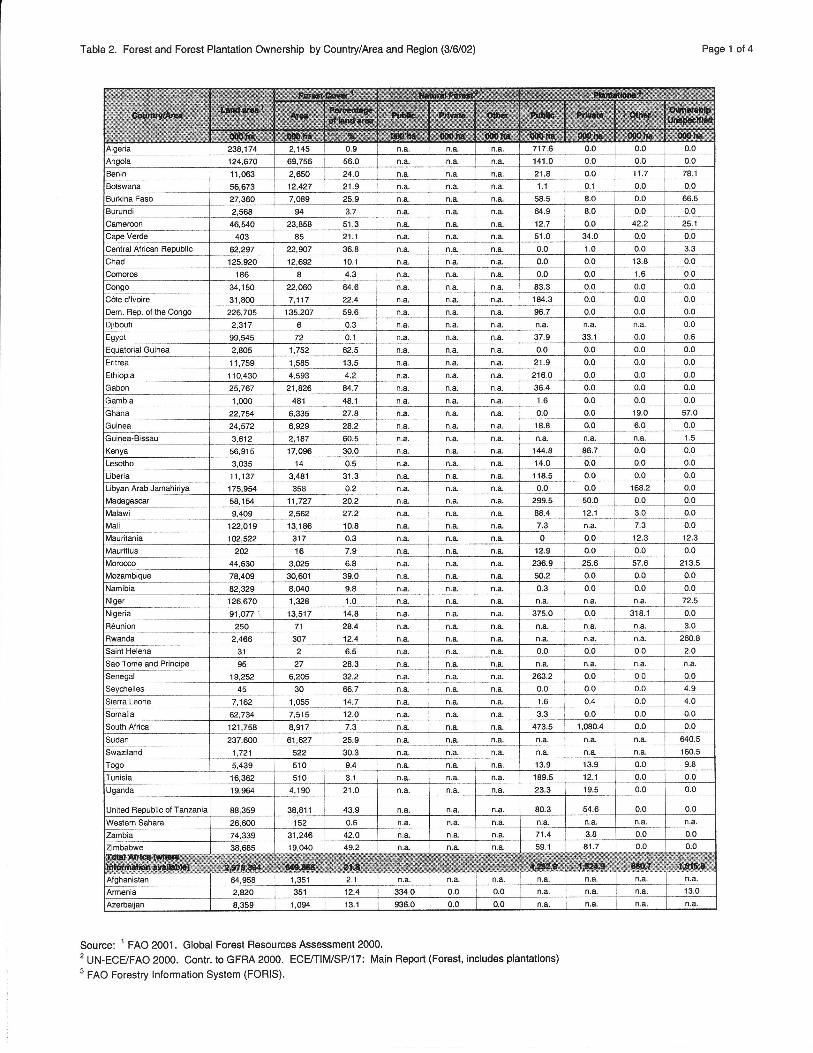
Table I of this paper shows information on global land area, forest cover, forest ownership, and
forest plantation ownership that was readily available in the time dedicated to this study,
summarised by region. Table 2 data on national land area and forest cover, in hectares and as a
percent of total land area, were taken from Table 3 of Global Forest Resource Assessment 2000(fnO. ZOOtt. Inforrnation on ownership of forests, including plantations, for Australia, Canada,
CIS, Europe, Japan, New Zealand and the United States, was taken from United Nations (2000).
That study did not distinguish between plantations and naturally established forests. Information
on plantation ownership was taken from FAO's Forest Information System (FORI$. Tables Iand 2 also portray information on plantation arsa for some countries for which plantation
ownership was not specified but plantation area was substantial and worth noting. Data are
lacking in the FORIS computerized database on ownership of forest lands and plantations formany countries.
Table 1 . Summary of Global Ownership of Forests and Forest Plantations, by Region.
Forest Plantation
Public Private Other Public Private Otherut t-PEgrilE!Ownership
Region (000 ha) (000 ha) (000 ha) (000 ha) (000 ha) (000 ha) (000 ha)
Africa n.a. n,a. n.a. 4,293 1,525 661 1,616
Asia 41 ,581 14,230 0 42,9'30 23,24'l 36,177 13.,134
oceania 120,082 31 ,109 13.627 153 17 0 3,031
Europe 903.281 96,354 9 6 0 32,000NOnn & cenlnalArnerica 291,824 165,857 4,223 1.808 15.265 133 361
South America n.a. n.a. n.a. 1.312 4,085 0 5,058
World 1,3s6,768 307,550 17,850 50,555 44.139 36.971 55,499
\ote: Data on ownership not available for all countries; based on available data.

Global Forest Ownership Page 3
It should be noted that interpretation of this statistical information on forest ownership must takeinto consideration the complexity of the subject. This is because forests are complexcommunities, including numerous biotic and abiotic components. Perhaps more complex and
numerous are the tenurial, stewardship, and spiritual relationships that exist between forestresources and people and communities, both within and adjacent to the forests and at regional,national, and global scales. The significance of these institutional relationships governing use offorest resources (see Thompson & Schoonmaker-Freudenberger,1997) is profound whenconsidering the role of forests in the context of sustainable development for improving the qualityof life of current and future generations.
Forest I-and Tenure
Ownership of the land occupied by forests is the direct statistic presented in Tables I and2, andwould appear to be a simple one to collect. Many countries vest ownership of forest land in thestate, by constitutional, legislative, or executive edict. For instance, the Commonwealth ofIndependent States countries report 100 percent of forest ownership as public (LIN, 2000).However, the right to harvest timber is frequently ceded to private companies in many of these
and other countries, through harvesting licenses or concessions. In these cases, part of the bundle
of rights associated with forest land ownership, the right to harvest trees, has been transferred to
another party, the licensee or concessionaire. Also, in many countries, local people frequentlyhave the right to hunt, hike, and gather non-timber forest products (NTFP) and fuelwood onpublic land, further examples of partial granting of rights of forest land ownership.
Many developed countries have a 100 percent cadastral survey, with all lands titled. In these
countries, it is a relatively straightforward process to determine forest land ownership bycomparing forest cover information with land regrstry records, and many of these countriesregularly maintain this information. In countries without a complete cadastral survey, statistics onhectares of forest land ownership probably can't be accurately collected. Even in those countrieswhere forest ownership is legally documented, the general public frequently has a customary rightto hunt and to gather firewood and NTFPs on lands belonging to the state or other public orprivate owners. Therules governing people's access to resources on public and private forestland, the tenure niche (Bruce,1999), vary from place to place, so the significance of forest landownership needs to be considered in a place-specific manner.
The rights of indigenous populations to forest resources are an issue in many parts of the world,especially where the dominant economic system is a product of a non-indigenous population.
Intemational consensus recognizes these rights, which were affirmed in Principle22 of Agenda
21 @ and Principle 5(a) of the Forest Principles @,agreed to at the Rio Earth Summit. Many American Indian tribes have forest resource tenure
rights recognized under Nation-to-Nation treaties with the United States Govemment.Interpretation oftreaties, and their application on state and private lands, are still being clarifiedunder memoranda of understanding (eg. USFS & GLIFWC" 1998) and legal challenges. landownership and associated rights are an area under rapid evolution in some parts of the world, such
as Africa (Lund, 2000), America, and Asia (Kern et al., 1998).
Forest land vs. Forest Resource Tenure
L,and ownership does not necessarily confer an unrestricted right to control the use of the forest
resources found there (Bruce, 1989), and in many cases, the right to use a specific forest resource
is not necessarily restricted to the owner of the land. Classification of forest land ownership into
such categories as public, private and indigenous is a nebulous endeavour. Resource tenure is
more relevant than land tenure in defrning the role of forests (and their resources) in contributing

Global Forest Ownership Page 4
toward the quality of life of rural people and enterprises (Dubois, 1999). The FRA should
consider collecting country data on institutional arrangements affecting forest resource tenure, in
addition to statistics on forest land ownership, in order to compile and disseminate information
that is more meaningful to sustainable development. However, because of the extreme
complexities and variability of institutional arrangements governing forest resource tenure,
collection of these data will be a challenging task.
Forest Resource Tenure on Public land
Countries, local units of government, and communities have both formal and informal rules
regarding land and resource tenure and rights. The importance and potential of public forest land,
and its resources, to contribute to the quality of life of rural people depend on peoples' use of the
resources on a daily basis, and this use is affected by what rules, or institutional arrangements,
govern that use. It is not unusual for infomral working rules, such as customary rights to gather
fuelwood and edible and medicinal NTFPs, to contradict formal national forestry laws and
regulations @ruce, 1989; Dubois, 1999). The increasing concern over peoples' participation indecisions on, and economic benefit from, forest management (community forestry) has generated
increased focus on understanding and formalising the legal basis for this participation (Bruce,
1999). The FRA will be challenged to collect accurate data on working institutional arrangements
and rules governing resource tenure, not only because of their complexity, but also because
countries will frequently be inclined to provide formal regulations as the national reality.
As the importance of public and private participation in forest management has become more
embraced at the intemational level, and the rights to utilise forest resources have been transferred
to community and private entities in specific instances, so too have forest management
responsibilities been delegated to these non-public parbrers (landell-Mills & Ford, L999). Trends
toward decentalization of government forest administration and privatisation of public forest land
are changing the realities of public forest land resource tenure. Initiatives include devolution ofgovernment control from central to provincial or district levels and management systems
involving the participation of people. Joint management systems in India, community forestryprognrmmes in the Philippines, and village land management in Burkina Faso, Mali, Niger, and
Senegal represent transfer of resource tenure from public to private and indigenous entities (FAO,
1997a). Privatisation of public forest land has occurred as part of transition from centrallyplanned to market economies in Central and Eastem Europe (FAO, 1997b) and in China, Laos,
and Viet Nam (FAO, 1997a).
Forest Resource Tenure on Private I-and
Government regulations usually limit the full exercise of the rights of private forest land
ownership to some extent in the public interest. Although both the scope of formal regulations
and their enforcement vary greatly, a minimal principle is that a landowner's rights end where
another landowner's or the public's rights begrn. In the United States, perhaps the country where
private property rights are most fiercely guarded there is no federal statute directly regulatingforest management on state or private land and only 10 of the 50 United States have State
Forestry Practices Acts 0jAEF-l_998). However, federal statutes such as the Clean Water Actand Endangered Species Act protect water quality and endangered species, respectively, and
similar legislation at the state level provides parallel protection for such public goods in many
states. Many local jurisdictions such as counties, townships or municipalities have enacted
ordinances regulating or banning forestrypractices, the 'Not In My BackYard," or NIMBY,syndrome, with the result that nine states have passed Right to Practice Forestry Acts to counter
this tendency GjASE L99g).

Global Forest Ownership Page 5
Governments have been inclined to regulate forest management on private land in part becausemany of the amenities and services provided by forests, such as watershed protection , aquiferrecharge, habitat for biological diversity, carbon storage, and scenic vistas, benefit the generalpublic, are impossible for a land owner to control access to, and therefore lack markets that wouldmotivate private forest land owners to provide these environmental services (Bruce, 1997;Landell-Mills & Ford, 1999).
However, institutional arrangements that provide markets for amenities and services are beingdeveloped (Landell-Mills & Ford, 1999). Joint implementation under the Framework Conventionon Climate Change, which has evolved into the Clean Development Mechanism of the KyotoProtocol, establishes an opportunity for countries to partially meet their greenhouse gas (GHG)emissions reduction commitments when GHG emitters in that country offset their emissions bypaylng for a parbrer in another country to undertake activities resulting in a net lowering of GHGemissions at a lower unit cost than possible in their own facility. Markets have also been
developed for bioprospecting as a means to pay for biodiversity conservation and ecotourism topay for conservation of scenic and wildlife viewing areas. Costa Rica has been a pioneer indeveloping mechanisms to internalise supply and demand for ecotourism, bioprospecting, carbonsequestration, and watershed protection (Landell-Mills & Ford, 1999). kgal encumbrances onholdings, such as conservation easements, established through these environmental amenitytrading mechanisms represent a portion of a forest owner's rights to use their forest resource thathas been voluntarily sold. These are conceptually little different than other instrumentsdocumenting partial trading of landowner rights, such as easements for access to landlockedproperites and utility rights-of-way. A promising and different approach is Colombia's PlanVerde, which partially internalises costs of watershed protection by transferring a portion ofelectricity receipts from users to land owners in watersheds through regional autonomouscorporations (RodriguezBecerra & Ponce De k6n, 2000).
Another reason that governments have elected to regulate forest management on private land is toimplement a policy that forest lands constitute a source of wood for the forest products industryand non-timber forest products. Regulations also provide for conservation of other ecosystem
components, such as:wildlife, soil, and water. While this is not in itself a bad policy, the nature ofthe regulations frequently assume a command and control approach, embodying a paternalisticgovernment attitude that the private sector will assume a short-terrr approach and not manage ona sustained, and sustainable, basis. According to l^andell-Mills & Ford (1999), government
regulation of private forest management has increased in the last ten years in Bolivia, Branl,Chile, Costa Rica, Finland Honduras, Ireland, the Republic of South Africa, and the UnitedKingdom. However, increased privatisation of forests in Eastern and Central European countries
with economies in transition has created a demand for forest management services that has
outstripped central governments' capability to deliver, with the result that government regulationof private forest management has decreased (FAO, I997b).
Frequently, the transaction costs associated with acquiring the necessary permits to carry outforest management activities on private forest land in countries with command and controlregulations have served as a strong disincentive reducing the efficiency and profitability of forest
management, in effect reducing or effectively eliminating the right of the land owner to use its
forest resources. Onerous regulations frequently provide an incentive for comrption, as bribes ofunderpaid civil servants charged with enforcing the regulations become less costly than the
transaction costs of regulatory compliance. The development of timber certification has been an
effort to use market mechanisms as an alternative to govemment regulations, which are frequently
ineffective and even counterproductive, to promote sustainable manage,ment of public and private
forests (Rametsteiner, 2000; Teisl & Roe, 2000). This approach is based on the assumption, as

Global Forest Ownership Page 6
yet to be bome out, that consumers will be willing to pay a premium for forest products that are
certified to have been sustainably produced.
Conclusions
Forest ownership is a nebulous terrn, and reporting of statistics on ownership of forest lands on a
country basis as part of the FRA should be qualified by a discussion of the complexity ofinstitutional arrangements, i.e. rules, both formal and informal, affecting tenure of forest
resoruces. As discussed above, private citizens, corporations, and indigenous peoples frequently
have the right to use and eqjoyresources from forests classified as public. Similarly, manypublic
benefits u"cru" from private forests and many countries limit the exclusive and free rights ofprivate forest owners to use tle resources on their land. Rather than falling in discrete ownership
categories, forest resource tenure is distributed along a continuum from public to private (Dubois,
reee).
The FRA collects and portmys comparable statistics for all countries for the purpose ofmonitoring world and regional trends. Because of the complexity of forest resource tenure and its
wide variability even within individual counkies, collection of information on resource tenure
might not easily lend itself to developing and publishing of comparable statistics by FAO. ln fact,
locally specific tenure arrangements are probably not reportable as statistics.
Recommendations
The Global Forest Resources Assessment Programme should continue to compile information on
ownership of forest land and forest plantations. The current and future assessments should clearly
note the distinction between forest land ownership and forest resource tenure, and the complexity
of the latter.
FAO's Community Forestry Unit has developed methodologies for appraisal of land and tree
tenure appraisal (Bruce, 1989; Schoonmaker Freudenberger,1994). These methodologies have
been used in specific,locations to provide the basis for policy and project intervention, as in Nepal
(Subedi, et al., 1993) and Madagascar (Schoonmaker Freudenberger, 1995). Continued research
on community-specific forest resource tenure rules using these or comparable methodologies
should continue, especially in the context of sustainable forest management project design and
implernentation. Capacity building and policy analysis undertaken as components of national
forest programmes carried out as proposals for action from the lntergovernmental Panel on
Forests and Intergovernmental Forum on Forests should also include forest resource tenure
analysis for public, private, and other forest land ownership.
Literature Consulted
Bruce J.W, 1989. Community forestry: rapid appraisal of free and land tenure. CommunityForestryNote 5. U.N. Food and Agriculture Organization, Rome' 90 p.
Bruce J.W., 1999. LegaL bases for the management of forest resources as common property.
Community Forestry Note 14. U.N. Food and Agriculture Organization, Rome. 133 p.
Dubois Olivier, 1999. Tenure, sustainable livelihoods and forest management: An overview ofissues and options. International Institute for Environment and Development Forest and l,and
Use Programme, london. 38 p.
Global Forest Ownership PageT
Dubois Olivier, n.d. Rights and wrongs of rights to land and forest resources in sub-SaharanAfrica: Bridging the gap between customary and formal rules. Forest Participation Series
No. 10. International Institute for Environment and Development, London. 34 p.
FAO, 1997a. State of the world's forests 1997. U.N. Food and Agriculture Organization, Rome.
200 p.
FAO, 1997b. Issues and opporfunities in the evolution of private foreshy and forestry extensionin several countries with economies in hansition in Central and Eastern Europe. U.N. Foodand Agriculture Organization, Rome. 163 p.
FAO, 1998. FRA 2000 terms and definitions. Working PaperNo. L Forestry Department, U.N.Food and Agriculture Organization, Rome. l7 p.
FSC, 2000. FSC Principles and criteria. Document 1.2. Forest Stewardship Council, Oaxaca,Mexico. web site: http://www. fscoax. orglhtrnU I -2.html
ITTO, 1998. Criterion 1. Enabling conditions for sustainable forest management. Criteria and
Indicators for Sustainable Management ofNatural Tropical Forests Part A. Indicators attheNational l,evel. International Tropical Timber Organization, Osaka, Japan. web site:
http ://www.itto.orjp/policy/pds9/criterion I .html
Kern Ellen, Kenneth L. Rose,nbaum, Rossana Silva Repetto & Tomme Young, 1998. Trends inforestry law in America and Asia. FAO Legislative Study 66. U.N. Food and Agriculturearganrzation, Rome. 140 p.
Lund Christian, 2000. African land tenure: Questioning basic assumptions. Issue Paper No. 100.
Intemational Institute for Environment and Development, London. 25 p.
Landell-Mills Natasha and Jason Ford, 1999. Privatising sustainable forestry: A global review oftrends and challenges. Instruments for sustainable private sector forestry series. InternationalInstitute for Environment and Development, London. 102 p.
MPWG, 1998. Criterion 7 of Criteria and indicators for the sustainable management of temperate
and boreal forests. Decalaration of the Montreal Process Working Group following their sixthmeeting in February, L995. Web site:http : //www. mpci. orglmeetings/santiago/santiagoT-e.html
NASF, 1998. Fiscal Year 1998 State Forestry Statistics V. State forestry legislation applicable
to forestry in your state. National Association of State Foresters, Washington, D.C. web
page: http:l/www.stateforesters.org/statisticslFYgS-Statistics/legislation.html
Rametsteiner Ewald, 2000. Sustainable forest management certification: frame conditions,
system designs and impact assessment. Ministerial Conference on the Protection of Forests
in Europe, LiaisonUnit, Vienna. 199 p.
Rodriguez Becerra Manuel & Eugenia Ponce De Le6n, 1999. I-a Financidn del "Plan Verde"en
Colombia: Retos y oportunidades. Presentation at the Workshop on Financing Sustainable
Forest Management. U.N. Development Programme Forestry Project. 11 - 13 October,
1999,I-ondon. 27 p.

Global Forest Ownership Page 8
Schoonmaker Freudenberger Karen, L995. Tree and land tenure: Using rapid appraisal to study
natural resource management. Community Forestry Case Study Series 10. U.N. Food and
Agriculture Organrzation, Rome. 85 p.
Subedi Bhishma P., Chintamani L. Das & Donald A. Messerschmidt, 1993. Tree and land tenure
in the eastern Terai, Nepal. Community ForestryCase Study Series 9. U.N. Food and
Agriculture Organtzation, Rome. ll7 p.
Thompson James T. and Karen Schoonmaker-Freudenberger 1997. Crafting institutionalarrangements for community forestry. Community Forestry Field Manual 7. U.N. Food and
Agriculture Organization, Rome. 139 p.
Tiesl Mario F. & Brian Roe, 2000. Environmental certification: lnforming consumers about
forest products. Journal ofForestry 99(2): 36 - 42
United Nations, I992a. Agenda 21: Rio Declaration on Environment and Development. UnitedNations Conference on Environment and Development, 3-14 June 1992, Rio de Janeiro,
Brazil New York
United Nations, I992b. Non-legally binding authoritative statement of principles for a globaol
consensus on the management, conservation and sustainable development of all types offorest. United Nations Conference on Environment and Development , 3-14 June 1992, Riode Janeiro, Br:;nl. New York
United Nations, 2000. Forest resources of Europe, CIS, Norlh America, Ausfalia, Japan, and
New Zealand (Industrialised temperate/boreal countries): I-IN-ECE/FAO Contribution to the
Global Forest Resources Assessment 2000. Main Report. Geneva Timber and Forest Study
Papers, No. 17. UnitedNations, NewYork & Geneva. 445 p.
USFS & GLIFWC ,1998. Memorandtrm of Understanding regarding the recognition and
implementation of tribal ceded territory rights guaranteed by the Treaties of 1836, 1837, and
1842 onNational Forest lands. USDA Forest Service and Great Iakes Indian Fish &Wildlife Commission. Milwaukee, WI. 16 p.
Global Forest Ownership Page 9
List of Contacts
Manuel Paveri-Anziani, Chief, Forestry Policy and Institutions BranchMerilio Morell, Forestry Officeq Forestry Policy and Institutions BranchLennart Ljungman, Forestry Policy and Planning DivisionDouglas Kneeland, Programme Coordinator, Programme Coordination UnitPeter Holmgren, Project Director, Forest Resources Assessment, FAOSoren Dalsgaard, Forest Resources Assessment, FAOPetteri Vourinen, Forest Resources Assessment, FAOZoltan Fazakas, Forest Resources Assessment, FAOOlivier Dubois, Community Forestry Unit, Forestry Policy and Institutions BranchDominique Reeb, Community Foresty Unit, Forestry Policy and Institutions BranchHiroyuki Tanaka, Community Forestry Unit, Forestry Policy and Institutions BranchAli Mekouar, Development Law Service, FAOJon Lindsay, Development Law Service, FAODavid Palmer, Land Tenure ServiceMichael Martin, Forestry Planning and Statistics BranchAdrian Whiteman, Forestry Planning and Statistics BranchSusan Braa%, Forestry Planning and Statistics BranchChristel Palmberg-Lerche, Forest Resources Development ServiceFroylan Castaffeda, Forest Resources Development ServiceKenneth G. McDicken, Director of Research, CIFORChetan Agarwal, Forest Trends
' John W. Bruce, Senior Counsel, ESSD and International Law, Legal Department, World Bank
Algeria 238.174 2.145 0.9 n.a. n.a, 717.6 0.0 0.0 o.0
Angola 124,670 69,7s6 56.0 n.a. n.a. n.a. t4't.0 0.0 0.o 0.0
Benin 1 1.063 2,650 24.O n.a. 21.8 0.o 11.7 78.1
Botswana 56,673 12,427 21.9 n.a. n.a. 1.1 0.1 0.0 0.0
Burkina Faso 27,5@ 7,089 25.9 n.a 58.5 8.0 o.0 oo.c
Burundi 2,568 94 3.7 n,a. n.a, n.a, el.9 8.0 0.0 0.0
lameroon 46.540 23.858 51.3 n.a. n.a. n.a 12.7 0.0 42.2 25.1
iape verde 403 85 21.1 n.a. n.a. n.a. 51.0 34.0 0.0 0.0
lentral African Reoublic 62.297 ?2,W7 36.8 n.a. n,a. n.a. 0.0 1.0 0.0 3.3
-;'had 125,920 12,69? i 10.1 n.a. n.a, 0.0 0.0 13.8 0.0
lomoros 186 I 4.3 n.a. n.a. n.a. 0.0 0.0 1.6 0.0
lolsgl01e d'lvoire
34,150 22,O@ 64.6 n,a. n.a n.a. s3.3 0.0 0.0
0.0,.Q,0-0.031,800 7.1'17 22.4 n.a. n.a, n.a. 184.3 0.0
)em. Rep, of the Congo 226,705 't35,207 59.6 n,a n,a. n.a, 96.7 0.0 0.0 0.0
ljibouti 2,317 6 0.3 n.a. n.a. n,a. n.a. n.a. 0.0
:gYPl 99,545 72 o.1 n.a, n.a. n.a. 37.9 aol 0.0 0.6
:qualorial Guinea 2,805 1,752 62.5 n.a. 0.0 0.0 0.0 0.0
:ritrea 1 I,759 r,585 't 3.5 n.a. n.a. 21.9 0.0 0.0 0.0
:thiooia 110,430 4,593 4.2 n.a. n.a. n.a. 2t6.0 0.0 0.0 0.0
fabon 21,826 u.7 n.a. n.a. n.a. 0.0 0.0 0.0
Gambia 1,000 481 48.1 n.a. LD 0.0 0.0 0.0
Ghana 22,7* o,oJo 27.5 n.a, n.a n.a. 0.0 0.0 r 9.0 57.0
iuinea 24.572 6.929 28.2 n.a n.a n.a. 18.8 0.0 o,u o.o
fuinea-Bissau 3.612 2.'187 60.5 n.a. n.a. n.a. n.a, n.a. 1.5
(enya 56.91 5 17,096 30.0 144.8 86.7 o.0 0.0
-eetho 3,035 14 0.5 n.a. n.a. 14.0 0.0 0.0 0.0
-iberia 11,'l.37 3,481 31.3 n.a. n.a. n,a. 1 18.5 0.0 0.0 0.0jbyan Arab Jamahiriya t75,99 358 o.2 n.a n.a. n.a 0.0 0.0 168.2 0.o
vladagasr 58,'t54 '11,727 20.2 n.a. n.a. 299.5 50.0 0.0 0.0
9.409 2.562 : 27.2 88.4 12.1 3.0 0.0
0.0t4ali 122,O19 13,186 . 10.8 n.a. n.a. n.a. 7.3
t auritania 102,522 317 0.3 n.a n.a. n,a 0 0.0 12.3 12.3
t4auritius 202 16 7.9 n.a 12.9 0.0 0.0 0.0
vlorocco 44.630 3,025 o.o n.a. n.a. 236.9 25.6 c/.o 213.5
v'lozambioue 78,409 30,601 39.0 n.a. n.a. n.a. 50.2 0.0 0,0
lamibia 82,329 8,040 9.8 n.a. n.a. n,a. 0.3 0.o 0.0 0.0
!iger 126,670 1.328 1.0 n.a. n.a. n.a. n.a. n.a.
!igeria 91,077" 13.517 '14.8 n.a n.a. 0.0 31 8.1 0.0
l0union 250 71 28.4 n.a. n.a. n.a. n.a.
n.a.
n,a. 3.0
lwanda 2.466 307 12.4 n.a n.a. n.a. n.a.
Saint Helena 31 6.5 n.a, n.a. n.a. o.o 0.0 o.0 2.O
Sao Tome and Princioe 95 27 28.3 n.a. n.a. n.a. n.a. n.a. n.a. n.a.
ieneqal 19,252 6,205 32.2 n.a. n.a. n.a. 263.2 0.0 o.0 o.0
ieycfrelles 45 30 66.7 n.a. n.a. n.a 0.0 0.0 o.0 4.9
;ierra Leone 7,162 1,055 14.7 n.a. n.a t.o 0.4 0.0 4.0
Somalia 62.734 /.cro t1.v n.a. n.a. n.a 3.3 0.0 0.0 o.o
South A{rica 121.758 8,917 ) 7.3 n.a n.a. 473.5 1,080.4 0.0 0.0
Sudan 237.600 61,627 25.9 n.a n.a. ll'1,
n,a.
n.a. n.a.
n.a.
640.5
Swaziland 1.721 522 30.3 n.a n.a. 160.5
Togo 5.439 510 9.4 n.a n.a. 13.9 13.9 o.0 9.8
Tunisia 16,362 510 at n.a. n.a. n.a, lao 4 12.1 0.0 0.0
Jganda r 9,964 4,1 90 21.O n,a. n.a. 23.3 19.5 0.0 0.0
United Republic of Tanzania 88.359 38.81 1 43.9 n.a. n-4. n.a. 80.3 54.6 0.0 0.0
Weslem Sahara 26.600 152 n.a. n.a. n.a. n.a. n.a, n.a. n.a.
Zambia 74,339 31,246 42.O n.a. n.a, 71.4 3.8 o.o 0.0
Zimbabwe 38,685 19,040 49.2 n.a, n,a. 59.1 81.7 0.0 0.0
\fghanislan 81,958 1,35't 2.1 n.a. n,a. n.a n.a. n.a. n,a. n.a.
\rmenia 2,420 12.4 334.O 0.0 0.0 n.a. n.a, n.a. 13.0
\zerbaian 8.359 1.094 1 3.1 936.0 0.0 0.0 n.a. n.a. n.a. n.a.
Table 2. Forest and Forest Plantation Ownerhip by Country/Area and Region (3/6/02)
Source: t FAO 2001. Global Forest Resources Assessment 2000.
'UN-ECEJfAO 2000. Contr. to GFFiA 2000. ECE/T|I/VSP/17: Main Report (Forest, includes plantations)3 FAO Forestry Information System (FORIS).
Page I of 4

lahrain 69 n.s. n.s. n.a. n.a. n.a. o.4 0.0 0.0 o.0
langladesh 13.017 1,334 10.2 n.a. n.a. n.a. 53S.0 0.0 91.8 0.0
3.016 u.2 n.a. n.a. n.a. 21.4 0.0 0.o 0.9
0.0lrunei Darussalam 527 442 83.9 n.a. 1.9 0.9 0.0
lambodia 17,62 9,335 s2.9 n.a. n.a. 0.o 0.0 82.4
lhina 932,743 163.480 n.a. 10,283.9 0.0 34,799.1 0.0
lyprus 925 172 18.6 104.0 13.0 0.0 n.a. n.a. n.a,
)em People's Rep. ot Korea 12,U1 4,2'to w.z n.a. n.a. n.a. n.a. n.a, n.a
:a$ Imor 1,479 507 34.3 n.a. n.a. n.a. n,a. n.a. n.a, n.a
iaza Strip 38 n.a. n.a. n.a. n.a. n.a. n.a n.a
ieorgia 6,831 2,988 43.7 2,988.0 0.0 0.0 n.a. n,a. n.a 200.0
India 297,91 q
181,157
64,1 13 21.6 n.a. n.a. r 9,627.0 12,391.O 55e_€
0.0
0.o
0.0Indonesia 104,986 58.0 n.a. 4,449.2 4,9U1
ran, lslamic Rep. 162,201 7,299 4.5 n,a. n.a. n.a. 2.'179.2 105.1 0.0 0.0
raq 43.737 799 1-8 n.a, n.a. n.a. 't0.4 0.o 0.0 0.0
lsrael 2,0,62 132 6.4 121.O 1.0 n.a. n.a. n.a. n.a 91.0
Jaoan 37,652 24.081 64.O 9,863.0 | 4,201.0 0.0 n.a, n.a 1 0,682.0
Jordan 8,893 86 1.0 n.a. n.a. n.a. 37.9 7.5 0.0 0.0
(azakhstan 267.O74 12,'148 4.5 r0.504.0 0.0 0.0 n.a n.a n.a. 5.0
fuwait 1,782 0.3 n.a. n.a. n.a 4.9 o.o 0.0 0.0
19.180 t.003 5.2 729.O 0.0 0.0
n,a.
n,a. n.a. jL,o
o.o-ao People's Dem. Rep 23,080 12,561 v.4 n.a. n,a, 0.0 0.0 53.9
-eoanon 1,O24 36 EE n.a. n.a, n,a. 1.8 0.0 0.0 0.0
\ralaysia s2,855 19,2y.2 L 58.7 n.a, n.a n.a. 439.9 1.309.6 0.0 0.0
vlaldives 3.3 n.a n,a. n,a. n.a
\,longolia 156,650 10,64s 6.8 n.a n.a. n.a. n.a. n.a. n.a. n.a.
vlyanmar 65.755 u,419 52.3 n.a 202.4 11t.0 0.0
\epal 14,300 3,900 n.a. n.a. n.a. 112.8 25.3 0.0 0.0
)man 21,246 1 0.0 n.a. n.a. 0.5 0.0 0.5 0.0
Pakistan
Fnitippines
77,O87 2,361 3.1 .!:1n.a.
!:1n.a,
!3:n.a.
191,3295.4
7e9.7
361.0
o.o
97.09.00.029,817 s.789 19.4
f,alar 't.100 I 0.1 n.a. n.a, 0.6 0.0 o.0 0.0
lepublic ol Korea 9,873 6,244 63.3 n.a. n.a. n.a. n.a, n.a. n.a.
3audi Arabia 214,969 1,504 o.7 n.a. 3.7 0.0 0.0 0.0
iingapore 61 3.3 n.a. n.a. n.a. n.a, n.a. n.a.
Sri Lanka 6,463 1,940 30.0 n.a, n.a. n.a. 1't4.6 36.9 164.0 0.0
Syrian Arab Republic 18,377 461 z,a n.a. n.a. n,a. 229.O 0.0 0.0 0.0
T4ikistan 14,@7' 400 2.8 400.0 0.0 0.0 n.a. n.a. n.a. 10.0
Thailand 51.089 14,762 28.9 n.a. n.a. n.a. 2,068.8 2,851.2 0.o _ 0.0,1.8il.0Turkey 76.963 to,225 13.3 9,939.0 15.O 0.0 n.a. n.a
furkmenis{an 46,992 3,755 8.0 3,754.0 0.0 0.0 n.a. n.a. n.a. 12.4
Jnited Arab Emirates 8,360 321 3.8 n.a n,a. n.a. 313.7 o.o 0.0 0.0
Jzbekislan 41,424 1.969 4.8 1,909.0 0.0 0.0 n.a. n.a. n.a. [email protected]
y'iet Nam 32,550 9.819 30.2 n.a. n.a. n.a. 'I,1 13.7 170.2 299.9 127.O
l/est Bank 580 n,a. n.a. n.a. n.a. n.a,
femen 52,797 449 0.9 n.a. n.a. n.a n.a. n.a. n.a.
American Samoa 20 12 60-1
rr+"^"on.a. n,a. n.a n.a. n.a. 0.0
Aus{ralia 76€.230 154,539 20.1 28,683.0 13,627.O n.a n.a.
3ook lslands 22 95.7 n.a. n.a. n.a 0.0 1.1 0.0 0.0
Fiji 1,827 815 44.6 n.a. n.a 87.5 9.7 0.0 0.0
:rench Polynesia 366 t05 28.7 n.a. n.a n.a 2.4 z.o 0.0 0.0
iuam 21 34.2 n.a. n,a, n,a. 0.4 0.0 0.0 0.0
(ribati 73 28 38.4 n,a. n.a. n.a. n.a. n.a. n.a. n,a.
vlarshall lslands 18 n.s. n.a. n.a. n.a. n.a. n.a. n.a. n.a.
ilicronesia 69 15 21.7 n.a. n.a. n.a. 0.1 0.0 0.0 0.0
rauru 2 n.s. n.a. n.a. n.a. n.a n.a. n,a.
{ew Caledonia t,824 372 20.4 n.a. n.a. 2.'l 0.0 0.0
{ew Zealand 26,799 7,6 29.7 5,514.O 2,426.O 0.0 n.a. n.a, n.a. 1,542.0
\tue 26 n.a. n.a. n.a. 0.4 o.o 0.0 0.0
{orthern Mariana lsl. 46 14 30.4 n.a. n.a. n.a. n.a. n.a
Table 2. Forest and Forest Plantation ownership by country/Area and Region (316102)
Source: t FAO zoo1. Global Forest Resources Assessment 2000'
' Ut|-ECE/FAO 2000. Contr. to GFRA 2000. ECgTlN,|/SP/17: Main Report (Forest, includes plantations)t FAO Forestry Information System (FORIS).
Page 2 ol 4

Table 2. Forest and Forest Plantation Ownership by Country/Area and Region (316/02\
Source: t FAO 2001. Global Forest Resources Assessment 2000.
'UII-ECE/FAO 2000. Contr. to GFF{A 2000. ECgTllWSPllTi Main Report (Forest, includes plantations)3 FAO Forestry Information System (FORIS).
Page 3 of 4
)aoua New Guinea 45,239 30,601 ] 67.6 n.a, n.a. n.a. n.a. n.a. 89.8
iamm ?42 105 n.a. n.a 3.6 0.9 o.0 0.0
iolomon lslands 2,856 2.536 88.8 n.a. n.a. 49.9 0.0 0.0 0.0
Tmga 73 5.5 n.a. n.a. 0.0 0.0
/anualu |,218 447 JO. / n.a. n.a. n.a. n.a, n.a. n.a
ffiM102.O\lbania 2,740 991 36.2 1,030.0 0.0 0.0 n.a. n.a,
\ndorra 45 n,a. n.a. n.a. n.a. n.a. n.a
\uslria 8,273 3,886 47.O 672.O 3,168.0 0.0 n.a. n.a. n.a
lelarus 20,748 9,402 4s.3 7,865.0 0.0 0.0 n.a. n.a n.a. 194.8
gelgjum & Luxembourg
3osnia & Herzegor'ina
3,282 728 22.2
i.ita , +qs279:o
1.785.0
367.0 0.0 !.i:n.a.
n.a. n.a.
n.a.
n.a,
5,100 491.0 0.0 n.a, 56.9
3ulgaria '1 1.055 3.690 33.4 3,590.0 o.0 0.0 n.a. n.a, n.a. 968.5
Croatia 5.592 1,783 31.9 1,341.O 434.0 0.0 n.a. n.a. n.a. 47.O
Czech Republic 7,728 2,632 34.'l 2,2'12.O 418.0 0.0 n.a. n.a. n.a. n.a
)enmark A 2L? 455 10.7 140.0 JW.U 0.0 n.a. 340.7
Eslonia 4,227 2,060 48.7 'I,84 1.0 175.O o.0 n.a. n.a. 305.0:inland 30,459 21,935 72.O 6.332.O 15.551.0 0.0 n.a n,a. n.a.
-rance 55,010 r 5,341 27.9 3.965.0 | 1.191.0 0.0 n.a 961.0
3emany 34,927 't0,740 30.7 5.762.O 4.978.0 0.0 n.a. n,a.
3reece r2,890 3.599 27.9 2.603.0 0.0 n.a. n.a. 't20.o
lungary 9.234 1.840 t9.9 1,169.0 u2.o 0.0 n.a. n.a. n.a. 136.2
celano 1 0.02s 31 9.0 2'l.o 0.0 n.a. n.a 12.O
reland 6,889 659 391.0 200.0 0.0 n.a. 590.0
tary 29,406 10,003 34.O 3.252.0 6,505.0 0.0 n,a. n.a, 133.0
-awra 6,205 2,923 47.1 1.U7.O 0.0 n.a. n.a. n.a. 143.0
-iecitenstein 15 7 6.O 1.0 o.o n,a n.a. n.a,
-ilhuania 6,258 1,994 31.9 1,628.0 350.O 0.0 n.a. n.a n.a, 2U.O
Malta n.s. n.s, 0.3 0.0 0.0 n.a. n.a, n.a 0.3
Netherlands 3,392 375 11.1 173.0 166.0 o.0 n.a, n.a. 100.0
{omay 30,683 8.868 28.9 1.226.0 7,484.0 0.0 n,a. n.a. 300.0)oland 30.442 9,U7 29.7 7,449.0 1,493.0 0.0 n.a. n.a, n.a. 39.0)ortugal 9.150 J.@ 40.1 248.O 3,135.0 0.0 n.a, n.a, n.a 834.0
lepublic of Moldova 3,296 9.9 324.O 0.0 0.0 n.a. 1.3
lomania 23,034 6,448 28.O 5.96r.0 340.0 0.0 n.a 90.6
lussian Federation 1,688,851 851,392 , 50.4 816.538.0 0.0 0.0 n.a. n.a n.a. 17,340.0
ian Marino 6 n,a. n.a. n.a, n.a. n.a. n.a.
;lovakia 4,808 2,'177 i 45.3 1,124.0 892.0 0.0 9.0 6.0 0.0 0.0
ilovenia 2.O12 1,107 55.0 330.0 769.0 0.0 n.a. n.a, 1.0
ipain 49,945 't4,370 28.8 4,23s.0 9,274.O 0.0 n.a. 1,[email protected]
iweden 4 1,162 27,1U 65.9 4.555.0 22.699.0 0.0 n.a. n.a n.a 569.0
;witzerland 3,955 1,199 30.3 800.0 373.0 0.0 n.a. n.a. n.a. 4.O
It|e FYR of Macedonia 2,543 906 35.6 707.O 199.0 0.0 n.a. n.a. 30.0
Jkraine 5/.gJC 9.s84 16.5 9,4s8.0 0.0 0.0 n.a. n.a. n,a. 4,425.O
Jnited Kingdom 24.160 2,794 11.6 1,072.0 1,397.0 0.0 n.a. 1,928.0
r'ugoSavia 10.200 2.887 28.3 1,552.0 1,3r'.2.O 0.0 n.a. 39.4
\ntigua and Barbuda 44 9 20.5 n.a. n.a n.a. n.a. n.a. n.a.
3ahamas 1,001 u2 84.1 n.a n.a. n.a. n.a, n.a. n.a. n.a.
3arbados 43 2 n.a, n.a, n.a. n-4. n.a, n.a, 0.0
3elize 2.280 1.348 59.1 n.a. n.a, n,a. 1.2 1.1 0.o 0.0
3emuda n.a. n.a. n.a n,a n.a. n.a. n.a.
Brilish Virgin lslands 15 3 20.o n.a. n.a. n.a, n.a n.a. n.a.
lanada 922,O97 244,571 26.5 21 9.399.0 24,096.0 1,076.0 n.a. n.a. n.a n.a
layman lslands 26 IJ n.a. n.a. n.a. n.a. n.a. n.a n.a.
Costa Flica 5,106 1,968 J6.C n.a n.a. 178.0 34.3 0.0 0.0
Cuba 10.982 2,U8 21.4 n.a. n.a. 394..2 34.3 0.0 5J,U
Dominica 46 61.3 n.a. n.a n.a. n.a, n.a, 0.1
Dominican BeDublic 4,838 1,376 | 28.4 n.a. n.a. n.a. n.a. n,a 30.0

:l Salvador 2,O72 121 5.8 n,a. n,a. n.a. n.a. n.a, n.a. 13.8
)reenland 34,170 n.a. n.a. n.a. n.a. n.a. n.a.
3renada
169
14.7 n.a. n.a. n.a. n.a. o,2
4.1iuadeloupe 82 48.5 n,a. n.a. n.a. n.a. n.a.
Suatemala 10,843 2,850 26.3 n.a. n.a. n.a. n.a. n.a. 132.4
Haili 2,756 88 3.2 n.a n.a, n.a. n.a. n.a. n.a 20.o
Honduras 1 1,189 5,383 48. t n.a n.a. n.a, n.a. 47.6
Jamaica 1,083 s25 30.0 n,a. n.a. n.a. 8.5
Marlinique 107 47 43.9 n.a, t.6 0.0 0.0 0.0
llexic! 190.869 55,205 28.9 n.a. n,a. 't6.0 118.5 133.4 0.0
\rontserrat 11 3 27.3 n.a. n.a. n.a. n.a. n.a, n.a
\,letherlands Antilles 80 n,s. n,a. n.a. n.a. n.a, n.a.
\,licaraoua 12.140 3,278 27.O n.a. n.a. n.a. n.a, n.a, 46.0
)anama 7,443 2,476 38.6 n.a. n,a, n.a. t6.4 23.7 0.0 0.0
tuerlo Rico aa7 229 25.4 n.a n.a. n.a. n.a 4.0
Saint Kitts and Nevis 36 11.1 n.a n.a. n.a. n.a, n.a n.a.
Saint Lucia o 14.8 n,a. n.a. n.a. n.a. n.a. n.a. u.b
iaint Pierre & Miquelon 23 n.a. n.a. n.a. n.a, n,a
iarnt vrncent anoSrenadines 39 b 15.4 n.a. n.a. n.a. n.a. n.a. 0.3
frinidad and Tobago 513 259 50.5 n.a. n.a. n.a. r 5.3 0.0 0.0 0.0
United Slates 915.895 225,993 24.7 72.425.O t41.761.0 3,147.0 1,.184.9 1 5,053.2 0.0 0.0
JS Virgin lslands 34 14 41 n.a n.a, n.a. n,a. n.a. n.a.
\rgentina 273,669 34,648 12.7 n.a, 0.0 926.0 0.0 0.0
lolivia r08,438 s3,068 48.9 n.a. n.a. n.a. n.a. n.a. 45.6
*azil 845,651 s3.905 64.3 n,a. n.a. n.a. n.a. 4,981.5
lhile
;olomUiJ74,881 15.536 20.7 n.a. n.a. n.a. 104.5 1.912.5 0.0 0.0
n.a.103,871 49.601 47.8 n,a. n.a. 141.0 n.a. n.a.
:cuador 27,684 10.557 38.1 n.a. n.a. n.a. t33.6 33.4 0.0 0.0
:alkland lslands 1.217 n.a. n.a. n.a. n.a, n,a. n.a. n.a.
:renc*\ Guiana 8.815 7,926 , 89.9 n.a. n.a. n.a, n.a n.a. n.a. o.7
luyana 21,4 16,879 78.5 n.a. n.a n.a. n.a. n,a. l2.oearaguay 39,730 23,572 58.8 n.a. n.a- n.a, 0.0 21.3 0.0
teru 128,O00 65.215 50.9 n.a. n.a. n.a. 192.O 448.0 0.0 0.0
Suriname 15,600 14,1 13 90.5 n,a. n.a. n.a. n.a. n.a. n.a. 12.7
Uruguay 17,441 1.292 n.a. n.a, n.a. 0.0 622.O 0.0 0.0
Veneruela 88.206 49,506 s6.1 n.a. n,a. 740.9 122.1 0.0
Table 2. Forest and Forest Plantation ownerhip by country/Area and Region (316102)
Source: t FAO 2001. Global Forest Resources Assessment 2000.
'UN-ECSFAO 2000. Contr. to GFRA 2000. ECgTlfvVSPllT: Main Report (Forest, includes plantations)s FAO Forestry Intormation System (FORIS).
Page 4 of 4