for the year ended 31 december 2011 annual report/media/files/f/... · for the year ended 31...
TRANSCRIPT
Falck Renewables S.p.A.Via Alberto Falck 4-16, 20099 Sesto San Giovanni (MI) ITALYph +39.02.24332360www.falckrenewables.eu - [email protected]
AN
NU
AL
REPO
RT F
OR
THE
YEA
R EN
DED
31
DEC
EMBE
R 20
11 ANNUAL REPORT
FOR THE YEAR ENDED 31 DECEMBER 2011

Annual report for the year ended 31 December 2011

2
Letter of the Chairman to the shareholders and stakeholders 4Letter of the Chief Executive Officer to the shareholders and stakeholders 6
1 Notice of annual general meeting 9
2 Company officers 12
3 Group structure 13
4 Consolidated financial highlights 14
5 Directors’ report
5.1 Falck Renewables group operating and financial review5.1.1 Falck Renewables group profile 175.1.2 Regulatory framework 185.1.3 Performance 255.1.4 Non-financial performance indicators 305.1.5 Share price performance 315.1.6 Performance of business sectors 315.1.7 Review of business in 2011 415.1.8 Employees 435.1.9 Environment, health and safety 445.1.10 Research and development activities 455.1.11 Risks and uncertainties 455.1.12 Significant events after the balance sheet date 545.1.13 Management outlook and going concern 545.1.14 Combined results 55
5.2 Operating and financial review of Falck Renewables SpA5.2.1 Financial highlights 605.2.2 Performance and review of business in 2011 605.2.3 Employees 615.2.4 Capital expenditure 615.2.5 Directors, statutory auditors, general managers and their interests 615.2.6 Related party transactions 615.2.7 Direction and coordination activities 635.2.8 Holding of own shares or parent company shares 635.2.9 Purchase and sale of own shares or parent company shares 635.2.10 Share schemes 635.2.11 Corporate governance and code of self-discipline 635.2.12 Legislative decree 231/01 635.2.13 Proposed appropriation of loss for the year 64
3
6 Consolidated financial statements6.1 Balance sheet 676.2 Income statement 686.3 Statement of comprehensive income 696.4 Cash flow statement 706.5 Statement of changes in equity 716.6 Notes to the consolidated financial statements 726.7 Additional disclosures regarding financial instruments in accordance with IFRS7 109
7 Supplementary information to the consolidated financial statements7.1 List of investments in subsidiaries and associates 125
8 Falck Renewables SpA separate financial statements8.1 Balance sheet 1298.2 Income statement 1308.3 Statement of comprehensive income 1318.4 Cash flow statement 1328.5 Statement of changes in equity 1338.6 Notes to the financial statements 1348.7 Additional disclosures regarding financial instruments in accordance with IFRS7 169
9 Supplementary information to the Falck Renewables SpA separate financial statements9.1 List of direct and indirect investments in subsidiaries and associates 1779.2 Summary of significant financial data from latest financial statements
of subsidiaries and associates 179
10 Certifications on consolidated and parent company financial statements pursuant toarticle 81-ter of Consob Regulation 11971 of 14 May 1999 as amended 185
11 Report of the board of statutory auditors to the annual general meeting 189
12 Independent auditors’ reports 197

Before commenting on the year that has justpassed, I would like to pause and reflect on aspecific day that was fundamental to achievingthis year’s results, more precisely 28 May 2010,the day on which the relevant boards of directorsapproved the extraordinary project to consolida-te all of the Falck Group’s renewable activities.
Numerous variables could have affected thischange, but I believed then, as I do now, thatbusiness is founded on the courage to embracechange. Falck Renewables was created on thisprinciple, which has always promoted change inthe Falck Group, and now we are delighted toillustrate the results of the previous year.
2011 was an exemplary year in terms of finalisedprojects and outstanding financial results thatare illustrated further in the Chief Executive Offi-cer’s letter.
Falck Renewables’ growth this year was unstop-pable, confirming once again that we chose theright direction and that the business plan isbased on sound assumptions and shows ampledevelopment potential.
As an example of our growth model and thevalues to which we aspire, it is worth highlightinganother longstanding business characteristicthat is apparent in the activities finalised thisyear: interaction and collaboration with the com-munities in which we work. Recent examples ofthis include: three quarters of the companiesthat worked on the construction of the Buddusò- Alà dei Sardi wind farm, which commencedoperations in 2011 boasting the largest installedcapacity in Italy, were local companies from Sar-dinia; a cooperative of young people is involvedin security and maintenance activities at the San
Sostene wind farm, providing an invaluablesource of employment in an area hit by highunemployment; more than 300 students visit ourTrezzo sull’Adda WtE plant every year.
We have also embarked on numerous social andenvironmental initiatives at our overseas opera-tions: at Cefn Croes in the UK, every year wesupport a countryside restoration plan thatincludes projects to safeguard a number of spe-cies of local wildlife and protect moorland andbog habitats, in Ben Aketil local species of birdsare monitored and in Kilbraur a conservationplan to maintain the existing natural habitat is inthe pipeline.
Falck Renewables is today the leading indepen-dent producer of renewable energy and I wouldlike to thank the Chief Executive Officer and themanagement team together with all of the staffwho, through their hard efforts, determinationand effectiveness, achieved significant andsustainable operating results. I also thank theboard of directors and the committees that pro-vided invaluable constructive support to thesegreat developments.
I am confident that the results achieved this yearhave provided the impetus for future develop-ment that we will build on together.
The ChairmanFederico Falck
4
Letter of the Chairman to the shareholders and stakeholders

5

6
2011 marked the“birth” of Falck Rene-wables, following themerger of the FalckGroup’s renewableenergy generatingactivities into onecompany.
This was a highly suc-cessful year for FalckRenewables that wit-nessed achievementsboth in terms of pro-jects developed andfinancial results, and
demonstrates the fact that we upheld and car-ried through all of our commitments to our sha-reholders and stakeholders with passion andconviction.
I personally would like to thank our manage-ment team and all of my colleagues for thedetermination and enthusiasm they showed incarrying out their work over the year and for thesupport they provided to the projects.
From a business perspective, Falck Renewa-bles increased its installed capacity from 498 to684 MW (+37%) in 2011, firmly cementing itsleadership position in the private independentrenewable energy production sector in Italy andEurope. This increase is thanks to the photo-voltaic plants of Cardonita, Spinasanta andSugherotorto in Sicily, amounting to a combined13 MW, the expansion of Kilbraur and Millen-nium in Scotland (35 MW) and the Buddusò -Alà dei Sardi wind farm (138 MW), all coming onstream this year. The latter is the largest windfarm in Italy with an estimated annual output ofapproximately 330 GWh that alone is able tomeet the energy needs of 110,000 average Ita-lian families. It was inaugurated last October
and took only 30 months to construct. Theincrease in installed capacity, together withimproved operating efficiency, cost synergies,better plant performance and careful manage-ment of our energy portfolio led to an increasein electricity generated from 1,147,000 MWh to1,560,000 MWh, corresponding to the energyrequirements of more than 500,000 Italian fami-lies and an outstanding improvement in thefinancial results compared to the combinedfigures for 2010.
This is a significant milestone, particularly inenvironmental terms, which we share with localcommunities: our clean energy meant thatapproximately 550,000 tons of CO2 emissionsto the atmosphere were avoided. The environ-mental and social, together with economic,responsibility of Falck Renewables’ projects is afundamental element of our corporate missionand an aspect on which we will focus evenmore in future in our pipeline of around 1,000MW of new projects across the UK, France andPoland. Over the next few years our efforts willbe concentrated on Poland due to its high rene-wable energy potential.
We also recorded 11% growth in the wastetreatment business, due to more effective main-tenance work on the Trezzo sull’Adda (20 MW)and Granarolo dell’Emilia (49% stake) plants,together with the impact of the full year’s con-solidation of Esposito Servizi Ecologici Srl andEcocentro Soluzioni Ambientali Srl that provideenvironmental services including waste selec-tion, treatment and transformation.
Financial growth exceeded expectations, recor-ding marked percentage increases: Ebitdaamounted to Euro 141.7 million (+49.9% on the2010 combined amount), which significantlysurpassed the estimated Euro 130 million com-municated to the market at the time of the share
Letter of the Chief Executive Officer to the shareholders and stakeholders

7
capital increase finalised in March. Revenuealso bettered expectations, equalling Euro248.6 million (+34.7% on the 2010 combinedamount), while profit for the year closed at Euro19.8 million, more than eight times the 2010combined amount. Profit for the year wouldhave reached Euro 32 million without the impactof the deconsolidation and impairment lossrecognised against Palermo Energia Ambiente,which is detailed in full in the Annual Report. Itake this opportunity to reassure those share-holders and stakeholders who read the report:the stake in Pea has been written off in full andas a consequence is no longer included in theGroup’s scope of consolidation.
The net financial position net of the fair value ofderivatives is a net indebtedness of approxima-tely Euro 765 million, even lower than expected.
All of the above results take on a new light whenconsidered in the context of the current econo-mic crisis and confirm the solidity of the projectimplemented at the end of 2010 to consolidatethe Falck Group’s renewable activities.
2011 was also a year in which we laid the foun-dations for future growth: we secured theauthorisations for the Spaldington Airfield (15MW) and West Browncastle (30 MW) windfarms, construction work commenced on theNutberry (15 MW) wind farm and we enteredtwo joint ventures with Photonike and L.E.D.Lighting and Renewable Energy Development,for the development of rooftop photovoltaicplants in Italy, in addition to launching initiativesto develop the future pipeline in areas of interestacross Europe.
With regard to the outlook for 2012 this willmark a year of growth for Falck Renewablesthanks to the full year impact of the Buddusò -Alà dei Sardi plant, the expansion of the Scot-
tish plants Millennium and Kilbraur and the pho-tovoltaic plants in Sicily. Other projects will alsocome on stream this year: the Petralia Sottanawind farm (22 MW) and the Ty Ru wind farm inFrance (10 MW) that, together with our existingoperating plants, we estimate will bring Ebitdato more than Euro 155 million.
I would like to provide a brief update on the2012-2014 business plan that was approved bythe Board of Directors together with the AnnualReport. The plan confirms the drivers of diffe-rentiating by production technology and bygeographical area and envisages sustainablegrowth centred on areas where there is a higherconcentration of renewable energy sources andon countries investing in the expansion of rene-wable energy.
We expect to have an installed capacity ofapproximately 950 MW by the end of 2014, with684 MW already in place at 31 December 2011and more than 100 MW in the pipeline inrespect of plants under construction or authori-sed plants. We estimate this will provide Ebitdaof around Euro 190 million, representing 34%overall growth.
To conclude, I renew my, and management’scommitment, to ensuring that Falck Renewa-bles maintains its outstanding strategic positionand continues to create value for its sharehol-ders in the years to come.
The Chief Executive OfficerPiero Manzoni

9
The shareholders are invited to attend the ordinary annual general meeting (AGM) at the Mediobanca offi-ces in Milan, Via Filodrammatici 3, at 10.30 a.m. on 7 May 2012 in first call and, where necessary, at the sametime and address on 9 May 2012 in second call, in order to discuss the following:
Agenda
Ordinary business:
1. The annual report for the year ended 31 December 2011; directors’ report, independent auditors’ reports,board of statutory auditors’ report: approval, related resolutions and resulting matters.
2. Proposed distribution of reserves.3. Appointment of a director to the board.4. Presentation of the remuneration report pursuant to articles 123-ter of Legislative Decree 58/1998 and84-quater of the Listing Rules and consultative vote on Section I;
5. Review of Reconta Ernst & Young SpA’s audit fees for the period 2011-2019: related resolutions and resul-ting matters.
Share capital and right to voteThe share capital of Falck Renewables SpA is Euro 291,413,891 issued and fully paid, consisting of291,413,891 shares with a nominal value of Euro 1 each, each share holding the right to one vote at theAGM. The company does not hold any own shares at today’s date.
Attendance and representation at the AGMThe following information is provided in respect of those shareholders who hold the right to attend and voteat the AGM (pursuant to article 125-bis of the Consolidated Finance Act):- In accordance with article 83-sexies of the Consolidated Finance Act, shareholders with the right toattend and vote at the AGM is confirmed in writing to the company by the intermediary, based on theinformation in the company’s register at the end of the accounting day on the seventh working day priorto the date established for the AGM in first call (specifically by 25 April 2012); those parties that becameshareholders after this date may not attend or vote at the AGM; the intermediary must provide the abovenotice to the company by the end of the third working day prior to the date set for the AGM in first call(specifically by 2 May 2012). The right to attend and vote will be upheld where notice is received by thecompany after this date but prior to work commencing on the shareholders’ meeting;
- Postal votes and electronic votes are not permitted;- All shareholders who have the right to attend the AGM may be represented by written proxy in com-pliance with current legislation, by completing a proxy form that may be requested from the relevantintermediaries or is available online on the company website www.falckrenewables.eu. The representati-ve who either delivers or transmits a copy of the proxy form to the company is required to certify boththe validity of the proxy and the identity of the shareholder;
- Notice of proxy may be sent by registered post to the company’s registered offices in Corso Venezia 16,Milan (20121), or by e mail to: [email protected];
- proxy may also be given, without any additional cost to the voter, by instructing the company Società perAmministrazioni Fiduciarie “SPAFID” S.p.A. to vote on some or all of the business on the agenda, for thepurpose designated by the company pursuant to article 135-undecies of the Consolidated Finance Act,on condition that the original is received by the second working day prior to the date set for the AGM(specifically by 3 May 2012) either by courier, AR recorded delivery or ordinary post to the premises in
1Notice of annual general meeting

Foro Buonaparte 10, Milan (20121); proxy will not be valid for those matters for which voting instructionswere not received. A proxy form may be obtained from the registered offices in Corso Venezia 16, Milanand the company website www.falckrenewables.eu; the proxy and voting instructions may be withdrawnby the above deadline (specifically by 3 May 2012).
Right to ask questionsShareholders may ask questions relating to items on the agenda prior to the meeting and up to the end ofthe second working day before the date set for the AGM in first call (specifically by 3 May 2012). These maybe put in writing and sent by registered post to the company’s registered offices in Corso Venezia 16, Milan(20121) or by e mail to the following address: [email protected], together with the inter-mediary notice confirming the shareholders’ validity; this notice is not required where prior notice has beenreceived from the intermediary regarding attendance at the AGM. The company may publish a response onthe company website www.falckrenewables.eu. or at the latest reply during the AGM and may avail of theoption to offer a single reply to more than one question pertaining to the same subject.
Amendments to the agendaIn accordance with law, shareholders who, either individually or jointly, represent at least one fortieth of theshare capital are entitled to propose, within ten days of the notice of the AGM being issued, additional agen-da, providing details of them in the request; requests must be filed in writing together with the interme-diary’s notice confirming the limit regarding the number of shares held is satisfied. Shareholders who pro-pose additional agenda prepare a report on the business to be discussed, which should be submitted to theboard of directors by the last date for filing amendments. Proposed amendments to the agenda are notadmitted in relation to matters, on which the AGM is required to deliberate in accordance with law, propo-sed by the board of directors or in relation to projects or reports prepared by them, other than those pur-suant to article 125-ter, paragraph 1, of the Consolidated Finance Act. Amendments to the agenda must besent by recorded delivery to the registered offices in Corso Venezia 16, Milan, or by e mail to: [email protected]. Any changes to the AGM’s agenda subsequent to these requests must be notified following the same pro-cedure as the notice calling the AGM, at least fifteen days before the date set for the AGM. The amendmentnotice will be made available to the public, using the same communication channels used to provide thedocumentation relating to the AGM, together with the shareholders’ report that gave rise to the amendmentand any comments by the board of directors.
***
Documentation Documentation relating to the AGM, required by existing legislation, will be made available to the public atthe company’s registered offices in Milan, Corso Venezia 16, Borsa Italiana SpA and the company websitewww.falckrenewables.eu within the time limits prescribed by law. Shareholders may view the filed docu-ments at the registered offices and copies will be provided on request for a fee.
10

11
More precisely:- the documentation relating to item 1 on the agenda comprising the report of the board of directors andproposed approval, the annual report for the year ended 31 December 2011, the directors’ report, the 2011report on corporate governance and ownership structure, the report of the board of statutory auditors andthe independent auditors’ reports, together with the board of directors’ report on the remuneration reportat item 4 of the agenda prepared pursuant to article 123-ter of the Consolidated Finance Act and theremuneration report itself, will be made available to the public by 16 April 2012 as noted above.
- the documentation supporting items 2, 3 and 5 on the agenda, specifically the board of directors’ propo-sed distribution of reserves (item 2), the board of directors’ report on items 3 and 5 of the agenda, toge-ther with the board of statutory auditors’ proposal and the proposal regarding the audit fees, will be madeavailable to the public by 7 April 2012 as noted above.
***
Shareholders entitled to attend the AGM are invited to arrive before the scheduled starting time for themeeting in order to facilitate registration procedures that will commence from 10.00 a.m. onwards; share-holders are also requested to present a copy of the intermediary notice in order to expedite the control pro-cess.
Milan, 30 March 2012
The ChairmanFederico Falck
The notice of the AGM was published in the Milano Finanza of 6 April 2012.

12
Board of directors
Federico Falck (*) Chairman
Guido Rosa (*) Deputy chairman
Piero Manzoni (*) Chief Executive Officer
Marco Agostini Directors
Guido Corbetta
Enrico Falck (*)
Elisabetta Falck
Giovanni Maria Garegnani (**)
William Jacob Heller
Andrea Merloni (**)
Libero Milone (**)
Barbara Poggiali (by co-option 24.2.2012) (**)
Bernardo Rucellai (**)
Claudio Tatozzi (**)
Sergio Ungaro
(*) Members of the Executive Committee(**) Independent members
Board of statutory auditors
Massimo Scarpelli Chairman
Aldo Bisioli Statutory auditors
Alberto Giussani
Massimo Foschi Substitute statutory auditors
Gianluca Pezzati
Independent auditors
Reconta Ernst & Young SpA
2Company officers

10
0%10
0%85
%
96.3
5%
86.7
7%
60%
Ele
ttro
ambi
ente
SpA
Tife
o En
ergi
aA
mbi
ente
Scp
Ain
liqu
idat
ion
Pla
tani
Ene
rgia
Am
bien
te S
cpA
in li
quid
atio
n
Ecos
esto
SpA
Prim
a S
rl
Am
bien
te20
00 S
rl
49% F
rullo
Ene
rgia
Ambi
ente
Srl
100%
Act
elio
sS
olar
SpA
100%
Sol
arM
esag
ne S
rl100%
Esp
osito
S
ervi
ziE
colo
gici
Srl
23.2
7%Pa
lerm
o En
ergi
aAm
bien
te S
cpA
in li
quid
atio
n
Fal
ckR
enew
able
sIt
alia
Srl10
0%
100%
100%
Eol
o3W
Min
ervi
noM
urge
Srl 10
0%
Eol
ica
Pet
ralia
Srl
Geo
pow
erSa
rdeg
na S
rl100% 20
%
FR
IE
nerg
etic
a S
rl
Eol
ica
Cal
abra
Srl
in li
quid
atio
n20%
Eol
ica
Sud
Srl
100%
Tasf
iye
Hal
inde
Ezse
Ele
ktrik
U
retim
Ltd
Sirk
eti
99.9
9%F
alck
Ren
ewab
les
Win
d Lt
d
100%
Par
c E
olie
n de
Sai
nte
Trep
hine
Sar
l
100%F
alck
Ene
rgie
sR
enou
vela
bles
Sas
100%
100%
SE
Ty
Ru
Sas
Par
c E
olie
n de
Bau
d S
arl
Par
c E
olie
n de
Plo
neve
z du
Fao
u S
arl
100%
Par
c E
olie
n d’
Ava
illes
–Li
mou
zin
Sarl
Par
c E
olie
n D
e M
oulis
mes
Sa
rl
100%
75%
75%
51%
Ecov
eol S
as
Con
solid
ated
by
prop
ortio
nal
met
hod
Valu
ed a
pply
ing
equi
ty m
etho
d
Valu
ed a
t cos
t
Con
solid
ated
lin
e-by
-line
Wte
, bio
mas
s an
d ph
otov
olta
ic s
ecto
r
Win
d se
ctor
FALC
K R
EN
EW
AB
LES
SpA
Boy
ndie
Win
dEn
ergy
Ltd 10
0%
Earls
burn
M
ezza
nine
Ltd
Cam
bria
n W
ind
Ene
rgy
Ltd
Falc
k R
enew
able
sU
K H
oldi
ngs
(No.
1) L
td100%
Falc
k R
enew
able
sFi
nanc
e Lt
d100%
100%
100%
100%
Earls
burn
Win
dEn
ergy
Ltd
Kilb
raur
Win
d E
nerg
y Lt
d100%
Kilb
raur
2 W
ind
Ene
rgy
Ltd10
0%
Mill
enni
um W
ind
Ene
rgy
Ltd10
0%
100% B
en A
ketil
Win
dE
nerg
y Lt
d
100% B
en A
ketil
2
Win
d E
nerg
y Lt
d
52% N
utbe
rry
Win
dEn
ergy
Ltd
Eol
ica
Cab
ezo
San
Roq
ue S
A
Par
que
Eol
ico
La C
arra
cha
SL
Nue
vos
Par
que
Eol
icos
La M
uela
AIE
95.5
1%
26%
50%
50%
26%
Par
que
Eol
ico
Plan
a de
Jarre
ta S
L
50%
Elek
trow
nie
Wia
trow
e Bo
nwin
dLy
szko
wic
eSp
. Z.o
.o.
50%
Elek
trow
nie
Wia
trow
e Bo
nwin
dKa
mie
nica
Sp. Z
.o.o
.
52% D
unbe
ath
Win
dEn
ergy
Ltd
Par
c E
olie
n du
Fou
y Sa
s
100%
100%
100%
52%
Nes
s W
ind
Ener
gy L
td
52%
Spal
ding
ton
Airf
ield
Win
dEn
ergy
Ltd
Cus
hnie
Win
dE
nerg
y Lt
d
Kin
gsbu
rn W
ind
Ene
rgy
Ltd
Par
c E
olie
nde
s C
rete
s S
as
100%
Esqu
enno
isE
nerg
ie S
as
100%
50%
Elek
trow
nie
Wia
trow
e Bo
nwin
dLe
szno
Sp. Z
.o.o
Act
elio
sE
tnea
Srl
100%
SE K
erne
bet S
as
13
Group structure3

14
(Euro thousands) 2011 2010 2009 2008
Revenue 248,650 99,196 94,923 97,699
Gross profit 118,062 37,257 32,826 40,977
EBITDA (1) 141,738 39,541 35,691 48,718
Operating profit 79,233 19,656 18,802 32,937
Profit for the year 19,844 4,643 5,734 19,462
Profit for the year attributable to owners of the parent 18,863 2,499 4,175 17,927
Earnings per share (Euro) (2) 0.070 0.031 0.062 0.265
No. of shares (average for the year) in thousands 269,402 79,812 67,680 67,680
No. of shares (at year-end) in thousands 291,414 161,897 67,680 67,680
- Net financial (assets)/liabilities 15,523 103,910 (162,407) (180,236)
- Non-recourse financing 749,680 601,213 65,371 79,841
Total net financial position - indebtedness/(asset) 765,203 705,123 (97,036) (100,395)
- Derivative financial instruments 60,913 23,228 1,778 1,612
Total net financial position including derivatives (asset) 826,116 728,351 (95,258) (98,783)
Total equity 451,826 335,333 349,652 354,994
Equity attributable to owners of the parent 444,913 327,988 343,849 350,063
Equity holders equity per share (Euro) (2) 1.651 4.110 5.081 5.172
Capital expenditure 177,995 89,047 13,687 17,070
Gross profit/revenue 47.5% 37.6% 34.6% 41.9%
EBITDA/revenue 57.0% 39.9% 37.6% 49.9%
Operating profit/revenue 31.9% 19.8% 19.8% 33.7%
Profit for the year/total equity 4.4% 1.4% 1.6% 5.5%
Net financial position/total equity 1.83 2.17 (0.27) (0.28)
Total number of group employees (no.) 241 210 145 140
(1) EBITDA = EBITDA is measured by the Falck Renewables group as profit for the year before income and costs from investments, net financeincome/costs, amortisation and depreciation, impairment, charges to risk provisions and income tax expense. This indicator was calculatedapplying best market practice taking into consideration the new group financing contracts. This method was applied to calculate EBITDA forthe previous years disclosed.
(2) Calculated using the average shares outstanding during the year.
Consolidated financial highlights4
Directors’ report5

16
Map of Falck Renewables’s plants

17
Dear Shareholders,
The parent company’s separate financial statements and the consolidated financial statements for the yearended 31 December 2011 have been prepared in accordance with International Financial Reporting Stan-dards (IFRS). These standards were adopted in 2005 for the first time in relation to the consolidated finan-cial statements and in 2006 for the parent company’s separate financial statements.
5.1 Falck Renewables group operating and financial review
5.1.1 Falck Renewables group profile
Falck Renewables SpA is an Italian limited company (“the Company” or “Falck Renewables”) with registe-red offices in Corso Venezia 16, Milan and its subsidiaries (hereinafter “the Falck Renewables Group” or the“Group”) essentially operate in Italy, the United Kingdom and France. Falck Renewables also holds invest-ments in three associated companies that operate two wind farms in Spain. A number of wind farms arecurrently under construction in Poland.
The Falck Renewables Group’s current structure is the outcome of the Consolidation Project that took placein the 2010 fourth quarter, whereby all of the renewable energy businesses of Falck SpA were transferred toFalck Renewables SpA, more specifically:
(i) the wind sector business of Falck Renewables Wind Ltd formerly Falck Renewables Plc (previously con-trolled by Falck SpA through Falck Energy SpA) and its subsidiaries; and
(ii) the WtE, biomass and photovoltaic businesses of Falck Renewables SpA (already controlled prior to con-clusion of the Consolidation Project by Actelios SpA) and its subsidiaries.
The Falck Renewables Group operates in the production of energy from renewable sources through windfarms and WtE, biomass and photovoltaic plants. Specialising in the renewable energy sector has allowedthe Falck Renewables Group to gain experience and acquire know-how in the operation and maintenance(O&M) of proprietary and third party-owned renewable energy power plants.
The Falck Renewables Group operates in the following two sectors:
• the wind sector, revenue from which derives mainly from the sale of Green Certificates, ROCs and elec-tricity generated by the Group’s wind farms;
• the WtE, biomass and photovoltaic sector, where revenue mainly derives from the sale of Green Certifi-cates and electrical and thermal energy and the operation and maintenance of third party renewableenergy power plants.
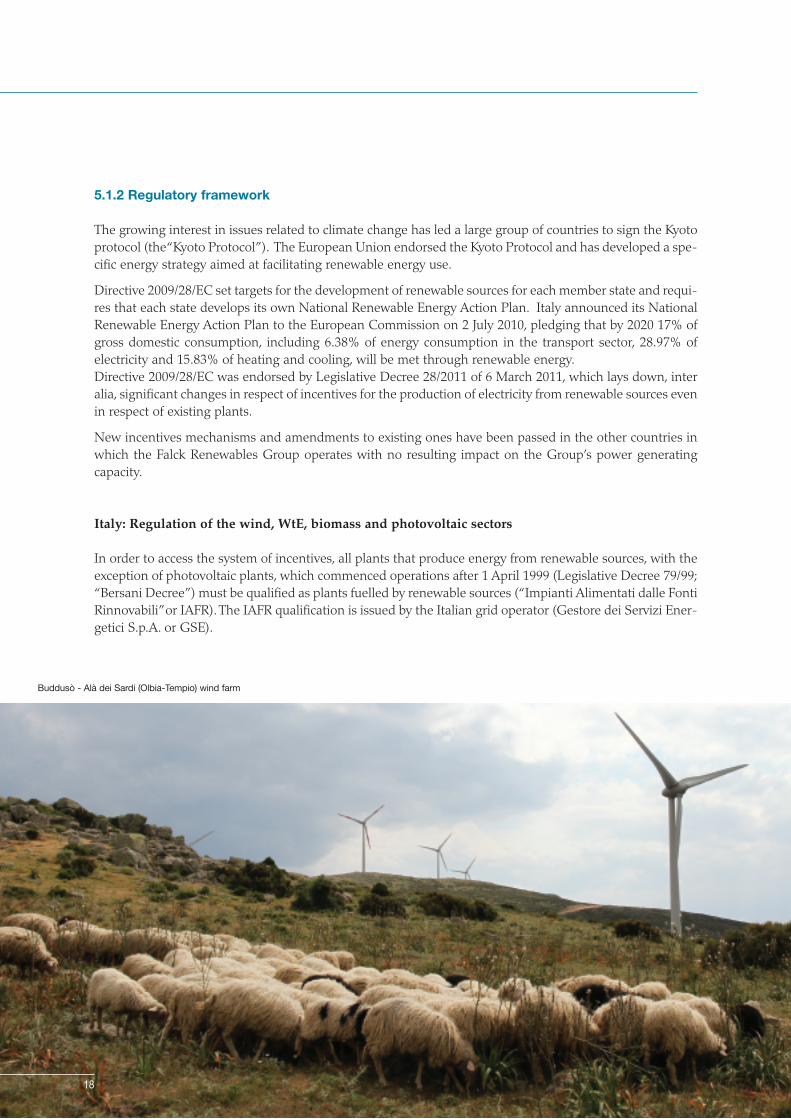
5.1.2 Regulatory framework
The growing interest in issues related to climate change has led a large group of countries to sign the Kyotoprotocol (the “Kyoto Protocol”). The European Union endorsed the Kyoto Protocol and has developed a spe-cific energy strategy aimed at facilitating renewable energy use.
Directive 2009/28/EC set targets for the development of renewable sources for each member state and requi-res that each state develops its own National Renewable Energy Action Plan. Italy announced its NationalRenewable Energy Action Plan to the European Commission on 2 July 2010, pledging that by 2020 17% ofgross domestic consumption, including 6.38% of energy consumption in the transport sector, 28.97% ofelectricity and 15.83% of heating and cooling, will be met through renewable energy. Directive 2009/28/EC was endorsed by Legislative Decree 28/2011 of 6 March 2011, which lays down, interalia, significant changes in respect of incentives for the production of electricity from renewable sources evenin respect of existing plants.
New incentives mechanisms and amendments to existing ones have been passed in the other countries inwhich the Falck Renewables Group operates with no resulting impact on the Group’s power generatingcapacity.
Italy: Regulation of the wind, WtE, biomass and photovoltaic sectors
In order to access the system of incentives, all plants that produce energy from renewable sources, with theexception of photovoltaic plants, which commenced operations after 1 April 1999 (Legislative Decree 79/99;“Bersani Decree”) must be qualified as plants fuelled by renewable sources (“Impianti Alimentati dalle FontiRinnovabili” or IAFR). The IAFR qualification is issued by the Italian grid operator (Gestore dei Servizi Ener-getici S.p.A. or GSE).
18
Buddusò - Alà dei Sardi (Olbia-Tempio) wind farm

19
The regulations on incentives for the production of electricity from renewable sources focus on severalmechanisms with different applications based on (i) the date the plant commenced operations, (ii) the typeof renewable resource used, and (iii) the plant’s capacity. The principal incentives are as follows:
a) CIP 6/92;
b) Green Certificates introduced by the Bersani Decree;
c) all-in rate introduced by Law 244 of 24 December 2007 (“All-in Rate”);
d) energy account governing photovoltaic plants (Ministerial Decree (MD) 6/08/2010).
a) CIP 6/92
This incentive system offers a direct incentive to producers of renewable and similar types of energy, and isstill effective for a number of operating plants, whereby under a specific agreement the producers soldenergy produced to ENEL (now the GSE) at a fixed price without participating in the feed in tariff marketmechanism. In particular, CIP 6/92 fixed the selling prices under which Enel purchased electricity, in accor-dance with the “avoided costs” criteria (of investment and combustibles) and offering incentives in relationto the higher costs incurred by generating electricity from renewable sources.Benefits terms have been fixed for 15 years, although the incentive element that increments avoided costsis guaranteed up to a maximum of 8 years.
b) Green certificates (GC)
From 2001, the Bersani Decree has required entities importing or producing more than 100 GWh per yearfrom conventional sources to feed into the grid (in the following year) not less than 2% of energy producedby renewable sources (for 2011 the minimum quota is 6.8%).
Cardonita (Enna) photovoltaic plant Spinasanta (Catania ) photovoltaic plant

The above mentioned emission quotas may bemet through the production of renewableenergy or alternatively the purchase of GC’sfrom other renewable energy producers. For each MWh of renewable energy the GSEawards the producer 1 GC. The GC’s are annual certificates of renewableproduction that producers receive (for 15 yearperiods) from the GSE based on productionlevels and the renewable source used. The cur-rent GC ratios applied to renewable energyproduction are:
. onshore wind farms: 1;
. offshore wind farms: 1.50;
. biodegradable waste and biomass plants notsourced from short chain: 1.3;
. agricultural biomass plants sourced fromshort chain supplies: 1.8.
The GC market becomes one of demand(minimum quotas) and supply (GC’s). TheLegislative Decree implementing Directive2009/28/EC states that the GC incentivemechanism will cease (with a transition periodup to 2015) and be replaced by a “Tariff” whe-reby the incentive element is determined
annually based on the market value of energy generated. The producers will therefore be involved in theelectricity market both in technical terms, through transmission (TERNA), and commercial terms, throughvaluation (the Electricity Account with the GME or bilateral contracts with operators or traders of standardproducts).The above mechanism applies to plants in operation at 31 December 2012.The GC system will continue through 2011-2015 and the GSE will buy in all excess GCs on the market. Thelegislative decree envisages an annual buy-in by the GSE of 78% (in Euro/MWh) of the difference between180 and the average annual electricity trading price published by the Regulatory Authority for Electricity andGas by 31 January each year. From 2016, a new FEED IN system will be applied to the remaining incentive years, the terms of which willbe defined in the forthcoming decree implementing Legislative Decree 28/2011.
c) All-in rate
The all-in rate is a form of incentive for energy produced from renewable sources that can be provided for15 years to certain types of plants with an average annual nominal capacity of up to 1 MW, as an alternati-ve to the Green Certificate mechanism. Producers who opt for this tariff option may not participate in the electricity market (FEED IN TARIFFmechanism). This tariff is not applicable to the Falck Renewables Group’s plants.
20
Work at the street sweeping recovery plant in Gorle (Bergamo)

d) Energy account
The energy account is the incentive for photo-voltaic plants and was originally governed byMinisterial Decree of 19 February 2007 andensuing amendments (replacing MinisterialDecree 28/07/05 and Ministerial Decree06/02/06). With regard to plants that commen-ced operations between 1 January 2008 and31 December 2010 the Ministerial Decree pro-vides tariff-based incentives for the energyproduced that vary based on the characteristicsof the plants (integrated, partially integrated ornon-integrated) and their nominal capacity (1-3 KW; 3 - 20 KW; over 20 KW). This incentiveis provided by GSE for a period of up to 20years. Under Legislative Decree 129 of 13 August2010, the incentive tariffs under the energyaccount governed by Ministerial Decree of19 February 2007 continue to apply to photo-voltaic systems including those that commen-ced operations after 31 December 2010, provi-ded that (i) by 31 December 2010 the photo-voltaic system had been installed and the rele-vant authorities notified of the completion ofwork, and (ii) the facilities came into operationby 30 June 2011.
The MD of 6/8/2010 sets a national target for systems installation totalling 8 GW by 2020. It also sets anincentives cap of 3 GW for solar photovoltaic plants, 300 MW for integrated plants with innovative featuresand 200 MW for concentrated photovoltaic plants. The MD of 6/8/2010 no longer distinguishes betweenplants in relation to their integration with existing buildings but identifies them as those “constructed onbuildings” and “other plants”.
The Legislative Decree implementing Directive 2009/28/EC specifies that the provisions of MD 06/08/10apply to plants that commenced operations prior to 31 May 2011. New Ministerial Decrees will be issuedfor subsequent periods.
• United Kingdom: regulatory framework in the wind sector
In line with Directive 2009/28/EC, the UK Government’s target is to achieve 30% of its energy consumptionfrom renewable sources by 2020.
The incentives schemes for the production of electricity from renewable sources fall under 2 incentives regi-mes:
a) NFFO Order (England, Wales and Scotland);b) Renewables Obligation Order.
21
Street sweeping recovery plant in Gorle (Bergamo)

a) NFFO (England, Wales and Scotland)
In England and Wales the legacy regime for the sale of electricity generated from renewable sources is regu-lated under the Electricity (Non-Fossil Fuel Sources) (England and Wales) Orders of 1994, 1997 and 1998(“NFFOEW Orders”). In Scotland it is regulated under the Electricity (Non-Fossil Fuel Sources) (Scotland)Orders of 1994, 1997 and 1999 (“NFFOS Orders”). There are also separate regulations for Northern Ireland.
Although the underlying legislation has been repealed, there is a saving in respect of existing projects whichcontinue to operate under the regulation until the expiry of the existing NFFO contracts (fixed price long-term sales contracts) with NFPA. For these plants the incentive mechanism is the feed in tariff. The CefnCroes plant continues to operate under the NFFOEW Orders.
b) Renewables Obligation Orders
The current regime to promote and support the generation of electricity from renewable sources in Englandand Wales and in Scotland is through separate Renewables Obligation Orders (“ROs”). The RenewablesObligation Order 2006 (England and Wales) and the Renewables Obligation (Scotland) Order 2007, respec-tively impose obligations on electricity suppliers to demonstrate that not less than a stipulated percentageof electricity produced was generated from renewable sources. The Office of Gas and Electricity Markets,OFGEM, issues Renewable Obligations Certificates (“ROCs”) and Scottish Renewable Obligations Certifi-cates (“SROCs”) on behalf of the Gas and Electricity Markets Authority (“GEMA”).
The ROs require electricity suppliers to source an increasing portion of their electricity supply from rene-wable sources (including onshore and offshore wind farms). The current target is set at 12.4% of all electri-city fed into the network in the period from 1 April 2011 to 31 March 2012.
Compliance under the RO scheme is regulated through a certification system using ROCs and SROCs.Renewable energy generators receive ROCs or SROCs for each MWh of electricity generated. ROCs andSROCs are tradable, are priced in the market and traded at a premium compared to the market price of asimilar quantity of energy (FEED IN PREMIUM mechanism).
Smaller wind farms (all of the Group’s wind farms except for Kilbraur and Millennium) are also entitled toother benefits. Renewables generating plants are typically connected to the low voltage regional electricitydistribution network rather than to the high voltage transmission network operated by the National Grid.Using the distribution network rather than the high voltage transmission network avoids the charges impo-sed by the National Grid. This is known as Triad Avoidance Benefit.
The Finance Act 2000 introduced the Climate Change Levy (“CCL”) which is a flat rate currently at £4.41 perMWh, charged on the supply of electricity to non-domestic customers. Eligible renewable generators areentitled to climate change levy exemption certificates (“LECs”). In order to meet the obligations of theFinance Act 2000, suppliers may either purchase LECs from a generator of qualifying renewable energywhich can then be submitted to OFGEM or pay the tax directly to OFGEM. Unlike ROCs (and SROCs), LECs are not fully tradable and the supplier must show they relate to a quan-tity of renewable electricity actually supplied to a specific industrial consumer.
22

23
• Spain: regulatory framework in the wind sector
Under Directive 2001/77/EC, Spain has targeted that 29% of gross electricity consumption be produced fromrenewable energy sources by 2010.
The main regulations in Spain comprise the 2004 and 2007 Royal Decrees. New regulations were approvedin July 2010 which do not affect the wind farms falling under the 2004 Royal Decree. The 2004 Royal Decree established that electricity generated could be sold at a price comprising a fixed ele-ment (or premium) and a variable element depending on the energy prices in the Spanish electricity mar-ket.
The 2004 Royal Decree was superseded by the 2007 Royal Decree. The 2007 Royal Decree maintains thefeed-in tariff regime and introduces a new pool price regime, which is subject to a floor and a cap to ensu-re wind farm owners are not under or over remunerated. The Group’s wind farms have elected to apply thepool price regime established in the 2004 Royal Decree until 31 December 2012, following which the newpool price regime established under the 2007 Royal Decree will apply. In addition to the pricing regimes, electricity generated from renewable sources is afforded priority access tothe transmission and distribution grid system, ensuring all power is purchased.
Royal Decree 1/2012 issued on 27 January 2012 temporarily suspends all economic incentives for the pro-duction of electricity from renewal sources in respect of projects not authorised at the date of issue of thedecree as Spain has already exceeded the level of installed capacity set out in the plan issued by the SpanishGovernment. This suspension will remain in force until a solution to the system’s tariff deficit is found anda new renewable sources remuneration model is established.
Pool price regime
The majority of Spain’s wind power is sold under the pool price regime. The Group’s wind farms apply thisregime.
Remuneration under the 2004 Royal Decree is calculated as the sum of the negotiated market price plus pre-mium, plus/minus a reactive power bonus, plus incentives, minus deviations.
The negotiated market price is calculated either (i) by reference to the settlement of demand and supply andother procedures carried out by OMEL (the market operator) or (ii) by reference to the price negotiated bet-ween the parties when the sale is made though bilateral agreements or forward market trading (“venta aplazo”).
The premium is set at 40% of the average or reference tariff, while the incentive is set at 10% of the avera-ge reference tariff.
Pursuant to the 2007 Royal Decree, remuneration is calculated as the sum of the negotiated market priceplus a premium of 2.9291 Euro c/Kwh. The market price plus the premium cannot be greater than 8.4944Euro c/Kwh nor less than 7.1275 Euro c/KWh. Moreover, the remuneration also includes a reactive powerbonus (calculated as a percentage of 7.8441 Euro c/KWh) in relation to the ability of the operator to controlreactive power. The premium will be reviewed annually, taking into consideration the Consumer Price Index(published monthly and at the end of every year by the Instituto Nacional de Estadisctica) minus 0.25% until2012 and minus 0.50% thereafter.

• France: regulatory framework in wind sector
Law 2000-198 of 10 February 2000 regarding theupgrade and development of public services andelectricity (and ensuing amendments under theLaws of 3 January 2003 and 15 July 2003 - theFrench Electricity Law) and Decree 2001-410 of10 May 2001, require Electricité de France (“EDF”)and local distributors to purchase electricity gene-rated by producers of energy from renewable sour-ces under a 15 year purchase agreement. Subsequent to the amendment of July 2005, thepurchase obligation applies to wind farms locatedwithin the perimeter of a wind farm developmentarea (zone de development de l’éolien or ZDE).
The conditions applicable to the purchase of elec-tricity generated by renewable energy plants areset out in the Arrété of 17 November 2008.
The Arrété specifies a fixed tariff regime (8.2 Euroc/KWh subject to indexation) for the first 10 yearsof generation, while the tariff for the last five yearsof the purchase contract is linked to the volume ofenergy produced in the first 10 year period. Low-wind sites (less than 2,400 hours of generation peryear) will continue to benefit from the same tarifffor the full 15 year period, whereas middle andhigh-wind speed sites will see a decrease in thepurchase tariff in the final five years of the con-tract.
The tariff applicable to a specific wind farm isdetermined using a coefficient (“k index”) depen-dent on the year in which the EDF received the fullapplication to enter into the electricity purchaseagreement. The k index is reviewed annually inline with a specific formula defined in the Arrété.The tariff, subject to an annual index, is guaran-teed for the 15 years following the start of opera-tions.
The Group’s plants are located in low wind speedareas.
24
Le Fouy (France) wind farm
Buddusò - Alà dei Sardi (Olbia-Tempio) wind farm

25
5.1.3 Performance
The consolidated results for the year ended 31 December 2010 comprised the full year’s results of the WtE,biomass and photovoltaic sector while the results of the wind sector (Falck Renewables Wind Ltd, formerlyFalck Renewables Plc) only related to the period 1.12.2010-31.12.2010, as it became part of the Falck Rene-wables Group in November 2010. The balance sheet comprised all of the assets and liabilities of both of the above sectors at 31 December2010.Consequently, the 2011 results of operations are not comparable with those for the year ended 2010 whilethe state of affairs and financial position at 31 December 2011 are comparable with those at 31 December2010.
(Euro thousands) 31.12.2011 31.12.2010Revenue 248,650 99,196Cost of sales (130,588) (61,939)Gross profit 118,062 37,257Operating profit 79,233 19,656EBITDA 141,738 39,541Profit for the year 19,844 4,643Profit for the year attributable to owners of the parent 18,863 2,499Invested capital net of provisions 1,277,942 1,063,684Total equity 451,826 335,333Net financial position - net indebtedness 826,116 728,351of which non-recourse financing 749,680 601,213Capital expenditure 177,995 89,047Group employees at year-end (no.) 241 210Ordinary shares (no.) 291,413,891 161,896,607
La Calce (Brindisi) photovoltaic plant Trezzo sull’Adda (Milan) WtE plant
Revenue, increased by Euro 149,454 thousand principally due to the consolidation of the full year’s resultsof the wind sector and new wind farms, the photovoltaic plants in Sicily and the Rende biomass plant, fol-lowing its closure in 2010 in order to carry out a total revamp, all coming on stream.
Gross profit also increased by Euro 80,805 thousand and represents 47.5% (2010 – 37.6%) when expressedas a percentage of revenue.
Revenue for the year compared to 2010 may be analysed as follows:
(Euro thousands) 2011 % 2010 %Sale of electrical energy 208,759 84.0 62,188 62.7Sale of agricultural produce 375 0.4Waste treatment and disposal 33,339 13.4 31,735 32.0Operation of WtE plants 3,651 1.5 4,898 4.9Other operating income 2,901 1.2Total 248,650 100 99,196 100
Operating profit increased by Euro 59,577 thousand compared to 2010 and is equal to 31.9% of revenue(2010 -19.8%).
Operating profit has been affected by the impairment losses recognised on the goodwill of the Trezzo sul-l’Adda plant (Euro 3,136 thousand) and on the goodwill (Euro 1,121 thousand) and a portion of the costsrecorded in intangible assets (Euro 1,489 thousand) in respect of the Petralia wind farm. These losses wereidentified on performance of impairment tests.
Operating profit was also impacted by the deconsolidation and subsequent impairment loss recognisedagainst amounts owed to Falck Renewables SpA by Palermo Energia Ambiente ScpA (hereinafter “Pea”),currently in liquidation, one of the Sicily Project companies that was previously consolidated applying theproportional method, and the risk provision also set up in respect of Pea as described further below. Thesecontributed to a Euro 6,226 thousand decrease in operating profit.
At the date of preparation of the Annual Report, the first (2010) and second (2011) interim liquidationaccounts of Palermo Energia Ambiente ScpA had not been approved. Pea is one of the Sicily Project com-panies (Bellolampo-Palermo) currently in liquidation, in which the Company has a 23.2725% interest thatwas consolidated applying the proportional method up to the 2010 financial statements. This is due to a dis-pute with the shareholder Amia SpA (“Amia”), which holds a 48% interest in Pea and is currently in extraor-dinary administration. Consequently, as joint control may not be exercised over Pea this results in its exclu-sion from the scope of consolidation and measurement of the investment at carrying value, as illustratedbelow, while the 2011 Falck Renewables Group consolidated income statement reflects the share of Pea’sestimated loss for the twelve month period.
In the event that an agreement cannot be reached with Amia regarding approval of Pea’s third liquidationaccounts, it is highly likely that the company will be dissolved pursuant to article 2490 of the Italian CivilCode. The above issues involving Pea do not apply to the other two Sicily Project companies, Tifeo and Pla-tani (in which Falck Renewables SpA holds indirect interests of 96.35% and 86.77% respectively through itssubsidiary Elettroambiente SpA).
Furthermore, on 6 and 8 March 2012 respectively, the liquidators of Pea received notification of the ban-kruptcy proceedings filed by the Public Prosecutor with the Court of Palermo on 28 December 2011. Thepresiding judge scheduled a hearing for 28 March 2012. Pea submitted a defence statement and documen-tation relevant to the proceedings. Following the above hearing the presiding judge adjourned proceedingsto 23 May 2012 in order to give the Public Prosecutor time to submit statements and Pea time to reply.
26

27
In order to best represent Pea’s and its shareholders claims against the Sicily Regional Authorities, FalckRenewables SpA and Falck SpA, which together hold a 48% interest in Pea, signed an agreement with Peawhereby they agree to defer the receivables (both trade and financial) to allow payment of other creditorsand waive the same receivables in the event that following liquidation Pea does not have sufficient financialresources to pay the amounts in full. Also under this agreement, the shareholders Falck Renewables SpAand Falck SpA undertake to provide Pea with the funds required to settle certain creditors. A provision ofEuro 2,210 thousand was included in the sundry risks provision in the consolidated financial statements inorder to reflect this commitment. Pea’s other shareholders entered into separate agreements regarding thesettlement of receivables with Pea.
In light of this situation, which only involves Pea and in no way impacts on outstanding disputes betweenTifeo and Platani and the Sicily Regional Offices as confirmed by its legal advisors, the Falck RenewablesGroup carried out a valuation of the amounts arising after deconsolidation of Pea that resulted in recogni-tion of impairment losses, given the risk of dissolution of the company, against the carrying value of theinvestment in Pea and all receivables (trade and financial) due from it. Although there has been no sub-stantial change in the claims brought forward in the proceedings as no facts have emerged that would altersignificantly the outcome of the proceedings, certain risks and uncertainties regarding the corporate gover-nance of Pea exist that affect the risk of recoverability of the impaired amounts.
As a consequence, the consolidated results reflect an impairment loss of Euro 110 thousand, net of theamount arising on deconsolidation, recognised against the investment in Pea, an impairment loss of Euro4,015 thousand against trade receivables, an impairment loss recognised against financial receivables due tothe Falck Renewables Group from Pea, net of reversed capitalised interest, of Euro 5,776 thousand and the
Maintenance work on the Rende (Cosenza) biomass plant Control room of the Trezzo sull’Adda (Milan) WtE plant

abovementioned charge of Euro 2,210 thousand to the sundry risks provision. The total impact is Euro12,178 thousand, which is further detailed in the table below.
31.12.2011 Pea impact 31.12.2011(Euro thousands) Excl. Pea impact Incl. Pea impactA Revenue 248,650 248,650
Direct labour costs (8,100) (8,100)Direct costs (122,488) (122,488)
B Total cost of sales (130,588) (130,588)C Gross profit 118,062 118,062
Other income 1,662 1,662 Other employee costs (12,983) (12,983)Administrative expenses (21,283) (6,225) (27,508)
D Operating profit 85,458 (6,225) 79,233 Finance costs - net (36,906) (5,776) (42,682)Investment income/(costs) 810 (110) 700
E Profit before income tax 49,362 (12,111) 37,251 Income tax expense (17,340) (67) (17,407)
F Profit for the year 32,022 (12,178) 19,844 G Profit attributable to non-controlling interests 981 981 H Profit attributable to owners of the parent 31,041 (12,178) 18,863
The Group’s consolidated income tax expense increased on 2010 primarily due to the increase in profit forthe year but also due to the expiry of the tax benefits pursuant to the Tremonti-Ter Law tax that only appliedto the 2009 and 2010 results and contributed Euro 872 thousand in 2010. Electricity producers with morethan Euro 10 million of revenue and Euro 1 million of taxable income are subject to additional IRES (cor-poration tax) of 10.5% for 2011-2013, following which the additional tax will fall to 6.5%. The Group companies affected by the additional tax in 2011 were: Prima Srl, Frullo Energia Ambiente Srl,Eolica Sud Srl and Eolo 3W Minervino Murge Srl.
Moreover, the tax effect of the UK subsidiaries resulted in a Euro 4.6 million reduction in the total tax char-ge, principally due to a decrease in the tax rate (28% to 26.5%) and certain prior year costs (2008 and 2009)now being treated as deductions for tax purposes.
As a result of the above, profit for the year amounted to Euro 19,844 thousand, an increase of Euro 15,201thousand on 2010. The net result was affected by the impairment losses and charge to the sundry risks pro-vision in respect of Pea that totalled Euro 12,178 thousand.
The net financial position, excluding the fair value of derivatives1 was a net indebtedness of Euro765,203 thousand, an increase on the total net indebtedness of Euro 705,123 thousand at 31 December 2010.The increase in the level of debt is largely due to capital expenditure of Euro 177,995 thousand that expan-ded the Group’s installed capacity from 498 MW in 2010 to 684 MW at the end of 2011. These outflows werepartially compensated by the parent company’s share capital increase of Euro 129,972 thousand that wasfinalised in late March 2011. The net financial position comprises non-recourse loans (Gross Project Debt) that amounted to Euro749,680 thousand at 31 December 2011 (2010 – Euro 601,213 thousand).
28
1 The net financial position including the fair value of derivates amounted to Euro 826,116 thousand at 31 December 2011 (2010 - Euro 728,351 thou-sand). The overall net indebtedness represents the sum of cash and cash equivalents, current financial assets including available for sale securities, finan-cial liabilities, the fair value of financial hedging instruments and other non-current financial assets.
29
The net financial position includes net borrowings of Euro 43,841 thousand relating to construction projectsthat were not revenue generating at 31 December 2011. The net indebtedness, net of these borrowings andthe fair value of derivatives would have amounted to Euro 721,362 thousand.
The net financial position of the project companies (NFP Project) comprising Gross Project Debt, the fairvalue of derivatives to hedge interest rate exposure on this debt and the liquidity of the financed projectsamounted to Euro 714,832 thousand, representing approximately 87% of the Group’s net indebtedness at31 December 2011.
Interest rate swaps to a total of Euro 579,532 thousand have been entered into to hedge interest rate fluc-tuations on the Gross Project Debt, corresponding to 77% of the total debt. Consequently, approximately85% of the total net indebtedness of Euro 765,203 thousand, net of the fair value of derivatives, is hedgedfrom interest rate fluctuations through the same interest rate swaps.
(Euro thousands) 31.12.2011Total NFP net of Fair Value of Derivatives 765,203Total hedged against interest rate fluctuations 649,532% Hedged/NFP net of derivatives 85%
Total Gross Debt including Fair Value of Derivatives (GD+FVD) 923,754of which Gross Project Debt + Fair Value of Project Derivatives 809,403%Project GD including FV Derivatives/(GD+FVD) 88%
Total Gross Debt (GD) 862,841of which Project Gross Debt (Project GD) 749,680% Project GD/GD 87%
Project Gross Debt 749,680Total hedged against interest rate fluctuations 579,532% Project NFP/NFP 77%
Total Gross Debt (GD) 862,841Total hedged against interest rate fluctuations 649,532% Hedged/GD 75%
Total net financial position including Fair Value of Derivatives (NFP) 826,116of which Project Financing Net Debt (Project NFP) (*) 714,832% Project NFP/NFP 87%
(*) Project NFP = Project Gross Debt + Fair Value of Project Derivatives - Project Liquidity
Capital expenditure in the period, which amounted to Euro 177,995 thousand, represents the Group’sfinancial commitment in relation to wind farms and photovoltaic plants and improvements to operatingplants. Capital expenditure principally comprised Euro 90,007 thousand for the construction of the Buddusò-Alàdei Sardi wind farm, Euro 26,137 thousand on the construction of the Petralia Sottana wind farm, a total ofEuro 32,621 thousand on the expansion of the Kilbraur and Millennium wind farms in the UK and Euro19,681 thousand on the Spinasanta, Cardonita and Sugherotorto photovoltaic plants.
Employee numbers increased by 31 compared to the total at 31 December 2010, following acquisition oftwo businesses from Falck SpA and its subsidiary Riesfactoring SpA (detailed in note 5.1.7 Review of busi-ness in 2011) that resulted in the transfer of 31 employees together with the management, administrative,legal, financial and control activities that Falck SpA provided to the Falck Renewables Group and the trea-sury management function that Riesfactoring SpA performed on behalf of the Falck Renewables Group.

Reconciliation of equity attributable to owners of the parent and profit for the year
The consolidation reserve includes the differences arising from the elimination of the book value of conso-lidated investments against the related share of net equity.As a result the other equity headings correspond to the amounts disclosed in the parent company’s finan-cial statements.
The reconciliation of equity attributable to owners of the parent and profit for the year as at and for the yearended 31 December 2011 may be summarised as follows:
Share capital Profit Equityand reserves for the year attributable to
owners of(Euro thousands) the parentFalck Renewables SpA financial statements 558,412 (1,776) 556,636- Difference between adjusted net equity of consolidated entities
and carrying value of related investments (139,547) 36,114 (103,433)- Reversal of dividends from consolidated entities 15,811 (15,811)- Realised profits on sale of assets between Group companies net
of depreciation and amortisation (8,530) 104 (8,426)- Impairment losses recognised on consolidated equity investments (96) 232 136Group consolidated profit for the year and equity attributable to owners of the parent 426,050 18,863 444,913
5.1.4 Non-financial performance indicators
The key non-financial performance indicators are set out below:
Unit of measurement 31.12.2011 31.12.2010Gross electricity generated MWh 1,560,000 303,745Total waste treated tonn. 339,593 328,646
The total electricity generated in 2010 only includes production for the month of December in respect of thewind sector. Including wind sector production for the entire year would have resulted in gross electricitygenerated of 1,147,000 MWh.
30

31
5.1.5 Share price performance
The performance of the Falck RenewablesSpA share price, which is listed on theSTAR segment, is illustrated below.
The format of communications to sharehol-ders or prospective investors of Falck Rene-wables SpA is based on constant interac-tion and does not necessarily follow that ofpresentations or road shows. Investor rela-tions are in fact principally based on one toone meetings and issuing notices andexplanations even by e-mail or throughtelephone contact. The Company attendsconventions and financial discussions orga-nised by Borsa Italiana, enterprises orfinancial institutions.
Throughout 2011, and in the concludingstages of the share capital increase in thefirst quarter, road show presentations toboth Italian and overseas institutional investors were intensified, complementing the usual meetings withthe financial community aimed at illustrating the key elements of the Group’s business model, comprisingthe management and strategic development of new projects.
Particular care is taken by the Company to ensure that all communications are transparent and timely, alsothrough quarterly earnings conference calls.An effective communication tool available to investors is the website www.falckrenewables.eu, which meetsall of the criteria for companies listed on the STAR segment.
5.1.6 Performance of business sectorsThe Falck Renewables Group operates in the following business sectors:
- The wind sector through Falck Renewables Wind Ltd and its subsidiaries;
- The WtE and waste treatment, biomass and photovoltaic sector.
This paragraph therefore illustrates the principal results of operations, net assets and financial data of theGroup’s two sectors, supported by a brief commentary, while the notes to the financial statements report thefull results of operations and net assets of the sectors with separate disclosure of the amounts relating toFalck Renewables SpA which are commented on in a separate note.
Share price performance
• WtE, biomass and photovoltaic sector
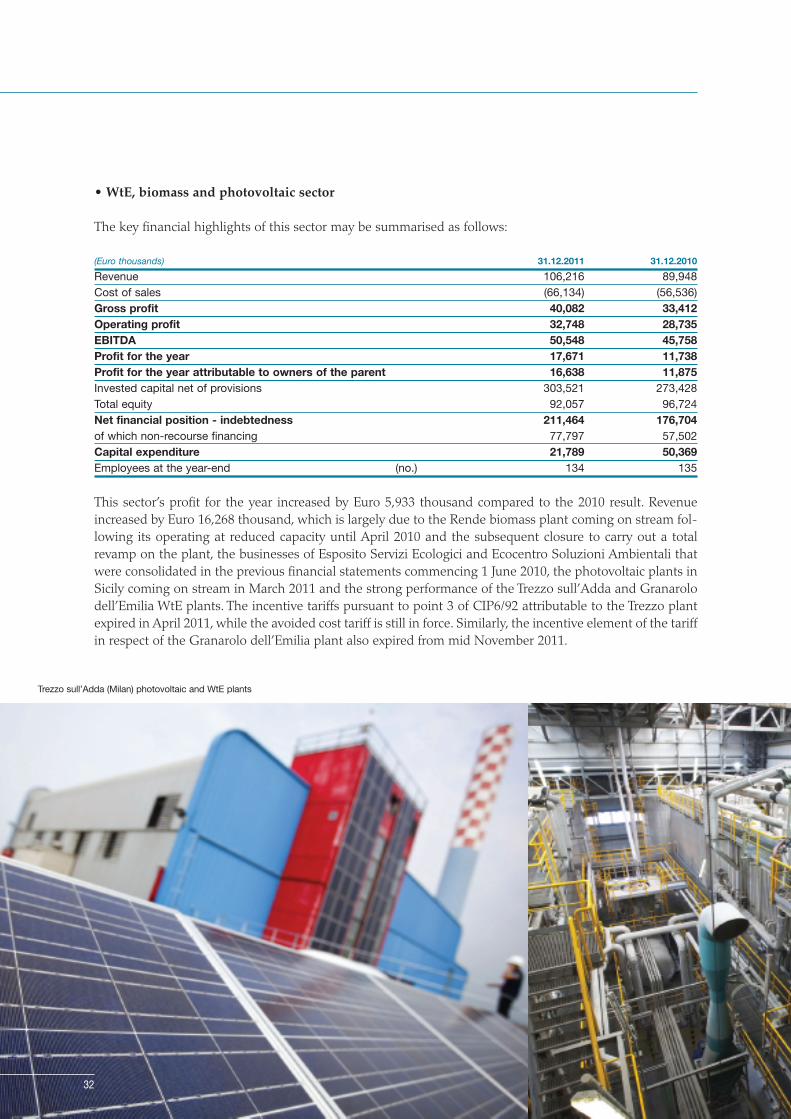
The key financial highlights of this sector may be summarised as follows:
(Euro thousands) 31.12.2011 31.12.2010Revenue 106,216 89,948Cost of sales (66,134) (56,536)Gross profit 40,082 33,412Operating profit 32,748 28,735EBITDA 50,548 45,758Profit for the year 17,671 11,738Profit for the year attributable to owners of the parent 16,638 11,875Invested capital net of provisions 303,521 273,428Total equity 92,057 96,724Net financial position - indebtedness 211,464 176,704of which non-recourse financing 77,797 57,502Capital expenditure 21,789 50,369Employees at the year-end (no.) 134 135
This sector’s profit for the year increased by Euro 5,933 thousand compared to the 2010 result. Revenueincreased by Euro 16,268 thousand, which is largely due to the Rende biomass plant coming on stream fol-lowing its operating at reduced capacity until April 2010 and the subsequent closure to carry out a totalrevamp on the plant, the businesses of Esposito Servizi Ecologici and Ecocentro Soluzioni Ambientali thatwere consolidated in the previous financial statements commencing 1 June 2010, the photovoltaic plants inSicily coming on stream in March 2011 and the strong performance of the Trezzo sull’Adda and Granarolodell’Emilia WtE plants. The incentive tariffs pursuant to point 3 of CIP6/92 attributable to the Trezzo plantexpired in April 2011, while the avoided cost tariff is still in force. Similarly, the incentive element of the tariffin respect of the Granarolo dell’Emilia plant also expired from mid November 2011.
32
Trezzo sull’Adda (Milan) photovoltaic and WtE plants

33
There was marked growth in EBITDA (+ Euro 4,790 thousand), corresponding to 47.6% of revenue (2010 -50.9%).
The net indebtedness increased by Euro 34,760 thousand compared to the balance at 31 December 2010,principally due to capital expenditure on the photovoltaic plants in Sicily that came on stream in March. Thenet financial position comprises Euro 77,797 thousand of non-recourse borrowings.
Capital expenditure in the year amounted to Euro 21,789 thousand and largely related to the photovoltaicplants of Actelios Solar SpA located in Sicily.
• Wind sector
The key financial information for this sector may be summarised as follows:
(Euro thousands) 31.12.2011 31.12.2010Revenue 142,378 8,884Cost of sales (64,861) (5,310)Gross profit 77,517 3,574Operating profit 64,380 1,281EBITDA 101,859 3,934Profit/(loss) for the period 19,452 (2,632)Profit/(loss) for the period attributable to owners of the parent 19,504 (2,618)Invested capital net of provisions 959,960 781,999Total equity 53,411 31,364Net financial position - indebtedness 906,549 750,635of which non-recourse financing 671,883 543,711Capital expenditure 155,336 38,678Employees at the year-end (no.) 42 42
School trip to the Rende (Cosenza) biomass plant

Following the Demerger and Contribution of the wind energy business to Falck Renewables SpA, the con-solidated results of the wind sector for 2010 comprised the period 1.12.2010 - 31.12.2010, as it became partof the Falck Renewables Group in November 2010. Consequently, the results of operations for 2011 and are not comparable with those of 2010, while the stateof affairs and financial position at 31 December 2011 are comparable with those at 31 December 2010.
The consolidated financial statements comprise the results of the wind sector for the full year from 1 January2011 representing a profit for the year of Euro 19,452 thousand, and EBITDA of Euro 101,859 thousand, cor-responding to 71.5% of revenue.
The net indebtedness, which reflects the significant level of investment in wind farms, increased by Euro155,914 thousand compared to 31 December 2010, as did non-recourse borrowings that amounted to Euro671,883 thousand at 31 December 2011, an increase of Euro 128,172 thousand.
Capital expenditure for the year amounted to Euro 155,336 thousand and principally related to the Buddu-sò-Alà dei Sardi and Petralia in Sicily wind farms and the expansion of the Kilbraur and Millennium windfarms in Scotland.
• Sicily projects (Integrated projects for the management and WtE treatment of waste in Sicily)
The Group worked on three projects for the construction and management of integrated WtE plants whichwere to be located in Casteltermini (province of Agrigento) (the “Platani Project”), Augusta (province ofSyracuse) (the “Tifeo Project”) and Bellolampo (province of Palermo) (the “Palermo Project”), to be con-structed by project companies belonging to the Group (together the “Sicily Projects”).
34
Cefn Croes (GB) wind farm Boyndie (GB) wind farm
35
These projects commenced following the declaration of a state of emergency in the waste managementsector in Sicily by the Italian Prime Minister in the Decree dated 22 January 1999, resulting in theappointment of a Commissioner to deal with the emergency on 31 May 1999. Subsequently the Govern-ment identified the possibility of treating the municipal waste generated in the territory of the SicilyRegion using WtE technology, as this provided the opportunity to derive fuel from waste, improving theenergy content of the residual fraction of waste by increasing the dry portion.
Following publication of O.P.C.M. (Ordinance of the Prime Minister) 3190 of 22 March 2002, whichapproved, inter alia, the construction of WtE plants, the Commissioner published an invitation to enterinto conventions with a maximum 20 year duration, for the utilisation of the residual fraction of muni-cipal waste, net of recycled waste, generated in the territory of the Sicily Region pursuant to article 4 ofO.P.C.M. 2983, (subsequently replaced by article 5 of Ordinance 3190/02), with industrial operators thatwere able to treat the residual fraction of waste and recover energy through its use in dedicated WtEplants or industrial plants under their ownership.
At this time Elettroambiente SpA (Elettroambiente), formerly part of the Enel group, together with otherlocal and non-local companies, formed a temporary business association (ATI), in which it acted as leadagent, with the purpose of bidding for public tenders. Enel Produzione SpA (Enel) was also a memberof this ATI as it provided the required financial resources that the other members lacked.
In August 2002, the Company joined a group, with Elettroambiente acting as lead agent, to submit a bidin relation to the above tender for the treatment of waste through WtE for municipalities in the Palermoarea. Subsequently, Elettroambiente and Enel left the group in respect of the Palermo area and Falck SpAtook over as lead agent.
Under the new directive, the Commissioner published calls for tenders on 9 August 2002 that wereawarded on 2 May 2003; in the same month the members of the ATI formed the special-purpose enti-ties Palermo Energia Ambiente ScpA (Pea), Platani Energia Ambiente ScpA (Platani) and Tifeo EnergiaAmbiente ScpA (Tifeo) (hereinafter, the “Industrial Operators”).
On 17 June 2003 each of these project companies executed a 20 year convention with the President ofthe Sicily Region (then the Commissioner appointed by the Italian government to tackle the emergencywaste situation), to utilise the residual fraction of municipal waste, net of recycling, generated in themunicipalities of the Sicily Region as per article 4 of O.P.C.M. 2983, replaced by article 5 of Ordinance3190/02.
Also in 2003, Enel entered into an agreement with Italgest Energia SpA (Italgest) for the sale of Elet-troambiente (the holding company of Platani and Tifeo), and further to this Falck and Italgest executedan agreement on 5 August 2003 for the sale of Elettroambiente to the Company. This provides a brief outline of how the Company came to operate in Sicily from 2003 through the threeproject companies, Pea (23.27% stake), Platani (previously an 85.73% stake increased to 86.77% from 11June 2011, held through Elettroambiente and subject to direction and coordination activities by theCompany) and Tifeo (previously a 95.62% stake increased to 96.35% from 11 June 2011, held throughElettroambiente and subject to direction and coordination activities by the Company), which were incor-porated to construct and operate the Integrated Systems for waste management in Sicily after recycling.
The salient points of the Conventions included the information contained in a number of annexes sum-marising the key financial data and the 20 year business plan that supported the financial viability of theSicily Projects. These annexes expressly envisaged that the Industrial Operators would benefit from theincentives linked to the production of energy from renewable and comparable sources recognised byLaw 9 of 9 January 1991.

In the period between late 2004 and early 2006, the Industrial Operators received all of the authorisa-tions relating to the construction and operation of the plants comprised in the integrated systems andthose relating to emissions to the atmosphere, with work commencing officially in July 2006. A seriesof unforeseeable events that were beyond the control of the Industrial Operators had a significantimpact on the timing of construction work on the WtE plants and on the financial terms of the SicilyProjects and as a consequence on the realisation of the Sicily Projects themselves.
For example, in February 2007 the Industrial Operators were notified of a Joint Ministry Decree suspen-ding the authorisations following which work was suspended (appeals to the Regional AdministrativeCourt (TAR) in Lazio and the ruling issued by the Council of State resulted in cancellation of thesuspension decree); the 2007 Finance Act introduced significant changes to existing legislation creatinguncertainty regarding the continued application of the CIP/6 incentives (it was only at the end of 2008that the TAR in Lazio ruled on the appeals made by the Industrial Operators and declared illegitimatethe silence of the Ministry for Economic Development in relation to the statements filed by the plain-tiffs against the ministry decree on article 1, paragraphs 1117 and 1118 of Law 296/2006 relating to theright to be awarded the incentives under CIP 6/1992). The above events prevented the execution of the project financing contracts essential to the construc-tion of the plants. In a letter dated 21 March 2008 the Regional Department for Waste and Water(ARRA) notified the Industrial Operators that the European Court of Justice had previously passedjudgment on 18 July 2007 (case C-382/05) whereby it found that the Italian Republic had failed to ful-fil its publicity obligations regarding tenders as the Court regarded the Conventions as public servicecontracts rather than service concessions.
The Industrial Operators may not be held responsible for the breach of procedures that led to thesigning of the Conventions. The above-mentioned letters communicated that in order to comply withthis judgment a new call for tenders would be made in order to award the service. ARRA invited theIndustrial Operators to continue carrying out work despite this situation. The requirement to imple-ment the measures established in the judgement passed by the European Court of Justice gave rise toa long and complex negotiation process between the parties in order to identify the appropriatemethods and conditions required to reach a mutual solution to the Conventions.
These negotiations lasted almost a year and were finalised on 28 April 2009 with the execution of anagreement (the Agreement) between ARRA and each of the Industrial Operators and the respectiveshareholders. More precisely it was established that: (i) in the event that no bids were submitted inrelation to the new tender, the Industrial Operators would be required to take part in a “negotiated pro-cedure”, on condition that these procedures were “carried out based on tariffs and operating conditionsin line with those stipulated in the New Call for Tenders, provided that the financial viability of the cur-rent project was preserved” (Agreement art. 3); (ii) in any event the Industrial Operators and their sha-reholders would assign ownership of the Sicily Projects, the authorisations, sites and work carried outby the Industrial Operators and the shareholders against compensation for costs incurred to be certi-fied by an independent advisor (clause 6 of the Agreements). Calls for tenders were issued the follo-wing day (no bids were submitted) and on 23 July 2009 ARRA called for a “negotiated procedure” appl-ying the same terms as those of the call for tenders using open procedures, also inviting the IndustrialOperators.
The Industrial Operators notified ARRA that they were available to attend a meeting however, at thesame time brought to the attention of ARRA the fact that the basis for the negotiated procedure did notallow the financial terms of the Conventions to be met as required under clause 3 of the Agreementsdated 28 April 2009: this was supported by an independent expert opinion (professor Mario Massari ofBocconi University in Milan).
36

37
No bids were submitted in relation to the negotiated procedure and on 11 September 2009 ARRA,without replying to the numerous requests to arrange a meeting, unilaterally terminated both the Con-ventions of June 2003 and the Agreements of April 2009, claiming that the Industrial Operators hadbreached their obligations.In October 2009 ARRA requested the insurers Zurich SpA to enforce the guarantees issued by the lat-ter as security for the performance of the Industrial Operators’ obligations established under the Con-ventions.
On 15 October 2009 the Industrial Operators served summons against ARRA and Zurich SpA beforethe Civil Court in Milan asking the court to (i) ascertain and declare that the execution of the guaran-tees was illegal; (ii) ascertain and declare that the Industrial Operators had not defaulted on the obli-gations under the Conventions dated June 2003 and the Agreements dated April 2009; (iii) ascertainand declare ARRA’s breach of its obligations under the Agreements; and (iv) order ARRA to complywith the Agreements, pay all costs incurred as certified by the independent advisor and compensate theIndustrial Operators for all damages already suffered and that would be suffered by them in future. Thisaction was brought both by the Industrial Operators and the shareholders Falck Renewables SpA (forPea), Falck SpA (for Pea), and Elettroambiente (for Tifeo and Platani). Amia SpA, a shareholder of Pea and Platani, subsequently intervened in the proceedings of the latter,requesting admission of the claims filed under the proceedings by the plaintiffs.
Moreover, the Industrial Operators filed an appeal against ARRA before the TAR in Palermo asking thecourt to cancel the act which resulted in termination of the Agreements and the Conventions, and toorder ARRA to compensate the operators for all damages already suffered and that would be sufferedin future.
At the end of 2009 ARRA extended the authorisations relating to the construction and operation of theindividual plants that constituted the Integrated Systems by a further 5 years.
On 18 January 2010 the Civil Court in Milan admitted the urgent appeal filed by the Industrial Opera-tors pursuant to art. 700 of the code of civil procedure (c.p.c.), prohibiting ARRA from enforcing theguarantees. With regard to the subject matter of the ruling, the judge, albeit as a summary judgement,established that the breach by the Industrial Operators assumed by ARRA as the basis for its decisionto terminate the Conventions and the Agreements was prima facie contradicted by ARRA in its decla-ration restated in the Agreements.
The Sicily Region’s Department for Energy and Public Utilities (replacing ARRA ex lege from 31December 2009 – “the Department”) did not appeal against the interim orders issued by the Civil Courtin Milan under art. 700 c.p.c..
On 16 February 2010 the Department joined the proceedings brought by the Industrial Operators withthe Civil Court in Milan, seeking the rejection of the measures sought by the Industrial Operators (andtheir shareholders), and asking the court to order the Industrial Operators to compensate the RegionalAdministration for the damages that it had allegedly suffered as a result of the alleged breach of theConventions (quantified as follows: Tifeo, Euro 36,656,997.65; Platani, Euro 12,898,471.19; Pea, Euro60,685,999.31).
Zurich also joined the proceedings, requesting that ARRA’s petition to enforce the guarantee policiesbe rejected.
The Industrial Operators filed a first defence brief under article 183, paragraph 6 of the c.p.c., on 8 April2010.

A second brief was filed on 8 May 2010, whereby, after informing the court of the approval by the Coun-cil of the Sicily Region of Law 9 of 8 April 2010 (the “New Regional Law”) relating to the reorganisa-tion of the waste management system in Sicily, the Industrial Operators redefined their claims, at thesame time requesting the intervention of a technical expert in relation to, among other things: 1) thedifferences in technical and/or financial requirements between the original invitations to tender andthose of 29 April 2009 with quantification of the financial consequences of the differences; 2) com-pliance with the financial viability requirement of the original projects under the Conventions drawnup on 17 June 2003; 3) the amount of the Industrial Operators’ return (representing their loss of profit)in the event that ARRA had fulfilled its obligations under the Agreement; 4) the amount of compensa-tion owed to the Industrial Operators under the Conventions.
Having acknowledged in the second brief the approval of the New Regional Law and the impossibilityof proceeding with the construction of the WtE plants, the Industrial Operators filed a third brief on 28May 2010 in which a detailed analysis of the impact on the Sicily Projects of the New Regional Law wasprovided based on an independent expert opinion. This opinion clearly demonstrated the radical chan-ges implemented by the Regional Administration in relation to the entire strategy surrounding wastemanagement and treatment in the municipalities of the Sicily Region.
Given the Department’s final and irrevocable decision no longer to proceed with the Sicily Projects inaccordance with the Conventions, confirmed by the introduction of the New Regional Law and the pro-ceedings initiated on 18 May 2010 pursuant to article 7 of Law 241/1990 (see paragraph below), theIndustrial Operators were forced to modify, before the Court in Milan, pursuant to article 1453, secondparagraph of the Italian Civil Code, their petition for specific performance of contract presented in theoriginal summons to a claim for termination of the Agreement due to the actions and default of theDepartment.
The Industrial Operators therefore sought compensation for damages suffered in respect of both pecu-niary loss (quantified as follows: Tifeo, Euro 55,745,013.00; Platani, Euro 37,676,745; Pea, Euro49,555,742.00 – of which the Company share is Euro 11,531,621.16) and loss of profit (quantified as fol-lows: Tifeo, Euro 94,100,000.00; Platani, Euro 47,800,000.00; Pea, Euro 88,800,000.00 – of which theCompany share is Euro 20,663,760.00).
Pecuniary losses correspond to the costs incurred on the projects while loss of profit represents thefinancial return that the Industrial Operators would have earned in the event that ARRA had fulfilledthe obligations defined in the Agreement.
In the hearings that took place on 15 July 2010, the modification of the claim from specific performan-ce brought by the companies in the summons previously filed, to a claim for termination of the Agree-ment due to the actions and default of ARRA was acknowledged by the Civil Court of Milan, specifyingalso that subsequent to this modification that the joinder of all parties to the Agreement would benecessary. On this basis, the plaintiffs asked the judge to postpone the hearing and set a limit for thejoinder of all parties, requesting, in any event, admission of the claims and preliminary motions broughtforward.
The public prosecutor objected to this request and asked for the intervention of an expert witness inorder to assess the damages sustained by the Department. The Court adjourned the hearing to 24February 2011 and, acknowledging the company’s request, ordered the shareholders of Tifeo, Plataniand Pea, signatories of the Agreement of 28 April 2009, to be joined to the proceedings.
Finally, the boards of directors of Tifeo and Platani on 3 August 2010 and the shareholders of Pea on 23September, approved the voluntary liquidation of the companies, which the Company believes will notaffect the above court proceedings.
38

39
As already notified to the public on 12 May 2010, all of the documentation in respect of the invitationto tender in 2002 was provided to the Italian Finance Police in relation to a tax investigation involvingundisclosed parties.
Events that took place in 2011 and subsequent to the year-end in relation to the Sicily Projects
On 24 February 2011 the Court confirmed the validity of the notices served against the named thirdparties and awarded the parties the time limits to submit statements pursuant to article 183, paragraphsix, c.p.c.. The case was adjourned and proceedings will continue in the hearing scheduled to take placeon 23 November 2011.
The shareholders’ meetings of 6 April 2011 approved the transfer of the registered offices of PalermoEnergia Ambiente ScpA, Platani Energia Ambiente ScpA and Tifeo Energia Ambiente ScpA from Paler-mo to Sesto San Giovanni.
On 14 July 2011, the Sicily Project companies were notified of Decree 548 of 22 September 2010 (the“Decree”) pursuant to which, inter alia, the said 2002 bids were declared non-responsive and all sub-sequent acts and measures adopted to implement the said procedures were cancelled in self-defence.This is in light of, among other things, the i) alleged “intersezione soggettiva” between a number of theassociated companies, ii) the alleged absence of any geographical overlap in the responses to the ten-der and iii) the outcome in 2005 regarding the infiltration of organised crime in the groups that parti-cipated in the bid, and iv) the rulings issued by the European Court of Justice on 18 July 2007.
An objection against the Decree was served on 3 October 2011, through notification of an appeal “for addi-tional grounds” in the proceedings pending before the TAR in Palermo. The nature of the challenges raisedstem from the arguments already put forward by the Industrial Operators in the statements presented on17 June 2010 in response to the notice of proceedings pursuant to articles 7 and ff. of Law 241/1990 initia-ted by the Sicily Region on 18 May 2010 that culminated with the issue of the Decree more than one yearafter presentation of the above counterclaims, in order to contest each aspect of the entire notified Decree,on the grounds of speciousness, contradiction with previous acts, including the suspension decree challen-ged in the originating application of November 2009, and illogicality, further breach of the legitimate awardto the Industrial Operator, serious flaws in the statements and finally misdirection. Compensation for actualdamage and loss of profits was sought together with the above additional grounds.
With regard to the ordinary proceedings before the Civil Court in Milan, in the hearing that took placeon 23 November 2011 the judge reserved his decision on the subject of the proceedings presented befo-re him and adjourned the hearing to 13 January 2012. In the ruling issued on 18 January 2012 – rever-sing the stance taken during the hearing of 13 January 2012 – the Court, inter alia:
- Declared that the plea of lack of territorial jurisdiction brought forward by the Department be revie-wed together with the ruling on the merits as the plea is not considered all-encompassing (i.e. thecases remain before the Civil Court in Milan);
- Approved filing of the Decree and authorised the plaintiffs and other parties to the action to submitrelevant and/or consequential documents;
- Awarded the Department time to prepare its closing statements and the plaintiffs and other partiesto the action time to reply and prepare closing statements;
- Adjourned the disputes to the hearing scheduled for 14 June 2012.
The radical change in the operating conditions from “development of WtE industrial projects as part ofthe new waste management plan” at 31 December 2009 to “no longer feasible” following the RegionalLaw of 12 April 2010, is such that the recoverability of all amounts relating to the Sicily Project hingesentirely on the outcome of the litigation in course with the Department.

Legal advisors confirmed in February 2012 that at present the status of the legal action remains sub-stantially unchanged (as stated in the legal opinions issued on 25 February and 22 July 2010 – i.e. thefinancial claims raised by the Group in substance had not changed following the modification of theoriginal claim from specific performance made in respect of the Agreement to a claim for terminationdue to the actions and default of ARRA) as no significant facts had emerged that could significantlyalter the outcome of the proceedings. With regard to the above opinions, Decree 548 of 22 September2010, submitted in the civil proceedings by the Department on 25 January 2012, stating that the provi-sions outlined therein would result in the discontinuance of the matter in issue regarding the legal dis-putes as the Decree would have effectively cancelled the motives (i.e. the Convention and Agreement)that formed the basis of the civil action brought by the Industrial Operators, has to be taken intoaccount. The Sicily Project companies disputed the arguments put forward by the Department, under-lining the fact that the Decree had been challenged before the TAR in Sicily for additional grounds ofappeal notified on 3 October 2011. The outcome of the civil proceedings could be affected by the admi-nistrative proceeding particularly in the event that the Sicily Project Companies do not obtain cancel-lation or a ruling of invalidity of the said Decree in the administrative proceedings.
At the date of preparation of the Annual Report, the first (2010) and second (2011) interim liquidationaccounts of Pea had not been approved. Pea is one of the Sicily Project companies (Bellolampo-Paler-mo) currently in liquidation, in which the Company has a 23.275% interest that was consolidated appl-ying the proportional method up to the 2010 financial statements. This is due to a dispute with the sha-reholder Amia S.p.A. (“Amia”), which holds a 48% interest in Pea and is currently in extraordinaryadministration. Consequently, as joint control may not be exercised over Pea this results in its exclusionfrom the scope of consolidation and measurement of the investment at carrying value, as illustratedbelow, while the 2011 Falck Renewables Group consolidated income statement reflects the share ofPea’s estimated loss for the twelve month period.
In the event that an agreement cannot be reached with Amia regarding approval of Pea’s third liquida-tion accounts, it is highly likely that the company will be dissolved pursuant to article 2490 of the Ita-lian Civil Code. The above issues involving Pea do not apply to the other two Sicily Project companies,Tifeo and Platani (in which Falck Renewables SpA holds indirect interests of 96.35% and 86.77%respectively through its subsidiary Elettroambiente SpA).
Furthermore, on 6 and 8 March 2012 respectively, the liquidators of Pea received notification of thebankruptcy proceedings filed by the Public Prosecutor with the Court of Palermo on 28 December 2011.The presiding judge scheduled a hearing for 28 March 2012. Pea submitted a defence statement anddocumentation relevant to the proceedings. Following the above hearing the presiding judge adjour-ned proceedings to 23 May 2012 in order to give the Public Prosecutor time to submit statements andPea time to reply.
In order to best represent Pea’s and its shareholders claims against the Sicily Regional Authorities, theshareholders Falck Renewables SpA and Falck SpA, which together hold a 48% interest in Pea, signedan agreement with Pea whereby they agree to defer the receivables (both trade and financial) to allowpayment of other creditors and waiver of the same receivables in the event that following liquidationPea does not have sufficient financial resources to pay the amounts in full. Also under this agreement,the shareholders Falck Renewables SpA and Falck SpA undertake to provide Pea with the funds requi-red to settle certain creditors. A provision of Euro 2,210 thousand was included in the sundry risks pro-vision in the consolidated financial statements in order to reflect this commitment. Pea’s other share-holders entered into separate agreements regarding the settlement of receivables with Pea.
In light of this situation, which only involves Pea and in no way impacts on outstanding disputes bet-ween Tifeo and Platani and the Sicily Regional Offices as confirmed by its legal advisors, the Falck
40
41
Renewables Group carried out a valuation of the amounts arising after deconsolidation of Pea thatresulted in the recognition of impairment losses, given the risk of dissolution of the company, againstthe carrying value of the investment in Pea and all receivables (trade and financial) due from it.Although there has been no substantial change in the claims brought forward in the proceedings as nofacts have emerged that would alter significantly the outcome of the proceedings, risks and uncertain-ties regarding the corporate governance of Pea exist that affect the risk of recoverability of the impai-red amounts.
As a result of the above, the consolidated results reflect an impairment loss of Euro 110 thousand, netof the amount arising on deconsolidation, recognised against the investment in Pea, an impairment lossof Euro 4,015 thousand against trade receivables, and an impairment loss recognised against financialreceivables due to the Falck Renewables Group from Pea, net of reversed capitalised interest, of Euro5,776 thousand and the abovementioned charge of Euro 2,210 thousand to the sundry risks provision.The total impact is Euro 12,178 thousand.
Consequently, from this year the Sicily Project cash generating units no longer include the Palermo WtEplant but only those of Casteltermini and Augusta.
For the purpose of preparing these consolidated financial statements an impairment test was perfor-med on the goodwill allocated to the Sicily Projects’ cash generating unit, the costs capitalised underthe headings Property, plant and equipment in the consolidated financial statements and Trade recei-vables, Financial receivables and Investments in the Falck Renewables SpA financial statements, andany other amount relating to the above-mentioned projects. This took into account the increase in theinvestments in Tifeo (from 95.62% to 96.35%) and Platani (from 85.73% to 86.77%), the change in inte-rest rates and the opinion of the independent legal experts.
The impairment test performed on the Sicily Projects (excluding Pea) did not determine any losses inrelation to the amounts recognised in respect of the Sicily Projects in the consolidated or separatefinancial statements. Consequently, no impairment loss was recognised against Property, plant andequipment and Goodwill attributable to the Sicily Projects in the consolidated financial statements, andInvestments and the Financial and Trade receivables due from Elettroambiente SpA, Tifeo and Platani,in the financial statements of Falck Renewables SpA at 31 December 2011.
5.1.7 Review of business in 2011
On 14 January 2011 Falck Renewables SpA entered into a loan agreement for Euro 165 million with apool of leading banks.The transaction falls within the scope of the Consolidation Project and reorganisation of the Group com-panies and its purpose is to fund development of the activities and investments envisaged in its businessplan.The loan agreement provides for a term facility with a cap of Euro 70 million and a revolving facilitytotalling Euro 95 million. The loan, which was received in April 2011 following completion of the sharecapital increase, will mature on 30 June 2015. The contract requires covenants to be fulfilled (Consolida-ted Net Financial Debt over Consolidated EBITDA and Consolidated Net Financial Debt over Consoli-dated Total Equity) every six months commencing 30 June 2011: these covenants have been met to date.
Details of the dispute between the Sicily Project companies Tifeo Energia Ambiente ScpA, Platani Ener-gia Ambiente ScpA and Palermo Energia Ambiente ScpA and the Sicily Region’s Department for Energyand Public Utilities are provided in the note above.

The photovoltaic plants of Cardonita (Enna) 3.8 MW, Spinasanta (Catania) 6 MW and Sugherotorto(Ragusa) 3.3 MW, a total of 13.1 MW, were put into commercial operation by Actelios Solar SpA on 25April 2011. A Euro 47 million project financing contract was entered into for the purpose of constructingthe plants.
Work on the 15 MW extension to the Millennium wind farm was finalised in March following whichcommercial operations commenced.
The 20 MW extension to the Kilbraur wind farm was also completed in the second quarter of 2011 andis currently in the advanced stages of commissioning. Kilbraur Wind Energy Ltd, a subsidiary of FalckRenewables Wind Limited, finalised a non-recourse project financing transaction worth Euro 23.3 mil-lion. The transaction, financed by The Royal Bank of Scotland Plc with 80% leverage and a 16 year term,was secured only a few months after the loan issued again by The Royal Bank of Scotland Plc in Decem-ber 2010 to fund the 15 MW extension of the Millennium wind farm (Scotland).
Work on the largest Italian wind farm of 138 MW in Buddusò-Alà dei Sardi continued ahead of schedu-le. The wind farm has now been completed and the commissioning stage for the last aerogenerators isbeing finalised.
There were 47 aerogenerators in commercial operation at 31 December 2011, while the remaining 22commenced commercial operations at the end of February 2012 and will receive final approval in the firsthalf of 2012.
• Significant events relating to the Consolidation Project
As envisaged by the Consolidation Project,for the purpose of transferring to Falck Rene-wables SpA all of the activities relating to themanagement, administrative, legal, financialand control services that Falck SpA providedto the Group companies, on 22 December2010, Falck SpA sold the business comprisingthe assets (management software, goodwill,furniture, furnishings and electronic equip-ment) and employees (together with the TFRand holiday provisions) dedicated to provi-ding these services, to Falck Renewables SpAwith effect from 1 January 2011. As part ofthis agreement 28 employees were transfer-red to Falck Renewables SpA (6 managersand 22 middle management and white-collarstaff). Within the same reorganisation,Riesfactoring SpA, controlled by Falck SpA,sold the business that consisted of the assets(goodwill, furniture and furnishings) andemployees (together with the TFR and holi-day provisions) dedicated to the treasuryfunction to Falck Renewables SpA on 22December 2010, again with effect from 1
42
Falck Renewables Group brochure

43
January 2011. This agreement resulted in the transfer of 3 employees (1 manager and 2 white-collarstaff).
On 9 February 2011 the board of directors of Falck Renewables SpA established the final terms for theoffer of its new ordinary shares to be issued upon the exercise of pre-emptive rights granted to existingholders, thereby completing the terms approved by the board of directors on 2 December 2010 and exe-cuting the powers vested in the directors by the extraordinary shareholders’ meeting of 27 August 2010.
The rights offering concluded with all of the 129,517,284 new ordinary shares being subscribed at Euro1.003 per share for a total value of Euro 129,905,835.85 net of commission and expenses. Consequently,the underwriting services offered by the syndicate were not required.
With regard to Falck SpA’s underwriting commitment, at 31 December 2011 Falck SpA holds a 60%stake in the new share capital of Falck Renewables SpA.
The table below illustrates the movements in share capital in the period 30 June 2010 – 31 December2011 and the stake of the majority shareholder.
Number of shares in issue Share capital Falck SpA's stake in Falck Renewables SpA
30 June 2010 67,680,000 67,680,000 68.72%31 December 2010 161,896,607 161,896,607 74.95%31 December 2011 291,413,891 291,413,891 60.00%
5.1.8 Employees
The number of Group employees at the year-end was 241 and comprised:
(Number) 31.12.2011 31.12.2010 ChangeManagers 24 19 5White-collar staff 140 115 25Blue-collar staff 77 76 1Total employees in consolidated entities 241 210 31
As Frullo Energia Ambiente Srl is consolidated applying the proportional method, the total at 31 Decemberincluded the 49% proportional share of the employees amounting to 19 white-collar staff and 28 blue-col-lar staff.
The increase of 31 compared to 31 December 2010 is largely due to the Falck SpA and Riesfactoring SpAemployees transferred to Falck Renewables SpA following acquisition of the businesses relating to the pro-vision of management services in early 2011.

5.1.9 Environment, health and safety
During the year the Group continued its commitment to meet adequate environmental, safety and qualitystandards that are consistent with its mission statement, through:
- On-going improvements in the integration of company management procedures relating to quality, envi-ronment and safety, by taking advantage of synergies in these areas;
- Periodic training of employees in relation to health and safety in the workplace and increasing awarenessregarding the protection and safeguarding of the environment while carrying out their work.
More specifically the principal Group subsidiaries operating in the WtE, biomass and photovoltaic sectorhad the following systems in place at 31 December 2011:
Company Management system LocationFalck Renewables SpA Quality management system UNI EN ISO 9001:2008 Head office
for services provided to group companies: human resources, administration and finance, procurement, quality, environment and safety management.Environmental management system UNI EN ISO 14001:2004Safety management system OHSAS 18001-2007
Ecosesto SpA Certified integrated quality and environment system - Head officeUNI EN ISO 9001:2008 - Rende biomass plant Environmental management system UNI EN ISO 14001:2004 - Rende biomass plant Safety management system OHSAS 18001- 2007 - Rende biomass plantSafety management system OHSAS 18001- 2007 - Fusina WtE plant
Ambiente 2000 Srl Quality management system UNI EN ISO 9001:2008 Trezzo sull’Adda Environmental management system UNI EN ISO 14001:2004 WtE plantSafety management system OHSAS 18001-2007 Certificate of Excellence (quality, environment and safety)
Prima Srl Environmental management system UNI EN ISO 14001:2004 Trezzo sull’Adda EMAS III registration WtE plant
Esposito Servizi Quality management system UNI EN ISO 9001:2008 Plant in Gorle: Ecologici Srl Selection and
adjustment of volume of non-hazardous wasteWaste collection and transport
Ecocentro Soluzioni Environmental management system UNI EN ISO 14001:2004 Plant in Gorle: Ambientali Srl Treatment and recovery (merged into Esposito EMAS III registration of non-hazardous waste Servizi Ecologici Srl) mainly from street
sweeping and land reclamation
44

45
With regard to accidents, two accidents took place in 2011 involving employees of the Falck RenewablesGroup. Consequently, the total Group accident frequency and criticality rates were 6.41 and 0.50 respecti-vely.With regard to companies operating in the wind energy sector both in Italy and abroad, no accidents wererecorded in the course of 2011. The companies have adopted internal quality, environment and safety mana-gement systems and the operating plants in Italy have implemented environmental management systemscertified under UNI EN ESO 14001:2004, while Eolo 3W Minervino Murge Srl has also been awarded anEMAS registration.
5.1.10 Research and development activities
The Falck Renewables Group did not carry out any research and development activities in 2011.
5.1.11 Risks and uncertainties
a) Financial
1. Credit riskCredit risk represents both potential losses from non-settlement of receivables and the counterparty riskconnected to the negotiation of other financial assets. The credit risk exposure of the Falck RenewablesGroup is very limited in respect of both commercial customers and financial counterparties. Commercialcustomers present a low risk due to their nature: one third of amounts due from third parties (not rela-ted parties) is owed by the Italian national electrical energy supplier (GSE). The degree of concentrationof customers is medium-high, however they have a high credit rating. The credit risk attributable to thecounterparties with which the derivative financial instruments are negotiated is also limited as the deri-
Street sweeping recovery plant in Gorle (Bergamo) Trezzo sull’Adda (Milan) WtE plant
vatives are negotiated with leading financial institutions. A summary quantitative indication of the maxi-mum exposure to credit risk is the carrying amount of the financial assets, expressed gross of derivativeswith a positive fair value and net of any guarantees. The Group does not enter into instruments or guarantees to mitigate credit risk and as a consequencethese have no impact on the disclosures that follow.Amounts due to the parent company Falck Renewables SpA from the Sicily Project companies are linkedto the risks and uncertainties surrounding the outcome of the dispute with the Sicily Region as disclosedin full in the above note on the Sicily Projects.
2. Liquidity riskThe Falck Renewables Group has a group treasury department that does not employ a cash poolingsystem with all of its subsidiaries but carries out netting of opposing balances through the use of specificintercompany correspondence accounts. With regard to the management of Falck Renewables Group’sliquidity, in accordance with the agreement between Falck SpA and Falck Renewables SpA, until last yearthe latter transferred to Falck SpA the liquidity not required for working capital, and Falck SpA under-took to repay the liquidity, either in whole or in part, in order to meet the Falck Renewables Group’s capi-tal expenditure commitments, in line with the notice terms of the agreement. These terms were appliedin relation to the extraordinary transaction that resulted in the transfer of the Falck Renewables Windgroup to Falck Renewables SpA. As part of this transaction Falck Renewables SpA’s financial receivablesdue from the parent company Falck SpA were extinguished following repayment of Falck RenewablesWind’s debt to Falck Energy SpA. In order to carry out this repayment, Falck Renewables Wind secured aloan from its parent company Falck Renewables SpA that on one hand extinguished the financial recei-vable owed by Falck SpA and on the other took out a short-term loan for the part that exceeded the abo-vementioned receivable. All of the above transactions took place in accordance with the terms of the trea-sury agreement. The loan payable to Falck SpA was reimbursed on 7 April 2011 following the share capi-tal increase and securing the Euro 165 million loan contract. Finally, the Falck Renewables Group prepares an updated cash flow statement and the cash budget on amonthly basis, in which the actual data for the period are supported by a summary evaluation and com-mentary.
3. Market risksThe Falck Renewables Group manages interest rate risk centrally. Although it does not define in advan-ce the maximum variable rate debt exposure, it does follow well-established procedures aimed at moni-toring risk and that avoid undertaking transactions of a speculative nature.The type and suitability of hedging instruments is evaluated for each specific case in consideration of theamount of exposure and current financial market conditions.
The Falck Renewables Group uses derivative financial instruments to hedge interest rates and in particu-lar enters into interest rate swaps (IRS) with the exclusive aim of hedging. Moreover, the derivatives heldat the year-end were acquired in order to allow the debt structure to meet the covenants determined bythe financial institutions in relation to project financing. In particular, borrowings at variable rates forthese contracts are matched with opposing IRS that partially convert the borrowings from variable tofixed rates. Although these operations are entered into to hedge interest rate risk, hedge accounting is notapplied to all of these derivative financial instruments. Consequently, changes in the fair value of thesederivatives follow the general rule applied to trading derivatives and are charged directly to the incomestatement with a direct effect on profit for the year.Approximately 85% of net debt was hedged against interest rate fluctuations through IRS.
46

47
b) Legal
The principal legal risks associated with current litigation are as follows.
. Ecosesto SpAWith regard to litigation with Syntea SpA, on 14 December 2011 the Court dismissed the appeal filedby Syntea and sentenced it to pay the costs. The potential loss to Ecosesto SpA is in line with theamount already provided (Euro 300 thousand).
. Elettroambiente SpAOn 2 April 2008, Enel Produzione commenced arbitration proceedings against Elettroambiente, reque-sting the transfer to Elettroambiente of its shareholdings in Tifeo and Platani (both in liquidation) clai-ming that Elettroambiente should pay the sum of Euro 3,550,743.00; all on the basis of an optionagreement executed between them on 13 May 2003. A settlement was signed by both parties on 11 June 2011 whereby Elettroambiente agreed to pay Euro800 thousand in settlement of, inter alia, the acquisition of Enel Produzione’s stakes in Tifeo EnergiaAmbiente and Platani Energia Ambiente, which represent 0.73% and 1.04% respectively of share capi-tal.
. Sicily projects (Projects for the management and WtE treatment of waste in Sicily)
- Altecoen Srl in liquidation/Tifeo On 28 December 2009, Altecoen Srl (hereinafter “Altecoen), currently in liquidation, served threewrits on Tifeo regarding agreements for the sale of land in the municipalities of Caltagirone,Enna and Modica, entered into on 1 December 2005. Altecoen’s requests were: (i) primarily,immediate payment of the balance for the sale (95% of the consideration), respectively Euro23,401.80, Euro 229,301.05 and Euro 169,588.30 and (ii) alternatively, termination of the agree-ments, with the award of damages that Altecoen calculated as no less than Euro 5,616.43, Euro83,424.63 and Euro 40,701.19. Tifeo joined the proceedings and in turn requested that the claimbe rejected, while retaining the right to exercise the put option on Altecoen’s land, as envisagedin the agreements, after verifying the implications that Regional Law 9 of 8 April 2010 (RegionalLaw 9/2010) had on proceeding with the Tifeo Project (the Project). On 9 June 2010, Tifeo exer-cised the put option. Altecoen sent a recorded delivery on 1 July 2010, in which it notified its intention to repurchasethe land in question. In the statements filed in the three actions pursuant to article 183, para-graph 6, no. 1 of the c.p.c., Tifeo acknowledged the impact that Regional Law 9/2010 and the pro-cedure pursuant to article 7 ff of Law 241/1990 had on the Project’s execution and the exerciseof the option right stipulated in the agreements. In reference to the last point, Tifeo requested that in the event that Altecoen defaulted on its obli-gation to repurchase the land, a ruling be made pursuant to article 2932 of the Italian Civil Code,to execute the sale and purchase agreements and that Altecoen be ordered to return the sumsalready paid by Tifeo. Altecoen submitted a counterclaim against the last request in its statementto the Civil Court of Enna pursuant to article 183, paragraph 6 no. 2, requesting that the Courtorder Tifeo to pay an indemnity for use of the land under dispute. After several attempts at rea-ching a settlement, in the hearing that took place on 16 February 2012 Tifeo requested, pursuantto article 153 paragraph 2 of the Civil Code (“c.p.c.”), the case be re-opened to submit Decree548 issued by the President of the Sicily Region on 22/9/2010 (the Decree) and the appeal onadditional grounds in Tifeo’s favour notified on 3/10/2011; Altecoen opposed this request, askingthat the Court grant time to submit a counterclaim. The trial was adjourned to the hearing sche-duled for 7 June 2012. With regard to the proceedings before the Civil Court of Caltagirone, on

14 December 2010 the Court held that the case was not within its territorial jurisdiction and,accordingly, removed the case from the case register and set Altecoen a deadline of three monthsto transfer the matter to a competent Court. In an application to reinstate the action on 12 March2011, Altecoen resumed proceedings before the Court of Siracusa. Tifeo joined the proceedingssubmitting its defence on 16 September 2011. The first hearing pursuant to article 183 of thec.p.c., originally set for 10 October 2011, was adjourned to 7 November 2011. On conclusion ofthis hearing the Court withheld sentencing. Finally, in relation to the proceedings before theCivil Court of Modica, in the hearing of 30 June 2011 the parties indicated to the Court their wil-lingness to settle and the case was first adjourned to 20 January 2012 and later to 13 April 2012.The parties are exploring the possibility of reaching an amicable settlement of the disputes. Asthese disputes are still in the opening stages, it is not possible at present to predict the outcomeof the proceedings, or exclude the possibility of an adverse outcome.
- Gulino Group SpA/TifeoOn 28 December 2009 Gulino Group S.p.A. (“Gulino”) served two writs on Tifeo regarding thesale agreements for some sites of land in the municipalities of Modica and Enna/Assoro, ente-red into on 1 December 2005. Gulino claimed: (i) primarily, immediate payment of the balanceof the sales (95% of the total consideration), respectively Euro 2,774,950 and Euro 2,931,700; and(ii) alternatively, the termination of the agreements and payment of damages calculated at notless than Euro 2,143,968 and Euro 2,258,700. Tifeo joined the proceedings requesting the claimbe rejected, while stating that it would consider its position with regard to the request for termi-nation after verifying the implications of Regional Law 9 of 8 April 2010 on the ability to proceedwith constructing the plants. In the statement filed pursuant to article 183, paragraph 6, no.1 ofthe c.p.c., Tifeo acknowledged the impact of Regional Law 9/2010 and the procedure pursuant toArticle 7 ff of Law 241/1990 on the ability to execute the project and the request to terminate theAgreement with ARRA submitted in the action pending before the Court of Milan. Tifeo alsorequested that the sale and purchase agreements be terminated; demanding the reimbursementof all sums already paid (5% of the sale price plus VAT on the whole amount, namely Euro730,250 and Euro 771,500 respectively). In the proceedings before the Civil Court of Enna, in thestatement filed pursuant to article 183, paragraph 6, no.2, Gulino submitted a counterclaimrequesting the Court to order Tifeo to pay an indemnity for the use of the land under dispute. After several attempts at reaching a settlement, in the hearing that took place on 16 February2012 Tifeo requested, pursuant to article 153 paragraph 2 of the c.p.c., the case be re-opened tosubmit Decree 548 issued by the President of the Sicily Region on 22/9/2010 (the Decree) andthe appeal on additional grounds in Tifeo’s favour notified on 3/10/2011; Altecoen opposed thisrequest, asking that the Court grant time to submit a counterclaim. The trial was adjourned tothe hearing scheduled for 7 June 2012. In the proceedings before the Civil Court of Modica, during the hearing of 7 October 2011 to dis-cuss the preliminary statements presented by the parties, the Court of Modica upheld Tifeo’sclaim of lack of territorial jurisdiction, transferring the case to the Civil Court of Siracusa, remo-ved the case from the register and granted the parties time to resume proceedings before thecompetent court. Gulino notified Tifeo of the reinstatement of the case before the Civil Court inSiracusa on 9 January 2012; the first hearing is scheduled to take place on 14 May 2012. Giventhat the disputes are still in the opening stages, it is not possible to predict the outcome of theproceedings or exclude the possibility of an adverse outcome for Tifeo.
48

49
- Panelli Impianti Ecologici SpA/Tifeo
A)ProceedingsTifeo brought an action before the Civil Court of Milan against the temporary injunction orderawarded to Panelli Impianti Ecologici S.p.A. (in liquidation) (“Panelli”) by the Civil Court ofMilan on 17 June 2010 and notified to Tifeo on 23 July 2010. Under this injunction the Courtin Milan ordered Tifeo to pay Euro 5,079,349 representing the balance of the amount payableto Panelli by Tifeo for the purchase of land owned by Panelli pursuant to sale agreements ente-red into on 1 December 2005. On 23 September 2010 Tifeo exercised the put option envisagedby article 3.2 of the agreement to transfer the land under dispute to Panelli. Tifeo issued a writon 30 September 2010, within the time limits required by law, opposing the injunction andnotified Panelli, requesting (i) revocation of the provisional enforceability of the injunctionorder, (ii) revocation of the injunction order on the grounds that Tifeo was not in breach of theagreements, (iii) that in the event that Panelli contested the exercise of the option by Tifeo anddefaulted on its obligation to repurchase the land, that a constitutive ruling be made pursuantto article 2932 of the Italian Civil Code to enforce the sale agreements and order return of allsums already paid by Tifeo. Panelli joined the proceedings on 24 January 2011 submitting adeed of reply in which it denies in full the claims made by Tifeo and requested the separationof the proceedings relating to the put option, contesting the claims put forward. Followingthe hearing that took place on 26 January 2011 to discuss the suspension of the provisionalenforceability of the opposed injunction, the Court of Milan admitted Tifeo’s claim thussuspending the provisional enforceability and confirming, albeit in a summary ruling, the sub-stance of the claims brought forward by Tifeo regarding (i) the irrecoverable nature of thereceivable claimed by Panelli in the payment injunction due to non-fulfilment of the event towhich payment of the balance for the land purchase was dependent (i.e. the loan was notissued) and (ii) Tifeo’s valid and effective exercise of the option right on 23 September 2010regarding sale of the land pursuant to the contracts’ terms. In the hearing that took place on17 February 2011 the Court assigned the limits under law for filing statements pursuant toarticle 183, paragraph six, c.p.c., adjourning the proceedings to 29 June 2011, following whichthe Court adjourned the case to 15 March 2012 to allow the admission of facts. In light of themotives presented by the Court on 26 January 2011, justifying the actions, at present it is con-sidered improbable that Tifeo will lose the case.
On 4 October 2010, Panelli served a writ of execution on Tifeo pursuant to article 480 of c.p.c. forpayment of Euro 6,954,528.82 (representing the amount of Euro 5,079,349 cited in the injunc-tion order plus interest and costs).Subsequently, on 24 November 2010 Panelli issued an order to seize Tifeo’s bank accounts andTifeo’s receivable due from Platani Energia Ambiente S.c.p.A. (Platani) “up to the amount spe-cified in the writ of execution plus half, corresponding to Euro 10,431,793.23”. On 13 December 2010, Tifeo filed its objection to the enforcement actions pursuant to article617 c.p.c., claiming (i) lack of territorial jurisdiction of the Civil Court of Milan in relation tothe third parties Platani and Unicredit SpA and consequently (ii) the invalidity of the seizureorder, for lack of territorial jurisdiction of the Court official that issued the order. The hearingto discuss this objection, pursuant to article 618 c.p.c., was held on 14 March 2011, duringwhich, the Court reviewing the enforcement proceedings acknowledged the ruling to suspendthe provisional enforceability of the injunction order until the outcome of the proceedingsopposing the injunction order. The Court of the enforcement proceedings assigned the limitsfor filing introductory statements regarding the bases for opposing the enforcement orders;consequently under the writ served on Panelli on 28 May 2011, Tifeo claimed (i) lack of terri-

torial jurisdiction of the Civil Court of Milan in relation to the third parties Platani and Uni-credit SpA, (ii) cancellation of the seizure order, for lack of territorial jurisdiction of the Courtofficial that issued the order and consequently (iii) cancellation of the enforcement procee-dings. In the first hearing before the Civil Court of Milan on 4 October 2011, the Court gran-ted time to submit statements pursuant to article 183, paragraph 6 of the c.p.c.. The Court,adjourned the proceeding to the hearing of 16 April 2013.
- Palermo Energia Ambiente ScpA/SafabSAFAB (Società Appalti e Forniture per Acquedotti e Bonifiche S.p.A. that subsequently assignedthe claims in the action to Safab S.p.A. (“Safab”)), initiated arbitration proceedings against Pea on2 February 2010. Safab requested the board of arbitration (i) to find Pea in breach of the tender con-tract entered into by the parties on 8 March 2005, regarding construction work to be performed bySafab in order to execute the Pea Project; (ii) to terminate the tender contract owing to acts com-mitted by and through the fault of Pea; and (iii) to order Pea to pay Euro 20,047,293.63 as conside-ration for work carried out and damages (this request was later reduced to Euro 16.5 million). Pea responded in the arbitration proceedings objecting that it was not in default of its paymentobligations under the contract since the alleged breaches of contract were the subject of a compro-mise settlement agreed by the parties on 2 April 2009. Pea also argued that it was not in breach ofthe compromise settlement since, following execution of the Agreement of 28 April 2009 withARRA (to which Safab was a party), Safab agreed that the amounts it was due to receive in accor-dance with the settlement would be paid in the manner specified in and in accordance with, theprovisions of the Agreement with ARRA. After it became clear that the project would not proceed,Pea submitted a counterclaim to the board of arbitration, asking the board to rule on the termina-tion of the tender contract and the compromise settlement under the principle of frustration of pur-pose or, alternatively, factum principis (representing a decision or order issued by a relevant autho-rity which overrides any contractual obligation to fulfil or otherwise comply with the terms of thecontract). In the hearing of 13 September 2010, the board of arbitration, deferring any decision on the inad-missibility of the claims to invalidate or terminate the compromise settlement due to breach by Pea,explored the possibility of reaching a settlement, on conclusion of which the parties declared theywould consider the possibility of reaching an amicable settlement of the dispute. After severaladjournments, in the order dated 9 February 2011, the board of arbitrators, requested the interven-tion of an independent technical expert to provide an opinion on the statements formulated by theparties. Following further adjournments, on request of both parties presented on 24 January 2012,the arbitration proceedings were suspended until 10 May 2012. It is not possible at present to pre-dict the final outcome of this dispute.The appointment of an independent technical expert in the proceedings does not give any indica-tion of the leanings of the board of arbitration as the investigation to be carried out by the techni-cal expert is instrumental to the ruling on the claims filed by both parties. This does not howeverexclude the possibility of Pea losing the case, which is limited to the amounts determined in thecompromise agreement (approximately Euro 4.5 million). A sundry risk provision has been set upto cover part of this amount.
50

51
- Consorzio Ravennate delle Cooperative di Produzione e Lavoro ScpA (the Consorzio)/Elet-troambiente An injunction was filed on 9 October 2010 by the Consorzio for service on 27 October 2010, andprovisionally enforceable only against Pianimpianti, a shareholder of Platani, whereby the Court ofRavenna ordered Elettroambiente and other shareholders of Platani, to pay Euro 1,530,711 to theConsorzio representing payment for work carried out pursuant to a tender contract entered into on4 August 2006 between the Consorzio and Pianimpianti for civil works on the Platani Project. Theaction was also brought against the other shareholders of Platani on the grounds that they werejointly and severally liable pursuant to article 13 of Law 109/1994 (now article 37 of LegislativeDecree 163/2006). In a writ served on the Consorzio opposing the injunction, Elettroambiente ini-tially contested the claims brought against it as the conditions for invoking its joint and several lia-bility were not satisfied as it had not signed the said tender contract. Moreover, regarding the sub-ject matter of the dispute Elettroambiente has requested (i) withdrawal and/or cancellation of thesaid injunction due to (a) the invalidity of the basis, namely the tender contract, on which theinjunction was issued and (b) the acknowledgement of the events that occurred in the meantime(i.e. the issue of Regional Law 9/2010 and the proceedings initiated by the Department pursuant toarticle 7 and ff of Law 241/1990 to render invalid the 2002 tender process and all related measures)that made it impossible to proceed with the Project, with all related consequences regarding theimpossibility of the Consorzio to finish the work specified in the tender contract; and (ii) to verifythe absence of any sum owed by Elettroambiente to the Consorzio. Subordinately, in the event ofconviction, Elettroambiente filed recovery actions against Pianimpianti and EPC Sicilia Srl (whichsold the business of Pianimpianti involved, inter alia, in the dispute), in order to recover any sumthat Elettroambiente may be ordered to pay to the Consorzio, requesting the Court pursuant toarticle 269 c.p.c. to summon Pianimpianti and EPC Sicilia to the action. In a writ served on the Con-sorzio on 9 December 2010 Enel Produzione contested the injunction requesting it be fully refor-med and that the claims made against it by the Consorzio be dismissed. Consequently, Enel Pro-duzione enforced Elettroambiente’s guarantee, invoking the indemnity clause pursuant to the sha-reholders’ agreement entered into by the parties on 27 October 2002. Finally, AMIA, EMIT andCatanzaro Costruzioni have also independently contested the above injunction without howevermaking any claim against Elettroambiente. The actions were originally assigned to different courtsbut were later grouped with the exception of the action brought by AMIA as it is currently inextraordinary administration: this action will therefore proceed independently of the others. Theparties exchanged statements pursuant to article 183, paragraph 6 of the c.p.c.. With regard to the above exchange of statements, in its first statement Elettroambiente, in light ofthe Project no longer proceeding, requested appointment of a technical expert (i) to ascertain whe-ther, given the impossibility of executing the Project, the work carried out by the Consorzio underthe tender contract is currently of any use to Pianimpianti and, consequently, (ii) in the event thatit is, identify which work Pianimpianti can put to use; the purpose being to establish whether Pia-nimpianti is required to pay the Consorzio compensation pursuant to article 1672 of the ItalianCivil Code. In the third statement Elettroambiente and Enel Produzione waived the claims and objectionsmade by each other in the proceeding. The Court reserved judgement following the hearing thattook place on 2 February 2012 to discuss the claims made by the Consorzio for the temporaryenforcement of the opposed injunction orders, and the admission of preliminary statements by theparties. As the proceeding is in the initial stage it is not possible to predict the outcome at present.Given the highly delicate nature of this dispute, the risk of an adverse outcome for Elettroambien-te cannot be excluded.

- Palermo Energia Ambiente ScpA/Tax authorities Following the application submitted by Pea to the tax authorities regarding VAT to be reclaimed inrelation to 2005 to 2009, Pea received Euro 386 thousand (2005 VAT) on 24 April 2007 and Euro1,021 thousand (2006 VAT) on 19 August 2008. On 27 July 2011, Pea received a copy of a letterissued by the tax authorities to Unicredit SpA regarding enforcement of the guarantee issued by Peafor an amount of Euro 1,111 thousand, pursuant to article 38bis Presidential Decree 633/72, regar-ding the 2006 claim. Pea received a tax demand from the Provincial Offices in Palermo on 29 July2011, rejecting the VAT claim made in respect of 2006 and issuing a penalty of 100% of the claimsubmitted. This tax assessment has been appealed. The tax authorities have also rejected the 2007and 2008 VAT claims on the basis that Pea is not an operating company and has no right to claimrepayment. Pea challenged this refusal in an appeal. In its ruling of 28 December 2011 the Provin-cial Commission of Palermo admitted the appeals filed by Pea and agreed to settle the claims forrepayment. A default notice was sent to the tax authorities regarding payment of all sums due.
. Falck Renewables Wind Ltd
- Arbitration Falck SpA- Geopower Sardegna Srl - GEO Mbh A request for arbitration was filed on 25 June 2009 by GEO Gesellschaft für Energie und Oekolo-gie mbH against Falck SpA after a dispute arose regarding the consideration payable by FalckRenewables Wind Ltd under an agreement for the sale of quotas in GeoPower Sardegna dated20 May 2005. The request regards the enforcement of the corporate guarantee for Euro 3,621,000issued by Falck SpA on 8 April 2009. The board of arbitration assessed the credit secured by the corporate guarantee as Euro 1.9 millionand handed down its award on 8 October 2010, ordering Falck SpA to pay Euro 1.9 million. On18 November 2010 Falck SpA filed a plea to correct the award, having found mistakes in its calcu-lation. In an order of 20 December 2010, the board of arbitration dismissed the application for thecorrection of the award. On 7 September 2011 Falck SpA filed an appeal with the Appeal Court inMilan, claiming the invalidity of the arbitration award and a plea for suspension of the award exe-cution; this plea was thrown out by the Court order issued on 20 October 2011. The first hearing on the merits of the appeal action is scheduled to take place on 29 May 2012. Inthe meantime a notice of objection to the payment order was served by GEO relating to the awar-ded amount and subsequent costs (which have been paid by Falck under right of restitution). GEOraised an enforcement order in relation to a dispute that arose regarding bank commission appliedto the amount paid to it by Falck, seizing Euro 500 from Falck’s bank accounts. Falck commencedlegal proceedings opposing the order. Given the complex subject matter and the new rules governing the challenge of arbitration awards,the outcome of the dispute is uncertain and as a consequence recovery of the sums already paid isconsidered unlikely.
c) Internal and external risks
The Falck Renewables Group is largely exposed to risks relating to the authorisation process involvedwith the development of its projects and the authorisations held that are necessary to continue pro-duction activities.In order to mitigate these risks the Group is diversifying both the types of investment and the loca-tion of the operating plants in order to spread the risks across different businesses.With regard to the operating plants, the risks principally relate to the activities performed by theworkforce and the operation and maintenance of owned plants or those managed by Group compa-nies, in order to ensure that they respect the requirements of the Integrated Environmental Authori-sation (AIA) and authorisations issued under law.
52

53
Moreover, the renewable energy market in which the Group operates is heavily regulated. As a con-sequence particular care must be paid in order to keep abreast of regulatory developments so that,where possible, the best implementation solutions may be adopted. The previous factors present a significant risk to the Group.
d) Risks related to the legal/fiscal and regulatory framework
The Group operates in a highly regulated sector. The directives and regulations on renewables issuedboth at European and national level can have a significant impact on the Group’s activities andresults. These regulations govern, inter alia, the construction phase (regarding both construction andadministration authorisations), the operations phase, the environmental aspects (regulations relatingto the landscape and noise pollution). Consequently, these regimes affect the way in which the Groupcarries out its business. The rules applicable to the generation of electricity from renewable sourcesvary from country to country and may be subject to changes in future. Future changes in the regula-tory framework could have a significant impact on the authorisation procedures for new plants andtherefore on revenue. The Group mitigates this risk as far as possible by constantly monitoring regu-lations in order to take on board potential changes immediately and minimise any economic impacts.
e) Risks related to production
The sources of energy used in this sector lead to highly variable production, due to variable climaticconditions of the locations of the wind farms and the photovoltaic plants (sun and wind), and pro-duction forecasts based on historic data and probability estimates. In particular, electricity generation from wind and solar sources are associated with unforeseeable cli-matic factors that are affected by seasonality during the year and do not generate constant productionlevels. Adverse climatic conditions, specifically long periods of low wind levels for the wind farms and lowlevels of sun rays for the photovoltaic plants compared to levels recorded during the development sta-ges (regarding the availability of the source and forecast climate conditions), could result in a drop in,or interruption of, the plant’s activities with a fall in the volume of electricity generated and a negati-ve impact on operations and the Group’s results, state of affairs and financial position.The Group mitigates this risk by installing new sites in diversified geographic areas and monitoringperformance using historic data in order to identify sites of potential interest.
f) Risks related to plant technology
The technology used to produce energy from renewable sources is subject to continuous developmentand improvement. The Group cannot guarantee that the technology and materials currently used toconstruct the plants will allow them to function effectively throughout their entire lifecycle. In theevent that the technology and/or materials used are no longer efficient, some or all of the Group’sowned plants may suffer a drop in the volume of electricity produced and have a negative impact onthe Group’s results, state of affairs and financial position.
g) Risks related to supplier dependence
Capital expenditure in this sector consists of technologically advanced components (such as windaerogenerators and photovoltaic panels), manufactured by a limited number of suppliers, particularlyin the wind sector. The expansion of the renewable energy market and the resulting constant growthin demand, may result in increased purchase prices and longer delivery times.The continued economic and financial crises at international level has led to machine prices remai-ning in line with the previous year and improved delivery times.

h) Risks related to plant financing
The Group finances its projects, in particular in the wind sector, principally through project financing andin many cases taking out bridging loans during the construction phase while waiting to receive theseloans.The current financial situation and the difficulties involved in raising debt has witnessed a general wor-sening in the economic conditions of project financing and an extension in the time taken to secure thefinance. The Group continues to have access to this form of financing at economic conditions and within a time-frame that meets the construction and performance specifications of the financed projects.
5.1.12 Significant events after the balance sheet date
No significant events took place after the balance sheet date that require disclosure with the exception ofthose set out in the note regarding the Sicily Projects.
5.1.13 Management outlook and going concern
2012 revenue will benefit from the full-year production of:
- The Buddusò-Alà dei Sardi (138 MW) wind farm; - The expansions to the Kilbraur (20 MW) and Millennium (15 MW) wind farms.
The above increase in installed capacity will more than offset the fall in revenue attributable to the expiry in2011 of the incentive portion under point 3 of the CIP 6/92 decree in respect of both the Trezzo sull’Addaand Granarolo dell’Emilia WtE plants.
With regard to plants under construction, the 22 MW Petralia wind farm is expected to be completed andcome on stream in the first half of 2012 while the 10 MW Ty Ru wind farm in France is expected to com-mence operations by the end of 2012. Construction work commenced on the 15 MW wind farm of Nut-berry Wind Energy Ltd (15 MW), which is expected to be completed in the first half of 2013.
Authorisations have been received to construct the Spaldington Airfield (15 MW) and West Browncastle (30MW) UK wind farms, which will be completed in 2013 together with the previously authorised Kingsburn(20MW) wind farm.
The funds required to finance construction of the above plants will impact the net financial position, withthe increased debt partially offset by cash generated by the operating plants.
The Group will continue to monitor regulations in the renewables sector, with particular focus on incenti-ves schemes, particularly in Italy where the renewable energy incentives regime is currently under review.The Group will monitor regulatory and tax changes in order to allocate investments to those businesses orcountries that are more interesting and advantageous, with a view to diversifying both renewable technolo-gies employed and geographical location.
54

55
5.1.14 Combined results
The following combined data have been prepared in order to provide shareholders, stakeholders and thefinancial markets with a better insight into the magnitude of the results of operations, net assets and finan-cial position of the new Falck Renewables Group.
The combined data of the Falck Renewables Group at 31 December 2010 have been reported for the pur-pose of presenting the net assets, financial position and results of operations of the activities that are nowpart of the Group following the Demerger, as though the Actelios group and Falck Renewables Plc group(now Falck Renewables Wind Ltd) had operated as a single group under Falck Renewables SpA commen-cing 1 January 20102.
The combined results at 31 December 2011 represent the consolidated results at 31 December 2011 of theFalck Renewables Group illustrated above and do not require adjustment for comparison purposes.
Had the combined businesses operated under the Falck Renewables SpA group in 2010, the net assets,financial position and results of operations may have differed from those presented below.
• Combined income statement
(Euro thousands) 31.12.2011 31.12.2010A Revenue 248,650 184,641
Direct labour costs (8,100) (8,001)Direct costs (122,488) (99,398)
B Total cost of sales (130,588) (107,399)C Gross profit 118,062 77,242
Other income 1,662 3,742 Other employee costs (12,983) (10,640)Administrative expenses (27,508) (21,811)
D Operating profit 79,233 48,533 Finance costs - net (42,682) (35,802)Investment income 700 1,138
E Profit before income tax 37,251 13,869 Income tax expense (17,407) (11,501)
F Profit for the year 19,844 2,368 G Profit attributable to non-controlling interests 981 2,072 H Profit attributable to owners of the parent 18,863 296
EBITDA (1) 141,738 94,559
(1) EBITDA is measured by the Falck Renewables Group as profit for the year before investment income/(costs), finance costs - net, deprecia-tion and amortisation, impairment losses, charges to risk provisions and income tax expense. This amount has been determined in line withbest market practice taking into consideration the latest project financing contracts entered into by the Group. This definition was also appliedretroactively to calculate EBITDA for previous financial statements.
2 The combination took effect following the Demerger on 15 November 2010.

• Installed capacity
(MW) 31/12/2011 31/12/2010Wind 623.2 450.2WtE 31.0 31.0Biomass 14.0 14.0Photovoltaic 16.1 3.0Total 684.3 498.2
Comments on the combined results
Falck Renewables Group’s consolidated revenue recorded a marked increase of Euro 64,009 thousand(+34.7%) compared to the combined result at 31 December 2010, which is principally due to:
. A Euro 48,049 thousand increase in the wind sector due to new plants coming on stream and an increa-se in installed capacity, which was offset in part by scarce wind levels experienced by the Italian windfarms in early 2011;
. Revenue of Euro 3,739 thousand arising from the full year consolidation of Esposito Servizi Ecologici Srland Ecocentro Soluzioni Ambientali Srl that were acquired in June 2010;
. The Euro 7,672 thousand growth in revenue of the photovoltaic plants that is largely attributable to theActelios Solar SpA plants in Sicily coming on stream in the course of the year;
. The biomass plant in Rende returning to full operating regime in January 2011, as in 2010 it had opera-ted at reduced capacity until April following which it was closed to carry out the total revamp of the plant.This contributed Euro 18,023 thousand of increased revenue;
56
Les Crêtes (France) wind farm
57
. The strong performance of the Granarolo dell’Emilia plants, which contributed an additional Euro 851thousand of revenue. Although it performed well, the Trezzo sull’Adda plant recorded a Euro 14,142thousand fall in revenue due to expiry in April 2011 of the incentive component of the tariff pursuant toparagraph 3 of the CIP6/92 decree, whole the avoided cost tariff remain in force. The incentive compo-nent of the Granarolo dell’Emilia plant expired in November 2011 and again only the avoided cost tariffremains in force;
. A Euro 250 thousand fall in the revenue of Ambiente 2000 Srl.
Falck Renewables Group’s consolidated direct labour and other employee costs increased by Euro 2,442thousand in 2011 compared to the 2010 combined total, principally as a result of increased employee numbersfollowing acquisition of two businesses from Falck SpA and its subsidiary Riesfactoring SpA respectively (asdetailed in note 4.1.7 Review of business for the first half of 2011) resulting in the transfer of 31 employees.
The consolidated direct costs of the Falck Renewables Group increased in 2011 on the combined amountfor 2010, which is largely due to greater depreciation on property, plant and equipment (Euro 8,180 thou-sand) and increased maintenance costs (Euro 4,392 thousand), both resulting from the increase in installedcapacity and the level of biomass purchases following the Rende plant resuming production (+ Euro 8,934thousand).
The Falck Renewables Group’s consolidated administrative expenses for 2011 increased by Euro 5,697thousand on the 2010 combined total following the deconsolidation and impairment loss recorded inrespect of Palermo Energia Ambiente ScpA (Pea) that had a total impact of Euro 6,225 thousand, which waspartially offset by the cost reduction plan implemented by Group management.
The 2011 consolidated EBITDA recorded a marked increase (+ Euro 47,179 thousand, +49.9%) comparedto the combined amount for 2010. EBITDA expressed as a percentage of revenue corresponded to 57%against 51.2% in 2010.
Consolidated operating profit increased significantly on the 2010 combined total (+ Euro 30,700 thousand,+63.3%). This was negatively impacted by the above-mentioned impairment losses and sundry risk provi-sion totalling Euro 6,225 thousand recorded in respect of Pea.
Finance costs – net, increased on the 2010 combined amount (+ Euro 6,880 thousand), again largely dueto the deconsolidation and impairment losses recorded in respect of Pea that contributed to an increase ofEuro 5,776 thousand.
The above factors contributed to significant growth in the Falck Renewables Group’s consolidated profitbefore income tax (+ Euro 23,382 thousand, +169%) compared to the 2010 combined amount.
The Group’s consolidated income tax expense increased on the 2010 combined amount, in part due tohigher taxable income but mainly due to expiry of the tax benefits pursuant to the Tremonti-Ter Law tax thatonly applied to the 2009 and 2010 results and amounted to Euro 5,868 thousand in 2010. Electricity produ-cers with more than Euro 10 million of revenue and Euro 1 million of taxable income are subject to additio-nal IRES (corporation tax) of 10.5% for 2011-2013, following which the additional tax will fall to 6.5%. The Group companies affected by the additional tax in 2011 were: Prima Srl, Frullo Energia Ambiente Srl,Eolica Sud Srl and Eolo 3W Minervino Murge Srl. Moreover, the tax effect of the UK subsidiaries resulted in a Euro 4.6 million fall in the total tax charge, prin-cipally due to a decrease in the tax rate (28% to 26.5%) and certain prior year costs (2008 and 2009) nowbeing treated as deductions for tax purposes.
Consolidated profit for the year amounted to Euro 19,844 thousand (2010 – Euro 2,368 thousand), a mar-ked increase on the combined amount (+ Euro 17,476 thousand).
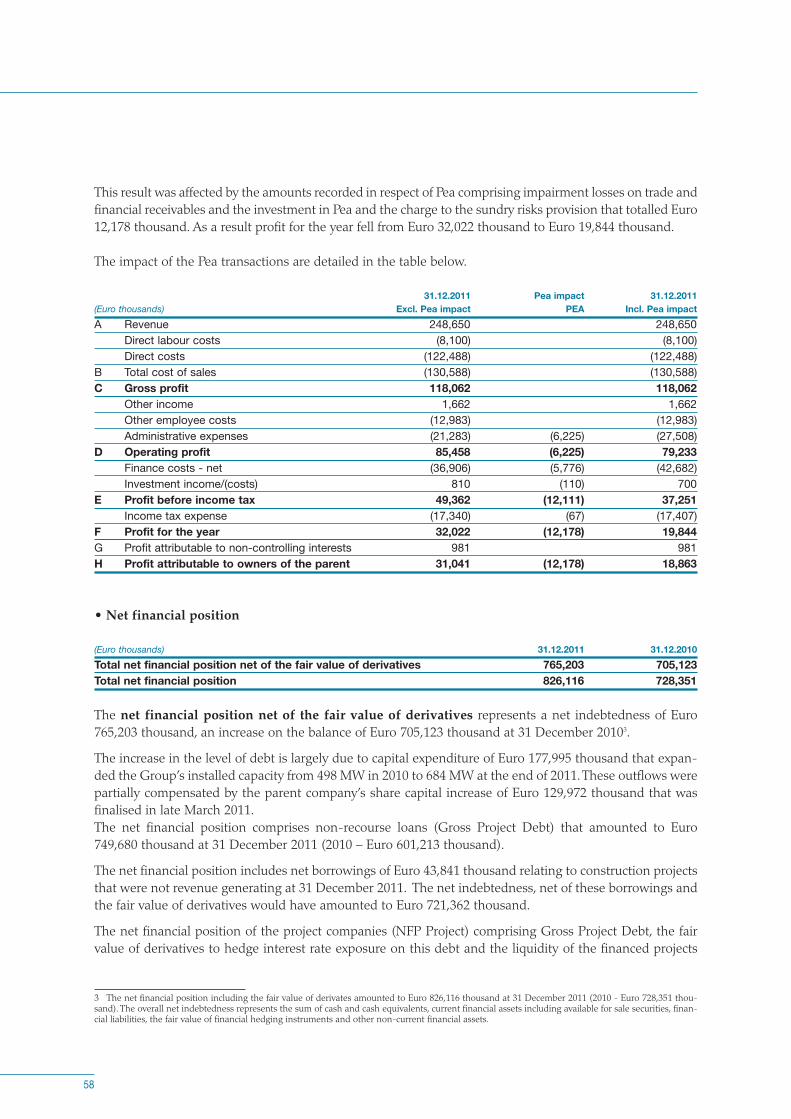
This result was affected by the amounts recorded in respect of Pea comprising impairment losses on trade andfinancial receivables and the investment in Pea and the charge to the sundry risks provision that totalled Euro12,178 thousand. As a result profit for the year fell from Euro 32,022 thousand to Euro 19,844 thousand.
The impact of the Pea transactions are detailed in the table below.
31.12.2011 Pea impact 31.12.2011(Euro thousands) Excl. Pea impact PEA Incl. Pea impactA Revenue 248,650 248,650
Direct labour costs (8,100) (8,100)Direct costs (122,488) (122,488)
B Total cost of sales (130,588) (130,588)C Gross profit 118,062 118,062
Other income 1,662 1,662 Other employee costs (12,983) (12,983)Administrative expenses (21,283) (6,225) (27,508)
D Operating profit 85,458 (6,225) 79,233 Finance costs - net (36,906) (5,776) (42,682)Investment income/(costs) 810 (110) 700
E Profit before income tax 49,362 (12,111) 37,251 Income tax expense (17,340) (67) (17,407)
F Profit for the year 32,022 (12,178) 19,844 G Profit attributable to non-controlling interests 981 981 H Profit attributable to owners of the parent 31,041 (12,178) 18,863
• Net financial position
(Euro thousands) 31.12.2011 31.12.2010Total net financial position net of the fair value of derivatives 765,203 705,123Total net financial position 826,116 728,351
The net financial position net of the fair value of derivatives represents a net indebtedness of Euro765,203 thousand, an increase on the balance of Euro 705,123 thousand at 31 December 20103.
The increase in the level of debt is largely due to capital expenditure of Euro 177,995 thousand that expan-ded the Group’s installed capacity from 498 MW in 2010 to 684 MW at the end of 2011. These outflows werepartially compensated by the parent company’s share capital increase of Euro 129,972 thousand that wasfinalised in late March 2011. The net financial position comprises non-recourse loans (Gross Project Debt) that amounted to Euro749,680 thousand at 31 December 2011 (2010 – Euro 601,213 thousand).
The net financial position includes net borrowings of Euro 43,841 thousand relating to construction projectsthat were not revenue generating at 31 December 2011. The net indebtedness, net of these borrowings andthe fair value of derivatives would have amounted to Euro 721,362 thousand.
The net financial position of the project companies (NFP Project) comprising Gross Project Debt, the fairvalue of derivatives to hedge interest rate exposure on this debt and the liquidity of the financed projects
58
3 The net financial position including the fair value of derivates amounted to Euro 826,116 thousand at 31 December 2011 (2010 - Euro 728,351 thou-sand). The overall net indebtedness represents the sum of cash and cash equivalents, current financial assets including available for sale securities, finan-cial liabilities, the fair value of financial hedging instruments and other non-current financial assets.

59
amounted to Euro 714,832 thousand, representing approximately 87% of the Group’s net indebtedness at31 December 2011.
Interest rate swaps to a total of Euro 579,532 thousand have been entered into to hedge interest rate fluc-tuations on the Gross Project Debt, corresponding to 77% of the total debt. Consequently, approximately85% of the total net indebtedness of Euro 765,203 thousand, net of the fair value of derivatives, is hedgedfrom interest rate fluctuations through the same interest rate swaps.
The ratios illustrated in the table below summarise the breakdown and hedging of the Falck RenewablesGroup interest rate risk:
(Euro thousands) 31.12.2011Total NFP net of Fair Value of Derivatives 765,203Total hedged against interest rate fluctuations 649,532% Hedged/NFP net of derivatives 85%
Total Gross Debt including Fair Value of Derivatives (GD+FVD) 923,754of which Gross Project Debt + Fair Value of Project Derivatives 809,403%Project GD including FV Derivatives/(GD+FVD) 88%
Total Gross Debt (GD) 862,841of which Project Gross Debt (Project GD) 749,680% Project GD/GD 87%
Project Gross Debt 749,680Total hedged against interest rate fluctuations 579,532% Project NFP/NFP 77%
Total Gross Debt (GD) 862,841Total hedged against interest rate fluctuations 649,532% Hedged/GD 75%
Total net financial position including Fair Value of Derivatives (NFP) 826,116of which Project Financing Net Debt (Project NFP) (*) 714,832% Project NFP/NFP 87%
(*) Project NFP = Project Gross Debt + Fair Value of Project Derivatives - Project Liquidity
• Combined capital expenditure
(Euro thousands) 31.12.2011 31.12.2010Intangible assets 468 13,522 Property, plant and equipment 177,527 177,418 Total capital expenditure 177,995 190,940
Capital expenditure in the year, which amounted to Euro 177,995 thousand, represents the Group’s finan-cial commitment in relation to wind farms and photovoltaic plants and improvements to operating plants. Capital expenditure principally comprised Euro 90,007 thousand for the construction of the Buddusò-Alàdei Sardi wind farm, Euro 26,137 thousand on the construction of the Petralia Sottana wind farm, a total ofEuro 32,621 thousand on the expansion of the Kilbraur and Millennium wind farms in the UK and Euro19,681 thousand on the Spinasanta, Cardonita and Sugherotorto photovoltaic plants.

5.2 Operating and financial review of Falck Renewables SpA
5.2.1 Financial highlights
(Euro thousands) 31.12.2011 31.12.2010Revenue 140 364Cost of sales (130) (93)Gross profit 10 271Operating loss (17,654) (9,358)Loss for the year (1,776) (194)Invested capital net of provisions 264,739 237,133Total equity 556,636 436,121Net financial position (asset) (291,897) (198,988)Capital expenditure 2,140 71Employees at the year-end (no.) 65 33Ordinary shares (no.) 291,413,891 161,896,607
5.2.2 Performance and review of business in 2010
The Company recorded a loss of Euro 1,776 thousand in 2011, after amortisation and depreciation of Euro185 thousand and tax income of Euro 15 thousand.
The result was affected significantly by impairment losses recorded against trade and financial receivablesdue from Palermo Energia Ambiente ScpA (“Pea” – in which the Company has a 23.2725% stake), amoun-ting to Euro 3,021 thousand and Euro 6,022 thousand respectively, the impairment loss of Euro 2,639thousand recognised on the investment in Pea and Euro 3,204 thousand charged to the sundry risks pro-vision representing Falck Renewables SpA’s commitment to provide Pea with the funds required to sett-
le a number of its creditors (including Euro 994thousand to Elettroambiente SpA). The totalimpact was Euro 14,886 thousand.
Operating profit compared to the previous yearwas affected by higher employee costs of Euro2,938 thousand following the acquisition of twobusinesses from Falck SpA and Riesfactoring SpA,an increase in administrative expenses (+ Euro 966thousand), which was partially offset by an increa-se of Euro 2,094 thousand in other income. Investment income increased (+ Euro 8,727 thou-sand) due to dividends from Prima Srl (Euro 6,800thousand), Frullo Energia Ambiente Srl (Euro8,771 thousand) and Ambiente 2000 Srl (Euro 240thousand).
The results also include Euro 552 thousand ofimpairment losses comprising the fall in the shareof net assets compared to the carrying amount ofthe investment in Actelios Etnea Srl (Euro 455
60
CEO and directors of the Falck Renewables Group

thousand) and the impairment loss recognised on the investment in Actagri Srl (Euro 97 thousand). The net financial position, a total asset of Euro 291,897 thousand, increased by Euro 92,909 thousand on thebalance at 31 December 2010, largely as a result of Euro 129,972 thousand raised through the share capitalincrease in March 2011, which was partially offset by participation in the share capital increase of FalckRenewables Wind Ltd (Euro 23,973 thousand), the impairment loss recognised on the financial receivabledue from Pea (Euro 6,022 thousand) and dividends paid (Euro 3,497 thousand).
5.2.3 Employees
The total number of employees in the Company at 31 December 2011 was 65, comprising 15 managers and50 blue-collar workers, representing an increase of 32 employees compared to the total at 31 December2010, which is mainly attributable to the employees transferred to Falck Renewables SpA following acqui-sition of the two management services businesses from Falck SpA and its subsidiary Riesfactoring SpA.
5.2.4 Capital expenditure
Capital expenditure amounted to Euro 870 thousand, comprising intangible assets of Euro 412 thousandthat included Euro 252 thousand of software following acquisition of the two businesses, further softwarefor Euro 61 thousand and Euro 99 thousand for the SAS software licence, and property, plant and equip-ment totalling Euro 458 thousand that included assets of Euro 247 thousand arising on acquisition of thetwo businesses, Euro 148 thousand of motor vehicles and Euro 63 thousand of office furniture.
5.2.5 Directors, statutory auditors, general managers and their interests
Company No. of shares No. of shares No. of shares No. of shares held at purchased sold held at
1 January 2011 31 December 2011Marco Agostini Falck Renewables SpA 108,000 108,000Elisabetta Falck Falck Renewables SpA 14,400 14,400Enrico Falck Falck Renewables SpA 14,400 32,000 46,400William Jacob Heller Falck Renewables SpA 17,460,006 17,460,006
The above disclosures are based on information provided by the relevant parties based on the situation at31 December 2011.
5.2.6 Related party transactions
Relations with subsidiaries and associates
Falck Renewables SpA carries out arm’s length transactions of both a trade and financial nature with its sub-sidiaries and associates.
61

These transactions allow for Group synergies to be achieved through the use of common services and know-how and the application of common financial policies.In particular, the transactions relate to specific activities, details of which are provided in the notes to thefinancial statements and include:
- Raising finance and issuing guarantees;- Administrative and professional services;- Management of common services.
Relations with the parent company Falck SpA
Falck SpA, which is in turn 65.96% owned by Finmeria Srl, held a 60% stake in the Company at 31 Decem-ber 2011 and no transactions of an economic or financial nature take place with the former.
Falck Renewables SpA performs professional services for modest amounts and manages shared services forthe parent company Falck SpA.
The Company also participates in the consolidated tax regime and the Group VAT return with its parentcompany Falck SpA.
The treasury agreement with Falck SpA terminated on 7 April 2011.
Subsequent to Consob’s communication issued on 24 September 2010 detailing the position on relatedparty transactions pursuant to Consob regulation 17221 of 12 March 2010 and ensuing amendments, theboard of directors of Falck Renewables SpA approved the procedure governing related party transactions on12 November 2010.
62
A Falck Renewables corporate meeting

63
5.2.7 Direction and coordination activities
In accordance with article 2497 bis, paragraph 5 of the Italian Civil Code, it is noted that Falck SpA performsdirection and coordination activities with respect to Falck Renewables SpA. The activities performed are ofa commercial and financial nature as noted above, and resulted in Euro 100 thousand of income from ser-vices performed on behalf of the parent company. Profit for the year also includes recharges made by FalckSpA for services totalling Euro 1,641 thousand and finance costs of Euro 1,182 thousand, calculated appl-ying market rates to the balance of the intercompany account with Falck SpA up to closure of the accounton 7 April 2011.
5.2.8 Holding of own shares or parent company shares
In accordance with article 2428, sub-section 2, point 3 of the Italian Civil Code, the Company declares thatat 31 December 2011 it had no holdings in its own or its parent company shares.
5.2.9 Purchase and sale of own shares or parent company shares
In accordance with article 2428, sub-section 2, point 4 of the Italian Civil Code, the Company declares thatit did not purchase or sell holdings in its own or its parent company shares in the course of 2011.
5.2.10 Share schemes
The company does not currently operate employee benefit schemes through the implementation of stockoption plans.
5.2.11 Corporate governance and Code of Self Discipline
The Falck Renewables Group complies and conforms to the Code of Self Discipline for listed companies(hereinafter the “Code”), which was approved by the Corporate Governance Committee in March 2006 andsponsored by Borsa Italiana SpA, as amended and updated to reflect changes in the Group. The report on Corporate Governance and Corporate Structure provides an overview of the Group’s adop-ted corporate governance model and the risk management and internal control system overseeing thefinancial disclosure process. This Report, provided as an appendix to the financial statements and availableon the Company website www.falckrenewables.eu, is subject to the same reporting deadlines as the latter.
5.2.12 Legislative decree 231/01
The Company has adopted an Organisation and Operations Manual aimed at ensuring that the Companycarries out its business correctly and transparently thus safeguarding its stakeholders and has been tailoredto meet the specific requirements of Falck Renewables SpA.
The Supervisory Board members are the Chairman, Giovanni Maria Garegnani, Bernardo Rucellai and LuciaGiancaspro.
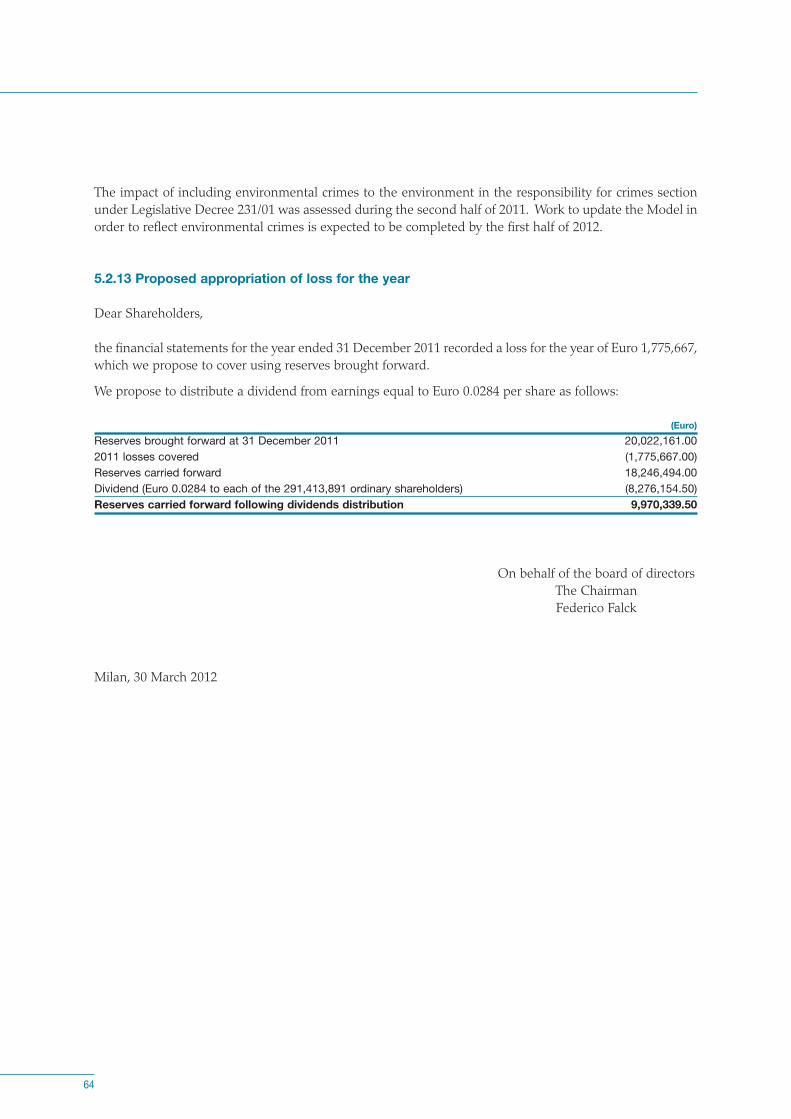
The impact of including environmental crimes to the environment in the responsibility for crimes sectionunder Legislative Decree 231/01 was assessed during the second half of 2011. Work to update the Model inorder to reflect environmental crimes is expected to be completed by the first half of 2012.
5.2.13 Proposed appropriation of loss for the year
Dear Shareholders,
the financial statements for the year ended 31 December 2011 recorded a loss for the year of Euro 1,775,667,which we propose to cover using reserves brought forward.
We propose to distribute a dividend from earnings equal to Euro 0.0284 per share as follows:
(Euro)Reserves brought forward at 31 December 2011 20,022,161.002011 losses covered (1,775,667.00)Reserves carried forward 18,246,494.00Dividend (Euro 0.0284 to each of the 291,413,891 ordinary shareholders) (8,276,154.50)Reserves carried forward following dividends distribution 9,970,339.50
On behalf of the board of directorsThe ChairmanFederico Falck
Milan, 30 March 2012
64

Consolidated financial statements for the year ended 31 December 2011
6

6.1 Consolidated balance sheet
31.12.2011 31.12.2010Note of which of which
(Euro thousands) related parties related partiesAssetsA Non-current assets
1 Intangible assets (1) 131,069 136,277 2 Property, plant and equipment (2) 1,098,604 947,061 3 Financial assets (3) 1,096 1,191 4 Medium/long-term financial receivables (4) 734 734 10,765 734 5 Deferred income tax assets (7) 29,853 17,833 6 Other receivables (6) 8,288 5,760 11,352 10,079 Total 1,269,644 1,124,479
B Current assets1 Inventories (8) 4,263 3,728 2 Trade receivables (5) 102,554 236 72,570 35 3 Other receivables (6) 60,449 6,250 49,170 7,814 4 Financial receivables (4) 14 14 13 13 5 Financial assets6 Cash and cash equivalents (9) 96,890 92,789 Total 264,170 218,270
C Non-current assets held for saleTotal assets 1,533,814 1,342,749
LiabilitiesD Equity
1 Ordinary shares 291,414 161,897 2 Reserves 114,614 139,879 3 Retained earnings 20,022 23,713 4 Profit for the year 18,863 2,499 Equity attributable to owners of the parent (10) 444,913 327,988 5 Non-controlling interests 6,913 7,345 Total equity (10) 451,826 335,333
E Non-current liabilities1 Medium/long-term financial liabilities (13) 879,569 618,746 2 Other non-current liabilities (15) 352 1,837 3 Deferred income tax liabilities 14,990 17,471 4 Provisions for other liabilities and charges (11) 33,797 5,982 5 Staff leaving indemnity (12) 3,790 2,952 Total 932,498 646,988
F Current liabilities1 Trade payables (14) 62,116 3,034 106,707 27,380 2 Other payables (15) 43,189 8,519 40,549 8,554 3 Short-term financial liabilities (13) 44,185 213,172 161,464 4 Provisions for other liabilities and chargesTotal 149,490 360,428
G Liabilities attributable to non-current assetsheld for sale
Total liabilities 1,533,814 1,342,749
Related party transactions are detailed on pages 100 and 101.
67

6.2 Consolidated income statement
31.12.2011 31.12.2010Note of which of which
(Euro thousands) related parties related parties
A Revenue (16) 248,650 1 99,196
Direct labour costs (17) (8,100) (7,657)
Direct costs (18) (122,488) (2) (54,282)
B Cost of sales (130,588) (61,939)
C Gross profit 118,062 37,257
Other income (19) 1,662 250 1,527 114
Other employee costs (17) (12,983) (5,356)
Administrative expenses (20) (27,508) (1,674) (13,772) (3,394)
D Operating profit 79,233 19,656
Finance costs - net (21) (42,682) (1,535) (4,011) 1,102
Investment income (22) 700 700 345 1
E Profit before income tax 37,251 15,990
Income tax expense (23) (17,407) (11,347)
F Profit for the year 19,844 4,643
G Profit attributable to non-controlling interests 981 2,144
H Profit attributable to owners of the parent 18,863 2,499
No non-recurring income or costs arose in 2011.
Related party transactions are detailed on page 107.
68
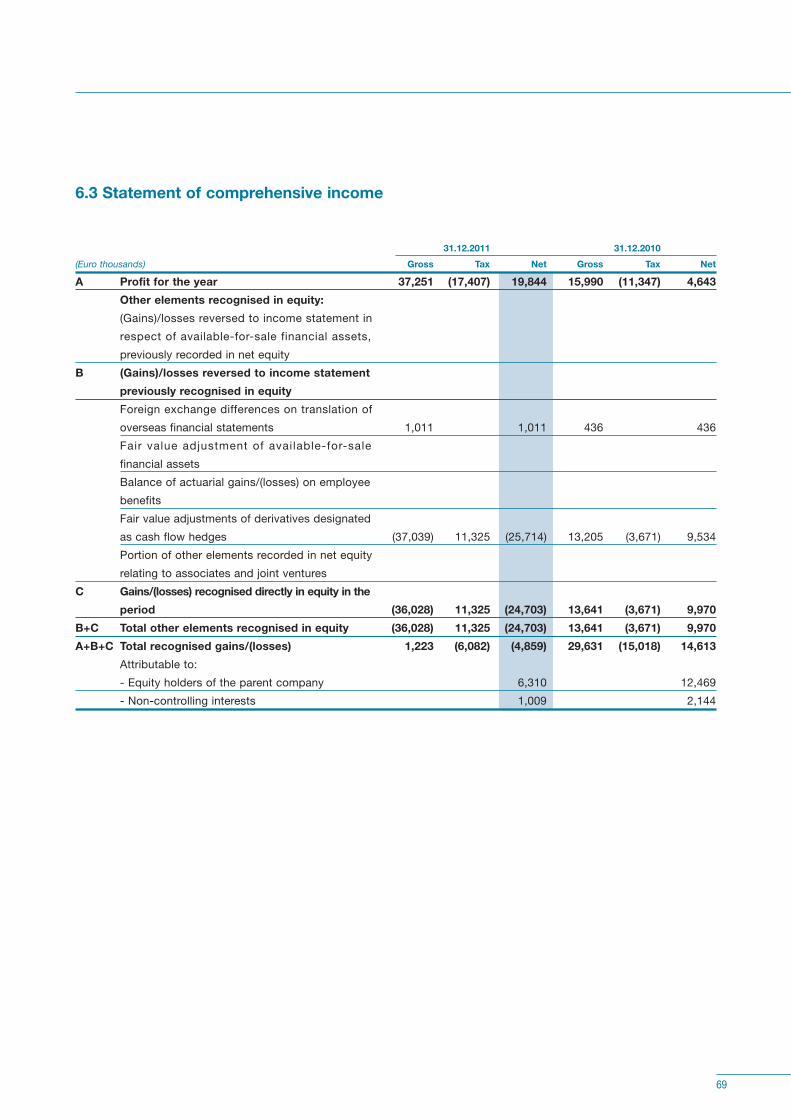
6.3 Statement of comprehensive income
31.12.2011 31.12.2010(Euro thousands) Gross Tax Net Gross Tax NetA Profit for the year 37,251 (17,407) 19,844 15,990 (11,347) 4,643
Other elements recognised in equity:(Gains)/losses reversed to income statement in respect of available-for-sale financial assets, previously recorded in net equity
B (Gains)/losses reversed to income statement previously recognised in equityForeign exchange differences on translation of overseas financial statements 1,011 1,011 436 436Fair value adjustment of available-for-sale financial assetsBalance of actuarial gains/(losses) on employee benefitsFair value adjustments of derivatives designated as cash flow hedges (37,039) 11,325 (25,714) 13,205 (3,671) 9,534Portion of other elements recorded in net equity relating to associates and joint ventures
C Gains/(losses) recognised directly in equity in theperiod (36,028) 11,325 (24,703) 13,641 (3,671) 9,970
B+C Total other elements recognised in equity (36,028) 11,325 (24,703) 13,641 (3,671) 9,970A+B+C Total recognised gains/(losses) 1,223 (6,082) (4,859) 29,631 (15,018) 14,613
Attributable to:- Equity holders of the parent company 6,310 12,469- Non-controlling interests 1,009 2,144
69

6.4 Consolidated cash flow statement
31.12.2011 31.12.2010Note of which of which
(Euro thousands) related parties related partiesCash flows from operating activitiesProfit for the year 19,844 4,643 Adjusted for:Amortisation of intangible assets 1,062 781 Depreciation of property, plant and equipment 46,749 12,538 Impairment of intangible assets 6,022 4,887 Impairment of property, plant and equipment 283 Staff leaving indemnity provision 821 567 Fair value of financial assetsFinance income (34,214) (172) (5,102) (1,929)Finance costs 76,896 9,113 826 Dividends receivedShare of profit of investments carried at equity (811) (811) 6 Gain on sale of intangiblesProfit on disposal of property, plant and equipmentProfit on sale of investments (350)Investment costs 110 Other changes 283 Income tax expense (income statement) 17,407 11,347 Operating profit before changes in net working capital and provisions 134,452 38,430 Change in inventories (535) 654 Change in trade receivables (29,051) (12,767)Change in trade payables (39,647) 38,878 Change in other receivables/payables (12,075) (6,564)Net change in provisions 3,742 765 Change in employee payables - staff leaving indemnity paid during year (559) (474)Cash generated from operating activities 56,327 58,922 Interest paid (73,215) (1,923) (8,515) (826)Tax paid (16,132) (8,879)Net cash (used in)/generated from operating activities (1) (33,020) 41,528 Cash flows from investing activitiesDividends received 867 867 Proceeds from sale of property, plant and equipment 587 129 Proceeds from sale of intangible assetsProceeds from investment activitiesPurchases of intangible assets (468) (1,369)Purchases of property, plant and equipment (177,527) (77,456)Acquisition of investments (800) (800) (13,957)Sale of investments 1,965 Change in scope of consolidation (6) 56,970 Interest received 34,213 172 4,779 1,929 Net cash used in investing activities (2) (143,134) (28,939)Cash flows from financing activitiesDividends paid (4,895) (2,937) (6,502) (3,953)Proceeds from share capital increase and capital contribution net of expenses 130,382 Expenses on capital transaction (3,393) (3,832)Proceeds from borrowings 66,192 Loans granted (178) (178) (8,496) (8,496)New borrowings 281,539 49,715 Repayment of borrowings (221,934) (41,947)Net cash generated from financing activities (3) 181,521 55,130 Net increase in cash and cash equivalents (1+2+3) 5,367 67,719 Cash and cash equivalents and bank overdrafts at 1 January 92,789 20,709 Translation (loss)/gain on cash and cash equivalents (1,387) 4,361 Cash and cash equivalents and bank overdrafts at 31 December (9) 96,769 92,789
70

6.5 Consolidated statement of changes in equity
Share Reserves Profit Equity Non- Totalcapital for the year attributable to controlling equity
owners of interests(Euro thousands) the parent
At 31.12.2009 67,680 271,994 4,175 343,849 5,803 349,652
Appropriation of 2009 profit 4,175 (4,175)
Dividends (5,752) (5,752) (5,752)
Share capital increase 94,217 (94,217)
Other movements (12,608) (12,608) (602) (13,210)
Profit for the year to 31 December 2010 2,499 2,499 2,144 4,643
At 31.12.2010 161,897 163,592 2,499 327,988 7,345 335,333
Appropriation of 2010 profit 2,499 (2,499)
Dividends (3,497) (3,497) (1,398) (4,895)
Share capital increase 129,517 (2,006) 127,511 127,511
Other movements (25,952) (25,952) (15) (25,967)
Profit for the year to 31 December 2011 18,863 981 19,844
At 31.12.2011 291,414 134,636 444,913 6,913 451,826
71

72
6.6 Notes to the consolidated financial statements
6.6.1 Basis of preparation of the consolidated financial statements
The consolidated financial statements for the year ended 31 December 2011 have been prepared in accordance with Interna-tional Financial Reporting Standards (International Accounting Standards - IAS and International Financial Reporting Stan-dards - IFRS), and the relevant interpretations (Standing Interpretations Committee – SIC and International Financial Repor-ting Interpretations Committee – IFRIC) endorsed by the European Union and the provisions pursuant to article 9 of Legisla-tive Decree 38/2005.
The financial statements used for consolidation purposes are those presented by the board of directors for approval at the sha-reholders’ meetings of each subsidiary, associate and joint venture and those submitted by the liquidators of Palermo EnergiaAmbiente ScpA, Platani Energia Ambiente ScpA and Tifeo Energia Ambiente ScpA, reclassified and adjusted in line with Inter-national Financial Reporting Standards (IAS/IFRS) and Group policy.
At the date of preparation of the Annual Report, the first (2010) and second (2011) interim liquidation accounts of PalermoEnergia Ambiente ScpA had not been approved. Pea is one of the Sicily Project companies (Bellolampo-Palermo) currently inliquidation, in which the Company has a 23.2725% interest that was consolidated applying the proportional method up to the2010 financial statements. This is due to a dispute with the shareholder Amia SpA (“Amia”), which holds a 48% interest in Peaand is currently in extraordinary administration. Consequently, as joint control may not be exercised over Pea this results in itsexclusion from the scope of consolidation and measurement of the investment at carrying value, as illustrated below, while the2011 Falck Renewables Group consolidated income statement reflects the share of Pea’s estimated loss for the twelve monthperiod. In the event that an agreement cannot be reached with Amia regarding approval of Pea’s third liquidation accounts, itis highly likely that the company will be dissolved pursuant to article 2490 of the Italian Civil Code.
The above issues involving Pea do not apply to the other two Sicily Project companies, Tifeo and Platani (in which Falck Rene-wables SpA holds indirect interests of 96.35% and 86.77% respectively through its subsidiary Elettroambiente SpA) and theydo not affect the disputes between Tifeo and Platani and the Department of the Sicily Region.
With regard to the layout of the consolidated financial statements, the Company has opted to present the following accountingstatements:
. Consolidated balance sheetThe consolidated balance sheet is presented in sections with separate disclosure of assets and liabilities and equity. Assetsand liabilities are classified in the consolidated financial statements as either current or non-current.
. Consolidated income statement The consolidated income statement presents costs by function, also using the variable element of cost as a distinguishingfactor in the analysis of direct and general costs.
For a better understanding of the normal results of ordinary operating, financial and tax management activities, the incomestatement presents the following intermediate consolidated results:
- gross profit;- operating profit;- profit before income tax;- profit for the period;- profit attributable to non-controlling interests;- profit attributable to owners of the parent.
Segment reporting has been presented in respect of the business units in which the Group operates, as the information usedby management to evaluate operating results and for decision-making purposes in the individual business units coincideswith the economic and financial information of each segment.
. Statement of comprehensive income The Group has opted to present two separate statements, consequently this statement discloses profit for the period inclu-ding income and expenses recognised directly in equity.

73
. Consolidated cash flow statementThe consolidated cash flow statement presents an analysis by areas that generate cash flows as required by InternationalFinancial Reporting Standards.
. Consolidated statement of changes in equity The statement of changes in equity is presented as required by International Financial Reporting Standards with separatedisclosure of the profit for the period and each item of revenue, income, cost and expense not recorded in the income sta-tement but recognised directly in consolidated equity based on specific IAS/IFRS requirements.
The consolidated financial statements of the Falck Renewables SpA group are prepared in Euro thousands.
The consolidated financial statements for the year ended 31 December 2011 were approved by the board of directors on 30March 2012 and publication of the annual report was authorised.
The annual report is audited by Reconta Ernst & Young SpA under the terms of the engagement approved in the AGM of 6 May2011.
6.6.2 Scope of consolidation
The consolidated financial statements for the year ended 31 December 2011 include the financial statements of the parent com-pany Falck Renewables SpA and all of the subsidiaries in which it holds, either directly or indirectly, majority voting rights. Thecompanies in which the parent company exercises joint control with other shareholders (joint-ventures) are consolidated appl-ying the proportional method, while those companies over which the Group exercises a significant influence are accounted forusing the equity method.
The Falck Renewables Group consists of 58 companies, 51 of which are consolidated on a line-to-line basis, 1 is consolidatedapplying the proportional method, 3 are consolidated applying equity accounting and 3 are valued at cost. The companies included in the scope of consolidation at 31 December 2011 are disclosed in the supplementary information(note 7.1).
As explained above, Palermo Energia Ambiente ScpA, currently in liquidation, is no longer consolidated applying the propor-tional method and is now valued at cost. The following companies were merged during 2011 and as a consequence are also nolonger included in the scope of consolidation:
. Eolica Sarda Srl merged with Geopower Sardegna Srl;
. Abbiategrasso Bioenergia Srl merged with Esposito Servizi Ecologici Srl;
. Actagri Srl merged with Esposito Servizi Ecologici Srl;
. Ecocentro Soluzioni Ambientali Srl merged with Esposito Servizi Ecologici Srl.
6.6.3 Principles of consolidation
The companies included within the scope of consolidation applying the line-by-line method are those controlled by the parentcompany, also through indirect holdings.The companies on which the parent company exercises joint control together with other third parties are consolidated applyingthe proportional method.Associated companies are accounted for under the equity method.The financial statements of the companies included within the scope of consolidation have been adjusted, where necessary, tobring them into line with Group accounting policies that conform to IAS/IFRS.The financial statements of subsidiaries are included in the consolidated financial statements from the date on which the parentcompany gains control and up to the date on which this control ceases. All significant intercompany balances and transactions are eliminated.Profits arising on transactions between consolidated entities, or with companies accounted for under the equity method, whichare included within assets at the year-end as they are not yet realised, are eliminated if significant. The book value of consolidated investments is eliminated against the related share of equity inclusive of any fair value adjust-ments on acquisition. The resulting difference is treated as goodwill and is accounted for in accordance with IFRS 3.The non-controlling interests in net equity and profit for the period of consolidated entities are disclosed under separate hea-dings in the consolidated balance sheet and income statement.Differences between acquisition cost and net equity at current fair values at the acquisition date are, where possible, allocated

74
to specific assets and liabilities of the acquired company. In the event that the residual difference relates to a higher purchaseprice paid for goodwill this is recorded within intangible assets and subjected to an impairment test on an annual basis. Wherethe remaining difference is negative the amount is charged against the consolidation reserve in equity.The ownership percentage used for companies consolidated either line-by-line or proportionally is the statutory amount con-sidering also indirect holdings.Dividends received by the parent company or other consolidated companies from investments included within the scope ofconsolidation are reversed in the consolidated income statement.The assets and liabilities in the financial statements of subsidiaries denominated in foreign currencies are translated to Euroapplying the year-end exchange rate.The income statements of the financial statements of subsidiaries denominated in foreign currencies are translated to Eurousing the average exchange rate for the year.The differences arising from the translation of opening balances at year-end rates are recorded in the translation reserve toge-ther with the difference arising on translation of the income statement and balance sheet values of profit for the year.
The following exchange rates were used to translate the financial statements:
Average rate 31.12.2011 Average rate 31.12.2010Pounds Sterling (GBP) 0,8678 0,8353 0,8582 0,8607US Dollar (USD) 1.3917 1.2939 1.3362 1.3268Turkish Lira (TYR) 2.3351 2.4432 2.1610 2.0694Polish Zloty (PLN) 4.1187 4.4580 3.9950 3.9750
6.6.4 Accounting policies
The valuation and measurement of the financial information for the year ended 31 December 2011 have been based on theIAS/IFRS currently in force and the related interpretations as set out in the documents issued to date by the International Finan-cial Reporting Interpretations Committee (IFRIC) and the Standing Interpretations Committee (SIC).
The consolidated financial statements are prepared in Euro and all values are rounded to thousands of Euro except where other-wise indicated. The consolidated financial statements are prepared under the historical cost convention, with the exception of derivative instru-ments and financial assets held for trading, which are measured at fair value.Non-current assets and tangible fixed assets held for sale are recorded at the lower of net book value and fair value less coststo sell.Preparation of the consolidated financial statements in accordance with IFRS requires management to make estimates, valua-tions and assumptions on the accounting value of a number of assets and liabilities and related disclosures, and contingentassets and liabilities at the date of the financial statements. The estimates and assumptions are based on historical results andother reasonable information and are adopted when the carrying value of the assets or liabilities may not be reliably estimatedusing other sources. Actual amounts may differ from estimates. These estimates and assumptions are reviewed periodically and the effects of all differences relating to the current accountingperiod are recognised in the income statement. Where the adjustment covers both current and future reporting periods, theadjustment is recorded in the year in which the adjustment is made and future periods. The actual results may differ, in some cases significantly, from the estimated amounts due to changes in the circumstances onwhich the estimate was based.The accounting policies detailed below were applied to the current financial year and comparative amounts for the prior year. The financial statements have been prepared in accordance with International Financial Reporting Standards - IFRS issued by the International Financial Reporting Standards Board, based on the documents published in the EuropeanCommunity’s Official Gazette (ECOG).
A number of amendments were made to IFRS and the interpretations with effect from 1 January 2011, none of which had asignificant impact on the Group.
The main changes are summarised below:
• IAS 24 - Related party disclosures (amended)
The IASB issued an amendment to IAS 24 clarifying the definition of related parties. The new definition emphasises thesymmetry in identifying related parties and defines more clearly in which circumstances employees and key managementpersonnel are considered to be related parties. The amendment also introduces an exemption from the general disclosure

75
requirements for government-related entities in respect of transactions between entities controlled, jointly controlled orsignificantly influenced by the same state. The adoption of these amendments has not had any impact on the disclosuresprovided by the Group.
• IAS 32 - Financial instruments: disclosures (amended)
The standard includes an amendment to the definition of financial liabilities for the purpose of classifying rights issues –such as options and warrants - denominated in foreign currency. Previously practice required the rights issues to be classi-fied as derivative liabilities. If certain conditions are met these may now be classified as equity instruments regardless of thecurrency in which the exercise price is denominated. This amendment has not had any impact on the Group’s net finan-cial position or results.
• IFRIC 14 - Prepayments of a minimum funding requirement (amended)
The amendments correct an unintended consequence for entities required to make prepayments for minimum funding con-tributions. The amendment allows entities to recognise as an asset some voluntary prepayments for minimum funding con-tributions. The Group is not required to make minimum prepayments in Europe. Consequently this amendment has noimpact on the Group’s net financial position or results.
• IFRS 1 - First time adoption of IFRS (amended)
The amendment relieves first-time adopters of IFRS from providing the additional disclosures required by IFRS 7 regardingfair value measurement and liquidity risk. There has been no impact on the consolidated financial statements.
• IFRIC 19 - Extinguishing Financial Liabilities with Equity Instruments
This interpretation clarifies the accounting practice that a debtor must adopt where an entity issues an equity instrument toa creditor to extinguish a financial liability (debt for equity swap), or the terms of a financial liability are renegotiated andresult in the entity issuing equity instruments to a creditor to extinguish all or part of the financial liability.The interpretation clarifies that:. The equity instruments issued to a creditor are part of the consideration paid to extinguish the financial liability;. The equity instruments are measured at their fair value. If their fair value cannot be reliably measured, the equity instru-
ments should be measured to reflect the fair value of the financial liability extinguished;. The difference between the carrying amount of the financial liability extinguished and the initial measurement amount
of the equity instruments issued is included in the entity’s profit or loss for the period.. Implementation of this interpretation does not have an impact on the consolidated financial statements.
Improvements to IFRSThe IASB issued a third series of improvements to the standards in May 2010, principally to eliminate existing inconsistenciesand clarify terminology. The adoption of the following improvements has resulted in a number of changes to accounting stan-dards without impacting the Group’s financial position or results:
• IFRS 3 - Business combinations: amends the options available for the measurement of non-controlling interests (NCI). Thesemay be measured at fair value or alternatively at the proportionate share of the acquiree’s net identifiable assets only wherethe non-controlling interests are present ownership interests and entitle the holders to a proportionate share of the acqui-ree’s net assets in the event of liquidation. All other components should be measured at their acquisition date fair value (seeNote 5). Changes were also made to i) transitional requirements for contingent consideration from a business combina-tion, ii) un-replaced and voluntary replaced share-based payment awards in the context of a business combination.
• IFRS 7 - Financial Instruments: Disclosures: the improvement clarifies disclosures for classes of financial assets; in particular,a number of changes have been made to the level of disclosure around credit risk.
• IAS 1 - Presentation of Financial Statements: this improvement clarifies that an entity may present the analysis of other com-prehensive income by item either in the statement of changes in equity or in the notes to the financial statements.

76
• IAS 34 - Interim Financial Reporting: emphasises the additional disclosures required by IFRS7 “Financial Instruments: dis-closures” and how to apply this to interim reports.
• IAS 27 - Consolidated and Separate Financial Statements: provides transitional requirements for consequential amendmentsto a number of standards following changes introduced by IAS 27 (2008): i) IAS 21 The Effects of Changes in Foreign Rates:the accounting treatment of the exchange differences accumulated in a separate component of equity on the disposal orpartial disposal of a foreign operation; ii) IAS 28 Investments in Associates/IAS 31 – Interests in Joint Ventures: accountingtreatment following loss of significant influence or joint control.
• IFRIC 13 - Customer Loyalty Programmes: relates to the fair value of award credits.
IFRS and/or interpretations issued but not yet effective and/or endorsedPursuant to IAS 8 “Accounting policies, Changes in Accounting Estimates and Errors”, the new standards and/or interpretationsthat have been issued but not yet effective or not yet endorsed by the European Union, and therefore not applicable, are illu-strated and described in brief below. None of these standards and interpretations has been early adopted by the Group.
• Amendments to IFRS 7 - Financial Instruments: Disclosures – transfer of financial assets
These amendments are intended to improve disclosures by providing greater transparency and comparability regarding thetransfer of financial assets (e.g. securitisations), including the possible effects where the transferor retains some level of risks.These amendments were endorsed by the European Union in November 2011 (EC Regulation 1205/2011) and are effecti-ve from 1 January 2012. This is not expected to have an impact on the Group’s consolidated financial statements.
• Amendments to IAS 12- Income Taxes – Recovery of Underlying Assets
IAS 12 requires an entity to measure the deferred tax relating to an asset or liability depending on whether the entity expectsto recover the carrying amount of the asset through use or sale. It can be difficult and subjective to assess whether recoverywill take place through use or sale when the asset is measured using the fair value model in IAS 40 Investment Property.The amendment provides a practical solution to the problem by introducing a presumption that recovery of the carryingamount will normally be through sale. As a result of the amendments, SIC 21 “Income Taxes – Recovery of Revalued Non-Depreciable Assets” would no longer apply to investment properties carried at fair value. The amendments also incorpora-te into the amended IAS 12 remaining guidance contained in SIC 21 which is accordingly withdrawn. These amendments will become effective from 1 January 2012 but have not yet been endorsed by the European Union andare not applicable to the Group.
• Amendments to IFRS 1 - First-time Adoption of IFRS – Severe Hyperinflation and Removal of Fixed Dates for First-time Adopters
The amendments cover:- Guidance on how an entity should resume presenting financial statements in accordance with IFRS after a period where
the entity’s functional currency was subject to hyperinflation;- Removal of fixed dates for first-time adopters of IFRS. Entities that adopt IFRS apply the requirements relating to the
prospective derecognition of financial assets and liabilities, hence they are no longer required to reconstruct the trans-actions that took place before the transition to IFRS that led to the derecognition of the financial assets and liabilities.
These amendments do not apply to the Group.
• IFRS 11 - Joint Arrangements
The new standard, which replaces IAS 31 “Interests in Joint Ventures”, defines two categories of joint arrangements that giverise to different accounting treatments:- joint operations: are joint arrangements whereby the parties that have joint control of the arrangement have rights to the
assets, and obligations for the liabilities, relating to the arrangement. A joint operator accounts for the assets and liabi-lities, revenue and expenses relating to its involvement in a joint operation in accordance with the relevant IFRSs;
- joint ventures: a joint venture is where the parties that have joint control of the arrangement do not have rights to theseparate assets/liabilities involved in the arrangement but only the net assets or net profit of the arrangement. A jointventurer recognises its interest in a joint venture as an investment and shall account for that investment applying theequity method, while IAS 31 allowed proportionate consolidation or consolidation applying the equity method.

77
This standard is applicable to annual reporting periods beginning on or after 1 January 2013 but has not yet been endorsedby the European Union. The impact of applying this new standard for the first time is currently being assessed taking intoaccount the fact the investment in Frullo Energia is consolidated at present applying the proportionate method.
• IFRS 12 - Disclosure of Interests in Other Entities
IFRS 12 provides – expanded – disclosure requirements about subsidiaries, associates, joint arrangements and other struc-tured entities. Many of the disclosures required under IFRS 12 were previously included in IAS 27 “Consolidated and Sepa-rate Financial Statements”, IAS 28 “Investments in Associates” and IAS 31 “Interests in Joint Ventures”, as well as issuingnew requirements. This standard is effective from 1 January 2013 but has not yet been endorsed by the European Union. The impact on dis-closures in the consolidated financial statements resulting from the future application of this standard is currently beingassessed.
• IFRS 13 - Fair Value Measurement
IFRS 13 provides guidance on the measurement of fair value and the disclosures required. The standard does not provideguidance on the use of fair value but the criteria for its measurement and application when another IFRS requires or per-mits fair value measurement.This standard becomes effective commencing 1 January 2013 and has not yet been endorsed by the European Union. It isnot expected to have a significant impact on the Group’s consolidated financial statements.
• Amendments to IAS 1 - Presentation of Financial Statements – Presentation of Items of Comprehensive Income
The principal amendments to IAS 1 relate to the new method of presenting other comprehensive income in the statementof changes in comprehensive income: the other items of comprehensive income are required to be grouped into those thatwill and will not be reclassified (recycled) to profit or loss. Examples of other comprehensive income items that may be recycled to profit or loss are: foreign currency differences, fairvalue differences on cash flow hedges or available for sale equity investments. Examples of other comprehensive incomeitems that would never be reclassified to profit or loss are actuarial gains and losses on defined benefit pension plans.The effective date of these amendments, which have not yet been endorsed by the European Union, is 1 July 2012.
• IAS 19 - Employee Benefits
The IASB has issued numerous amendments to IAS 19. These range from radical changes such as elimination of the corri-dor method and the concept of expected return on plan assets, to simple clarification and terminology. The amendmentsare applicable for annual periods beginning on or after 1 January 2013. With regard to the impact on the consolidated finan-cial statements, elimination of the corridor approach will not impact the results as the Group does not adopt this option atpresent. The other impacts are currently under evaluation.
• IFRS 10 - Consolidated Financial Statements
This new standard replaces IAS 27 “Consolidated and Separate Financial Statements” – for the portion relating to consoli-dated financial statements – and SIC 12 “Consolidation – Special Purpose Entities”. IAS 27 – renamed “Separate FinancialStatements” – is limited to standards and guidance for the preparation of separate financial statements.IFRS 10 establishes a single control model that applies to all entities and represents the determining factor in establishingwhether an investment should be consolidated. The accounting treatment and method of consolidation remain in line withthose defined in IAS 27. The new model of control introduces a higher degree of subjectivity and will require management to exercise significantjudgement to determine which entities are controlled and therefore require consolidation. The new standard envisages thepossibility of controlling an entity even in the absence of majority voting rights (de facto control), which is not consistentwith IAS 27. This standard, not yet endorsed by the European Union, becomes effective from 1 January 2013. The Company is currentlyanalysing the impact of first time application of this new standard on the scope of consolidation.
• IAS 27 - Separate Financial Statements
Subsequent to publication of IFRS 10 and IFRS 12, IAS 27 is now limited to the accounting treatment of subsidiaries, asso-ciates and jointly controlled entities in the separate financial statements. These amendments become effective on or after 1January 2013. The potential impact on the parent company financial statements is under review.
78
• IAS 28 - Investments in Associates and Joint Ventures
Following publication of IFRS 11 and IFRS 12, IAS 28 was renamed Investments in Associates and Joint Ventures, and setsout the requirements for the application of the equity method when accounting for investments in associates and joint ven-tures. The amendments become effective for accounting periods commencing on or after 1 January 2013. Future applicationof these amendments will not impact the consolidated financial statements.
• Amendments to IFRS 7 - Financial Instruments: Additional Disclosures – Offsetting Financial Assets and Financial Liabilities
These amendments introduce the requirement to provide in the notes to the financial statements extensive disclosuresabout financial assets and liabilities offset where there is a legal right to do so (e.g. gross and net amounts, guarantees issuedand held). These amendments are effective for annual periods beginning on or after 1 January 2013 and have not yet beenendorsed by the European Union. No impact on the Group financial statements is expected as a result of future applicationof the amendments.
The Group has not early adopted any other standards, interpretation or improvements issued but not yet effective.
The principal accounting policies and valuation methods adopted in the preparation of these consolidated financial statementsare set out below:
Intangible assetsAn intangible asset is recorded only when it is identifiable, controllable, is expected to generate economic benefits in futureperiods and the cost may be reliably measured. Intangible assets are recorded at cost including directly attributable expensesand are amortised systematically over their estimated useful economic life.Intangible assets with a finite useful life are classified at cost net of accumulated amortisation and any impairment losses. Amor-tisation is based on the estimated useful life and commences when the asset is available for use.Intangible assets with an indefinite useful life and those not available for use are tested for impairment. This test consists in acomparison between the future estimated cash flows from the intangible asset and the net book value. The method of disco-unted operating cash flows is applied based on projections included in future business plans approved by company manage-ment.Costs relating to the acquisition of CIP 6/92 rights are amortised over the related benefit period. Goodwill principally relates to the differences arising on first-time consolidation between the book value of the investmentsand the corresponding share of equity of the consolidated companies, adjusted in order to take into consideration both signi-ficant intercompany transactions and the fair values of the identifiable assets and liabilities of the acquired company. Goodwillthat did not originate from consolidation differences relates to the purchase price paid by Frullo Energia Ambiente Srl followingacquisition of a business. Goodwill is subjected to an impairment test, at least on an annual basis, in order to identify perma-nent reductions in value. In order to perform the impairment test correctly, goodwill has been allocated to each of the cashgenerating units (CGUs) that benefit from the acquisition.The CGUs identified within the Falck Renewables Group are the various cash-flow generating projects: Trezzo, Rende, Frullo,the Sicily Projects (Casteltermini and Augusta projects) in the WtE, biomass and photovoltaic sector and Cabezo, Boyndie, SanSostene, Minervino Murge, Earlsburn, Cambrian, Millennium, Ben Aketil, Kilbraur, Buddusò-Alà dei Sardi, Petralia, Kernebet,Ty Ru and Falck Renewables Wind in the wind sector.The Sicily Project relating to Bellolampo-Palermo that is operated by Palermo Energia Ambiente ScpA is no longer included inthe Sicily Project CGUs.
Property, plant and equipmentProperty, plant and equipment is recorded at acquisition or production cost including directly attributable costs.Property, plant and equipment is valued at cost, net of depreciation and accumulated impairment losses, with the exception ofland, which is not depreciated and is valued at cost less accumulated impairment losses.In the event that significant components of an item of property, plant and equipment have differing useful lives, each compo-nent is attributed a separate useful life for depreciation purposes (component approach).The depreciation rates applied represent the estimated useful life of the assets.

79
The rates applied to the various asset categories are as follows:
(%)Industrial buildings - lightweight construction 3 - 4 - 10General and specific plant 5-12- 15 - 20Heavy plant and operating machinery 9 - 10 Equipment 10 - 12 - 20 - 25 - 30Office machinery and equipment 12 - 20Vehicles 20 - 25
These rates are applied based on months of actual use with regard to assets that come into use during the year.Ordinary maintenance costs are charged to expenses in the year in which they are incurred.Maintenance costs that increase the future economic benefits derived from the assets are capitalised on the related asset anddepreciated over the asset’s residual useful life. Borrowing costs for the construction of a plant or its acquisition are capitalised up until the moment in which the asset is readyfor use in the production process.Depreciation is applied from the date on which temporary approval (or equivalent status) is awarded to the plant or areas of itthat are capable of operating at full regime as defined by management. From this date, finance costs and expenses attributableto the approved plant or areas within it are no longer capitalised and are charged to the income statement.With regard to the Sicily Projects, property, plant and equipment was measured taking into consideration the current litigationwith the Department of the Sicily Region, as detailed in paragraph 5.1.6 Sicily Projects of the directors’ report.
Impairment of assetsIn the presence of circumstances that potentially indicate a loss in value, impairment tests are conducted on tangible and intan-gible assets with an indefinite useful life, by estimating the recoverable amount of the asset and comparing it with the relatednet book value. In the event that the recoverable value is lower than the carrying value an impairment loss is recognised in theincome statement. Where there is an indication that an impairment loss recognised in a previous accounting period is no longer required, the carr-ying amount is restated to the new estimated recoverable value which may not exceed the carrying value that would have beenrecognised had the original impairment not occurred. The reversal is also recorded in the income statement.Given the presence of external indicators including the market capitalisation of the Group at 31 December 2011 of Euro 247,702thousand, which is lower than the carrying amount of total equity of Euro 444,913 thousand, an impairment test was perfor-med on the operating and non-operating assets of the Falck Renewables Group that did not give rise to the recognition of animpairment loss against assets.
Investments and securitiesInvestments in subsidiaries and associatesInvestments in subsidiaries excluded from the scope of consolidation are valued at cost when the effect of their consolidationwould not have a significant impact on the consolidated financial position and on the consolidated profit for the period.Investments in associates in which the Falck Renewables Group holds more than 20% (or 10% if listed) are valued applying theequity method.
Investments in other companies and other securitiesIn accordance with IAS 39 and 32, investments in companies that are neither subsidiaries nor associates are measured at fairvalue through profit or loss with the exception of those circumstances in which market price or fair value cannot be determi-ned, in which case the cost method is applied.Gains and losses arising on adjustments to value are recognised as a specific reserve within equity.Where impairment losses exist or in the event of disposal of the related asset, the gains and losses recorded in equity up untilthis point are recycled to the income statement.Investments held for trading are measured at fair value with any adjustment recognised in the income statement.Cost is reduced for any impairment losses in the event that investments have recorded losses and no profits are foreseeable inthe near future to cover these losses; the original value may be restated in subsequent accounting periods in the event that thecircumstances that gave rise to the write-down no longer exist.
Joint-venturesHoldings in joint ventures are consolidated applying the proportional method whereby the consolidated financial statementsreflect line-by-line the relevant share of the assets, liabilities, profits and losses of the entity in which the company holds aninterest.

80
Financial assets Classification In accordance with IAS 39 and IAS 32, financial assets are classified into the following four categories:
1. Financial assets ‘at fair value through profit or loss’;2. Held-to-maturity investments;3. Loans and receivables;4. Available-for-sale financial assets.
The classification depends on the reason for which the investment was initially purchased and is subsequently held and mana-gement is required to determine the initial classification on initial recognition updating this at each financial year-end. Adescription of the principal characteristics of each asset category detailed above may be summarised as follows:
Financial assets ‘at fair value through profit or loss’This category has two sub-categories:
1. Financial assets held for trading;
2. Financial assets designated to the fair value category on initial recognition. This category includes all financial investments,except for equity instruments that are not quoted in an active market but for which a fair value may be reliably measured.
Financial instruments, with the exception of hedge instruments, are included in this category and their fair value recorded inthe income statement.All assets within this category are classified as current if they are held for trading purposes or where disposal is expected within12 months from the year end. Designation of a financial instrument to this category is irrevocable and may take place only on initial recognition.
Held-to-maturity investments Held-to-maturity investments are financial assets with fixed or determinable payments and fixed maturity, which the Groupintends to hold to maturity (e.g. underwritten debentures).Evaluation of the intent and ability to hold the asset to maturity must be made on initial recognition and at each subsequentbalance sheet date.In the event of sale before maturity (of a significant amount and not in exceptional circumstances) of held-to-maturity securi-ties, all such investments are reclassified as financial assets held for trading and measured at fair value.
Loans and receivablesLoans and receivables are non-derivative financial assets with fixed or determinable payments that are not quoted on an acti-ve market and which the Group does not intend to trade in.These are included in current assets with the exception of the portion expiring more than 12 months after the balance sheetdate, which is classified in non-current assets. Loans and receivables are classified within the financial statements under theheadings financial receivables and other receivables.
Available-for-sale financial assets All non-derivative instruments that are not classified in another category are designated as available-for-sale financial assets.These are classified as non-current assets unless management intends to dispose of them within 12 months of the balance sheetdate.
Accounting treatment Financial assets ‘at fair value through profit or loss’ held for trading (category 1) and available-for-sale financial assets (category4) are recorded at fair value including costs directly attributable to acquisition.Gains or losses relating to financial assets held for trading are recognised immediately in the income statement.Gains or losses relating to financial assets available for sale are recorded within a separate heading in equity until they are soldor otherwise disposed of, or until circumstances indicate they may be impaired. Where any of these events takes place, all gainsor losses recognised to date and recorded in equity are reclassified to the income statement. For this purpose the Group hasidentified quantitative parameters that identify a prolonged and significant decline in market prices, with particular referenceto a significant decrease in terms of value and a prolonged decrease over time. Fair value represents the amount at which an asset may be exchanged or a liability settled in an arm’s length transaction bet-ween knowledgeable, willing parties. As a result it is assumed that the entity is a going concern and that neither party needs toliquidate its assets through transactions applying unfavourable terms.

81
In the case of securities traded on an active market, fair value is determined with reference to the bid price at the end of tra-ding at the balance sheet date. In the event that a market valuation is not available for the investment, fair value is determined either based on the current mar-ket value of another substantially similar financial instrument or applying appropriate valuation techniques (discounted cashflows - DCF).Where fair value may not be reliably determined, the financial asset is valued at cost with disclosure in the notes to the finan-cial statements regarding the type of asset and explanation of the accounting treatment.Held-to-maturity investments (category 2) and loans and receivables (category 3) are recorded at cost representing the fairvalue of the initial consideration exchanged and are subsequently valued applying the amortised cost method utilising the effec-tive interest rate and taking into consideration any discounts or premiums received at the date of acquisition in order to recordthem over the entire period of ownership up to maturity. Gains and losses are recognised in the income statement either whenthe investment reaches maturity or where circumstances indicate that it has suffered an impairment loss, in the same way theyare identified during the normal amortisation period foreseen by the amortised cost method.Investments in financial assets may be derecognised only when the contractual rights to receive cash flows from the invest-ments have expired (e.g. final payment of underwritten bonds) or when the Group transfers the financial asset together withall of the related risks and rewards. The Company has entered into Interest Rate Swaps (IRS) in order to cover the risk arisingon changes in interest rates of project financing contracts. Where possible the Group adopts hedge accounting in relation tothese financial instruments, ensuring compliance with IAS 39.
InventoriesFinished goods are stated at the lower of purchase cost and net realisable value.Purchase cost is determined using the weighted average cost method.Obsolete and slow moving inventory is valued based on possible future use or realisation.With regard to contract work in progress that spans more than one accounting period, valuation is based on income earned todate with reasonable certainty, determined by comparing actual costs to date with the total estimated costs to completion.
ReceivablesReceivables are initially recorded at the fair value of the amount to be received, which for this category normally relates to thenominal value indicated on the invoice, adjusted where necessary to the estimated recoverable amount through recognition ofa provision for doubtful accounts. Subsequently, where the required conditions exist, receivables are valued applying the amor-tised cost method.
Cash and cash equivalentsCash and cash equivalents include cash on hand and demand and short-term deposits, the latter maturing in less than threemonths at the outset. Cash and cash equivalents are recorded at nominal value, or in the case of balances denominated inforeign currency at the year-end spot rate, which represents the fair value.
Non-current assets disposed of or held for sale (Discontinued operations)Non-current assets that have been disposed of or that are held for sale include those assets (or groups of assets) due to be dis-posed of and for which the accounting value will be recovered principally through sale rather than future use. Non-currentassets held for sale are valued at the lower of their carrying amount and fair value less costs to sell. In accordance with IFRS, information relating to discontinued operations is presented in two specific headings in the balancesheet: non-current assets held for sale and liabilities attributable to non-current assets held for sale; and in a specific headingin the income statement: net profit/(loss) of discontinued operations or non-current assets held for sale.
ProvisionsProvisions are recognised when a present obligation (legal or constructive) exists as a result of a past event and it is probablethat an outflow of resources embodying economic benefits will be required to settle the obligation and a reliable estimate of theamount may be made.No provision is made for risks in relation to which the recognition of a liability is only possible. In this case the risk is disclo-sed in the relevant note on contingencies and commitments and no provision is made.Provisions may be analysed as follows:
LitigationThis provision includes the charge for future costs relating to legal proceedings.
InvestmentsProvision is made to recognise potential impairment losses in the carrying value of non-consolidated subsidiaries.

82
EnvironmentalThis provision comprises future obligations in relation to the decommissioning of power plants at the end of their useful life,with a corresponding increase in the book value of the asset to which the obligation relates, which are calculated based on inde-pendent expert valuations. The portion of the total classified in property, plant and equipment that exceeds the amount expec-ted to be realised on sale of the recovered materials is subject to depreciation. This provision also includes amounts provided to meet future commitments in relation to the redevelopment of landfills inaccordance with the obligations undertaken on receipt of authorisations from the relevant authorities. These provisions arebased on estimates prepared by specialist enterprises and are charged to the income statement.
Sundry risks provisionThis provision includes all other future liabilities not included above, which are reasonably quantifiable but for which the dateof occurrence is uncertain.
Staff leaving indemnity (TFR) Post-employment defined benefits and other long-term employee benefits are subjected to actuarial valuation. The liabilityrecognised in the balance sheet is the present value of the Group’s obligations. Actuarial gains and losses are recognised in theincome statement.Valuation of the liability is performed by independent actuaries.Pursuant to Finance Act 296 of 27 December 2006, only the liability relating to the TFR held within the company has beenvalued for the purpose of IAS 19 as future provisions are paid to a separate entity. Consequently, in respect of future paymentsthe company is not subject to the reporting requirements relating to the future benefits payable during employment.
Trade payablesTrade payables with normal trading terms are recorded at nominal value. Where the payment terms are such that a financial transaction exists, the nominal value of the liabilities measured applying theamortised cost method are discounted and the difference included in finance costs.Trade payables denominated in foreign currency are translated at year-end exchange rates and the gains and losses arising onexchange are recognised in the income statement in the period in which they arise.
Borrowings and financial liabilitiesBorrowings are recognised initially at fair value, net of transaction costs incurred. Subsequently, borrowings are stated at amor-tised cost. Finance costs are determined using the effective interest method.Other financial liabilities comprise derivative instruments entered into in order to hedge interest rate risk. Where possible theGroup adopts hedge accounting in relation to these financial instruments, ensuring compliance with IAS 39.
Government grantsGovernment grants are recognised when there is reasonable assurance that an entity will comply with any conditions attachedand that the grant will be received. Where grants are awarded to cover expenditure, they are classified as income and recogni-sed in the period in which the related costs are incurred. Where grants are received towards the cost of an asset, both the assetand the grant are recorded at nominal value and systematically charged to the income statement over the useful life of the cor-responding asset.Where the Group receives a non-monetary grant, the asset and the grant are recorded at nominal value and systematically char-ged to the income statement over the useful life of the corresponding asset. Where loans or subsidies awarded by governmentauthorities or similar institutions bear interest rates below current market rates, the benefit arising from this difference is reco-gnised as an additional government grant.
Current tax liabilitiesThe provision for income taxes is based on the estimated taxable income for the period for each individual company, taking intoconsideration tax credits and losses brought forward and utilised in the period.
Accruals, prepayments and deferralsAccruals, prepayments and deferrals are determined applying the accruals concept.
Share capitalOrdinary shares are classified within share capital at nominal value. Incremental costs directly attributable to capital transac-tions by the parent company are recorded as a deduction in equity.
83
Foreign currency translationThe functional currency of the Group is the Euro, representing the currency in which the consolidated financial statements areprepared and presented.Foreign currency transactions are recorded at the exchange rate existing at the date of the transaction. Receivables and paya-bles are translated at the closing rate at the balance sheet date. Exchange gains or losses arising on translation are recognisedin the income statement in the period in which they arise.Non-monetary items measured at historical cost are translated using the exchange rate at the date of the transaction. Non-monetary items measured at fair value are translated using the exchange rate at the date when the fair value was deter-mined.
Revenue recognitionRevenue is recorded net of returns, discounts and rebates, as well as direct taxes on the sale of goods or provision of services.
Revenue from product salesRevenue from the sale of products is recognised on the transfer of ownership, which normally takes place on delivery ordespatch of the goods. Revenue also includes income from the sale of Green Certificates which are accounted for applying theaccruals concept.
Revenue from servicesRevenue from services is recognised once the service has been rendered.
InterestFinance income is accounted for applying the accruals concept.
DividendsDividends are recognised when the right to receipt of the dividend is established, which normally corresponds to the approvalof distribution in the shareholders’ meeting.
Other income Other income comprises amounts that do not relate to the core business of the Group and, in accordance with IAS 1 which hasbeen applied from 1 January 2005, they are classified in ordinary activities and where significant in value are disclosed separa-tely in the notes to the financial statements.
CostsCosts are recognised net of returns, discounts, bonuses and premiums, as well as direct taxes relating to the purchase of goodsand services.
Taxation including deferred income taxIncome tax is calculated and provided for based on estimated taxable income for the year and applying existing tax legislation. Deferred income taxes are calculated applying the liability method on all temporary differences between the tax bases of assetsand liabilities and the financial reporting values at the balance sheet date. Deferred income tax assets are recognised only when sufficient future taxable income against which these assets can be utili-sed is reasonably foreseeable. The balance of deferred income tax assets is reviewed at each balance sheet date and a valuationallowance is provided in the event that it is no longer probable that sufficient future taxable profits will be available to offset allor part of the tax credit. Deferred income tax assets and liabilities are measured at the enacted tax rates that will be in effect in the periods in which theassets are realised or the liability is settled and are classified in non-current assets and liabilities, respectively.
6.6.5 Financial risk management: objectives and criteria
The financial instruments of the Group, other than derivatives, comprise bank borrowings, demand and short-term bank depo-sits. Similar instruments are employed in financing the group operating activities. The Group uses derivative financial instru-ments, principally interest rate swaps. The Group’s aim is to manage interest rate risk on its transactions and various forms offinancing.The Group’s debt financing exposes it to a variety of financial risks that include interest rate, liquidity and credit risk.

84
Interest rate riskThe Group’s exposure to market risk in respect of variations in interest rates principally relates to the long-term obligationsentered into by the Group using a mix of fixed and variable interest rates. In order to manage this mix effectively, the Grouppurchases interest rate swaps under which it agrees to exchange, at specific levels, the difference between fixed interest ratesand variable rates calculated on a pre-determined notional capital amount. The swaps are designated to hedge the underlyingobligations.
Credit riskThe Group only trades with reliable and reputable customers. Credit risk relates to the other financial activities of the Group that include cash and cash equivalents, available-for-sale finan-cial assets and a number of derivative instruments, and present a maximum risk equal to the carrying amount of these assets.
Liquidity riskThe objective of the Group is to achieve a balance between maintaining available funds and flexibility through the use of loansand bank overdrafts.
6.6.6 Capital risk management
The key objectives of the Group regarding capital management are creating value for its shareholders and ensuring the goingconcern of the business.The Group has also established the objective of maintaining the best possible capital structure in order to reduce the cost ofdebt and fulfil financial covenants.
6.6.7 Segment information
Set out below are details of the results of operations and financial position by business segment in accordance with IAS/IFRS. The segments identified represent the organisation and production structure that the Falck Renewables Group has decided toadopt. The operating segments and performance indicators were determined based on the reporting used by the Group’s board ofdirectors for the purpose of strategic decision making.
(Euro thousands) WtE, biomass, photovoltaic Wind Holding Elimination Consolidated
Operations 2011 2010 2011 2010 2011 2010 2011 2010 2011 2010Revenue 106,216 89,948 142,378 8,884 140 364 (84) 248,650 99,196Cost of sales (66,134) (56,536) (64,861) (5,310) (130) (93) 537 (130,588) (61,939)Gross profit 40,082 33,412 77,517 3,574 10 271 453 118,062 37,257Other income 190 1,588 1,086 24 5,095 3,001 (4,709) (3,086) 1,662 1,527Administrative expenses (7,524) (6,265) (14,223) (2,317) (22,759) (12,630) 4,015 2,084 (40,491) (19,128)Operating profit 32,748 28,735 64,380 1,281 (17,654) (9,358) (241) (1,002) 79,233 19,656Finance income/(costs) - net (6,578) (5,653) (39,347) (2,623) 3,243 4,265 (42,682) (4,011)Investment income/(expenses) 2,529 810 (6) 12,620 3,893 (15,259) (3,542) 700 345Profit/(loss) before income tax 28,699 23,082 25,843 (1,348) (1,791) (1,200) (15,500) (4,544) 37,251 15,990Income tax expense (11,028) (11,344) (6,391) (1,284) 15 1,006 (3) 275 (17,407) (11,347)Profit/(loss) for the year 17,671 11,738 19,452 (2,632) (1,776) (194) (15,503) (4,269) 19,844 4,643Net profit/(loss) of assets held for saleProfit/(loss) for the year 17,671 11,738 19,452 (2,632) (1,776) (194) (15,503) (4,269) 19,844 4,643Profit/(loss) attributable to non-controlling interests 1,033 (137) (52) (14) 2,295 981 2,144Profit/(loss) attributable to owners of the parent 16,638 11,875 19,504 (2,618) (1,776) (194) (15,503) (6,564) 18,863 2,499

85
(Euro thousands) WtE, biomass, photovoltaic Wind Holding Elimination Consolidated
Financial 2011 2010 2011 2010 2011 2010 2011 2010 2011 2010Non-current assets 320,925 336,872 946,651 786,605 352,037 238,687 (349,969) (237,685) 1,269,644 1,124,479Current assets 81,780 61,502 184,943 159,843 308,378 373,592 (310,931) (376,667) 264,170 218,270Assets held for saleTotal assets 402,705 398,374 1,131,594 946,448 660,415 612,279 (660,900) (614,352) 1,533,814 1,342,749Equity attributable to owners of the parent 84,991 96,713 53,382 31,272 556,636 436,121 (250,096) (236,118) 444,913 327,988Non-controlling interests 7,066 11 29 92 (182) 7,242 6,913 7,345Total equity 92,057 96,724 53,411 31,364 556,636 436,121 (250,278) (228,876) 451,826 335,333Non-current liabilities 107,510 76,297 750,220 577,906 91,998 1,593 (17,230) (8,808) 932,498 646,988Current liabilities 203,138 225,353 327,963 337,178 11,781 174,565 (393,392) (376,668) 149,490 360,428Liabilities attributable to assets held for saleTotal liabilities 402,705 398,374 1,131,594 946,448 660,415 612,279 (660,900) (614,352) 1,533,814 1,342,749
6.6.8 Balance sheet content and movements
Business combinations and transactions under common control
In the course of 2011 Falck SpA sold to Falck Renewables SpA the business comprising the assets (management software, good-will, furniture, furnishings and electronic equipment) and employees (together with the TFR and holiday provisions) dedicatedto providing management services, with effect from 1 January 2011. As part of this agreement 28 employees were transferred toFalck Renewables SpA (6 managers and 22 middle management and white-collar staff). Within the same reorganisation,Riesfactoring SpA, controlled by Falck SpA, sold the business that consisted of the assets (goodwill, furniture and furnishings)and employees (together with the TFR and holiday provisions) dedicated to the treasury function to Falck Renewables SpA,again with effect from 1 January 2011. This agreement resulted in the transfer of 3 employees (1 manager and 2 white-collarstaff).
IFRS requires application of the continuing value principle to extraordinary transactions involving businesses under commoncontrol and consequently that the amounts in the consolidated financial statements are recognised as though the entities orbusinesses involved in the business combination had always been combined. The net assets of the entity acquired or the acqui-ring entity are measured at the pre-combination carrying amount in the separate financial statements:
(Euro thousands) Falck SpA Riesfactoring SpA Carrying amount of the acquired business business businessAssetsSoftware 252Motor vehicles, furniture, furnishings and electronic equipment 247Cash and cash equivalents 34Total assets 499 34LiabilitiesStaff leaving indemnity (TFR) 455 121Other payables 533 31Total liabilities 988 152Total net assets acquired/sold (489) (118)Consideration of the acquisition/disposal 661 2Difference resulting in a decrease in consolidated total equity (1,150) (120)Tax effect 372 38Difference resulting in a decrease in consolidated total equity net of the tax effect (778) (82)

86
Assets
A Non-current assets
1 Intangible assets
Movements in the period were as follows:
At Acquisi- Foreign Change in Sales Other Impair- Amorti- At31.12.2010 tions exchange scope of move- ment sation 31.12.2011
(Euro thousands) differences consol.n ments losses1.1 Industrial patent rights 89 322 (92) 3191.2 Concessions, licences,
trademarks and similar 9,203 (968) 8,2351.3 Goodwill 119,447 2,191 (651) (2) (4,422) 116,5631.4 Other intangibles 5,090 92 1 (1,600) (2) 3,5811.5 Assets under construction
and advances 2,448 146 (223) 2,371Total 136,277 468 2,283 (651) (224) (6,022) (1,062) 131,069
Goodwill principally consists of the differences arising on first time consolidation between the book value of the investmentsand the corresponding share of net equity of the consolidated companies that is attributable to the Group. In addition, thisheading includes the purchased goodwill arising on the acquisition of a business line by Frullo Energia Ambiente Srl (Euro 1,519thousand).
Since 1 January 2005, goodwill has not been amortised but is subjected to an annual impairment test. The goodwill resulting from business combinations has been allocated to separate cash generating units (CGUs) in order toidentify potential impairment losses. The cash generating units identified are:
- Ben Aketil Wind Energy Ltd (Ben Aketil wind farm)- Boyndie Wind Energy Ltd (Boyndie wind farm)- Cambrian Wind Energy Ltd (Cefn Croes wind farm) - Earlsburn Wind Energy Ltd (Earlsburn wind farm) - Ecosesto SpA (Rende biomass plant)- Eolica Cabezo San Roque Sa (Cabezo wind farm) - Eolica Petralia Srl (Petralia wind farm) - Eolica Sud Srl (San Sostene wind farm) - Eolo 3W Minervino Murge Srl (Minervino Murge wind farm) - Esquennois Energie Sas (Breteuil wind farm)- Falck Renewables Wind Ltd (parent company of wind sector)- Frullo Energia Ambiente Srl (Granarolo dell’Emilia WtE plant)- Geopower Sardegna Srl (Buddusò-Alà dei Sardi wind farm) - Kernebet Sas and Ty Ru Sas (Plouigneau wind farm) - Kilbraur Wind Energy Ltd (Kilbraur wind farm) - Millennium Wind Energy Ltd (Millennium wind farm) - Parc Eolien du Fouy Sas (Fouy wind farm)- Prima Srl (Trezzo sull’Adda WtE plant)- Sicily Projects (Casteltermini and Augusta WtE plants).
Goodwill of Sicily Projects’ CGUsAt the time of preparation of the Annual Report, the first (2010) and second (2011) interim liquidation accounts of PalermoEnergia Ambiente ScpA (“Pea”) had not been approved. Pea is one of the Sicily Project companies (Bellolampo-Palermo) cur-rently in liquidation, in which the Company has a 23.2725% interest that was consolidated applying the proportional methodup to the 2010 financial statements. This is due to a dispute with the shareholder Amia SpA (“Amia”), which holds a 48% inte-rest in Pea and is currently in extraordinary administration. Consequently, as joint control may not be exercised over Pea thisresults in its exclusion from the scope of consolidation and measurement of the investment as detailed below.

87
In the event that an agreement cannot be reached with Amia regarding approval of Pea’s third liquidation accounts, it is highlylikely that the company will be dissolved pursuant to article 2490 of the Italian Civil Code.
The above issues involving Pea do not apply to the other two Sicily Project companies, Tifeo and Platani (in which Falck Rene-wables SpA holds indirect interests of 96.35% and 86.77% respectively through its subsidiary Elettroambiente SpA).
Following Pea’s deconsolidation, the Sicily Projects’ CGUs no longer include the Palermo project.
Legal experts confirmed in February 2012 that at present the status of the legal action remains substantially unchanged (as sta-ted in the opinions issued on 25 February 2010 and 22 July 2010 – the financial claims raised by the Group in substance hadnot changed following the modification of the original claim from specific performance made in respect of the Agreement dated28 April 2009 to a claim for termination due to the actions and default of ARRA) as no significant facts had emerged that couldsignificantly alter the outcome of the proceedings. On 25 January 2012, the Department submitted a copy of Decree 548 of 22September 2010 to the trial stating that the provisions outlined therein would result in the discontinuance of the matter in issueregarding the legal disputes as the Decree would have effectively cancelled the motives (i.e. the Convention and Agreement)that formed the basis of the civil action brought by the Industrial Operators. The Sicily Project companies disputed the argu-ments put forward by the Department, underlining the fact that the Decree had been challenged before the TAR in Sicily foradditional grounds of appeal notified on 3 October 2011. Now therefore the outcome of the civil proceedings could be affectedby the administrative proceedings particularly in the event that the Sicily Project Companies do not obtain cancellation or aruling of invalidity of the said Decree in the administrative proceedings.
An impairment test was performed on the goodwill allocated to the Sicily Projects’ cash generating unit taking into account theincrease in the investments in Tifeo (from 95.62% to 96.35%) and Platani (from 85.73% to 86.77%), the change in interest ratesand the opinion of the independent legal experts.
This impairment test was performed primarily taking into consideration all costs incurred at 31 December 2009 (pecuniarydamages), the compensation established in the Agreement with ARRA of 28 April 2009, costs incurred in 2010-2011, intereston costs incurred net of legal expenses, and by estimating the date of settlement of the total amount to be 2015.Total costs incurred up to 31 December 2009 amounted to Euro 93,422 thousand, while compensation was estimated at Euro27,879 thousand4. These amounts were discounted based on the interest rate swap rate at the presumed settlement date.
In addition to the above pecuniary damages loss of profit was calculated only taking into account the compensation establis-hed in the Agreement of 28 April 2009 as this had been recognised by ARRA in the agreement, instead of the full loss of profitassociated with the case. Acknowledgement of the Company’s statements (already confirmed by the Company’s expert wit-nesses) regarding the entire loss of profits will be assessed by a court appointed technical consultant as part of the proceedingspending with ARRA.The compensation corresponds to approximately 20% of the loss of profits of the Falck Renewables Group requested by theTifeo and Platani, in liquidation, as part of the said proceedings5.
Based on the above and the matters described in the Sicily Projects’ note in the directors’ report, the impairment test did notidentify impairment of the goodwill allocated to the Sicily Projects’ CGUs.
Other CGUs
An impairment test on the goodwill of the other CGUs was performed at 31 December 2011 following the procedures esta-blished in IAS 36. In particular, the recoverable amount of the individual cash generating units was determined for all of theCGUs (which corresponds to each individual projects) based on value in use, which is calculated using the projection of cashflows over a period of time corresponding to the estimated useful life of each individual project and a weighted average cost ofcapital (WACC) that varies depending on the technology used and the country in question. Given the nature of the business,which foresees medium-term returns and fixed duration rights and concessions, the business plan exceeds 5 years.
4 The total costs incurred takes into consideration the 100% line-by-line consolidation of Tifeo (95.62% owned by Falck Renewables SpA) and Platani (85.73%owned by Falck Renewables SpA), while the abovementioned compensation relates entirely to Elettroambiente SpA, 100% owned by Falck Renewables SpA.
5 The Industrial Operators requested compensation for the prejudice suffered both as pecuniary damages (amounting to: Tifeo, Euro 55,745,013; Platani, Euro37,676,745); and loss of profits (amounting to: Tifeo, Euro 94,100,000.00; Platani, Euro 47,800,000).

88
The recoverable amount of each unit was determined estimating the discounted operating cash flows over the concession termof each project (normally 20 years from the start of production), and a nil terminal value. The projected cash flows are basedon the following assumptions:
• Expected production levels of the wind farms/photovoltaic plants based on productivity plans;
• Estimated sales prices extrapolated using market projections on the energy price curve and expected incentives (green cer-tificates and energy account contributions). With regard to incentives, regulatory developments in the sector that are cur-rently under review were taken into account.
The WACCs applied were as follows:
WtE Italy 6.83%Wind sector UK 6.03%Wind sector Italy 7.18%Wind sector Spain 7.31%Wind sector France 6.28%Photovoltaic Italy 7.26%
The discount rate applied represents the weighted average cost of capital determined using the Capital Asset Pricing Model(“CAPM”) where the risk free rate was calculated with reference to the long-term (10 year) rate of return on Italian/UK/Frenchand Spanish government bonds. With regard to the CGUs relating to Italian projects, the rate corresponded to the return on 10 year Italian government bondsas at 15 February 2012, which is largely in line with the average rate of return of 10 year Italian government bonds over the last6 to 12 months. The systematic non-diversifiable risk (β) and the debt to equity ratio were calculated through an analysis of a group of compa-rable entities operating in the same sector.
This led to an impairment loss of Euro 3,136 thousand being recognised against the goodwill of Prima Srl (Trezzo sull’AddaWtE plant ); the residual goodwill of the Prima Srl CGU after impairment was Euro 1,009 thousand at 31 December 2011.The Trezzo sull’Adda plant will become an asset operated under concession from 2023.The impairment test also led to an impairment loss of Euro 1,079 thousand against the goodwill of Eolica Petralia Srl and Euro1,489 thousand on a portion of the expenditure capitalised on the construction of the wind farm. This impairment arose as aresult of delays in the authorisation process and changes in the regulatory framework governing electricity sales tariffs.
Goodwill at 31 December 2011 comprised:
(Euro thousands) Carrying amount at 31.12.2011Ben Aketil Wind Energy Ltd 10,482 Boyndie Wind Energy Ltd 4,377 Cambrian Wind Energy Ltd 13,291 Earlsburn Wind Energy Ltd 10,312 Eolica Cabezo San Roque Sa 760 Eolica Sud Srl 2,074 Eolo 3W Minervino Murge Srl 1,893 Esquennois Energie Sas 6 Falck Renewables Wind Ltd 10,222 Frullo Energia Ambiente Srl 1,519 Geopower Sardegna Srl 17,052 Kilbraur Wind Energy Ltd 3,979 Millennium Wind Energy Ltd 9,995 Parc Eolien du Fouy Sas 20 Prima Srl 1,009 Sicily Projects 29,297 Ty Ru Sas 275 Total 116,563

89
Acquisitions principally relate to the acquisition of the businesses of Falck SpA and Riesfactoring SpA (Euro 252 thousand) anddevelopment expenditure on the photovoltaic plants (Euro 146 thousand).
Impairment losses comprise the amounts identified on performance of the annual year-end impairment test. More specifically,these relate to the Trezzo sull’Adda WtE plant (Euro 3,136 thousand of goodwill), the Petralia wind farm (Euro 1,079 thousandof goodwill and Euro 1,489 thousand of capitalised development costs) and the Kernebet wind farm (Euro 207 thousand ofgoodwill and Euro 111 thousand of capitalised development costs).
The change in scope of consolidation relates to the goodwill of Palermo Energia Ambiente ScpA that was reversed and reco-gnised as investment costs following the deconsolidation of the related stake in the company.
No borrowing costs were capitalised on intangible assets during the year.
2 Property, plant and equipment
Movements during the year were as follows:
At Additions Change in Capital.n Exchange Disposals Other Impair- Deprec- At31.12.2010 scope of and differences move- ment iation 31.12.2011
consol.n reclass.n ments losses(Euro thousands) (A)Gross value2.1 Land 18,668 206 (27) 2 18,8492.2 Buildings 6,073 15 (3) 6,0852.3 Plant and machinery 728,178 17,992 240,685 9,547 (357) 24,074 (17) 1,020,1022.4 Industrial and office equipment 2,508 40 668 7 (28) 1 3,1962.5 Other assets 3,884 562 19 19 (185) 2 (75) 4,2262.6 Assets operated under concession 92,324 204 (1) 92,5272.7 Assets under construction and adv. 246,606 158,712 (10,001) (243,929) (105) (231) (60) (191) 150,801Total gross value 1,098,241 177,527 (10,001) (2,353) 9,468 (828) 24,015 (283) 1,295,786Accumulated depreciation2.1 Land2.2 Buildings (4,023) (108) (4,131)2.3 Plant and machinery (105,021) 2,530 (2,052) 61 (40,772) (145,254)2.4 Industrial and office equipment (894) 35 (6) 28 (393) (1,230)2.5 Other assets (2,169) 9 (12) 153 (559) (2,578)2.6 Assets operated under concession (39,073) 1 (4,917) (43,989)Total depreciation (151,180) 2,574 (2,070) 242 1 (46,749) (197,182)Net book amounts2.1 Land 18,668 206 (27) 2 18,8492.2 Buildings 2,050 15 (3) (108) 1,9542.3 Plant and machinery 623,157 17,992 243,215 7,495 (296) 24,074 (17) (40,772) 874,8482.4 Industrial and office equipment 1,614 40 703 1 1 (393) 1,9662.5 Other assets 1,715 562 28 7 (32) 2 (75) (559) 1,6482.6 Assets operated under concession 53,251 204 (4,917) 48,5382.7 Assets under construction and adv. 246,606 158,712 (10,001) (243,929) (105) (231) (60) (191) 150,801Total net book amounts 947,061 177,527 (10,001) 221 7,398 (586) 24,016 (283) (46,749) 1,098,604

90
A) Additions – these comprise:
(Euro thousands)Petralia wind farm 26,137Kilbraur wind farm (expansion) 25,023Millennium wind farm (expansion) 7,598Ty Ru wind farm 5,139Nutberry wind farm 472Improvements to the Cambrian wind farm 436Assets relating to Falck SpA business acquisition 254Improvements to Granarolo dell'Emilia WtE plant 640Buddusò-Alà dei Sardi wind farm 90,007Improvements to Trezzo sull'Adda WtE plant 1,199Spinasanta photovoltaic plant 8,755Sugherotorto photovoltaic plant 5,180Cardonita photovoltaic plant 5,746Motor vehicles 128Other minor wind sector additions 526Other minor WtE, biomass and photovoltaic sector additions 287Total 177,527
Other movements comprise Euro 24,074 thousand capitalised on the wind farms, with a corresponding charge to the environ-mental provision, to account for future expenditure on the decommissioning of these plants as determined by independentexpert estimates. These estimates also identified the plants’ scrap value arising from their decommissioning and disposal.Depreciation at 31.12.2011 was calculated taking into account the plants’ residual value. The change in scope of consolidationreflects the deconsolidation of Palermo Energia Ambiente ScpA that gave rise to the reversal of assets under construction witha corresponding entry to trade and financial receivables that were subsequently written off in full.Borrowing costs allocated during the year to property, plant and equipment amounted to Euro 9,756 thousand relating to windfarms under construction (Euro 8,667 thousand) and photovoltaic plants (Euro 1,089 thousand). Property, plant and equipmentat 31 December 2011 did not include amounts relating to revaluations carried out in accordance with local monetary revalua-tion legislation or arising from economic revaluations.The impairment test performed on the property, plant and equipment of the Sicily Projects6 did not identify any impairmentloss.
3 Financial assets
Financial assets at 31 December 2011 comprised:
(Euro thousands) 31.12.2011 31.12.2010 ChangeInvestments in subsidiariesInvestments in associates 1,085 1,180 (95)Other investments 11 11SecuritiesTotal 1,096 1,191 (95)
6 Following deconsolidation of Pea and its subsequent impairment, the Palermo project is no longer included in the Sicily Projects’ CGUs.

91
Equity investmentsAssociates accounted for under the equity methodThis relates to two 26% stakes in Parque Eolico La Carracha Sl and Parque Eolico Plana de Jarreta Sl, the owners of the La Muelawind farm, which have carrying values of Euro 547 thousand and Euro 534 thousand respectively. The carrying values take intoaccount the associates’ results.
Associates valued at costThese comprise two 20% stakes, the first in Falck Renewables Italia Energetica Srl that has a carrying amount of Euro 4 thou-sand and the second in Eolica Calabra Srl that has a nil carrying amount as it is in liquidation. This heading also comprises the interest in Palermo Energia Ambiente ScpA, which was written down to nil at the year-end(Euro 2,639 thousand).
Other entities valued at costThe only investment included under this heading is Riesfactoring SpA, the value of which did not change during the year.
4 Financial receivables
Financial receivables at 31 December 2011 may be analysed as follows:
31.12.2011 31.12.2010 ChangeTotal Non- Current Total Non- Current Total Non- Current
(Euro thousands) current current currentAmounts owed by third parties 4,442 4,442 (4,442) (4,442)Amounts owed by subsidiariesAmounts owed by associates 748 734 14 747 734 13 1 1Amounts owed by parent companyAmounts owed by other Falck Group companiesDerivative financial instruments 5,589 5,589 (5,589) (5,589)Total 748 734 14 10,778 10,765 13 (10,030) (10,031) 1
Financial receivables are disclosed net of the provision for doubtful accounts of Euro 6,022 thousand.Non-current amounts owed by associates comprise loans granted to Parque Eolico La Carracha Sl for Euro 251 thousand andParque Eolico Plana de Jarreta Sl for Euro 483 thousand.Amounts owed by associates also comprises Euro 6,022 thousand due from Palermo Energia Ambiente Scpa, which was writ-ten down to nil through the provision for doubtful accounts.
5 Trade receivables
Trade receivables at 31 December 2011 consisted of the following:
31.12.2011 31.12.2010 ChangeTotal Non- Current Total Non- Current Total Non- Current
(Euro thousands) current current currentTrade receivables 102,318 102,318 72,535 72,535 29,783 29,783Amounts owed by subsidiariesAmounts owed by associatesAmounts owed by parent company 121 121 34 34 87 87Amounts owed by other Falck Group companies 115 115 1 1 114 114Total 102,554 102,554 72,570 72,570 29,984 29,984

92
The analysis of trade receivables by geographical location is as follows:
. Italy Euro 78,719 thousand
. Great Britain Euro 22,025 thousand
. Spain Euro 496 thousand
. France Euro 1,075 thousand
. Other countries Euro 3 thousand
Trade receivables are disclosed net of the provision for doubtful accounts of Euro 4,906 thousand at 31 December 2011, whichis recorded in order to adjust them to fair value.Total third party trade receivables of Euro 102,318 thousand at 31 December 2011, comprised Euro 73,598 thousand not yet dueand Euro 28,720 thousand overdue that in turn comprised Euro 25,193 thousand between 0 and 90 days overdue.
Amounts owed by associates include Euro 4,015 thousand due from Palermo Energia Ambiente Scpa that was written down tonil through the provision for doubtful accounts.
6 Other receivables
Other receivables at 31 December 2011 consisted of the following:
31.12.2011 31.12.2010 ChangeTotal Non- Current Total Non- Current Total Non- Current
(Euro thousands) current current currentAmounts owed by third parties 605 605 886 886 (281) (281)Amounts owed by subsidiariesAmounts owed by associatesAmounts owed by parent company 12,010 5,760 6,250 17,512 10,079 7,433 (5,502) (4,319) (1,183)Amounts owed by other Falck Group companies 381 381 (381) (381)Advances 5,612 5,612 331 331 5,281 5,281Tax credits 42,570 42,570 37,771 37,771 4,799 4,799Guarantee deposits 2,153 2,153 914 880 34 1,239 1,273 (34)Accrued income and prepayments 5,787 375 5,412 2,727 393 2,334 3,060 (18) 3,078Total 68,737 8,288 60,449 60,522 11,352 49,170 8,215 (3,064) 11,279
The amounts owed by parent company principally relate to tax income due from Falck SpA in relation to the Group consoli-dated tax regime (Euro 11,395 thousand). The current portion (Euro 5,760 thousand) will be settled in 2012 by the consolida-ting entity Falck SpA, while the non-current portion will be settled in future accounting periods.Current tax credits principally relate to the VAT receivables of Platani Energia Ambiente ScpA (Euro 1,680 thousand), Tifeo Ener-gia Ambiente ScpA (Euro 2,380 thousand), Actelios Solar SpA (Euro 4,552 thousand), Eolica Sud Srl (Euro 9,078 thousand),Eolica Petralia Srl (Euro 1,618 thousand), Eolo 3W Minervino Murge Srl (Euro 1,080 thousand) and Geopower Sardegna Srl(Euro 20,284 thousand). Accrued income and prepayments at the year-end amounted to Euro 5,787 thousand and largely relate to the one off advanceon the ground lease for the land to be used by Tifeo Energia Ambiente ScpA for the construction of the WtE plant, maintenan-ce prepayments and deferred charges on expenses relating to guarantees, insurance and royalties payable.

93
7 Deferred income tax assets
Deferred income tax assets may be analysed as follows:
Deferred income tax asset Deferred income tax asset(Euro thousands) 31.12.2011 31.12.2010Intangible assets (3,108) (4,677)Property, plant and equipment (10,532) (7,275)Risk and expenses provisions (884) 1,250Provision for doubtful accounts 291 154Tax losses carried forward 874 602Share capital increase expenses 1,844 1,316Accruals 581 1,692Financial instruments 18,244 5,741Amortised cost method 2,821 1,863Other 4,732 (304)Total 14,863 362
The balance of Euro 14,863 thousand comprises Euro 29,853 thousand of deferred income tax assets net of Euro 14,990 thou-sand of deferred income tax liabilities.
Deferred income tax assets and liabilities generated on the differences between the tax bases of assets and liabilities and theIFRS financial reporting values are only offset when there is a legal enforceable right of offset and when they relate to taxeslevied by the same fiscal authority.
Deferred income tax assets on tax losses carried forward are recognised as they are considered recoverable.
Movements in the deferred income tax asset account were as follows:
(Euro thousands)At 31 December 2010 17,833Movements through the income statement 1,054Movements recorded within equity 10,258Change in the scope of consolidationOther movements 708At 31 December 2011 29,853
Movements in the deferred income tax liability account were as follows:
(Euro thousands)At 31 December 2010 (17,471)Movements through the income statement 1,043Movements recorded within equity 2,410Change in the scope of consolidationOther movements (972)At 31 December 2011 (14,990)

94
B Current assets
8 Inventories
Inventories at 31 December 2011 consisted of the following:
(Euro thousands) 31.12.2011 31.12.2010 ChangeRaw materials and consumables 2,736 2,324 412Semi-finished goods 166 (166)Work in progress 69 (69)Finished goods 1,527 1,169 358AdvancesTotal 4,263 3,728 535
Raw materials comprise the stocks of biomass while finished goods relate to spare parts for the operating plants.
9 Cash and cash equivalents
(Euro thousands) 31.12.2011 31.12.2010 ChangeShort-term bank and post office deposits 96,871 92,710 4,161Cash in hand 19 79 (60)Total 96,890 92,789 4,101
Cash and cash equivalents may be detailed as follows:
(Euro thousands) 31.12.2011 31.12.2010 ChangeCash at bank and in hand 96,890 92,789 4,101Bank overdrafts (121) (121)Invoice advancesGroup current accountsTotal cash and cash equivalents 96,769 92,789 3,980
Cash at bank and in hand largely relates to the current accounts of Prima Srl (Euro 11,270 thousand), Eolica Sud Srl (Euro15,864 thousand), Eolo 3W Minervino Murge Srl (Euro 7,856 thousand), Geopower Sardegna Srl (Euro 2,132 thousand), Frul-lo Energia Ambiente Srl (Euro 7,175 thousand), Actelios Solar SpA (Euro 3,136 thousand), Cambrian Wind Energy Ltd (Euro6,595 thousand), Earlsburn Wind Energy Ltd (Euro 6,401 thousand), Ben Aketil Ltd (Euro 5,962 thousand), Millennium WindEnergy Ltd (Euro 10,680 thousand), Kilbraur Wind Energy Ltd (Euro 8,240 thousand), Boyndie Wind Energy Ltd (Euro 2,150thousand), Eolica Cabezo San Roque Sl (Euro 3,960 thousand) and the three operating companies of the wind sector businessin France (Euro 3,149 thousand). The bank accounts of Group companies that have entered into project financing contractsmust manage their current accounts in order to meet the covenants established under the contracts.

95
Liabilities
D Equity
10 Share capital
Share capital consists of 291,413,891 issued and fully paid ordinary shares, with a nominal value of Euro 1 each. The number ofshares increased by 129,517,284 ordinary shares of Euro 1 each following the share capital increase finalised in March 2011. Movements in equity during 2010 and 2011 were as follows:
ReservesShare Share Demerger Translat- Cash flow Other Profit Equity Non- Totalcapital premium reserve ion hedge reserves for the attributable controlling
account under com- reserve reserve year to owners interests(Euro thousands) mon control of the parentAt 31.12.2009 67,680 240,828 3,936 27,230 4,175 343,849 5,803 349,652Appropriation of 2009 profit of the parent to reserves 4,175 (4,175)Dividends distributed (5,752) (5,752) (750) (6,502)Share capital increase 94,217 379,693 (375,534) (94,217) 4,159 4,159Cost of share capital increase (2,778) (2,778) (2,778)Other movements recorded in equity 436 9,534 9,970 9,970Acquisition of Falck Renewables Wind (23,516) (23,516) 104 (23,412)Reclassifications (1,730) (29,758) 31,488Other movements (443) (443) 44 (399)Profit for the year 2,499 2,499 2,144 4,643At 31.12.2010 161,897 620,521 (371,598) (1,294) (20,224) (63,813) 2,499 327,988 7,345 335,333
ReservesShare Share Demerger Translat- Cash flow Other Profit Equity Non- Totalcapital premium reserve ion hedge reserves for the attributable controlling
account under com- reserve reserve year to owners interests(Euro thousands) mon control of the parentAt 31.12.2010 161,897 620,521 (371,598) (1,294) (20,224) (63,813) 2,499 327,988 7,345 335,333Appropriation of 2010 profit of the parent to reserves 2,499 (2,499)Dividends distributed (3,497) (3,497) (1,398) (4,895)Share capital increase 129,517 455 129,972 129,972Cost of share capital increase (2,461) (2,461) (2,461)Other movements recorded in equity 979 (25,714) (24,735) 28 (24,707)Acquisition of non-controlling interests (755) (755) (45) (800)Reclassifications 931 (274) (657)Other movements (462) (462) 2 (460)Profit for the year 18,863 18,863 981 19,844At 31.12.2011 291,414 620,521 (371,598) 616 (46,212) (68,691) 18,863 444,913 6,913 451,826

96
Earnings per share
Basic earnings per share is calculated by dividing profit for the year attributable to owners of the parent by the weighted ave-rage number of ordinary shares outstanding during the year. The data used to calculate basic earnings per share were as follows.
31.12.2011 31.12.2010Weighted average number of ordinary shares in issue (number) 269,401,780 79,812,001Profit attributable to ordinary equity holders of the company (Euro thousands) 18,863 2,499Basic earnings per share (Euro per share) 0.070 0.031
31.12.2011 31.12.2010Weighted average number of ordinary shares in issue (number) 269,401,780 79,812,001Profit attributable to ordinary equity holders of the company (Euro thousands) 18,863 2,499Diluted earnings per share (Euro per share) 0.070 0.031
11 Provisions for other liabilities and charges
Change in Charges Credited Other ForeignAt scope of movements exchange At
(Euro thousands) 31.12.2010 consolidation differences 31.12.2011Provisions for pensions and similar obligationsOther provisions- litigation 386 250 (48) 588- investments- environmental 4,259 24,074 913 (33) 29,213- restructuring- sundry risks provision 1,337 2,868 (219) 10 3,996Total other provisions 5,982 27,192 (267) 913 (23) 33,797Total 5,982 27,192 (267) 913 (23) 33,797
All provisions are non-current.
The environmental provision comprises future obligations in relation to the decommissioning of power plants at the end of theiruseful life that are calculated based on independent expert valuations. The corresponding charges are not expensed in the inco-me statement but recorded as an increase in the book value of the asset to which the obligation relates.The provision also includes amounts provided to meet future commitments in relation to the redevelopment of landfills inaccordance with the obligations undertaken on receipt of authorisations from the relevant authorities. These are also based onestimates prepared by specialist enterprises.
The litigation provision has been recognised in order to cover probable liabilities that may arise on pending legal proceedings.
The sundry risks provision covers the possible costs arising on pending litigation with one of the shareholders of Palermo Ener-gia Ambiente ScpA, which was already included in the prior year financial statements and was increased by Euro 2,210 thou-sand to reflect Falck Renewables SpA’s commitment to provide financial support to Pea to settle a number of outstanding cre-ditors.

97
12 Staff leaving indemnity
ChangeAt Charges in scope Transfers Utilised or At
(Euro thousands) 31.12.2010 of consolid.n and reclass.ns paid 31.12.2011Managers 511 215 158 (223) 661White-collar staff 1,520 380 703 (230) 2,373Blue-collar staff 921 226 (285) (106) 756Total 2,952 821 576 (559) 3,790
The Trattamento di Fine Rapporto, “TFR” (staff leaving indemnity provision), was subjected to an actuarial valuation by an inde-pendent expert.
The actuarial financial assumptions utilised to calculate the estimated cost in 2011 are as follows:
(%) 31.12.2011 31.12.2010 ChangeAnnual discount rate 4.60% 4.60% 0.00%Annual inflation rate 2.00% 2.00% 0.00%Annual total pay increase rate 3.00% 3.00% 0.00%Annual TFR increase rate 3.00% 3.00% 0.00%
13 Financial liabilities
Financial liabilities at 31 December 2011 consisted of the following:
31.12.2011 31.12.2010 ChangeTotal Non- Current Total Non- Current Total Non- Current
(Euro thousands) current current currentDue to third parties 113,161 109,323 3,838 40,424 26,682 13,742 72,737 82,641 (9,904)Due to subsidiariesDue to associatesDue to parent company 161,152 161,152 (161,152) (161,152)Due to other group companies 312 312 (312) (312)Project financing 749,680 709,333 40,347 601,213 563,247 37,966 148,467 146,086 2,381Derivative financial instruments 60,913 60,913 28,817 28,817 32,096 32,096Total 923,754 879,569 44,185 831,918 618,746 213,172 91,836 260,823 (168,987)
Falck Renewables SpA entered into a loan agreement for Euro 165 million with a pool of leading banks on 14 January 2011.The transaction falls within the scope of the Consolidation Project and reorganisation of the Group companies, its purposebeing to fund development of the activities and investments envisaged in the business plan.The loan agreement provides for a term facility with a cap of Euro 70 million and a revolving facility totalling Euro 95 million.The loan, which was released on completion of the share capital increase, will mature on 30 June 2015. Approximately Euro 85million had been drawn down at 31 December 2011. The parent company has placed a pledge on the shares held in Falck Rene-wables Wind Ltd corresponding to a nominal value of Euro 37,755 thousand.The contract requires covenants to be met every six months commencing 30 June 2011. The covenants in place at 31 December2011 comprised Net Financial Debt over EBITDA and Net Financial Debt over Total Equity: all covenants were satisfied at 30June 2011 and 31 December 2011.
The amount due to the parent company Falck SpA, which amounted to Euro 161,152 thousand at 31 December 2010, wasrepaid in full following the share capital increase and receipt of the loan as detailed above. Liabilities supported by real guarantees include all project financing contracts, which are secured by pledges on the shares ofthe financed companies and the non-recourse borrowing of Frullo Energia Ambiente Srl, which is guaranteed by a mortgageand special privileges on the plant’s assets.
Amounts due to third parties represent borrowings raised by other Group companies and are further detailed in the additionaldisclosures on financial instruments together with project financing loans and derivative financial instruments.

98
In order to hedge the interest rate risk on project financing, the entities in question have entered into interest rate swap con-tracts (IRS) for the portion of the interest linked to project financing, with the purpose of rendering variable rates fixed at con-ditions that are substantially in line with market rates. Details of Falck Renewables Group’s outstanding IRSs at 31 December 2011 are disclosed in the note “Additional disclosures onfinancial instruments in accordance with IFRS7”.
The lending banks have imposed covenants on the above borrowings that the companies are obliged to meet for the entire con-tract period and are verified by the banks every six months. These checks did not identify any breach of the defined parameters.More specifically the project financing contracts require the Group companies to meet certain obligations and satisfy certainparameters including:
- The obligation to bind part of settled revenue to guarantee repayment of the outstanding debt on specific projects;
- The requirement to issue mortgages on properties or pledges on shares to the financial institutions that are party to the pro-jects;
- The satisfaction of certain debt service cover ratios between expected cash flows arising on the financed project over a cer-tain period and the interest and principal of the outstanding debt in the same period;
- The satisfaction of total equity/net financial debt ratios;
- The possibility of distributing dividends only where: i) established debt service cover ratios are met, and ii) on settlement ofoutstanding payments arising on the project financing contracts.
All project financing covenants were met at 31 December 2011.
14 Trade payables
Trade payables at 31 December 2011 compared to the previous year-end may be analysed as follows:
31.12.2011 31.12.2010 ChangeTotal Non- Current Total Non- Current Total Non- Current
(Euro thousands) current current currentTrade payables 59,082 59,082 79,327 79,327 (20,245) (20,245)Amounts due to subsidiariesAmounts due to associatesAmounts due to parent company 2,539 2,539 5,549 5,549 (3,010) (3,010)Amounts due to other Falck Group companies 495 495 21,831 21,831 (21,336) (21,336)Total 62,116 62,116 106,707 106,707 (44,591) (44,591)
Amounts due to the parent company Falck SpA largely relate to amounts due by Falck Renewables SpA for Euro 1,126 thou-sand, Tifeo Energia Ambiente ScpA for Euro 701 thousand and Platani Energia Ambiente ScpA for Euro 699 thousand.Amounts due to other Falck Group companies comprise the amount owed to the factoring company Riesfactoring SpA, a mem-ber of the Falck Group, which provided factoring services up to November 2011.

99
15 Other payables
Other payables at 31 December 2011 compared to 31 December 2010 consisted of the following:
31.12.2011 31.12.2010 ChangeTotal Non- Current Total Non- Current Total Non- Current
(Euro thousands) current current currentAmounts due to third party creditors 32,012 352 31,660 30,698 1,837 28,861 1,314 (1,485) 2,799Amounts due to subsidiariesAmounts due to associatesAmounts due to parent company 8,519 8,519 8,547 8,547 (28) (28)Amounts due to other Falck Group companies 7 7 (7) (7)Accruals and deferred income 3,010 3,010 3,134 3,134 (124) (124)Total 43,541 352 43,189 42,386 1,837 40,549 1,155 (1,485) 2,640
Third party creditors may be detailed as follows:
(Euro thousands) 31.12.2011 31.12.2010Amount due for acquisition of wind sector investments 1,233 5,026 Amounts due to Ministry of Economic Development 12,719 12,719 Tax payables 8,514 2,296 Wittholding taxes due 550 405 Advances 11 1 Environmental contribution 1,213 1,131 Other amounts due to employees 2,019 617 Amounts owed to the Province of Bologna 885 821 Holiday pay 1,139 682 Dividends to be distributed by Prima Srl 1,950 1,200 Social security payables 803 823 Amount due for acquisition of Solar Mesagne business 276 411 Property tax assessment due to municipality of Minervino Murge 604 Amounts due to GSE 498 Other 348 1,627 Total 31,660 28,861
The amounts due to the Ministry of Economic Development relate to the grant awarded pursuant to Law 488, which has beenrecorded in other payables awaiting final confirmation of the amount following which the balance will be deducted from thecost of the plant.
The amount due to the parent company relates to IRES (corporation tax) payable under the Group taxation regime with theparent company Falck SpA.
Commitments and contingencies
Guarantees issued at 31 December 2011 amounted to Euro 149,065 thousand. Guarantees relating to subsidiary undertakingsprincipally consist of performance bonds to guarantee completion of work in progress and to participate in tenders for con-tracts, for a total of Euro 68,251 thousand and guarantees issued to the VAT authorities in relation to requests for repayment ofVAT receivables for Euro 7,895 thousand. Also included are Euro 39,109 thousand of bank guarantees and other guarantees ofEuro 33,810 thousand.
Upon request of the liquidators of the Sicily Project companies Tifeo and Platani, Falck Renewables SpA has agreed to providethe financial support they need in order to settle third party debts excluding those with current and previous shareholders andpursue pending legal proceedings against the Sicily Region’s Department for Energy and Public Utilities.

100
Other risks
With regard to the price adjustment of Euro 20 million relating to the investment in Elettroambiente SpA and the correspon-ding decrease in Other payables due to Italgest Energia SpA recorded at the time of preparation of the 2009 financial state-ments, the Falck Renewables Group is exposed to a remote risk in respect of this amount with regard to the potential reinsta-tement of the contractual conditions on which the total acquisition price of Elettroambiente SpA was based, although this isconsidered improbable.
Related party transactions
In compliance with Consob’s circulars of 20 February 1997, 27 February 1998, 30 September 1998, 30 September 2002 and 27July 2006, no uncharacteristic or uncommon transactions take place with related parties that are outside the normal businessoperations or are detrimental to the Group’s results of operations, state of affairs and financial position.Related party transactions represent the day to day business activities that are carried out at arm’s length. These comprise therecharge of costs between Group companies and intercompany current accounts that give rise to finance income and costs. In accordance with IAS 24 Related Party Disclosures and the disclosures pursuant to Consob circular 6064293 of 28 July 2006,all related party transactions and the corresponding incidence on the Falck Renewables Group’s balance sheet headings areprovided below.
Trade receivables Trade payables(Euro thousands) 31.12.2011 31.12.2010 Change 31.12.2011 31.12.2010 ChangeParent companyFalck SpA 121 34 87 2,539 5,549 (3,010)Total parent company 121 34 87 2,539 5,549 (3,010)Other Group companiesFalck Financial Services Sa (in liquid.) 2 (2)Falck Energy SpA 60 60 812 (812)Sesto Siderservizi Srl 28 28Riesfactoring SpA 27 1 26 495 21,017 (20,522)Total other Group companies 115 1 114 495 21,831 (21,336)Total 236 35 201 3,034 27,380 (24,346)% incidence on balance sheet heading 0.2% 0.0% 4.9% 25.7%
Financial receivables Financial payables(Euro thousands) 31.12.2011 31.12.2010 Change 31.12.2011 31.12.2010 ChangeParent companyFalck SpA 161,152 (161,152)Total parent company 161,152 (161,152)AssociatesEolica Calabra Srl 14 13 1Parque Eolico La Carracha Sl 251 251Parque Eolico Plana de Jarreta Sl 483 483Total associates 748 747 1Other Group companiesRiesfactoring SpA 312 (312)Total other Group companies 312 (312)Total 748 747 1 161,464 (161,464)% incidence on balance sheet heading 100.0% 6.9% 75.7%
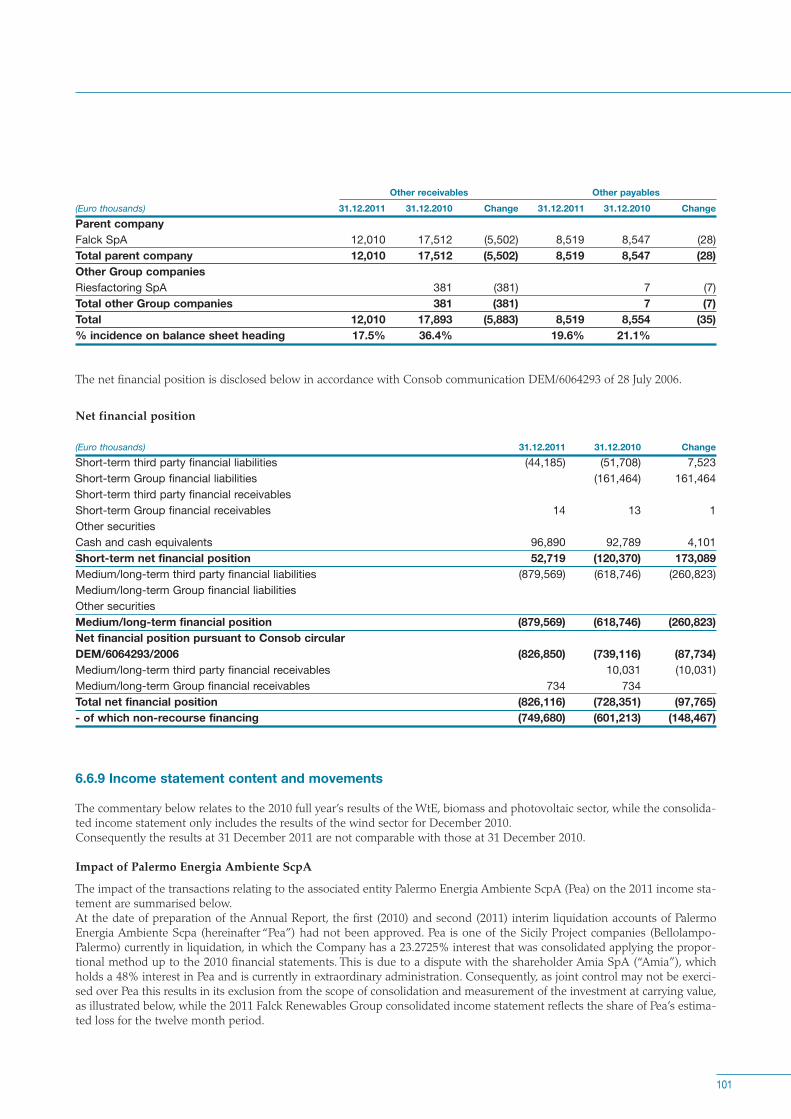
101
Other receivables Other payables(Euro thousands) 31.12.2011 31.12.2010 Change 31.12.2011 31.12.2010 ChangeParent companyFalck SpA 12,010 17,512 (5,502) 8,519 8,547 (28)Total parent company 12,010 17,512 (5,502) 8,519 8,547 (28)Other Group companiesRiesfactoring SpA 381 (381) 7 (7)Total other Group companies 381 (381) 7 (7)Total 12,010 17,893 (5,883) 8,519 8,554 (35)% incidence on balance sheet heading 17.5% 36.4% 19.6% 21.1%
The net financial position is disclosed below in accordance with Consob communication DEM/6064293 of 28 July 2006.
Net financial position
(Euro thousands) 31.12.2011 31.12.2010 ChangeShort-term third party financial liabilities (44,185) (51,708) 7,523Short-term Group financial liabilities (161,464) 161,464Short-term third party financial receivablesShort-term Group financial receivables 14 13 1Other securitiesCash and cash equivalents 96,890 92,789 4,101Short-term net financial position 52,719 (120,370) 173,089Medium/long-term third party financial liabilities (879,569) (618,746) (260,823)Medium/long-term Group financial liabilitiesOther securitiesMedium/long-term financial position (879,569) (618,746) (260,823)Net financial position pursuant to Consob circularDEM/6064293/2006 (826,850) (739,116) (87,734)Medium/long-term third party financial receivables 10,031 (10,031)Medium/long-term Group financial receivables 734 734Total net financial position (826,116) (728,351) (97,765)- of which non-recourse financing (749,680) (601,213) (148,467)
6.6.9 Income statement content and movements
The commentary below relates to the 2010 full year’s results of the WtE, biomass and photovoltaic sector, while the consolida-ted income statement only includes the results of the wind sector for December 2010.Consequently the results at 31 December 2011 are not comparable with those at 31 December 2010.
Impact of Palermo Energia Ambiente ScpA
The impact of the transactions relating to the associated entity Palermo Energia Ambiente ScpA (Pea) on the 2011 income sta-tement are summarised below. At the date of preparation of the Annual Report, the first (2010) and second (2011) interim liquidation accounts of PalermoEnergia Ambiente Scpa (hereinafter “Pea”) had not been approved. Pea is one of the Sicily Project companies (Bellolampo-Palermo) currently in liquidation, in which the Company has a 23.2725% interest that was consolidated applying the propor-tional method up to the 2010 financial statements. This is due to a dispute with the shareholder Amia SpA (“Amia”), whichholds a 48% interest in Pea and is currently in extraordinary administration. Consequently, as joint control may not be exerci-sed over Pea this results in its exclusion from the scope of consolidation and measurement of the investment at carrying value,as illustrated below, while the 2011 Falck Renewables Group consolidated income statement reflects the share of Pea’s estima-ted loss for the twelve month period.

102
In the event that an agreement cannot be reached with Amia regarding approval of Pea’s third liquidation accounts, it is highlylikely that the company will be dissolved pursuant to article 2490 of the Italian Civil Code. The above issues involving Pea donot apply to the other two Sicily Project companies, Tifeo and Platani (in which Falck Renewables SpA holds indirect interestsof 96.35% and 86.77% respectively through its subsidiary Elettroambiente SpA).
Furthermore, on 6 and 8 March 2012 respectively, the liquidators of Pea received notification of the bankruptcy proceedingsfiled by the Public Prosecutor with the Court of Palermo on 28 December 2011. The presiding judge scheduled a hearing for 28March 2012. Pea submitted a defence statement and documentation relevant to the proceedings. Following the above hearingthe presiding judge adjourned proceedings to 23 May 2012 in order to give the Public Prosecutor time to submit statements andPea time to reply.
In order to best represent Pea’s and its shareholders claims against the Sicily Regional Authorities, Falck Renewables SpA andFalck SpA, which together hold a 48% interest in Pea, signed an agreement with Pea whereby they agree to defer the receiva-bles (both trade and financial) to allow payment of other creditors and waive the same receivables in the event that followingliquidation Pea does not have sufficient financial resources to pay the amounts in full. Also under this agreement, the share-holders Falck Renewables SpA and Falck SpA undertake to provide Pea with the funds required to settle certain creditors. Aprovision of Euro 2,210 thousand was included in the sundry risks provision in the consolidated financial statements in orderto reflect this commitment. Pea’s other shareholders entered into separate agreements regarding the settlement of receivableswith Pea.
In light of this situation, which only involves Pea and in no way impacts on outstanding disputes between Tifeo and Platani andthe Sicily Regional Department as confirmed by its legal advisors, the Falck Renewables Group carried out a valuation of theamounts arising after deconsolidation of Pea that resulted in recognition of impairment losses, given the risk of dissolution ofthe company, against the carrying value of the investment in Pea and all receivables (trade and financial) due from it. Althoughthere has been no substantial change in the claims brought forward in the proceedings as no facts have emerged that wouldalter significantly the outcome of the proceedings, risks and uncertainties regarding the corporate governance of Pea exist thataffect the risk of recoverability of the impaired amounts.
As a consequence, the consolidated results reflect an impairment loss of Euro 110 thousand, net of the amount arising ondeconsolidation, recognised against the investment in Pea, an impairment loss of Euro 4,015 thousand against trade receivablesand an impairment loss recognised against financial receivables due to the Falck Renewables Group from Pea, net of capitali-sed interest reversed, of Euro 5,776 thousand and the abovementioned charge of Euro 2,210 thousand to the sundry risks pro-vision. The total impact on the consolidated income statement for the year is Euro 12,178 thousand, which is further detailedin the table below:
(Euro thousands) 31.12.2011Impairment loss recognised against trade receivable due from Pea (4,015)Charge to sundry risks provision as guarantee for Pea third party creditors (2,210)Administrative expenses (6,225)Impairment loss recognised against financial receivables due from Pea (6,022)Reversal of interest capitalised in Pea 246Finance costs - net (5,776)Impairment loss recognised against total carrying amount of interest in Pea (2,639)Reversal of goodwill in Pea following deconsolidation (651)Reversal of retained losses of Pea following deconsolidation 3,180Investment income (110)Reversal of deferred income tax asset on capitalised interest (67)Total income statement impact (12,178)
16 Revenue
Revenue consisted of the following:
(Euro thousands) 31.12.2011 31.12.2010 ChangeRevenue from sale of goods 208,759 62,563 146,196Revenue from sale of services 39,891 36,633 3,258Total 248,650 99,196 149,454

103
Revenue arising from the sale of goods, compared to the previous year, may be attributed to the following business segments:
(Euro thousands) 31.12.2011 31.12.2010 ChangeSale of electrical energy 208,069 61,712 146,357Sale of thermal energy 690 476 214Sale of agricultural produce 375 (375)Total 208,759 62,563 146,196
Revenue arising on the provision of services, compared to 2010, is attributable to the following business segments:
(Euro thousands) 31.12.2011 31.12.2010 ChangeWaste treatment and disposal 33,339 31,735 1,604Operation and maintenance 3,651 4,898 (1,247)Other operating income 2,901 2,901Total 39,891 36,633 3,258
Revenue analysed by geographical location is as follows:
Italy Euro 157,941 thousandGreat Britain Euro 80,540 thousandFrance Euro 4,879 thousandSpain Euro 5,290 thousand
17 Employee costs
Employee costs may be analysed as follows:
(Euro thousands) 31.12.2011 31.12.2010 ChangeCost of production employees 8,100 7,657 443Cost of administrative staff 12,983 5,356 7,627Total 21,083 13,013 8,070
Employee costs increased by Euro 8,070 thousand as a result of the increase in employee numbers following acquisition of twobusinesses.
Total employee costs analysed by nature of expense are as follows:
(Euro thousands) 31.12.2011 31.12.2010 ChangeWages and salaries 15,321 8,445 6,876Social security costs 4,693 2,710 1,983Staff leaving indemnity (TFR) 821 567 254Other costs 248 1,291 (1,043)Total 21,083 13,013 8,070
The average number of employees was as follows:
(Number) 31.12.2011 31.12.2010Managers 25 15White-collar staff 140 79Blue-collar staff 76 71Total average number of employees 241 165
The above totals include the 49% share of the employees of Frullo Energia Ambiente Srl, consolidated applying the proportio-nal method, which amount to 19 white-collar staff and 28 blue-collar staff.

104
18 Direct costs
An analysis of direct costs is provided without comments as they are not comparable with the amounts at 31 December 2010:
(Euro thousands) 31.12.2011 31.12.2010 ChangeMaterials 15,411 6,427 8,984Services 36,183 18,768 17,415Other costs 18,712 10,716 7,996Change in inventories (535) 655 (1,190)Charges to/(utilisation of) operating provisions 425 (106) 531Amortisation and impairment of intangibles 6,674 5,640 1,034Depreciation and impairment of property, plant and equipment 46,625 12,465 34,160Employee costs capitalised on assets under construction (1,007) (283) (724)Total 122,488 54,282 68,206
Amortisation and impairment of intangibles comprises the impairment losses recognised following the impairment test per-formed on the goodwill of Prima Srl (Euro 3,136 thousand in 2011 and Euro 4,797 thousand in 2010), on the goodwill and capi-talised development costs of Eolica Petralia Srl (Euro 2,568 thousand).
19 Other income
Other income consisted of the following:
(Euro thousands) 31.12.2011 31.12.2010 ChangeIncome from operating activities 483 701 (218)Income from non-operating activities 1,179 826 353Total 1,662 1,527 135Income from operating activities may be further detailed as follows:
(Euro thousands) 31.12.2011 31.12.2010 ChangeIncome from services attributable to non-controlling interest in companies consolidated applying the proportional method 345 558 (213)Revenue grants 94 (94)Other 138 49 89Total 483 701 (218)Income from non-operating activities may be further detailed as follows:
(Euro thousands) 31.12.2011 31.12.2010 ChangeIncome relating to other accounting periods 353 444 (91)Gains on disposal of property, plant and equipment 17 161 (144)Insurance compensation 718 4 714Other 91 217 (126)Total 1,179 826 353

105
20 Administrative expenses
An analysis only of administrative expenses is provided without comments as they are not comparable with the amounts at 31December 2010:
(Euro thousands) 31.12.2011 31.12.2010 ChangeConsumables 1,124 385 739Services 11,742 8,898 2,844Other costs 5,992 2,647 3,345Non-operating expenses 4,982 638 4,344Amortisation and impairment of intangible assets 410 28 382Depreciation and impairment of property, plant and eq.pt 407 73 334Charges to/(utilisation of) provisions 2,851 1,103 1,748Total 27,508 13,772 13,736
Administrative expenses comprise the impairment loss recognised against trade receivables due from Palermo Energia Ambien-te (Euro 4,015 thousand) that is classified in non-operating expenses and the charge to the sundry risks provision (Euro 2,210thousand) reflecting Falck Renewables SpA’s commitment to provide financial support to Pea in order to settle certain credi-tors.
21 Finance costs - net
Finance income and costs may be analysed as follows:
(Euro thousands) 31.12.2011 31.12.2010 ChangeFinance costs (53,733) (7,070) (46,663)Foreign exchange losses (32,918) (3,073) (29,845)Finance income 2,009 2,464 (455)Foreign exchange gains 32,204 2,638 29,566Borrowing costs capitalised on assets under construction 9,756 1,030 8,726Total (42,682) (4,011) (38,671)
Finance costs consisted of the following:
(Euro thousands) 31.12.2011 31.12.2010 ChangePayable to parent company 1,690 145 1,545Payable to other Falck Group companies 17 682 (665)Payable to others 84,944 9,316 75,628Total 86,651 10,143 76,508
Finance costs payable to other Falck Group companies represent amounts due to Riesfactoring SpA. Amounts payable to others comprises the impairment loss of Euro 5,776 thousand recognised against the financial receivablesdue from Palermo Energia Ambiente net of Pea’s capitalised interest costs.Other finance costs also comprise foreign exchange losses of Euro 32,918 thousand.
Finance costs for 2011 and 2010 may be further analysed as follows:
31.12.2011Debenture Bank Others Total
(Euro thousands) loans loansPayable to parent company 1,690 1,690Payable to other Falck Group companies 17 17Payable to others 56,314 28,630 84,944Total 56,314 30,337 86,651

106
31.12.2010Debenture Bank Others Total
(Euro thousands) loans loansPayable to parent company 145 145Payable to other Falck Group companies 682 682Payable to others 9,316 9,316Total 9,316 827 10,143
Finance income for 2011 and 2010 may be further analysed as follows:
(Euro thousands) 31.12.2011 31.12.2010 ChangeInterest and commission - parent company 1,733 (1,733)Interest and commission - associates 172 196 (24)Interest and commission - banks 26,710 3,039 23,671Other 7,331 134 7,197Total 34,213 5,102 29,111
Bank interest and commission and Other finance income comprise Euro 25,275 thousand and Euro 6,929 thousand of foreignexchange gains respectively.
22 Investment income
Investment income comprises the amount arising from accounting for associates under the equity method that gave rise to Euro811 thousand of income attributable to:
Parque Eolico La Carracha Sl Euro 443 thousandParque Eolico Plana de Jarreta Sl Euro 368 thousand.
This also includes income arising on the reversal of Pea’s retained losses of Euro 3,180 thousand following its deconsolidation,net of the reversal of goodwill of Euro 651 thousand in the consolidated financial statements.Investment costs comprise the impairment losses recognised against the interest in the associated entities Palermo EnergiaAmbiente (Euro 2,639 thousand) and Eolica Calabra (Euro 2 thousand).
23 Income tax expense
(Euro thousands) 31.12.2011 31.12.2010 ChangeCurrent tax 19,504 9,641 9,863Deferred income tax (2,097) 1,706 (3,803)Total 17,407 11,347 6,060
Current taxes are based on the estimated taxable income for the period calculated in accordance with current tax legislation.Total taxes differ from the theoretical amount that results from applying the tax rate to the Group’s consolidated profit. The 2010 income tax expense included the benefit from tax reliefs pursuant to the Tremonti-ter law that were applicable to cer-tain categories of companies that operated in specific industries. Electricity producers with more than Euro 10 million of revenue and Euro 1 million of taxable income are subject to additionalIRES (corporation tax) of 10.5% for 2011-2013, following which the additional tax will fall to 6.5%. The Group companies affec-ted by the additional tax in 2011 were: Prima Srl, Frullo Energia Ambiente Srl, Eolica Sud Srl and Eolo 3W Minervino MurgeSrl. Moreover, the tax effect of the UK subsidiaries resulted in a Euro 4.6 million reduction in the total tax charge, principally due toa decrease in the tax rate (28% to 26.5%) and certain prior year costs (2008 and 2009) now being treated as deductions for taxpurposes.
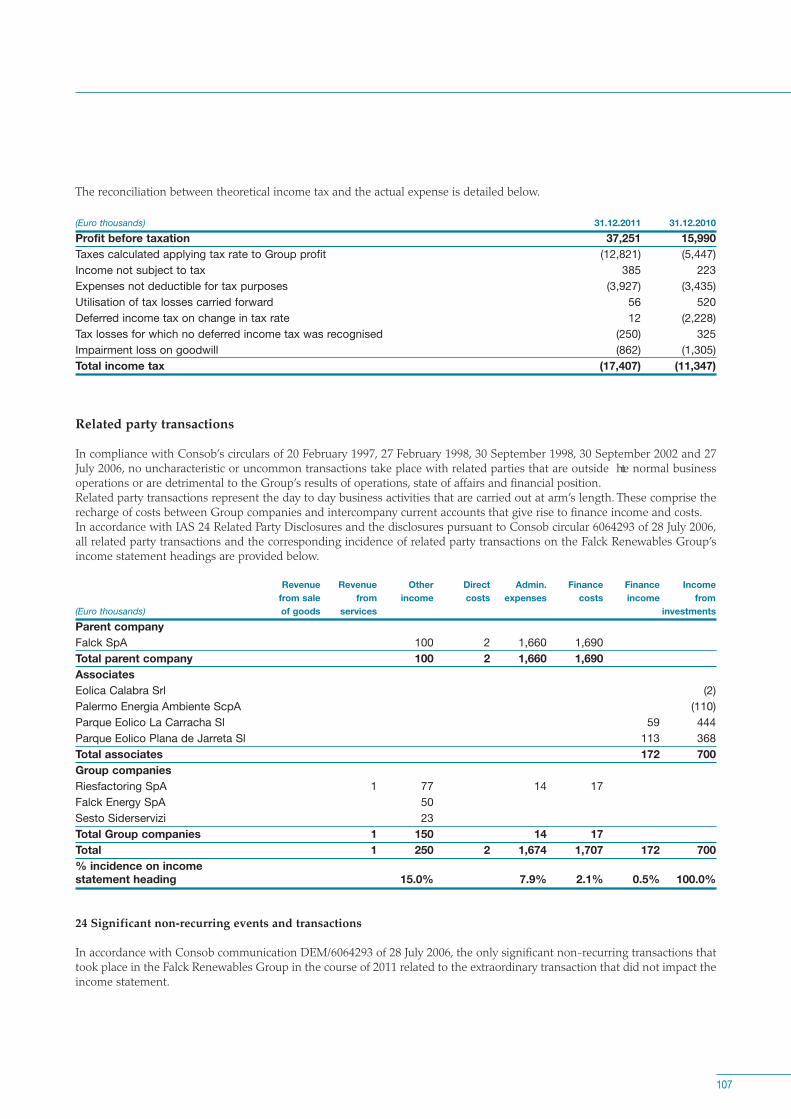
107
The reconciliation between theoretical income tax and the actual expense is detailed below.
(Euro thousands) 31.12.2011 31.12.2010Profit before taxation 37,251 15,990Taxes calculated applying tax rate to Group profit (12,821) (5,447)Income not subject to tax 385 223Expenses not deductible for tax purposes (3,927) (3,435)Utilisation of tax losses carried forward 56 520Deferred income tax on change in tax rate 12 (2,228)Tax losses for which no deferred income tax was recognised (250) 325Impairment loss on goodwill (862) (1,305)Total income tax (17,407) (11,347)
Related party transactions
In compliance with Consob’s circulars of 20 February 1997, 27 February 1998, 30 September 1998, 30 September 2002 and 27July 2006, no uncharacteristic or uncommon transactions take place with related parties that are outside the normal businessoperations or are detrimental to the Group’s results of operations, state of affairs and financial position.Related party transactions represent the day to day business activities that are carried out at arm’s length. These comprise therecharge of costs between Group companies and intercompany current accounts that give rise to finance income and costs. In accordance with IAS 24 Related Party Disclosures and the disclosures pursuant to Consob circular 6064293 of 28 July 2006,all related party transactions and the corresponding incidence of related party transactions on the Falck Renewables Group’sincome statement headings are provided below.
Revenue Revenue Other Direct Admin. Finance Finance Incomefrom sale from income costs expenses costs income from
(Euro thousands) of goods services investmentsParent companyFalck SpA 100 2 1,660 1,690Total parent company 100 2 1,660 1,690AssociatesEolica Calabra Srl (2)Palermo Energia Ambiente ScpA (110)Parque Eolico La Carracha Sl 59 444Parque Eolico Plana de Jarreta Sl 113 368Total associates 172 700Group companiesRiesfactoring SpA 1 77 14 17Falck Energy SpA 50Sesto Siderservizi 23Total Group companies 1 150 14 17Total 1 250 2 1,674 1,707 172 700% incidence on income statement heading 15.0% 7.9% 2.1% 0.5% 100.0%
24 Significant non-recurring events and transactions
In accordance with Consob communication DEM/6064293 of 28 July 2006, the only significant non-recurring transactions thattook place in the Falck Renewables Group in the course of 2011 related to the extraordinary transaction that did not impact theincome statement.

108
25 Uncharacteristic and uncommon transactions
In accordance with Consob communication DEM/6064293 of 28 July 2006, in the course of 2011 the Falck Renewables Groupdid not carry out any uncharacteristic and/or uncommon transactions, as defined in the above communication.
26 Auditors’ remuneration
Company Audit of Other activities(Euro thousands) annual and interim reportFalck Renewables SpA 80 14WtE, biomass and photovoltaic sector 181Wind sector 347Total 608 14
All companies are audited by Reconta Ernst & Young with the exception of the Italian wind sector companies ElettroambienteSpA, Platani Energia Ambiente ScpA, Tifeo Energia Ambiente ScpA and Palermo Energia Ambiente ScpA that are audited byPricewaterhouseCoopers.
Other activities relate to the certification of covenants.

6.7 Additional disclosures on financial instruments in accordance with IFRS7
This note sets out the additional disclosures relating to financial assets and liabilities in accordance with IFRS 7. This disclosu-re respects the order of the IFRS. Where the information requested was not considered significant the related paragraph wasomitted. The note is presented in two sections. The first sets out detailed information regarding financial assets and liabilities, in parti-cular regarding their classification in compliance with IAS 39, the impact on the income statement for the year and their fairvalue. The second section presents information regarding the risks attributable to the financial assets and liabilities, in particu-lar credit risk, liquidity risk and market risk. This includes both qualitative and quantitative information that is analysed intopoints (e.g. 1.) and sub-points (e.g. 1.2). The detailed quantitative information is provided for 31 December 2011 and wheresignificant at 31 December 2010.
Prior to presenting the detailed disclosures, a summary of the principal disclosures is provided as follows.
The Falck Renewables Group holds significant financial liabilities in the form of third party borrowings in particular in relationto project financing, resulting in an overall net indebtedness. Financial assets and liabilities are almost entirely measured at costand amortised cost in the financial statements, with the exception of certain derivative instruments on interest rates that aremeasured at fair value. A number of these transactions, although undertaken to hedge exposure, are not measured in accor-dance with hedge accounting, while the majority are measured applying hedge accounting with changes in fair value recordedin equity. The main impact of the derivative instruments on the income statement does not arise from changes in the value ofthe principal financial assets and liabilities recorded on the balance sheet, but from the interest income and expense and thechanges in value of the derivative financial instruments not measured applying hedge accounting.
Credit risk is not considered to be significant: the high concentration of trade receivables due from a few counterparties isstrongly mitigated by the corresponding credit rating. Liquidity risk is moderate as trade payables due within one year are offset by significant cash reserves, while the most signifi-cant borrowings relate to long-term project financing contracts.The Group also has committed credit facilities relating to the finance contract stipulated on 14.1.2011 that are only partiallydrawn down.The only market risk considered to be significant is interest rate risk as almost all Group borrowings are at variable rates,although the risk is mitigated by IRS contracts.
The Falck Renewables Group adopts well-established internal procedures in the management of credit, liquidity and marketrisks on financial assets and liabilities, which are documented in the Group’s policies and procedures.
Section I: Supplementary disclosures on financial assets/liabilities
1. Balance sheet
1.1 Categories of financial assets and liabilities
The tables below illustrate the carrying values at 31 December 2011 and 31 December 2010 of the financial assets and liabili-ties classified in accordance with IAS 39.In order to reconcile with the balance sheet totals the penultimate column sets out the values of the assets and liabilities thatare not included in the scope of IFRS 7.
At 31 December 2011 the total financial assets of the Falck Renewables Group amounted to Euro 202,961 thousand and finan-cial liabilities totalled Euro 1,001,109 thousand, compared to a total balance sheet value of Euro 1,533,814 thousand. The finan-cial assets and liabilities are almost entirely measured at cost and amortised cost. The principal financial assets comprise tradereceivables and cash and cash equivalents, while the main financial liabilities relate to borrowings and trade payables. Thefinancial impact of financial assets and liabilities measured at fair value through profit or loss or equity is not significant andconsists of derivative financial instruments.
109
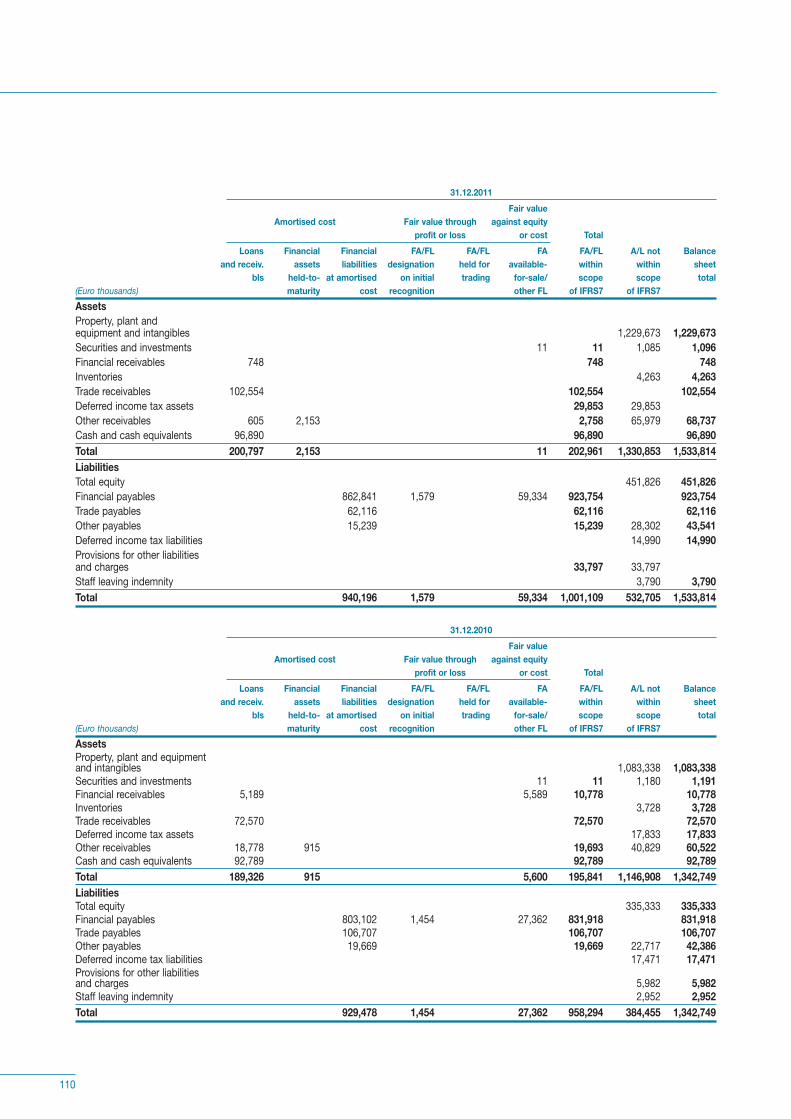
31.12.2011Fair value
Amortised cost Fair value through against equityprofit or loss or cost Total
Loans Financial Financial FA/FL FA/FL FA FA/FL A/L not Balanceand receiv. assets liabilities designation held for available- within within sheet
bls held-to- at amortised on initial trading for-sale/ scope scope total(Euro thousands) maturity cost recognition other FL of IFRS7 of IFRS7AssetsProperty, plant and equipment and intangibles 1,229,673 1,229,673Securities and investments 11 11 1,085 1,096Financial receivables 748 748 748Inventories 4,263 4,263Trade receivables 102,554 102,554 102,554Deferred income tax assets 29,853 29,853Other receivables 605 2,153 2,758 65,979 68,737Cash and cash equivalents 96,890 96,890 96,890Total 200,797 2,153 11 202,961 1,330,853 1,533,814LiabilitiesTotal equity 451,826 451,826Financial payables 862,841 1,579 59,334 923,754 923,754Trade payables 62,116 62,116 62,116Other payables 15,239 15,239 28,302 43,541Deferred income tax liabilities 14,990 14,990Provisions for other liabilities and charges 33,797 33,797Staff leaving indemnity 3,790 3,790Total 940,196 1,579 59,334 1,001,109 532,705 1,533,814
31.12.2010Fair value
Amortised cost Fair value through against equityprofit or loss or cost Total
Loans Financial Financial FA/FL FA/FL FA FA/FL A/L not Balanceand receiv. assets liabilities designation held for available- within within sheet
bls held-to- at amortised on initial trading for-sale/ scope scope total(Euro thousands) maturity cost recognition other FL of IFRS7 of IFRS7AssetsProperty, plant and equipment and intangibles 1,083,338 1,083,338Securities and investments 11 11 1,180 1,191Financial receivables 5,189 5,589 10,778 10,778Inventories 3,728 3,728Trade receivables 72,570 72,570 72,570Deferred income tax assets 17,833 17,833Other receivables 18,778 915 19,693 40,829 60,522Cash and cash equivalents 92,789 92,789 92,789Total 189,326 915 5,600 195,841 1,146,908 1,342,749LiabilitiesTotal equity 335,333 335,333Financial payables 803,102 1,454 27,362 831,918 831,918Trade payables 106,707 106,707 106,707Other payables 19,669 19,669 22,717 42,386Deferred income tax liabilities 17,471 17,471Provisions for other liabilities and charges 5,982 5,982Staff leaving indemnity 2,952 2,952Total 929,478 1,454 27,362 958,294 384,455 1,342,749
110

1.2 Collateral – financial assets pledged as security for liabilities and collateral accepted as security for assets
Financial assets pledged as security for liabilities comprise the shares of the companies listed in the table below. The principalterms of the pledge contracts do not enable the third party to sell the pledged shares as these companies do not have an acti-ve market.
Currency Pledged amountActelios Solar Srl Euro 120,000Ben Aketil Wind Energy Ltd GBP 100Boyndie Wind Energy Ltd GBP 100Cambrian Wind Energy Ltd GBP 100Earlsburn Wind Energy Ltd GBP 100Eolica Cabezo San Roque Sa Euro 1,432,650Eolica Sud Srl Euro 5,000,000Eolo 3w Minervino Murge Srl Euro 10,000Esquennois Energie Sas Euro 37,000Falck Renewables Finance Ltd GBP 100Falck Renewables UK Holdings (No.1) Ltd GBP 1Falck Renewables Wind GBP 37,754,814Geopower Sardegna Srl Euro 2,000,000Kilbraur Wind Energy Ltd GBP 100Millennium Wind Energy Ltd GBP 100Parc Eolien des Crêtes Sas Euro 37,000Parc Eolien du Fouy Sas Euro 37,000Parque Elico Plana de Jarreta Sl Euro 100,000Parque Eolico La Carracha Sl Euro 100,000Prima Srl Euro 4,615,500
2. Income statement and net equity
2.1 Impact of financial assets and liabilities on the income statement and net equity
The table below illustrates the net gains or losses generated in 2011 and 2010 from the financial assets/liabilities reclassifiedaccording to IAS 39.The only amount relates to the increase in value of derivative financial instruments.
31.12.2011Gains/(losses) Gains/(losses) Gains/(losses) through profit reversed from equity recorded
(Euro thousands) or loss to profit or loss against equity TotalFA at fair value through profit or loss 174 174FA held for tradingFL at fair value through profit or loss (299) (299)FL held for tradingAvailable-for-sale FA/other FL (37,039) (37,039)FA held-to-maturityLoans and receivablesFL at amortised costTotal (125) (37,039) (37,164)
111

31.12.2010Gains/(losses) Gains/(losses) Gains/(losses) through profit reversed from equity recorded
(Euro thousands) or loss to profit or loss against equity TotalFA at fair value through profit or loss 325 325FA held for hadingFL at fair value through profit or lossFL held for hadingavailable-for-sale FA 13,205 13,205FA held-to-maturityLoans and receivablesFL at amortised costTotal 325 13,205 13,530
The amount of Euro 125 thousand represents the total change in fair value of the contracts entered into to hedge interest raterisk that are not accounted for under hedge accounting, while the change of Euro 37,039 thousand relates to the change in fairvalue of derivative financial instruments measured applying hedge accounting.
The table below illustrates total interest income/expense (calculated using the effective interest rate method) and the fee inco-me/expense generated by financial assets/liabilities not measured at fair value through profit or loss and the fee income/expen-se arising from trust and other fiduciary activities in 2011 and 2010.
31.12.2011(Euro thousands) Interest income (expense) Fee income (expense) TotalFA not at fair value through profit or loss 1,830 1,830FL not at fair value through profit or loss (45,977) (1,435) (47,412)Trust and other fiduciary activitiesOther (not within scope of IFRS7) 3,025 3,025Total (41,122) (1,435) (42,557)
31.12.2010(Euro thousands) Interest income (expense) Fee income (expense) TotalFA not at fair value through profit or loss 2,065 2,065FL not at fair value through profit or loss (6,889) (6,889)Trust and other fiduciary activities (108) (108)Other (not within scope of IFRS7) 596 596Total (4,228) (108) (4,336)
The reconciliations of the above amounts with net finance costs recorded in the 2011 and 2010 income statements are as fol-lows.
(Euro thousands) 31.12.2011Gains/losses through profit or loss (125)Total interest income/expense (41,122)Fee income/expense (1,435)Total (42,682)Net finance costs per income statement (42,682)
(Euro thousands) 31.12.2010Gains/losses through profit or loss 325Total interest income/expense (4,228)Fee income/expense (108)Total (4,011)Net finance costs per income statement (4,011)
112

2.2 Provision for doubtful accounts
Total charges of Euro 4,450 thousand were made in 2011 in respect of Falck Renewables’ trade receivables due from PalermoEnergia Ambiente ScpA (Euro 3,021 thousand) and Elettroambiente SpA (Euro 994 thousand) and against the trade receivablesof Esposito Servizi Ecologici Srl, Frullo Energia Ambiente Srl and Falck Renewables Wind Ltd for a total Euro 435 thousandgross of Euro 10 thousand utilised by Esposito Servizi Ecologici Srl.
3 Further additional disclosures
3.1 Accounting policies
The accounting policies adopted for the recognition and measurement of financial assets and liabilities are presented in thenotes to the consolidated financial statements in paragraph 6.6.4 Accounting policies.
3.2 Fair value
The tables below disclose the fair value of the financial assets/liabilities and the related carrying amount at 31 December 2011and 31 December 2010. The carrying amount of the financial assets/liabilities valued at cost and amortised cost (see point 1.1)is a reasonable estimate of fair value as these relate to either short-term or variable rate financial assets and liabilities ormedium/long-term financial liabilities that, based on sample calculations, did not give rise to significant differences.The fair value of derivative financial instruments at the balance sheet date is equal to the discounted future cash flows giventhe Euro curve at 31 December and its related forward rates.
31.12.2011(Euro thousands) Carrying amount Fair valueFinancial assetsSecurities and investments 11 11 Financial receivables 748 748 Trade receivables 102,554 102,554 Other receivables 2,758 2,758 Cash and cash equivalents 96,890 96,890 Total 202,961 202,961 Financial liabilitiesFinancial payables 923,754 923,754 Trade payables 62,116 62,116 Other payables 15,239 15,239 Total 1,001,109 1,001,109
31.12.2010(Euro thousands) Carrying amount Fair valueFinancial assetsSecurities and investments 11 11 Financial receivables 10,778 10,778 Trade receivables 72,570 72,570 Other receivables 19,693 19,693 Cash and cash equivalents 92,789 92,789 Total 195,841 195,841 Financial liabilitiesFinancial payables 831,918 831,918 Trade payables 106,707 106,707 Other payables 19,669 19,669 Total 958,294 958,294
113

Analysis of financial liabilities at 31 December 2011 and 31 December 2010 by instrument and conditions.
31.12.2011Interest rate Fair Carrying Current Non-current
(Euro thousands) (%) value amount portion portionLoan to finance revamp of Rende plant - Banca Popolare di Sondrio -Ecosesto SpA Euribor 3 m + spread 12,600 12,600 1,575 11,025Banca Popolare Sondrio mortgage - Ecosesto SpA Euribor 3 m + spread 3,765 3,765 1,326 2,439Shareholders' loan - Prima Srl Euribor 3 m + spread 1,118 1,118 1,118Sicily Projects' loan Euribor 3 m + spread 1,288 1,288 1,288Other bank borrowings Falck Renewables SpA Euribor 3 m + spread 84,679 84,679 121 84,558Bank overdrafts - Falck Renewables Wind group Libor + spread 388 388 388Other borrowings - Falck Renewables Wind group Variable 428 428 428Payables for royalty instruments Euribor 3 m + spread 8,895 8,895 8,895Total borrowings 113,161 113,161 3,838 109,323M/L-term loan Frullo Energia Ambiente Srl Euribor 6 m + spread 26,814 26,814 1,960 24,854Project financing Prima Srl Euribor 6 m + spread 9,001 9,001 4,687 4,314Project financing Actelios Solar Srl Euribor 6 m + spread 41,982 41,982 1,869 40,113Project financing Millennium WE Ltd Libor 3 m + spread 63,169 63,169 2,618 60,551Project financing Kilbraur WE Ltd Libor 3 m + spread 68,420 68,420 3,710 64,710Project financing Ben Aketil WE Ltd Libor 3 m + spread 27,983 27,983 1,782 26,201Project financing Earlsburn WE Ltd Libor 3 m + spread 31,274 31,274 1,981 29,293Project financing Boyndie WE Ltd Libor 3 m + spread 4,097 4,097 835 3,262Project financing Cambrian WE Ltd Libor 3 m + spread 32,868 32,868 4,238 28,630Project financing Falck Renewables Finance Ltd Libor 3 m + spread 1,350 1,350 1,350Project financing Eolica Cabezo San Roque Sa Euribor + spread 9,954 9,954 1,124 8,830Project financing Eolo 3W Minervino Murge Srl Euribor + spread 79,233 79,233 4,572 74,661Project financing Parc Eolien des Crêtes Sas Euribor + spread 10,384 10,384 445 9,939Project financing Par Eolien des Fouy Sas Euribor + spread 9,998 9,998 429 9,569Project financing Esquennois Energie Sas Euribor + spread 12,894 12,894 552 12,342Project financing Eolica Sud Srl Euribor + spread 136,699 136,699 5,282 131,417Project financing Geopower Sardegna Srl Euribor + spread 183,560 183,560 2,913 180,647Total borrowings under project financing 749,680 749,680 40,347 709,333IRS Prima Srl 154 154 154IRS Frullo Energia Ambiente Srl 1,425 1,425 1,425IRS Actelios Solar SpA 1,642 1,642 1,642IRS Falck Renewables SpA 1,190 1,190 1,190IRS Cambrian WE Ltd 3,363 3,363 3,363IRS Kilbraur WE Ltd 6,172 6,172 6,172IRS Millennium WE Ltd 7,459 7,459 7,459IRS Ben Aketil WE Ltd 5,247 5,247 5,247IRS Boyndie WE Ltd 286 286 286IRS Earlsburn WE Ltd 3,070 3,070 3,070IRS Eolo 3W Minervino Murge Srl 6,799 6,799 6,799IRS Eolica Cabezo San Roque Sa 1,145 1,145 1,145IRS Parc Eolien des Crêtes Sas 1,020 1,020 1,020IRS Esquennois Energie Sas 1,228 1,228 1,228IRS Parc Eolien du Fouy Sas 983 983 983IRS Eolica Sud Srl 9,375 9,375 9,375IRS Geopower Sardegna Srl 10,355 10,355 10,355Total derivative financial instruments 60,913 60,913 60,913Total financial liabilities 923,754 923,754 44,185 879,569
114

31.12.2010Interest rate Fair Carrying Current Non-current
(Euro thousands) (%) value amount portion portionLoan to finance revamp of Rende plant - Banca Popolare di Sondrio -Ecosesto SpA Euribor 3 m + spread 12,600 12,600 12,600Banca Popolare Sondrio mortgage - Ecosesto SpA Euribor 3 m + spread 5,044 5,044 1,279 3,765Shareholders' loan - Prima Srl Euribor 3 m + spread 1,118 1,118 1,118Sicily Project companies loan Euribor 3 m + spread 3,708 3,708 1,288 2,420Correspondence account with Falck SpA Average for month
of quarterly Euribor 159,699 159,699 159,699Loan to Pea - Falck SpA Average for month
of quarterly Euribor 1,453 1,453 1,453Bank overdrafts - Falk Renewables Wind group Libor + spread 9,438 9,438 9,438Other borrowings - Falck Renewables Wind group Variable 7,998 7,998 1,219 6,779Other amounts due to Riesfactoring SpA Euribor 3 m + spread 312 312 312Other third party loans Euribor 3 m + spread 518 518 518Total borrowings 201,888 201,888 175,206 26,682M/L-term loan Frullo Energia Ambiente Srl Euribor 6 m + spread 31,377 31,377 4,704 26,673Project financing Prima Srl Euribor 6 m + spread 17,198 17,198 8,437 8,761Project financing Actelios Solar Srl Euribor 6 m + spread 8,926 8,926 1,205 7,721Project financing Millennium WE Ltd Libor 3 m + spread 56,525 56,525 3,223 53,302Project financing Kilbraur WE Ltd Libor 3 m + spread 42,549 42,549 2,750 39,799Project financing Ben Aketil WE Ltd Libor 3 m + spread 28,782 28,782 1,659 27,123Project financing Earlsburn WE Ltd Libor 3 m + spread 31,727 31,727 1,752 29,975Project financing Boyndie WE Ltd Libor 3 m + spread 4,730 4,730 756 3,974Project financing Cambrian WE Ltd Libor 3 m + spread 35,531 35,531 3,536 31,995Project financing Falck Renewables Finance Ltd Libor 3 m + spread 3,306 3,306 2,295 1,011Project financing Eolica Cabezo San Roque Sa Euribor + spread 10,976 10,976 1,040 9,936Project financing Eolo 3W Minervino Murge Srl Euribor + spread 86,383 86,383 3,927 82,456Project financing Parc Eolien des Crêtes Sas Euribor + spread 10,759 10,759 382 10,377Project financing Par Eolien des Fouy Sas Euribor + spread 10,358 10,358 367 9,991Project financing Esquennois Energie Sas Euribor + spread 13,362 13,362 474 12,888Project financing Eolica Sud Srl Euribor + spread 147,359 147,359 1,459 145,900Project financing Geopower Sardegna Srl Euribor + spread 61,365 61,365 61,365Total borrowings under project financing 601,213 601,213 37,966 563,247IRS Prima Srl 328 328 328IRS Frullo Energia Ambiente Srl 1,126 1,126 1,126IRS Cambrian WE Ltd 2,808 2,808 2,808IRS Kilbraur WE Ltd 3,941 3,941 3,941IRS Millennium WE Ltd 5,745 5,745 5,745IRS Ben Aketil WE Ltd 3,151 3,151 3,151IRS Boyndie WE Ltd 286 286 286IRS Earlsburn WE Ltd 2,459 2,459 2,459IRS Eolo 3W Minervino Murge Srl 3,489 3,489 3,489IRS Eolica Cabezo San Roque Sa 1,020 1,020 1,020IRS Parc Eolien des Crêtes Sas 514 514 514IRS Esquennois Energie Sas 598 598 598IRS Parc Eolien du Fouy Sas 495 495 495IRS Eolica Sud Srl 2,857 2,857 2,857Total derivative financial instruments 28,817 28,817 28,817Total financial liabilities 831,918 831,918 213,172 618,746
115

Analysis of financial receivables at 31 December 2011 and 31 December 2010 by instrument and conditions.
31.12.2011Interest rate Fair Carrying Current Non-current
(Euro thousands) (%) value amount portion portionAmounts due from associates (La Carracha, Plana de Jarreta, Eolica Calabra wind farms) Variable 748 748 14 734Total financial receivables 748 748 14 734
31.12.2010Interest rate Fair Carrying Current Non-current
(Euro thousands) (%) value amount portion portionPalermo Energia Ambiente ScpA Euribor + spread 4,442 4,442 4,442Amounts due from associates (La Carracha, Plana de Jarreta, Eolica Calabra wind farms) Variable 747 747 13 734IRS Actelios Solar Srl 1,261 1,261 1,261IRS Geopower Sardegna Srl 4,328 4,328 4,328Total receivables 10,778 10,778 13 10,765
Section II: Risks arising from financial instruments
1. Credit risk
1.1 Qualitative disclosures
Credit risk represents both potential losses from non-settlement of receivables and the counterparty risk linked with the nego-tiation of other financial activities. The credit risk exposure of the Falck Renewables Group is very limited in respect of bothcommercial customers and financial counterparties. Firstly due to the nature of the commercial customers: one third of amountsdue from third parties (not related parties) is owed by the Italian national electrical energy supplier (GSE). The degree of con-centration of customers is medium-high, however they have a high credit rating. The credit risk attributable to the counterpar-ties with which the derivative financial instruments are negotiated is also limited as the derivatives are negotiated with leadingfinancial institutions. A summary quantitative indication of the maximum exposure to credit risk is the carrying amount of thefinancial assets, expressed gross of derivatives with a positive fair value and net of any guarantees.The Group does not enter into instruments or guarantees to mitigate credit risk; consequently, the disclosures below are notaffected by such instruments.
1.2 Quantitative disclosures
At 31 December 2011 the maximum credit risk exposure amounted to Euro 202,950 thousand and comprised:
31.12.2011(Euro thousands) Gross Impairment loss NetFinancial receivables 748 748Trade receivables 107,460 (4,906) 102,554Other receivables 2,758 2,758Cash and cash equivalents 96,890 96,890Total 207,856 (4,906) 202,950
116

At 31 December 2010 the maximum credit risk exposure amounted to Euro 195,830 thousand and comprised:
31.12.2010(Euro thousands) Gross Impairment loss NetFinancial receivables 10,778 10,778Trade receivables 73,033 (463) 72,570Other receivables 19,693 19,693Cash and cash equivalents 92,789 92,789Total 196,293 (463) 195,830
An analysis of trade receivables at 31 December 2011 and 31 December 2010 by class of customer with the corresponding per-centage of total receivables is set out below. This provides a summary indication of the concentration of commercial credit risk.
31.12.2011Class of customer Total exposure % exposure by class (Euro thousands) of customerGSE 89,712 88%Public authorities (municipalities) 3,504 3%Other entities 9,102 9%Total trade receivables 102,318 100%
31.12.2010Class of customer Total exposure % exposure by class (Euro thousands) of customerItalian National Grid (GSE - Enel) 56,576 78%Public authorities (municipalities) 5,381 7%Other entitites 10,578 15%Total trade receivables 72,535 100%
The ageing analysis of trade receivables by class of customer, analysed by the overdue periods used internally to monitor recei-vables, as at 31 December 2011 and 31 December 2010, is set out below. Balances not yet due at 31 December 2011 and 31December 2010 are also presented.
31.12.2011Total Overdue Total Not yet
(Euro thousands) exposure > 120 91 - 120 61 - 90 31 - 60 0 - 30 overdue dueGSE 89,712 1,717 498 3,875 4,191 13,763 24,044 65,668 Public authorities (municipalities) 3,504 347 280 446 344 1,417 2,087 Other entities 9,102 965 151 916 1,227 3,259 5,843 Total trade receivables 102,318 1,717 1,810 4,306 5,553 15,334 28,720 73,598
31.12.2010Total Overdue Total Not yet
(Euro thousands) exposure > 120 91 - 120 61 - 90 31 - 60 0 - 30 overdue dueGSE 56,576 2,950 939 3,010 3,469 9,071 19,439 37,137 Public authorities (municipalities) 5,381 831 452 351 478 2,112 3,269 Other entities 10,578 3,625 3 178 572 1,822 6,200 4,378 Total trade receivables 72,535 7,406 942 3,640 4,392 11,371 27,751 44,784
117

2. 2. Liquidity risk
2.1 Qualitative disclosures
Liquidity risk is summarised in the tables below that illustrate the financial liabilities grouped by maturity date. The Falck Rene-wables Group has a group treasury department that does not use a cash pooling system but carries out netting of opposingbalances through the use of specific intercompany correspondence accounts. The treasury agreement with Falck SpA terminated on 7 April 2011. The Falck Renewables Group prepares an update of thecash flow statement and the cash budget on a monthly basis, in which the actual data for the period are supported by a sum-mary evaluation and commentary.
2.2 Quantitative disclosures
Financial liabilities are analysed by contractual maturity across four time bands. The analysis has been concentrated on bankborrowings and shareholders’ loans, the latter have been disclosed separately as the maturity dates are not defined based onindividual contractual agreements and repayment, with regard to Prima Srl, is subordinated to bank borrowings. Liabilities inrespect of royalty instruments have also been disclosed separately as payment depends on the performance of the financedwind farms. Royalty instruments represent a financial instrument used by wind farms in the UK to acquire the consent of localcommunities in which the wind farms are located. The communities invest in the plants without right of ownership, in returnfor a profit share.
Analysis of financial liabilities (principal amounts: amounts due by contractual maturity)
31.12.2011(Euro thousands) < 12 months 1 - 2 years 2 - 5 years > 5 years TotalBank borrowings 3,410 2,950 90,348 4,725 101,433Non-recourse financing of Frullo Energia Ambiente SpA 1,960 2,940 12,187 9,726 26,813Project financing 38,387 41,272 164,032 479,176 722,867Trade payables 62,116 62,116Total 105,873 47,162 266,567 493,627 913,229
Analysis of financial liabilities (principal amounts: amounts due by estimated contractual maturity)
31.12.2011(Euro thousands) < 12 months 1 - 2 years 2 - 5 years > 5 years TotalShareholders' loans 428 2,406 2,834Royalty instruments 8,895 8,895Other payables 15,239 15,239Total 15,667 2,406 8,895 26,968
Analysis of financial liabilities (principal amounts: amounts due by contractual maturity)
31.12.2010(Euro thousands) < 12 months 1 - 2 years 2 - 5 years > 5 years TotalBank borrowings 12,330 2,902 7,558 5,906 28,696Non-recourse financing of Frullo Energia Ambiente Srl 4,704 1,960 10,716 13,997 31,377Project financing 33,262 34,133 139,404 363,036 569,835Correspondence account with Falck SpA 161,152 161,152Other liabilities due to related parties 312 312Trade payables 106,707 106,707Total 318,467 38,995 157,678 382,939 898,079
118

Analysis of financial liabilities (principal amounts: amounts due by estimated maturity)
31.12.2010(Euro thousands) < 12 months 1 - 2 years 2 - 5 years > 5 years TotalShareholders' loans 1,368 3,538 4,906Royalty instruments 44 6,238 540 6,822Other payables 19,669 19,669Total 21,081 9,776 540 31,397
In order to provide a better analysis of the overall financial commitments underlying the liabilities illustrated in the table above,a calculation was made of interest due to be paid for each maturity period shown. As contractual interest rates on the aboveborrowing instruments are all variable, quarterly or six-monthly, and closely linked to Euribor rates, this calculation was madetaking into consideration the implicit rates of the swap rate curve correlated with Euribor rates at 31 December 2011. Calcula-tion of the quarterly and six-monthly interest was simplified by assuming that the payment periods for each instrument hadthe same start and end date.
With regard to interest payable, the estimated value of the differentials relating to derivative financial instruments held at 31December 2011 was calculated. The estimated differentials were calculated applying the implicit forward rates in the swap curveat 31 December 2011. In this case a detailed analysis of each derivative instrument held was performed.
Analysis of financial liabilities (estimated flows on contractual basis: interest costs plus IRS differentials)
31.12.2011(Euro thousands) < 12 months 1 - 2 years 2 - 5 years > 5 years TotalIRS differentials 14,150 15,262 26,177 5,518 61,107Bank borrowings 3,642 3,426 6,131 425 13,624Project financing 28,221 30,659 90,191 149,374 298,445Total 46,013 49,347 122,499 155,317 373,176
Analysis of financial liabilities (flows on estimated contractual basis: interest costs)
31.12.2011(Euro thousands) < 12 months 1 - 2 years 2 - 5 years > 5 years TotalShareholders' loans 85 72 157Total 85 72 157
Analysis of financial liabilities (estimated flows on contractual basis: interest costs plus IRS differentials)
31.12.2010(Euro thousands) < 12 months 1 - 2 years 2 - 5 years > 5 years TotalIRS differentials 11,821 9,695 11,259 (9,645) 23,130Bank borrowings 598 705 1,409 678 3,390Project financing 24,265 27,614 88,749 157,412 298,040Total 36,684 38,014 101,417 148,445 324,560
Analysis of financial liabilities (flows on estimated contractual basis: interest costs)
31.12.2010(Euro thousands) < 12 months 1 - 2 years 2 - 5 years > 5 years TotalShareholders' loans 61 67 71 199Total 61 67 71 199
119

3. Market risks
3.1 Interest rate risk
3.1.1 Qualitative disclosures
The Falck Renewables Group manages interest rate risk centrally. Although it does not define in advance the maximum varia-ble rate debt exposure, it follows well-established procedures aimed at monitoring risk and that avoid undertaking transactionsof a speculative nature. The type and suitability of hedging instruments is evaluated for each specific case in consideration ofthe amount of exposure and current financial market conditions.
The Falck Renewables Group uses derivative financial instruments to hedge interest rates and in particular enters into interestrate swaps (IRS) with the exclusive aim of hedging. Moreover, the derivatives held at the year-end were acquired in order toallow the debt structure to meet the covenants established by the financial institutions in relation to project financing. In par-ticular, borrowings at variable rates for these contracts are matched with opposing IRS that partially convert the borrowingsfrom variable to fixed rates. Although these operations are entered into to hedge interest rate risk, hedge accounting is notapplied to all of these derivative financial instruments. Consequently, changes in fair value of these derivatives follow the gene-ral rule applied to trading derivatives and are charged directly to the income statement with a direct effect on profit for the year.
The degree of Falck Renewables’ interest rate exposure was measured through a sensitivity analysis performed applying the gui-delines provided in paragraph 40 of IFRS 7 and the examples illustrated in Implementation Guide (IG) 35. A brief descriptionof the methodology used to perform the sensitivity analysis and the results obtained is provided below.
The effect on profit for the year was determined applying a different yield curve to that used at the reporting date. For FalckRenewables this means recalculating the fair value of the derivative instruments and charging directly to the income statementthe difference between the simulated fair value and the value at the year-end. This provides both the portfolio risk on derivati-ves held at the balance sheet date and the related effect on profit for the year.
The actual effect on profit for the year of a different scenario for interest rates also depends on the average financial assets andliabilities for the period on which interest accrues. The example provided in IG35 of IFRS 7 refers to the effect on the actualfinancial statements originating from a different interest rate arising during the year. Once the finance income and costs rela-ting to a new scenario become known it is easy to verify, measuring the difference between these and the actual income/expen-se, the effect of a new interest rate scenario on the income statement.
The sensitivity analysis assumed two scenarios, a decrease and an increase in interest rates. Changes in interest rates for eachscenario have been applied: 1) to the yield curve at the reporting date, assuming a parallel shift in the yield curve; 2) to the ave-rage interest rate paid in the course of the year on variable rate borrowings; 3) to the average interest rate earned during theyear on variable rate financial assets; 4) to the interest rates used to determine the differentials paid/received during the yearon derivative financial instruments.
As already noted the change in fair value of each derivative instrument held at 31 December 2011, together with the relatedimpact on profit for the year, was calculated for each scenario. The impact on profit arising from changes in finance income andcosts was also calculated for each scenario. The tables below illustrate the outcome of these analyses. An increase of 50 basispoints would have resulted in a negative impact on profit of approximately 12.30%, while a decrease of 50 basis points wouldhave determined a positive impact on profit for the year of approximately 12.30%.
120

3.1.2 Quantitative disclosures
• Scenario Euribor +50bp
Derivatives impact
Scenario I - Euribor + 50bpTax effect Tax effect
% of profit of change of change % of profitAccounting Base Scenario before in FV in FV for
(Euro thousands) treatment Value value Change FV Change BS Change IS income tax in IS to equity the yearFalck Renewables SpA Hedge Accounting (1,190) 20 1,210 1,210 0.00% (333) 0.00%Frullo Energia Ambiente Srl Non Hedge Accounting (1,425) (1,091) 334 334 0.90% (127) 1.04%Prima Srl Non Hedge Accounting (154) (126) 28 28 0.07% (10) 0.09%Actelios Solar SpA Hedge Accounting (1,642) (208) 1,434 1,434 0.00% (394) 0.00%Geopower Sardegna Srl Hedge Accounting (10,355) (3,782) 6,573 6,573 0.00% (1,807) 0.00%Eolo 3W Minervino Murge Srl Hedge Accounting (6,799) (4,893) 1,906 1,906 0.00% (724) 0.00%Eolica Sud Srl Hedge Accounting (9,375) (5,686) 3,688 3,688 0.00% (1,401) 0.00%Esquennois Energie Sas Hedge Accounting (1,228) (837) 392 392 0.00% (108) 0.00%Parc Eolien des Crêtes Sas Hedge Accounting (1,020) (705) 316 316 0.00% (87) 0.00%Parc Eolien du Fouy Sas Hedge Accounting (983) (679) 304 304 0.00% (84) 0.00%Cambrian WE Ltd Hedge Accounting (3,363) (2,907) 455 455 0.00% (125) 0.00%Kilbraur WE Ltd Hedge Accounting (6,172) (5,519) 653 653 0.00% (180) 0.00%Millennium WE Ltd Hedge Accounting (7,459) (6,711) 748 748 0.00% (206) 0.00%Ben Aketil WE Ltd Hedge Accounting (5,247) (4,403) 844 844 0.00% (232) 0.00%Boyndie WE Ltd Hedge Accounting (286) (246) 41 41 0.00% (11) 0.00%Earlsburn WE Ltd Hedge Accounting (3,070) (2,616) 453 453 0.00% (125) 0.00%Eolica Cabezo San Roque Sa Hedge Accounting (1,145) (1,013) 132 132 0.00% (36) 0.00%Total (60,913) (41,402) 19,511 19,149 362 0.97% (137) (5,853) 1.13%
Total impact
Scenario I - Euribor + 50bpTax effect
Change BS Tax effect Net impact % of on change (Euro thousands) on BS on BS Change IS PBT in IS % of PFYImpact of change in fair value of derivatives 19,147 (5,853) 13,294 362 0.97% (137) 1.13%Impact on finance costs and IRS differentials (*) (4,166) -11.18% 1,146 -15.22%Impact on finance income and IRS differentials (*) 490 1.32% (135) 1.79%Total 19,147 (5,853) 13,294 (3,314) -8.89% 874 -12.30%
(*) The tax effect was calculated applying an average rate of 27.5%.
121

• Scenario Euribor -50bp
Derivatives impact
Scenario II - Euribor - 50bpTax effect Tax effect
% of profit of change of change % of profitAccounting Base Scenario before in FV in FV for
(Euro thousands) treatment Value value Change FV Change BS Change IS income tax in IS to equity the yearFalck Renewables SpA Hedge Accounting (1,190) (2,400) (1,210) (1,210) 0.00% 333 0.00%Frullo Energia Ambiente Srl Non Hedge Accounting (1,425) (1,759) (334) (334) -0.90% 127 -1.04%Prima Srl Non Hedge Accounting (154) (181) (28) (28) -0.07% 10 -0.09%Actelios Solar SpA Hedge Accounting (1,642) (3,076) (1,434) (1,434) 0.00% 394 0.00%Geopower Sardegna Srl Hedge Accounting (10,355) (16,927) (6,572) (6,572) 0.00% 1,807 0.00%Eolo 3W Minervino Murge Srl Hedge Accounting (6,799) (8,779) (1,980) (1,980) 0.00% 753 0.00%Eolica Sud Srl Hedge Accounting (9,375) (13,063) (3,689) (3,689) 0.00% 1,402 0.00%Esquennois Energie Sas Hedge Accounting (1,228) (1,621) (392) (392) 0.00% 108 0.00%Parc Eolien des Crêtes Sas Hedge Accounting (1,020) (1,336) (316) (316) 0.00% 87 0.00%Parc Eolien du Fouy Sas Hedge Accounting (983) (1,287) (304) (304) 0.00% 84 0.00%Cambrian WE Ltd Hedge Accounting (3,363) (3,819) (457) (457) 0.00% 126 0.00%Kilbraur WE Ltd Hedge Accounting (6,172) (6,825) (652) (652) 0.00% 179 0.00%Millennium WE Ltd Hedge Accounting (7,459) (8,207) (749) (749) 0.00% 206 0.00%Ben Aketil WE Ltd Hedge Accounting (5,247) (6,090) (843) (843) 0.00% 232 0.00%Boyndie WE Ltd Hedge Accounting (286) (326) (40) (40) 0.00% 11 0.00%Earlsburn WE Ltd Hedge Accounting (3,070) (3,523) (453) (453) 0.00% 125 0.00%Eolica Cabezo San Roque Sa Hedge Accounting (1,145) (1,277) (132) (132) 0.00% 36 0.00%Total (60,913) (80,496) (19,585) (19,223) (362) -0.97% 137 5,883 -1.13%
Total impact
Scenario II - Euribor - 50bpTax effect
Change BS Tax effect Net impact % of on change (Euro thousands) on BS on BS Change IS PBT in IS % of PFYImpact of change in fair value of derivatives (19,223) 5,882 (13,341) (362) -0.97% 137 -1.13%Impact on finance costs and IRS differentials (*) 4,166 11.18% (1,146) 15.22%Impact on finance income and IRS differentials (*) (490) -1.32% 135 -1.79%Total (19,223) 5,882 (13,341) 3,314 8.89% (874) 12.30%
(*)The tax effect was calculated applying an average rate of 27.5%.
3.2 Foreign exchange risk
The Falck Renewables Group has established a foreign exchange risk management policy. A sensitivity analysis was performedin order to determine the impact of fluctuations in exchange rates on the balances denominated in foreign currencies of allGroup companies as at 31 December 2011. The analyses were performed assuming two scenarios, a 10% appreciation/depre-ciation of the spot rate between the exchange rate in which the amount is denominated and the rate used to translate the balan-ces for the purpose of preparing the financial statements. These analyses showed that a 10% appreciation in the exchange rates of balances denominated in foreign currency would resultin a foreign exchange loss and a corresponding decrease in consolidated profit before income tax of Euro -274 thousand. A 10%depreciation in the balances denominated in foreign currency would give rise to a foreign exchange gain and as a consequen-ce an increase in consolidated profit before income tax of Euro 335 thousand.
122

Supplementary informationto the consolidated financial statements
7

7.1 List of investments in subsidiaries and associates
Companies consolidated applying the line-by-line method
% Indirect holdingRegistered Currency Share Directoffice capital holding % Subsidiary
Falck Renewables SpA Milan Euro 291,413,891Actelios Etnea Srl Palermo Euro 10,000 100.000Actelios Solar SpA Sesto S. Giovanni (Mi) Euro 120,000 100.000Ambiente 2000 Srl Milan Euro 103,000 60.000Ben Aketil 2 Wind Energy Ltd Inverness (UK) GBP 100 100.000 Falck Renewables Wind LtdBen Aketil Wind Energy Ltd Inverness (UK) GBP 100 100.000 Falck Renewables Wind LtdBoyndie Wind Energy Ltd Inverness (UK) GBP 100 100.000 Falck Renewables UK
Holdings (No.1) LtdCambrian Wind Energy Ltd London (UK) GBP 100 100.000 Falck Renewables UK
Holdings (No.1) LtdCushnie Wind Energy Ltd Inverness (UK) GBP 100 52.000 Falck Renewables Wind LtdDunbeath Wind Energy Ltd Inverness (UK) GBP 100 52.000 Falck Renewables Wind LtdEarlsburn Mezzanine Ltd London (UK) GBP 100 100.000 Falck Renewables Wind LtdEarlsburn Wind Energy Ltd Inverness (UK) GBP 100 100.000 Earlsburn Mezzanine LtdEcosesto SpA Rende (Cosenza) Euro 5,120,000 100.000Ecoveol Sas Rennes (France) Euro 1,000 51.000 Falck Energies Renouvelables SasElettroambiente SpA Sesto S. Giovanni (Mi) Euro 245,350 100.000Elektrownie Wiatrowe Bonwind Leszno Sp.Z.o.o. Poznan (Poland) PLN 50,028 50.000 Falck Renewables Wind LtdElektrownie Wiatrowe Bonwind Łyszkowice Sp.Z.o.o. Łódź (Poland) PLN 100,000 50.000 Falck Renewables Wind LtdElektrownie Wiatrowe Bonwind Kamienica Sp.Z.o.o. Łódź (Poland) PLN 758 50.000 Falck Renewables Wind LtdEolica Cabezo San Roque Sa Saragozza (Spain) Euro 1,500,000 95.511 Falck Renewables Wind LtdEolica Petralia Srl Sesto S. Giovanni (Mi) Euro 10,000 100.000 Falck Renewables Wind LtdEolica Sud Srl Davoli Marina (Cz) Euro 5,000,000 100.000 Falck Renewables Wind LtdEolo 3W Minervino Murge Srl Sesto S. Giovanni (Mi) Euro 10,000 100.000 Falck Renewables Wind LtdEsposito Servizi Ecologici Srl Sesto S. Giovanni (Mi) Euro 10,000 100.000Esquennois Energie Sas Paris (France) Euro 37,000 100.000 Falck Renewables Wind LtdFalck Energies Renouvelables Sas Rennes (France) Euro 60,000 100.000 Falck Renewables Wind LtdFalck Renewables Finance Ltd London (UK) GBP 100 100.000 Falck Renewables Wind LtdFalck Renewables Italia Srl Sesto S. Giovanni (Mi) Euro 100,000 100.000 Falck Renewables Wind LtdFalck Renewables Wind Ltd London (UK) GBP 37,759,066 99.989Falck Renewables UK Holdings (No.1) Ltd London (UK) GBP 1 100.000 Falck Renewables Finance LtdGeopower Sardegna Srl Sesto S. Giovanni (Mi) Euro 2,000,000 100.000 Falck Renewables Wind LtdKilbraur 2 Wind Energy Ltd Inverness (UK) GBP 100 100.000 Falck Renewables Wind LtdKilbraur Wind Energy Ltd Inverness (UK) GBP 100 100.000 Falck Renewables Wind LtdKingsburn Wind Energy Ltd Inverness (UK) GBP 100 52.000 Falck Renewables Wind LtdMillennium Wind Energy Ltd Inverness (UK) GBP 100 100.000 Falck Renewables Wind LtdNess Wind Energy Ltd London (UK) GBP 50 100.000 Falck Renewables Wind LtdNutberry Wind Energy Ltd Inverness (UK) GBP 100 52.000 Falck Renewables Wind LtdParc Eolien d'Availles - Limouzin Sarl Paris (France) Euro 1,000 100.000 Falck Energies Renouvelables SasParc Eolien de Baud Sarl Rennes (France) Euro 1,000 75.000 Falck Energies Renouvelables SasParc Eolien de Sainte Trephine Sarl Rennes (France) Euro 10,000 100.000 Falck Energies Renouvelables SasParc Eolien de Moulismes Sarl Paris (France) Euro 1,000 100.000 Falck Energies Renouvelables SasParc Eolien de Plovenez du Faou Sarl Rennes (France) Euro 1,000 75.000 Falck Energies Renouvelables Sas
125

Companies consolidated applying line-by-line method (continued)
% Indirect holdingRegistered Currency Share Directoffice capital holding % Subsidiary
Parc Eolien des Cretes Sas Paris (France) Euro 37,000 100.000 Falck Renewables Wind LtdParc Eolien du Fouy Sas Paris (France) Euro 37,000 100.000 Falck Renewables Wind LtdPlatani Energia Ambiente ScpA (in liquidation) Palermo Euro 3,364,264 86.770 Elettroambiente SpAPrima Srl Sesto S. Giovanni (Mi) Euro 5,430,000 85.000S E Ty Ru Sas Rennes (France) Euro 37,005 100.000 Falck Energies Renouvelables SasS E Kernebet Sas Rennes (France) Euro 37,005 100.000 Falck Energies Renouvelables SasSolar Mesagne Srl Brindisi Euro 50,000 100.000Spaldington Airfield Wind Energy Ltd London (UK) GBP 50 100.000 Falck Renewables Wind LtdTasfiye Halinde Ezse Elektrik Uretim Ltd Sirketi Izmir (Turkey) YTL 11,772,152 100.000 Falck Renewables Wind LtdTifeo Energia Ambiente ScpA (in liquidation) Palermo Euro 4,679,829 96.350 Elettroambiente SpA
Companies consolidated applying proportional method
% Indirect holdingRegistered Currency Share Directoffice capital holding % Subsidiary
Frullo Energia Ambiente Srl Bologna Euro 17,139,100 49.000
Companies valued applying equity method
% Indirect holdingRegistered Currency Share Directoffice capital holding % Subsidiary
Nuevos Parque Eolicos La Muela AIE Saragozza (Spain) Euro 10,000 50.000 Parque Eolico La Carracha SL50.000 Parque Eolico Plana de Jarreta SL
Parque Eolico La Carracha Sl Saragozza (Spain) Euro 100,000 26.000 Falck Renewables Wind LtdParque Eolico Plana de Jarreta Sl Saragozza (Spain) Euro 100,000 26.000 Falck Renewables Wind Ltd
Other investments in subsidiaries and associates valued at cost
% Indirect holdingRegistered Currency Share Directoffice capital holding % Subsidiary
Eolica Calabra Srl Belvedere Marittimo (Cosenza) Euro 10,000 20.000 Falck Renewables Wind LtdFri Energetica Srl Cosenza Euro 20,000 20.000 Falck Renewables Wind LtdPalermo Energia Ambiente ScpA (in liquidation) Palermo Euro 120,000 23.272
126

Falck Renewables SpA separate financial statementsfor the year ended 31 December 2011
8

8.1 Falck Renewables SpA balance sheet
31.12.2011 31.12.2010Note of which of which
(Euro thousands) related parties related partiesAssetsA Non-current assets
1 Intangible assets (1) 412 88 2 Property, plant and equipment (2) 415 62 3 Investments and financial assets (3) 248,933 227,696 4 Trade receivables (5) 1,571 1,571 2,763 2,763 5 Medium/long-term financial receivables (4) 96,989 96,989 93,709 93,709 6 Deferred income tax assets (7) 2,953 1,567 7 Other receivables (6) 764 764 790 790 Total 352,037 326,675
B Current assets1 Inventories (8)2 Trade receivables (5) 2,259 2,237 1,976 1,885 3 Other receivables (6) 21,063 20,961 12,243 12,148 4 Financial assets (4) 284,879 284,879 270,799 270,799 5 Investments6 Cash and cash equivalents (9) 177 33 Total 308,378 285,051
C Non-current assets held for saleTotal assets 660,415 611,726
LiabilitiesD Equity
1 Ordinary shares 291,414 161,897 2 Reserves 246,976 250,705 3 Retained earnings 20,022 23,713 4 (Loss) for the year (1,776) (194)Equity attributable to shareholders (10) 556,636 436,121
E Non-current liabilities1 Medium/long-term financial liabilities (13) 85,750 2 Other non-current liabilities (15)3 Deferred income tax liabilities4 Provisions for other liabilities and charges (11) 4,976 1,067 5 Staff leaving indemnity (12) 1,272 526 Total 91,998 1,593
F Current liabilities1 Trade payables (14) 4,649 1,140 7,572 1,740 2 Other payables (15) 2,733 887 3 Short-term financial liabilities (13) 4,399 4,278 165,553 165,073 4 Provisions for other liabilities and chargesTotal 11,781 174,012
G Liabilities attributable to non-current assets held for saleTotal liabilities 660,415 611,726
Related party transactions are disclosed on pages 159 and 160.
129

8.2 Falck Renewables SpA income statement
31.12.2011 31.12.2010Note of which of which
(Euro thousands) related parties related parties
A Revenue (16) 140 83 364 346
Direct labour costs (17)
Direct costs (18) (130) (93)
B Cost of sales (130) (93)
C Gross profit 10 271
Other income (19) 5,095 5,057 3,001 2,593
Other employee costs (17) (7,487) (4,549)
Administrative expenses (20) (15,272) (1,670) (8,081) (2,576)
D Operating loss (17,654) (9,358)
Finance income - net (21) 3,243 12,538 4,265 4,306
Investment income (22) 12,620 12,620 3,893 7,191
E (Loss) before income tax (1,791) (1,200)
Income tax expense (23) 15 1,006
F (Loss) for the year (1,776) (194)
No non-recurring income or costs arose in 2011.
Related party transactions are disclosed on page 166.
130

8.3 Falck Renewables SpA statement of changes in comprehensive income
31.12.2011 31.12.2010(Euro thousands) Gross Tax Net Gross Tax NetA (Loss) for the year (1,791) 15 (1,776) (1,200) 1,006 (194)
Other elements recognised in equity:(Gains)/losses reversed to income statement in respect of available-for-sale financial assets, previously recorded in net equity
B (Gains)/losses reversed to income statement previously recognised in equityForeign exchange differences on translation of overseas financial statementsFair value adjustment of available-for-sale financial assetsBalance of actuarial gains/(losses) on employee benefitsFair value adjustments of derivatives designated as cash flow hedges (1,190) 327 (863)Portion of other elements recorded in net equity relating to associates and joint ventures
C Gains/(losses) recognised directly in equity in the period (1,190) 327 (863)
B+C Total other elements recognised in equity (1,190) 327 (863)A+B+C Total recognised (losses) (2,981) 342 (2,639) (1,200) 1,006 (194)
Attributable to:- owners of the parent- non-controlling interests
131

8.4 Falck Renewables SpA cash flow statement
31.12.2011 31.12.2010Note of which of which
(Euro thousands) related parties related partiesCash flows from operating activities(Loss) for the year (1,776) (194)Adjusted for:Amortisation and impairment of intangible assets 88 21 Depreciation and impairment of property, plant and equipment 97 34 Staff leaving indemnity provision 326 168 Write down of investments and other securities 2,735 3,763 Finance income (29,596) (13,815) (4,353) (4,353)Finance costs 26,354 1,381 89 48 Dividends received (15,811) (15,811) (7,191) (7,191)Share of profit of investments valued at equity Gain on sale of intangiblesProfit on disposal of property, plant and equipment (11)Profit on sale of investmentsOther cash flows (1) 2 Income tax (income statement) 15 1,006 Operating (loss) before changes in net working capital and provisions (17,580) (6,655)Change in inventoriesChange in trade receivables 909 2,188 Change in trade payables (2,923) 3,269 Change in other receivables/payables 1,211 (2,415)Net change in provisions 3,909 602 Change in employee payables - staff leaving indemnity paid during year (152) (141)Cash used in operating activities (14,626) (3,152)Interest paid (25,720) (1,381) (89) (48)Tax received/(paid) 716 Net cash used in operating activities (1) (40,346) (2,525)Cash flows from investing activitiesDividends received 7,396 7,396 9,510 9,510 Proceeds from sale of property, plant and equipment 19 Proceeds from sale of intangible assetsProceeds from investment activitiesPurchases of intangible assets (160) (55)Purchases of property, plant and equipment (211) (17)Acquisition of investments (24,605) (24,605) (7,500) (6,673)Sale of investments 1,965 Interest received 29,596 13,815 4,353 4,353 Net cash generated from investing activities (2) 12,035 8,256 Cash flows from financing activitiesDividends paid (3,497) (5,752)Proceeds from issue of ordinary share capital increase and capital injections 129,972 Expenses on capital transaction (3,393) (3,832)Proceeds from borrowingsLoans granted (17,361) (17,361) (116,521) (116,521)New borrowings 83,925 Repayments of borrowings (160,216) (160,216) 116,560 Net cash generated from/(used in) financing activities (3) 29,430 (9,545)Net increase/(decrease) in cash and cash equivalents and bank overdrafts(1+2+3) 1,119 (3,814)Cash and cash equivalents and bank overdrafts at 1 January (5,341) (1,527)Cash and cash equivalents and bank overdrafts at 31 December (9) (4,222) (5,341)
132

8.5 Falck Renewables SpA statement of changes in equity
Share Reserves Profit/(loss) Equity Non- Totalcapital for the attributable controlling equity
year to owners of interests(Euro thousands) the parent
At 31.12.2009 67,680 268,549 10,240 346,469 346,469
Appropriation of 2009 profit 4,488 (10,240) (5,752) (5,752)
Share capital increase 94,217 4,159 98,376 98,376
Expenses on share capital increase (2,778) (2,778) (2,778)
Loss for the year to 31 December 2010 (194) (194) (194)
At 31.12.2010 161,897 274,418 (194) 436,121 436,121
Appropriation of 2010 profit (194) 194
Dividends paid (3,497) (3,497) (3,497)
Share capital increase 129,517 129,517 129,517
Expenses on share capital increase (2,461) (2,461) (2,461)
Other movements (1,268) (1,268) (1,268)
Loss for the year to 31 December 2011 (1,776) (1,776) (1,776)
At 31.12.2011 291,414 266,998 (1,776) 556,636 556,636
133

8.6 Falck Renewables SpA notes to the financial statements
Direction and coordination activities
In accordance with article 2497 bis, paragraph 4 of the Italian Civil Code, the key information from the latest approved finan-cial statements of Falck SpA (31 December 2010) is disclosed, due to the fact that the latter performs direction and coordina-tion activities. For a full and better understanding of the financial position of Falck SpA at 31 December 2010, and the profit for the year thenended, reference should be made to its financial statements complete with the independent auditors’ report, which are availa-ble at the parent company’s registered offices and on its website www.falck.it
134

Balance sheet Falck SpA31 December 2010 31 December 2009
Amounts due Amounts due Total Amounts due Amounts due TotalAssets within 12 months after 12 months (Euro) within 12 months after 12 months (Euro)A) SHARE CAPITAL SUBSCRIBED AND NOT YET PAIDB) FIXED ASSETSI. Intangible assets
1 Start-up and expansion costs2 Research, development and advertising expenses3 Industrial patent rights 178,409 292,7824 Concessions, licences, trademarks and similar rights 90,431 141,9655 Goodwill6 Assets under construction and advances7 Other intangible assets Total intangible assets 268,840 434,747
II. Tangible assets1 Land and buildings 459,128 420,9582 Plant and machinery 12,722 20,6123 Industrial and commercial equipment4 Other tangible assets 345,224 369,4875 Assets operated under concession6 Assets under construction and advances Total tangible assets 817,074 811,057
III. Financial assets1 Equity investments :
a subsidiaries 286,161,059 286,161,059b associates 3,279,217 2,537,392c other companies 32,065,227 32,208,227Total equity investments 321,505,503 320,906,678
2 Receivables :a due from subsidiariesb due from associatesc due from parent companyd due from others 63,830 63,830e due from other group companiesf guarantee deposits 148,860 148,860 149,020 149,020Total receivables 148,860 148,860 212,850 212,850
3 Securities4 Own shares (nominal value Euro 6,907,653) 12,192,593 12,192,593Total financial assets 333,846,956 333,312,121TOTAL FIXED ASSETS 334,932,870 334,557,925
C) CURRENT ASSETSI. Inventory
1 Raw materials and consumables and goods2 Work in progress, semi-finished products and goods3 Contract work in progress4 Finished products and goods5 Advance paymentsTotal inventory
II. Receivables1 Trade receivables 531,532 531,532 1,604,533 1,604,5332 Due from subsidiaries
a trade 3,082,823 3,082,823 5,386,897 5,386,897b financial 188,405,771 188,405,771 325,726,340 325,726,340c other 8,348,123 8,348,123 6,958,178 6,958,178Total receivables due from subsidiaries 199,836,717 199,836,717 338,071,415 338,071,415
3 Due from associatesa trade 11,027,157 11,027,157 10,968,243 10,968,243b financial 6,245,452 6,245,452 6,862,277 6,862,277c other 2,418 2,418 3,418 3,418Total receivables due from associates 17,275,027 17,275,027 17,833,938 17,833,938
4 Due from parent companya tradeb financialc otheTotal receivables due from parent company
4bis Tax credits 6,648,280 6,648,280 6,467,954 6,467,9544terDeferred tax assets 16,927,036 16,927,036 5,884,824 5,884,8245 Due from others
a financialb advance payments 22,230 22,230c other 432,036 432,036 15,473,576 15,473,576Total receivables due from others 432,036 432,036 15,495,806 15,495,806
6 Due from other group companies a tradeb financialc otherTotal receivables due from other Group companies
Total receivables 224,375,601 17,275,027 241,650,628 385,358,470 385,358,470III. Short-term investments
1 Investments in subsidiaries2 Investments in associates3 Investments in other companies 2,833,254 3,242,4394 Own shares5 Securities 34,5506 Bills receivableTotal short-term investments 2,833,254 3,276,989
IV. Cash and bank1 Bank and post office accounts 667,241 718,7262 Cheques3 Cash in hand 11,749 8,974Total cash and bank 678,990 727,700TOTAL CURRENT ASSETS 245,162,872 389,363,159
D) ACCRUED INCOME AND PREPAID EXPENSES 38,889 72,110TOTAL ASSETS 580,134,631 723,993,194
135

31 December 2010 31 December 2009Amounts due Amounts due Total Amounts due Amounts due TotalLIABILITIES within 12 months after 12 months (Euro) within 12 months after 12 months (Euro)
A) SHAREHOLDERS' EQUITYI. Share capital 72,793,163 72,793,163II. Share premium reserve 28,905,335 28,905,335III. Revaluation reserve
1 reserve ex Law 72/832 reserve ex Law 413/91Total revaluation reserve
IV. Legal reserve 31,375,994 31,375,994V. Statutory reserveVI. Reserve for own shares 12,192,593 12,192,593VII. Other reserves
1 Extraordinary reserve 17,187,170 17,187,1702 Contributions from shareholders 450,000 450,000Total other reserves 17,637,170 17,637,170
VIII. Profit /(loss) carried forward 117,694,043 116,530,405IX. Profit /(loss) for the period 6,104,114 1,163,638
TOTAL SHAREHOLDERS' EQUITY 286,702,412 280,598,298B) PROVISIONS FOR RISKS AND CHARGES
1 For pensions and similar obligations2 For taxes
a Currentb DeferredTotal provision for taxes
3 Other provisionsa Provision for litigation 2,238,996 2,238,996b Provision for equity investment risks 3,935,000 3,935,000c Provision for environmental improvementsd Provision for reorganisation and liquidation costse Sundry provisions 25,061,596 50,928,686Total other provisions 31,235,592 57,102,682
TOTAL PROVISIONS FOR RISKS AND CHARGES 31,235,592 57,102,682C) EMPLOYEE SEVERANCE INDEMNITY 514,588 530,560D) PAYABLES
1 Bonds and debenture loans2 Convertible bonds and debenture loans 33,273,029 33,273,029 33,273,029 33,273,0293 Shareholders' loans 8,024 8,024 8,024 8,0244 Bank loans and overdrafts 201,534,812 201,534,812 37,355,666 140,000,000 177,355,6665 Other financing creditors6 Advance payments received7 Trade payables 4,644,864 4,644,864 3,713,483 3,713,4838 Bills payable9 Due to subsidiaries
a trade 731,483 731,483 1,014,241 1,014,241b financial 452,766 452,766 154,973,442 154,973,442c other 17,613,210 17,613,210 7,420,082 5,675,898 13,095,980Total amount due to subsidiaries 18,797,459 18,797,459 163,407,765 5,675,898 169,083,663
10 Due to associatesa tradeb financialc otherTotal amount due to associates
11 Due to parent companya tradeb financialc otherTotal amount due to parent company
12 Tax payables 145,459 145,459 200,085 200,08513 Social security and national insurance contributions 433,858 433,858 374,017 374,01714 Other payables 1,865,503 1,865,503 1,438,586 1,438,58615 Due to other group companies
a tradeb financialc otherTotal amount due to other group companies
TOTAL PAYABLES 227,429,979 33,273,029 260,703,008 206,497,626 178,948,927 385,446,553E) ACCRUED LIABILITIES AND DEFERRED INCOME 979,031 315,101TOTAL LIABILITIES 580,134,631 723,993,194
136
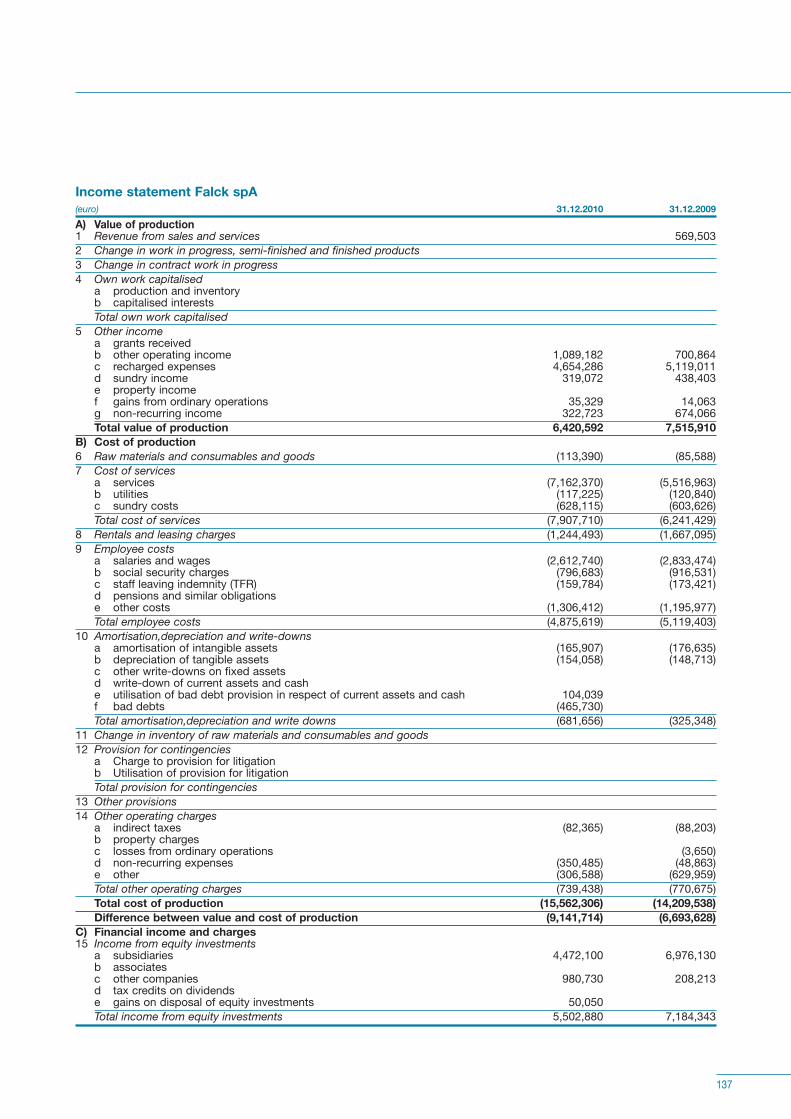
Income statement Falck spA(euro) 31.12.2010 31.12.2009A) Value of production1 Revenue from sales and services 569,5032 Change in work in progress, semi-finished and finished products3 Change in contract work in progress4 Own work capitalised
a production and inventoryb capitalised interestsTotal own work capitalised
5 Other incomea grants receivedb other operating income 1,089,182 700,864c recharged expenses 4,654,286 5,119,011d sundry income 319,072 438,403e property incomef gains from ordinary operations 35,329 14,063g non-recurring income 322,723 674,066Total value of production 6,420,592 7,515,910
B) Cost of production6 Raw materials and consumables and goods (113,390) (85,588)7 Cost of services
a services (7,162,370) (5,516,963)b utilities (117,225) (120,840)c sundry costs (628,115) (603,626)Total cost of services (7,907,710) (6,241,429)
8 Rentals and leasing charges (1,244,493) (1,667,095)9 Employee costs
a salaries and wages (2,612,740) (2,833,474)b social security charges (796,683) (916,531)c staff leaving indemnity (TFR) (159,784) (173,421)d pensions and similar obligationse other costs (1,306,412) (1,195,977)Total employee costs (4,875,619) (5,119,403)
10 Amortisation,depreciation and write-downsa amortisation of intangible assets (165,907) (176,635)b depreciation of tangible assets (154,058) (148,713)c other write-downs on fixed assetsd write-down of current assets and cashe utilisation of bad debt provision in respect of current assets and cash 104,039f bad debts (465,730)Total amortisation,depreciation and write downs (681,656) (325,348)
11 Change in inventory of raw materials and consumables and goods12 Provision for contingencies
a Charge to provision for litigationb Utilisation of provision for litigationTotal provision for contingencies
13 Other provisions14 Other operating charges
a indirect taxes (82,365) (88,203)b property chargesc losses from ordinary operations (3,650)d non-recurring expenses (350,485) (48,863)e other (306,588) (629,959)Total other operating charges (739,438) (770,675)Total cost of production (15,562,306) (14,209,538)Difference between value and cost of production (9,141,714) (6,693,628)
C) Financial income and charges15 Income from equity investments
a subsidiaries 4,472,100 6,976,130b associatesc other companies 980,730 208,213d tax credits on dividendse gains on disposal of equity investments 50,050Total income from equity investments 5,502,880 7,184,343
137

(euro) 31.12.2010 31.12.200916 Other financial income
a From receivables included in fixed assetsa.1 subsidiariesa.2 associatesa.3 parent companya.4 other group companiesa.5 othersTotal from receivables included in fixed assets
b From securities included in fixed assetsc From securities included in current assets
c.1 interest income from securitiesc.2 gains from disposal of securities 648 Total income from securities included in current assets 648
d Other incomed.1 interest and commission from subsidiaries 11,348,295 12,265,438 d.2 interest and commission from associates 178,172 251,561 d.3 interest and commission from parent companyd.4 interest and commission from other group companiesd.5 interest and commission from banks 5,467 160,161 d.6 interest and commission from others and sundry income 14 380 Total other income 11,531,948 12,677,540
Total other financial income 11,531,948 12,678,188 17 Interest expense and other financial charges
a subsidiaries (1,749,169) (2,001,308)b associatesc parent companyd other group companiese others (7,337,452) (6,190,639)f losses on disposal of equity investmentsg losses on disposal of securitiesTotal interest expense and other financial charges (9,086,621) (8,191,947)
17bis Exchange gains and lossesa exchange gains 15,372,582 26,056,393 b exchange losses (18,298,188) (26,022,721)Total exchange gains and losses (2,925,606) 33,672 Total financial income and charges 5,022,601 11,704,256
D) Adjustments to financial assets18 Revaluations
a equity investmentsb financial assets included in fixed assetsc securities included in current assetsTotal revaluations
19 Write-downsa equity investments
a.1 permanent losses on equity investments (569,342) (1,584,338)a.2 provision for equity investment risksa.3 utilisation of provision for equity investment risksTotal write-downs on equity investments (569,342) (1,584,338)
b of financial assets included in fixed assetsc of securities included in current assetsTotal write-downs (569,342) (1,584,338)Total adjustments to financial assets (569,342) (1,584,338)
E) Extraordinary income and expenses20 Income
a gains from extraordinary disposals 26,000 b other extraordinary income 26,000,139 1,506,247 c utilisation of provision for reorganisation and liquidation costsTotal extraordinary income 26,000,139 1,532,247
21 Expensesa losses from extraordinary disposalsb tax relating to prior financial periodsc other extraordinary charges (24,525,611) (4,100,041)d reorganisation and liquidation costsTotal extraordinary expenses (24,525,611) (4,100,041)Total extraordinary items 1,474,528 (2,567,794)Profit for the year before taxation (3,213,927) 858,496
22 Tax on profit for the year 9,318,041 305,142 23 Profit for the year 6,104,114 1,163,638
138

8.6.1 Accounting policies
The valuation and measurement of financial information for the year ended 31 December 2011 have been based on theIAS/IFRS currently in force and their related interpretations as set out in the documents issued to date by the InternationalFinancial Reporting Interpretations Committee (IFRIC) and the Standing Interpretations Committee (SIC). The Company’s separate financial statements are prepared in Euro and all values are rounded to thousands of Euro exceptwhere otherwise indicated. The financial statements have been prepared applying the historical cost convention, with the exception of derivative instru-ments and financial assets available for sale, valuation of which is based on the market value (fair value) principle.Non-current assets and tangible fixed assets held for sale are recorded at the lower of book and market value.The accounting policies detailed below were applied to the current financial year, comparative amounts for the prior year andin the preparation of the opening IFRS financial statements at 1 January 2005 representing the date of transition to IFRS. Alladjustments arising from the first time adoption of IAS/IFRS have been recorded in net equity. In addition, on first time adop-tion of IFRS, as prescribed by IFRS 1, the standards IFRS 3, IAS 32 and IAS 39 were adopted from 1 January 2005. As a result, commencing this date, amortisation of goodwill has no longer been accounted for and derivative financial instru-ments are measured at fair value without retrospective application.
At the date of preparation of the Annual Report, the first (2010) and second (2011) interim liquidation accounts of PalermoEnergia Ambiente Scpa (hereinafter “Pea”) had not been approved. Pea is one of the Sicily Project companies (Bellolampo-Palermo) currently in liquidation, in which the Company has a 23.2725% interest. This is due to a dispute with the shareholderAmia SpA (“Amia”), which holds a 48% interest in Pea and is currently in extraordinary administration. In the event that anagreement cannot be reached with Amia regarding approval of Pea’s third liquidation accounts, it is highly likely that the com-pany will be dissolved pursuant to article 2490 of the Italian Civil Code.
The above issues involving Pea do not apply to the other two Sicily Project companies, Tifeo and Platani (in which Falck Rene-wables SpA holds indirect interests of 96.35% and 86.77% respectively through its subsidiary Elettroambiente SpA).
Furthermore, on 6 and 8 March 2012 respectively, the liquidators of Pea received notification of the bankruptcy proceedingsfiled by the Public Prosecutor with the Court of Palermo on 28 December 2011. The presiding judge scheduled a hearing for 28March 2012. Pea submitted a defence statement and documentation relevant to the proceedings. Following the above hearingthe presiding judge adjourned proceedings to 23 May 2012 in order to give the Public Prosecutor time to submit statements andPea time to reply.
In order to best represent Pea’s and its shareholders claims against the Sicily Regional Authorities, Falck Renewables SpA andFalck SpA, which together hold a 48% interest in Pea, signed an agreement with Pea whereby they agree to defer the receiva-bles (both trade and financial) to allow payment of other creditors and waive the same receivables in the event that followingliquidation Pea does not have sufficient financial resources to pay the amounts in full. Also under this agreement, the share-holders Falck Renewables SpA and Falck SpA undertake to provide Pea with the funds required to settle certain creditors. Aprovision of Euro 3,204 thousand was included in the sundry risks provision in the separate company financial statements inorder to reflect this commitment. Pea’s other shareholders entered into separate agreements regarding the settlement of recei-vables with Pea.
In light of this situation, which only involves Pea and in no way impacts on outstanding disputes between Tifeo and Platani andthe Sicily Regional Offices as confirmed by its legal advisors, Falck Renewables SpA recognised an impairment loss against thefull carrying value of its investment in Pea and all receivables (trade and financial) due from it. Although there has been no sub-stantial change in the claims made in the proceedings as no facts have emerged that would alter significantly the outcome ofthe proceedings, certain risks and uncertainties regarding the corporate governance of Pea exist that affect the risk of recovera-bility of the impaired amounts.
The residual value in the Falck Renewables SpA financial statements at 31 December 2011 of amounts relating to the Sicily Pro-jects, net of the above impairment losses, is approximately Euro 116 million comprising the value of the investment in, and tradeand financial receivables due from, Elettroambiente SpA and the trade receivables due from Platani Energia Ambiente Scpa andTifeo Energia Ambiente ScpA. The recoverability of these amounts is assessed in a separate note.
A number of amendments were made to IFRS and the interpretations with effect from 1 January 2011, none of which had asignificant impact on the Company.
139

The main changes are summarised below:
• IAS 24 - Related party disclosures (amended)
The IASB issued an amendment to IAS 24 clarifying the definition of related parties. The new definition emphasises thesymmetry in identifying related parties and defines more clearly in which circumstances employees and key managementpersonnel are considered to be related parties. The amendment also introduces an exemption from the general disclosurerequirements for government-related entities in respect of transactions between entities controlled, jointly controlled orsignificantly influenced by the same state. The adoption of these amendments has not had any impact on the disclosuresprovided by the Company.
• IAS 32 – Financial instruments: disclosures (amended)
The standard includes an amendment to the definition of financial liabilities for the purpose of classifying rights issues –such as certain options and warrants - denominated in foreign currency. Previously practice required the rights issues to beclassified as derivative liabilities. If certain conditions are met these may now be classified as equity instruments regardlessof the currency in which the exercise price is denominated. This amendment has not had any impact on the Company’s netfinancial position or results as it does not own any such instrument.
• IFRIC 14 – Prepayments of a minimum funding requirement (amended)
The amendments correct an unintended consequence for entities required to make prepayments for minimum funding con-tributions. The amendment allows entities to recognise as an asset some voluntary prepayments for minimum funding con-tributions. The Company is not required to make minimum prepayments in Europe. Consequently, this amendment has noimpact on the Company’s net financial position or results.
• IFRS 1 – First time adoption of IFRS (amended)
The amendment relieves first-time adopters of IFRS from providing the additional disclosures required by IFRS 7 regardingfair value measurement and liquidity risk. There has been no impact on the financial statements.
• IFRIC 19 – Extinguishing Financial Liabilities with Equity Instruments
This interpretation clarifies the accounting practice that a debtor must adopt where an entity issues an equity instrument toa creditor to extinguish a financial liability (debt for equity swap), or the terms of a financial liability are renegotiated andresult in the entity issuing equity instruments to a creditor to extinguish all or part of the financial liability.The interpretation clarifies that:The equity instruments issued to a creditor are part of the consideration paid to extinguish the financial liability;The equity instruments are measured at their fair value. If their fair value cannot be reliably measured, the equity instru-ments should be measured to reflect the fair value of the financial liability extinguished;The difference between the carrying amount of the financial liability extinguished and the initial measurement amount ofthe equity instruments issued is included in the entity’s profit or loss for the period.Implementation of this interpretation does not have an impact on the financial statements.
Improvements to IFRSThe IASB issued a third series of improvements to the standards in May 2010, principally to eliminate existing inconsistenciesand clarify terminology. The adoption of the following improvements has resulted in a number of changes to accounting stan-dards without impacting the Company’s financial position or results:
• IFRS 3 – Business combinations: amends the options available for the measurement of non-controlling interests (NCI). Thesemay be measured at fair value or alternatively at the proportionate share of the acquiree’s net identifiable assets only wherethe non-controlling interests are present ownership interests and entitle the holders to a proportionate share of the acqui-ree’s net assets in the event of liquidation. All other components should be measured at their acquisition date fair value (seeNote 5). Changes were also made to i) transitional requirements for contingent consideration from a business combina-tion, ii) un-replaced and voluntary replaced share-based payment awards in the context of a business combination.
• IFRS 7 – Financial Instruments: Disclosures: the improvement clarifies disclosures for classes of financial assets; in particu-lar, a number of changes have been made to the level of disclosure around credit risk.
140

• IAS 1 – Presentation of Financial Statements: this improvement clarifies that an entity may present the analysis of other com-prehensive income by item either in the statement of changes in equity or in the notes to the financial statements.
• IAS 34 – Interim Financial Reporting: emphasises the additional disclosures required by IFRS7 “Financial Instruments: dis-closures” and how to apply this to interim reports.
• IAS 27 – Consolidated and Separate Financial Statements: provides transitional requirements for consequential amendmentsto a number of standards following changes introduced by IAS 27 (2008): i) IAS 21 The Effects of Changes in Foreign Rates:the accounting treatment of the exchange differences accumulated in a separate component of equity on the disposal orpartial disposal of a foreign operation; ii) IAS 28 Investments in Associates/IAS 31 – Interests in Joint Ventures: accountingtreatment following loss of significant influence or joint control.
• IFRIC 13 – Customer Loyalty Programmes: relates to the fair value of award credits.
IFRS and/or interpretations issued but not yet effective and/or endorsed
Pursuant to IAS 8 “Accounting policies, Changes in Accounting Estimates and Errors”, the new standards and/or interpretationsthat have been issued but not yet effective or not yet endorsed by the European Union, and therefore not applicable, are illu-strated and described in brief below. None of these standards and interpretations has been early adopted by the Company.
• Amendments to IFRS 7 – Financial Instruments: Disclosures – transfer of financial assets
These amendments are intended to improve disclosures by providing greater transparency and comparability regarding thetransfer of financial assets (e.g. securitisations), including the possible effects where the transferor retains some level of risks. These amendments were endorsed by the European Union in November 2011 (EC Regulation 1205/2011) and are effecti-ve from 1 January 2012. This is not expected to have an impact on the Company’s financial statements.
• Amendments to IAS 12 – Income Taxes – Recovery of Underlying Assets
IAS 12 requires an entity to measure the deferred tax relating to an asset or liability depending on whether the entity expectsto recover the carrying amount of the asset through use or sale. It can be difficult and subjective to assess whether recoverywill take place through use or sale when the asset is measured using the fair value model in IAS 40 Investment Property.The amendment provides a practical solution to the problem by introducing a presumption that recovery of the carryingamount will normally be through sale. As a result of the amendments, SIC 21 “Income Taxes – Recovery of Revalued Non-Depreciable Assets” would no longer apply to investment properties carried at fair value. The amendments also incorpora-te into the amended IAS 12 remaining guidance contained in SIC 21 which is accordingly withdrawn. These amendments will become effective from 1 January 2012 but have not yet been endorsed by the European Union andare not applicable to the Company.
• Amendments to IFRS 1 – First-time Adoption of IFRS – Severe Hyperinflation and Removal of Fixed Dates for First-time Adopters
The amendments cover:- Guidance on how an entity should resume presenting financial statements in accordance with IFRS after a period where
the entity’s functional currency was subject to hyperinflation;- Removal of fixed dates for first-time adopters of IFRS. Entities that adopt IFRS apply the requirements relating to the
prospective derecognition of financial assets and liabilities, hence they are no longer required to reconstruct the trans-actions that took place before the transition to IFRS that led to the derecognition of the financial assets and liabilities.
- These amendments do not apply to the Company.
• IFRS 11 – Joint Arrangements
The new standard, which replaces IAS 31 “Interests in Joint Ventures”, defines two categories of joint arrangements that giverise to different accounting treatments:- joint operations: are joint arrangements whereby the parties that have joint control of the arrangement have rights to the
assets, and obligations for the liabilities, relating to the arrangement. A joint operator accounts for the assets and liabi-lities, revenue and expenses relating to its involvement in a joint operation in accordance with the relevant IFRSs;
141

- joint ventures: a joint venture is where the parties that have joint control of the arrangement do not have rights to theseparate assets/liabilities involved in the arrangement but only the net assets or net profit of the arrangement. A jointventurer recognises its interest in a joint venture as an investment and shall account for that investment applying theequity method, while IAS 31 allowed proportionate consolidation or consolidation applying the equity method.
This standard is applicable to annual reporting periods beginning on or after 1 January 2013 but has not yet been endorsedby the European Union. There is no impact on the Falck Renewables SpA separate financial statements.
• IFRS 12 – Disclosure of Interests in Other Entities
IFRS 12 provides – expanded – disclosure requirements about subsidiaries, associates, joint arrangements and other struc-tured entities. Many of the disclosures required under IFRS 12 were previously included in IAS 27 “Consolidated and Sepa-rate Financial Statements”, IAS 28 “Investments in Associates” and IAS 31 “Interests in Joint Ventures”, as well as issuingnew requirements. This standard is effective from 1 January 2013 but has not yet been endorsed by the European Union. The impact on dis-closures in the financial statements resulting from the future application of this standard is currently being assessed.
• IFRS 13 – Fair Value Measurement
IFRS 13 provides guidance on the measurement of fair value and the disclosures required. The standard does not provideguidance on the use of fair value but the criteria for its measurement and application when another IFRS requires or per-mits fair value measurement.This standard becomes effective commencing 1 January 2013 and has not yet been endorsed by the European Union. It isnot expected to have a significant impact on the Company’s financial statements.
• Amendments to IAS 1 – Presentation of Financial Statements – Presentation of Items of Comprehensive Income
The principal amendments to IAS 1 relate to the new method of presenting other comprehensive income in the statementof changes in comprehensive income: the other items of comprehensive income are required to be grouped into those thatwill and will not be reclassified (recycled) to profit or loss. Examples of other comprehensive income items that may be recycled to profit or loss are: foreign currency differences, fairvalue differences on cash flow hedges or available for sale equity investments. Examples of other comprehensive incomeitems that would never be reclassified to profit or loss are actuarial gains and losses on defined benefit pension plans.The effective date of these amendments, which have not yet been endorsed by the European Union, is 1 July 2012.
• IAS 19 – Employee Benefits
The IASB has issued numerous amendments to IAS 19. These range from radical changes such as elimination of the corri-dor method and the concept of expected return on plan assets, to simple clarification and terminology. The amendmentsare applicable for annual periods beginning on or after 1 January 2013. With regard to the impact on the financial state-ments, elimination of the corridor approach will not impact the results as the Company does not adopt this option at pre-sent. The other impacts are currently under evaluation.
• IAS 27 – Separate Financial Statements
Subsequent to publication of IFRS 10 and IFRS 12, IAS 27 is now limited to the accounting treatment of subsidiaries, asso-ciates and jointly controlled entities in the separate financial statements. These amendments become effective on or after 1January 2013. The potential impact on the parent company financial statements is under review.
• IAS 28 – Investments in Associates and Joint Ventures
Following publication of IFRS 11 and IFRS 12, IAS 28 was renamed Investments in Associates and Joint Ventures, and setsout the requirements for the application of the equity method when accounting for investments in associates and joint ven-tures. The amendments become effective for accounting periods commencing on or after 1 January 2013. Future applicationof these amendments will not impact the financial statements.
• Amendments to IFRS 7 – Financial Instruments: Additional Disclosures – Offsetting Financial Assets and Financial Liabilities
These amendments introduce the requirement to provide in the notes to the financial statements extensive disclosuresabout financial assets and liabilities offset where there is a legal right to do so (e.g. gross and net amounts, guarantees issuedand held). These amendments are effective for annual periods beginning on or after 1 January 2013 and have not yet been
142

endorsed by the European Union. No impact on the Company’s financial statements is expected as a result of future appli-cation of the amendments.
The Company has not early adopted any other standards, interpretation or improvements issued but not yet effective.
The principal accounting policies and valuation methods adopted in the preparation of the Company’s separate financial sta-tements are set out below:
Intangible assetsAn intangible asset is recorded only when it is identifiable, controllable, is expected to benefit future periods and the cost maybe reliably measured. Intangible assets are recorded at cost including directly attributable expenses and are amortised systematically over their esti-mated useful economic life.Intangible assets having a finite useful life are classified at cost net of accumulated amortisation and any impairment losses.Amortisation is based on the estimated useful life and commences when the asset is available for use.Intangible assets are tested annually for impairment. In accordance with IAS 36 the carrying amount of assets is reviewed forimpairment whenever there is an indication that it may not be recoverable. Assets are disclosed net of any recognised impair-ment losses.Intangible assets also include industrial patent rights that comprise costs incurred for the automation and mechanisation of theinformation systems that are subject to an amortisation rate of 20%.
Property, plant and equipmentFalck Renewables SpA opted for the cost method in preparing the first IAS/IFRS financial statements, as prescribed by IFRS 1.As a result, with regard to property, plant and equipment, the Company has preferred not to adopt the fair value approach.Property, plant and equipment is recorded at acquisition or production cost including directly attributable costs.Property, plant and equipment is valued at cost, net of depreciation and impairment losses, with the exception of land, whichis not depreciated and is valued at cost less impairment losses.In the event that significant components of an item of property, plant and equipment have differing useful lives, each compo-nent is attributed a separate useful life for depreciation purposes (component approach).The depreciation rates applied represent the estimated useful life of the assets.The rates applied to the various asset categories are as follows:
(%)Industrial buildings – light construction 3 - 4 - 10General and specific plant 5 - 12- 15 - 20Heavy plant and operating machinery 9 - 10 Equipment 10 - 12 - 20 - 25 - 30Office machinery and equipment 12 - 20Vehicles 20 - 25
Borrowing costs for the construction of a plant or its acquisition are capitalised up until the moment in which the asset is readyfor use in the production process.
Impairment of assetsIn the presence of circumstances that potentially indicate a loss in value, impairment tests are conducted on tangible and intan-gible assets that have an indefinite useful life, by estimating the recoverable amount of the asset and comparing it with the rela-ted net book value. In the event that the recoverable value is lower than the carrying value an impairment loss is recorded inthe income statement. When there is an indication that an impairment loss recognised in a previous accounting period is no longer required, the carr-ying value is restated to the new estimated recoverable value which may not exceed the carrying value that would have beenrecognised had the original impairment not occurred. The reversal is also recorded in the income statement.Given the presence of external indicators including the market capitalisation of the Group at 31 December 2011 of Euro 247,702thousand, which is lower than the carrying amount of total equity of Euro 556,636 thousand, an impairment test was perfor-med on the operating and non-operating assets of Falck Renewables SpA that did not give rise to the recognition of an impair-ment loss against assets.
143

Investments and securitiesInvestments in subsidiaries and associatesInvestments in subsidiaries and associates are valued at cost. The book value is written down to reflect impairment losses inthe event that the investments are in a loss-making situation and no profits are foreseeable in the near future to cover the los-ses reported; the original value is restated in future financial periods in the event that the reasons for the write down no lon-ger exist.
Investments in other companies and other investmentsIn accordance with IAS 39 and 32, investments in companies that are neither subsidiaries nor associates are measured at fairvalue with the exception of those circumstances in which market price or fair value cannot be determined: in this event the costmethod is applied.The book value is written down to reflect impairment losses in the event that investments are in a loss-making situation andno profits are foreseeable in the near future to cover the losses reported; the original value is restated in future financial periodsin the event that the circumstances that give rise to the write-down no longer exist.
Financial assets Classification In accordance with IAS 39 and IAS 32, financial assets are classified into the following four categories:
1. Financial assets ‘at fair value through profit or loss’;2. Held-to-maturity investments;3. Loans and financial receivables similar to loans;4. Available-for-sale financial assets.
The classification depends on the reason for which the investment was initially purchased and is subsequently held and mana-gement is required to determine the initial classification on initial recognition updating this at each financial year-end. Adescription of the principal characteristics of each asset category detailed above may be summarised as follows:
Financial assets ‘at fair value through profit or loss’This category has two sub-categories:
1. Financial assets held for trading;
2. Financial assets designated to the fair value category on initial recognition. This category includes all financial investmentsother than equity instruments that are not quoted in an active market but for which a fair value may be reliably measured.
Financial instruments, with the exception of hedge instruments, are included in this category and their fair value recorded inthe income statement.All assets within this category are classified as current if they are held for trading purposes or where disposal is expected within12 months from the year end. Designation of a financial instrument to this category is irrevocable and may take place only on initial recognition.
Held-to-maturity investments Held-to-maturity investments are financial assets with fixed or determinable payments and fixed maturity, which the Companyintends to hold to maturity (e.g. underwritten debentures).Evaluation of the intent and ability to hold the asset to maturity must be made on initial recognition and at each subsequentbalance sheet date.In the event of sale before maturity (of a significant amount and not in exceptional circumstances) of held-to-maturity securi-ties, all such investments are reclassified as financial assets held for trading and measured at fair value.
Loans and receivablesLoans and receivables are non-derivative financial assets with fixed or determinable payments that are not quoted on an acti-ve market and which the Company does not intend to trade in.These are classified in current assets with the exception of the portion expiring more than 12 months after the balance sheetdate, which is classified in non-current assets. Loans and receivables are classified within the financial statements under theheadings financial receivables and other receivables.
Available-for-sale financial assets All non-derivative instruments that are not classified in another category are designated as available-for-sale financial assets.These are classified as non-current assets unless management intends to dispose of them within 12 months of the balance sheetdate.
144

Accounting treatment Financial assets ‘at fair value through profit or loss’ held for trading (category 1) and available-for-sale financial assets (category4) are recorded at fair value including costs directly attributable to acquisition.Gains or losses relating to financial assets held for trading are recognised immediately in the income statement.Gains or losses relating to financial assets available for sale are recorded within a separate heading in equity until they are soldor otherwise disposed of, or until circumstances indicate they may be impaired. Where any of these events takes place, all gainsor losses recognised to date and recorded in equity are reclassified to the income statementFair value represents the amount at which an asset may be exchanged or a liability settled in an arm’s length transaction bet-ween knowledgeable, willing parties. As a result it is assumed that the entity is a going concern and that neither party needs toliquidate its assets through transactions applying unfavourable terms. In the case of securities traded on an active market, fair value is determined with reference to the bid price at the end of tra-ding at the balance sheet date. In the event that a market valuation is not available for the investment, fair value is determined either based on the current mar-ket value of another substantially similar financial instrument or applying appropriate valuation techniques (discounted cashflows - DCF).Where fair value may not be reliably determined, the financial asset is valued at cost with disclosure in the notes to the finan-cial statements regarding the type of asset and explanation of the accounting treatment.Held-to-maturity investments (category 2) and loans and receivables (category 3) are recorded at cost representing the fairvalue of the initial consideration exchanged and are subsequently valued applying the amortised cost method utilising the effec-tive interest rate and taking into consideration any discounts or premiums received at the date of acquisition in order to recordthem over the entire period of ownership up to maturity. Gains and losses are recognised in the income statement either whenthe investment reaches maturity or where circumstances indicate that it has suffered an impairment loss, in the same way theyare identified during the normal amortisation period foreseen by the amortised cost method.Investments in financial assets may be derecognised only when the contractual rights to receive cash flows from the invest-ments have expired (e.g. final payment of underwritten bonds) or when the company transfers the financial asset together withall of the related risks and rewards.
InventoriesFinished goods are stated at the lower of purchase cost and net realisable value.Purchase cost is determined using the weighted average cost method.Obsolete and slow moving inventory is valued based on possible future use or realisation.With regard to contract work in progress that spans more than one accounting period, valuation is based on income maturedto date with reasonable certainty, determined by comparing actual costs to date with the total estimated costs to completion.
ReceivablesReceivables are initially recorded at the fair value of the amount to be received, which for this category normally relates to thenominal value indicated on the invoice, adjusted where necessary to the estimated recoverable amount through recognition ofa provision for doubtful accounts. Subsequently, where the required conditions exist, receivables are valued applying the amor-tised cost method.
Cash and cash equivalentsCash and cash equivalents include cash on hand and demand and short-term deposits, the latter maturing in less than threemonths at the outset. Cash and cash equivalents are recorded at nominal value, or in the case of balances denominated inforeign currency at the year-end spot rate, which represents the fair value.
Non-current assets disposed of or held for sale (Discontinued operations)Non-current assets that have been disposed of or that are held for sale include those assets (or groups of assets) due to be dis-posed of and for which the accounting value will be recovered principally through sale rather than future use. Non-currentassets held for sale are valued at the lower of their carrying amount and fair value less costs to sell. In accordance with IFRS, information relating to discontinued operations is presented in two specific headings in the balancesheet: non-current assets held for sale and liabilities attributable to non-current assets held for sale; and in a specific headingin the income statement: net profit/(loss) of discontinued operations or non-current assets held for sale.
Provisions Provisions are recognised when a present obligation (legal or constructive) exists as a result of a past event and it is probablethat an outflow of resources embodying economic benefits will be required to settle the obligation and a reliable estimate of theamount may be made.
145

No provision is made for risks in relation to which the recognition of a liability is only possible. In this case the risk is disclo-sed in the relevant note on contingencies and commitments and no provision is made.Provisions may be analysed as follows:
LitigationThis provision includes the charge for future costs relating to legal proceedings.
InvestmentsProvision is made to recognise potential impairment losses in the carrying value of non-consolidated subsidiaries.
EnvironmentalThis provision is set up to meet future requirements in relation to the redevelopment of landfills in accordance with the obli-gations undertaken on receipt of permission from the relevant authorities. The provision is based on estimates prepared by spe-cialist enterprises.
Sundry risks provisionThis provision includes all other future liabilities not included above, which are reasonably quantifiable but for which the dateof occurrence is uncertain.
Staff leaving indemnity (TFR) Post-employment defined benefits and other long-term employee benefits are subjected to actuarial valuation. The liabilityrecognised in the balance sheet is the present value of the company’s obligations. Actuarial gains and losses are recognised inthe income statement.Valuation of the liability is performed by independent actuaries.
Trade payablesTrade payables are recorded at nominal value. Where the payment terms are such that a financial transaction exists, the nominal value of the liabilities measured applying theamortised cost method are discounted and the difference included in finance costs.Trade payables denominated in foreign currency are translated at year-end exchange rates and the gains and losses arising onexchange are recognised in the income statement in the period in which they arise.
Borrowings and financial liabilitiesBorrowings are recognised initially at fair value, net of transaction costs incurred. Subsequently, borrowings are stated at amor-tised cost. Finance costs are determined using the effective interest method.Other financial liabilities comprise derivative instruments entered into in order to hedge interest rate risk. The derivative instru-ments are not accounted for using hedge accounting and in accordance with IAS 39 are recognised at fair value through profitor loss. The company adopted IAS 39 from 1 January 2005.
Government grants Government grants are recognised when there is reasonable assurance that an entity will comply with any conditions attachedand that the grant will be received. Where grants are awarded to cover expenditure, they are classified as income and recogni-sed in the period in which the related costs are incurred. Where grants are received towards the cost of an asset, both the assetand the grant are recorded at nominal value and systematically charged to the income statement over the useful life of the cor-responding asset.Where the Company receives a non-monetary grant, the asset and the grant are recorded at nominal value and systematicallycharged to the income statement over the useful life of the corresponding asset. Where loans or subsidies awarded by govern-ment authorities or similar institutions bear interest rates below current market rates, the benefit arising from this difference isrecognised as an additional government grant.
Current tax liabilitiesThe provision for income taxes is based on the estimated taxable income for the period for each individual company, taking intoconsideration tax credits and losses brought forward and utilised in the period.
Accruals, prepayments and deferralsAccruals, prepayments and deferrals are determined applying the accruals concept.
146

Share capitalOrdinary shares are classified within share capital at nominal value. Incremental costs directly attributable to capital transac-tions are recorded as a deduction in equity.
Foreign currency translationThe functional currency of the company is the Euro and is the currency in which the annual financial statements are preparedand presented.Foreign currency transactions are recorded at the exchange rate existing at the date of the transaction. Receivables and paya-bles are translated at the closing rate at the balance sheet date. Exchange gains or losses arising on translation are recognisedin the income statement in the period in which they arise.Non-monetary items measured at historical cost are translated using the exchange rate at the date of the transaction. Non-monetary items measured at fair value are translated using the exchange rate at the date when the fair value was deter-mined.
Revenue recognitionRevenue is recorded net of returns, discounts and rebates, as well as direct taxes on the sale of goods or provision of services.
Revenue from product sales Revenue from the sale of products is recognised on the transfer of ownership, which normally takes place on delivery ordespatch of the goods.
Revenue from servicesRevenue from services is recognised once the service has been rendered.
InterestFinance income is accounted for applying the accruals concept.
DividendsDividends are recognised when the right to receipt of the dividend is established, which normally corresponds to the approvalof distribution in the shareholders’ meeting.
Other income Other income comprises amounts that do not relate to the core business of the Company and, in accordance with IAS 1 whichhas been applied from 1 January 2005, they are classified in ordinary activities and where significant in value are disclosed sepa-rately in the notes to the financial statements.
CostsCosts are recognised net of returns, discounts, bonuses and premiums, as well as direct taxes relating to the purchase of goodsand services.
Taxation including deferred income taxIncome tax is calculated and provided for based on estimated taxable income for the year and applying existing tax legislation. Deferred income taxes are calculated applying the liability method on all temporary differences between the tax bases of assetsand liabilities and the financial reporting values at the balance sheet date. Deferred income tax assets are recognised only when sufficient future taxable income against which these assets can be utili-sed is reasonably foreseeable. The balance of deferred income tax assets is reviewed at each balance sheet date and a valuationallowance is provided in the event that it is no longer probable that sufficient future taxable profits will be available to offset allor part of the tax credit. Deferred income tax assets and liabilities are measured at the enacted tax rates that will be in effect in the periods in which theassets are realised or the liability is settled and are classified in non-current assets and liabilities, respectively.
147

8.6.2 Balance sheet contents and movements
Assets
A Non-current assets
1 Intangible assets
Movements during the year were as follows:
At Acquisitions Capital.n Change in Disposals Other Impair- Amorti- At31.12.2010 and reclass.n scope of move- ment sation 31.12.2011
(Euro thousands) consol.n ments1.1 Industrial patent rights 78 313 (88) 3031.2 Concessions, licences,
trademarks and similar1.3 Goodwill1.4 Other intangibles1.5 Assets under construction
and advances 10 99 109Total 88 412 (88) 412
Acquisitions principally relate to Euro 252 thousand of software deriving from the acquisition of two businesses, other softwa-re for Euro 61 thousand and SAS software for Euro 99 thousand.No borrowing costs were capitalised during the year.
148

2 Property, plant and equipment
Movements during the year were as follows:
At Additions Capital.n Change in Disposals Impair- Deprec- At31.12.2010 and scope of ment iation 31.12.2011
reclass.n consol.n losses(Euro thousands) (A)Gross value2.1 Land 2.2 Buildings2.3 Plant and machinery2.4 Industrial and office equipment2.5 Other assets 269 458 (78) 6492.6 Assets operated under concession2.7 Assets under construction and advancesTotal gross value 269 458 (78) 649Accumulated depreciation2.1 Land2.2 Buildings2.3 Plant and machinery2.4 Industrial office and equipment2.5 Other assets (207) 70 (97) (234)2.6 Assets operated under concessionTotal depreciation (207) 70 (97) (234)Net book amounts2.1 Land 2.2 Buildings2.3 Plant and machinery2.4 Industrial and office equipment2.5 Other assets 62 458 (8) (97) 4152.6 Assets operated under concession2.7 Assets under construction and advancesTotal net book amounts 62 458 (8) (97) 415
A) Additions
Additions comprise:
(Euro thousands)Other assets included in acquisition of business from Falck SpA 247Motor vehicles 148Office furniture 63Total 458
Disposals comprise the sale of a motor vehicle and furniture and fittings that resulted in a gain on disposal of Euro 12 thou-sand.No borrowing costs were capitalised during the year.
149

3 Investments and financial assets
The total at 31 December 2011 may be analysed as follows:
(Euro thousands) 31.12.2011 31.12.2010 ChangeInvestments in subsidiaries 240,450 216,574 23,876Investments in associates 8,472 11,111 (2,639)Investments in other entities 11 11SecuritiesTotal 248,933 227,696 21,237
The change in investments in subsidiaries is due to participation in the share capital increase of Falck Renewables Wind Ltd forEuro 23,973 thousand and the impairment loss of Euro 97 thousand against the interest in Actagri Srl, which was merged withEsposito Servizi Ecologici Srl on 30 December 2011. The change in investments in associates is wholly attributable to the impairment loss recorded against the interest in PalermoEnergia Ambiente ScpA.
A comparison of the carrying amount of investments and the related share of net assets is illustrated below.An impairment test was performed on the investments where the carrying amount is greater than the related share of net assetsand there is indication of impairment (Prima Srl).
Company Business Total equity Share of Carrying (Euro thousands) sector at 31.12.2011 % holding total assets value DifferenceEcosesto SpA WtE, biomass, photovoltaic 9,673 100% 9,673 6,788 2,885Actelios Solar SpA WtE, biomass, photovoltaic 4,811 100% 4,811 1,125 3,686Frullo Energia Ambiente Srl WtE, biomass, photovoltaic 39,431 49% 19,321 8,472 10,849Ambiente 2000 Srl WtE, biomass, photovoltaic 2,697 60% 1,618 864 754Prima Srl WtE, biomass, photovoltaic 43,449 85% 36,932 28,494 8,438Esposito Servizi Ecologici Srl WtE, biomass, photovoltaic 145 100% 145 1,000 (855)Solar Mesagne Srl WtE, biomass, photovoltaic 1,534 100% 1,534 2,189 (655)Actelios Etnea Srl WtE, biomass, photovoltaic 39 100% 39 136 (97)Falck Renewables Wind Ltd (consolidated) Wind 53,411 99.99% 53,406 166,483 (113,077)
The higher book value of the above investments compared to the proportionate share of shareholders’ equity does not requirerecognition of an impairment loss given the future profit flows that are expected to be realised on the projects, however animpairment loss was recognised in the Investments provision in respect of Actelios Etnea Srl.The WACCs used to discount the cash flows are as follows:
WtE Italy 6.83%Wind sector UK 6.03%Wind sector Italy 7.18%Wind sector Spain 7.31%Wind sector France 6.28%Photovoltaic Italy 7.26%
150

Sicily Projects
Company Business Total equity Share of Carrying (Euro thousands) sector at 31.12.2011 % holding total assets value DifferenceElettroambiente SpA WtE, biomass, photovoltaic 1,412 100% 1,412 33,370 (31,958)
Elettroambiente SpAThe higher carrying value of the interest in Elettroambiente SpA compared to the share of total assets must be viewed withinthe context of the radical change in the projects’ operating conditions from “the development of WtE industrial projects as partof the new waste management plan” as at 31 December 2009 to “no longer feasible” following the Regional Law of 12 April2010, with the result that the recoverability of the carrying value of the investments hinges exclusively on the litigation pendingwith the Department of the Sicily Region. This higher value was supported by the impairment test performed for the preparation of the financial statements that took intoaccount the opinion of an independent legal expert, issued on 22 July 2010, who confirmed that in relation to the financialclaims raised by the Group in substance the situation had not changed as a result of the modification of the original claim fromspecific performance made in respect of the Agreement dated 28 April 2009 to a claim for termination due to the actions andfault of ARRA; at the date of preparation of these financial statements the independent legal expert upheld this view in an opi-nion issued in February 2012 that reiterated that no substantial changes in the dispute had arisen that would affect the assump-tions adopted to measure and assess the recoverability of the assets.
This impairment test was performed primarily taking into consideration all costs incurred at 31 December 2009 (pecuniarydamages), the compensation established in the Agreement with ARRA of 28 April 2009, costs incurred in 2010-2011, intereston costs incurred net of legal expenses, and by estimating the date of settlement of the total amount to be 2015.Total costs incurred up to 31 December 2009 amounted to Euro 93,422 thousand, while compensation was estimated at Euro27,879 thousand7. These amounts were discounted based on the interest rate swap rate at the presumed settlement date andused to calculate the equity value of Tifeo and Platani (in turn to determine the equity value of Elettroambiente). The impair-ment test did not indicate that the interest in Elettroambiente was impaired and no impairment loss was recognised.In addition to the above pecuniary damages, loss of profits was calculated only taking into account the compensation establis-hed in the Agreement of 28 April 2009 as this had been recognised by ARRA in the agreement, instead of the full loss of pro-fits associated with the case. Acknowledgement of the Company’s statements (already confirmed by the Company’s expert wit-nesses) regarding the entire loss of profits will be assessed by a court appointed technical consultant as part of the proceedingspending with the Department of the Sicily Region.The compensation corresponds to approximately 20% of the loss of profits of Tifeo and Platani, currently in liquidation, as partof the said proceedings8.
Palermo Energia Ambiente ScpAAt the date of preparation of the Annual Report, the first (2010) and second (2011) interim liquidation accounts of PalermoEnergia Ambiente Scpa (hereinafter “Pea”) had not been approved. Pea is one of the Sicily Project companies (Bellolampo-Palermo) currently in liquidation, in which the Company has a 23.2725% interest. This is due to a dispute with the shareholderAmia SpA (“Amia”), which holds a 48% interest in Pea and is currently in extraordinary administration. In the event that anagreement cannot be reached with Amia regarding approval of Pea’s third liquidation accounts, it is highly likely that the com-pany will be dissolved pursuant to article 2490 of the Italian Civil Code.
The above issues involving Pea do not apply to the other two Sicily Project companies, Tifeo and Platani (in which Falck Rene-wables SpA holds indirect interests of 96.35% and 86.77% respectively through its subsidiary Elettroambiente SpA).
7 The costs incurred are based on the 100% consolidation on a line-by-line basis of Tifeo (Falck Renewables SpA’s interest is 95.62%) and Platani (Falck Renew-ables SpA’s interest is 85.73%), while compensation was indirectly considered attributable in full to Elettroambiente SpA, 100% owned by Falck Renewables SpA.
8 The Industrial Operators requested compensation for the prejudice suffered both as pecuniary damages (amounting to: Tifeo, Euro 55,745,013; Platani, Euro37,676,745) and loss of profits (amounting to: Tifeo, Euro 94,100,000.00; Platani, Euro 47,800,000).
151

In light of this situation, which only involves Pea and in no way impacts on outstanding disputes between Tifeo and Platani andthe Department of the Sicily Region as confirmed by its legal advisors, Falck Renewables SpA recognised an impairment lossagainst the full carrying value of its investment in Pea amounting to Euro 2,639 thousand. Although there has been no sub-stantial change in the claims made in the proceedings as no facts have emerged that would alter significantly the outcome ofthe proceedings, certain risks and uncertainties regarding the corporate governance of Pea exist that affect the risk of recovera-bility of the impaired amounts.
4 Financial receivables
Financial receivables at 31 December 2011 may be analysed as follows:
31.12.2011 31.12.2010 ChangeTotal Non- Current Total Non- Current Total Non- Current
(Euro thousands) current current currentAmounts owed by third partiesAmounts owed by subsidiaries 381,854 96,989 284,865 358,706 87,920 270,786 23,148 9,069 14,079Amounts owed by associates 14 14 5,802 5,789 13 (5,788) (5,789) 1Amounts owed by parent companyAmounts owed by other Falck Group companiesDerivative financial instrumentsTotal 381,868 96,989 284,879 364,508 93,709 270,799 17,360 3,280 14,080
Financial receivables are disclosed net of the provision for doubtful amounts of Euro 6,022 thousand.Non-current amounts owed by subsidiaries relate to the loans granted to Elettroambiente SpA for Euro 80,889 thousand, PrimaSrl for Euro 6,374 thousand and Actelios Solar SpA for Euro 9,726 thousand.Current amounts owed by associates is in respect of a loan to Eolica Calabra Srl, currently in liquidation.Current amounts owed by subsidiaries increased principally in relation to the correspondence current account balances withEcosesto Spa (+Euro 10,441 thousand) and Eolica Petralia Srl (+Euro 24,686 thousand), offset by the decrease in the balancewith Falck Renewables Wind Ltd (-Euro 18,465 thousand). The above transactions are detailed in the related party transactions note.Financial receivables owed by Elettroambiente SpA were subjected to an impairment test that did not indicate the existence ofan impairment loss.An impairment loss was recorded in the provision for doubtful amounts in respect of the total amount due from Palermo Ener-gia Ambiente ScpA (Euro 6,022 thousand).
5 Trade receivables
Trade receivables at 31 December 2011 consisted of the following:
31.12.2011 31.12.2010 ChangeTotal Non- Current Total Non- Current Total Non- Current
(Euro thousands) current current currentTrade receivables 22 22 91 91 (69) (69)Amounts owed by subsidiaries 3,508 1,571 1,937 1,804 1,804 1,704 1,571 133Amounts owed by associates 64 64 2,809 2,763 46 (2,745) (2,763) 18Amounts owed by parent company 121 121 34 34 87 87Amounts owed by other group companies 115 115 1 1 114 114Total 3,830 1,571 2,259 4,739 2,763 1,976 (909) (1,192) 283
The Company set-up a provision for doubtful accounts of Euro 3,021 thousand.The Company does not have significant receivables due from non-domestic customers that require disclosure.
152

An impairment test was carried out on amounts owed by Platani Energia Ambiente ScpA, Tifeo Energia Ambiente ScpA andElettroambiente SpA that did not indicate the existence of an impairment loss.An impairment loss was recognised in the provision for doubtful accounts against the full balance of trade receivables owed byPalermo Energia Ambiente ScpA (Euro 3,021 thousand).
6 Other receivables
Other receivables at 31 December 2011 comprised:
31.12.2011 31.12.2010 ChangeTotal Non- Current Total Non- Current Total Non- Current
(Euro thousands) current current currentAmounts owed by third parties 102 102 12 12 90 90Amounts owed by subsidiaries 11,050 11,050 6,855 6,855 4,195 4,195Amounts owed by associates 8,771 8,771 4,606 4,606 4,165 4,165Amounts owed by parent company 1,904 764 1,140 1,477 790 687 427 (26) 453Amounts owed by other group companiesTax credits 66 66 (66) (66)Accrued income and prepayments 17 17 (17) (17)Total 21,827 764 21,063 13,033 790 12,243 8,794 (26) 8,820
Amounts owed by subsidiaries and associates principally relate to the dividends declared by the shareholders of Prima Srl andFrullo Energia Ambiente Srl that had not been paid at the year-end.The amounts owed by parent company consist of the amount owed by Falck SpA under the Group VAT return (Euro 564 thou-sand) and the Group consolidated tax regime (Euro 1,340 thousand); this has been analysed into current and non-current as aportion of the balance will not be settled during 2012 but in future periods, consequently Euro 764 thousand was classified asnon-current other receivables.
7 Deferred income tax assets
Deferred income tax assets may be analysed as follows:
31.12.2011 31.12.2010Temporary Rate Deferred Temporary Rate Deferred
(Euro thousands) difference income tax difference income taxEmployee bonuses and directors' emoluments 1,946 27.50% 535 806 27.50% 222Expenses for share capital increase 6,704 27.50% 1,844 4,787 27.50% 1,316Charge to litigation provision 250 32.32% 81Goodwill on acquisition of business 1,270 32.32% 410Other 1,366 27.50% 375 106 27.50% 29Total 3,245 1,567
Deferred income tax assets in the financial statements of Euro 2,953 thousand, comprises Euro 3,245 thousand of deferred inco-me tax assets net of deferred income tax liabilities of Euro 292 thousand.
B Current assets
8 Inventories
The Company had no inventories at 31 December 2011.
153

9 Cash and cash equivalents
(Euro thousands) 31.12.2011 31.12.2010 ChangeShort-term bank and post office deposits 174 33 141Cash in hand 3 3Total 177 33 144
Cash and cash equivalents may be further detailed as follows:
(Euro thousands) 31.12.2011 31.12.2010 ChangeCash at bank and in hand 177 33 144Bank overdrafts (121) (121)Invoice advancesGroup current accounts (4,278) (5,374) 1,096Total cash and cash equivalents (4,222) (5,341) 1,119
Liabilities
D Equity
10 Share capital
Share capital consists of 291,413,891 issued and fully paid ordinary shares, with a nominal value of Euro 1 each. The number ofshares increased by 129,517,284 with a nominal value of Euro 1 each subsequent to the share capital increase. Total equity may be analysed as follows:
Summary of utilisationTotal Possible Share in three previous financial years
(Euro thousands) utilisation available To cover losses Other reasonsShare capital 291,414Capital reservesShare premium 620,976 A-B-C (*) 620,976Reserve for share capital increase expenses (8,731) (8,731)Revaluation reserves ex Law 72/83 1,003 A-B 1,003Reserve ex art.54 Pres. Decree 597/73 3,424 A-B 3,424Reserve ex art.55 Pres. Decree 597/73 653 A-B 653Fair value reserve (863) (863)Reserve on common control transactions (860)Demerger surplus (371,598) A-B (371,598)Earnings reservesLegal reserve 2,972 B 2,972Profit carried forward 20,022 A-B-C 20,022Total 558,412 267,858
Key:A: share capital increaseB: to cover lossesC: distributed to shareholders
(*): Pursuant to article 2431 of the Italian Civil Code, the total reserve may be distributed only if the legal reserve meets the limit imposed by article 2430of the Italian Civil Code.
154

Movements in equity during 2010 and 2011 were as follows:
At Appropriation Loss for Share capital Other At(Euro thousands) 31.12.2009 of result the year increase movements 31.12.2010Share capital 67,680 94,217 161,897Share premium 240,828 379,693 620,521Revaluation reserve 1,003 1,003Legal reserve 2,460 512 2,972Reserve for expenses on share capital increase (3,492) (2,778) (6,270)Statutory reservesOther reserves- ex art. 54 Pres. Decree 597/73 3,424 3,424- ex art. 55 Pres. Decree 597/73 653 653- demerger surplus 3,936 (375,534) (371,598)Retained earnings 19,737 3,976 23,713Profit/(loss) for the year 10,240 (10,240) (194) (194)Total 346,469 (5,752) (194) 98,376 (2,778) 436,121
At Appropriation Loss for Share capital Other At(Euro thousands) 31.12.2010 of result the year increase movements 31.12.2011Share capital 161,897 129,517 291,414Share premium 620,521 455 620,976Revaluation reserve 1,003 1,003Legal reserve 2,972 2,972Reserve for expenses on share capital increase (6,270) (2,461) (8,731)Statutory reservesOther reserves- ex art. 54 Pres. Decree 597/73 3,424 3,424- ex art. 55 Pres. Decree 597/73 653 653- demerger surplus (371,598) (371,598)- fair value reserve (863) (863)- reserve for transactions under
common control (860) (860)Retained earnings 23,713 (3,691) 20,022Loss for the year (194) 194 (1,776) (1,776)Total 436,121 194 (1,776) 127,511 (5,414) 556,636
The reserve for expenses on share capital increase and the fair value reserve are disclosed net of the related tax effect.
155

11 Provisions for other liabilities and charges
Change At in scope Charged Credited Other Foreign At
(Euro thousands) 31.12.2010 of consol.n movements exchange 31.12.2011Provisions for pensions and similarobligationsOther provisions- litigation 250 250- investments 455 455- environmental- restructuring- sundry risks provision 1,067 3,204 4,271Total other provisions 1,067 3,909 4,976Total 1,067 3,909 4,976
The charge to the litigation provision relates to disputes with former employees.The charge to the investments provision reflects the probable losses that will be incurred on the interest in Actelios Etnea Srland trade receivables due from it, following the abandonment of photovoltaic plant development projects. The charge to the sundry risks provision includes Euro 3,204 thousand representing Falck Renewables SpA’s commitment toprovide financial support to Palermo Energia Ambiente ScpA in order that it may settle certain creditors (including Euro 994thousand due to Elettroambiente).
12 Staff leaving indemnity (TFR)
At Charges Transfers/ Utilised/ At(Euro thousands) 31.12.2010 new consol.n paid 31.12.2011Managers 251 161 157 (112) 457White-collar staff and special categ.s 275 165 415 (40) 815Blue-collar staffTotal 526 326 572 (152) 1,272
The “Trattamento di Fine Rapporto” (TFR) (staff leaving indemnity provision), was subjected to an actuarial calculation by anindependent expert.
The actuarial financial assumptions used at 31 December 2010 and for the purpose of estimating the cost for 2011 are as fol-lows:
(%) 31.12.2011 31.12.2010 ChangeAnnual discount rate 4.60% 4.60% 0.00%Annual inflation rate 2.00% 2.00% 0.00%Annual total pay increase rate 3.00% 3.00% 0.00%Annual TFR increase rate 3.00% 3.00% 0.00%
156
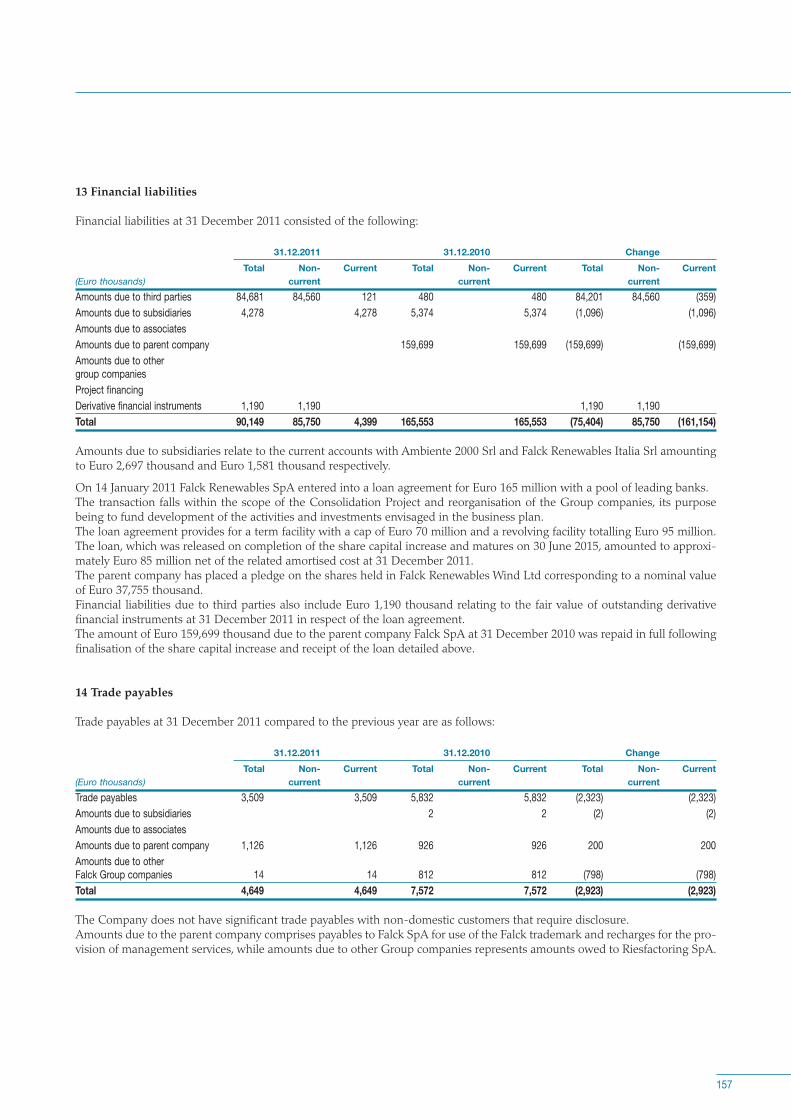
13 Financial liabilities
Financial liabilities at 31 December 2011 consisted of the following:
31.12.2011 31.12.2010 ChangeTotal Non- Current Total Non- Current Total Non- Current
(Euro thousands) current current currentAmounts due to third parties 84,681 84,560 121 480 480 84,201 84,560 (359)Amounts due to subsidiaries 4,278 4,278 5,374 5,374 (1,096) (1,096)Amounts due to associatesAmounts due to parent company 159,699 159,699 (159,699) (159,699)Amounts due to other group companiesProject financingDerivative financial instruments 1,190 1,190 1,190 1,190Total 90,149 85,750 4,399 165,553 165,553 (75,404) 85,750 (161,154)
Amounts due to subsidiaries relate to the current accounts with Ambiente 2000 Srl and Falck Renewables Italia Srl amountingto Euro 2,697 thousand and Euro 1,581 thousand respectively.
On 14 January 2011 Falck Renewables SpA entered into a loan agreement for Euro 165 million with a pool of leading banks.The transaction falls within the scope of the Consolidation Project and reorganisation of the Group companies, its purposebeing to fund development of the activities and investments envisaged in the business plan.The loan agreement provides for a term facility with a cap of Euro 70 million and a revolving facility totalling Euro 95 million.The loan, which was released on completion of the share capital increase and matures on 30 June 2015, amounted to approxi-mately Euro 85 million net of the related amortised cost at 31 December 2011. The parent company has placed a pledge on the shares held in Falck Renewables Wind Ltd corresponding to a nominal valueof Euro 37,755 thousand.Financial liabilities due to third parties also include Euro 1,190 thousand relating to the fair value of outstanding derivativefinancial instruments at 31 December 2011 in respect of the loan agreement.The amount of Euro 159,699 thousand due to the parent company Falck SpA at 31 December 2010 was repaid in full followingfinalisation of the share capital increase and receipt of the loan detailed above.
14 Trade payables
Trade payables at 31 December 2011 compared to the previous year are as follows:
31.12.2011 31.12.2010 ChangeTotal Non- Current Total Non- Current Total Non- Current
(Euro thousands) current current currentTrade payables 3,509 3,509 5,832 5,832 (2,323) (2,323)Amounts due to subsidiaries 2 2 (2) (2)Amounts due to associatesAmounts due to parent company 1,126 1,126 926 926 200 200Amounts due to other Falck Group companies 14 14 812 812 (798) (798)Total 4,649 4,649 7,572 7,572 (2,923) (2,923)
The Company does not have significant trade payables with non-domestic customers that require disclosure. Amounts due to the parent company comprises payables to Falck SpA for use of the Falck trademark and recharges for the pro-vision of management services, while amounts due to other Group companies represents amounts owed to Riesfactoring SpA.
157

15 Other payables
Other payables at 31 December 2011 compared to 31 December 2010 are as follows:
31.12.2011 31.12.2010 ChangeTotal Non- Current Total Non- Current Total Non- Current
(Euro thousands) current current currentAmounts due to third party creditors 2,733 2,733 887 887 1,846 1,846Amounts due to subsidiariesAmounts due to associatesAmounts due to parent companyAmounts due to other Falck Group companiesAccruals and deferred incomeTotal 2,733 2,733 887 887 1,846 1,846
Amounts due to third party creditors may be detailed as follows:
(Euro thousands) 31.12.2011 31.12.2010Other amounts due to employees (Mbo) 1,162 323 Holiday pay 529 223 Social security payable 642 176 Tax payable 354 139 Other 46 26 Total 2,733 887
Commitments and contingencies
Guarantees issued at 31 December 2011 for both the Company and its subsidiaries amounted to Euro 11,520 thousand andrelated to performance bonds to guarantee completion of work in progress and to participate in tenders for contracts (Euro3,765 thousand) and guarantees issued to the VAT authorities (Euro 4,553 thousand). Also included are Euro 3,202 thousand ofother guarantees.
Upon request of the liquidators of the Sicily Project companies Tifeo and Platani, Falck Renewables SpA has agreed to providethe financial support they need in order to settle third party debts excluding those with current and previous shareholders andpursue pending legal proceedings against the Sicily Region’s Department for Energy and Public Utilities.
Other risks
With regard to the price adjustment of Euro 20 million relating to the investment in Elettroambiente SpA and the correspon-ding decrease in other payables due to Italgest Energia SpA that were recorded in the 2009 financial statements, Falck Rene-wables SpA is exposed to a remote risk in respect of this amount with regard to the potential reinstatement of the contractualconditions on which the total acquisition price of Elettroambiente SpA was based, although this is considered improbable.
Related party transactions
In compliance with Consob’s circulars of 20 February 1997, 27 February 1998, 30 September 1998, 30 September 2002 and 27July 2006, no uncharacteristic or uncommon transactions take place with related parties that are outside the normal businessoperations or are detrimental to the Company’s results of operations, state of affairs and financial position.Related party transactions represent the day to day business activities that are carried out at arm’s length. These comprise therecharge of costs between group companies and intercompany current accounts that give rise to finance income and costs. In accordance with IAS 24 Related Party Disclosures and the disclosures pursuant to Consob circular 6064293 of 28 July 2006,all related party transactions and the corresponding incidence on Falck Renewables SpA’s balance sheet headings are providedbelow.
158

Trade receivables Trade payables(Euro thousands) 31.12.2011 31.12.2010 Change 31.12.2011 31.12.2010 ChangeSubsidiariesAbbiategrasso Bioenergia Srl 4 (4)Actagri Srl 14 (14)Actelios Solar SpA 58 34 24Ambiente 2000 Srl 111 50 61Ecosesto SpA 217 104 113Elettroambiente SpA 32 15 17 2 (2)Ecocentro Soluzioni Ambientali Srl 16 (16)Eolica Sud Srl 57 57Eolica Petralia Srl 128 128Eolo 3W Minervino Murge Srl 48 48Esposito Servizi Ecologici Srl 342 39 303Falck Renewables Italia Srl 63 17 46Falck Renewables Wind Ltd 160 160Geopower Sardegna Srl 67 67Platani Energia Ambiente ScpA (in liquid.) 760 656 104Prima Srl 618 135 483Solar Mesagne Srl 20 9 11Actelios Etnea Srl 16 4 12Tifeo Energia Ambiente ScpA (in liquid.) 811 707 104Total subsidiaries 3,508 1,804 1,704 2 (2)AssociatesFrullo Energia Ambiente Srl 64 46 18Palermo Energia Ambiente ScpA (in liquid.) 2,763 (2,763)Total associates 64 2,809 (2,745)Parent companyFalck SpA 121 34 87 1,126 926 200Total parent company 121 34 87 1,126 926 200Group companiesFalck Energy SpA 60 60 812 (812)Riesfactoring SpA 27 1 26 14Sesto Siderservizi Srl 28 28Total Group companies 115 1 114 14 812 (812)Total 3,808 4,648 (840) 1,140 1,740 (614)% incidence on balance sheet heading 99.4% 98% 25% 23%
159

Financial receivables Financial payables(Euro thousands) 31.12.2011 31.12.2010 Change 31.12.2011 31.12.2010 ChangeSubsidiariesAbbiategrasso Bioenergia Srl 70 (70)Actagri Srl 66 (66)Actelios Solar SpA 9,726 2,901 6,825Ambiente 2000 Srl 2,697 1,559 1,138Ecosesto SpA 21,310 10,869 10,441Elettroambiente SpA 80,889 78,645 2,244Eolica Sarda Srl 310 (310)Ecocentro Soluzioni Ambientali Srl 9,245 (9,245)Esposito Servizi Ecologici Srl 11,875 4,152 7,723Falck Renewables Wind Ltd 215,592 234,057 (18,465)Falck Renewables Italia Srl 1,581 3,815 (2,234)Eolica Petralia Srl 28,750 4,064 24,686Prima Srl 6,374 6,374Actelios Etnea Srl 339 235 104Solar Mesagne Srl 6,999 7,718 (719)Total subsidiaries 381,854 358,706 23,148 4,278 5,374 (1,096)AssociatesFrullo Energia Ambiente SrlEolica Calabra Srl 14 13 1Palermo Energia Ambiente ScpA (in liquid.) 5,789 (5,789)Total associates 14 5,802 (5,788)Parent companyFalck SpA 159,699 (159,699)Total parent company 159,699 (159,699)Total 381,868 364,508 17,360 4,278 165,073 (160,795)% incidence on balance sheet heading 100% 100% 4.7% 99.7%
Other receivables Other payables(Euro thousands) 31.12.2011 31.12.2010 Change 31.12.2011 31.12.2010 ChangeSubsidiariesFalck Renewables Italia Srl 55 (55)Prima Srl 11,050 6,800 4,250Total subsidiaries 11,050 6,855 4,195AssociatesFrullo Energia Ambiente Srl 8,771 4,606 4,165Total associates 8,771 4,606 4,165Parent companyFalck SpA 1,904 1,477 427Total parent company 1,904 1,477 427Total 21,725 12,938 8,787% incidence on balance sheet heading 99.5% 99%
160
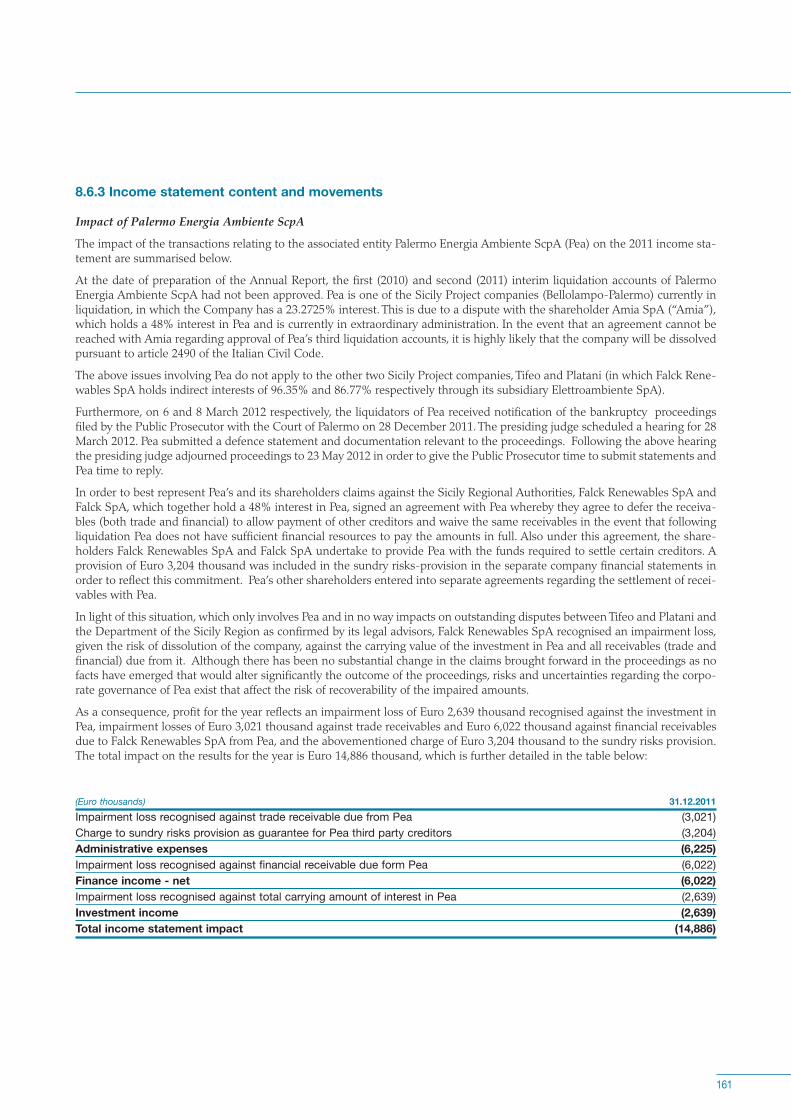
8.6.3 Income statement content and movements
Impact of Palermo Energia Ambiente ScpAThe impact of the transactions relating to the associated entity Palermo Energia Ambiente ScpA (Pea) on the 2011 income sta-tement are summarised below.
At the date of preparation of the Annual Report, the first (2010) and second (2011) interim liquidation accounts of PalermoEnergia Ambiente ScpA had not been approved. Pea is one of the Sicily Project companies (Bellolampo-Palermo) currently inliquidation, in which the Company has a 23.2725% interest. This is due to a dispute with the shareholder Amia SpA (“Amia”),which holds a 48% interest in Pea and is currently in extraordinary administration. In the event that an agreement cannot bereached with Amia regarding approval of Pea’s third liquidation accounts, it is highly likely that the company will be dissolvedpursuant to article 2490 of the Italian Civil Code.
The above issues involving Pea do not apply to the other two Sicily Project companies, Tifeo and Platani (in which Falck Rene-wables SpA holds indirect interests of 96.35% and 86.77% respectively through its subsidiary Elettroambiente SpA).
Furthermore, on 6 and 8 March 2012 respectively, the liquidators of Pea received notification of the bankruptcy proceedingsfiled by the Public Prosecutor with the Court of Palermo on 28 December 2011. The presiding judge scheduled a hearing for 28March 2012. Pea submitted a defence statement and documentation relevant to the proceedings. Following the above hearingthe presiding judge adjourned proceedings to 23 May 2012 in order to give the Public Prosecutor time to submit statements andPea time to reply.
In order to best represent Pea’s and its shareholders claims against the Sicily Regional Authorities, Falck Renewables SpA andFalck SpA, which together hold a 48% interest in Pea, signed an agreement with Pea whereby they agree to defer the receiva-bles (both trade and financial) to allow payment of other creditors and waive the same receivables in the event that followingliquidation Pea does not have sufficient financial resources to pay the amounts in full. Also under this agreement, the share-holders Falck Renewables SpA and Falck SpA undertake to provide Pea with the funds required to settle certain creditors. Aprovision of Euro 3,204 thousand was included in the sundry risks-provision in the separate company financial statements inorder to reflect this commitment. Pea’s other shareholders entered into separate agreements regarding the settlement of recei-vables with Pea.
In light of this situation, which only involves Pea and in no way impacts on outstanding disputes between Tifeo and Platani andthe Department of the Sicily Region as confirmed by its legal advisors, Falck Renewables SpA recognised an impairment loss,given the risk of dissolution of the company, against the carrying value of the investment in Pea and all receivables (trade andfinancial) due from it. Although there has been no substantial change in the claims brought forward in the proceedings as nofacts have emerged that would alter significantly the outcome of the proceedings, risks and uncertainties regarding the corpo-rate governance of Pea exist that affect the risk of recoverability of the impaired amounts.
As a consequence, profit for the year reflects an impairment loss of Euro 2,639 thousand recognised against the investment inPea, impairment losses of Euro 3,021 thousand against trade receivables and Euro 6,022 thousand against financial receivablesdue to Falck Renewables SpA from Pea, and the abovementioned charge of Euro 3,204 thousand to the sundry risks provision.The total impact on the results for the year is Euro 14,886 thousand, which is further detailed in the table below:
(Euro thousands) 31.12.2011Impairment loss recognised against trade receivable due from Pea (3,021)Charge to sundry risks provision as guarantee for Pea third party creditors (3,204)Administrative expenses (6,225)Impairment loss recognised against financial receivable due form Pea (6,022)Finance income - net (6,022)Impairment loss recognised against total carrying amount of interest in Pea (2,639)Investment income (2,639)Total income statement impact (14,886)
161

16 Revenue
Revenue consisted of the following:
(Euro thousands) 31.12.2011 31.12.2010 ChangeRevenue from sale of goodsRevenue from provision of services 140 364 (224)Total 140 364 (224)
17 Employee costs
Employee costs may be analysed as follows:
(Euro thousands) 31.12.2011 31.12.2010 ChangeCost of production employeesCost of administrative staff 7,487 4,549 2,938Total 7,487 4,549 2,938
Total employee costs analysed by nature of expense are as follows:
(Euro thousands) 31.12.2011 31.12.2010 ChangeWages and salaries 5,472 2,350 3,122Social security costs 1,689 781 908Staff leaving indemnity (TFR) 326 168 158Other costs 1,250 (1,250)Total 7,487 4,549 2,938
The average number of employees was as follows:
(Number) 31.12.2011 31.12.2010Managers 15 8White-collar staff 50 25Blue-collar staffTotal average number of employees 65 33
Employee costs increased principally due to an increase in employee numbers followings acquisition of the two businesses fromFalck SpA and Riesfactoring SpA.
18 Direct costs
(Euro thousands) 31.12.2011 31.12.2010 ChangeMaterialsServices 130 93 37Other costsTotal 130 93 37
162

19 Other income
Other income may be analysed as follows:
(Euro thousands) 31.12.2011 31.12.2010 ChangeIncome from operating activities 5,029 2,867 2,162Income from non-operating activities 66 134 (68)Total 5,095 3,001 2,094
Income from operating activities may be further detailed as follows:
(Euro thousands) 31.12.2011 31.12.2010 ChangeIncome from services provided to other Group companies 4,799 2,786 2,013Other 230 81 149Total 5,029 2,867 2,162
Income from non-operating activities may be further detailed as follows:
(Euro thousands) 31.12.2011 31.12.2010 ChangeIncome relating to other accounting periods 38 126 (88)Other 28 8 20Total 66 134 (68)
20 Administrative expenses
Administrative expenses may be detailed as follows:
(Euro thousands) 31.12.2011 31.12.2010 ChangeMaterials 218 111 107Services 5,042 5,370 (328)Other costs 3,017 1,478 1,539Non-operating expenses 3,356 1 3,355Amortisation and impairment of intangible assets 88 21 67Depreciation and impairment of property, plant and equipment 97 33 64Charges to provisions 3,454 1,067 2,387Total 15,272 8,081 7,191
Administrative expenses increased on the previous year due to the impairment loss recognised against the trade receivables duefrom Palermo Energia Ambiente (Euro 3,021 thousand) and the charge to the sundry risks provision (Euro 3, 204 thousand) tocover Falck Renewables SpA’s commitment to provide financial support to Palermo Energia Ambiente ScpA in order to settlecertain creditors (including Euro 994 thousand due to Elettroambiente).
21 Finance income - net
Finance income and costs comprised:
(Euro thousands) 31.12.2011 31.12.2010 ChangeFinance costs (26,353) (89) (26,264)Finance income 29,596 4,354 25,242Borrowing costs capitalised on construction projectsTotal 3,243 4,265 (1,022)
Finance costs comprise the impairment loss of Euro 6,022 thousand recognised against financial receivables due from PalermoEnergia Ambiente ScpA.
163

Finance costs consisted of the following:
(Euro thousands) 31.12.2011 31.12.2010 ChangeInterest payable to subsidiaries 96 3 93Interest payable to associatesInterest payable to the parent company 1,182 22 1,160Interest on M/L-term loans 1,994 1,994Interest arising on amortised cost method 634 634Bank charges 69 6 63Commission on guarantees 145 58 87Other finance costs 6,482 6,482Foreign exchange losses 15,751 15,751Total 26,353 89 26,264
Finance costs for 2011 and 2010 may be further analysed as follows:
31.12.2011Debenture Bank Others Total
(Euro thousands) loans borrowingsPayable to subsidiaries 96 96Payable to associatesPayable to parent company 1,182 1,182Payable to others 9,299 15,776 25,075Total 9,299 17,054 26,353
31.12.2010Debenture Bank Others Total
(Euro thousands) loans borrowingsPayable to subsidiaries 25 25Payable to associatesPayable to parent companyPayable to others 64 64Total 64 25 89
Finance income for the year ended 31 December 2011 may be detailed as follows:
(Euro thousands) 31.12.2011 31.12.2010 ChangeInterest income and commission from subsidiaries 13,621 2,459 11,162Interest income and commission from associates 195 166 29Interest income and commission from parent company 1,728 (1,728)Interest income and commission from banks 33 33Foreign exchange gains 15,745 1 15,744Interest income and commission from others 2 2Total 29,596 4,354 25,242
164

22 Investment income
(Euro thousands) 31.12.2011 31.12.2010 ChangeDividends from Frullo Energia Ambiente Srl 8,771 2,940 5,831Dividends from Prima Srl 6,800 4,250 2,550Dividends from Ambiente 2000 Srl 240 240Dividends from Riesfactoring SpA 1 (1)Charge to investments provision in respect of Actelios Etnea Srl (455) (455)Impairment loss on Actagri Srl (97) (1,029) 932Impairment loss on Powercrop SpA (2,734) 2,734Impairment loss on Palermo Energia Ambiente ScpA (2,639) (2,639)Use of investments provision 465 (465)Total 12,620 3,893 8,727
23 Income tax expense
(Euro thousands) 31.12.2011 31.12.2010 ChangeCurrent tax 300 896 (596)Deferred tax (285) 110 (395)Total 15 1,006 (991)
(Euro thousands) 31.12.2011 31.12.2010(Loss) before taxation (1,791) (1,200)Taxes calculated applying tax rate to profit 562 376Profits not subject to tax 4,184 1,847Expenses not deductible for tax purposes (4,731) (1,217)Total income tax expense 15 1,006
Related party transactions
In compliance with Consob’s circulars of 20 February 1997, 27 February 1998, 30 September 1998, 30 September 2002 and 27July 2006, no uncharacteristic or uncommon transactions take place with related parties that are outside the normal businessoperations or are detrimental to the Company’s results of operations, state of affairs and financial position.Related party transactions represent the day to day business activities that are carried out at arm’s length. These comprise therecharge of costs between Group companies and intercompany current accounts that give rise to finance income and costs. In accordance with IAS 24 Related Party Disclosures and the disclosures pursuant to Consob circular 6064293 of 28 July 2006,all related party transactions and the corresponding incidence of related party transactions on Falck Renewables SpA’s incomestatement headings are provided below.
165

Revenue Other Recharged Other Income Services Other Income Other Interestfrom sales operating expenses income relating to costs from equity financial and other
and services income other investments income financial (Euro thousands) periods chargesSubsidiariesAmbiente 2000 Srl 364 1 240 46Actelios Solar SpA 178 293Actagri Srl (97)Ecosesto SpA 597 36 1,000Elettroambiente SpA 40 20 950Esposito Servizi Ecologici Srl 18 618 7 2 532Eolica Petralia Srl 64 420 1 494Eolica Sud Srl 188Eolo 3W Minervino Murge Srl 158Falck Renewables Italia Srl 207 50Falck Renewables Wind Ltd 640 13 9,736Geopower Sardegna Srl 218 1 9Platani Energia Ambiente ScpA 36 40 16 4Prima Srl 631 24 6,800 280Solar Mesagne Srl 67 307Actelios Etnea Srl 53 (455) 11Tifeo Energia Ambiente ScpA (in liquid.) 36 40 16 5Total subsidiaries 82 4,451 170 32 15 6,488 13,621 96Parent companyFalck SpA 100 1,050 591 1,182Total parent company 100 1,050 591 1,182AssociatesEolica Calabra Srl 1Frullo Energia Ambiente Srl 77 17 8,771Palermo Energia Ambiente ScpA (in liquid.) 20 40 (2,639) 194Total associates 97 57 6,132 195Group companiesFalck Energy SpA 50Sesto Siderservizi Srl 23Riesfactoring SpA 1 74 3 14Total Group companies 1 147 3 14Total 83 4,795 230 32 1,079 591 12,620 13,816 1,278% incidence on income statement heading 59.3% 94.1% 4.5% 0.6% 7.1% 3.9% 100% 46.7% 4.8%
24 Significant non-recurring events and transactions
Pursuant to Consob communication DEM/6064293 of 28 July 2006, the only significant non-recurring transactions carried outby Falck Renewables SpA in the course of 2011 related to the extraordinary transaction that did not have an impact on the inco-me statement.
25 Uncharacteristic and uncommon transactions
Pursuant to Consob communication DEM/6064293 of 28 July 2006, in the course of 2011 Falck Renewables SpA did not carryout any uncharacteristic and/or uncommon transactions, as defined in the communication.
166

Emoluments of directors, statutory auditors and managing directors
In accordance with Consob Circular 11971 of 14 May 1999, details of all emoluments and fees, for all amounts paid to eachparty, including amounts from subsidiaries, are provided below:
Bonuses Other (Euro) Benefits and other remunerat-Name Office Term of office Emoluments in kind incentives ion Federico Falck Chairman Falck Renewables SpA 1.1.2011-31.12.2011 Approval 2013
annual report 31 1 Bruno Isabella Deputy chairman Falck Renewables SpA 1.1.2011-6.5.2011 - 6 Guido Rosa Deputy chairman Falck Renewables SpA 6.5.2011-31.12.2011 Approval 2013
annual report 20 Director Falck Renewables SpA 1.1.2011-6.5.2011 - 4
Piero Manzoni CEO Falck Renewables SpA 1.1.2011-31.12.2011 Approval 2013 annual report 437 (*) 200(*)
Remuneration committee Falck Renewables SpA 1.1.2011-6.5.2011 - -
Marco Agostini Director Falck Renewables SpA 1.1.2011-31.12.2011 Approval 2013 annual report 17
Augusto Clerici Bagozzi Director Falck Renewables SpA 1.1.2011-6.5.2011 - 4 Chairman Internal Control Committee Falck Renewables SpA 1.1.2011-6.5.2011 - 3
Guido Corbetta Director Falck Renewables SpA 1.1.2011-31.12.2011 Approval 2013 annual report 17
Enrico Falck Director Falck Renewables SpA 1.1.2011-31.12.2011 Approval 2013 annual report 17 (*) 97 (*)
Elisabetta Falck Director Falck Renewables SpA 1.1.2011-31.12.2011 Approval 2013 annual report 17
Giovanni Maria Garegnani Director Falck Renewables SpA 1.1.2011-31.12.2011 Approval 2013 annual report 17
Chairman of Supervisory Body 1.1.2011-31.12.2011 Approval 2013 Falck Renewables SpA annual report 10
William Jacob Heller Director Falck Renewables SpA 6.5.2011-31.12.2011 Approval 2013 annual report 13 42 (**) 359 (**)
Chairman Actelios Solar SpA 20.7.2011-31.12.2011 Approval 2011 annual report -
Marco Mangiagalli Director Falck Renewables SpA 6.5.2011-31.12.2011 Approval 2013 annual report 13
Internal Control Committee 6.5.2011-31.12.2011 Approval 2013 Falck Renewables SpA annual report 13
Ferruccio Marchi Director Falck Renewables SpA 1.1.2011-6.5.2011 - 4 Andrea Merloni Director Falck Renewables SpA 6.5.2011-31.12.2011 Approval 2013
annual report 13 Remuneration committee 6.5.2011-31.12.2011 Approval 2013 Falck Renewables SpA annual report 10
Libero Milone Director Falck Renewables SpA 6.5.2011-31.12.2011 Approval 2013 annual report 13
Chairman Internal Control Committee 6.5.2011-31.12.2011 Approval 2013 Falck Renewables SpA annual report 16 Remuneration committee 6.5.2011-31.12.2011 Approval 2013 Falck Renewables SpA annual report 10
* amount recharged to the parent company Falck SpA, Enrico Falck receives Other remuneration from his role as assistant to the Chairman** the salary and benefits in kind of William Jacob Heller are paid by Falck Renewables Wind Ltd
167

Bonuses Other (Euro) Benefits and other remunerat-Name Office Term of office Emoluments in kind incentives ion Umberto Rosa Director Falck Renewables SpA 1.1.2011-6.5.2011 - 4
Remuneration committee Falck Renewables SpA 1.1.2011-6.5.2011 - 2 Internal Control Committee Falck Renewables SpA 1.1.2011-6.5.2011 - 3
Bernardo Rucellai Director Falck Renewables SpA 1.1.2011-31.12.2011 Approval 2013 annual report 17
Internal Control Committee 1.1.2011-31.12.2011 Approval 2013 Falck Renewables SpA annual report 16 Supervisory Body Falck Renewables SpA 1.1.2011-31.12.2011 Approval 2013
annual report 8 Claudio Tatozzi Director Falck Renewables SpA 1.1.2011-31.12.2011 Approval 2013
annual report 17 Chairman Remuneration Committee 1.1.2011-31.12.2011 Approval 2013 Falck Renewables SpA annual report 17 Secretary of the board of directors 1.1.2011-31.12.2011 Approval 2013 of Falck Renewables SpA annual report 5
Sergio Ungaro Director Falck Renewables SpA 6.5.2011-31.12.2011 Approval 2013 annual report 13
Fabrizio Zenone Director Falck Renewables SpA 1.1.2011-6.5.2011 - 4 Massimo Scarpelli Chairman of the board of statutory 6.5.2011-31.12.2011 Approval 2013
auditors of Falck Renewables SpA annual report 75 Roberto Bracchetti Chairman of the board of statutory
auditors of Falck Renewables SpA 1.1.2011-6.5.2011 - 8 Chairman of the board of statutory 1.1.2011-31.12.2011 Approval of 2011 auditors of Ecosesto SpA annual report 10 Chairman of the board of statutory 1.1.2011-31.12.2011 Approval of 2012 auditors of Prima Srl annual report 6 Chairman of the board of statutory 1.1.2011-31.12.2011 Approval of 2011 auditors of Frullo Energia Ambiente Srl annual report 20
Aldo Bisioli Statutory auditor of 1.1.2011-31.12.2011 Approval 2013 Falck Renewables SpA annual report 55
Alberto Giussani Statutory auditor of 6.5.2011-31.12.2011 Approval 2013 Falck Renewables SpA annual report 50
Nicola Vito Notarnicola Statutory auditor of Falck Renewables SpA 1.1.2011-6.5.2011 - 5
Key managers (no.4) 1.1.2011-31.12.2011 52 (***) 218 (***) 745 (***)
*** The 4 Key managers are Falck Renewables SpA employees
These financial statements present a true and fair view of the Company’s state of affairs, financial position and loss for the yearand are in agreement with the accounting records.
On behalf of the board of directorsThe ChairmanFederico Falck
168

6.7 Additional disclosures on financial instruments in accordance with IFRS7
This note sets out the additional disclosures relating to financial assets and liabilities in accordance with IFRS 7. These disclo-sures are presented in the same order as they are set out in IFRS 7 and have been omitted where not considered significant.The note is presented in two sections. The first sets out detailed information regarding financial assets and liabilities while thesecond presents information regarding the risks attributable to the financial assets and liabilities, in particular credit risk, liqui-dity risk and market risk. This includes both qualitative and quantitative information that is analysed into points (e.g. 1.) andsub-points (e.g. 1.2). The detailed quantitative information is provided for 31 December 2011 and where significant at 31December 2010.
Before presenting the detailed disclosures it is important to note that Falck Renewables SpA holds significant financial assetsin the form of financial receivables that contributes to a strong positive net financial position. The financial assets and liabili-ties are almost entirely measured at cost and amortised cost in the financial statements, with the exception of derivative finan-cial instruments on interest rates that are measured at fair value. As these are hedging instruments they are measured appl-ying hedge accounting with changes in fair value recorded in equity.
Credit, liquidity and market risk are very limited. Credit risk exposure is not significant as the majority of trade and financialreceivables are with other Group companies and not third parties. Liquidity risk is also considered to be low due to the creditfacility arising from the loan agreement entered into on 14 January 2011 and that is only partially drawn down at present. Asensitivity analysis was performed as interest rate risk relates to financial receivables due from subsidiaries and interest rate fluc-tuations could give rise to higher or lower finance income and as a consequence higher or lower dividends. Falck RenewablesSpA adopts specific procedures to manage the credit, liquidity and market risk on financial assets and liabilities, which havebeen documented in the Group’s policies.
Section I: Financial instruments
1. Balance sheet1.1 Categories of financial assets and liabilities
The tables below illustrate the carrying value at 31 December 2011 and 31 December 2010 of the financial assets and liabilitiesclassified in accordance with IAS 39.In order to reconcile with the balance sheet totals the penultimate column sets out the values of the assets and liabilities thatare not included within the scope of IFRS 7.
169
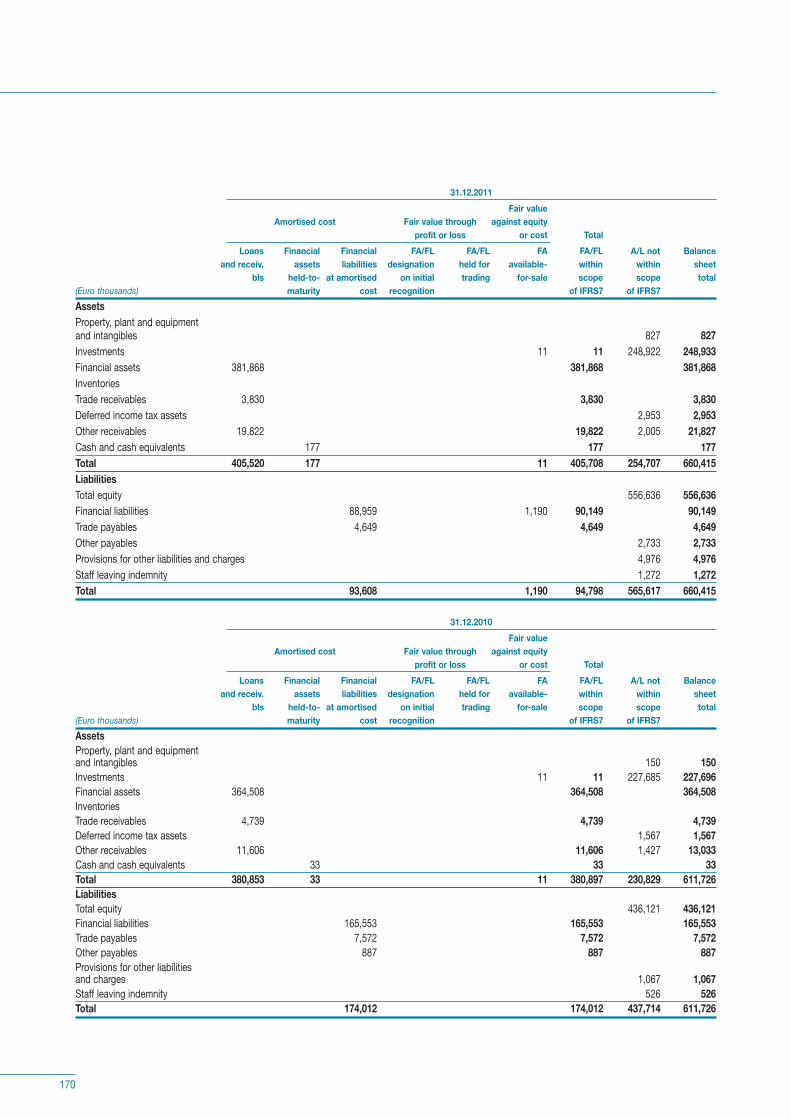
31.12.2011Fair value
Amortised cost Fair value through against equityprofit or loss or cost Total
Loans Financial Financial FA/FL FA/FL FA FA/FL A/L not Balanceand receiv. assets liabilities designation held for available- within within sheet
bls held-to- at amortised on initial trading for-sale scope scope total(Euro thousands) maturity cost recognition of IFRS7 of IFRS7AssetsProperty, plant and equipment and intangibles 827 827Investments 11 11 248,922 248,933Financial assets 381,868 381,868 381,868InventoriesTrade receivables 3,830 3,830 3,830Deferred income tax assets 2,953 2,953Other receivables 19,822 19,822 2,005 21,827Cash and cash equivalents 177 177 177Total 405,520 177 11 405,708 254,707 660,415LiabilitiesTotal equity 556,636 556,636Financial liabilities 88,959 1,190 90,149 90,149Trade payables 4,649 4,649 4,649Other payables 2,733 2,733Provisions for other liabilities and charges 4,976 4,976Staff leaving indemnity 1,272 1,272Total 93,608 1,190 94,798 565,617 660,415
31.12.2010Fair value
Amortised cost Fair value through against equityprofit or loss or cost Total
Loans Financial Financial FA/FL FA/FL FA FA/FL A/L not Balanceand receiv. assets liabilities designation held for available- within within sheet
bls held-to- at amortised on initial trading for-sale scope scope total(Euro thousands) maturity cost recognition of IFRS7 of IFRS7AssetsProperty, plant and equipment and intangibles 150 150Investments 11 11 227,685 227,696Financial assets 364,508 364,508 364,508InventoriesTrade receivables 4,739 4,739 4,739Deferred income tax assets 1,567 1,567Other receivables 11,606 11,606 1,427 13,033Cash and cash equivalents 33 33 33Total 380,853 33 11 380,897 230,829 611,726LiabilitiesTotal equity 436,121 436,121Financial liabilities 165,553 165,553 165,553Trade payables 7,572 7,572 7,572Other payables 887 887 887Provisions for other liabilities and charges 1,067 1,067Staff leaving indemnity 526 526Total 174,012 174,012 437,714 611,726
170
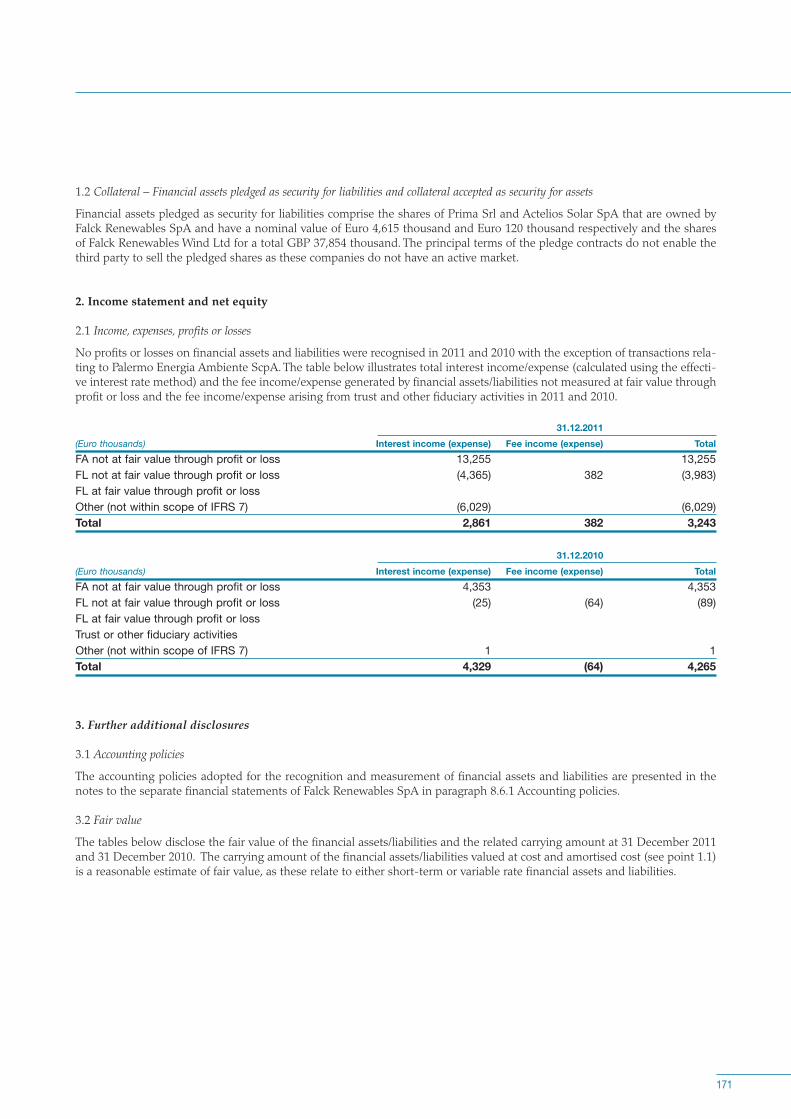
1.2 Collateral – Financial assets pledged as security for liabilities and collateral accepted as security for assets
Financial assets pledged as security for liabilities comprise the shares of Prima Srl and Actelios Solar SpA that are owned byFalck Renewables SpA and have a nominal value of Euro 4,615 thousand and Euro 120 thousand respectively and the sharesof Falck Renewables Wind Ltd for a total GBP 37,854 thousand. The principal terms of the pledge contracts do not enable thethird party to sell the pledged shares as these companies do not have an active market.
2. Income statement and net equity
2.1 Income, expenses, profits or losses
No profits or losses on financial assets and liabilities were recognised in 2011 and 2010 with the exception of transactions rela-ting to Palermo Energia Ambiente ScpA. The table below illustrates total interest income/expense (calculated using the effecti-ve interest rate method) and the fee income/expense generated by financial assets/liabilities not measured at fair value throughprofit or loss and the fee income/expense arising from trust and other fiduciary activities in 2011 and 2010.
31.12.2011(Euro thousands) Interest income (expense) Fee income (expense) TotalFA not at fair value through profit or loss 13,255 13,255FL not at fair value through profit or loss (4,365) 382 (3,983)FL at fair value through profit or lossOther (not within scope of IFRS 7) (6,029) (6,029)Total 2,861 382 3,243
31.12.2010(Euro thousands) Interest income (expense) Fee income (expense) TotalFA not at fair value through profit or loss 4,353 4,353FL not at fair value through profit or loss (25) (64) (89)FL at fair value through profit or lossTrust or other fiduciary activitiesOther (not within scope of IFRS 7) 1 1Total 4,329 (64) 4,265
3. Further additional disclosures
3.1 Accounting policies
The accounting policies adopted for the recognition and measurement of financial assets and liabilities are presented in thenotes to the separate financial statements of Falck Renewables SpA in paragraph 8.6.1 Accounting policies.
3.2 Fair value
The tables below disclose the fair value of the financial assets/liabilities and the related carrying amount at 31 December 2011and 31 December 2010. The carrying amount of the financial assets/liabilities valued at cost and amortised cost (see point 1.1)is a reasonable estimate of fair value, as these relate to either short-term or variable rate financial assets and liabilities.
171
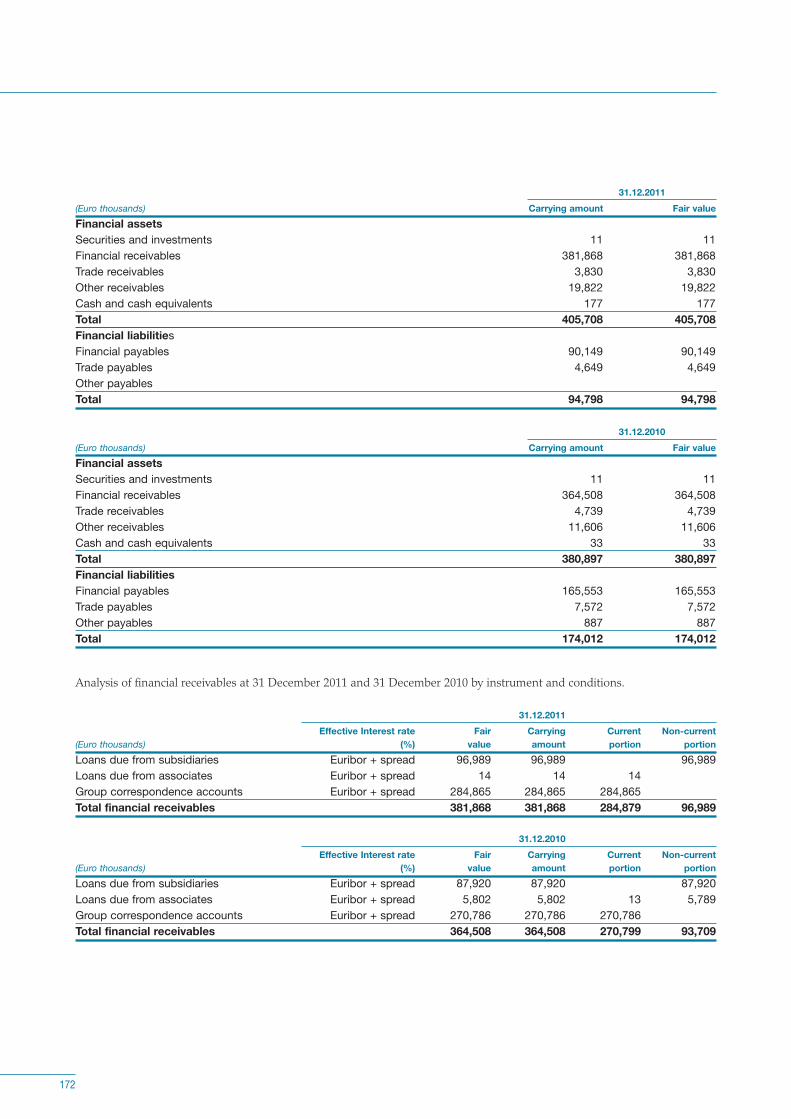
31.12.2011(Euro thousands) Carrying amount Fair valueFinancial assetsSecurities and investments 11 11 Financial receivables 381,868 381,868 Trade receivables 3,830 3,830 Other receivables 19,822 19,822 Cash and cash equivalents 177 177 Total 405,708 405,708 Financial liabilitiesFinancial payables 90,149 90,149 Trade payables 4,649 4,649 Other payablesTotal 94,798 94,798
31.12.2010(Euro thousands) Carrying amount Fair valueFinancial assetsSecurities and investments 11 11 Financial receivables 364,508 364,508 Trade receivables 4,739 4,739 Other receivables 11,606 11,606 Cash and cash equivalents 33 33 Total 380,897 380,897 Financial liabilitiesFinancial payables 165,553 165,553 Trade payables 7,572 7,572 Other payables 887 887 Total 174,012 174,012
Analysis of financial receivables at 31 December 2011 and 31 December 2010 by instrument and conditions.
31.12.2011Effective Interest rate Fair Carrying Current Non-current
(Euro thousands) (%) value amount portion portionLoans due from subsidiaries Euribor + spread 96,989 96,989 96,989Loans due from associates Euribor + spread 14 14 14Group correspondence accounts Euribor + spread 284,865 284,865 284,865Total financial receivables 381,868 381,868 284,879 96,989
31.12.2010Effective Interest rate Fair Carrying Current Non-current
(Euro thousands) (%) value amount portion portionLoans due from subsidiaries Euribor + spread 87,920 87,920 87,920Loans due from associates Euribor + spread 5,802 5,802 13 5,789Group correspondence accounts Euribor + spread 270,786 270,786 270,786Total financial receivables 364,508 364,508 270,799 93,709
172

4. Risks arising from financial instruments
4. 1 Credit risk
Credit risk is not considered significant as the majority of trade and financial receivables are due from subsidiaries. The thirdparty credit risk exposure of Falck Renewables SpA is very limited.
The maximum credit risk exposure at 31 December 2011 amounted to Euro 405,697 thousand and consisted of the following:
(Euro thousands) 31.12.2011Financial receivables 381,868Trade receivables 3,830Other receivables 19,822Cash and cash equivalents 177Total 405,697
The maximum credit risk exposure at 31 December 2010 amounted to Euro 380,886 thousand and consisted of the following:
(Euro thousands) 31.12.2010Financial receivables 364,508Trade receivables 4,739Other receivables 11,606Cash and cash equivalents 33Total 380,886
4.2 Liquidity risk
Falck Renewables SpA’s liquidity risk is modest with its net financial debt decreasing from Euro 165,553 thousand in 2010 toEuro 90,149 thousand in 2011. These compare with total liabilities amounting to Euro 611,726 thousand and Euro 661,275thousand, in 2010 and 2011 respectively. The increase from 2010 and 2011 comprises Falck Renewables SpA’s repayment of itsloan from the parent company and the new bank borrowings secured during the year. These borrowings are classified inmedium/long-term liabilities, while short-term liabilities consist entirely to the balance of correspondence accounts with sub-sidiaries.
173

4.3 Market risk
4.3.1 Interest rate risk
Falck Renewables SpA has entered into interest rate swaps to hedge the interest rate exposure on the committed bank borro-wings. The financial receivables due from subsidiaries is also exposed to interest rate risk with changes in interest rates resul-ting in fluctuations in finance income that in turn could impact dividend payments. The level of exposure was assessed by wayof a sensitivity analysis; total financial assets and liabilities exposed to changes in interest rates are detailed below:
(Euro thousands) 31.12.2011Financial assetsFinancial receivables 381,868Cash and cash equivalents 177Total 382,045Financial liabilitiesFinancial liabilities (88,959)Derivative financial instruments (1,190)Total (90,149)Net exposure 291,896
(Euro thousands) 31.12.2010Financial assetsFinancial receivables 364,508Cash and cash equivalents 33Total 364,541Financial liabilitiesFinancial liabilities (165,553)Total (165,553)Net exposure 198,988
174

Supplementary information to the separate financialstatements of Falck Renewables SpA
9
9.1 List of direct and indirect investments in subsidiaries and associates
Total Profit Direct IndirectRegistered Currency Share capital equity (loss) interest interest Carryingoffice value
(Euro (Eurothousands) thousands) (%) (%) (Euro)
Directly controlled subsidiariesActelios Etnea Srl Palermo Euro 10,000 39 (51) 100.000 136,000Actelios Solar SpA Sesto S. Giovanni (Mi) Euro 120,000 4,811 3,845 100.000 1,124,979Ambiente 2000 Srl Milan Euro 103,000 2,697 343 60.000 863,874Ecosesto SpA Rende (Cosenza) Euro 5,120,000 9,673 2,664 100.000 6,788,473Elettroambiente SpA Sesto S. Giovanni (Mi) Euro 245,350 1,412 (38) 100.000 33,370,000Esposito Servizi Ecologici Srl Sesto S. Giovanni (Mi) Euro 10,000 145 (229) 100.000 1,000,458Falck Renewables Wind Ltd London (UK) GBP 37,759,066 73,202 25,000 99.989 166,483,362Prima Srl Sesto S. Giovanni (Mi) Euro 5,430,000 43,449 6,961 85.000 28,494,159Solar Mesagne Srl Brindisi Euro 50,000 1,534 72 100.000 2,189,000
240,450,305
Indirectly controlled subsidiariesBen Aketil 2 Wind Energy Ltd Inverness (UK) GBP 100 100.000 Ben Aketil Wind Energy Ltd Inverness (UK) GBP 100 (884) 3,911 100.000 Boyndie Wind Energy Ltd Inverness (UK) GBP 100 4,551 1,829 100.000 Cambrian Wind Energy Ltd London (UK) GBP 100 931 1,644 100.000 Cushnie Wind Energy Ltd Inverness (UK) GBP 100 (782) 52.000 Dunbeath Wind Energy Ltd Inverness (UK) GBP 100 (1,963) (619) 52.000 Earlsburn Mezzanine Ltd London (UK) GBP 100 7,007 2,815 100.000 Earlsburn Wind Energy Ltd Inverness (UK) GBP 100 (1,479) 3,827 100.000 Ecoveol Sas Rennes (France) Euro 1,000 (208) (20) 51.000 Elektrownie Wiatrowe Bonwind Leszno Sp.Z.o.o. Poznan (Poland) PLN 50,028 (234) (50) 50.000Elektrownie Wiatrowe Bonwind Łyszkowice Sp.Z.o.o. Łódź (Poland) PLN 100,000 (257) (132) 50.000Elektrownie Wiatrowe Bonwind Kamienica Sp.Z.o.o. Łódź (Poland) PLN 758 6 (5) 50.000Eolica Cabezo San Roque Sa Saragozza (Spain) Euro 1,500,000 6,129 983 95.511Eolica Petralia Srl Sesto S. Giovanni (Mi) Euro 10,000 68 (119) 100.000Eolica Sud Srl Davoli Marina (Cz) Euro 5,000,000 6,725 (4,721) 100.000Eolo 3W Minervino Murge Srl Sesto S. Giovanni (Mi) Euro 10,000 (142) (1,063) 100.000Esquennois Energie Sas Paris (France) Euro 37,000 (178) (180) 100.000Falck Energies Renouvelables Sas Rennes (France) Euro 60,000 (2,338) (905) 100.000Falck Renewables Finance Ltd London (UK) GBP 100 876 105 100.000
177

Total Profit Direct IndirectRegistered Currency Share capital equity (loss) interest interest Carryingoffice value
(Euro (Eurothousands) thousands) (%) (%) (Euro)
Indirectly controlled subsidiaries (continued)Falck Renewables Italia Srl Sesto S. Giovanni (Mi) Euro 100,000 1,744 (897) 100.000Falck Renewables UK Holdings (No.1) Ltd London (UK) GBP 1 (7,947) (2,506) 100.000Geopower Sardegna Srl Sesto S. Giovanni (Mi) Euro 2,000,000 26,668 9,069 100.000Kilbraur 2 Wind Energy Ltd Inverness (UK) GBP 100 100.000Kilbraur Wind Energy Ltd Inverness (UK) GBP 100 (2,114) 5,177 100.000Kingsburn Wind Energy Ltd Inverness (UK) GBP 100 (1,002) (3) 52.000Millennium Wind Energy Ltd Inverness (UK) GBP 100 (2,460) 5,448 100.000Ness Wind Energy Ltd London (UK) GBP 50 100.000Nutberry Wind Energy Ltd Inverness (UK) GBP 100 (828) (4) 52.000Parc Eolien d'Availles - Limouzin Sarl Paris (France) Euro 1,000 (13) (3) 100.000Parc Eolien de Baud Sarl Rennes (France) Euro 1,000 (17) (3) 75.000Parc Eolien de Sainte Trephine Sarl Rennes (France) Euro 10,000 (1) (7) 100.000Parc Eolien de Moulismes Sarl Paris (France) Euro 1,000 (11) (2) 100.000Parc Eolien de Plovenez du Faou Sarl Rennes (France) Euro 1,000 (19) (5) 75.000Parc Eolien des Cretes Sas Paris (France) Euro 37,000 (1,207) (271) 100.000Parc Eolien du Fouy Sas Paris (France) Euro 37,000 (164) (216) 100.000Platani Energia Ambiente ScpA (in liquidation) Palermo Euro 3,364,264 1,129 (736) 86.770S E Ty Ru Sas Rennes (France) Euro 37,005 (32) (25) 100.000S E Kernebet Sas Rennes (France) Euro 37,005 (79) (38) 100.000Spaldington Airfield Wind Energy Ltd London (UK) GBP 50 100.000Tasfiye Halinde Ezse Elektrik Uretim Ltd Sirketi Izmir (Turkey) YTL 11,772,152 (26) (12) 100.000Tifeo Energia Ambiente ScpA (in liquidation) Palermo Euro 4,679,829 1,601 (1,036) 96.350
AssociatesEolica Calabra Srl Belvedere Marittimo (CS) Euro 10,000 (10) (10) 20.000Fri Energetica Srl Cosenza Euro 20,000 20.000Frullo Energia Ambiente Srl Bologna Euro 17,139,100 39,431 14,647 49.000 8,471,678Nuevos Parque Eolicos La Muela AIE Saragozza (Spain) Euro 10,000 38 50.000Palermo Energia Ambiente ScpA (in liquidation) Palermo Euro 120,000 NA NA 23.272Parque Eolico La Carracha Sl Saragozza (Spain) Euro 100,000 588 1,592 26.000Parque Eolico Plana de Jarreta Sl Saragozza (Spain) Euro 100,000 328 1,308 26.000
8,471,678
178

9.2 Summary of significant financial data of subsidiaries and associates
Balance sheet
Non-current Current Total Non-current Current(Euro thousands) assets assets equity liabilities liabilities
Directly controlled subsidiariesActelios Etnea Srl 363 50 39 374
Actelios Solar SpA 47,343 12,420 4,811 51,024 3,928
Ambiente 2000 Srl 237 6,514 2,697 1,006 3,048
Ecosesto SpA 31,689 22,875 9,673 14,887 30,004
Elettroambiente SpA 46,816 35,707 1,412 81,111
Esposito Servizi Ecologici Srl 11,725 3,680 145 535 14,725
Falck Renewables Wind Ltd 72,796 237,915 73,202 9,084 228,425
Prima Srl 59,196 21,782 43,449 12,009 25,520
Solar Mesagne Srl 8,534 427 1,534 7,427
Indirectly controlled subsidiariesBen Aketil 2 Wind Energy Ltd
Ben Aketil Wind Energy Ltd 39,922 8,931 (884) 33,115 9,622
Boyndie Wind Energy Ltd 14,996 10,415 4,551 4,760 16,100
Cambrian Wind Energy Ltd 44,969 10,415 931 34,404 20,049
Cushnie Wind Energy Ltd (782) 782
Dunbeath Wind Energy Ltd 17 (1,963) 1,980
Earlsburn Mezzanine Ltd 10,846 1,758 7,007 5,597
Earlsburn Wind Energy Ltd 38,500 9,760 (1,479) 37,969 11,770
Ecoveol Sas 55 (208) 263
Elektrownie Wiatrowe Bonwind Leszno Sp.Z.o.o. 28 (234) 262
Elektrownie Wiatrowe Bonwind Łyszkowice Sp.Z.o.o. 67 162 (257) 486
Elektrownie Wiatrowe Bonwind Kamienica Sp.Z.o.o. 6 6
Eolica Cabezo San Roque Sa 15,365 4,483 6,129 12,063 1,656
Eolica Petralia Srl 29,859 1,621 68 31,412
Eolica Sud Srl 150,041 43,830 6,725 134,597 52,549
Eolo 3W Mi nervino Murge Srl 87,531 16,468 (142) 78,914 25,227
Esquennois Energie Sas 15,468 1,977 (178) 14,048 3,575
Falck Energies Renouvelables Sas 1,290 4,283 (2,338) 46 7,865
Falck Renewables Finance Ltd 335 2,292 876 1,751
179
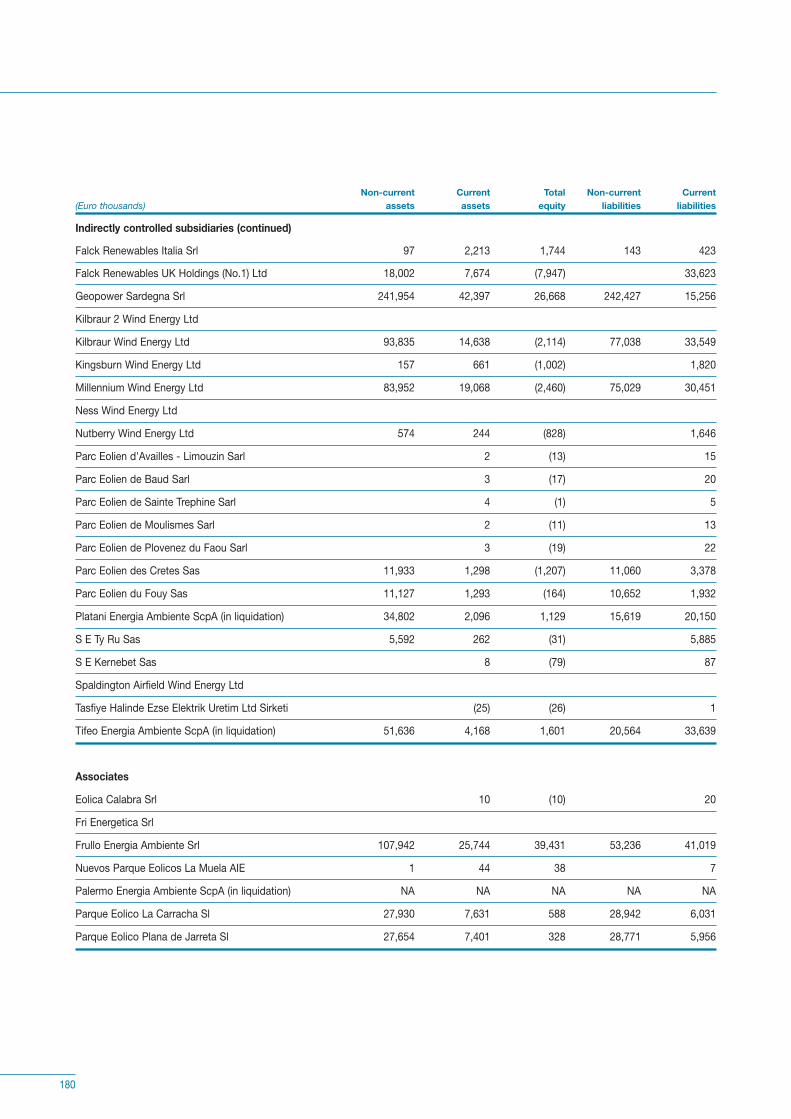
Non-current Current Total Non-current Current(Euro thousands) assets assets equity liabilities liabilities
Indirectly controlled subsidiaries (continued)Falck Renewables Italia Srl 97 2,213 1,744 143 423
Falck Renewables UK Holdings (No.1) Ltd 18,002 7,674 (7,947) 33,623
Geopower Sardegna Srl 241,954 42,397 26,668 242,427 15,256
Kilbraur 2 Wind Energy Ltd
Kilbraur Wind Energy Ltd 93,835 14,638 (2,114) 77,038 33,549
Kingsburn Wind Energy Ltd 157 661 (1,002) 1,820
Millennium Wind Energy Ltd 83,952 19,068 (2,460) 75,029 30,451
Ness Wind Energy Ltd
Nutberry Wind Energy Ltd 574 244 (828) 1,646
Parc Eolien d'Availles - Limouzin Sarl 2 (13) 15
Parc Eolien de Baud Sarl 3 (17) 20
Parc Eolien de Sainte Trephine Sarl 4 (1) 5
Parc Eolien de Moulismes Sarl 2 (11) 13
Parc Eolien de Plovenez du Faou Sarl 3 (19) 22
Parc Eolien des Cretes Sas 11,933 1,298 (1,207) 11,060 3,378
Parc Eolien du Fouy Sas 11,127 1,293 (164) 10,652 1,932
Platani Energia Ambiente ScpA (in liquidation) 34,802 2,096 1,129 15,619 20,150
S E Ty Ru Sas 5,592 262 (31) 5,885
S E Kernebet Sas 8 (79) 87
Spaldington Airfield Wind Energy Ltd
Tasfiye Halinde Ezse Elektrik Uretim Ltd Sirketi (25) (26) 1
Tifeo Energia Ambiente ScpA (in liquidation) 51,636 4,168 1,601 20,564 33,639
AssociatesEolica Calabra Srl 10 (10) 20
Fri Energetica Srl
Frullo Energia Ambiente Srl 107,942 25,744 39,431 53,236 41,019
Nuevos Parque Eolicos La Muela AIE 1 44 38 7
Palermo Energia Ambiente ScpA (in liquidation) NA NA NA NA NA
Parque Eolico La Carracha Sl 27,930 7,631 588 28,942 6,031
Parque Eolico Plana de Jarreta Sl 27,654 7,401 328 28,771 5,956
180
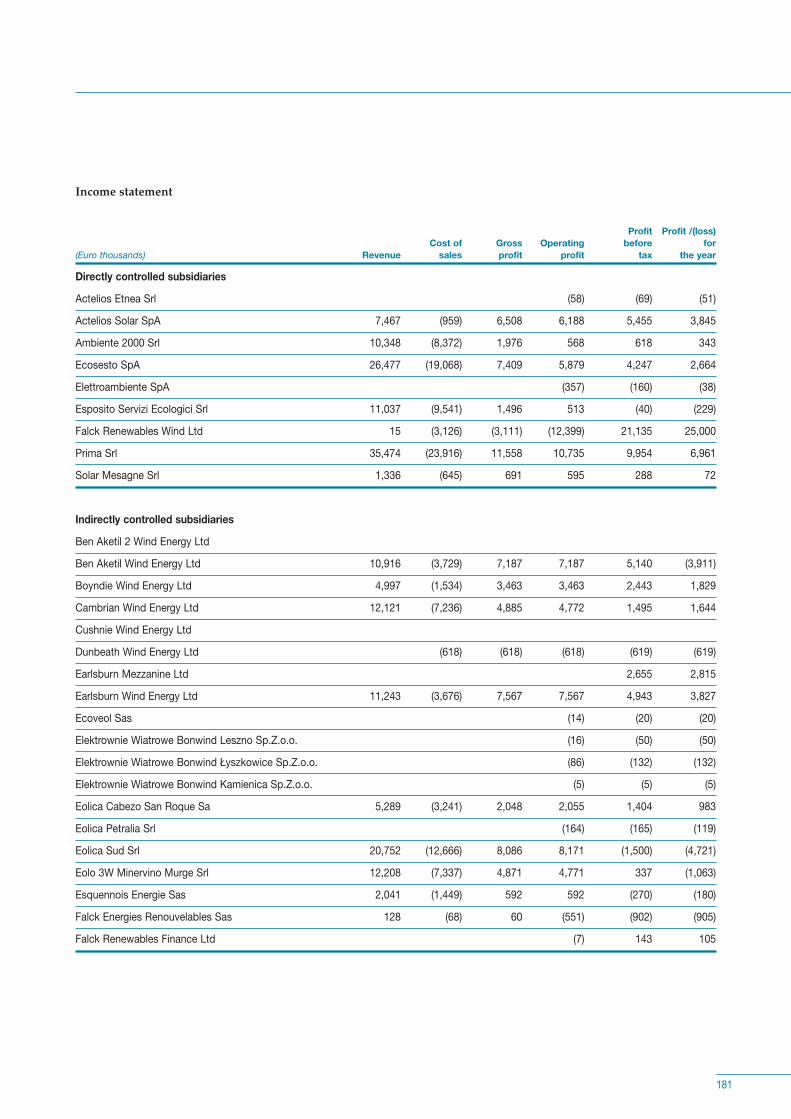
Income statement
Profit Profit /(loss)Cost of Gross Operating before for
(Euro thousands) Revenue sales profit profit tax the year
Directly controlled subsidiariesActelios Etnea Srl (58) (69) (51)Actelios Solar SpA 7,467 (959) 6,508 6,188 5,455 3,845Ambiente 2000 Srl 10,348 (8,372) 1,976 568 618 343Ecosesto SpA 26,477 (19,068) 7,409 5,879 4,247 2,664Elettroambiente SpA (357) (160) (38)Esposito Servizi Ecologici Srl 11,037 (9,541) 1,496 513 (40) (229)Falck Renewables Wind Ltd 15 (3,126) (3,111) (12,399) 21,135 25,000Prima Srl 35,474 (23,916) 11,558 10,735 9,954 6,961Solar Mesagne Srl 1,336 (645) 691 595 288 72
Indirectly controlled subsidiariesBen Aketil 2 Wind Energy LtdBen Aketil Wind Energy Ltd 10,916 (3,729) 7,187 7,187 5,140 (3,911)Boyndie Wind Energy Ltd 4,997 (1,534) 3,463 3,463 2,443 1,829Cambrian Wind Energy Ltd 12,121 (7,236) 4,885 4,772 1,495 1,644Cushnie Wind Energy LtdDunbeath Wind Energy Ltd (618) (618) (618) (619) (619)Earlsburn Mezzanine Ltd 2,655 2,815Earlsburn Wind Energy Ltd 11,243 (3,676) 7,567 7,567 4,943 3,827Ecoveol Sas (14) (20) (20)Elektrownie Wiatrowe Bonwind Leszno Sp.Z.o.o. (16) (50) (50)Elektrownie Wiatrowe Bonwind Łyszkowice Sp.Z.o.o. (86) (132) (132)Elektrownie Wiatrowe Bonwind Kamienica Sp.Z.o.o. (5) (5) (5)Eolica Cabezo San Roque Sa 5,289 (3,241) 2,048 2,055 1,404 983Eolica Petralia Srl (164) (165) (119)Eolica Sud Srl 20,752 (12,666) 8,086 8,171 (1,500) (4,721)Eolo 3W Minervino Murge Srl 12,208 (7,337) 4,871 4,771 337 (1,063)Esquennois Energie Sas 2,041 (1,449) 592 592 (270) (180)Falck Energies Renouvelables Sas 128 (68) 60 (551) (902) (905)Falck Renewables Finance Ltd (7) 143 105
181

Profit Profit /(loss)Cost of Gross Operating before for
(Euro thousands) Revenue sales profit profit tax the year
Indirectly controlled subsidiaries (continued)Falck Renewables Italia Srl (1,340) (1,291) (897)
Falck Renewables UK Holdings (No.1) Ltd (3,409) (2,506)
Geopower Sardegna Srl 18,708 (4,377) 14,331 13,619 12,000 9,069
Kilbraur 2 Wind Energy Ltd
Kilbraur Wind Energy Ltd 19,815 (8,261) 11,554 11,554 6,521 5,177
Kingsburn Wind Energy Ltd (2) (3) (3)
Millennium Wind Energy Ltd 21,444 (8,669) 12,775 12,775 6,517 5,448
Ness Wind Energy Ltd
Nutberry Wind Energy Ltd (3) (4) (4)
Parc Eolien d'Availles - Limouzin Sarl (3) (3) (3)
Parc Eolien de Baud Sarl (2) (3) (3)
Parc Eolien de Sainte Trephine Sarl (7) (7) (7)
Parc Eolien de Moulismes Sarl (2) (2) (2)
Parc Eolien de Plovenez du Faou Sarl (4) (5) (5)
Parc Eolien des Cretes Sas 1,429 (1,149) 280 280 (406) (271)
Parc Eolien du Fouy Sas 1,409 (1,086) 323 323 (324) (216)
Platani Energia Ambiente ScpA (in liquidation) (446) (959) (736)
S E Ty Ru Sas (36) (36) (36) (37) (25)
S E Kernebet Sas (36) (36) (36) (38) (38)
Spaldington Airfield Wind Energy Ltd
Tasfiye Halinde Ezse Elektrik Uretim Ltd Sirketi (12) (12) (12)
Tifeo Energia Ambiente ScpA (in liquidation) (672) (1,347) (1,036)
AssociatesEolica Calabra Srl (10) (10) (10)
Fri Energetica Srl
Frullo Energia Ambiente Srl 52,857 (24,693) 28,164 27,857 25,502 14,647
Nuevos Parque Eolicos La Muela AIE 363 (363)
Palermo Energia Ambiente ScpA (in liquidation) NA NA NA NA NA NA
Parque Eolico La Carracha Sl 9,736 (5,998) 3,738 3,812 2,273 1,592
Parque Eolico Plana de Jarreta Sl 9,343 (5,926) 3,417 3,459 1,865 1,308
182

Certifications on the consolidated and separate financialstatements pursuant to article 81-ter of Consob regulation11971 of 14 May 1999 as amended
10


Report of the board of statutory auditorsto the annual general meeting
11

Report of the board of statutory auditors to the annual general meeting of shareholders of Falck Renewables SpA on 7 May 2012 pursuant to article 153 of Legislative Decree no. 58/1998 and article 2429, paragraph 2 of the ItalianCivil Code
During the financial year ended 31 December 2011, we carried out the controls required by current law and regulations, pur-suant to article 149 of Legislative Decree 58/1998 (Consolidated Finance Act) and the rules of conduct for boards of statutoryauditors recommended by the Consigli Nazionali dei Dottori Commercialisti and Esperti Contabili (representative bodies of theItalian accounting professions) to which we refer in this report, which was prepared also taking into consideration the guideli-nes issued by Consob (the Italian stock exchange commission) in communication 1025564 of 6 April 2001 and ensuing amend-ments.
*** ***
The board of statutory auditors was appointed by the AGM on 6 May 2011 and will remain in office until the approval of theannual report for the year ending 31.12.2013.The members of the board of statutory auditors have complied with the limits on the number of offices held as set forth in arti-cle 144 terdecies of the Listing Rules and notified Consob accordingly.The independent auditors are Reconta Ernst & Young SpA and reference should be made to the independent audit report.We note that the state of affairs and financial position at 31 December 2011 are comparable with those at 31 December 2010,while the results of operations are not comparable.
*** ***
In consideration of the manner in which we performed our institutional activities we confirm that:
- We attended all of the meetings of the shareholders, the board of directors, the internal control committee - for the lattertaking into account the responsibilities assumed under article 19 of Legislative Decree 39/2010 - and the remuneration com-mittee meeting that took place during the year and we obtained from the directors timely and adequate information regar-ding the activities performed, in accordance with regulatory and statutory requirements;
- We obtained suitable information in order to be able to perform our required duties regarding verification of the adequacyof the Company's organisation structure and compliance with principles of correct administrative practice, through directenquiries, the collation of information from officers responsible for the respective functions and exchanges of informationand data with the independent auditors and with the boards of statutory auditors of the subsidiary companies;
- We oversaw the internal control and accounting- administrative systems, with the objective of verifying their adequacy tosupport operational requirements, as well as their reliability in presenting transactions, by examining company documen-tation, obtaining information from the heads of the relevant departments, and analysing the results of the work carried outby the independent auditors;
- We verified compliance with current legislation regarding the preparation, presentation and layout of both the separateCompany and consolidated financial statements, taking into consideration the fact that the Company has prepared theseparate company and the consolidated financial statements in accordance with International Financial Reporting Stan-dards. Following publication of the joint document by Banca d’Italia/Consob/Isvap of 4 March 2010, the board of directorsconfirmed that the impairment test performed on the assets carried in the balance sheet complied with the provisions ofIAS 36 and approved them separately prior to that of the financial statements;
- We verified that the directors’ report for 2011 conforms to the law and is in agreement with the resolutions approved by theboard of directors and with transactions presented in the Company’s and the consolidated financial statements; more spe-cifically in the paragraphs in the directors’ report on risks and uncertainties and management outlook and going concernthe directors describe the major risks and uncertainties to which the Group is exposed, indicating those of an operational,financial and general nature, providing details of all civil and administrative litigation in which the Group is involved andproviding detailed evidence of the status of litigation involving the Sicily Project companies. No observations were required to be made by the board of statutory auditors in relation to the interim half-year report ofthe Company and the Group. The quarterly and half-yearly reports were prepared and published in accordance with cur-rent legislation and regulations.
189

In the course of our verification work, carried out in the manner described above, no significant matters emerged that requirednotification to the regulatory bodies. On the basis of our findings from the tests carried out and from information obtained, thedecisions taken by the directors appear to comply with the law and the Company’s articles of association, principles of correctadministrative practice, are appropriate to and compatible with the Company’s size and net assets, and meet company requi-rements.
*** ***
The specific disclosures to be included in this report are set out below in the order prescribed in the above-mentioned Consobcommunication of 6 April 2001.
1. We have obtained adequate information and investigated the major economic, financial and equity transactions underta-ken by the Company and its subsidiaries, as disclosed in detail in the directors’ report in the paragraph on the Review ofbusiness in 2011, to which we refer. More specifically, we bring to your attention to the following:
A) Disclosures relating to the Sicily Projects: despite the opinion of the legal expert assisting the companies involved in thedispute with the Sicily Region’s Department for Energy and Public Utilities (the Department – replacing ARRA ex legefrom 31 December 2009), which states that the financial claims made by the Group remain unchanged, the interest inPalermo Energia Ambiente SpA (Pea), currently in liquidation, was deconsolidated as the directors consider that the jointcontrol requirement is no longer met; Pea’s second interim liquidation accounts have not been approved and the com-pany is pending a bankruptcy petition; in light of the above, impairment losses were recognised against the full carryingvalues of the interest in Pea and receivables due from it and a charge was made to the sundry risks provision, resultingin a total negative impact on the consolidated result of Euro 12,178 thousand. With regard to Tifeo, Platani and Elet-troambiente SpA (the parent company of Tifeo and Platani), given that Pea’s bankruptcy petition has no consequencesfor the actions taken out by Tifeo and Platani against the Department and that the impairment tests performed on theSicily Projects (excluding Pea) did not identify any impairment in the amounts relating to the Sicily Projects in the Com-pany’s or the consolidated financial statements, the directors did not recognise an impairment loss against the costscapitalised in Property, plant and equipment or the goodwill on the Sicily Projects in the consolidated financial state-ments, or against the interests classified in Investments and securities and the trade and financial receivables due fromElettroambiente, Tifeo, and Platani at 31 December 2011 in Falck Renewables SpA’s separate financial statements.
B) The covenants established in the loan agreement in place with a pool of leading financial institutions were met at the six-monthly intervals of 30 June and 31 December 2011.
C) In the course of 2011 share capital increased to Euro 291,413,891, of which Falck SpA holds a 60% interest; Falck SpAperforms direction and coordination activities in respect of Falck Renewables SpA. The treasury current account betweenthe Company and its parent Falck SpA was closed on 7 April 2011.
2. We have not been informed of uncharacteristic and/or uncommon transactions carried out during the year, including thosewith Group companies or related parties. The ordinary financial and trading transactions carried out between Group com-panies or with related parties are disclosed in the directors' report and in the notes to the Company and the consolidatedfinancial statements. In particular, these related to a number of specific transactions including treasury management, theprovision of loans and guarantees, the provision of professional and other services, and the management of common ser-vices, which are all made at arm’s length and are regulated by contractual agreements. The information obtained allowedus to confirm that the above transactions took place in accordance with the law and the Company’s articles of associationand that they were undertaken in the interests of the Company and the Group.
3. On the whole, the information provided by the directors in their report in accordance with article 2428 of the Italian CivilCode, in respect of uncharacteristic and/or uncommon transactions and in respect of ordinary transactions, as detailed atpoint 1 above, are considered sufficient to provide all of the required disclosures.
4. The independent auditors Reconta Ernst & Young SpA issued on today’s date audit reports, in accordance with articles 14and 16 of Legislative Decree 39 dated 27.1.2010, on the separate Company financial statements and the consolidated finan-cial statements for the year ended 31 December 2011. These audit reports confirm that the Company’s and the consoli-dated financial statements for the year ended 31 December 2011 comply with the provisions relating to the preparation offinancial statements, that they have been properly presented and that they give a true and fair view of the state of affairs
190

and the profit for the year of the parent company Falck Renewables SpA and of the Falck Renewables SpA group and thatthe directors’ report reflects the information disclosed in the financial statements.The auditors bring to attention the amounts relating to the Sicily Projects in the separate financial statements, includinginvestments and receivables totalling approximately Euro 116 million and the consolidated financial statements, represen-ting assets under construction and goodwill totalling approximately Euro 107 million, the recoverability of which hinges onthe outcome of litigation pending with the Sicily Region.
5. No petitions have been filed to date.
6. No petitions have been filed to date pursuant to article 2408 of the Italian Civil Code.
7. Reconta Ernst & Young SpA was appointed as the Company’s independent auditors for 2011-2019 at the AGM on 6 May2011. No further engagements were assigned with the exception of verifying the covenants established under the loanagreement with the pool of banks. No issues regarding the independence of the auditors arose during the year, taking into consideration the regulatory andprofessional requirements that govern audit activities. Moreover the independent auditors confirmed that based on all avai-lable evidence it maintained its independence and objectivity in respect of Falck Renewables SpA and that there were nochanges regarding the existence of reasons for incompatibility defined under article 160 of the Consolidated Finance Actand chapter I-bis of section IV of the listing rules.
8. No engagements were assigned to third parties that have relations of a continuous nature with the independent auditors.
9. In the course of 2011, the board of statutory auditors did not issue any opinions prescribed by law.
10. The control activities described above were carried out in 2011 through the attendance by the board of statutory auditors at: 8 meetings of the board of statutory auditors;1 shareholders’ meeting;13 board of directors’ meetings;2 executive committee meetings;15 internal control committee meetings;7 remuneration committee meetings.
11. We have no particular observations to make regarding compliance with principles of correct administrative practice, whichappear to have been applied consistently.
12. The board of statutory auditors has constantly updated its knowledge and verified the effectiveness of the Company’s orga-nisation structure, comparing it with the Company organisation charts approved and communicated to Consob, throughinformation gathered from each area and meetings with the internal control officer and the independent auditors. The current organisation structure, analysed by business unit and function, at present appears to be appropriate given thesize of the Group and meets its operating requirements.
13. With regard to the adequacy of the System of Internal Controls the board of statutory auditors confirms that it: participatedin the activities of the Internal Control Committee, agreed the audit plan with the independent auditors, received informa-tion regarding the accounting standards adopted and the outcome of the audit activities from the Corporate AccountingDocuments Officer and the independent auditors. The Board, together with the Internal Control Committee regularly met with the Internal Control Officer who providedupdates regarding the audit activities aimed at verifying: the adequacy and effectiveness of the internal control system, com-pliance with law, corporate procedures and processes and implementation of improvement plans. In particular the internalauditor responds directly to the internal control committee, the board of statutory auditors and the directors responsible forthis area and carries out his work based on a six-month plan devised by the internal auditor or taking into considerationareas identified by the control bodies and the auditors. In the course of 2011 the Internal Control Committee focused particular attention on the update of the System of InternalControls, which it declared to be adequate in the meeting of 12 December 2011. The Committee suggested implementationof a suitable centralised risk management model.Falck Renewables SpA has for some time now adopted the Organisation and Operations Manual (the “Manual”) preparedin accordance with Legislative Decree 231/01, aimed at preventing the commission of illegal acts as defined in the decree,
191

thus safeguarding the administrative responsibility of the Company. A Supervisory Board (SB) has been appointed in orderto enforce implementation of the Manual. The SB carries out supervisory, control and other activities independently and iscomposed of two independent directors and the manager for legal and corporate affairs. The Manual will be updated toincorporate environmental crimes in the first half of 2012.
14. We have no particular observations to report with regard to the adequacy of the administrative-accounting system and ofits ability to present fairly Company transactions. Pursuant to Law 262/05 (law on savings), a Corporate Accounting Docu-ments Officer was appointed based on the proposal of the Internal Control Committee in agreement with the board of sta-tutory auditors. A Group accounting manual and protocols and administrative-accounting procedures have been adopted regardingaccounting closures, the preparation of the financial statements and reporting packages by subsidiaries. The Company maintains strict control over information from its subsidiaries in order to fulfil its regular communicationrequirements. The Corporate Accounting Documents Officer evaluates the administrative-accounting internal controlsystem using tests performed by an independent third party. In accordance with Law 262/2005 the Company performedtests on the accounting closure and administrative procedures in general in order to confirm that the correct accounting dataflows into the financial statements, documents and prospectuses.
15. An adequate flow of information between the parent company and its subsidiaries (also in relation to the communicationscovered by article 114.2 of Legislative Decree no. 58/1998) is ensured through specific instructions sent to the subsidiariesby parent company management. The Group coordination activities are also guaranteed by the presence on the corporate bodies of the main subsidiaries ofdirectors and members of top management of the parent company. In accordance with article 2497 bis of the Italian Civil Code, it is noted that Falck Renewables SpA is subject to directionand coordination activities by Falck SpA in the form of strategic directives, while the Company and its corporate bodies stillmaintain operating independence. Falck Renewables SpA performs direction and coordination activities in respect of itssubsidiaries. We have no specific matters to note regarding the exchange of information with the boards of statutory audi-tors of the subsidiaries.
16. No significant matters emerged, which require specific mention, during the regular meetings between the statutory audi-tors and the independent auditors, held in accordance with article 150.2 of Legislative Decree no. 58/1998.
17. The Company has adopted the Code of Self Discipline for listed companies. We note that the directors’ report makes specific mention to the annual corporate governance report prepared in accordan-ce with 123 – bis TUF, to which reference should be made. The board of statutory auditors confirmed that the board of direc-tors carried out the independence requirement checks on its own non-executive members in compliance with article 3.C.1of the Code of Self Discipline and the assessment criteria therein; the board of statutory auditors verified the correct appli-cation of the independence assessment criteria and procedures adopted by the board of directors and has no exceptions tonote.The board of statutory auditors also verified the independence of its own board members through compliance with para-graph 10.C.2 of the Code of Self Discipline of Borsa Italiana. In 2010 the board of directors adopted the procedure regarding related party transactions prepared in accordance with arti-cle 2391 – bis of the Italian Civil Code and based on Consob ruling 17221 of 12 March 2010 and ensuing amendments andinterpretations. The Board of Directors has delegated the responsibility for overseeing related party transactions to the Inter-nal Control Committee.
18. Our work was carried out in 2011, from the date of appointment on 6 May 2011, under normal circumstances and no omis-sions, censurable actions or other irregularities emerged from our work that require disclosure.
19. In conclusion, in relation to the work performed during the financial year, we do not have any observations to report underarticle 153.2 of Legislative Decree 58/1998 on the financial statements, their approval and on matters we are required toreport. In addition, we have no observations to make regarding the board of directors proposal to cover the loss for the yearand the amount of the dividend to be distributed from reserves brought forward.
192

*** ***
Pursuant to article 144 – quinquiesdecies of the Listing Rules, approved by Consob in ruling 11971/99 and ensuing amend-ments, the list of offices held by the board of statutory auditors in companies listed in Book V, Chapter V, Headings V, VI and VIIof the Italian Civil Code, is published by Consob on its website (www.consob.it).
Milan, 2 April 2012
The board of statutory auditors
Massimo Scarpelli
Aldo Bisioli
Alberto Giussani
193

Independent auditors’ reports12


