fiscal year ended j
TRANSCRIPT
Garland Independent School District
Garland, Texas
COMPREHENSIVE ANNUAL FINANCIAL REPORT
Fiscal Year Ended June 30, 2020

GARLAND INDEPENDENT SCHOOL DISTRICT
GARLAND, TEXAS
COMPREHENSIVE ANNUAL FINANCIAL REPORT
FISCAL YEAR ENDED
JUNE 30, 2020
Prepared by:
The Division of Finance

GARLAND INDEPENDENT SCHOOL DISTRICT
ANNUAL FINANCIAL REPORT
FOR THE FISCAL YEAR ENDED JUNE 30, 2020
Exhibit Page
Certificate of the Board i
Board of Trustees and Administrative Officials ii
Plan of Organization iii
Transmittal Letter iv
GFOA Certificate of Achievement xii
ASBO Certificate of Excellence xiii
Independent Auditor's Report 1
Management's Discussion and Analysis (Unaudited) 4
Government Wide Statements:
A-1 Statement of Net Position 12
B-1 Statement of Activities 13
Governmental Fund Financial Statements:
C-1 Balance Sheet - Governmental Funds 14
C-1R Reconciliation of the Governmental Funds Balance Sheet 16
to the Statement of Net Position
C-2 Statement of Revenues, Expenditures, and Changes in Fund Balance 17
C-3 Reconciliation of the Governmental Funds Statement of Revenues, 19
Expenditures, and Changes in Fund Balance to the Statement of Activities
Proprietary Fund Financial Statements:
D-1 Statement of Net Position 20
D-2 Statement of Revenues, Expenses, and Changes in Fund Net Position 21
D-3 Statement of Cash Flows 22
Fiduciary Fund Financial Statements:
E-1 Statement of Fiduciary Assets and Liabilities 23
Notes to the Basic Financial Statements 24
G-1 Schedule of Revenues, Expenditures, and Changes in 58
Fund Balance - Budget and Actual - General Fund
G-2 Schedule of Revenues, Expenditures, and Changes in 59
Fund Balance - Budget and Actual - National Breakfast and Lunch Program
Note to Required Supplemental Information 60
G-3 Schedule of The District's Proportionate Share of The Net Pension Liability 62
Teacher Retirement System of Texas
G-4 Schedule of The District's Contributions- Last 10 Fiscal Years 62
Teacher Retirement System of Texas
G-5 Schedule of The District's Proportionate Share of the Net OPEB Liability 63
G-6 Schedule of The District's Contributions for other Post-Employment Benefits (OPEB) 63
Note to Teacher Retirement System and Post Employment 64
INTRODUCTORY SECTION (Unaudited)
TABLE OF CONTENTS
REQUIRED SUPPLEMENTARY INFORMATION
BASIC FINANCIAL STATEMENTS
FINANCIAL SECTION
GARLAND INDEPENDENT SCHOOL DISTRICT
ANNUAL FINANCIAL REPORT
FOR THE FISCAL YEAR ENDED JUNE 30, 2020
Exhibit Page
Internal Service Funds: 65
H-1 Combining Statement of Net Position 66
H-2 Combining Statement of Revenues, Expenses, and Changes 68
in Fund Net Position
H-3 Combining Statement of Cash Flows 70
Agency Funds: 72
H-4 Combining Statement of Changes in Assets and Liabilities 73
J-1 Schedule of Delinquent Taxes Receivable 74
J-2 Schedule of Revenues, Expenditures, and Changes in Fund Balance 76
Budget and Actual - Debt Service Fund
Table of Contents - Statistical Section 77
S-1 Net Position by Component 78
S-2 Expenses, Program Revenues, and Net (Expense) Revenue 80
S-3 General Revenues and Total Change in Net Position 82
S-4 Fund Balances, Governmental Funds 84
S-5 Governmental Funds Revenues 86
S-6 Governmental Funds Expenditures and Debt Service Ratio 88
S-7 Other Financing Sources and Uses and Net Change in Fund Balances 90
S-8 Appraised Value and Actual Value of Taxable Property 92
S-9 Direct and Overlapping Property Tax Rates 93
S-10 Principal Property Taxpayers 94
S-11 Property Tax Levies and Collections 95
S-12 Outstanding Debt by Type 96
S-13 Ratios of General Bonded Debt Outstanding 97
S-14 Direct and Overlapping Governmental Activities Debt 98
S-15 Legal Debt Margin Information 99
S-16 Demographic and Economic Statistics 100
S-17 Principal Employers 101
S-18 Full Time Equivalent District Employees by Type 102
S-19 Operating Statistics 104
S-20 Operating Indicators 105
S-21 School Building Information 106
STATISTICAL SECTION (UNAUDITED):
REQUIRED TEA SCHEDULES SECTION
COMBINING STATEMENTS
GARLAND INDEPENDENT SCHOOL DISTRICT
ANNUAL FINANCIAL REPORT
FOR THE FISCAL YEAR ENDED JUNE 30, 2020
Exhibit Page
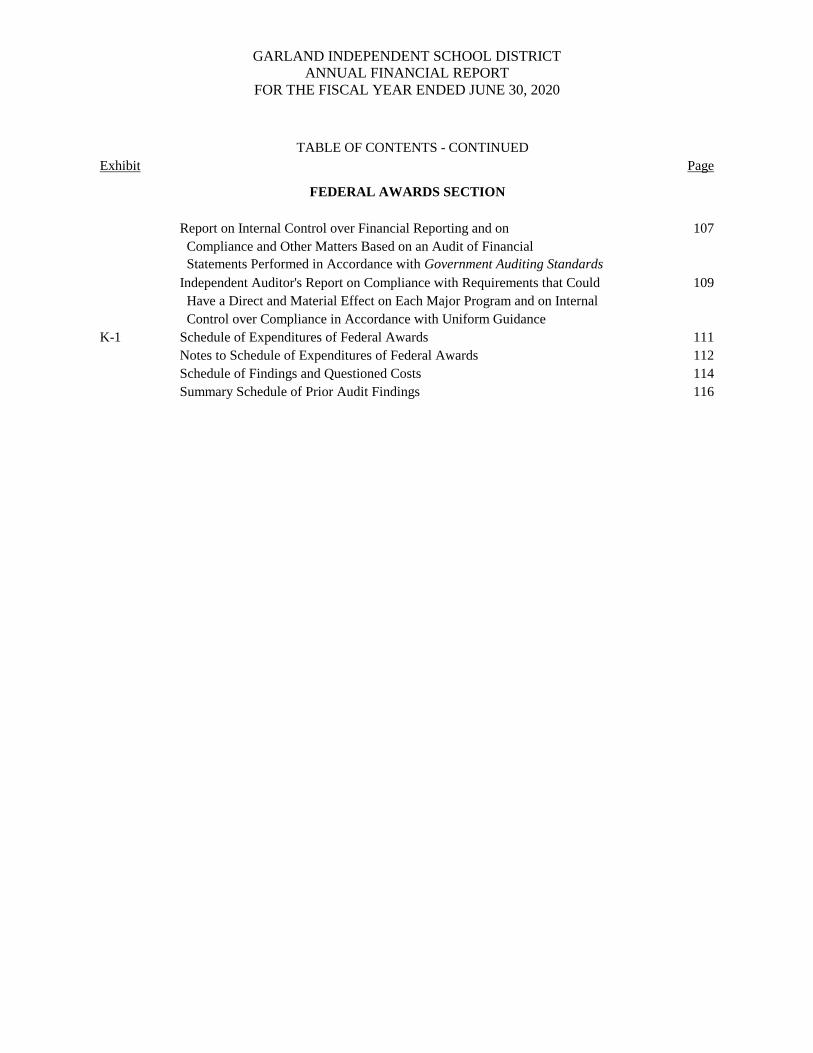
Report on Internal Control over Financial Reporting and on 107
Compliance and Other Matters Based on an Audit of Financial
Statements Performed in Accordance with Government Auditing Standards
Independent Auditor's Report on Compliance with Requirements that Could 109
Have a Direct and Material Effect on Each Major Program and on Internal
Control over Compliance in Accordance with Uniform Guidance
K-1 Schedule of Expenditures of Federal Awards 111
Notes to Schedule of Expenditures of Federal Awards 112
Schedule of Findings and Questioned Costs 114
Summary Schedule of Prior Audit Findings 116
TABLE OF CONTENTS - CONTINUED
FEDERAL AWARDS SECTION

This page intentionally left blank
Introductory Section

This page intentionally left blank
i
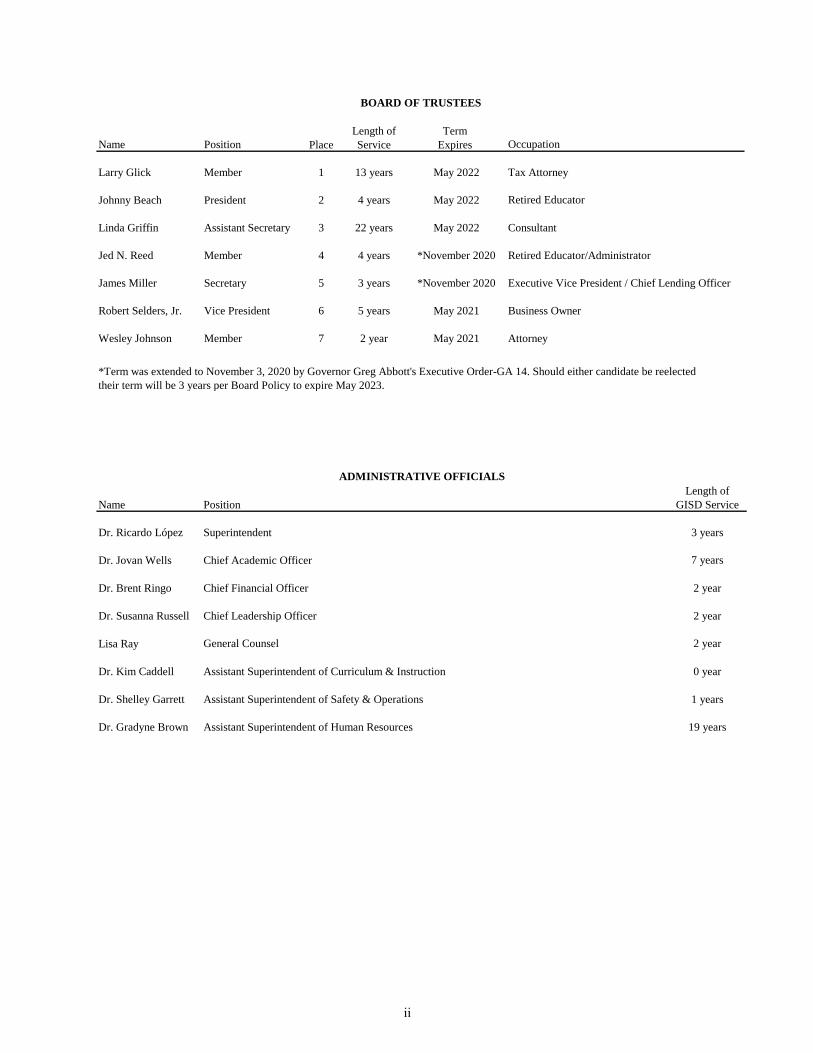
Length of Term
Name Position Place Service Expires
Larry Glick Member 1 13 years May 2022 Tax Attorney
Johnny Beach President 2 4 years May 2022 Retired Educator
Linda Griffin Assistant Secretary 3 22 years May 2022 Consultant
Jed N. Reed Member 4 4 years *November 2020 Retired Educator/Administrator
James Miller Secretary 5 3 years *November 2020 Executive Vice President / Chief Lending Officer
Robert Selders, Jr. Vice President 6 5 years May 2021 Business Owner
Wesley Johnson Member 7 2 year May 2021 Attorney
*Term was extended to November 3, 2020 by Governor Greg Abbott's Executive Order-GA 14. Should either candidate be reelected
their term will be 3 years per Board Policy to expire May 2023.
Occupation
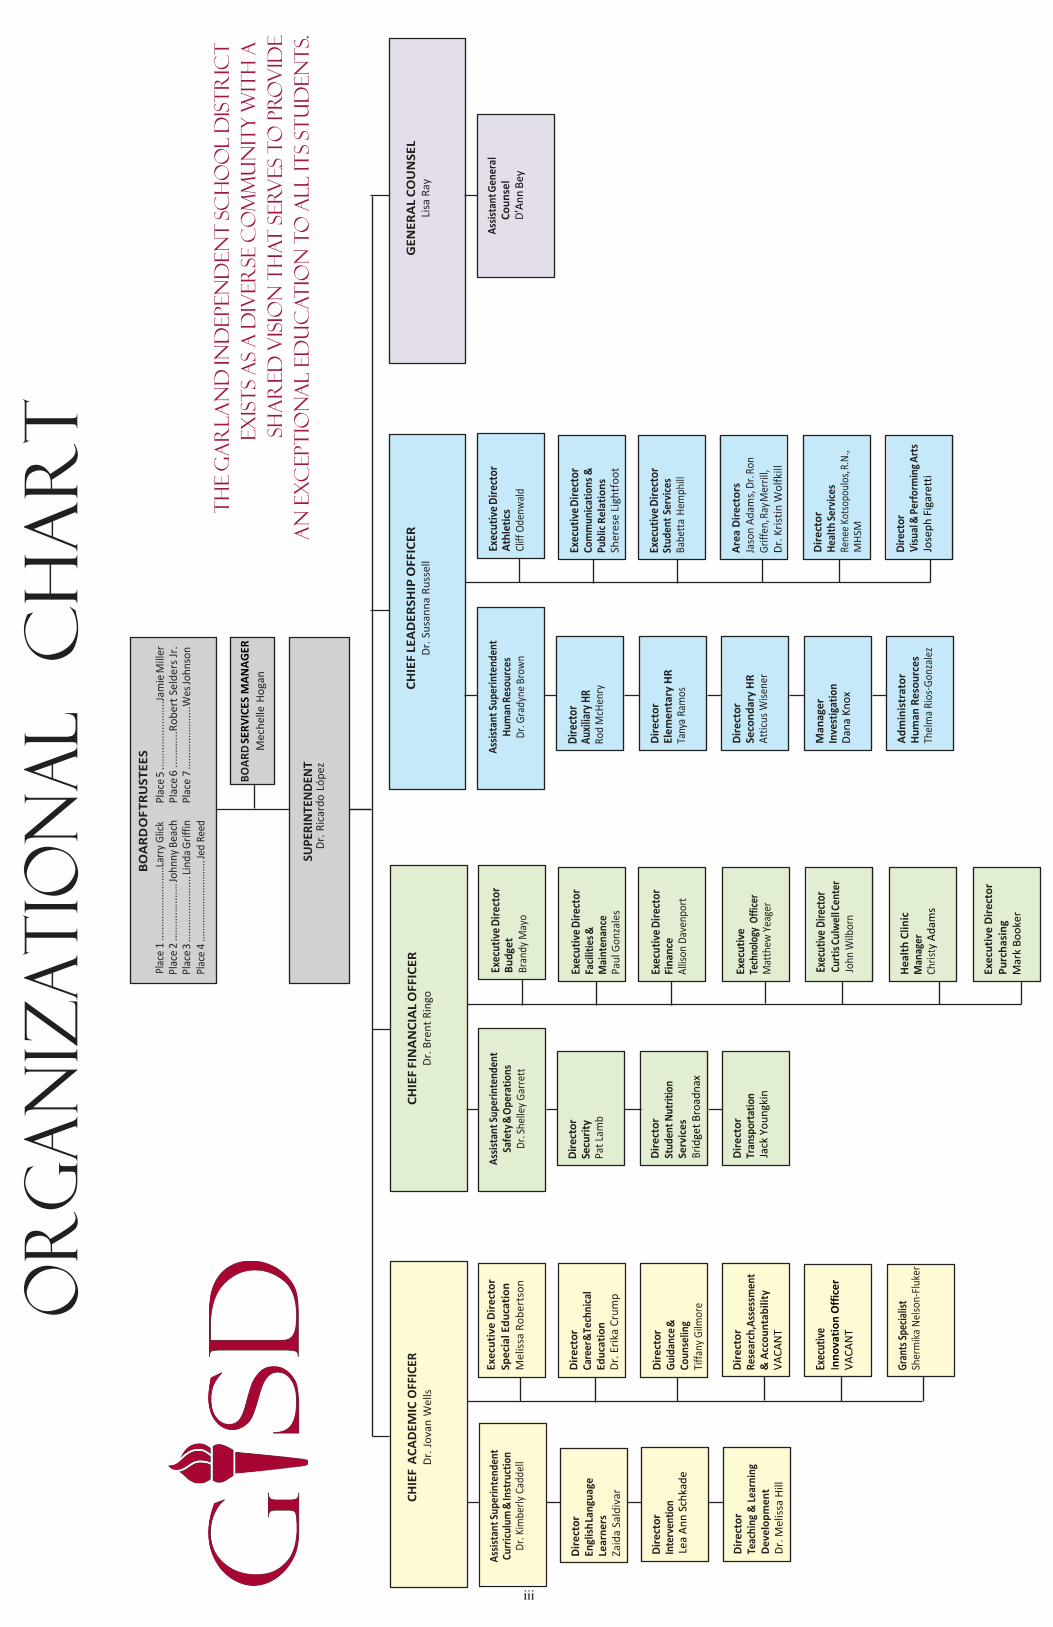
BOARD OF TRUSTEES
Length of
Name Position GISD Service
Dr. Ricardo López Superintendent 3 years
Dr. Jovan Wells Chief Academic Officer 7 years
Dr. Brent Ringo Chief Financial Officer 2 year
Dr. Susanna Russell Chief Leadership Officer 2 year
Lisa Ray General Counsel 2 year
Dr. Kim Caddell Assistant Superintendent of Curriculum & Instruction 0 year
Dr. Shelley Garrett Assistant Superintendent of Safety & Operations 1 years
Dr. Gradyne Brown Assistant Superintendent of Human Resources 19 years
ADMINISTRATIVE OFFICIALS
ii
SUP
ERIN
TEN
DEN
T
Or
ga
niz
at
ion
al
Ch
ar
t
BO
AR
D O
F T
RU
ST
EE
S
Plac
e 1
......
......
......
......
...La
rry G
lick
Plac
e 2
......
......
......
.. Jo
hnny
Bea
ch
Plac
e 3
......
......
......
.....
Lind
a G
riff
in
Plac
e 4
......
......
......
......
......
Jed
Reed
Plac
e 5
......
......
......
......
Jam
ie M
iller
P
lace
6 ..
....
....
..R
ob
ert S
eld
ers J
r.
Plac
e 7
......
......
......
....W
es Jo
hnso
n
Th
e G
ar
la
nd
In
depen
den
t S
ch
oo
l D
ist
ric
t
ex
ist
s a
s a
div
er
se c
om
mu
nit
y w
ith
a
Dr.
Ric
ard
o L
óp
ez
sh
ar
ed
vis
ion
th
at
ser
ves t
o p
ro
vid
e
an
ex
cept
ion
al e
du
ca
tio
n t
o a
ll it
s s
tu
den
ts.
CH
IEF
AC
AD
EM
IC OFFICER
Dr.
Jo
van
Wel
ls
CH
IEF
FIN
AN
CIA
L O
FF
ICE
R
Dr.
Bre
nt
Rin
go
CH
IEF
LE
AD
ER
SH
IP O
FF
ICE
R
Dr.
Su
san
na
Ru
ssel
l G
EN
ER
AL
CO
UN
SE
L Li
sa R
ay
Ass
ista
nt Su
peri
nten
dent
Cu
rric
ulum
& In
stru
ctio
n Dr
. Kim
berly
Cad
dell
Dir
ect
or
Engl
ish
Lan
guag
e Le
arn
ers
Za
ida
Sald
ivar
Dir
ect
or
Inte
rven
tion
Le
a An
n Sc
hkad
e
Dir
ect
or
Teac
hing
& Le
arni
ng
De
velo
pm
en
tD
r. M
elis
sa H
ill
Dir
ect
or
Care
er &
Tech
nica
l Ed
uca
tio
n
Dr.
Erik
a Cr
ump
Dir
ect
or
Gui
danc
e &
Co
unse
ling
Tiffa
ny G
ilmor
e
Dir
ect
or
Res
earc
h, A
sses
smen
t &
Acc
ou
nta
bili
ty
VACA
NT
Ass
ista
nt Su
peri
nten
dent
Sa
fety
& O
pera
tion
s D
r. Sh
elle
y Gar
rett
Dir
ecto
r Se
curi
ty
Pat L
amb
Dir
ect
or
Stud
ent N
utri
tion
Se
rvic
es
Brid
get B
road
nax
Dir
ect
or
Tran
spor
tati
on
Jack
You
ngki
n
Exec
utiv
e D
irec
tor
Bu
dge
t Br
andy
May
o
Exec
utiv
e D
irec
tor
Faci
litie
s &
Mai
nten
ance
Pa
ul G
onza
les
Exec
utiv
e D
irec
tor
Fin
ance
A
lliso
n D
aven
port
Exec
uti
ve
Tech
nolo
gy O
ffic
er
Mat
thew
Yea
ger
Ass
ista
nt Su
peri
nten
dent
H
uman
Reso
urce
s D
r. G
rady
ne B
row
n
Dir
ecto
r Au
xilia
ry H
RRo
d M
cHen
ry
Dir
ect
or
Ele
me
nta
ry H
R Ta
nya
Ram
os
Dir
ect
or
Seco
nd
ary
HRA
ttic
us W
isen
er
Exec
utiv
e D
irec
tor
Ath
leti
cs
Cliff
Ode
nwal
d
Exec
utiv
e D
irec
tor
Com
mun
icat
ions
&
Publ
ic R
ela
tio
ns
Sher
ese
Ligh
tfoo
t
Exec
utiv
e D
irec
tor
Stud
ent S
ervi
ces
Babe
tta
Hem
phill
Are
a D
ire
cto
rs
Jaso
n A
dam
s, D
r. Ro
n G
riff
en, R
ay M
erri
ll,
Dr. K
rist
in W
olf
kill
Ass
ista
nt G
ener
al
Co
un
sel
D'A
nn
Bey
Exec
utive
In
nova
tion
Offi
cer
VACA
NT
Exec
utive
Dire
ctor
Cu
rtis
Cul
wel
l Cen
ter
John
Wilb
orn
Dir
ect
or
Hea
lth
Serv
ices
Re
nee K
otso
poul
os, R
.N.,
MH
SM
Heal
th C
linic
Man
ager
Ch
rist
y Ad
ams
Dir
ecto
r V
isua
l & P
erfo
rmin
g A
rts
Jose
ph F
igar
etti
BO
ARD
SERV
ICES
MAN
AGER
Mec
hel
le H
oga
n
Gran
ts Sp
ecial
ist
Sher
mika
Nel
son-
Fluke
r
Exec
utiv
e Di
rect
orPu
rcha
sing
Mar
k Bo
oker
Man
ager
In
vest
igat
ion
Dana
Kno
x
Adm
inis
trat
orHu
man
Res
ourc
esTh
elm
a Ri
os-G
onza
lez
Exec
utiv
e Di
rect
or
Spec
ial E
duca
tion
Mel
issa
Robe
rtso
n
iii
Diverse Community. Share Vision. Exceptional Education.
P.O. Box 469026 Garland, TX 75046-4923
www.garlandisd.net
Garland Independent School District Division of Business Operations
Street Address Harris Hill Administration Building
501 S. Jupiter RD
Garland, TX
75042
Phone 972-487-3100
FAX 972-485-4922
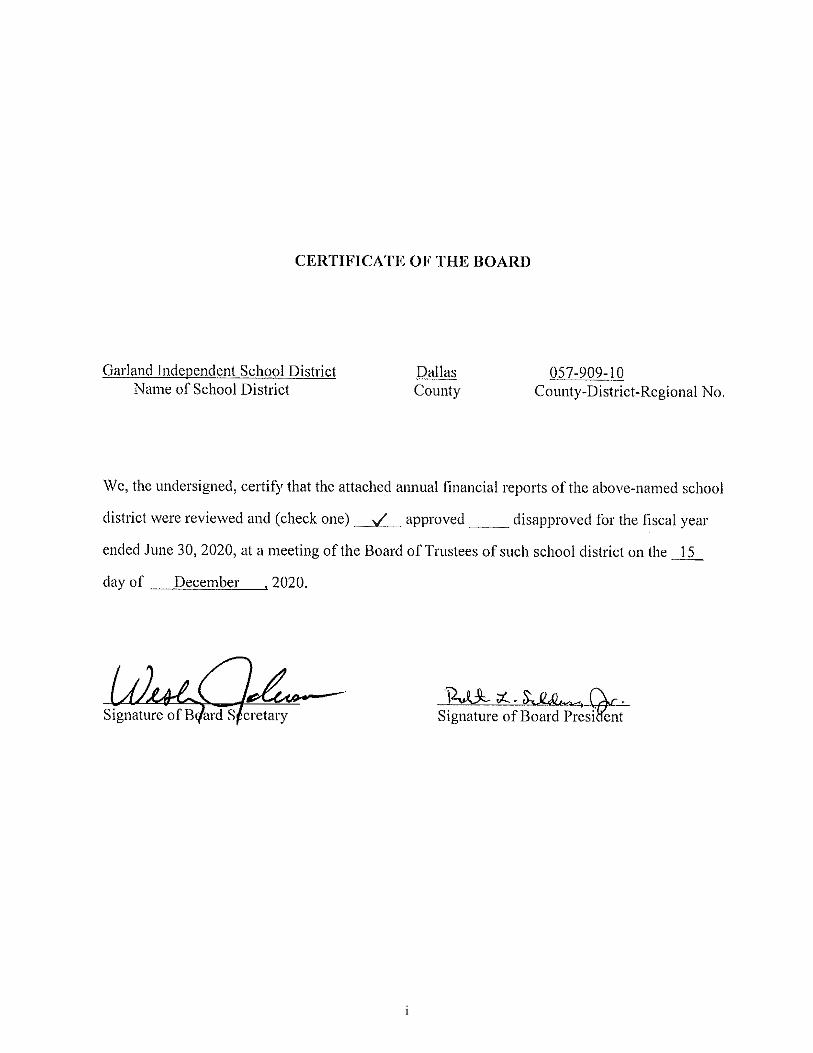
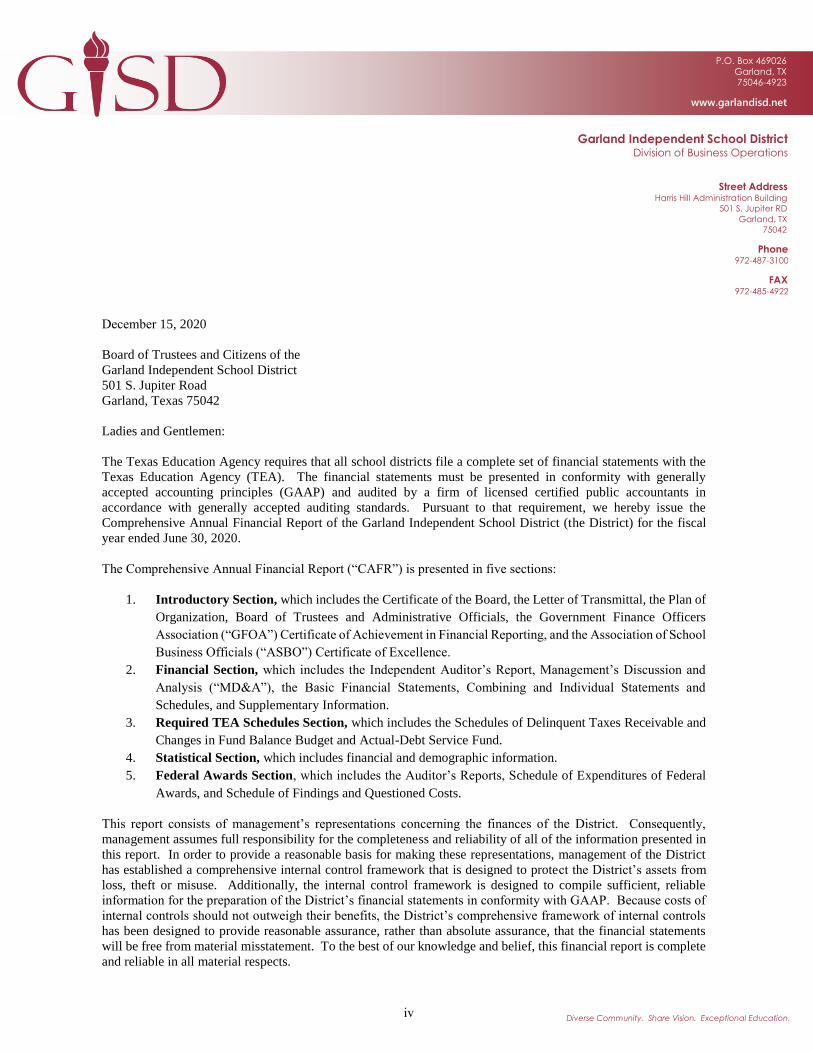
December 15, 2020
Board of Trustees and Citizens of the
Garland Independent School District
501 S. Jupiter Road
Garland, Texas 75042
Ladies and Gentlemen:
The Texas Education Agency requires that all school districts file a complete set of financial statements with the
Texas Education Agency (TEA). The financial statements must be presented in conformity with generally
accepted accounting principles (GAAP) and audited by a firm of licensed certified public accountants in
accordance with generally accepted auditing standards. Pursuant to that requirement, we hereby issue the
Comprehensive Annual Financial Report of the Garland Independent School District (the District) for the fiscal
year ended June 30, 2020.
The Comprehensive Annual Financial Report (“CAFR”) is presented in five sections:
1. Introductory Section, which includes the Certificate of the Board, the Letter of Transmittal, the Plan of
Organization, Board of Trustees and Administrative Officials, the Government Finance Officers
Association (“GFOA”) Certificate of Achievement in Financial Reporting, and the Association of School
Business Officials (“ASBO”) Certificate of Excellence.
2. Financial Section, which includes the Independent Auditor’s Report, Management’s Discussion and
Analysis (“MD&A”), the Basic Financial Statements, Combining and Individual Statements and
Schedules, and Supplementary Information.
3. Required TEA Schedules Section, which includes the Schedules of Delinquent Taxes Receivable and
Changes in Fund Balance Budget and Actual-Debt Service Fund.
4. Statistical Section, which includes financial and demographic information.
5. Federal Awards Section, which includes the Auditor’s Reports, Schedule of Expenditures of Federal
Awards, and Schedule of Findings and Questioned Costs.
This report consists of management’s representations concerning the finances of the District. Consequently,
management assumes full responsibility for the completeness and reliability of all of the information presented in
this report. In order to provide a reasonable basis for making these representations, management of the District
has established a comprehensive internal control framework that is designed to protect the District’s assets from
loss, theft or misuse. Additionally, the internal control framework is designed to compile sufficient, reliable
information for the preparation of the District’s financial statements in conformity with GAAP. Because costs of
internal controls should not outweigh their benefits, the District’s comprehensive framework of internal controls
has been designed to provide reasonable assurance, rather than absolute assurance, that the financial statements
will be free from material misstatement. To the best of our knowledge and belief, this financial report is complete
and reliable in all material respects.
iv
Whitley Penn, L.L.P., a firm of independent auditors, has audited the financial statements of the District. The goal
of the independent audit is to provide reasonable assurance that the financial statements of the District for the fiscal
year ended June 30, 2020, are free of material misstatement. The independent audit involves examining, on a test
basis, evidence supporting the amounts and disclosures in the financial statements, assessing the accounting
principles used and significant estimates made by management, and evaluating the overall financial statement
presentation. Based upon the audit, the independent auditors concluded there was a reasonable basis for rendering
an unmodified opinion that the District’s financial statements for the fiscal year ended June 30, 2020, are fairly
presented in conformity with GAAP. The independent auditor’s report is presented as the first component of the
financial section of this report.
The District is including all information required by the TEA as set forth in the Financial Accountability System
Resource Guide. In order to comply with state-mandated audit requirements, data control codes are shown on all of
the financial statements. The District is required to undergo an annual single audit in conformity with the provisions
of the Single Audit Act Amendments of 1996 and U.S. Office of Management and Budget Uniform Guidance,
Audits of States, Local Governments, and Non-Profit Organizations. Information related to this single audit,
including the schedule of expenditures of federal awards, findings and recommendations, and independent auditor’s
reports on the internal control and compliance with applicable laws and regulations is included in this report and
sent to the TEA.
GAAP requires management to provide a narrative introduction, overview, and analysis to accompany the basic
financial statements in the form of Management’s Discussion and Analysis (MD&A). This letter of transmittal is
designed to complement MD&A and should be read in conjunction with it. The District’s MD&A can be found
immediately following the report of the independent auditors.
PROFILE OF THE DISTRICT
The District was created in 1949 and is the fourteenth largest school district in Texas. Residents of the District elect
a seven-member Board of Trustees (the Board), each of whom serves for three years. Semi-monthly meetings of the
Board are posted and advertised as prescribed under state law so the Board may fulfill its charge to the students,
parents, staff, and taxpayers of the District. Special meetings or work sessions are scheduled as needed. The Board
has final control over all school matters except as limited by state law.
Serving the communities of Garland, Rowlett, and Sachse, the District’s boundaries encompass approximately 93
square miles in Dallas County. The District provides a well-rounded program of public education for children from
pre-kindergarten through grade twelve. In addition to basic instructional programs, the District offers special
education, gifted and talented, bilingual/ESL, remedial, college preparatory, and career and technical programs. The
District is fully accredited by the TEA.
The District has seven traditional high schools serving students in grades nine through twelve. The District has a
nontraditional high school program serving students in grades nine through twelve and a high school offering
advanced-level career and technical education classes. The District has twelve middle schools, forty-seven
elementary schools, including two Montessori campuses, two Pre-Kindergarten centers, and two special learning
centers.
v
The table below shows the demographic composition of the District during the 2009-10 and 2019-20 school years.
2009-10 2019-20
Enrollment 57,564 55,701
African-American 18.8% 17.6%
American Indian 0.4%
Asian 8.3% 9.3%
Hispanic 45.3% 53.9%
Native American 0.4%
Pacific Islander 0.1%
White 27.2% 16.4%
Two or More 2.4%
Economically Disadvantaged 57.2% 65.8%
English Language Learners 22.1% 32.3%
Graduates 3,562 4,125
The District’s total student population decreased over the past 10 years, although there has been a slight decrease in
recent years with the expectation that this slight downward trend may continue in subsequent years based on
information provided in a recent demographic study. However, need for student academic support continues to
increase, as evidenced in increases in student groups based on special program identification. These changes require
adjustments in the instructional programs. Educational research suggests economically disadvantaged students
come to school with academic needs that should be addressed through early childhood programs, accelerated
instruction, and extended learning time. The District is seeking opportunities to expand existing programs to meet
identified needs and studying the most effective methods to enhance learning for these children.
Another challenge facing many Texas school districts is the growing number of students who are learning English as
a second language and do not currently possess grade-level appropriate English-language proficiency. While the
majority of non-English speakers are Hispanic, the District serves students speaking more than 72 different
languages. The District is continuing to expand and improve the bilingual and English-as-a-Second Language
instructional programs. The growth, particularly in these two areas, is an ongoing challenge for the Garland
Independent School District.
There are a number of charter schools that serve the same population as Garland ISD. These charter schools receive
their charters from the state and are separate and apart from Garland ISD. The District competes with these charter
schools for the same students. Similar to Garland ISD, these charter schools receive state funding based on their
Average Daily Attendance and special population counts. However, unlike Garland ISD, they do not have the ability
to levy local property taxes. As such, relative to Garland ISD, these charter schools are generally more heavily
dependent on state revenues for their Maintenance and Operations funding.
A high degree of professionalism exists among the District’s employees and an on-going recognition of student and
staff excellence contributes to this environment. The instructional program is geared toward having the students
meet or exceed grade-level expectations. Emphasis is placed on higher-level thinking skills, including research
methodologies and independent, complex, and critical thinking skills.
The District attracts highly qualified personnel because of its commitment to excellence. The following table shows
the employee composition of the District during the 2009-10 and 2019-20 school year.
2009-10 2019-20
Total Staff 7,394 7,185
Teachers 3,720 3,594
Masters or Doctorate 27.1% 32.6%
Average Years of Experience 11.2 11.4
Student/Teacher Ratio 15.5 15.5
vi
The District maintains budgetary controls throughout all of its financial systems. The objective of budgetary
controls is to ensure compliance with legal provisions embodied in the official budget adopted by the Board. The
Board adopts an official budget for the general fund, debt service fund, and student nutrition services fund (which is
included in the special revenue fund). In accordance with procedures prescribed by the Texas Education Code,
budget amendments that affect the total amount in a fund or functional spending category must be approved by the
Board prior to the expenditure of funds. The functional level is specified by Board policy as the legal level of
budgetary control.
FINANCIAL CONDITION AND LONG RANGE PLANNING
The information presented in the financial statements is perhaps best understood when it is considered within the
broader perspective of the specific environment in which the District operates.
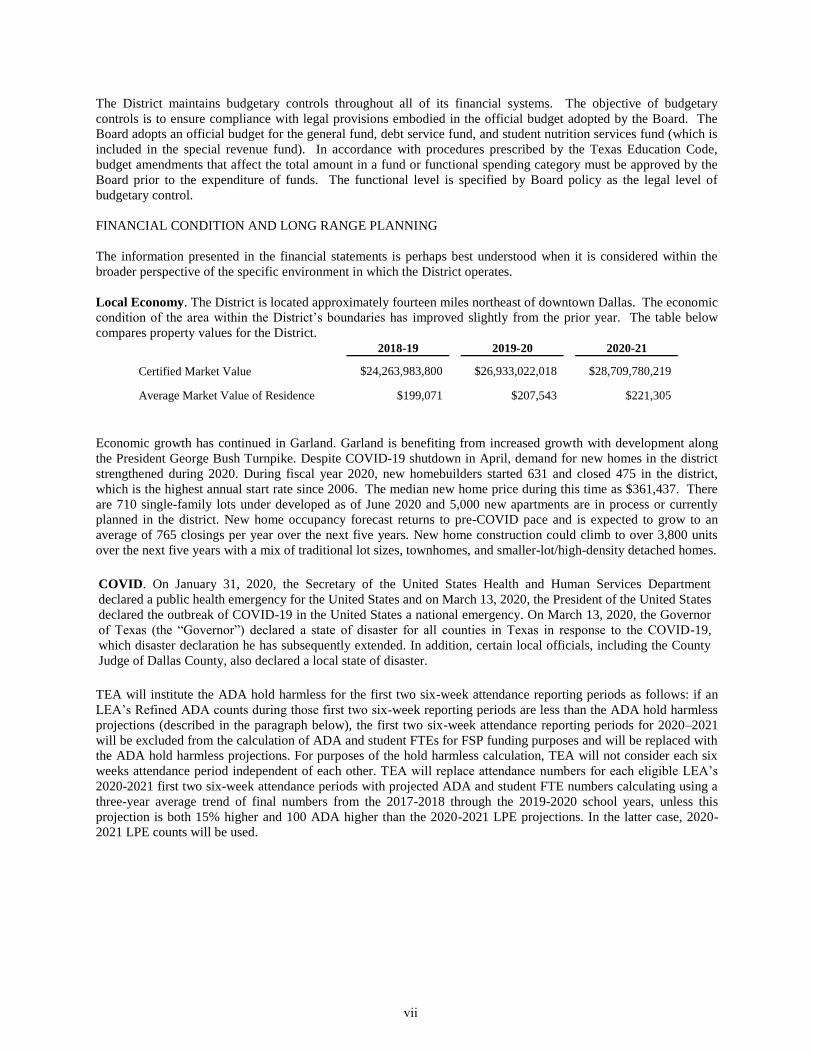
Local Economy. The District is located approximately fourteen miles northeast of downtown Dallas. The economic
condition of the area within the District’s boundaries has improved slightly from the prior year. The table below
compares property values for the District.
2018-19 2019-20 2020-21
Certified Market Value $24,263,983,800 $26,933,022,018 $28,709,780,219
Average Market Value of Residence $199,071 $207,543 $221,305
Economic growth has continued in Garland. Garland is benefiting from increased growth with development along
the President George Bush Turnpike. Despite COVID-19 shutdown in April, demand for new homes in the district
strengthened during 2020. During fiscal year 2020, new homebuilders started 631 and closed 475 in the district,
which is the highest annual start rate since 2006. The median new home price during this time as $361,437. There
are 710 single-family lots under developed as of June 2020 and 5,000 new apartments are in process or currently
planned in the district. New home occupancy forecast returns to pre-COVID pace and is expected to grow to an
average of 765 closings per year over the next five years. New home construction could climb to over 3,800 units
over the next five years with a mix of traditional lot sizes, townhomes, and smaller-lot/high-density detached homes.
COVID. On January 31, 2020, the Secretary of the United States Health and Human Services Department
declared a public health emergency for the United States and on March 13, 2020, the President of the United States
declared the outbreak of COVID-19 in the United States a national emergency. On March 13, 2020, the Governor
of Texas (the “Governor”) declared a state of disaster for all counties in Texas in response to the COVID-19,
which disaster declaration he has subsequently extended. In addition, certain local officials, including the County
Judge of Dallas County, also declared a local state of disaster.
TEA will institute the ADA hold harmless for the first two six-week attendance reporting periods as follows: if an
LEA’s Refined ADA counts during those first two six-week reporting periods are less than the ADA hold harmless
projections (described in the paragraph below), the first two six-week attendance reporting periods for 2020–2021
will be excluded from the calculation of ADA and student FTEs for FSP funding purposes and will be replaced with
the ADA hold harmless projections. For purposes of the hold harmless calculation, TEA will not consider each six
weeks attendance period independent of each other. TEA will replace attendance numbers for each eligible LEA’s
2020-2021 first two six-week attendance periods with projected ADA and student FTE numbers calculating using a
three-year average trend of final numbers from the 2017-2018 through the 2019-2020 school years, unless this
projection is both 15% higher and 100 ADA higher than the 2020-2021 LPE projections. In the latter case, 2020-
2021 LPE counts will be used.
vii
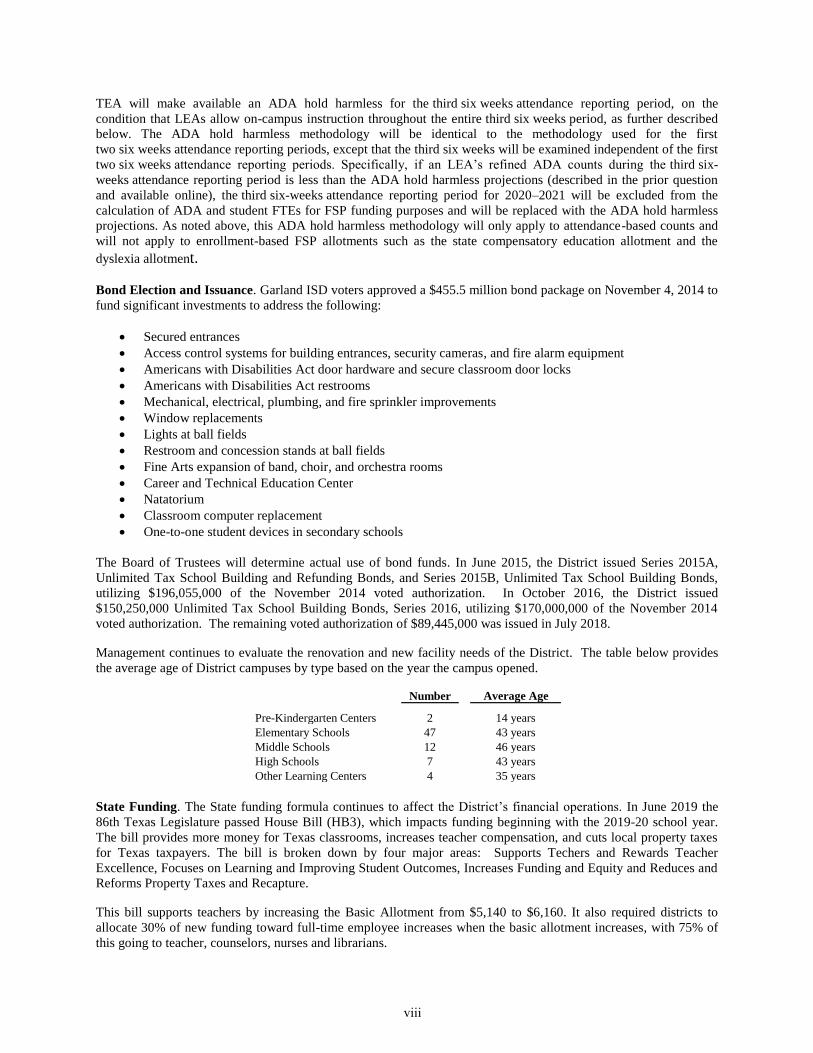
TEA will make available an ADA hold harmless for the third six weeks attendance reporting period, on the
condition that LEAs allow on-campus instruction throughout the entire third six weeks period, as further described
below. The ADA hold harmless methodology will be identical to the methodology used for the first
two six weeks attendance reporting periods, except that the third six weeks will be examined independent of the first
two six weeks attendance reporting periods. Specifically, if an LEA’s refined ADA counts during the third six-
weeks attendance reporting period is less than the ADA hold harmless projections (described in the prior question
and available online), the third six-weeks attendance reporting period for 2020–2021 will be excluded from the
calculation of ADA and student FTEs for FSP funding purposes and will be replaced with the ADA hold harmless
projections. As noted above, this ADA hold harmless methodology will only apply to attendance-based counts and
will not apply to enrollment-based FSP allotments such as the state compensatory education allotment and the
dyslexia allotment.
Bond Election and Issuance. Garland ISD voters approved a $455.5 million bond package on November 4, 2014 to
fund significant investments to address the following:
Secured entrances
Access control systems for building entrances, security cameras, and fire alarm equipment
Americans with Disabilities Act door hardware and secure classroom door locks
Americans with Disabilities Act restrooms
Mechanical, electrical, plumbing, and fire sprinkler improvements
Window replacements
Lights at ball fields
Restroom and concession stands at ball fields
Fine Arts expansion of band, choir, and orchestra rooms
Career and Technical Education Center
Natatorium
Classroom computer replacement
One-to-one student devices in secondary schools
The Board of Trustees will determine actual use of bond funds. In June 2015, the District issued Series 2015A,
Unlimited Tax School Building and Refunding Bonds, and Series 2015B, Unlimited Tax School Building Bonds,
utilizing $196,055,000 of the November 2014 voted authorization. In October 2016, the District issued
$150,250,000 Unlimited Tax School Building Bonds, Series 2016, utilizing $170,000,000 of the November 2014
voted authorization. The remaining voted authorization of $89,445,000 was issued in July 2018.
Management continues to evaluate the renovation and new facility needs of the District. The table below provides
the average age of District campuses by type based on the year the campus opened.
Number Average Age
Pre-Kindergarten Centers 2 14 years
Elementary Schools 47 43 years
Middle Schools 12 46 years
High Schools 7 43 years
Other Learning Centers 4 35 years
State Funding. The State funding formula continues to affect the District’s financial operations. In June 2019 the
86th Texas Legislature passed House Bill (HB3), which impacts funding beginning with the 2019-20 school year.
The bill provides more money for Texas classrooms, increases teacher compensation, and cuts local property taxes
for Texas taxpayers. The bill is broken down by four major areas: Supports Techers and Rewards Teacher
Excellence, Focuses on Learning and Improving Student Outcomes, Increases Funding and Equity and Reduces and
Reforms Property Taxes and Recapture.
This bill supports teachers by increasing the Basic Allotment from $5,140 to $6,160. It also required districts to
allocate 30% of new funding toward full-time employee increases when the basic allotment increases, with 75% of
this going to teacher, counselors, nurses and librarians.
viii
HB3 Focuses on learning and improving student outcomes include establishing an Early Education Allotment for
students in grade K-3 who are educationally disadvantaged or limited English proficiency. It also establishes a new
Dyslexia Allotment of 0.1 per ADA and a Dual Language Allotment. It also focused on improving college, career
and military readiness (CCMR) by requiring school boards to adopt and monitor CCMR plans. It increased funding
for college pre exams, industry certification exams, career and technical education.
HB3 increased funding and equity by increasing compensatory education weight from 0.2 to one of five values from
0.225 – 0.275 based upon the census tier for educationally disadvantaged students.
It also reduces and reforms property taxes by cutting property taxes in the first year by an average of 8 cents per
$100 of assessed value, bringing the maximum allowable tax rate for Maintenance & Operations from $1.17 to
$1.06835. HB3 also provides for automatic tax rate reductions starting in the second year if property value grows by
more than 2.5% per year.
Fund Balance. The unassigned fund balance in the general fund is 53% of general fund expenditures. This
represents 6.4 months of operations in the general fund. The District has been aware of the possibility of fluctuations
in state funding for several years and has taken steps to control expenditures and increase operational efficiencies.
Accordingly, the fund balance in the general fund has increased for 10 consecutive years. The increased fund balance
will enable the District to compensate for fluctuations in state funding and meet the challenge of future needs.
MAJOR INITIATIVES AND ACCOMPLISHMENTS
The Board of Trustees for Garland ISD has continued to ensure that all of the students in the district have the
opportunity to earn college credit in addition to their high school diplomas by expanding the College for All
initiative to include all seven of the district high schools. Lakeview Centennial High School continues to host the
Collegiate Academy, which allows students to graduate with both an associate degree (up to 60 credit hours) and a
high school diploma. The focus at this campus is Accounting and Criminal Justice. In 2019-20, Naaman Forrest
High School launched a Collegiate Academy and partnered with Richland College to offer both an Associate of
Science and Associate of Arts degrees that focus on Construction Technology and Mortgage Banking. Rowlett High
School launched a Collegiate Academy for Technology, which offers both an Associate of Applied Science degree
as well as a two-year career certification. They will focus on Game Design as well as Software Programming and
Developing. The campus will work with local businesses as well, including Microsoft and Game Stop, to provide
students training through internships and apprenticeships. The South Garland Early College High School partnered
with Eastfield College and will target first-generation college-goers, as well as students who may not already be on
the path to college. This program offers an Associate of Science degree with a focus on automotive and electronics
as well as an Associate of Arts degree in Teaching ED-6. In 2020-21, the College for All initiative will expand to
the remaining three high schools. Garland High School is partnering with Richland College to offer both an
Associate of Applied Science degrees and Associate of Science degrees with a focus on Advanced Manufacturing or
Electrical Engineering. North Garland High School in its partnership with Richland College offers an Associate of
Applied Science with a focus on Network Administration and Support and Associate of Science degree with a
concentration in Premedical/Predental. Sachse High School in partnership with Richland College will offer an
Associate of Applied Science in Multimedia Web Design and Associate of Arts in Teaching EC-6. Garland High
School and Naaman Forest High School joined Lakeview Centennial High School, North Garland High School, and
South Garland High School in the Dallas County Promise to offer all students a full-ride scholarship.
The 2019-20 school year also saw the addition of ESports at each of the seven district high schools as well as the
Gilbreth-Reed Career and Technical Center. Garland ISD became the largest school district to have all of its high
schools compete for a state championship title and advance to the playoffs. Naaman Forrest High School earned the
gold in the PlayVS Rocket League State Championship.
ix

MAJOR INITIATIVES AND ACCOMPLISHMENTS- continued
Garland ISD has also excelled in its Visual and Performing Arts by earning multiple awards again. For the second
year in a row, Garland ISD was named a 2020 District of Distinction from the Texas Art Education Association.
Only 42 districts received a distinction this year, out of more than 1,000 applications, placing Garland ISD in the top
4 percent statewide. Garland ISD also received its 11th distinction as a 2020 Best Communities for Music Education
by the National Association of Music Merchants Foundation. Austin Academy Honors Orchestra, directed by Jane
Samford, is a National Winner in the 2020 March of Excellence/National Orchestra Honors project by the
Foundation for Music Education that recognizes programs for high standards in performance. Out of 145 entries
from 38 states, only 13 were named National Winners.
2019-20 also brought many unexpected challenges and trials that the country had not seen in 100 years. The spring
brought nationwide shut downs due to the Coronavirus (COVID-19) pandemic that affected business as well as
schools. Garland ISD rose to the challenge to offer its students at-home learning. They also distributed more than
18,000 technology devices to students so that they would be able to learn at home. Teachers and administrators
collaborated to design activities and lessons for families to continue learning at home. The district’s at-home
learning website has been accessed by more than 97,000 users spanning all 50 states and 63 countries. Student
Nutrition Services also stepped up and distributed more than 550,000 meals at 33 curbside pickup locations between
March 16-May 1, 2020.
With many school districts across the country cancelling high school graduations, Garland ISD fought to come up
with many different plans and options to hold in-person graduations for the districts graduating seniors. Plans
changed several times before they were finally able to hold graduations at the brand new Globe Life Field, home of
the Texas Rangers. The Board of Trustees and District Leadership were able to pull off an amazing graduation for
each high school where 4,321 graduates received their diplomas at Home Plate. With all of the end of year activities
also cancelled, they were still able to celebrate the top ten students from each high school by doing drive-by
celebrations. The valedictorian and salutatorian from each high school received a visit from members of the Board
of Trustees as well as various members of the District Leadership team and campus staff, including teachers. Each
of the top ten students also received a yard sign celebrating their accomplishment.
x
AWARDS AND ACKNOWLEDGEMENTS
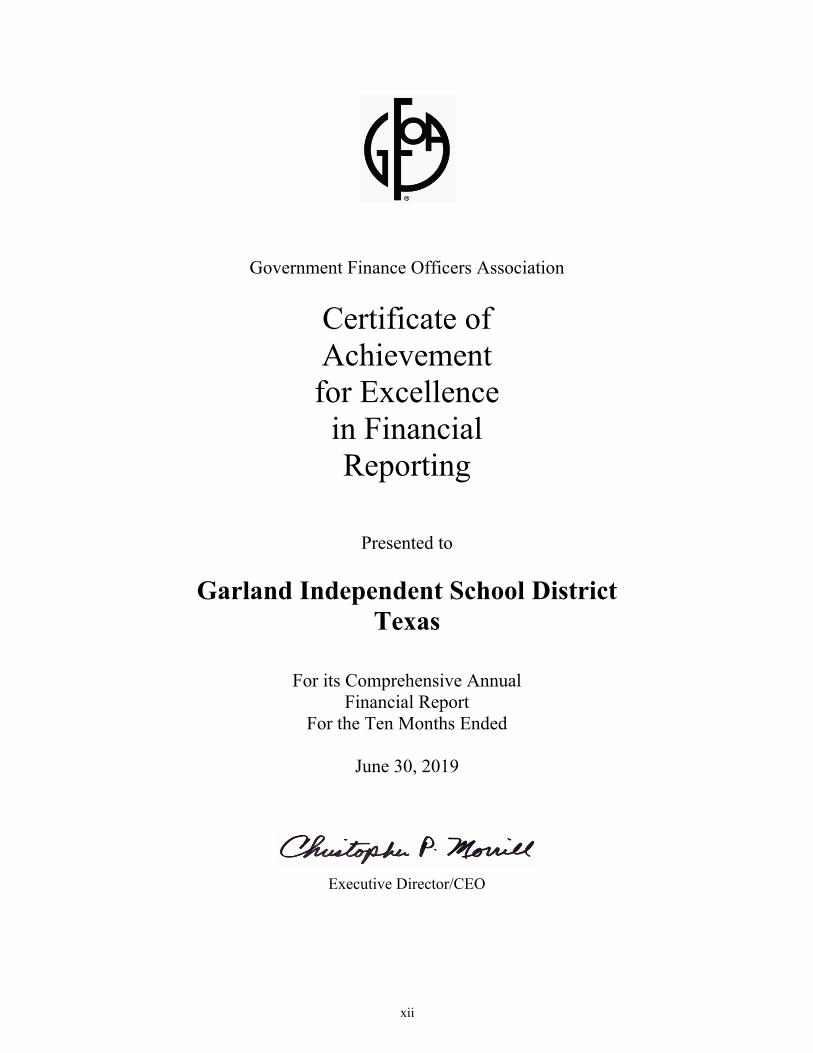
Awards - The Government Finance Officers Associations of the United States and Canada (GFOA) awarded a
Certificate of Achievement for Excellence in Financial Reporting to the District for its Comprehensive Annual
Financial Report for the fiscal year ended June 30, 2019. The Certificate of Achievement is a prestigious national
award recognizing conformance with the highest standards for preparation of state and local government financial
reports. In order to be awarded a Certificate of Achievement, the District published a Comprehensive Annual
Financial Report in which contents conformed to program standards. This report satisfied both generally accepted
accounting principles and applicable legal requirements. A Certificate of Achievement is valid for a period of only
one year. The District has received a Certificate of Achievement for thirty-one consecutive years. We believe our
current Comprehensive Annual Financial Report continues to meet the Certificate of Achievement program
requirements and we are submitting it to the GFOA to determine its eligibility for another certificate.
The District was awarded a Certificate of Excellence in Financial Reporting by the Association of School Business
Officials (ASBO) stating that the District’s Comprehensive Annual Financial Report for the fiscal year ended June
30, 2019, substantially conformed to the recommended principles and standards of financial reporting adopted by
that organization. The District has received the Certificate of Excellence for thirty-two consecutive years. The
Certificate of Excellence is valid for a period of one year only. We believe that our current report continues to
conform to the Certificate of Excellence program requirements and we are submitting it to ASBO to determine its
eligibility for another certificate.
Acknowledgments - The preparation of this report on a timely basis could not be accomplished without the efficient
and dedicated services of the Finance and Budget Departments. We would like to express our appreciation to all
members of the department who assisted and contributed.
We also wish to thank the Board of Trustees for their continued leadership and support and for planning and
conducting the financial operations of the District in a responsible and progressive manner.
Sincerely,
________________________________
Ricardo López, Ed.D.
Superintendent
________________________________
Brent Ringo, Ed.D.
Chief Financial Officer
________________________________
Allison Davenport, CPA
Executive Director of Finance
xi
Government Finance Officers Association
Certificate of Achievementfor Excellence
in Financial Reporting
Presented to
Garland Independent School District Texas
For its Comprehensive AnnualFinancial Report
For the Ten Months Ended
June 30, 2019
Executive Director/CEO
xii

The Certificate of Excellence in Financial Reporting
is presented to
Garland Independent School District
for its Comprehensive Annual Financial Report (CAFR)
for the Fiscal Year Ended June 30, 2019.
The CAFR meets the criteria established for
ASBO International’s Certificate of Excellence.
Claire Hertz, SFO David J. Lewis
President Executive Director
xiii

This page intentionally left blank

Financial Section

This page intentionally left blank
Dallas Office 8343 Douglas Avenue Suite 400 Dallas, Texas 75225 214.393.9300 Main
whitleypenn.com
REPORT OF INDEPENDENT AUDITORS
To the Board of TrusteesGarland Independent School District Garland, Texas
Report on the Financial Statements
We have audited the accompanying financial statements of the governmental activities, each major fund and the aggregate remaining fund information of Garland Independent School District (the “District”), as of and for the year ended June 30, 2020, and the related notes to the financial statements, which collectively comprise the District’s basic financial statements as listed in the table of contents.
Management’s Responsibility for the Financial Statements
Management is responsible for the preparation and fair presentation of these financial statements inaccordance with accounting principles generally accepted in the United States of America; this includesthe design, implementation, and maintenance of internal control relevant to the preparation and fair presentation of financial statements that are free from material misstatement, whether due fraud or error.
Auditor’s Responsibility
Our responsibility is to express opinions on these financial statements based on our audit. We conducted our audit in accordance with auditing standards generally accepted in the United States of America and the standards applicable to financial audits contained in Government Auditing Standards, issued by the Comptroller General of the United States. Those standards require that we plan and perform the audit toobtain reasonable assurance about whether the financial statements are free of material misstatement.
An audit involves performing procedures to obtain audit evidence about the amounts and disclosures in the financial statements. The procedures selected depend on the auditor’s judgment, including the assessment of the risks of material misstatement of the financial statements, whether due to fraud or error. In making those risk assessments, the auditor considers internal control relevant to the entity’s preparation and fair presentation of the financial statements in order to design audit procedures that are appropriate in the circumstances, but not for the purpose of expressing an opinion on the effectiveness of the entity’s internal control. Accordingly, we express no such opinion. An audit also includes evaluating theappropriateness of accounting policies used and the reasonableness of significant accounting estimates made by management, as well as evaluating the overall presentation of the financial statements.
We believe that the audit evidence we have obtained is sufficient and appropriate to provide a basis for our audit opinions.
1
To the Board of Trustees Garland Independent School District
Opinions
In our opinion, the financial statements referred to above present fairly, in all material respects, the respective financial position of the governmental activities, each major fund, and the aggregate remaining fund information of the District as of June 30, 2020, and the respective changes in financial position and, where applicable, cash flows thereof for the year then ended in accordance with accounting principles generally accepted in the United States of America.
Other Matters
Required Supplementary Information
Accounting principles generally accepted in the United States of America require that management’s discussion and analysis on pages 4 through 11 and budgetary comparison information, pension information, and other-post employment benefit information on pages 58 through 64, be presented to supplement the basic financial statements. Such information, although not a part of the basic financial statements, is required by the Governmental Accounting Standards Board, who considers it to be an essential part of the financial reporting for placing the basic financial statements in an appropriate operational, economic, or historical context. We have applied certain limited procedures to the required supplementary information in accordance with auditing standards generally accepted in the United States of America, which consisted of inquiries of management about the methods of preparing the information and comparing the information for consistency with management’s responses to our inquiries, the basic financial statements, and other knowledge we obtained during our audit of the basic financial statements. We do not express an opinion or provide any assurance on the information because the limited procedures do not provide us with sufficient evidence to express an opinion or provide any assurance.
Other Information
Our audit was conducted for the purpose of forming opinions on the financial statements that collectively comprise the District’s basic financial statements. The combining and individual non-major fund financial statements, and required Texas Education Agency (“TEA”) schedules, as listed in the table of contents, are presented for purposes of additional analysis and are not a required part of the basic financial statements. The schedule of expenditures of federal awards is presented for purposes of additional analysis as required by Title 2 U.S. Code of Federal Regulations (CFR) Part 200, Uniform Administrative Requirements, Cost Principles, and Audit Requirements for Federal Awards, and other information, such as the introductory and statistical section, are presented for purposes of additional analysis and are also not a required part of the basic financial statements.
The combining and individual non-major fund financial statements, and required TEA schedules, as listed in the table of contents, and the schedule of expenditures of federal awards are the responsibility of management and were derived from and relate directly to the underlying accounting and other records used to prepare the basic financial statements. Such information has been subjected to the auditing procedures applied in the audit of the basic financial statements and certain additional procedures, including comparing and reconciling such information directly to the underlying accounting and other records used to prepare the basic financial statements or to the basic financial statements themselves, and other additional procedures in accordance with auditing standards generally accepted in the United States of America. In our opinion, the combining and individual non-major fund financial statements, required TEA schedules, and the schedule of expenditures of federal awards are fairly stated, in all material respects, in relation to the basic financial statements as a whole.
2
To the Board of Trustees Garland Independent School District
The introductory and statistical sections have not been subjected to the auditing procedures applied in the audit of the basic financial statements and, accordingly, we do not express an opinion or provide any assurance on them.
Other Reporting Required by Government Auditing Standards
In accordance with Government Auditing Standards, we have also issued our report dated December 15, 2020 on our consideration of the District’s internal control over financial reporting and our tests of its compliance with certain provisions of laws, regulations, contracts, grant agreements and other matters. The purpose of that report is solely to describe the scope of our testing of internal control over financial reporting and compliance and the results of that testing, and not to provide an opinion on the effectiveness of the District’s internal control over financial reporting or on compliance. That report is an integral part of an audit performed in accordance with Government Auditing Standards in considering the District’s internal control over financial reporting and compliance.
Dallas, Texas December 15, 2020
3
This page intentionally left blank
Garland Independent School District
Management’s Discussion and Analysis
Year Ended June 30, 2020
As management of the District, we offer readers of the District’s financial statements this narrative overview and
analysis of the financial activities of the District for the fiscal year ended June 30, 2020.
FINANCIAL HIGHLIGHTS
The assets and deferred outflows of the District’s governmental activities exceeded its liabilities and
deferred inflows at the close of the most recent fiscal year by $301,119,161 (net position). Of this amount
$73,878,610 was restricted for specific purposes (i.e. Federal/State grants, Debt Service and Student
Nutrition). Unrestricted net position was ($125,543,118) due to GASB 75. The remainder represents the net
investments in capital assets.
As of the close of the current fiscal year, the District’s governmental funds reported combined ending fund
balances of $403,198,801, which breaks down as follows.
Non-Spendable 2,647,142$ 0.7%
Restricted 111,448,124 27.6%
Committed 11,087,876 2.7%
Assigned 20,115,877 5.0%
Unassigned 257,899,782 64.0%
Total 403,198,801$ 100.0%
OVERVIEW OF THE FINANCIAL STATEMENTS
Both the discussion and analysis presented are intended to serve as an introduction to the District’s basic financial
statements. The District’s basic financial statements comprise three components: government-wide financial
statements, fund financial statements, and notes to the financial statements. This report contains other
supplementary information in addition to the basic financial statements.
Government-wide financial statements. The government-wide financial statements are designed to provide
readers with a broad overview of the District’s finances, in a manner similar to a private-sector business.
The statement of net position presents information on all of the District’s assets, liabilities, and deferred outflows
and inflows of resources. Net position is equal to assets plus deferred outflows of resources less liabilities and
deferred inflows of resources. Over time, increases or decreases in net position may serve as a useful indicator of
whether the financial position of the District is improving or deteriorating.
The statement of activities presents information for all current year revenues and expenses regardless of when
revenue is received or expenses incurred. Therefore, some revenues and expenses reported in this statement will
result in cash flows in future fiscal periods.
Component units are legally separate organizations for which the Board of Trustees of the District is legally
accountable. They can also be other organizations for which the nature and significance of their relationship with
the District is such that exclusion would cause the District’s financial statements to be incomplete. The District has
no component units for which it is financially accountable. The government-wide financial statements can be found
on pages 12-13 of this report.
4
Fund financial statements. A fund is a grouping of related accounts used to maintain control over resources
segregated for specific activities or objectives. The District, like other state and local governments, uses fund
accounting to demonstrate compliance with finance-related requirements. The fund financial statements provide
more detailed information about the District’s most significant funds, not the District as a whole. Some funds are
required by State law and/or bond covenants. Other funds may be established by the Board to control and manage
money for particular purposes or to show it is properly using certain taxes or grants.
All of the funds of the District can be divided into three categories: governmental funds, proprietary funds, and
fiduciary funds.
Governmental funds. Governmental funds are used to account for essentially the same functions reported
as governmental activities in the government-wide financial statements. However, unlike the government-
wide financial statements, governmental fund financial statements focus on near-term inflows and outflows
of spendable resources as well as on balances of spendable resources available at the end of the fiscal year.
Such information may be useful in evaluating a government’s near-term financing requirements. Because
the focus of governmental funds is narrower than that of the government-wide financial statements, it is
useful to compare the information presented for governmental funds with similar information presented for
governmental activities in the government-wide financial statements. By doing so, readers may better
understand the long-term impact of the government’s near-term financing decisions. Both the
governmental fund balance sheet and the governmental fund statement of revenues, expenditures, and
changes in fund balance provide a reconciliation to facilitate this comparison between governmental funds
and governmental activities. The District maintains four governmental funds all of which are considered to
be major funds. Information is presented separately in the governmental fund balance sheet and in the
governmental fund statement of revenues, expenditures, and changes in fund balances for the general fund,
debt service fund, capital projects fund, and special revenue fund. Per the Texas Education Agency, the
District adopts an annual appropriated budget for its general fund, debt service fund, and student nutrition
services fund. A budgetary comparison schedule has been provided to demonstrate compliance with these
budgets. The basic governmental fund financial statements can be found on pages 14-19 of this report.
Proprietary funds. Proprietary funds provide the same type of information as the government-wide
financial statements, only in more detail. The District’s five proprietary funds are Internal Service Funds.
Internal Service Funds are an accounting device used to accumulate and allocate costs internally among the
various functions. The District uses the Internal Service Fund to report activities for its motor pool, print
shop, risk management, copier pool and Curtis Culwell Center. The proprietary fund statements offer short
and long-term financial information about the activities the District operates like a business. The basic
proprietary fund financial statements can be found on pages 20-22 of this report.
Fiduciary funds. Fiduciary funds are used to account for resources held for the benefit of parties outside
the District. Fiduciary funds are not reflected in the government-wide financial statements because the
resources of those funds are not available to support the District’s own programs. The District is the
trustee, or fiduciary, for these funds and is responsible for ensuring the assets reported in these funds are
used for their intended purposes. All of the District’s fiduciary activities are reported in a separate
statement of fiduciary assets and liabilities that can be found on page 23. These activities are excluded
from the District’s government-wide financial statements because the District cannot use these assets to
finance its operations.
Notes to the financial statements. The notes provide additional information essential to a complete understanding
of the data provided in the government-wide and fund financial statements. The notes to the financial statements
can be found on pages 24-57 of this report.
5
Other information. In addition to the basic financial statements and accompanying notes, this report also presents
certain required supplementary information that further explains and supports the information in the financial
statements. Required supplementary information can be found on pages 58-64 of this report.
Combining statements are prepared in connection with internal service funds and are presented immediately
following the required supplementary information on pages 65-71 of this report.
Government-wide Financial Analysis
As previously noted, net position may serve as a useful indicator of a government’s financial position. As of June
30, 2020, assets and deferred outflow of resources exceeded liabilities and deferred inflows by $301,119,161.
The District’s Net Position
2020 2019
Current and other assets 489,661,396$ 498,003,775$
Capital assets 837,735,025 816,930,507
Total assets 1,327,396,421 1,314,934,282
Total deferred outflows 120,617,415 137,571,603
Noncurrent liabilities 950,198,242 1,015,530,083
Other liabilities 78,668,996 93,859,873
Total liabilities 1,028,867,238 1,109,389,956
Total deferred inflows 118,027,437 81,297,958
Net investment in
capital assets 352,783,669 339,849,519
Restricted 73,878,610 57,695,155
Unrestricted (125,543,118) (135,726,703) Total net position 301,119,161$ 261,817,971$
Governmental
Activities
Net Position. As noted earlier, net position may serve over time as a useful indicator of the District’s financial
position. The District’s combined net position between fiscal years 2020 and 2019 increased by $39.3 million. This
is due to a reduction in expenses from the COVID-19 shutdown. The District’s net investment in capital assets is
$352.8 million and includes investments in capital assets (e.g. land, building, equipment, improvements, and
construction in progress) less any debt used to acquire those assets that is still outstanding. Of the remaining net
position, $73.9 million are restricted resources subject to external restrictions on how they are used, and ($125.5)
million are unrestricted resources.
The District uses the capital assets to provide services to students; consequently, these assets are not available for
future spending. Although the District’s investment in its capital assets is reported net of related debt, it should be
noted that the resources needed to repay this debt must be provided from other sources, since the capital assets
themselves cannot be used to liquidate these liabilities.
The above table provides a summary of the Assets, Deferred Outflows of Resources, Liabilities, Deferred Inflows of
Resources, and Net Position for governmental activities for years ended June 30, 2020 and 2019, respectively.
6
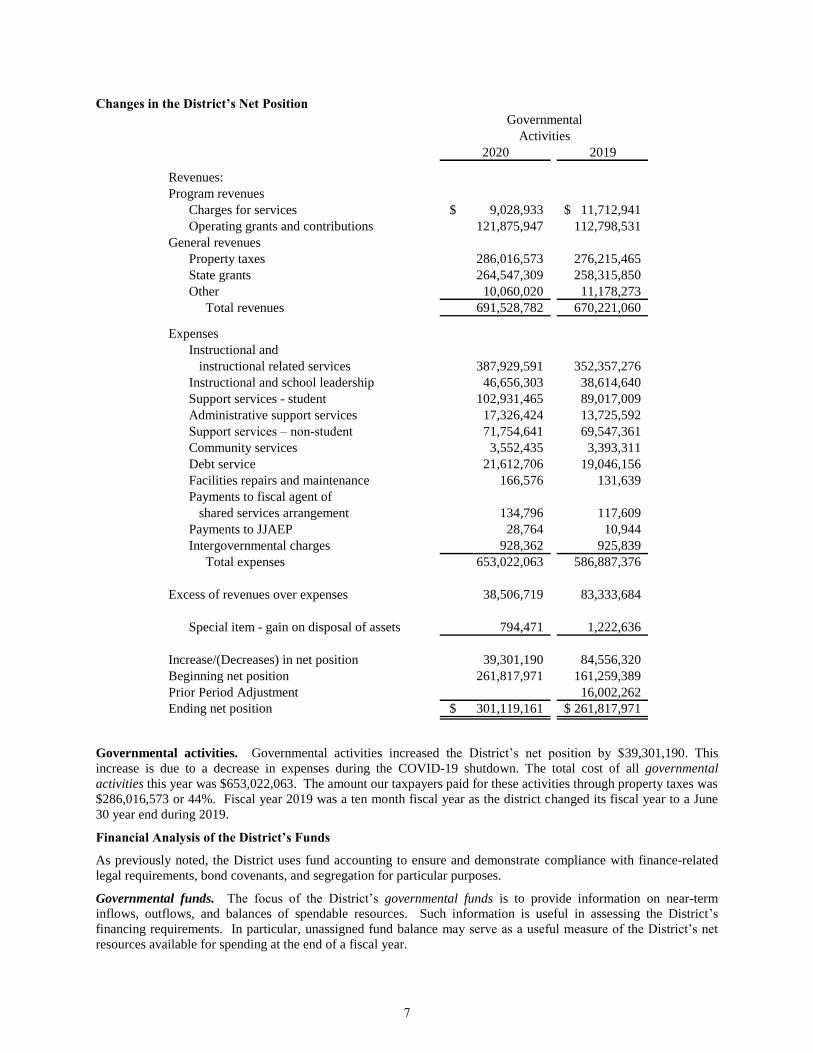
Changes in the District’s Net Position
2020 2019
Revenues:
Program revenues
Charges for services 9,028,933$ 11,712,941$
Operating grants and contributions 121,875,947 112,798,531
General revenues
Property taxes 286,016,573 276,215,465
State grants 264,547,309 258,315,850
Other 10,060,020 11,178,273
Total revenues 691,528,782 670,221,060
Expenses
Instructional and
instructional related services 387,929,591 352,357,276
Instructional and school leadership 46,656,303 38,614,640
Support services - student 102,931,465 89,017,009
Administrative support services 17,326,424 13,725,592
Support services – non-student 71,754,641 69,547,361
Community services 3,552,435 3,393,311
Debt service 21,612,706 19,046,156
Facilities repairs and maintenance 166,576 131,639
Payments to fiscal agent of
shared services arrangement 134,796 117,609
Payments to JJAEP 28,764 10,944
Intergovernmental charges 928,362 925,839
Total expenses 653,022,063 586,887,376
Excess of revenues over expenses 38,506,719 83,333,684
Special item - gain on disposal of assets 794,471 1,222,636
Increase/(Decreases) in net position 39,301,190 84,556,320
Beginning net position 261,817,971 161,259,389
Prior Period Adjustment 16,002,262
Ending net position 301,119,161$ 261,817,971$
Governmental
Activities
Governmental activities. Governmental activities increased the District’s net position by $39,301,190. This
increase is due to a decrease in expenses during the COVID-19 shutdown. The total cost of all governmental
activities this year was $653,022,063. The amount our taxpayers paid for these activities through property taxes was
$286,016,573 or 44%. Fiscal year 2019 was a ten month fiscal year as the district changed its fiscal year to a June
30 year end during 2019.
Financial Analysis of the District’s Funds
As previously noted, the District uses fund accounting to ensure and demonstrate compliance with finance-related
legal requirements, bond covenants, and segregation for particular purposes.
Governmental funds. The focus of the District’s governmental funds is to provide information on near-term
inflows, outflows, and balances of spendable resources. Such information is useful in assessing the District’s
financing requirements. In particular, unassigned fund balance may serve as a useful measure of the District’s net
resources available for spending at the end of a fiscal year.
7
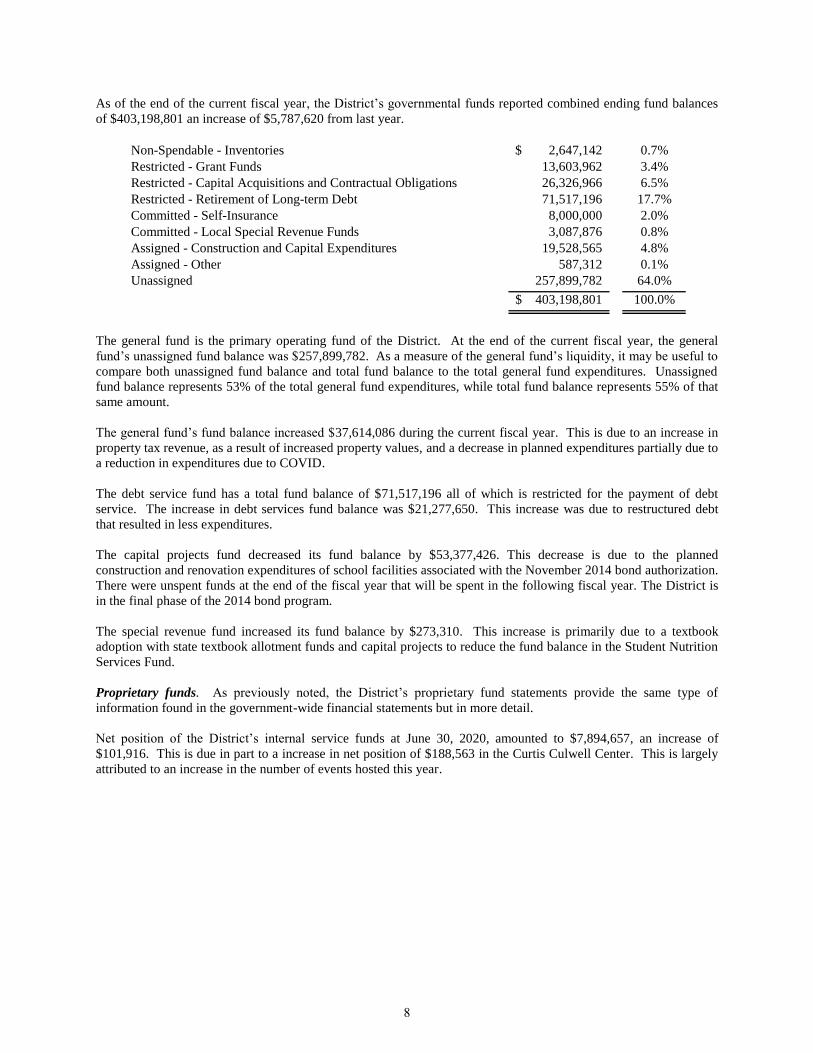
As of the end of the current fiscal year, the District’s governmental funds reported combined ending fund balances
of $403,198,801 an increase of $5,787,620 from last year.
Non-Spendable - Inventories 2,647,142$ 0.7%
Restricted - Grant Funds 13,603,962 3.4%
Restricted - Capital Acquisitions and Contractual Obligations 26,326,966 6.5%
Restricted - Retirement of Long-term Debt 71,517,196 17.7%
Committed - Self-Insurance 8,000,000 2.0%
Committed - Local Special Revenue Funds 3,087,876 0.8%
Assigned - Construction and Capital Expenditures 19,528,565 4.8%
Assigned - Other 587,312 0.1%
Unassigned 257,899,782 64.0%
403,198,801$ 100.0%
The general fund is the primary operating fund of the District. At the end of the current fiscal year, the general
fund’s unassigned fund balance was $257,899,782. As a measure of the general fund’s liquidity, it may be useful to
compare both unassigned fund balance and total fund balance to the total general fund expenditures. Unassigned
fund balance represents 53% of the total general fund expenditures, while total fund balance represents 55% of that
same amount.
The general fund’s fund balance increased $37,614,086 during the current fiscal year. This is due to an increase in
property tax revenue, as a result of increased property values, and a decrease in planned expenditures partially due to
a reduction in expenditures due to COVID.
The debt service fund has a total fund balance of $71,517,196 all of which is restricted for the payment of debt
service. The increase in debt services fund balance was $21,277,650. This increase was due to restructured debt
that resulted in less expenditures.
The capital projects fund decreased its fund balance by $53,377,426. This decrease is due to the planned
construction and renovation expenditures of school facilities associated with the November 2014 bond authorization.
There were unspent funds at the end of the fiscal year that will be spent in the following fiscal year. The District is
in the final phase of the 2014 bond program.
The special revenue fund increased its fund balance by $273,310. This increase is primarily due to a textbook
adoption with state textbook allotment funds and capital projects to reduce the fund balance in the Student Nutrition
Services Fund.
Proprietary funds. As previously noted, the District’s proprietary fund statements provide the same type of
information found in the government-wide financial statements but in more detail.
Net position of the District’s internal service funds at June 30, 2020, amounted to $7,894,657, an increase of
$101,916. This is due in part to a increase in net position of $188,563 in the Curtis Culwell Center. This is largely
attributed to an increase in the number of events hosted this year.
8
Budgetary Highlights
In June 2019 the Board of Trustees adopted the 2019-20 budget, which supports the District’s strategic goals. The
budgeting process involves careful planning to properly align revenues and appropriations. A conservative budget
approach is utilized when estimating revenues. Expenditures, on the other hand, are allocated to be fully expended.
This methodology, in essence, creates a ‘worst case budget scenario’ and ensures that expenditures by function are
not exceeded. The expected result each year is that revenues will exceed estimated amounts and expenditures will be
less than budgeted.
During the course of the year, the District monitors revenues and expenditures and submits monthly amendments to
the Board for approval to be more in line with expected final results. Over the course of the year, the District
recommended and the Board approved, several revisions to budgeted revenue and appropriations. These
amendments fall into the following categories:
Amendments approved shortly after the beginning of the new fiscal year for amounts reserved and
designated in the prior year
Amendments approved shortly after the beginning of the new fiscal year to align the payroll budget with
job assignment changes
Amendments in summer to revise estimates for local and state revenue based on the latest information on
student attendance numbers and tax collections
Amendments throughout the year for transfers to and from other funds and federal indirect cost calculations
Amendments during the year for changes in programs
Significant differences between the original and final amended budget can be briefly summarized as follows:
GENERAL FUND
Revenues
$14,176,485 decrease in local revenue sources due to increase state received as an impact from House Bill
3.
$35,237,292 increase in state program revenue sources due to updated guidance from House Bill 3.
$3,000,000 decrease in federal program revenue due to timing of Medicaid payments.
Expenditures by function are amended monthly to fulfill requests from campuses and central organizations to
appropriately code expenses as required by the state accountability system.
Additionally, the District made and the Board approved the transfers in and out:
$6,574,697 transfer in from capital projects for projects related to the SECO-LoneStar Program. This
amount was transferred from the general fund to capital projects during FY19.
$9,000,000 transfer in from capital projects as repayment for funds used to supplement bond program
projects as savings from other construction projects were realized. These funds were transferred from the
general fund to capital projects during FY19.
$3,916,000 transfer out to fund bus and white fleet purchases.
$590,000 transfer out to fund construction projects at Lakeview Centennial, O’Banion, and Walnut Glen.
$300,000 transfer out for the Natatorium scoreboard.
After appropriations were amended as described above, actual revenues were $4,061,223 greater than final budgeted
amounts due to more revenue in local, state and federal programs than final budgeted estimates. Actual
expenditures were $29,750,414 less than final budget amounts due to savings primarily from operational changes
due to COVID-19. Year-end revenues were greater than expenditures, thus adding to existing fund balance.
9
NATIONAL BREAKFAST AND LUNCH PROGRAM
Revenues
$3,658,809 decrease in federal revenue sources due to decrease in meal service due to COVID-19.
Expenditures
$3,658,809 increase in food services expenditures due to increase in operational and construction of a
freezer to house food service inventory.
Actual revenues were $6,677,621 less than final budgeted amounts due to less revenue in local and state sources
than final budgeted estimates. Actual expenditures were $5,570,947 less than final budget amounts due to the year-
end payroll accrual being less than estimated. Year-end expenditures were less than revenue, thus increasing
existing fund balance.
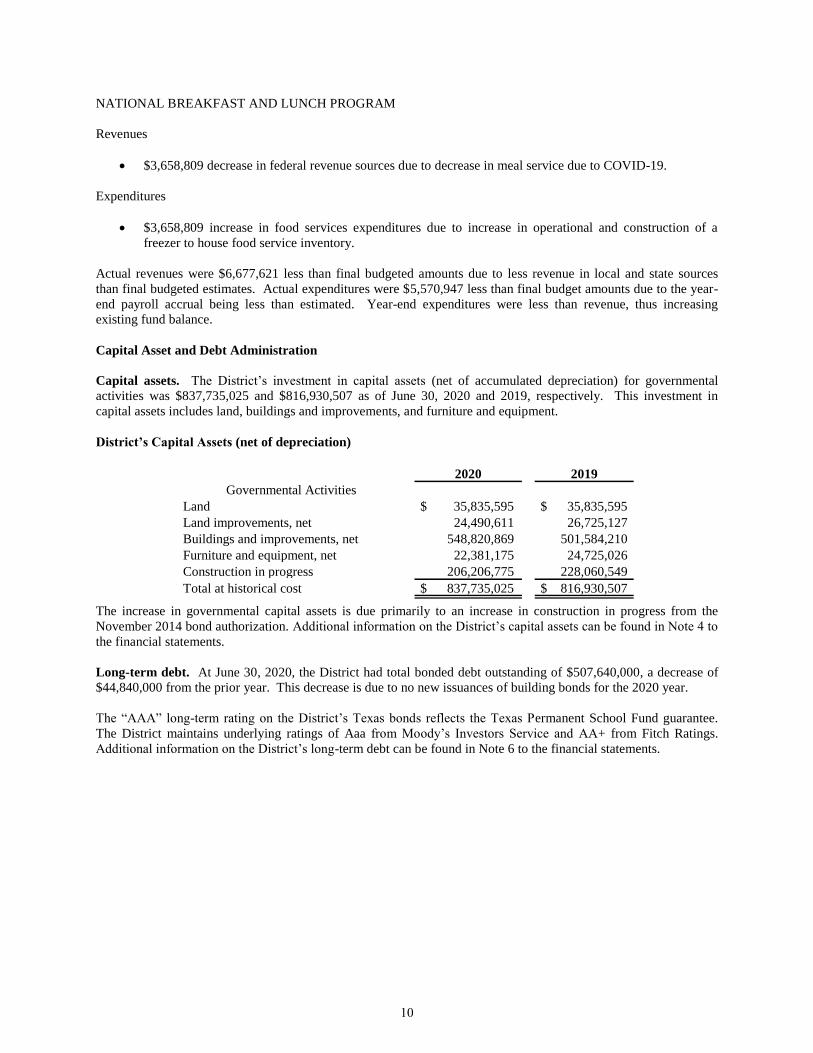
Capital Asset and Debt Administration
Capital assets. The District’s investment in capital assets (net of accumulated depreciation) for governmental
activities was $837,735,025 and $816,930,507 as of June 30, 2020 and 2019, respectively. This investment in
capital assets includes land, buildings and improvements, and furniture and equipment.
District’s Capital Assets (net of depreciation)
2020 2019
Governmental Activities
Land $ 35,835,595 $ 35,835,595
Land improvements, net 24,490,611 26,725,127
Buildings and improvements, net 548,820,869 501,584,210
Furniture and equipment, net 22,381,175 24,725,026
Construction in progress 206,206,775 228,060,549
Total at historical cost $ 837,735,025 $ 816,930,507
The increase in governmental capital assets is due primarily to an increase in construction in progress from the
November 2014 bond authorization. Additional information on the District’s capital assets can be found in Note 4 to
the financial statements.
Long-term debt. At June 30, 2020, the District had total bonded debt outstanding of $507,640,000, a decrease of
$44,840,000 from the prior year. This decrease is due to no new issuances of building bonds for the 2020 year.
The “AAA” long-term rating on the District’s Texas bonds reflects the Texas Permanent School Fund guarantee.
The District maintains underlying ratings of Aaa from Moody’s Investors Service and AA+ from Fitch Ratings.
Additional information on the District’s long-term debt can be found in Note 6 to the financial statements.
10
Economic Factors and Next Year’s Budgets and Rates
The unemployment rate for the City of Garland stands at 3.3%. Dallas County has a 3.5% unemployment
rate as compared to a statewide rate of 7.0% and a national average of 8.5%.
Inflationary trends in the region tend to be similar to the national consumer price index (CPI). The region’s
CPI increased 0.4% while the nation experienced a 1.4% increase.
The District’s student attendance rate has historically been approximately 96%.
The District has appropriated revenues of $559,662,185 and expenditures of $548,724,059 in the 2020-21
budget of the General Fund.
The Debt Service Fund has budgeted revenues of $72,426,381 and expenditures of $66,025,000 in the
2020-21 budget.
The Student Nutrition Services Fund revenue and expenditure budgets for 2020-21 are $33,802,809 and
$37,802,809, respectively.
The 2020-21 budget is based on a total property tax rate of $1.2563 per hundred dollars of assessed value.
The property tax rate for maintenance and operations is $0.9513 per hundred dollars of assessed value. The
debt service tax rate is $0.3050 per hundred dollars of assessed value. The District’s taxable value for
2020-21 increased 2.58% due to an increase in commercial and residential property values.
COVID will potentially impact state funding for the FY21 year. TEA will institute the ADA hold harmless
for the first two six-week attendance reporting periods as follows: if an LEA’s Refined ADA counts during
those first two six-week reporting periods are less than the ADA hold harmless projections, the first two
six-week attendance reporting periods for 2020–2021 will be excluded from the calculation of ADA and
student FTEs for FSP funding purposes and will be replaced with the ADA hold harmless projections. For
purposes of the hold harmless calculation, TEA will not consider each six weeks attendance period
independent of each other. TEA will replace attendance numbers for each eligible LEA’s 2020-2021 first
two six-week attendance periods with projected ADA and student FTE numbers calculating using a three-
year average trend of final numbers from the 2017-2018 through the 2019-2020 school years, unless this
projection is both 15% higher and 100 ADA higher than the 2020-2021 LPE projections. In the latter case,
2020-2021 LPE counts will be used.
TEA will make available an ADA hold harmless for the third six weeks attendance reporting period, on the
condition that LEAs allow on-campus instruction throughout the entire third six weeks period, as further
described below. The ADA hold harmless methodology will be identical to the methodology used for the
first two six weeks attendance reporting periods, except that the third six weeks will be examined
independent of the first two six weeks attendance reporting periods. Specifically, if an LEA’s refined ADA
counts during the third six-weeks attendance reporting period is less than the ADA hold harmless
projections (described in the prior question and available online), the third six-weeks attendance reporting
period for 2020–2021 will be excluded from the calculation of ADA and student FTEs for FSP funding
purposes and will be replaced with the ADA hold harmless projections. As noted above, this ADA hold
harmless methodology will only apply to attendance-based counts and will not apply to enrollment-based
FSP allotments such as the state compensatory education allotment and the dyslexia allotment.
Requests for Information
This financial report is designed to provide our citizens, taxpayers, customers, investors, and creditors with a general
overview of the District’s finances as well as demonstrate accountability for funds the District receives. Questions
concerning any of the information provided in this report or requests for additional information should be addressed
to the Director of Finance, Garland ISD, P.O. Box 469026, Garland, Texas, 75046-9026.
11
Basic Financial Statements
GARLAND INDEPENDENT SCHOOL DISTRICT Exhibit A-1
STATEMENT OF NET POSITION
JUNE 30, 2020
The accompanying notes are an integral part of the basic financial statements
Data Governmental
Codes Activities
ASSETS
1110 Cash and Cash Equivalents 402,029,930$
1220 Property Taxes - Receivable - Delinquent 8,238,718
1230 Allowance for Uncollectible Taxes (Credit) (558,854)
1240 Due From Other Governments 76,664,649
1290 Other Receivables, net 450,139
1300 Inventories 2,836,814
Capital Assets:
1510 Land 35,835,595
1510 Land Improvements, net 24,490,611
1520 Buildings and Building Improvements, net 548,845,855
1530 Furniture and Equipment, net 22,356,189
1580 Construction in Progress 206,206,775
1000 Total Assets 1,327,396,421
DEFERRED OUTFLOWS OF RESOURCES
1700 Deferred Charge on Refunding 7,376,020
1705 Deferred Outflow of Resources for Pension Activities 82,541,668
1706 Deferred Outflow of Resources for OPEB 32,429,069
Total Deferred Outflows of Resources 122,346,757
LIABILITIES
2110 Accounts Payable 14,461,946
2140 Interest Payable 8,549,818
2150 Payroll Deductions and Withholdings 3,263,476
2160 Accrued Wages Payable 50,778,307
2200 Accrued Expenses 340,672
2300 Unearned Revenues 1,274,777
Noncurrent Liabilities:
2501 Due Within One Year 44,730,585
2502 Due in More Than One Year 515,599,528
2531 Long-Term Capital Leases Payable 478,439
2540 Net Pension Liability 176,503,815
2545 Net OPEB Liability 204,393,433
2532 Vested Vacation Benefits Payable 1,029,666
2533 Loan Payable - Long Term 6,047,326
2591 Long-Term Claims Liability 1,415,450
2000 Total Liabilities 1,028,867,238
DEFERRED INFLOWS OF RESOURCES
2605 Deferred Inflow of Resources for Pension Activities 30,889,582
2606 Deferred Inflow of Resources for OPEB 88,867,197
119,756,779
NET POSITION
3200 Net Investment in Capital Assets 352,783,669
3850 Restricted for Debt Service 64,641,353
3860 Restricted for Grant Funds 1,648,765
3861 Restricted for Student Nutrition Services 7,588,492
3900 Unrestricted Net Position (125,543,118)
3000 Total Net Position 301,119,161$
12
GARLAND INDEPENDENT SCHOOL DISTRICT Exhibit B-1
STATEMENT OF ACTIVITIES
FOR THE FISCAL YEAR ENDED JUNE 30, 2020
The accompanying notes are an integral part of the basic financial statements
Net (Expense) Revenue and
Changes in Net Position
Data 1 3 4 6
Control Operating
Codes Charges for Grants and Governmental
Functions/Programs Expenses Services Contributions Activities
Primary Government:
Governmental Activities:
11 Instruction 358,104,960$ 710,330$ 67,815,861$ (289,578,769)$
12 Instructional Resources And Media Services 9,157,876 825,777 (8,332,099)
13 Curriculum And Staff Development 20,666,755 6,705,142 (13,961,613)
21 Instructional Leadership 10,023,316 2,155,762 (7,867,554)
23 School Leadership 36,632,987 3,392,590 (33,240,397)
31 Guidance, Counseling, And Evaluation Services 27,630,458 3,329,471 (24,300,987)
32 Social Work Services 1,247,338 461,216 (786,122)
33 Health Services 7,931,437 8,550,566 619,129
34 Student Transportation 19,181,850 193,096 (18,988,754)
35 Food Service 33,165,956 4,687,943 22,776,752 (5,701,261)
36 Extracurricular Activities 13,774,426 3,508,725 551,609 (9,714,092)
41 General Administration 17,326,424 1,165,971 (16,160,453)
51 Facilities Maintenance And Operations 43,253,497 121,935 363,273 (42,768,289)
52 Security And Monitoring Services 8,820,570 18,806 (8,801,764)
53 Data Processing Services 19,680,574 806,003 (18,874,571)
61 Community Services 3,552,435 668,719 (2,883,716)
72 Interest On Long-Term Debt 21,321,564 1,960,537 (19,361,027)
73 Bond Issuance Costs And Fees 291,142 (291,142)
81 Facilities Planning 166,576 (166,576)
93 Payments To Fiscal Agent Of Shared
Services Arrangement 134,796 134,796 -
95 Payments To Juvenile Justice Alternative
Education Programs 28,764 (28,764)
99 Intergovernmental Charges 928,362 (928,362)
TP TP Total Primary Government 653,022,063 9,028,933 121,875,947 (522,117,183)
Data
Control
Codes
General Revenues:
Taxes:
MT Property Taxes, Levied For General Purposes 199,764,239
DT Property Taxes, Levied For Debt Service 86,252,334
SF State Aid-Formula Grants (Unrestricted) 264,547,309
GC Grants And Contributions Not Restricted To Specific Programs 1,863,128
IE Investment Earnings 6,333,387
MI Miscellaneous 1,863,505
Special Items:
SI Special Items - Gain on Diposal of Assets 794,471
TR Total General Revenues 561,418,373
CN Change in Net Position 39,301,190
NB Net Position—Beginning 261,817,971
Prior Period Adjustment (Note 17)
NE Net Position—Ending 301,119,161$
Program Revenues
13
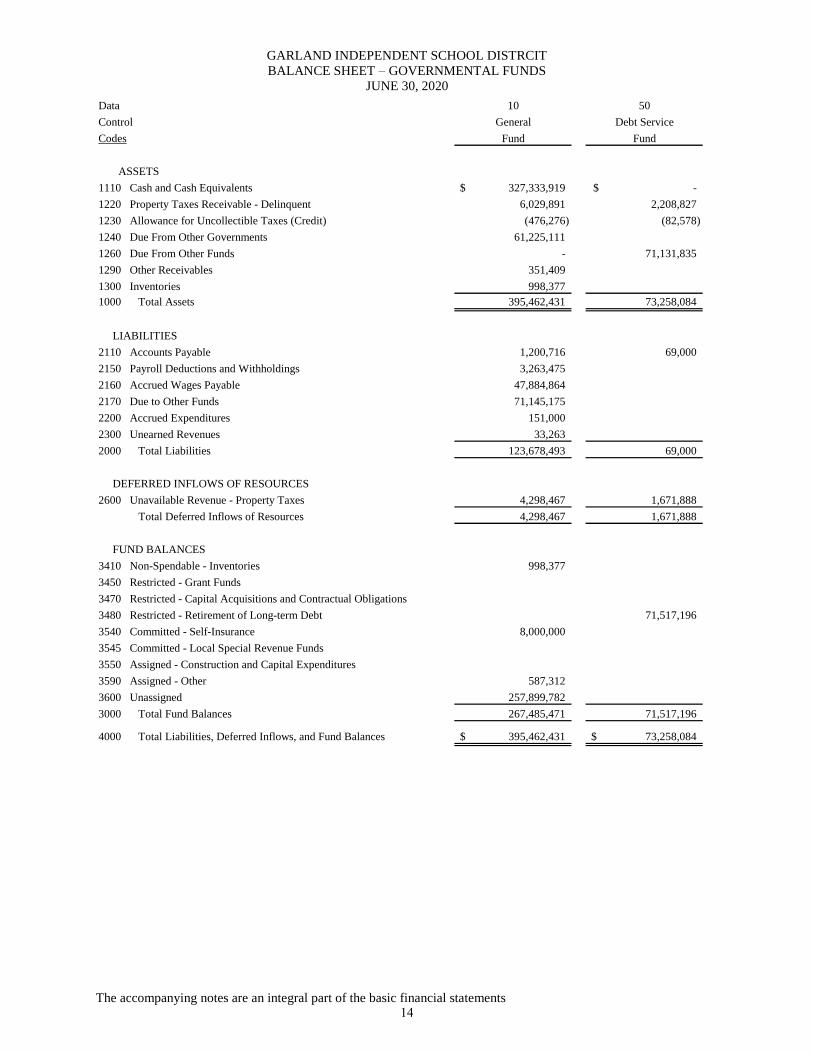
GARLAND INDEPENDENT SCHOOL DISTRCIT
BALANCE SHEET – GOVERNMENTAL FUNDS
JUNE 30, 2020
The accompanying notes are an integral part of the basic financial statements
Data 10 50
Control General Debt Service
Codes Fund Fund
ASSETS
1110 Cash and Cash Equivalents 327,333,919$ -$
1220 Property Taxes Receivable - Delinquent 6,029,891 2,208,827
1230 Allowance for Uncollectible Taxes (Credit) (476,276) (82,578)
1240 Due From Other Governments 61,225,111
1260 Due From Other Funds - 71,131,835
1290 Other Receivables 351,409
1300 Inventories 998,377
1000 Total Assets 395,462,431 73,258,084
LIABILITIES
2110 Accounts Payable 1,200,716 69,000
2150 Payroll Deductions and Withholdings 3,263,475
2160 Accrued Wages Payable 47,884,864
2170 Due to Other Funds 71,145,175
2200 Accrued Expenditures 151,000
2300 Unearned Revenues 33,263
2000 Total Liabilities 123,678,493 69,000
DEFERRED INFLOWS OF RESOURCES
2600 Unavailable Revenue - Property Taxes 4,298,467 1,671,888
Total Deferred Inflows of Resources 4,298,467 1,671,888
FUND BALANCES
3410 Non-Spendable - Inventories 998,377
3450 Restricted - Grant Funds
3470 Restricted - Capital Acquisitions and Contractual Obligations
3480 Restricted - Retirement of Long-term Debt 71,517,196
3540 Committed - Self-Insurance 8,000,000
3545 Committed - Local Special Revenue Funds
3550 Assigned - Construction and Capital Expenditures
3590 Assigned - Other 587,312
3600 Unassigned 257,899,782
3000 Total Fund Balances 267,485,471 71,517,196
4000 Total Liabilities, Deferred Inflows, and Fund Balances 395,462,431$ 73,258,084$
14
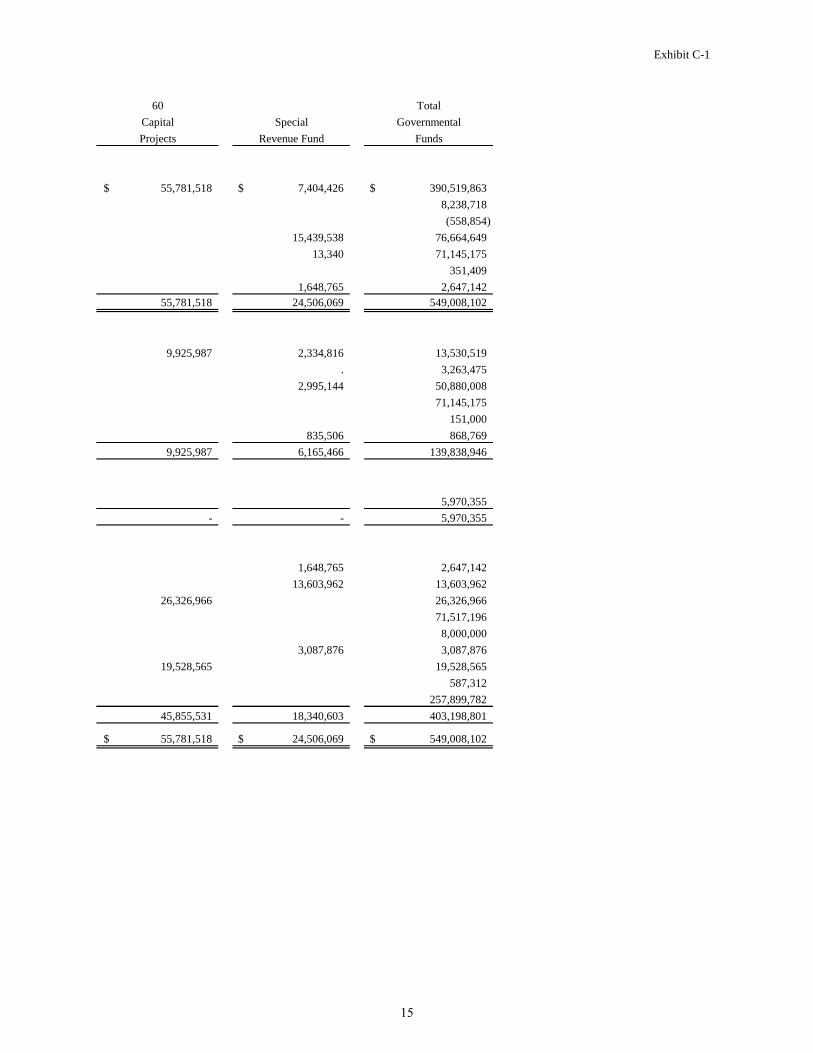
Exhibit C-1
60 Total
Capital Special Governmental
Projects Revenue Fund Funds
55,781,518$ 7,404,426$ 390,519,863$
8,238,718
(558,854)
15,439,538 76,664,649
13,340 71,145,175
351,409
1,648,765 2,647,142
55,781,518 24,506,069 549,008,102
9,925,987 2,334,816 13,530,519
. 3,263,475
2,995,144 50,880,008
71,145,175
151,000
835,506 868,769
9,925,987 6,165,466 139,838,946
5,970,355
- - 5,970,355
1,648,765 2,647,142
13,603,962 13,603,962
26,326,966 26,326,966
71,517,196
8,000,000
3,087,876 3,087,876
19,528,565 19,528,565
587,312
257,899,782
45,855,531 18,340,603 403,198,801
55,781,518$ 24,506,069$ 549,008,102$
15

This page intentionally left blank
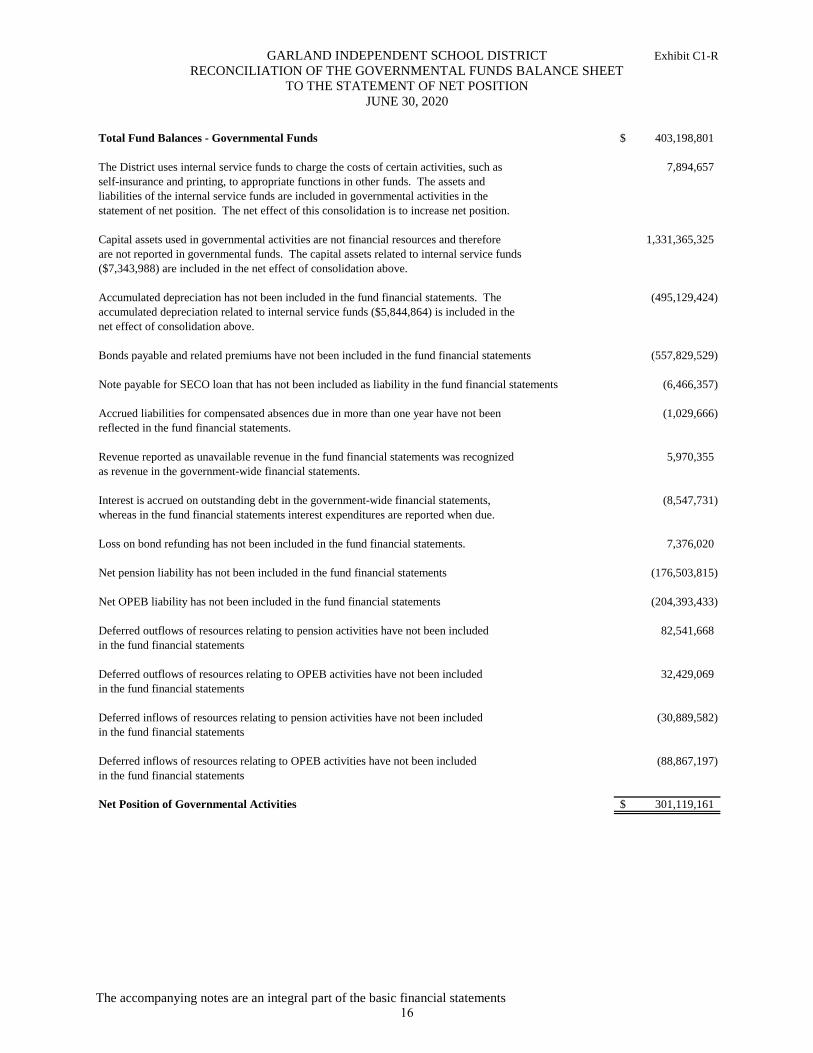
GARLAND INDEPENDENT SCHOOL DISTRICT Exhibit C1-R
RECONCILIATION OF THE GOVERNMENTAL FUNDS BALANCE SHEET
TO THE STATEMENT OF NET POSITION
JUNE 30, 2020
The accompanying notes are an integral part of the basic financial statements
Total Fund Balances - Governmental Funds 403,198,801$
The District uses internal service funds to charge the costs of certain activities, such as 7,894,657
self-insurance and printing, to appropriate functions in other funds. The assets and
liabilities of the internal service funds are included in governmental activities in the
statement of net position. The net effect of this consolidation is to increase net position.
Capital assets used in governmental activities are not financial resources and therefore 1,331,365,325
are not reported in governmental funds. The capital assets related to internal service funds
($7,343,988) are included in the net effect of consolidation above.
Accumulated depreciation has not been included in the fund financial statements. The (495,129,424)
accumulated depreciation related to internal service funds ($5,844,864) is included in the
net effect of consolidation above.
Bonds payable and related premiums have not been included in the fund financial statements (557,829,529)
Note payable for SECO loan that has not been included as liability in the fund financial statements (6,466,357)
Accrued liabilities for compensated absences due in more than one year have not been (1,029,666)
reflected in the fund financial statements.
Revenue reported as unavailable revenue in the fund financial statements was recognized 5,970,355
as revenue in the government-wide financial statements.
Interest is accrued on outstanding debt in the government-wide financial statements, (8,547,731)
whereas in the fund financial statements interest expenditures are reported when due.
Loss on bond refunding has not been included in the fund financial statements. 7,376,020
Net pension liability has not been included in the fund financial statements (176,503,815)
Net OPEB liability has not been included in the fund financial statements (204,393,433)
Deferred outflows of resources relating to pension activities have not been included 82,541,668
in the fund financial statements
Deferred outflows of resources relating to OPEB activities have not been included 32,429,069
in the fund financial statements
Deferred inflows of resources relating to pension activities have not been included (30,889,582)
in the fund financial statements
Deferred inflows of resources relating to OPEB activities have not been included (88,867,197)
in the fund financial statements
Net Position of Governmental Activities 301,119,161$
16
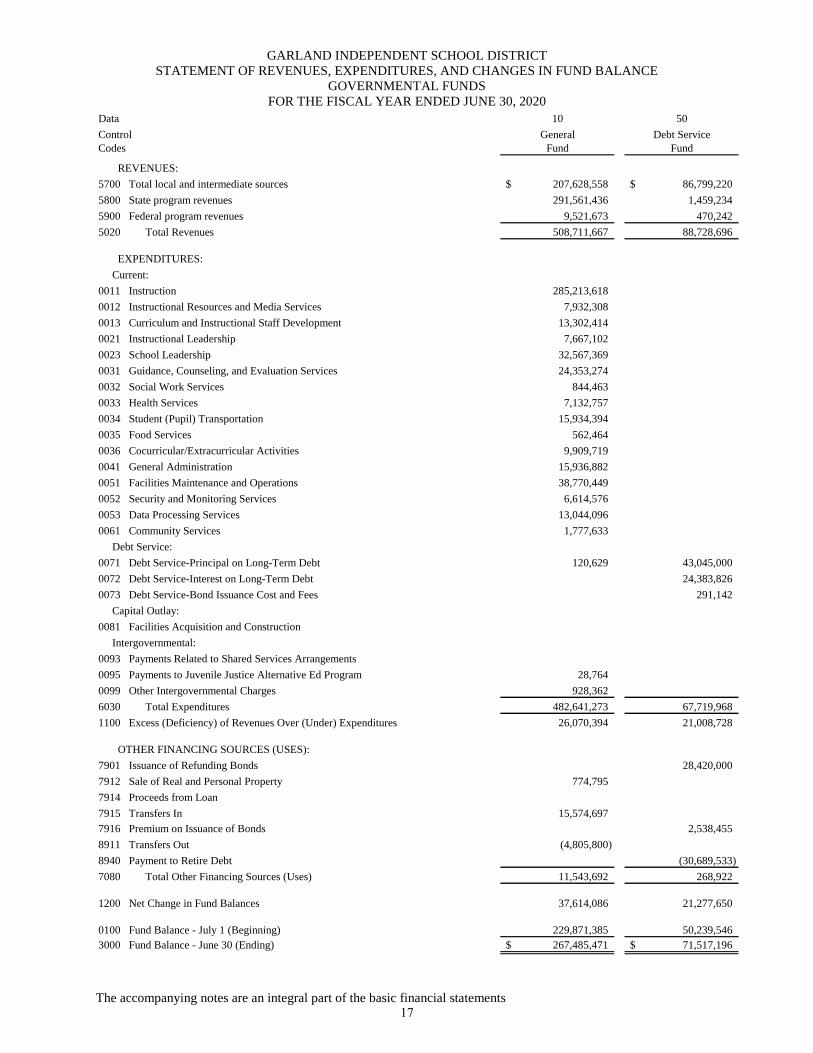
GARLAND INDEPENDENT SCHOOL DISTRICT
STATEMENT OF REVENUES, EXPENDITURES, AND CHANGES IN FUND BALANCE
GOVERNMENTAL FUNDS
FOR THE FISCAL YEAR ENDED JUNE 30, 2020
The accompanying notes are an integral part of the basic financial statements
Data 10 50
Control General Debt Service
Codes Fund Fund
REVENUES:
5700 Total local and intermediate sources 207,628,558$ 86,799,220$
5800 State program revenues 291,561,436 1,459,234
5900 Federal program revenues 9,521,673 470,242
5020 Total Revenues 508,711,667 88,728,696
EXPENDITURES:
Current:
0011 Instruction 285,213,618
0012 Instructional Resources and Media Services 7,932,308
0013 Curriculum and Instructional Staff Development 13,302,414
0021 Instructional Leadership 7,667,102
0023 School Leadership 32,567,369
0031 Guidance, Counseling, and Evaluation Services 24,353,274
0032 Social Work Services 844,463
0033 Health Services 7,132,757
0034 Student (Pupil) Transportation 15,934,394
0035 Food Services 562,464
0036 Cocurricular/Extracurricular Activities 9,909,719
0041 General Administration 15,936,882
0051 Facilities Maintenance and Operations 38,770,449
0052 Security and Monitoring Services 6,614,576
0053 Data Processing Services 13,044,096
0061 Community Services 1,777,633
Debt Service:
0071 Debt Service-Principal on Long-Term Debt 120,629 43,045,000
0072 Debt Service-Interest on Long-Term Debt 24,383,826
0073 Debt Service-Bond Issuance Cost and Fees 291,142
Capital Outlay:
0081 Facilities Acquisition and Construction
Intergovernmental:
0093 Payments Related to Shared Services Arrangements
0095 Payments to Juvenile Justice Alternative Ed Program 28,764
0099 Other Intergovernmental Charges 928,362
6030 Total Expenditures 482,641,273 67,719,968
1100 Excess (Deficiency) of Revenues Over (Under) Expenditures 26,070,394 21,008,728
OTHER FINANCING SOURCES (USES):
7901 Issuance of Refunding Bonds 28,420,000
7912 Sale of Real and Personal Property 774,795
7914 Proceeds from Loan
7915 Transfers In 15,574,697
7916 Premium on Issuance of Bonds 2,538,455
8911 Transfers Out (4,805,800)
8940 Payment to Retire Debt (30,689,533)
7080 Total Other Financing Sources (Uses) 11,543,692 268,922
1200 Net Change in Fund Balances 37,614,086 21,277,650
0100 Fund Balance - July 1 (Beginning) 229,871,385 50,239,546
3000 Fund Balance - June 30 (Ending) 267,485,471$ 71,517,196$
17
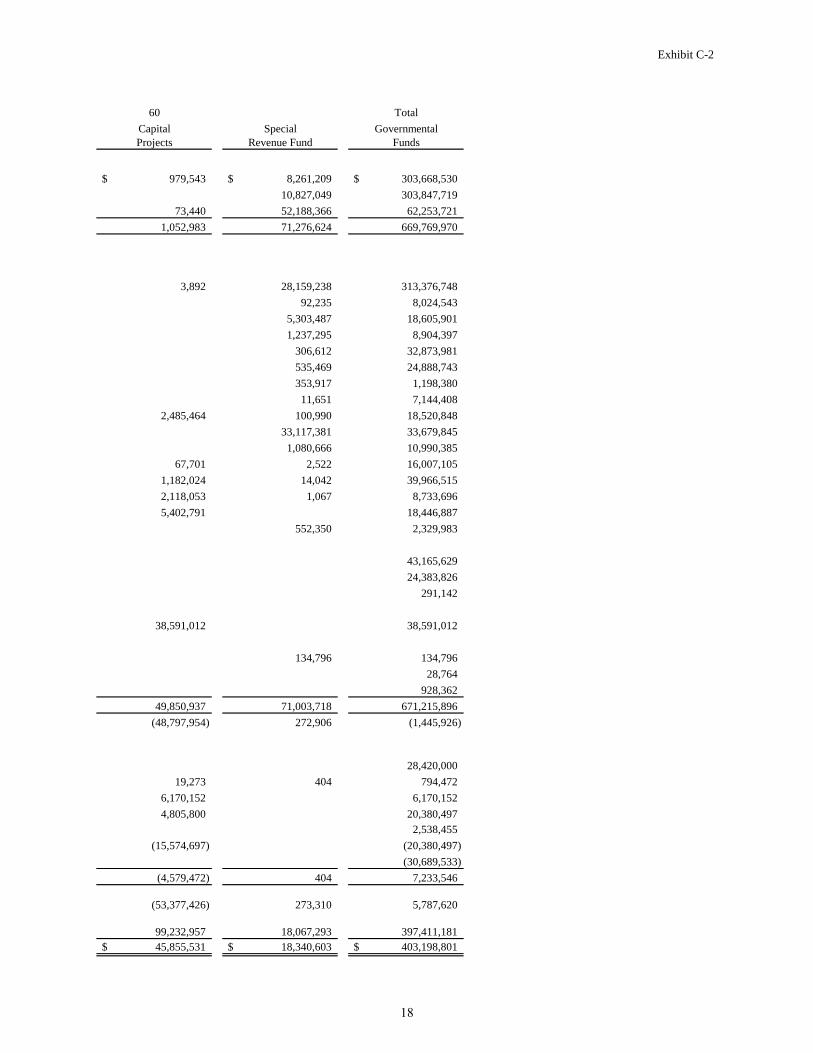
Exhibit C-2
60 Total
Capital Special Governmental
Projects Revenue Fund Funds
979,543$ 8,261,209$ 303,668,530$
10,827,049 303,847,719
73,440 52,188,366 62,253,721
1,052,983 71,276,624 669,769,970
3,892 28,159,238 313,376,748
92,235 8,024,543
5,303,487 18,605,901
1,237,295 8,904,397
306,612 32,873,981
535,469 24,888,743
353,917 1,198,380
11,651 7,144,408
2,485,464 100,990 18,520,848
33,117,381 33,679,845
1,080,666 10,990,385
67,701 2,522 16,007,105
1,182,024 14,042 39,966,515
2,118,053 1,067 8,733,696
5,402,791 18,446,887
552,350 2,329,983
43,165,629
24,383,826
291,142
38,591,012 38,591,012
134,796 134,796
28,764
928,362
49,850,937 71,003,718 671,215,896
(48,797,954) 272,906 (1,445,926)
28,420,000
19,273 404 794,472
6,170,152 6,170,152
4,805,800 20,380,497
2,538,455
(15,574,697) (20,380,497)
(30,689,533)
(4,579,472) 404 7,233,546
(53,377,426) 273,310 5,787,620
99,232,957 18,067,293 397,411,181
45,855,531$ 18,340,603$ 403,198,801$
18
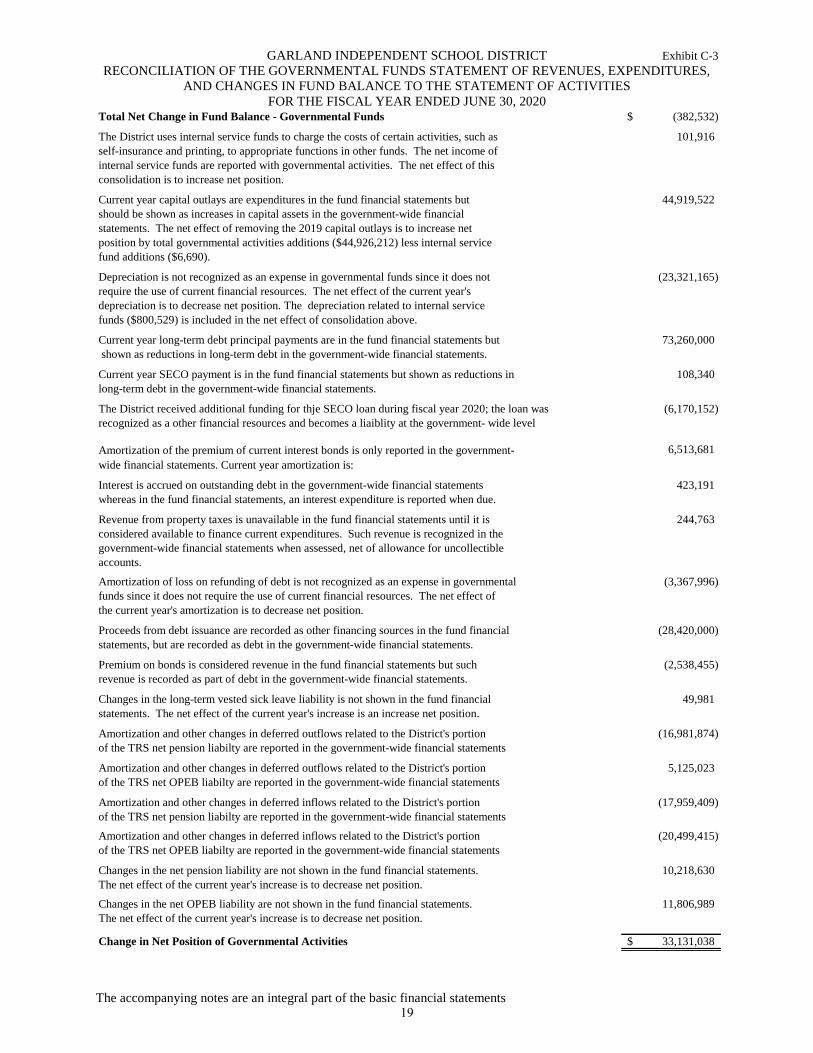
GARLAND INDEPENDENT SCHOOL DISTRICT Exhibit C-3
RECONCILIATION OF THE GOVERNMENTAL FUNDS STATEMENT OF REVENUES, EXPENDITURES,
AND CHANGES IN FUND BALANCE TO THE STATEMENT OF ACTIVITIES
FOR THE FISCAL YEAR ENDED JUNE 30, 2020
The accompanying notes are an integral part of the basic financial statements
Total Net Change in Fund Balance - Governmental Funds (382,532)$
The District uses internal service funds to charge the costs of certain activities, such as 101,916
self-insurance and printing, to appropriate functions in other funds. The net income of
internal service funds are reported with governmental activities. The net effect of this
consolidation is to increase net position.
Current year capital outlays are expenditures in the fund financial statements but 44,919,522
should be shown as increases in capital assets in the government-wide financial
statements. The net effect of removing the 2019 capital outlays is to increase net
position by total governmental activities additions ($44,926,212) less internal service
fund additions ($6,690).
Depreciation is not recognized as an expense in governmental funds since it does not (23,321,165)
require the use of current financial resources. The net effect of the current year's
depreciation is to decrease net position. The depreciation related to internal service
funds ($800,529) is included in the net effect of consolidation above.
Current year long-term debt principal payments are in the fund financial statements but 73,260,000
shown as reductions in long-term debt in the government-wide financial statements.
Current year SECO payment is in the fund financial statements but shown as reductions in 108,340
long-term debt in the government-wide financial statements.
The District received additional funding for thje SECO loan during fiscal year 2020; the loan was (6,170,152)
recognized as a other financial resources and becomes a liaiblity at the government- wide level
6,513,681
Interest is accrued on outstanding debt in the government-wide financial statements 423,191
whereas in the fund financial statements, an interest expenditure is reported when due.
Revenue from property taxes is unavailable in the fund financial statements until it is 244,763
considered available to finance current expenditures. Such revenue is recognized in the
government-wide financial statements when assessed, net of allowance for uncollectible
accounts.
Amortization of loss on refunding of debt is not recognized as an expense in governmental (3,367,996)
funds since it does not require the use of current financial resources. The net effect of
the current year's amortization is to decrease net position.
Proceeds from debt issuance are recorded as other financing sources in the fund financial (28,420,000)
statements, but are recorded as debt in the government-wide financial statements.
Premium on bonds is considered revenue in the fund financial statements but such (2,538,455)
revenue is recorded as part of debt in the government-wide financial statements.
Changes in the long-term vested sick leave liability is not shown in the fund financial 49,981
statements. The net effect of the current year's increase is an increase net position.
Amortization and other changes in deferred outflows related to the District's portion (16,981,874)
of the TRS net pension liabilty are reported in the government-wide financial statements
Amortization and other changes in deferred outflows related to the District's portion 5,125,023
of the TRS net OPEB liabilty are reported in the government-wide financial statements
Amortization and other changes in deferred inflows related to the District's portion (17,959,409)
of the TRS net pension liabilty are reported in the government-wide financial statements
Amortization and other changes in deferred inflows related to the District's portion (20,499,415)
of the TRS net OPEB liabilty are reported in the government-wide financial statements
Changes in the net pension liability are not shown in the fund financial statements. 10,218,630
The net effect of the current year's increase is to decrease net position.
Changes in the net OPEB liability are not shown in the fund financial statements. 11,806,989
The net effect of the current year's increase is to decrease net position.
Change in Net Position of Governmental Activities 33,131,038$
Amortization of the premium of current interest bonds is only reported in the government-
wide financial statements. Current year amortization is:
19
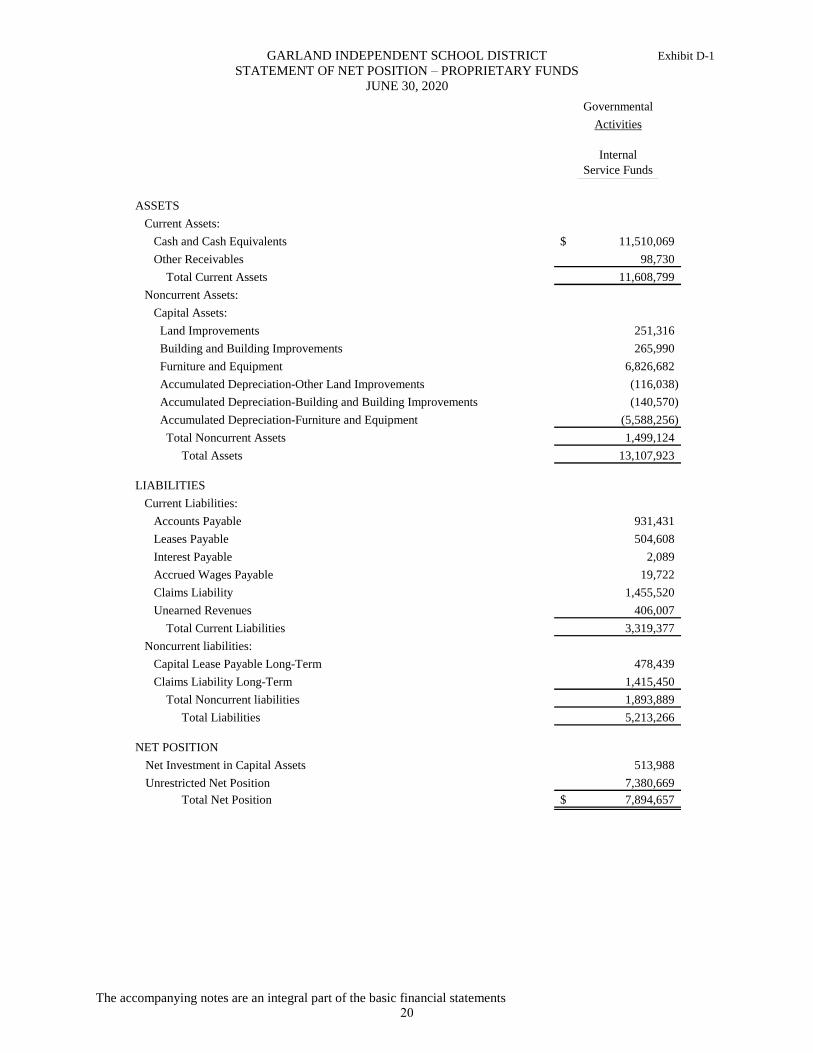
GARLAND INDEPENDENT SCHOOL DISTRICT Exhibit D-1
STATEMENT OF NET POSITION – PROPRIETARY FUNDS
JUNE 30, 2020
The accompanying notes are an integral part of the basic financial statements
Governmental
Activities
Internal
Service Funds_____________
ASSETS
Current Assets:
Cash and Cash Equivalents 11,510,069$
Other Receivables 98,730
Total Current Assets 11,608,799
Noncurrent Assets:
Capital Assets:
Land Improvements 251,316
Building and Building Improvements 265,990
Furniture and Equipment 6,826,682
Accumulated Depreciation-Other Land Improvements (116,038)
Accumulated Depreciation-Building and Building Improvements (140,570)
Accumulated Depreciation-Furniture and Equipment (5,588,256)
Total Noncurrent Assets 1,499,124
Total Assets 13,107,923
LIABILITIES
Current Liabilities:
Accounts Payable 931,431
Leases Payable 504,608
Interest Payable 2,089
Accrued Wages Payable 19,722
Claims Liability 1,455,520
Unearned Revenues 406,007
Total Current Liabilities 3,319,377
Noncurrent liabilities:
Capital Lease Payable Long-Term 478,439
Claims Liability Long-Term 1,415,450
Total Noncurrent liabilities 1,893,889
Total Liabilities 5,213,266
NET POSITION
Net Investment in Capital Assets 513,988
Unrestricted Net Position 7,380,669
Total Net Position 7,894,657$
20
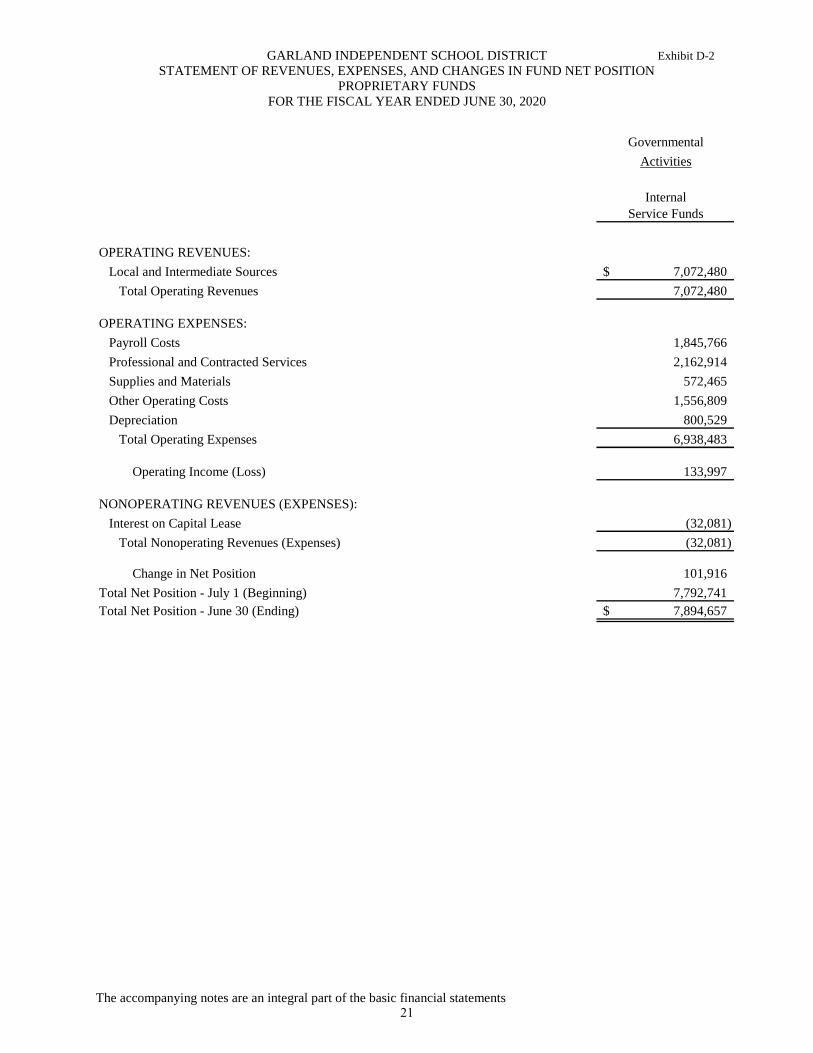
GARLAND INDEPENDENT SCHOOL DISTRICT Exhibit D-2
STATEMENT OF REVENUES, EXPENSES, AND CHANGES IN FUND NET POSITION
PROPRIETARY FUNDS
FOR THE FISCAL YEAR ENDED JUNE 30, 2020
The accompanying notes are an integral part of the basic financial statements
Governmental
Activities
Internal
Service Funds
OPERATING REVENUES:
Local and Intermediate Sources 7,072,480$
Total Operating Revenues 7,072,480
OPERATING EXPENSES:
Payroll Costs 1,845,766
Professional and Contracted Services 2,162,914
Supplies and Materials 572,465
Other Operating Costs 1,556,809
Depreciation 800,529
Total Operating Expenses 6,938,483
Operating Income (Loss) 133,997
NONOPERATING REVENUES (EXPENSES):
Interest on Capital Lease (32,081)
Total Nonoperating Revenues (Expenses) (32,081)
Change in Net Position 101,916
Total Net Position - July 1 (Beginning) 7,792,741
Total Net Position - June 30 (Ending) 7,894,657$
21
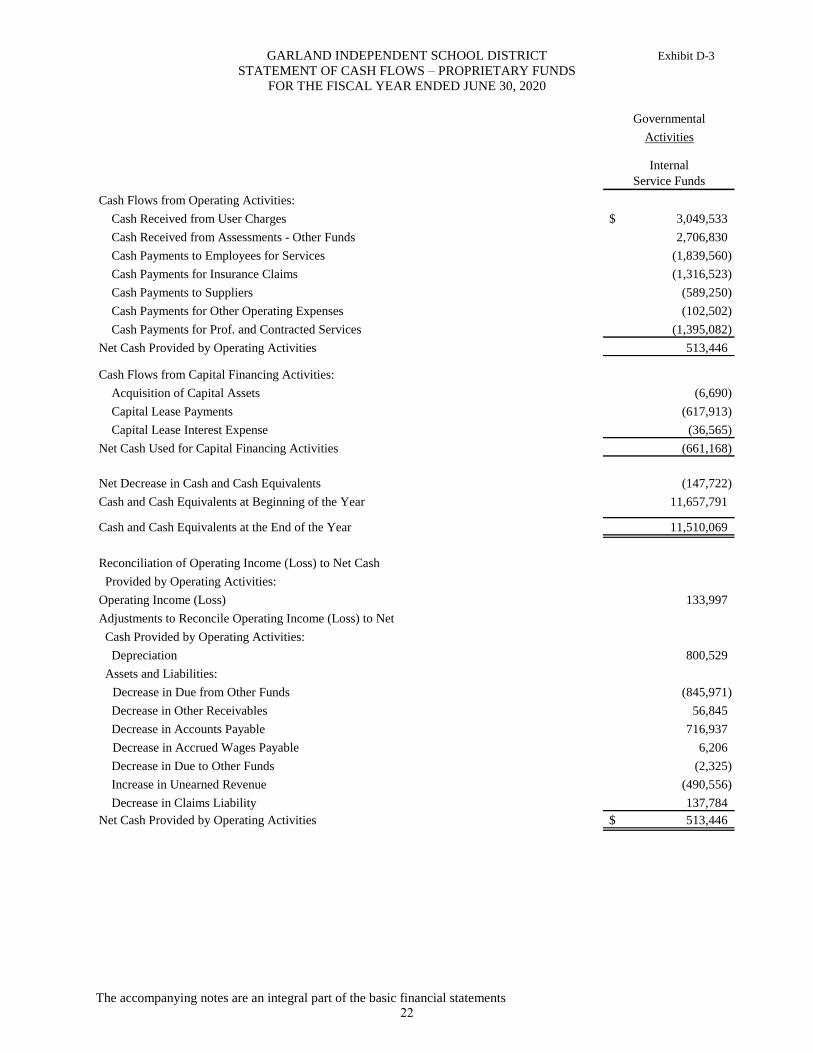
GARLAND INDEPENDENT SCHOOL DISTRICT Exhibit D-3
STATEMENT OF CASH FLOWS – PROPRIETARY FUNDS
FOR THE FISCAL YEAR ENDED JUNE 30, 2020
The accompanying notes are an integral part of the basic financial statements
Governmental
Activities
Internal
Service Funds
Cash Flows from Operating Activities:
Cash Received from User Charges 3,049,533$
Cash Received from Assessments - Other Funds 2,706,830
Cash Payments to Employees for Services (1,839,560)
Cash Payments for Insurance Claims (1,316,523)
Cash Payments to Suppliers (589,250)
Cash Payments for Other Operating Expenses (102,502)
Cash Payments for Prof. and Contracted Services (1,395,082)
Net Cash Provided by Operating Activities 513,446
Cash Flows from Capital Financing Activities:
Acquisition of Capital Assets (6,690)
Capital Lease Payments (617,913)
Capital Lease Interest Expense (36,565)
Net Cash Used for Capital Financing Activities (661,168)
Net Decrease in Cash and Cash Equivalents (147,722)
Cash and Cash Equivalents at Beginning of the Year 11,657,791
Cash and Cash Equivalents at the End of the Year 11,510,069
Reconciliation of Operating Income (Loss) to Net Cash
Provided by Operating Activities:
Operating Income (Loss) 133,997
Adjustments to Reconcile Operating Income (Loss) to Net
Cash Provided by Operating Activities:
Depreciation 800,529
Assets and Liabilities:
Decrease in Due from Other Funds (845,971)
Decrease in Other Receivables 56,845
Decrease in Accounts Payable 716,937
Decrease in Accrued Wages Payable 6,206
Decrease in Due to Other Funds (2,325)
Increase in Unearned Revenue (490,556)
Decrease in Claims Liability 137,784
Net Cash Provided by Operating Activities 513,446$
22
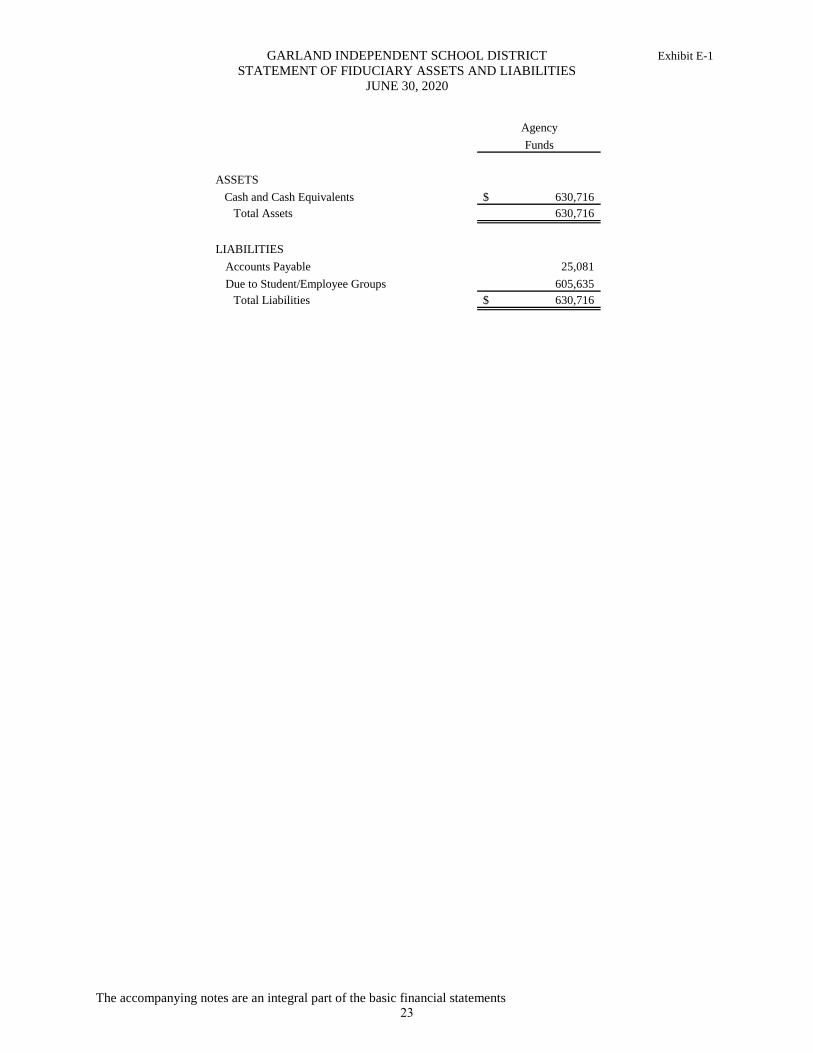
GARLAND INDEPENDENT SCHOOL DISTRICT Exhibit E-1
STATEMENT OF FIDUCIARY ASSETS AND LIABILITIES
JUNE 30, 2020
The accompanying notes are an integral part of the basic financial statements
Agency
Funds
ASSETS
Cash and Cash Equivalents 630,716$
Total Assets 630,716
LIABILITIES
Accounts Payable 25,081
Due to Student/Employee Groups 605,635
Total Liabilities 630,716$
23
GARLAND INDEPENDENT SCHOOL DISTRICT
NOTES TO THE BASIC FINANCIAL STATEMENTS
FISCAL YEAR ENDED JUNE 30, 2020
Note 1. Summary of Significant Accounting Policies
The accounting policies of the Garland Independent School District (the “District”) conform to generally
accepted accounting principles (“GAAP”) promulgated by the Governmental Accounting Standards Board
(“GASB”) and other authoritative sources identified in Statement on Auditing Standards No. 69 of the
American Institute of Certified Public Accountants, the rules prescribed by the Texas Education Agency
(“TEA”) Financial Accountability System Resource Guide (the “Resource Guide”), and the requirements of
contracts and grants of agencies from which it receives funds.
The following is a summary of the more significant policies:
Reporting Entity
In evaluating how to define the government for financial reporting purposes, the District’s management has
considered all potential component units. By applying the criteria set forth in generally accepted accounting
principles (“GAAP”), the District has determined that no other organizations require inclusion in its reporting
entity.
Governmental Fund Financial Statements
The District has adopted the provisions of GASB Statement No. 54, Fund Balance Reporting and
Government Fund Type Definitions. The objective of the statement is to enhance the usefulness of fund
balance information by providing clearer fund balance classifications that can be more consistently applied
and by clarifying the existing government fund type definitions. The statement establishes fund balance
classifications that comprise a hierarchy based primarily on the extent to which a government is bound to
observe constraints imposed upon the use of the resources reported in governmental funds. Fund balance
classifications, under GASB 54 are Nonspendable, Restricted, Committed, Assigned, and Unassigned. These
classifications not only reflect the nature of funds but also provide clarity to the level of restriction placed
upon fund balance. Fund balance can have different levels of constraint, such as external versus internal
compliance requirements. Unassigned fund balance is a residual classification within the General Fund. The
General Fund should be the only fund that reports a positive unassigned balance. In all other funds,
unassigned is limited to negative residual fund balance.
In accordance with GASB 54, the District classifies governmental fund balances as follows:
Nonspendable – includes amounts that cannot be spent because they are either not in spendable form, or, for
legal or contractual reasons, must be kept intact. This classification includes inventories, prepaid items, and
long-term receivables.
Restricted – includes fund balance amounts constrained for specific purposes externally imposed by
providers (such as creditors) or amounts restricted due to constitutional provisions or enabling legislation.
This classification includes the child nutrition program, retirement of long term debt, construction programs,
and other federal and state grants.
Committed – includes fund balance amounts constrained for specific purposes internally imposed by the
District through formal action of the highest level of decision making authority. Committed fund balance is
reported pursuant to a resolution passed by the District’s Board of Trustees. This classification includes
campus activity funds and local special revenue funds. In addition, the District committed $8 million for self-
insurance for underground fuel storage tanks and Metropolitan Area Network/Wide Area Network
(MAN/WAN) within the City of Garland. See Note 10 for additional information on the self-insurance.
Assigned – includes fund balance amounts self-imposed by the District to be used for a particular purpose.
Per Board of Trustee Policy CE (Local), fund balance can be assigned by the District’s Board, the
Superintendent, or the Chief Financial Officer. The District has assigned funds for local construction and
capital expenditures.
24
GARLAND INDEPENDENT SCHOOL DISTRICT
NOTES TO THE BASIC FINANCIAL STATEMENTS
FISCAL YEAR ENDED JUNE 30, 2020
Note 1. Summary of Significant Accounting Policies – continued
Unassigned – includes residual positive fund balance within the General Fund which has not been classified
within the other above mentioned categories. Unassigned fund balance may also include negative balances
for any governmental fund if expenditures exceed amounts restricted, committed, or assigned for those
specific purposes. When both restricted and unrestricted fund balances are available for use, it is the District’s
policy to use restricted fund balance first, then unrestricted fund balance. Furthermore, committed fund
balances are reduced first, followed by assigned amounts and the unassigned amounts when expenditures are
incurred for purposes for which amounts in any of those unrestricted fund balance classifications can be used.
Government-Wide and Fund Financial Statements
The Statement of Net Position and the Statement of Activities are government-wide financial statements.
They report information on all of the District’s non-fiduciary activities with most of the interfund activities
removed except for interfund services provided and used. Governmental activities include programs
supported primarily by taxes, State foundation funds, grants, and other intergovernmental revenues.
Business-type activities, which are reported separately, rely significantly on fees and charges for support.
The Statement of Activities demonstrates the degree to which the direct expenses of a given function are
offset by program revenues. Direct expenses are those that are clearly identifiable with a specific function.
All capital asset depreciation is reported as a direct expense of the functional program that benefits from the
use of the capital assets. Program revenues include: 1) charges for services and tuition charged by a given
function and 2) grants and contributions that are restricted to meeting operational requirements of a particular
function. Taxes, state aid, grants and contributions not restricted to specific programs are properly excluded
from program revenues and reported instead as general revenues.
The fund financial statements provide reports on the financial condition and results of operations for three
fund categories – governmental, proprietary, and fiduciary. Since the resources in the fiduciary funds cannot
be used for District operations, they are not included in the government-wide statements. The emphasis on
fund financial statements is on major governmental funds, each displayed in a separate column. All
remaining governmental funds are aggregated and reported as nonmajor funds.
Proprietary funds distinguish operating revenues and expenses from non-operating items. Operating revenues
and expenses result from providing services and producing and delivering goods in connection with a
proprietary fund’s principal ongoing operations. All other revenues and expenses are non-operating.
Measurement Focus, Basis of Accounting, and Financial Statement Presentation
The government-wide and proprietary fund financial statements use the economic resources measurement
focus and the accrual basis of accounting. Revenues are recorded when earned and expenses are recorded
when a liability is incurred, regardless of the timing of the related cash flows. Property taxes are recognized
as revenues in the year for which they are levied.
Governmental fund financial statements use the current financial resources measurement focus and the
modified accrual basis of accounting. Revenues are recognized as soon as they are both measurable and
available. Revenues are considered to be available when they are collectible within the current period or
soon enough thereafter to pay liabilities of the current period. For this purpose, the District considers
revenues to be available if they are collected within 60 days of the end of the current fiscal period.
Expenditures generally are recorded when a liability is incurred. However, debt service expenditures as well
as expenditures related to compensated absences and claims and judgments, are recorded when payment is
due.
25

GARLAND INDEPENDENT SCHOOL DISTRICT
NOTES TO THE BASIC FINANCIAL STATEMENTS
FISCAL YEAR ENDED JUNE 30, 2020
Note 1. Summary of Significant Accounting Policies – continued
Revenues from local sources consist primarily of property taxes. Property tax revenues and revenues
received from the State are recognized under the susceptible to accrual concept. Miscellaneous revenues are
recorded as revenue when received in cash because they are generally not measurable until actually received.
Investment earnings are recorded as earned, since they are both measurable and available.
Proprietary funds distinguish operating revenues from non-operating revenues. Operating revenues and
expenses generally result from providing services and producing and delivering goods in connection with a
proprietary fund’s principal ongoing operations. The principal operating revenues of the District’s internal
service funds are charges to customers for sales and services. Operating expenses for internal service funds
include the cost of sales and services, administrative expenses, and depreciation on capital assets. All
revenues and expenses not meeting this definition are reported as non-operating revenues and expenses.
For Fiduciary Fund types, the District has only Agency Funds. The Agency Funds have no measurement
focus.
When both restricted and unrestricted resources are available for use, it is the government’s policy to use
restricted resources first, then unrestricted resources as they are needed.
Fund Accounting
The District reports the following major governmental funds:
The General Fund accounts for financial resources related to the general operations of the District, including
financial resources not required to be accounted for in some other fund.
The Debt Service Fund is utilized to account for the accumulation of resources for, and the payment of,
general long-term debt principal, interest, and related costs arising from general obligation bonds.
The Capital Projects Fund accounts for proceeds from sales of bonds and other revenues to be used for
authorized construction and acquisition of capital facilities.
The Special Revenue Fund is used to account, on a project basis, for funds granted from the Federal
Government and the State of Texas, required by the State to be reported as a special revenue fund, and granted
from local sources (including revenues raised by campuses and grants from local not-for-profits).
Proprietary Funds
Internal Service Funds are used to account for services provided by one department to other departments of
the District on a cost-reimbursement basis. For the District, these funds are used to provide workers’
compensation insurance, reproduction, print services, motor pool, and Curtis Culwell Center services.
Accrued liabilities include provisions for claims reported and claims incurred but not reported for workers’
compensation insurance. The provision for reported claims is determined by estimating the amount that will
ultimately be paid to each claimant. The provision for claims incurred but not yet reported is estimated based
on the District’s experience since the inception of the programs.
Fiduciary Funds
Agency Funds are custodial in nature and account for activities of student and employee groups. These funds
have no equity. Assets are equal to liabilities and do not include revenues and expenditures for general
operations of the District. This accounting reflects the District’s agency relationship with the organizations.
Fiduciary funds use the accrual basis of accounting to recognize assets and liabilities.
26
GARLAND INDEPENDENT SCHOOL DISTRICT
NOTES TO THE BASIC FINANCIAL STATEMENTS
FISCAL YEAR ENDED JUNE 30, 2020
Note 1. Summary of Significant Accounting Policies – continued
Official Budget
The District is required by state law to submit annual budgets for the General Fund, Debt Service Fund, and
Student Nutrition Services (included within the Special Revenue Fund) to the Board of Trustees for adoption.
The remaining Special Revenue Funds and Capital Projects Fund utilize project–length budgets, established
by management. These budgets do not correspond to the District’s fiscal year and are not adopted by the
Board of Trustees. Each budget is presented on the modified accrual basis of accounting, which is consistent
with generally accepted accounting principles.
The following procedures are utilized in establishing the budgetary data reflected in the financial statements:
1. Prior to June 20 of the preceding fiscal year, the District prepares a budget for the subsequent fiscal year
beginning July 1. The operating budget includes proposed expenditures and the means of financing them.
2. A meeting of the Board of Trustees is then called for the purpose of adopting the proposed budget after
ten days public notice of the meeting has been given.
3. Prior to July 1, the budget is legally enacted through passage of a resolution by the Board of Trustees.
Once a budget is approved, it can be amended at the function and fund level only by approval of a majority
of the members of the Board of Trustees. Amendments are presented to the Board at their regular meetings.
Each amendment must have Board approval. Such amendments are made before the fact, are reflected in the
official minutes of the Board, and are not made after fiscal year-end as dictated by law.
Each budget is prepared and controlled by management at the revenue and expenditure function/object level.
Budgeted amounts are as amended by the Board of Trustees. All budget appropriations lapse at year-end.
Cash and Cash Equivalents
For the purposes of the statement of cash flows, investments are considered to be cash equivalents if they are
highly liquid with maturity within three months or less.
Investments
Investments consist of balances in privately managed public funds investment pools and investments in
United States (U.S.) securities and U.S. Agency securities. The District reports all investments at fair value,
except for investment pools. The District’s investment pools are valued and reported at amortized cost,
which approximates fair value.
The District categorizes fair value measurements of its investments based on the hierarchy established by
generally accepted accounting principles. The fair value hierarchy, which has three levels, is based on the
valuation inputs used to measure an asset’s fair value: Level 1 inputs are quoted prices in active markets
for identical assets; Level 2 inputs are significant other observable inputs; Level 3 inputs are significant
unobservable inputs. The District’s local government investment pools are recorded at amortized costs as
permitted by GASB Statement No. 79, Certain Investment Pools and Pool Participants.
Property Taxes
Property taxes are levied by October 1 on the assessed value listed as of January 1 for all real and business
personal property located in the District in conformity with Subtitle E, Texas Property Tax Code. Taxes
are due upon receipt of the tax bill and are delinquent if not paid before February 1 of the year following
the year in which imposed. On January 31 of each year, a tax lien attaches to property to secure the payment
of all taxes, penalties, and interest ultimately imposed. Property tax revenues are considered available
when due or past due and receivable within the current period.
27
GARLAND INDEPENDENT SCHOOL DISTRICT
NOTES TO THE BASIC FINANCIAL STATEMENTS
FISCAL YEAR ENDED JUNE 30, 2020
Note 1. Summary of Significant Accounting Policies – continued
Property Taxes (continued)
The tax rates assessed for the fiscal year ended June 30, 2020 to finance General Fund operations and the
payment of principal and interest on general obligation long-term debt were $0.97 and $0.42 per $100
valuation, respectively, for a total of $1.39 per $100 valuation.
Delinquent taxes are prorated between maintenance and debt service based on rates adopted for the year
of the levy. Allowances for uncollectible tax receivables within the General and Debt Service Funds are
based on historical experience in collecting property taxes. Uncollectible personal property taxes are
periodically reviewed and written off, but the District is prohibited from writing off real property taxes
without specific statutory authority from the Texas Legislature. At June 30, 2020, taxes receivable net of
estimated uncollectible taxes, aggregated $5,553,615 and $2,126,249 for the General Fund and Debt
Service Fund, respectively.
Inventories and Prepaid Items
Supplies and materials are recorded as expenditures when requisitioned. Inventories of supplies on the
balance sheet are recorded at cost using the average cost method. Inventories of food commodities are
recorded at market values supplied by the Texas Department of Agriculture and are recorded as inventory
when received. Inventory items are recorded as expenditures when they are consumed. Supplies are used
for almost all functions of activity while food commodities are used only in the Student Nutrition Services
Fund. In the governmental funds, inventories are reported as non-spendable fund balance.
Prepaid items are reported using the purchase method instead of the consumption method. Beginning with
fiscal year 2017, the District began using the purchase method where payments for prepaid items are fully
recognized as expenditures in the year of payment. The District believes the purchase method is preferable
and consistent with the governmental fund concept of reporting only expendable financial resources.
Deferred outflows/inflows of resources
In addition to assets, the Statement of Net Position will report a separate section for deferred outflows of
resources. This separate financial statement element, deferred outflows of resources, represents a
consumption of net position that applies to a future period(s) and so will not be recognized as an outflow
of resources (expenditures) until then. The District has three items that qualify for reporting in this
category. They are deferred loss on refunding, TRS pension costs, and TRS OPEB costs, which are reported
in the Government-wide Statement of Net Position.
In addition to assets and liabilities, the government-wide Statement of Net Position and governmental fund
Balance Sheet report separate sections for deferred outflows and deferred inflows of resources. Deferred
outflows of resources represent a consumption of net position/fund balance that applies to a future period(s)
and so will not be recognized as an outflow of resources (expense/expenditure) until then. Deferred inflows
of resources represent the acquisition of net position/fund balance that applies to a future period(s) and so
will not be recognized as an inflow of resources (revenue) until that time. In addition to deferred losses on
debt refunding, which are reported as deferred outflows of resources, the District reports certain deferred
inflows and outflows related to pensions and other post-employment benefits on the government-wide
Statement of Net Position. At the governmental fund level, earned but unavailable tax revenue is reported
as a deferred inflow of resources.
Pensions
The fiduciary net position of the Teacher Retirement System of Texas (TRS) has been determined using
the flow of economic resources measurement focus and full accrual basis of accounting. This includes for
purposes of measuring the net pension liability, deferred outflows of resources and deferred inflows of
resources related to pensions, pension expense, and information about assets, liabilities and additions
to/deductions from TRS’s fiduciary net position.
28
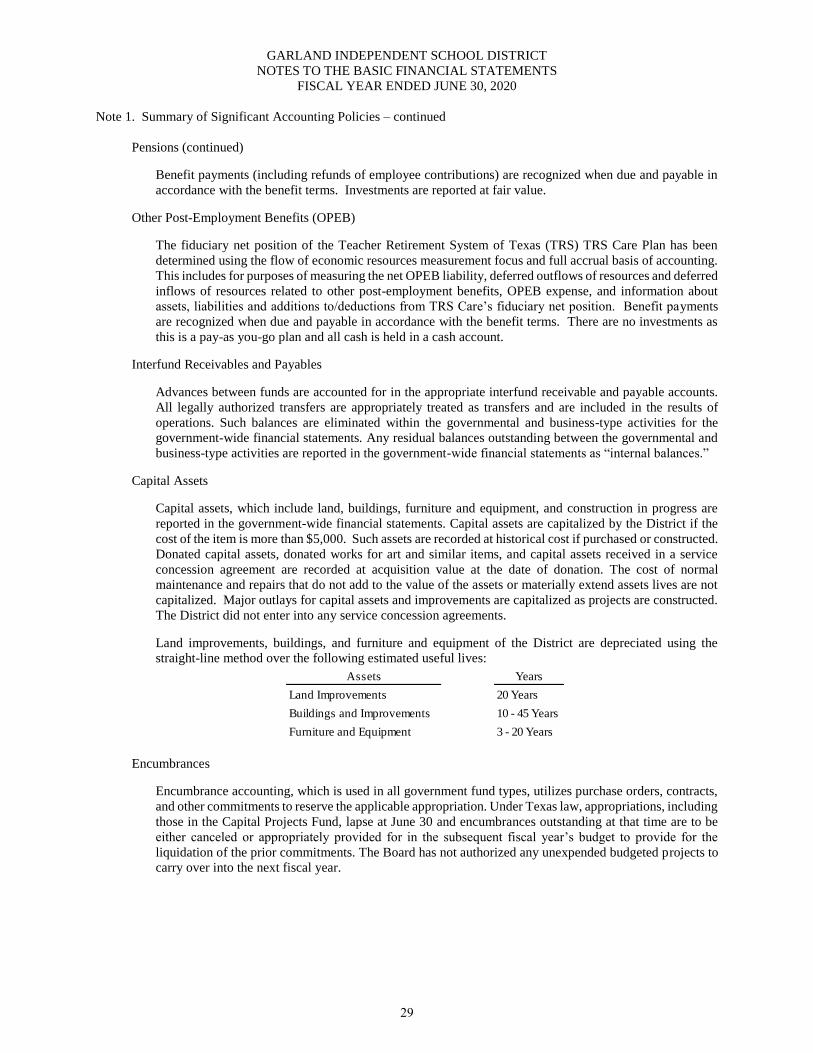
GARLAND INDEPENDENT SCHOOL DISTRICT
NOTES TO THE BASIC FINANCIAL STATEMENTS
FISCAL YEAR ENDED JUNE 30, 2020
Note 1. Summary of Significant Accounting Policies – continued
Pensions (continued)
Benefit payments (including refunds of employee contributions) are recognized when due and payable in
accordance with the benefit terms. Investments are reported at fair value.
Other Post-Employment Benefits (OPEB)
The fiduciary net position of the Teacher Retirement System of Texas (TRS) TRS Care Plan has been
determined using the flow of economic resources measurement focus and full accrual basis of accounting.
This includes for purposes of measuring the net OPEB liability, deferred outflows of resources and deferred
inflows of resources related to other post-employment benefits, OPEB expense, and information about
assets, liabilities and additions to/deductions from TRS Care’s fiduciary net position. Benefit payments
are recognized when due and payable in accordance with the benefit terms. There are no investments as
this is a pay-as you-go plan and all cash is held in a cash account.
Interfund Receivables and Payables
Advances between funds are accounted for in the appropriate interfund receivable and payable accounts.
All legally authorized transfers are appropriately treated as transfers and are included in the results of
operations. Such balances are eliminated within the governmental and business-type activities for the
government-wide financial statements. Any residual balances outstanding between the governmental and
business-type activities are reported in the government-wide financial statements as “internal balances.”
Capital Assets
Capital assets, which include land, buildings, furniture and equipment, and construction in progress are
reported in the government-wide financial statements. Capital assets are capitalized by the District if the
cost of the item is more than $5,000. Such assets are recorded at historical cost if purchased or constructed.
Donated capital assets, donated works for art and similar items, and capital assets received in a service
concession agreement are recorded at acquisition value at the date of donation. The cost of normal
maintenance and repairs that do not add to the value of the assets or materially extend assets lives are not
capitalized. Major outlays for capital assets and improvements are capitalized as projects are constructed.
The District did not enter into any service concession agreements.
Land improvements, buildings, and furniture and equipment of the District are depreciated using the
straight-line method over the following estimated useful lives:
Assets Years
Land Improvements 20 Years
Buildings and Improvements 10 - 45 Years
Furniture and Equipment 3 - 20 Years
Encumbrances
Encumbrance accounting, which is used in all government fund types, utilizes purchase orders, contracts,
and other commitments to reserve the applicable appropriation. Under Texas law, appropriations, including
those in the Capital Projects Fund, lapse at June 30 and encumbrances outstanding at that time are to be
either canceled or appropriately provided for in the subsequent fiscal year’s budget to provide for the
liquidation of the prior commitments. The Board has not authorized any unexpended budgeted projects to
carry over into the next fiscal year.
29
GARLAND INDEPENDENT SCHOOL DISTRICT
NOTES TO THE BASIC FINANCIAL STATEMENTS
FISCAL YEAR ENDED JUNE 30, 2020
Note 1. Summary of Significant Accounting Policies – continued
Data Control Codes
These codes refer to the account code structure prescribed by the TEA in the Resource Guide.
Estimates
The preparation of financial statements in conformity with generally accepted accounting principles
requires management to make estimates and assumptions that affect certain reported amounts and
disclosures. Accordingly, actual results could differ from those estimates. The amount of State foundation
revenue a school district earns for a year can and does vary until the time at which final values for each of
the factors in the formula become available. Availability can be as late as midway into the next fiscal year.
It is possible that the foundation revenue estimate as of June 30, 2020 will change.
Implementation of New Standards
The following GASB pronouncements have been issued but not yet implemented by the District:
GASB Statement No. 97, Certain Component Unit Criteria, and Accounting and Financial Reporting for
Internal Revenue Code Section 457 Deferred Compensation Plans—an amendment of GASB Statements
No. 14 and No. 84, and a supersession of GASB Statement No. 32. It was issued in June 2020, but the
requirements in (1) paragraph 4 of this Statement as it applies to defined contribution pension plans, defined
contribution OPEB plans, and other employee benefit plans and (2) paragraph 5 of this Statement are effective
immediately. The requirements in paragraphs 6–9 of this Statement are effective for fiscal years beginning after
June 15, 2021. Implementation of this Statement is planned for fiscal year 2022.
GASB Statement No. 96, Subscription-Based Information Technology Arrangements. This statement was
issued in May 2020 and provides guidance on the accounting and financial reporting for subscription-based
information technology arrangements (SBITAs) for government end users (governments). This Statement (1)
defines a SBITA; (2) establishes that a SBITA results in a right-to-use subscription asset—an intangible asset—
and a corresponding subscription liability; (3) provides the capitalization criteria for outlays other than
subscription payments, including implementation costs of a SBITA; and (4) requires note disclosures regarding
a SBITA. To the extent relevant, the standards for SBITAs are based on the standards established in Statement
No. 87, Leases, as amended. This statement is effective for fiscal years beginning after June 15, 2022, and all
reporting periods thereafter. Implementation of this Statement is planned for fiscal year 2023.
GASB Statement No. 95, Postponement of the Effective Dates of Certain Authoritative Guidance. This
Statements was issued was in March 2020. The primary objective of this Statement is to provide temporary
relief to governments and other stakeholders in light of the COVID-19 pandemic. That objective is
accomplished by postponing the effective dates of certain provisions in Statements and Implementation Guides
that first became effective or are scheduled to become effective for periods beginning after June 15, 2018, and
later. The requirements of this Statement are effective for fiscal years beginning after June 15, 2022, and all
reporting periods thereafter. The requirements of this Statement are effective immediately.
Statement No. 83, Certain Asset Retirement Obligations
Statement No. 84, Fiduciary Activities
Statement No. 88, Certain Disclosures Related to Debt, including Direct Borrowings and Direct
Placements
Statement No. 89, Accounting for Interest Cost Incurred before the End of a Construction Period
Statement No. 90, Majority Equity Interests
Statement No. 91, Conduit Debt Obligations
Statement No. 92, Omnibus 2020
Statement No. 93, Replacement of Interbank Offered Rates
30
GARLAND INDEPENDENT SCHOOL DISTRICT
NOTES TO THE BASIC FINANCIAL STATEMENTS
FISCAL YEAR ENDED JUNE 30, 2020
Note 1. Summary of Significant Accounting Policies – continued
Implementation Guide No. 2017-3, Accounting and Financial Reporting for Postemployment
Benefits Other Than Pensions (and Certain Issues Related to OPEB Plan Reporting)
Implementation Guide No. 2018-1, Implementation Guidance Update—2018
Implementation Guide No. 2019-1, Implementation Guidance Update—2019
Implementation Guide No. 2019-2, Fiduciary Activities.
The effective dates of the following pronouncements are postponed by 18 months:
Statement No. 87, Leases
Implementation Guide No. 2019-3, Leases.
The District plans on implementing GASB No. 84 Fiduciary Activities in fiscal year 2021 and GASB No. 87
Leases in fiscal year 2022.
Fiscal Year Change
The District’s Board of Trustees, in accordance with Texas Education Code, Section 44.0011, approved
changing its fiscal year end from August 31 to June 30 effective with start of new fiscal year July 1, 2019. The
year a school changes its fiscal year-end to June 30 is a shorter fiscal cycle of ten months (9/1-6/30).
Note 2. Cash and Investments
The District’s funds are required to be deposited under the terms of a depository contract pursuant to the School
Depository Act. The district has a letter of credit with the Federal Home Loan Bank of Cincinnati as a base
line for the districts’ funds. Additionally, for amounts needed in excess of the letter of credit. Amounts are
pledged from the Federal Reserve Bank of New York. The pledge of approved securities is waived only to the
extent of the dollar amount of Federal Deposit Insurance Corporation (FDIC) insurance.
At June 30, 2020, the carrying amount of the District’s deposits was $15,312,444 and the bank balance was
$16,999,816. In addition, the District had various petty cash balances held at different locations amounting to
$31,133.
The District’s entire bank balance on June 30, 2020 was covered by federal depository insurance or by collateral
held by the District’s agent in the District’s name. During the period, the District’s deposits were fully secured
with FDIC coverage and pledged collateral.
The District’s investment policy contains the following objectives:
A. Assure the safety of District funds.
B. Maintain sufficient liquidity to provide adequate and timely working funds.
C. Match the maturity of investment instruments to the daily cash flow requirements.
D. Diversify investments as to maturity, instrument, and financial institution, where permitted.
As a means of limiting exposure to fair value losses that could occur from rising interest rates, the District
limits the maturities of investments to one year from the time of purchase in all funds except capital projects
and debt service.
The District recognizes that investment risks can result from market price changes. Portfolio diversification is
employed as a way to control credit risk. Investment officers are expected to display prudence in the selection
of securities as a way to minimize risk. No individual investment transaction shall be undertaken which
jeopardizes the total capital position of the overall portfolio.
31
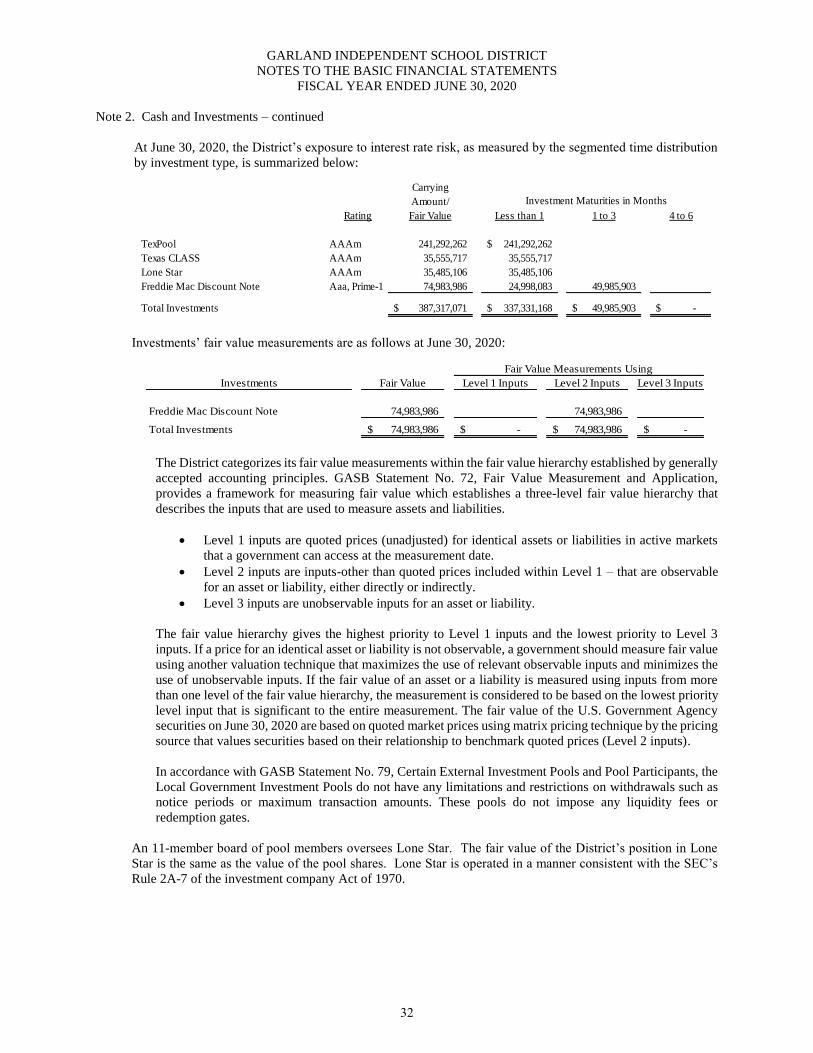
GARLAND INDEPENDENT SCHOOL DISTRICT
NOTES TO THE BASIC FINANCIAL STATEMENTS
FISCAL YEAR ENDED JUNE 30, 2020
Note 2. Cash and Investments – continued
At June 30, 2020, the District’s exposure to interest rate risk, as measured by the segmented time distribution
by investment type, is summarized below:
Carrying
Amount/
Rating Fair Value Less than 1 1 to 3 4 to 6
TexPool AAAm 241,292,262 241,292,262$
Texas CLASS AAAm 35,555,717 35,555,717
Lone Star AAAm 35,485,106 35,485,106
Freddie Mac Discount Note Aaa, Prime-1 74,983,986 24,998,083 49,985,903
Total Investments 387,317,071$ 337,331,168$ 49,985,903$ -$
Investment Maturities in Months
Investments’ fair value measurements are as follows at June 30, 2020:
Investments Fair Value Level 1 Inputs Level 2 Inputs Level 3 Inputs
Freddie Mac Discount Note 74,983,986 74,983,986
Total Investments 74,983,986$ -$ 74,983,986$ -$
Fair Value Measurements Using
The District categorizes its fair value measurements within the fair value hierarchy established by generally
accepted accounting principles. GASB Statement No. 72, Fair Value Measurement and Application,
provides a framework for measuring fair value which establishes a three-level fair value hierarchy that
describes the inputs that are used to measure assets and liabilities.
Level 1 inputs are quoted prices (unadjusted) for identical assets or liabilities in active markets
that a government can access at the measurement date.
Level 2 inputs are inputs-other than quoted prices included within Level 1 – that are observable
for an asset or liability, either directly or indirectly.
Level 3 inputs are unobservable inputs for an asset or liability.
The fair value hierarchy gives the highest priority to Level 1 inputs and the lowest priority to Level 3
inputs. If a price for an identical asset or liability is not observable, a government should measure fair value
using another valuation technique that maximizes the use of relevant observable inputs and minimizes the
use of unobservable inputs. If the fair value of an asset or a liability is measured using inputs from more
than one level of the fair value hierarchy, the measurement is considered to be based on the lowest priority
level input that is significant to the entire measurement. The fair value of the U.S. Government Agency
securities on June 30, 2020 are based on quoted market prices using matrix pricing technique by the pricing
source that values securities based on their relationship to benchmark quoted prices (Level 2 inputs).
In accordance with GASB Statement No. 79, Certain External Investment Pools and Pool Participants, the
Local Government Investment Pools do not have any limitations and restrictions on withdrawals such as
notice periods or maximum transaction amounts. These pools do not impose any liquidity fees or
redemption gates.
An 11-member board of pool members oversees Lone Star. The fair value of the District’s position in Lone
Star is the same as the value of the pool shares. Lone Star is operated in a manner consistent with the SEC’s
Rule 2A-7 of the investment company Act of 1970.
32
GARLAND INDEPENDENT SCHOOL DISTRICT
NOTES TO THE BASIC FINANCIAL STATEMENTS
FISCAL YEAR ENDED JUNE 30, 2020
Note 2. Cash and Investments – continued
Lone Star’s Government Overnight Fund is authorized for the following investments:
Obligations of the United States Government, its agencies or instrumentalities.
Other obligations, the principal and interest of which are unconditionally guaranteed or insured by,
or backed by the full faith and credit of, the United States Government, or its agencies and
instrumentalities.
Fully collateralized repurchase agreements that meet the following criteria: (1) have a defined
termination date; (2) are secured by obligations of the United States or its agencies and
instrumentalities; (3) require the securities being purchased by the Government Overnight Fund to
be pledged to the Government Overnight Fund, held in the Government Overnight Fund’s name, and
deposited at the time the investment is made with the Government Overnight Fund or with a third
party selected and approved by the Government Overnight Fund; and (4) are placed through a primary
government securities dealer, as defined by the Federal Reserve, or a financial institution doing
business in this state. The market value of repurchase agreement collateral is required to initially be
102 percent of the principal amount of such repurchase agreement. Thereafter, the market value of
such collateral will be determined (marked-to-market) daily and reset to 102 percent of the principal
amount if it falls below 100 percent.
The Government Overnight Fund may lend up to 25 percent of its securities pursuant to a reserve
repurchase agreement authorized under the Investment Act. Any funds obtained pursuant to a reserve
repurchase agreement must be invested in authorized Government Overnight Fund investments and
match the term of any reverse repurchase agreement may not exceed 90 days.
No-load money market mutual funds regulated by the Securities and Exchange Commission (SEC)
that invest exclusively in authorized Government Overnight Fund investments, provided the
Government Overnight Fund shall not invest its funds in any one money market mutual fund in an
amount that exceeds (i) 25 percent of the Government Overnight Fund’s total assets or (ii) 10 percent
of the total assets of such money market mutual fund.
Lone Star’s Government Overnight Fund seeks to maintain a dollar-weighted average maturity of 60 days or
fewer. As of June 30, 2020, the fund had a weighted average maturity of 36 days.
The Texas Comptroller of Public Accounts oversees TexPool. The fair value of the District’s position in
TexPool is the same as the value of the pool shares. TexPool is operated in a manner consistent with the SEC’s
Rule 2A-7 of the investment company Act of 1970.
TexPool is authorized for the following investments:
Obligations of the United States Government, its agencies or instrumentalities with a maximum final
maturity of 397 days for fixed rate securities and 24 months for variable rate notes.
Fully collateralized repurchase agreements or reverse repurchase agreements (i) with defined
termination dates, (ii) secured obligations of the United States, its agencies or its instrumentalities,
including mortgage-backed securities, (iii) that require purchased securities to be pledged to the
investing entity or a third party, and (iv) that are placed through primary government securities
dealers or a financial institution doing business in the State of Texas. The maximum maturity on
repurchase agreements may not exceed 90 days unless the repurchase agreements have a put option
that allows TexPool to liquidate the position at par with no more than 7-day notice to the counterparty.
The maximum maturity on repurchase agreements may not exceed 181 days.
33
GARLAND INDEPENDENT SCHOOL DISTRICT
NOTES TO THE BASIC FINANCIAL STATEMENTS
FISCAL YEAR ENDED JUNE 30, 2020
Note 2. Cash and Investments – continued
No-load money market mutual funds that (i) are registered with and regulated by the Securities and
Exchange Commission, (ii) provide a prospectus and other information required by the Securities
Exchange Act of 1934 or the Investment Company Act of 1940, (iii) maintain a dollar weighted
average stated maturity of 90 days or less, (iv) included in its investment objectives the maintenance
of a stable net asset value of $1.00, and (v) are rated or equivalent by at least one nationally
recognized statistical rating organization (“NRSRO”).
Securities lending programs that comply various limitations.
The weighted average maturity of TexPool cannot exceed 60 days. As of June 30, 2020, TexPool had a
weighted average maturity of 36 days.
Texas CLASS is administered by a board of pool members. The fair value of the District’s position in Texas
CLASS is the same as the value of the pool shares. Texas CLASS is operated in a manner consistent with the
SEC’s Rule 2A-7 of the investment company Act of 1970.
Texas CLASS is authorized for the following investments:
Obligations, including letters of credit, of the United States or its agencies and instrumentalities with
a maximum maturity of 397 days, except that certain permitted variable rate securities may be
purchased with final maturities greater than 397 days, as described in Paragraph 12 (d) below.
Direct obligations of the State of Texas or its agencies and instrumentalities.
Other obligations, the principal and interest of which are unconditionally guaranteed or insured by or
backed by the full faith and credit of the State of Texas or the United States or their respective
agencies and instrumentalities, including obligations that are fully guaranteed or insured by the
Federal Deposit Insurance Corporation or by the explicit full faith and credit of the United States.
Obligations of states, agencies, counties, cities, and other political subdivisions of any state rated as
to investment quality by a nationally recognized investment rating firm not less than A or its
equivalent.
Certificates of deposit or share certificates if the certificate is issued by a depository institution that
has its main office or a branch office in this state and is:
(1) guaranteed or insured by the Federal Deposit Insurance Corporation or its successor the National
Credit Union Share Insurance Fund or its successor; (2) secured by obligations that are described by
Section 2256.009(a) of Chapter 2256, Texas Government Code as amended, including mortgage
backed securities directly issued by a federal agency or instrumentality that have a market value of
not less than the principal amount of the certificates, but excluding those mortgage backed securities
of the nature described by Section 2256.009{b), Texas Government Code, as amended; or {3) secured
in any other manner and amount provided by law for deposits of the investing entity. In addition, an
investment in certificates of deposit is authorized if (1) the funds are invested by an investing entity
through (A) a broker that has its main office or a branch office in Texas and is selected from a list
adopted by the investing entity, or (B) a depository institution that has its main office or a branch
office in Texas and that is selected by the investing entity, (2) the broker or depository institution
selected by the investing entity under {1) above arranges for the deposit of the funds in certificates
of deposit in one or more federally insured depository institutions, wherever located, for the account
of the investing entity, {3) the full amount of the principal and accrued interest of each of the
certificates of deposit is insured by the United States or an instrumentality of the United States, and
(4) the investing entity appoints the depository institution selected by the investing entity under {1)
above, an entity described by Section 2257.041{d) or a clearing broker-dealer registered with the
34
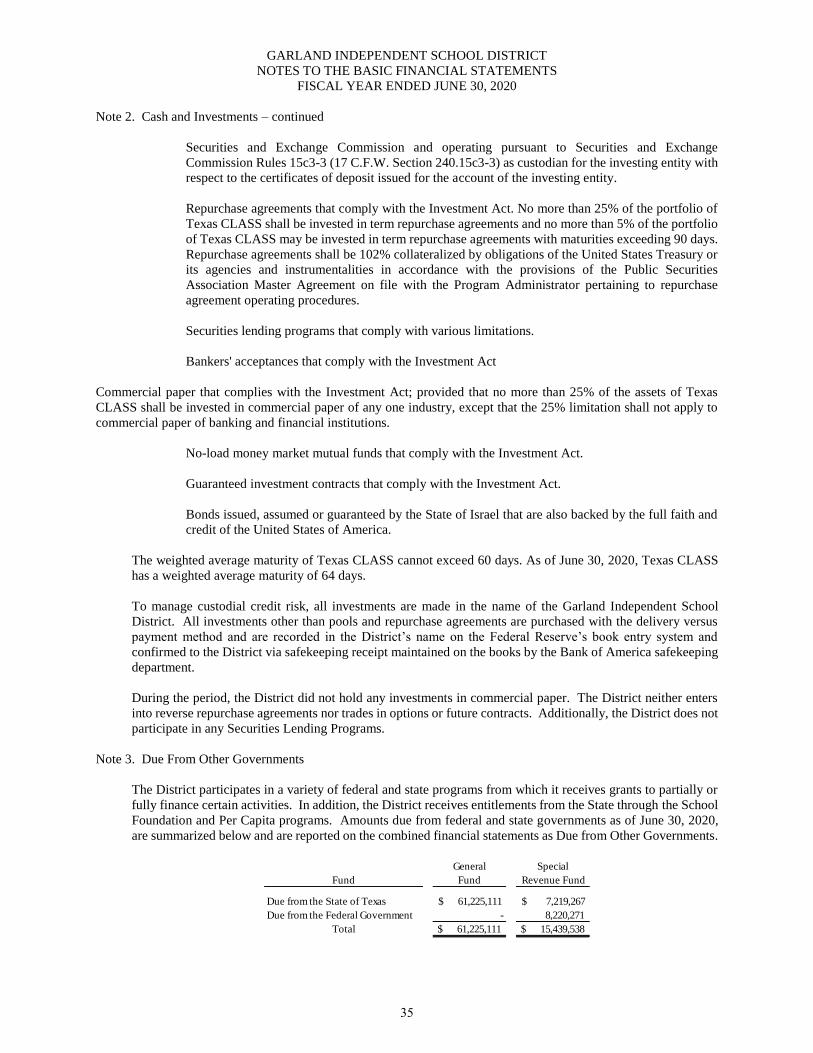
GARLAND INDEPENDENT SCHOOL DISTRICT
NOTES TO THE BASIC FINANCIAL STATEMENTS
FISCAL YEAR ENDED JUNE 30, 2020
Note 2. Cash and Investments – continued
Securities and Exchange Commission and operating pursuant to Securities and Exchange
Commission Rules 15c3-3 (17 C.F.W. Section 240.15c3-3) as custodian for the investing entity with
respect to the certificates of deposit issued for the account of the investing entity.
Repurchase agreements that comply with the Investment Act. No more than 25% of the portfolio of
Texas CLASS shall be invested in term repurchase agreements and no more than 5% of the portfolio
of Texas CLASS may be invested in term repurchase agreements with maturities exceeding 90 days.
Repurchase agreements shall be 102% collateralized by obligations of the United States Treasury or
its agencies and instrumentalities in accordance with the provisions of the Public Securities
Association Master Agreement on file with the Program Administrator pertaining to repurchase
agreement operating procedures.
Securities lending programs that comply with various limitations.
Bankers' acceptances that comply with the Investment Act
Commercial paper that complies with the Investment Act; provided that no more than 25% of the assets of Texas
CLASS shall be invested in commercial paper of any one industry, except that the 25% limitation shall not apply to
commercial paper of banking and financial institutions.
No-load money market mutual funds that comply with the Investment Act.
Guaranteed investment contracts that comply with the Investment Act.
Bonds issued, assumed or guaranteed by the State of Israel that are also backed by the full faith and
credit of the United States of America.
The weighted average maturity of Texas CLASS cannot exceed 60 days. As of June 30, 2020, Texas CLASS
has a weighted average maturity of 64 days.
To manage custodial credit risk, all investments are made in the name of the Garland Independent School
District. All investments other than pools and repurchase agreements are purchased with the delivery versus
payment method and are recorded in the District’s name on the Federal Reserve’s book entry system and
confirmed to the District via safekeeping receipt maintained on the books by the Bank of America safekeeping
department.
During the period, the District did not hold any investments in commercial paper. The District neither enters
into reverse repurchase agreements nor trades in options or future contracts. Additionally, the District does not
participate in any Securities Lending Programs.
Note 3. Due From Other Governments
The District participates in a variety of federal and state programs from which it receives grants to partially or
fully finance certain activities. In addition, the District receives entitlements from the State through the School
Foundation and Per Capita programs. Amounts due from federal and state governments as of June 30, 2020,
are summarized below and are reported on the combined financial statements as Due from Other Governments.
General Special
Fund Fund Revenue Fund
Due from the State of Texas $ 61,225,111 $ 7,219,267
Due from the Federal Government - 8,220,271
Total $ 61,225,111 $ 15,439,538
35
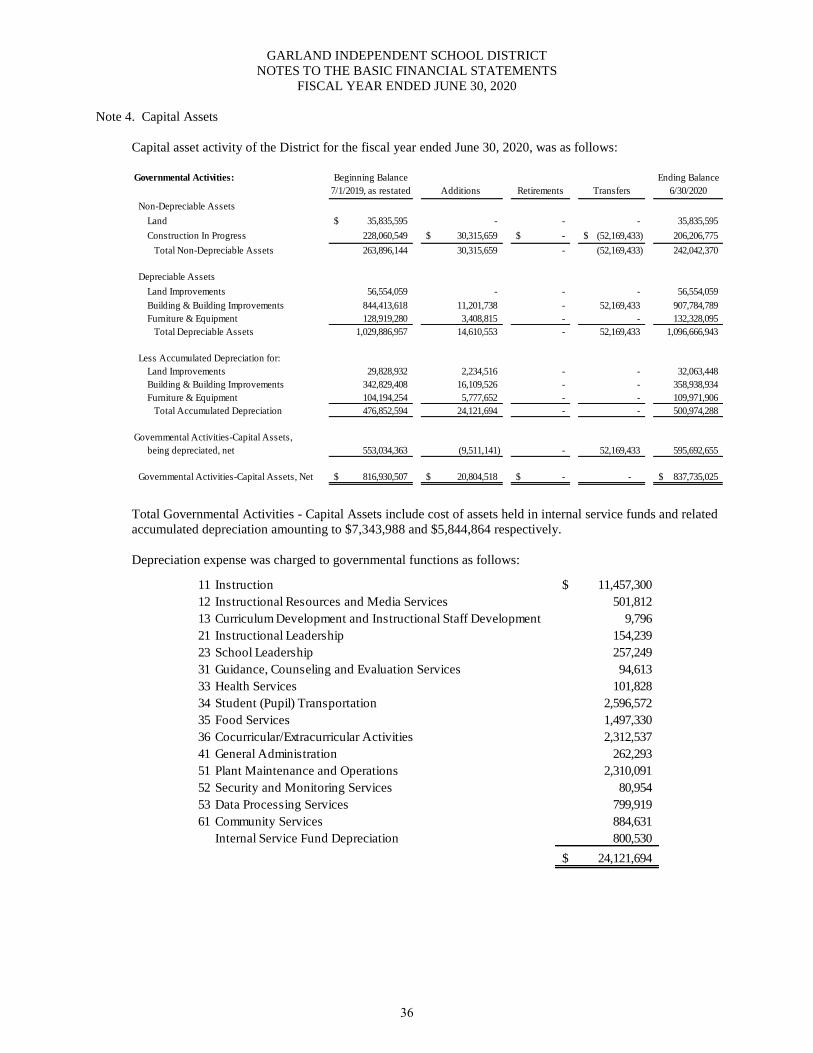
GARLAND INDEPENDENT SCHOOL DISTRICT
NOTES TO THE BASIC FINANCIAL STATEMENTS
FISCAL YEAR ENDED JUNE 30, 2020
Note 4. Capital Assets
Capital asset activity of the District for the fiscal year ended June 30, 2020, was as follows:
Governmental Activities: Beginning Balance Ending Balance
7/1/2019, as restated Additions Retirements Transfers 6/30/2020
Non-Depreciable Assets
Land 35,835,595$ - - - 35,835,595
Construction In Progress 228,060,549 30,315,659$ -$ (52,169,433)$ 206,206,775
Total Non-Depreciable Assets 263,896,144 30,315,659 - (52,169,433) 242,042,370
Depreciable Assets
Land Improvements 56,554,059 - - - 56,554,059
Building & Building Improvements 844,413,618 11,201,738 - 52,169,433 907,784,789
Furniture & Equipment 128,919,280 3,408,815 - - 132,328,095
Total Depreciable Assets 1,029,886,957 14,610,553 - 52,169,433 1,096,666,943
Less Accumulated Depreciation for:
Land Improvements 29,828,932 2,234,516 - - 32,063,448
Building & Building Improvements 342,829,408 16,109,526 - - 358,938,934
Furniture & Equipment 104,194,254 5,777,652 - - 109,971,906
Total Accumulated Depreciation 476,852,594 24,121,694 - - 500,974,288
Governmental Activities-Capital Assets,
being depreciated, net 553,034,363 (9,511,141) - 52,169,433 595,692,655
Governmental Activities-Capital Assets, Net 816,930,507$ 20,804,518$ -$ - 837,735,025$
Total Governmental Activities - Capital Assets include cost of assets held in internal service funds and related
accumulated depreciation amounting to $7,343,988 and $5,844,864 respectively.
Depreciation expense was charged to governmental functions as follows:
11 Instruction 11,457,300$
12 Instructional Resources and Media Services 501,812
13 Curriculum Development and Instructional Staff Development 9,796
21 Instructional Leadership 154,239
23 School Leadership 257,249
31 Guidance, Counseling and Evaluation Services 94,613
33 Health Services 101,828
34 Student (Pupil) Transportation 2,596,572
35 Food Services 1,497,330
36 Cocurricular/Extracurricular Activities 2,312,537
41 General Administration 262,293
51 Plant Maintenance and Operations 2,310,091
52 Security and Monitoring Services 80,954
53 Data Processing Services 799,919
61 Community Services 884,631
Internal Service Fund Depreciation 800,530
24,121,694$
36
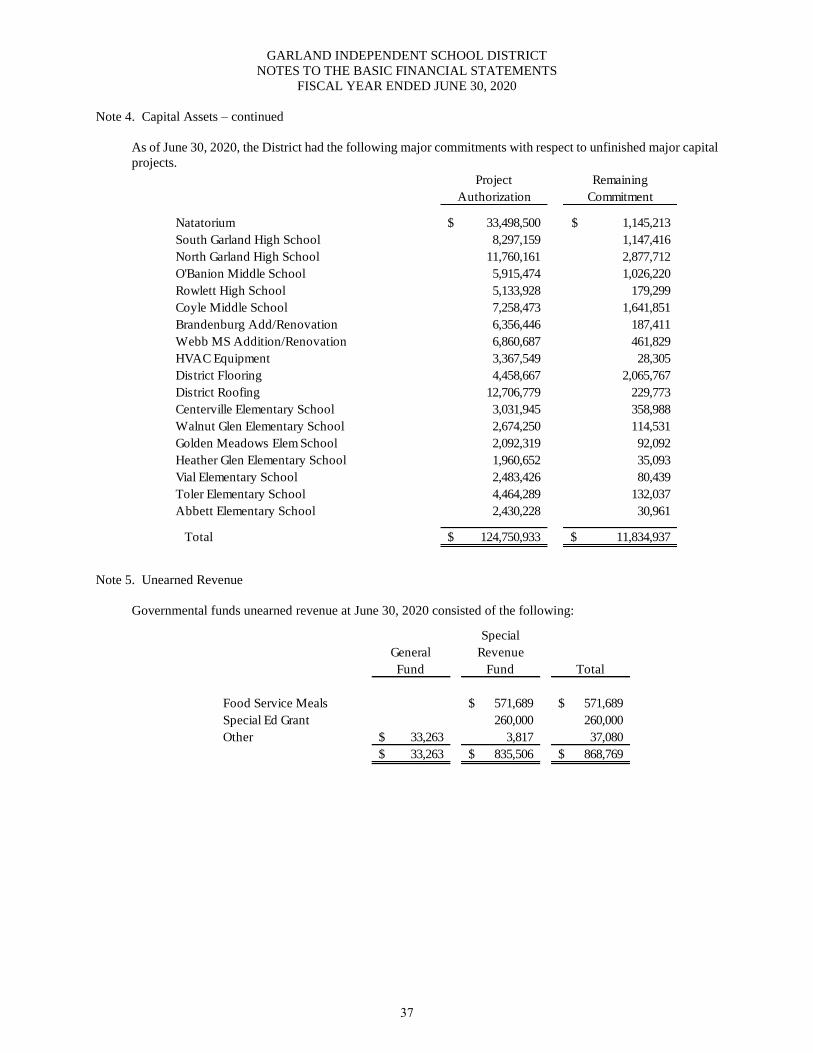
GARLAND INDEPENDENT SCHOOL DISTRICT
NOTES TO THE BASIC FINANCIAL STATEMENTS
FISCAL YEAR ENDED JUNE 30, 2020
Note 4. Capital Assets – continued
As of June 30, 2020, the District had the following major commitments with respect to unfinished major capital
projects.
Project Remaining
Authorization Commitment
Natatorium 33,498,500$ 1,145,213$
South Garland High School 8,297,159 1,147,416
North Garland High School 11,760,161 2,877,712
O'Banion Middle School 5,915,474 1,026,220
Rowlett High School 5,133,928 179,299
Coyle Middle School 7,258,473 1,641,851
Brandenburg Add/Renovation 6,356,446 187,411
Webb MS Addition/Renovation 6,860,687 461,829
HVAC Equipment 3,367,549 28,305
District Flooring 4,458,667 2,065,767
District Roofing 12,706,779 229,773
Centerville Elementary School 3,031,945 358,988
Walnut Glen Elementary School 2,674,250 114,531
Golden Meadows Elem School 2,092,319 92,092
Heather Glen Elementary School 1,960,652 35,093
Vial Elementary School 2,483,426 80,439
Toler Elementary School 4,464,289 132,037
Abbett Elementary School 2,430,228 30,961
Total 124,750,933$ 11,834,937$
Note 5. Unearned Revenue
Governmental funds unearned revenue at June 30, 2020 consisted of the following:
Special
General Revenue
Fund Fund Total
Food Service Meals 571,689$ 571,689$
Special Ed Grant 260,000 260,000
Other 33,263$ 3,817 37,080
33,263$ 835,506$ 868,769$
37
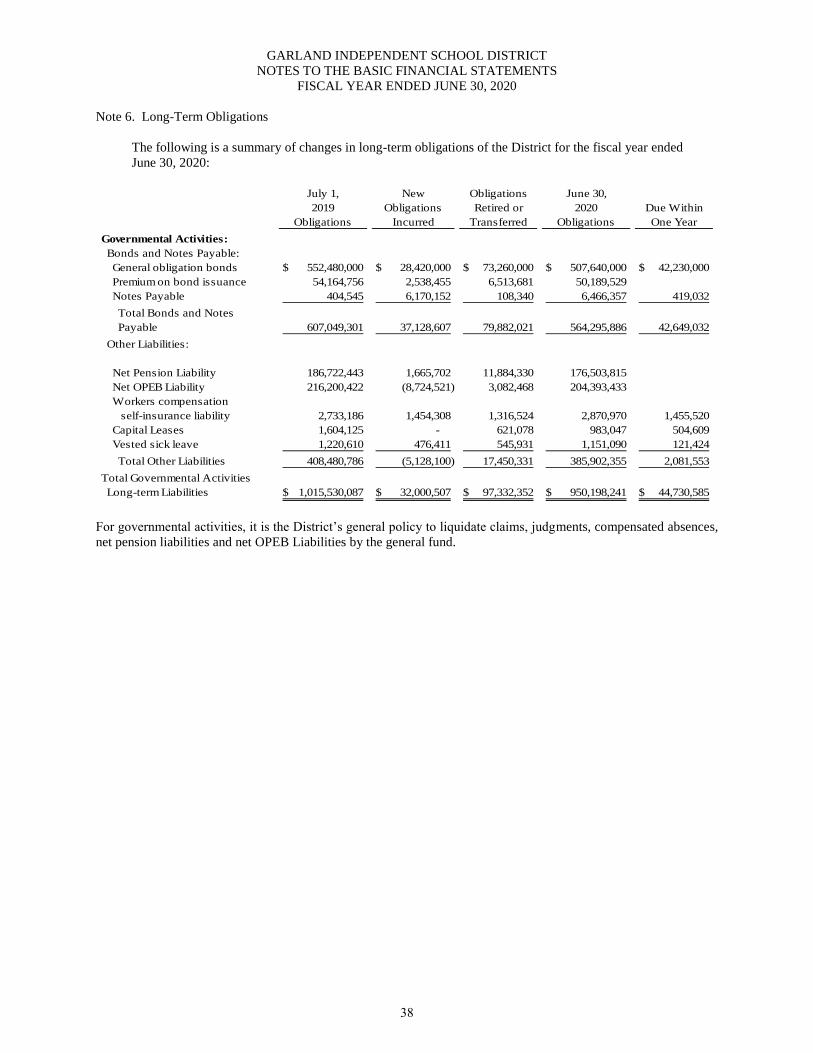
GARLAND INDEPENDENT SCHOOL DISTRICT
NOTES TO THE BASIC FINANCIAL STATEMENTS
FISCAL YEAR ENDED JUNE 30, 2020
Note 6. Long-Term Obligations
The following is a summary of changes in long-term obligations of the District for the fiscal year ended
June 30, 2020:
July 1, New Obligations June 30,
2019 Obligations Retired or 2020 Due Within
Obligations Incurred Transferred Obligations One Year
Governmental Activities:
Bonds and Notes Payable:
General obligation bonds 552,480,000$ 28,420,000$ 73,260,000$ 507,640,000$ 42,230,000$
Premium on bond issuance 54,164,756 2,538,455 6,513,681 50,189,529
Notes Payable 404,545 6,170,152 108,340 6,466,357 419,032
Total Bonds and Notes
Payable 607,049,301 37,128,607 79,882,021 564,295,886 42,649,032
Other Liabilities:
Net Pension Liability 186,722,443 1,665,702 11,884,330 176,503,815
Net OPEB Liability 216,200,422 (8,724,521) 3,082,468 204,393,433
Workers compensation
self-insurance liability 2,733,186 1,454,308 1,316,524 2,870,970 1,455,520
Capital Leases 1,604,125 - 621,078 983,047 504,609
Vested sick leave 1,220,610 476,411 545,931 1,151,090 121,424
Total Other Liabilities 408,480,786 (5,128,100) 17,450,331 385,902,355 2,081,553
Total Governmental Activities
Long-term Liabilities 1,015,530,087$ 32,000,507$ 97,332,352$ 950,198,241$ 44,730,585$
For governmental activities, it is the District’s general policy to liquidate claims, judgments, compensated absences,
net pension liabilities and net OPEB Liabilities by the general fund.
38
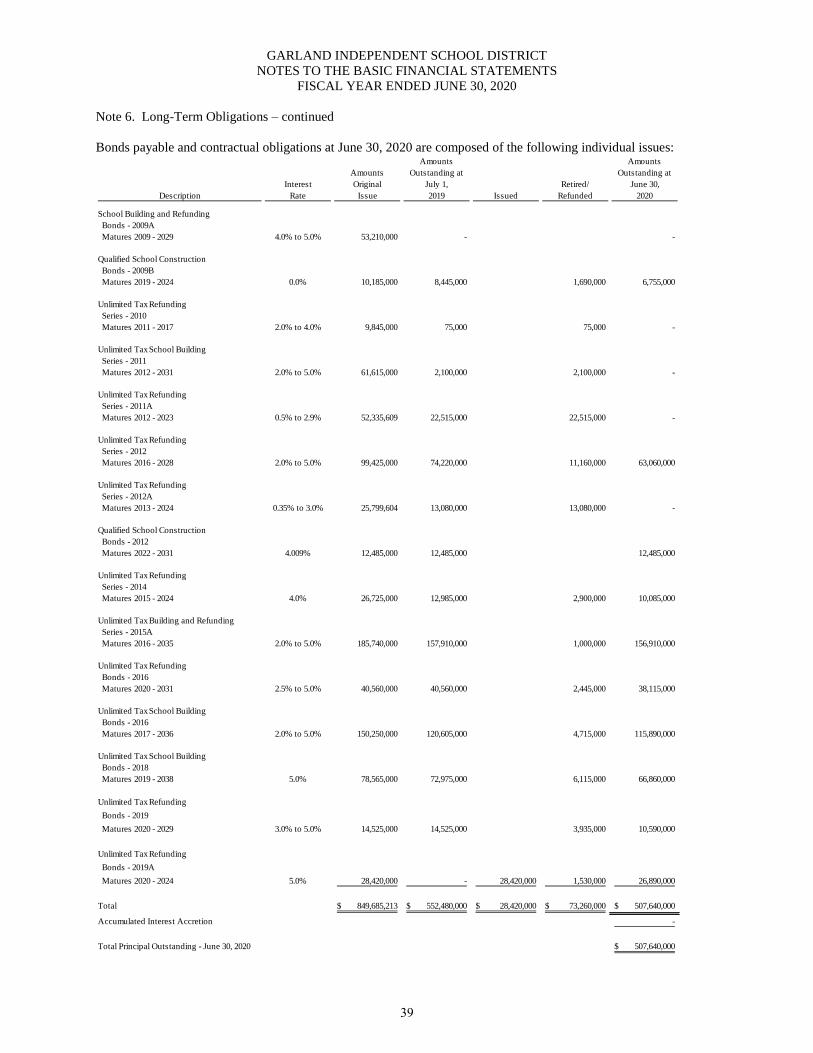
GARLAND INDEPENDENT SCHOOL DISTRICT
NOTES TO THE BASIC FINANCIAL STATEMENTS
FISCAL YEAR ENDED JUNE 30, 2020
Note 6. Long-Term Obligations – continued
Bonds payable and contractual obligations at June 30, 2020 are composed of the following individual issues: Amounts Amounts
Amounts Outstanding at Outstanding at
Interest Original July 1, Retired/ June 30,
Description Rate Issue 2019 Issued Refunded 2020
School Building and Refunding
Bonds - 2009A
Matures 2009 - 2029 4.0% to 5.0% 53,210,000 - -
Qualified School Construction
Bonds - 2009B
Matures 2019 - 2024 0.0% 10,185,000 8,445,000 1,690,000 6,755,000
Unlimited Tax Refunding
Series - 2010
Matures 2011 - 2017 2.0% to 4.0% 9,845,000 75,000 75,000 -
Unlimited Tax School Building
Series - 2011
Matures 2012 - 2031 2.0% to 5.0% 61,615,000 2,100,000 2,100,000 -
Unlimited Tax Refunding
Series - 2011A
Matures 2012 - 2023 0.5% to 2.9% 52,335,609 22,515,000 22,515,000 -
Unlimited Tax Refunding
Series - 2012
Matures 2016 - 2028 2.0% to 5.0% 99,425,000 74,220,000 11,160,000 63,060,000
Unlimited Tax Refunding
Series - 2012A
Matures 2013 - 2024 0.35% to 3.0% 25,799,604 13,080,000 13,080,000 -
Qualified School Construction
Bonds - 2012
Matures 2022 - 2031 4.009% 12,485,000 12,485,000 12,485,000
Unlimited Tax Refunding
Series - 2014
Matures 2015 - 2024 4.0% 26,725,000 12,985,000 2,900,000 10,085,000
Unlimited Tax Building and Refunding
Series - 2015A
Matures 2016 - 2035 2.0% to 5.0% 185,740,000 157,910,000 1,000,000 156,910,000
Unlimited Tax Refunding
Bonds - 2016
Matures 2020 - 2031 2.5% to 5.0% 40,560,000 40,560,000 2,445,000 38,115,000
Unlimited Tax School Building
Bonds - 2016
Matures 2017 - 2036 2.0% to 5.0% 150,250,000 120,605,000 4,715,000 115,890,000
Unlimited Tax School Building
Bonds - 2018
Matures 2019 - 2038 5.0% 78,565,000 72,975,000 6,115,000 66,860,000
Unlimited Tax Refunding
Bonds - 2019
Matures 2020 - 2029 3.0% to 5.0% 14,525,000 14,525,000 3,935,000 10,590,000
Unlimited Tax Refunding
Bonds - 2019A
Matures 2020 - 2024 5.0% 28,420,000 - 28,420,000 1,530,000 26,890,000
Total 849,685,213$ 552,480,000$ 28,420,000$ 73,260,000$ 507,640,000$
Accumulated Interest Accretion -
Total Principal Outstanding - June 30, 2020 507,640,000$
39
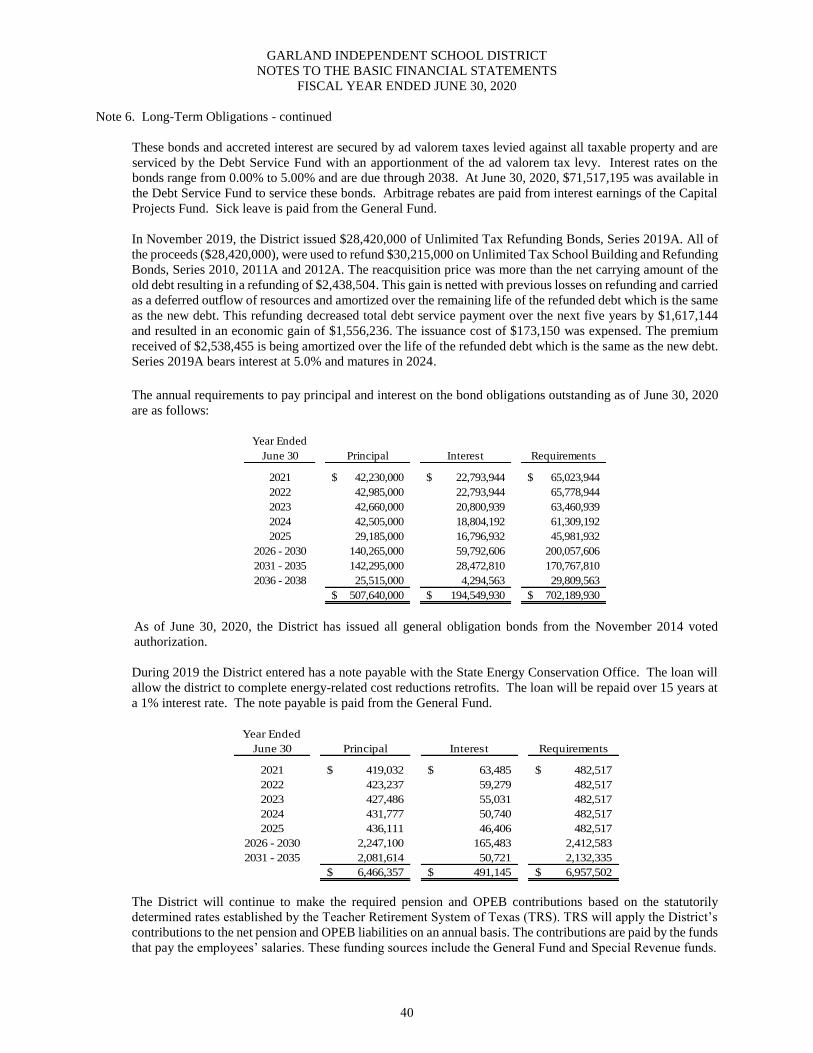
GARLAND INDEPENDENT SCHOOL DISTRICT
NOTES TO THE BASIC FINANCIAL STATEMENTS
FISCAL YEAR ENDED JUNE 30, 2020
Note 6. Long-Term Obligations - continued
These bonds and accreted interest are secured by ad valorem taxes levied against all taxable property and are
serviced by the Debt Service Fund with an apportionment of the ad valorem tax levy. Interest rates on the
bonds range from 0.00% to 5.00% and are due through 2038. At June 30, 2020, $71,517,195 was available in
the Debt Service Fund to service these bonds. Arbitrage rebates are paid from interest earnings of the Capital
Projects Fund. Sick leave is paid from the General Fund.
In November 2019, the District issued $28,420,000 of Unlimited Tax Refunding Bonds, Series 2019A. All of
the proceeds ($28,420,000), were used to refund $30,215,000 on Unlimited Tax School Building and Refunding
Bonds, Series 2010, 2011A and 2012A. The reacquisition price was more than the net carrying amount of the
old debt resulting in a refunding of $2,438,504. This gain is netted with previous losses on refunding and carried
as a deferred outflow of resources and amortized over the remaining life of the refunded debt which is the same
as the new debt. This refunding decreased total debt service payment over the next five years by $1,617,144
and resulted in an economic gain of $1,556,236. The issuance cost of $173,150 was expensed. The premium
received of $2,538,455 is being amortized over the life of the refunded debt which is the same as the new debt.
Series 2019A bears interest at 5.0% and matures in 2024.
The annual requirements to pay principal and interest on the bond obligations outstanding as of June 30, 2020
are as follows:
Year Ended
June 30 Principal Interest Requirements
2021 42,230,000$ 22,793,944$ 65,023,944$
2022 42,985,000 22,793,944 65,778,944
2023 42,660,000 20,800,939 63,460,939
2024 42,505,000 18,804,192 61,309,192
2025 29,185,000 16,796,932 45,981,932
2026 - 2030 140,265,000 59,792,606 200,057,606
2031 - 2035 142,295,000 28,472,810 170,767,810
2036 - 2038 25,515,000 4,294,563 29,809,563
507,640,000$ 194,549,930$ 702,189,930$
As of June 30, 2020, the District has issued all general obligation bonds from the November 2014 voted
authorization.
During 2019 the District entered has a note payable with the State Energy Conservation Office. The loan will
allow the district to complete energy-related cost reductions retrofits. The loan will be repaid over 15 years at
a 1% interest rate. The note payable is paid from the General Fund.
Year Ended
June 30 Principal Interest Requirements
2021 419,032$ 63,485$ 482,517$
2022 423,237 59,279 482,517
2023 427,486 55,031 482,517
2024 431,777 50,740 482,517
2025 436,111 46,406 482,517
2026 - 2030 2,247,100 165,483 2,412,583
2031 - 2035 2,081,614 50,721 2,132,335
6,466,357$ 491,145$ 6,957,502$
The District will continue to make the required pension and OPEB contributions based on the statutorily
determined rates established by the Teacher Retirement System of Texas (TRS). TRS will apply the District’s
contributions to the net pension and OPEB liabilities on an annual basis. The contributions are paid by the funds
that pay the employees’ salaries. These funding sources include the General Fund and Special Revenue funds.
40
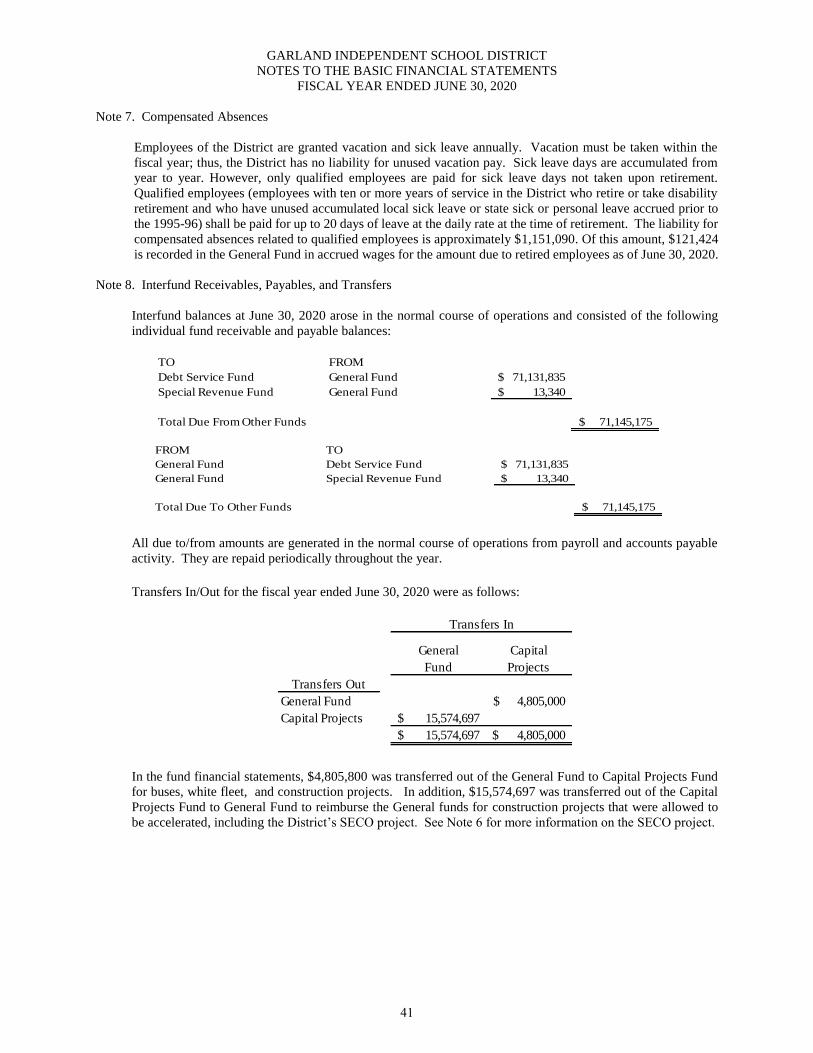
GARLAND INDEPENDENT SCHOOL DISTRICT
NOTES TO THE BASIC FINANCIAL STATEMENTS
FISCAL YEAR ENDED JUNE 30, 2020
Note 7. Compensated Absences
Employees of the District are granted vacation and sick leave annually. Vacation must be taken within the
fiscal year; thus, the District has no liability for unused vacation pay. Sick leave days are accumulated from
year to year. However, only qualified employees are paid for sick leave days not taken upon retirement.
Qualified employees (employees with ten or more years of service in the District who retire or take disability
retirement and who have unused accumulated local sick leave or state sick or personal leave accrued prior to
the 1995-96) shall be paid for up to 20 days of leave at the daily rate at the time of retirement. The liability for
compensated absences related to qualified employees is approximately $1,151,090. Of this amount, $121,424
is recorded in the General Fund in accrued wages for the amount due to retired employees as of June 30, 2020.
Note 8. Interfund Receivables, Payables, and Transfers
Interfund balances at June 30, 2020 arose in the normal course of operations and consisted of the following
individual fund receivable and payable balances:
TO FROM
Debt Service Fund General Fund 71,131,835$
Special Revenue Fund General Fund 13,340$
Total Due From Other Funds 71,145,175$
FROM TO
General Fund Debt Service Fund 71,131,835$
General Fund Special Revenue Fund 13,340$
Total Due To Other Funds 71,145,175$
All due to/from amounts are generated in the normal course of operations from payroll and accounts payable
activity. They are repaid periodically throughout the year.
Transfers In/Out for the fiscal year ended June 30, 2020 were as follows:
General Capital
Fund Projects
Transfers Out
General Fund 4,805,000$
Capital Projects 15,574,697$
15,574,697$ 4,805,000$
Transfers In
In the fund financial statements, $4,805,800 was transferred out of the General Fund to Capital Projects Fund
for buses, white fleet, and construction projects. In addition, $15,574,697 was transferred out of the Capital
Projects Fund to General Fund to reimburse the General funds for construction projects that were allowed to
be accelerated, including the District’s SECO project. See Note 6 for more information on the SECO project.
41
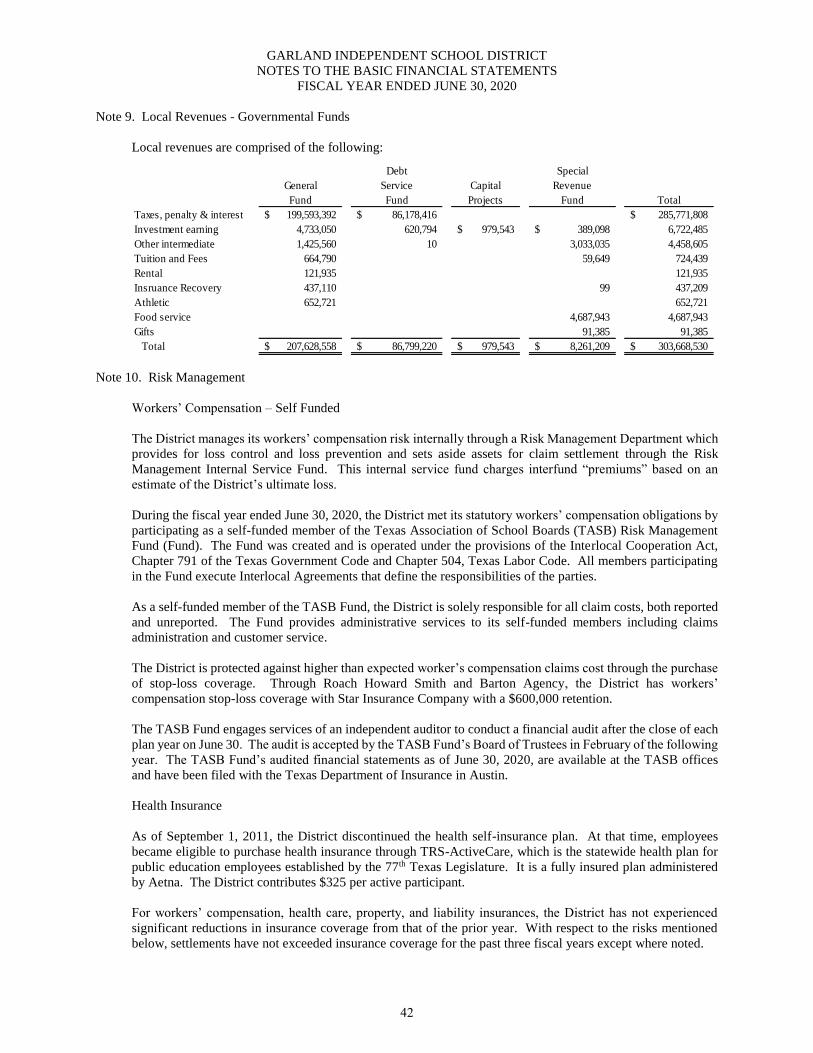
GARLAND INDEPENDENT SCHOOL DISTRICT
NOTES TO THE BASIC FINANCIAL STATEMENTS
FISCAL YEAR ENDED JUNE 30, 2020
Note 9. Local Revenues - Governmental Funds
Local revenues are comprised of the following:
Debt Special
General Service Capital Revenue
Fund Fund Projects Fund Total
Taxes, penalty & interest 199,593,392$ 86,178,416$ 285,771,808$
Investment earning 4,733,050 620,794 979,543$ 389,098$ 6,722,485
Other intermediate 1,425,560 10 3,033,035 4,458,605
Tuition and Fees 664,790 59,649 724,439
Rental 121,935 121,935
Insruance Recovery 437,110 99 437,209
Athletic 652,721 652,721
Food service 4,687,943 4,687,943
Gifts 91,385 91,385
Total 207,628,558$ 86,799,220$ 979,543$ 8,261,209$ 303,668,530$
Note 10. Risk Management
Workers’ Compensation – Self Funded
The District manages its workers’ compensation risk internally through a Risk Management Department which
provides for loss control and loss prevention and sets aside assets for claim settlement through the Risk
Management Internal Service Fund. This internal service fund charges interfund “premiums” based on an
estimate of the District’s ultimate loss.
During the fiscal year ended June 30, 2020, the District met its statutory workers’ compensation obligations by
participating as a self-funded member of the Texas Association of School Boards (TASB) Risk Management
Fund (Fund). The Fund was created and is operated under the provisions of the Interlocal Cooperation Act,
Chapter 791 of the Texas Government Code and Chapter 504, Texas Labor Code. All members participating
in the Fund execute Interlocal Agreements that define the responsibilities of the parties.
As a self-funded member of the TASB Fund, the District is solely responsible for all claim costs, both reported
and unreported. The Fund provides administrative services to its self-funded members including claims
administration and customer service.
The District is protected against higher than expected worker’s compensation claims cost through the purchase
of stop-loss coverage. Through Roach Howard Smith and Barton Agency, the District has workers’
compensation stop-loss coverage with Star Insurance Company with a $600,000 retention.
The TASB Fund engages services of an independent auditor to conduct a financial audit after the close of each
plan year on June 30. The audit is accepted by the TASB Fund’s Board of Trustees in February of the following
year. The TASB Fund’s audited financial statements as of June 30, 2020, are available at the TASB offices
and have been filed with the Texas Department of Insurance in Austin.
Health Insurance
As of September 1, 2011, the District discontinued the health self-insurance plan. At that time, employees
became eligible to purchase health insurance through TRS-ActiveCare, which is the statewide health plan for
public education employees established by the 77th Texas Legislature. It is a fully insured plan administered
by Aetna. The District contributes $325 per active participant.
For workers’ compensation, health care, property, and liability insurances, the District has not experienced
significant reductions in insurance coverage from that of the prior year. With respect to the risks mentioned
below, settlements have not exceeded insurance coverage for the past three fiscal years except where noted.
42
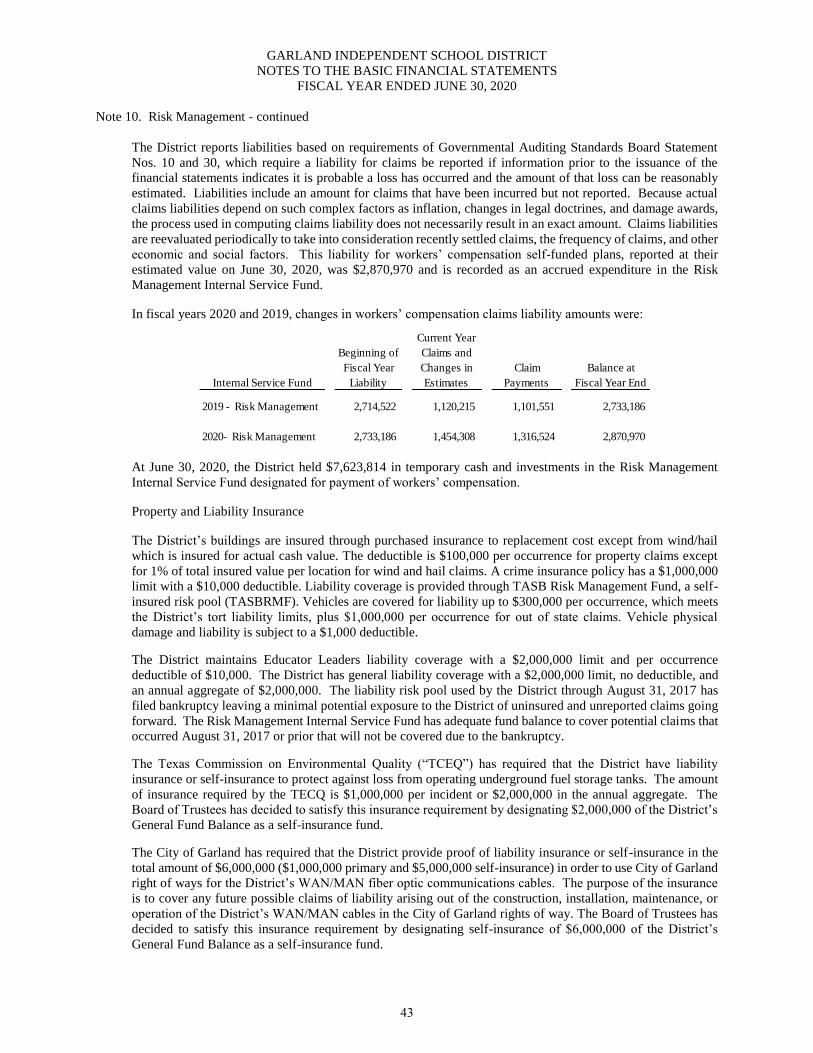
GARLAND INDEPENDENT SCHOOL DISTRICT
NOTES TO THE BASIC FINANCIAL STATEMENTS
FISCAL YEAR ENDED JUNE 30, 2020
Note 10. Risk Management - continued
The District reports liabilities based on requirements of Governmental Auditing Standards Board Statement
Nos. 10 and 30, which require a liability for claims be reported if information prior to the issuance of the
financial statements indicates it is probable a loss has occurred and the amount of that loss can be reasonably
estimated. Liabilities include an amount for claims that have been incurred but not reported. Because actual
claims liabilities depend on such complex factors as inflation, changes in legal doctrines, and damage awards,
the process used in computing claims liability does not necessarily result in an exact amount. Claims liabilities
are reevaluated periodically to take into consideration recently settled claims, the frequency of claims, and other
economic and social factors. This liability for workers’ compensation self-funded plans, reported at their
estimated value on June 30, 2020, was $2,870,970 and is recorded as an accrued expenditure in the Risk
Management Internal Service Fund.
In fiscal years 2020 and 2019, changes in workers’ compensation claims liability amounts were:
Internal Service Fund
Beginning of
Fiscal Year
Liability
Current Year
Claims and
Changes in
Estimates
Claim
Payments
Balance at
Fiscal Year End
2019 - Risk Management 2,714,522 1,120,215 1,101,551 2,733,186
2020- Risk Management 2,733,186 1,454,308 1,316,524 2,870,970
At June 30, 2020, the District held $7,623,814 in temporary cash and investments in the Risk Management
Internal Service Fund designated for payment of workers’ compensation. Property and Liability Insurance
The District’s buildings are insured through purchased insurance to replacement cost except from wind/hail
which is insured for actual cash value. The deductible is $100,000 per occurrence for property claims except
for 1% of total insured value per location for wind and hail claims. A crime insurance policy has a $1,000,000
limit with a $10,000 deductible. Liability coverage is provided through TASB Risk Management Fund, a self-
insured risk pool (TASBRMF). Vehicles are covered for liability up to $300,000 per occurrence, which meets
the District’s tort liability limits, plus $1,000,000 per occurrence for out of state claims. Vehicle physical
damage and liability is subject to a $1,000 deductible.
The District maintains Educator Leaders liability coverage with a $2,000,000 limit and per occurrence
deductible of $10,000. The District has general liability coverage with a $2,000,000 limit, no deductible, and
an annual aggregate of $2,000,000. The liability risk pool used by the District through August 31, 2017 has
filed bankruptcy leaving a minimal potential exposure to the District of uninsured and unreported claims going
forward. The Risk Management Internal Service Fund has adequate fund balance to cover potential claims that
occurred August 31, 2017 or prior that will not be covered due to the bankruptcy.
The Texas Commission on Environmental Quality (“TCEQ”) has required that the District have liability
insurance or self-insurance to protect against loss from operating underground fuel storage tanks. The amount
of insurance required by the TECQ is $1,000,000 per incident or $2,000,000 in the annual aggregate. The
Board of Trustees has decided to satisfy this insurance requirement by designating $2,000,000 of the District’s
General Fund Balance as a self-insurance fund.
The City of Garland has required that the District provide proof of liability insurance or self-insurance in the
total amount of $6,000,000 ($1,000,000 primary and $5,000,000 self-insurance) in order to use City of Garland
right of ways for the District’s WAN/MAN fiber optic communications cables. The purpose of the insurance
is to cover any future possible claims of liability arising out of the construction, installation, maintenance, or
operation of the District’s WAN/MAN cables in the City of Garland rights of way. The Board of Trustees has
decided to satisfy this insurance requirement by designating self-insurance of $6,000,000 of the District’s
General Fund Balance as a self-insurance fund.
43
GARLAND INDEPENDENT SCHOOL DISTRICT
NOTES TO THE BASIC FINANCIAL STATEMENTS
FISCAL YEAR ENDED JUNE 30, 2020
Note 10. Risk Management - continued
Medical Malpractice Insurance
The District carries a medical malpractice insurance policy to provide protection for the employee clinic and
school nurses from malpractice claims. The policy has a $1 million per occurrence limit with a $3 million
aggregate, subject to a $2,500 per claim deductible.
Student Accident Insurance
The District provides accident insurance for athletics, band, cheerleading and other UIL sponsored activities.
The accident policy is an excess insurance policy covering accidental injuries with a $25,000 limit. There is
also a catastrophic umbrella policy for these UIL sponsored activities with a limit of $7.5 million above the
underlying $25,000 policy.
Note 11. Retirement Plan
Retirement Plan Description
The District participates in a cost-sharing multiple-employer defined benefit pension that has a special funding
situation. The plan is administered by the Teacher Retirement System of Texas (TRS). TRS’s defined benefit
pension plan is established and administered in accordance with the Texas Constitution, Article XVI, Section
67 and Texas Government Code, Title 8, Subtitle C. The pension trust fund is a qualified pension trust under
Section 401(a) of the Internal Revenue Code. The Texas Legislature establishes benefits and contribution rates
within the guidelines of the Texas Constitution. The pension’s Board of Trustees does not have the authority to
establish or amend benefit terms. All employees of public, state-supported educational institutions in Texas
who are employed for one-half or more of the standard work load and who are not exempted from membership
under Texas Government Code, Title 8, Section 822.002 are covered by the system.
All employees of public, state-supported educational institutions in Texas who are employed for one-half or
more of the standard work load and who are not exempted from membership under Texas Government Code,
Title 8, Section 822.002 are covered by the system.
Pension Plan Fiduciary Net Position
Detail information about the Teacher Retirement System’s fiduciary net position is available in a separately-
issued Comprehensive Annual Financial Report that includes financial statements and required
supplementary information. That report may be obtained on the Internet at
https://www.trs.texas.gov/TRS%20Documents/cafr_2019.pdf; by writing to TRS at 1000 Red River Street,
Austin, TX, 78701-2698; or by calling (512) 542-6592.
Benefits Provided
TRS provides service and disability retirement, as well as death and survivor benefits, to eligible employees
(and their beneficiaries) of public and higher education in Texas. The pension formula is calculated using 2.3
percent (multiplier) times the average of the five highest annual creditable salaries times years of credited
service to arrive at the annual standard annuity except for members who are grandfathered, the three highest
annual salaries are used. The normal service retirement is at age 65 with 5 years of credited service or when
the sum of the member’s age and years of credited service equals 80 or more years. Early retirement is at age
55 with 5 years of service credit or earlier than 55 with 30 years of service credit. There are additional
provisions for early retirement if the sum of the member’s age and years of service credit total at least 80, but
the member is less than age 60 or 62 depending on date of employment, or if the member was grandfathered in
under a previous rule. There are no automatic post-employment benefit changes; including automatic COLAs.
Ad hoc post-employment benefit changes, including ad hoc COLAs can be granted by the Texas Legislature as
noted in the Plan description above.
44
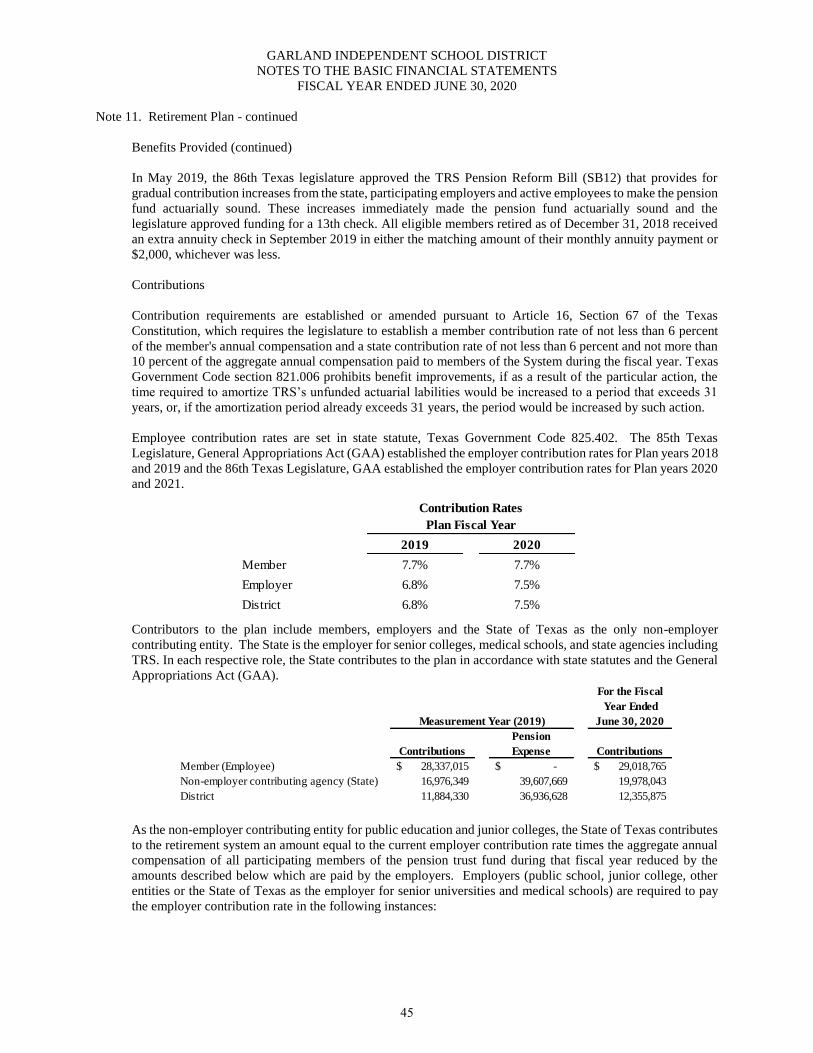
GARLAND INDEPENDENT SCHOOL DISTRICT
NOTES TO THE BASIC FINANCIAL STATEMENTS
FISCAL YEAR ENDED JUNE 30, 2020
Note 11. Retirement Plan - continued
Benefits Provided (continued)
In May 2019, the 86th Texas legislature approved the TRS Pension Reform Bill (SB12) that provides for
gradual contribution increases from the state, participating employers and active employees to make the pension
fund actuarially sound. These increases immediately made the pension fund actuarially sound and the
legislature approved funding for a 13th check. All eligible members retired as of December 31, 2018 received
an extra annuity check in September 2019 in either the matching amount of their monthly annuity payment or
$2,000, whichever was less.
Contributions
Contribution requirements are established or amended pursuant to Article 16, Section 67 of the Texas
Constitution, which requires the legislature to establish a member contribution rate of not less than 6 percent
of the member's annual compensation and a state contribution rate of not less than 6 percent and not more than
10 percent of the aggregate annual compensation paid to members of the System during the fiscal year. Texas
Government Code section 821.006 prohibits benefit improvements, if as a result of the particular action, the
time required to amortize TRS’s unfunded actuarial labilities would be increased to a period that exceeds 31
years, or, if the amortization period already exceeds 31 years, the period would be increased by such action.
Employee contribution rates are set in state statute, Texas Government Code 825.402. The 85th Texas
Legislature, General Appropriations Act (GAA) established the employer contribution rates for Plan years 2018
and 2019 and the 86th Texas Legislature, GAA established the employer contribution rates for Plan years 2020
and 2021.
2019 2020
Member 7.7% 7.7%
Employer 6.8% 7.5%
District 6.8% 7.5%
Contribution Rates
Plan Fiscal Year
Contributors to the plan include members, employers and the State of Texas as the only non-employer
contributing entity. The State is the employer for senior colleges, medical schools, and state agencies including
TRS. In each respective role, the State contributes to the plan in accordance with state statutes and the General
Appropriations Act (GAA).
For the Fiscal
Year Ended
June 30, 2020
Contributions
Pension
Expense Contributions
Member (Employee) 28,337,015$ -$ 29,018,765$
Non-employer contributing agency (State) 16,976,349 39,607,669 19,978,043
District 11,884,330 36,936,628 12,355,875
Measurement Year (2019)
As the non-employer contributing entity for public education and junior colleges, the State of Texas contributes
to the retirement system an amount equal to the current employer contribution rate times the aggregate annual
compensation of all participating members of the pension trust fund during that fiscal year reduced by the
amounts described below which are paid by the employers. Employers (public school, junior college, other
entities or the State of Texas as the employer for senior universities and medical schools) are required to pay
the employer contribution rate in the following instances:
45
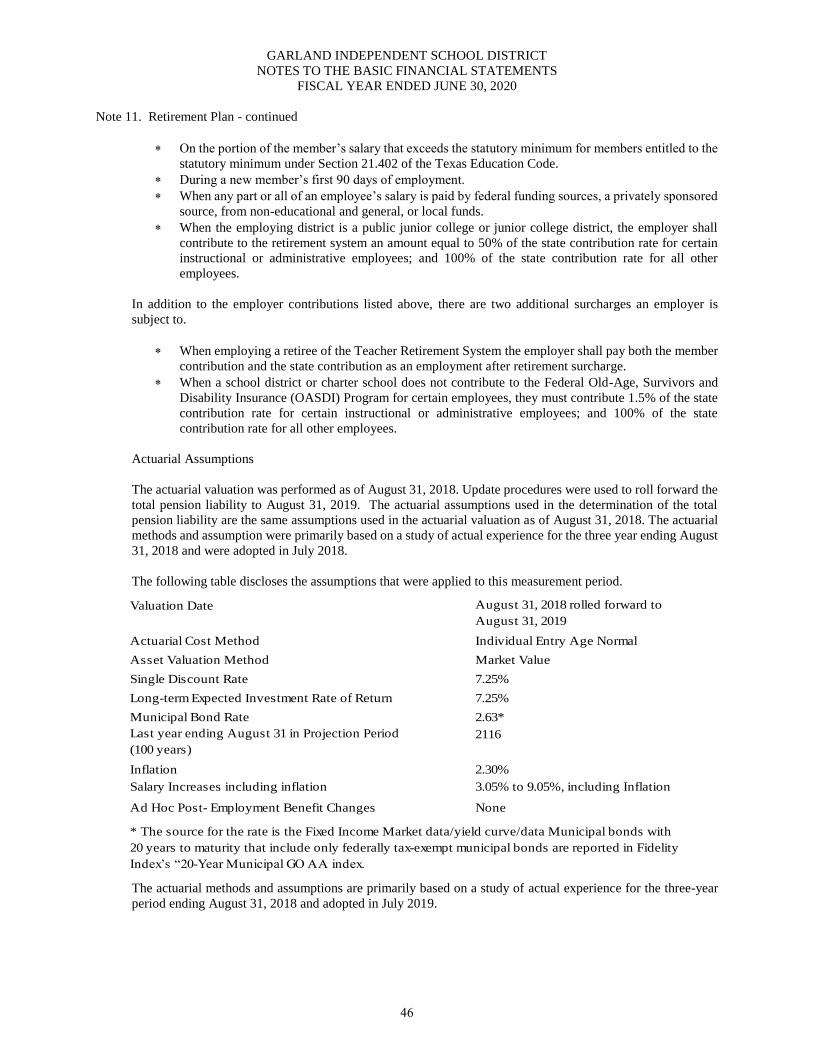
GARLAND INDEPENDENT SCHOOL DISTRICT
NOTES TO THE BASIC FINANCIAL STATEMENTS
FISCAL YEAR ENDED JUNE 30, 2020
Note 11. Retirement Plan - continued
On the portion of the member’s salary that exceeds the statutory minimum for members entitled to the
statutory minimum under Section 21.402 of the Texas Education Code.
During a new member’s first 90 days of employment.
When any part or all of an employee’s salary is paid by federal funding sources, a privately sponsored
source, from non-educational and general, or local funds.
When the employing district is a public junior college or junior college district, the employer shall
contribute to the retirement system an amount equal to 50% of the state contribution rate for certain
instructional or administrative employees; and 100% of the state contribution rate for all other
employees.
In addition to the employer contributions listed above, there are two additional surcharges an employer is
subject to.
When employing a retiree of the Teacher Retirement System the employer shall pay both the member
contribution and the state contribution as an employment after retirement surcharge.
When a school district or charter school does not contribute to the Federal Old-Age, Survivors and
Disability Insurance (OASDI) Program for certain employees, they must contribute 1.5% of the state
contribution rate for certain instructional or administrative employees; and 100% of the state
contribution rate for all other employees.
Actuarial Assumptions
The actuarial valuation was performed as of August 31, 2018. Update procedures were used to roll forward the
total pension liability to August 31, 2019. The actuarial assumptions used in the determination of the total
pension liability are the same assumptions used in the actuarial valuation as of August 31, 2018. The actuarial
methods and assumption were primarily based on a study of actual experience for the three year ending August
31, 2018 and were adopted in July 2018.
The following table discloses the assumptions that were applied to this measurement period.
Valuation Date August 31, 2018 rolled forward to
August 31, 2019
Actuarial Cost Method Individual Entry Age Normal
Asset Valuation Method Market Value
Single Discount Rate 7.25%
Long-term Expected Investment Rate of Return 7.25%
Municipal Bond Rate 2.63*
Last year ending August 31 in Projection Period
(100 years)
2116
Inflation 2.30%
Salary Increases including inflation 3.05% to 9.05%, including Inflation
Ad Hoc Post- Employment Benefit Changes None
* The source for the rate is the Fixed Income Market data/yield curve/data Municipal bonds with
20 years to maturity that include only federally tax-exempt municipal bonds are reported in Fidelity
Index’s “20-Year Municipal GO AA index.
The actuarial methods and assumptions are primarily based on a study of actual experience for the three-year
period ending August 31, 2018 and adopted in July 2019.
46
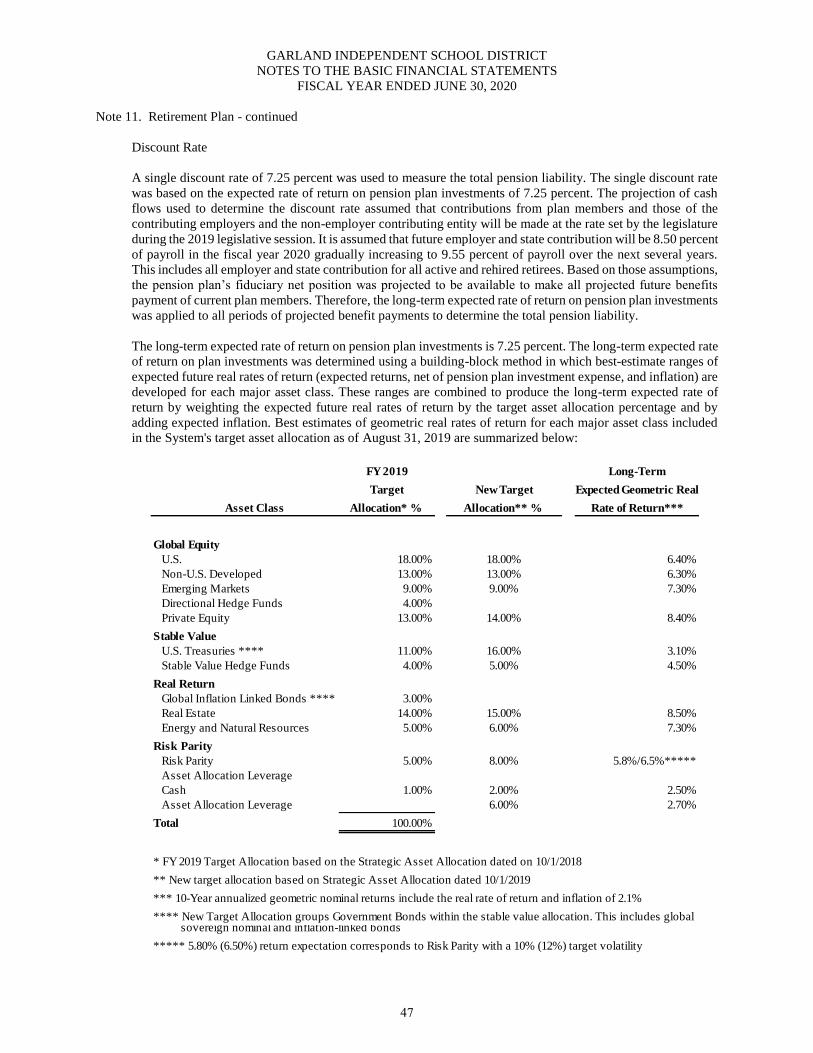
GARLAND INDEPENDENT SCHOOL DISTRICT
NOTES TO THE BASIC FINANCIAL STATEMENTS
FISCAL YEAR ENDED JUNE 30, 2020
Note 11. Retirement Plan - continued
Discount Rate
A single discount rate of 7.25 percent was used to measure the total pension liability. The single discount rate
was based on the expected rate of return on pension plan investments of 7.25 percent. The projection of cash
flows used to determine the discount rate assumed that contributions from plan members and those of the
contributing employers and the non-employer contributing entity will be made at the rate set by the legislature
during the 2019 legislative session. It is assumed that future employer and state contribution will be 8.50 percent
of payroll in the fiscal year 2020 gradually increasing to 9.55 percent of payroll over the next several years.
This includes all employer and state contribution for all active and rehired retirees. Based on those assumptions,
the pension plan’s fiduciary net position was projected to be available to make all projected future benefits
payment of current plan members. Therefore, the long-term expected rate of return on pension plan investments
was applied to all periods of projected benefit payments to determine the total pension liability.
The long-term expected rate of return on pension plan investments is 7.25 percent. The long-term expected rate
of return on plan investments was determined using a building-block method in which best-estimate ranges of
expected future real rates of return (expected returns, net of pension plan investment expense, and inflation) are
developed for each major asset class. These ranges are combined to produce the long-term expected rate of
return by weighting the expected future real rates of return by the target asset allocation percentage and by
adding expected inflation. Best estimates of geometric real rates of return for each major asset class included
in the System's target asset allocation as of August 31, 2019 are summarized below:
FY 2019 Long-Term
Target New Target Expected Geometric Real
Asset Class Allocation* % Allocation** % Rate of Return***
Global Equity
U.S. 18.00% 18.00% 6.40%
Non-U.S. Developed 13.00% 13.00% 6.30%
Emerging Markets 9.00% 9.00% 7.30%
Directional Hedge Funds 4.00%
Private Equity 13.00% 14.00% 8.40%
Stable Value
U.S. Treasuries **** 11.00% 16.00% 3.10%
Stable Value Hedge Funds 4.00% 5.00% 4.50%
Real Return
Global Inflation Linked Bonds **** 3.00%
Real Estate 14.00% 15.00% 8.50%
Energy and Natural Resources 5.00% 6.00% 7.30%
Risk Parity
Risk Parity 5.00% 8.00% 5.8%/6.5%*****
Asset Allocation Leverage
Cash 1.00% 2.00% 2.50%
Asset Allocation Leverage 6.00% 2.70%
Total 100.00%
** New target allocation based on Strategic Asset Allocation dated 10/1/2019
*** 10-Year annualized geometric nominal returns include the real rate of return and inflation of 2.1%
**** New Target Allocation groups Government Bonds within the stable value allocation. This includes global sovereign nominal and inflation-linked bonds
***** 5.80% (6.50%) return expectation corresponds to Risk Parity with a 10% (12%) target volatility
* FY 2019 Target Allocation based on the Strategic Asset Allocation dated on 10/1/2018
47
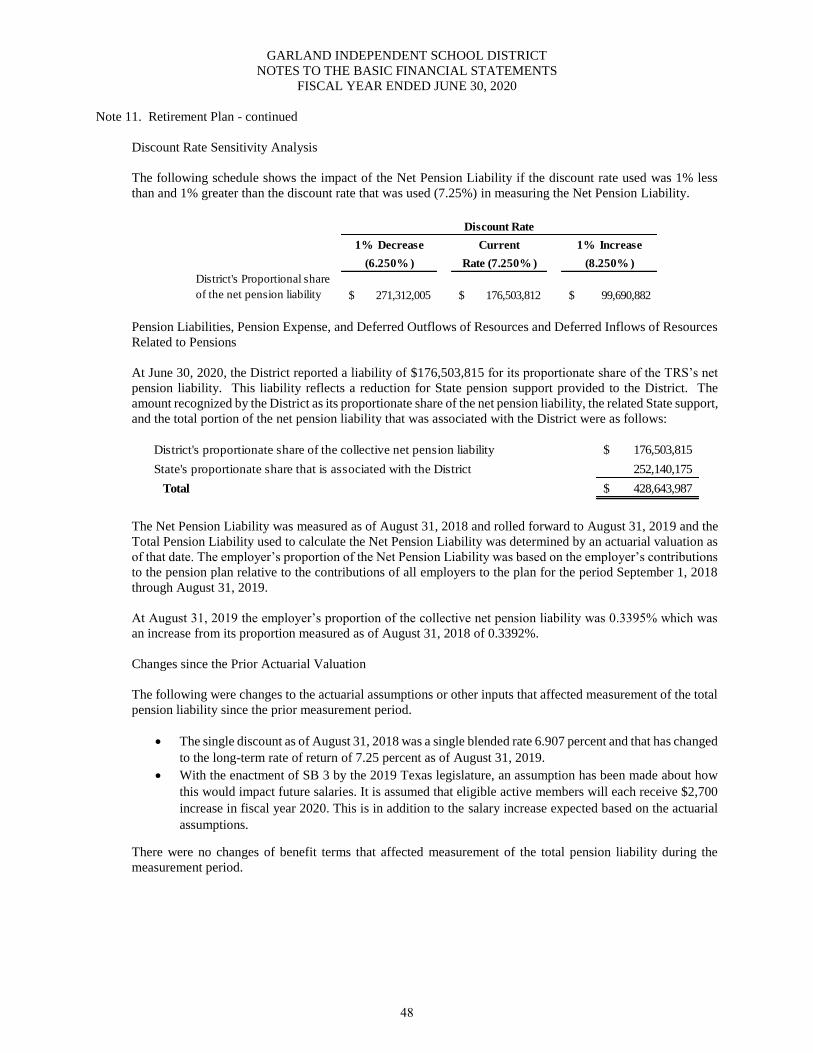
GARLAND INDEPENDENT SCHOOL DISTRICT
NOTES TO THE BASIC FINANCIAL STATEMENTS
FISCAL YEAR ENDED JUNE 30, 2020
Note 11. Retirement Plan - continued
Discount Rate Sensitivity Analysis
The following schedule shows the impact of the Net Pension Liability if the discount rate used was 1% less
than and 1% greater than the discount rate that was used (7.25%) in measuring the Net Pension Liability.
1% Decrease Current 1% Increase
(6.250% ) Rate (7.250% ) (8.250% )
District's Proportional share
of the net pension liability 271,312,005$ 176,503,812$ 99,690,882$
Discount Rate
Pension Liabilities, Pension Expense, and Deferred Outflows of Resources and Deferred Inflows of Resources
Related to Pensions
At June 30, 2020, the District reported a liability of $176,503,815 for its proportionate share of the TRS’s net
pension liability. This liability reflects a reduction for State pension support provided to the District. The
amount recognized by the District as its proportionate share of the net pension liability, the related State support,
and the total portion of the net pension liability that was associated with the District were as follows:
District's proportionate share of the collective net pension liability 176,503,815$
State's proportionate share that is associated with the District 252,140,175
Total 428,643,987$
The Net Pension Liability was measured as of August 31, 2018 and rolled forward to August 31, 2019 and the
Total Pension Liability used to calculate the Net Pension Liability was determined by an actuarial valuation as
of that date. The employer’s proportion of the Net Pension Liability was based on the employer’s contributions
to the pension plan relative to the contributions of all employers to the plan for the period September 1, 2018
through August 31, 2019.
At August 31, 2019 the employer’s proportion of the collective net pension liability was 0.3395% which was
an increase from its proportion measured as of August 31, 2018 of 0.3392%.
Changes since the Prior Actuarial Valuation
The following were changes to the actuarial assumptions or other inputs that affected measurement of the total
pension liability since the prior measurement period.
The single discount as of August 31, 2018 was a single blended rate 6.907 percent and that has changed
to the long-term rate of return of 7.25 percent as of August 31, 2019.
With the enactment of SB 3 by the 2019 Texas legislature, an assumption has been made about how
this would impact future salaries. It is assumed that eligible active members will each receive $2,700
increase in fiscal year 2020. This is in addition to the salary increase expected based on the actuarial
assumptions.
There were no changes of benefit terms that affected measurement of the total pension liability during the
measurement period.
48
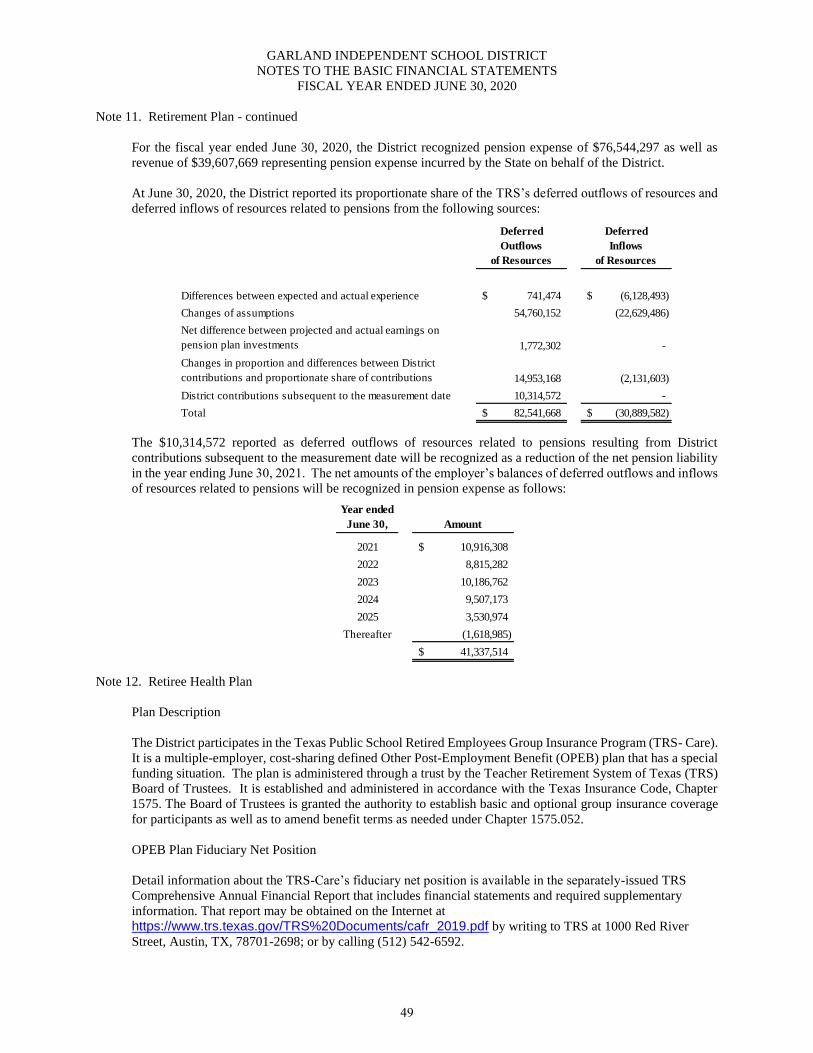
GARLAND INDEPENDENT SCHOOL DISTRICT
NOTES TO THE BASIC FINANCIAL STATEMENTS
FISCAL YEAR ENDED JUNE 30, 2020
Note 11. Retirement Plan - continued
For the fiscal year ended June 30, 2020, the District recognized pension expense of $76,544,297 as well as
revenue of $39,607,669 representing pension expense incurred by the State on behalf of the District.
At June 30, 2020, the District reported its proportionate share of the TRS’s deferred outflows of resources and
deferred inflows of resources related to pensions from the following sources:
Deferred
Outflows
of Resources
Deferred
Inflows
of Resources
Differences between expected and actual experience 741,474$ (6,128,493)$
Changes of assumptions 54,760,152 (22,629,486)
Net difference between projected and actual earnings on
pension plan investments 1,772,302 -
Changes in proportion and differences between District
contributions and proportionate share of contributions 14,953,168 (2,131,603)
District contributions subsequent to the measurement date 10,314,572 -
Total 82,541,668$ (30,889,582)$
The $10,314,572 reported as deferred outflows of resources related to pensions resulting from District
contributions subsequent to the measurement date will be recognized as a reduction of the net pension liability
in the year ending June 30, 2021. The net amounts of the employer’s balances of deferred outflows and inflows
of resources related to pensions will be recognized in pension expense as follows:
Year ended
June 30, Amount
2021 10,916,308$
2022 8,815,282
2023 10,186,762
2024 9,507,173
2025 3,530,974
Thereafter (1,618,985)
41,337,514$
Note 12. Retiree Health Plan
Plan Description
The District participates in the Texas Public School Retired Employees Group Insurance Program (TRS- Care).
It is a multiple-employer, cost-sharing defined Other Post-Employment Benefit (OPEB) plan that has a special
funding situation. The plan is administered through a trust by the Teacher Retirement System of Texas (TRS)
Board of Trustees. It is established and administered in accordance with the Texas Insurance Code, Chapter
1575. The Board of Trustees is granted the authority to establish basic and optional group insurance coverage
for participants as well as to amend benefit terms as needed under Chapter 1575.052.
OPEB Plan Fiduciary Net Position
Detail information about the TRS-Care’s fiduciary net position is available in the separately-issued TRS
Comprehensive Annual Financial Report that includes financial statements and required supplementary
information. That report may be obtained on the Internet at
https://www.trs.texas.gov/TRS%20Documents/cafr_2019.pdf by writing to TRS at 1000 Red River
Street, Austin, TX, 78701-2698; or by calling (512) 542-6592.
49
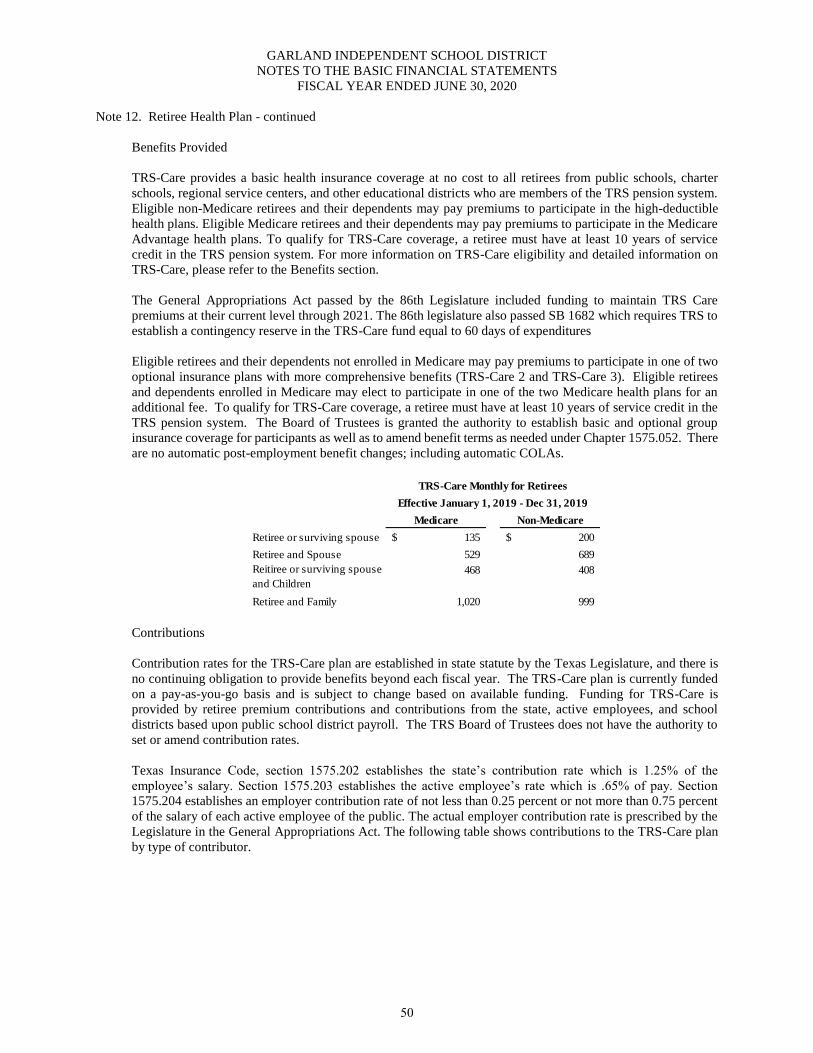
GARLAND INDEPENDENT SCHOOL DISTRICT
NOTES TO THE BASIC FINANCIAL STATEMENTS
FISCAL YEAR ENDED JUNE 30, 2020
Note 12. Retiree Health Plan - continued
Benefits Provided
TRS-Care provides a basic health insurance coverage at no cost to all retirees from public schools, charter
schools, regional service centers, and other educational districts who are members of the TRS pension system.
Eligible non-Medicare retirees and their dependents may pay premiums to participate in the high-deductible
health plans. Eligible Medicare retirees and their dependents may pay premiums to participate in the Medicare
Advantage health plans. To qualify for TRS-Care coverage, a retiree must have at least 10 years of service
credit in the TRS pension system. For more information on TRS-Care eligibility and detailed information on
TRS-Care, please refer to the Benefits section.
The General Appropriations Act passed by the 86th Legislature included funding to maintain TRS Care
premiums at their current level through 2021. The 86th legislature also passed SB 1682 which requires TRS to
establish a contingency reserve in the TRS-Care fund equal to 60 days of expenditures
Eligible retirees and their dependents not enrolled in Medicare may pay premiums to participate in one of two
optional insurance plans with more comprehensive benefits (TRS-Care 2 and TRS-Care 3). Eligible retirees
and dependents enrolled in Medicare may elect to participate in one of the two Medicare health plans for an
additional fee. To qualify for TRS-Care coverage, a retiree must have at least 10 years of service credit in the
TRS pension system. The Board of Trustees is granted the authority to establish basic and optional group
insurance coverage for participants as well as to amend benefit terms as needed under Chapter 1575.052. There
are no automatic post-employment benefit changes; including automatic COLAs.
Medicare Non-Medicare
Retiree or surviving spouse 135$ 200$
Retiree and Spouse 529 689
Reitiree or surviving spouse
and Children
468 408
Retiree and Family 1,020 999
TRS-Care Monthly for Retirees
Effective January 1, 2019 - Dec 31, 2019
Contributions
Contribution rates for the TRS-Care plan are established in state statute by the Texas Legislature, and there is
no continuing obligation to provide benefits beyond each fiscal year. The TRS-Care plan is currently funded
on a pay-as-you-go basis and is subject to change based on available funding. Funding for TRS-Care is
provided by retiree premium contributions and contributions from the state, active employees, and school
districts based upon public school district payroll. The TRS Board of Trustees does not have the authority to
set or amend contribution rates.
Texas Insurance Code, section 1575.202 establishes the state’s contribution rate which is 1.25% of the
employee’s salary. Section 1575.203 establishes the active employee’s rate which is .65% of pay. Section
1575.204 establishes an employer contribution rate of not less than 0.25 percent or not more than 0.75 percent
of the salary of each active employee of the public. The actual employer contribution rate is prescribed by the
Legislature in the General Appropriations Act. The following table shows contributions to the TRS-Care plan
by type of contributor.
50
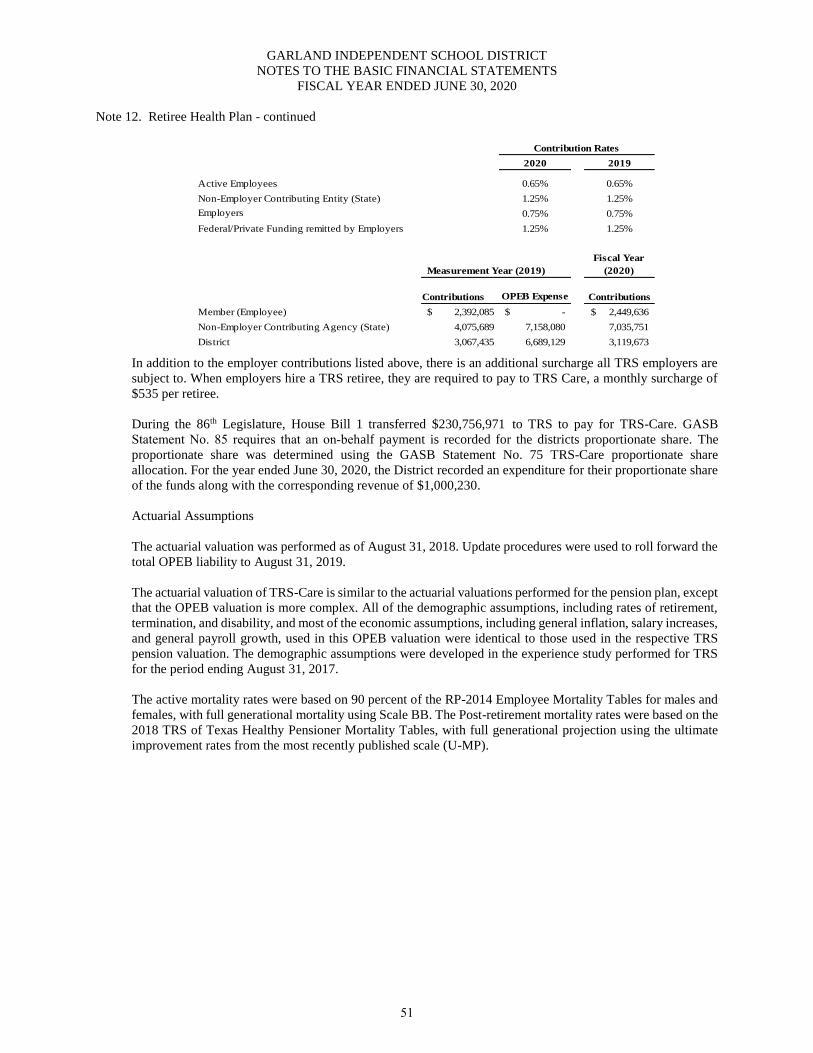
GARLAND INDEPENDENT SCHOOL DISTRICT
NOTES TO THE BASIC FINANCIAL STATEMENTS
FISCAL YEAR ENDED JUNE 30, 2020
Note 12. Retiree Health Plan - continued
2020
Active Employees 0.65%
Non-Employer Contributing Entity (State) 1.25%
Employers 0.75%
Federal/Private Funding remitted by Employers 1.25%
Contributions OPEB Expense
Member (Employee) -$
Non-Employer Contributing Agency (State) 7,158,080
District 6,689,129
Contribution Rates
2,449,636$ 2,392,085$
7,035,751
3,119,673
2019
0.65%
1.25%
0.75%
1.25%
4,075,689
3,067,435
Measurement Year (2019)
Fiscal Year
(2020)
Contributions
In addition to the employer contributions listed above, there is an additional surcharge all TRS employers are
subject to. When employers hire a TRS retiree, they are required to pay to TRS Care, a monthly surcharge of
$535 per retiree.
During the 86th Legislature, House Bill 1 transferred $230,756,971 to TRS to pay for TRS-Care. GASB
Statement No. 85 requires that an on‐behalf payment is recorded for the districts proportionate share. The
proportionate share was determined using the GASB Statement No. 75 TRS-Care proportionate share
allocation. For the year ended June 30, 2020, the District recorded an expenditure for their proportionate share
of the funds along with the corresponding revenue of $1,000,230.
Actuarial Assumptions
The actuarial valuation was performed as of August 31, 2018. Update procedures were used to roll forward the
total OPEB liability to August 31, 2019.
The actuarial valuation of TRS-Care is similar to the actuarial valuations performed for the pension plan, except
that the OPEB valuation is more complex. All of the demographic assumptions, including rates of retirement,
termination, and disability, and most of the economic assumptions, including general inflation, salary increases,
and general payroll growth, used in this OPEB valuation were identical to those used in the respective TRS
pension valuation. The demographic assumptions were developed in the experience study performed for TRS
for the period ending August 31, 2017.
The active mortality rates were based on 90 percent of the RP-2014 Employee Mortality Tables for males and
females, with full generational mortality using Scale BB. The Post-retirement mortality rates were based on the
2018 TRS of Texas Healthy Pensioner Mortality Tables, with full generational projection using the ultimate
improvement rates from the most recently published scale (U-MP).
51
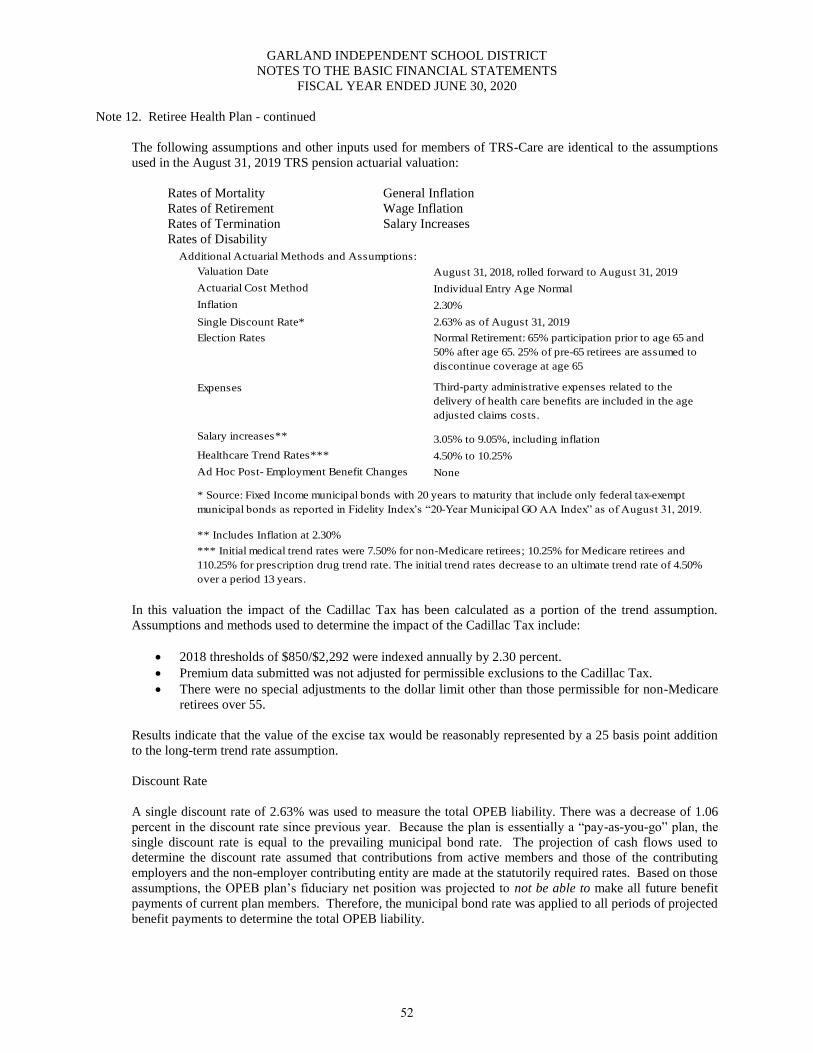
GARLAND INDEPENDENT SCHOOL DISTRICT
NOTES TO THE BASIC FINANCIAL STATEMENTS
FISCAL YEAR ENDED JUNE 30, 2020
Note 12. Retiree Health Plan - continued
The following assumptions and other inputs used for members of TRS-Care are identical to the assumptions
used in the August 31, 2019 TRS pension actuarial valuation:
Rates of Mortality General Inflation
Rates of Retirement Wage Inflation
Rates of Termination Salary Increases
Rates of Disability
Additional Actuarial Methods and Assumptions:
Valuation Date August 31, 2018, rolled forward to August 31, 2019
Actuarial Cost Method Individual Entry Age Normal
Inflation 2.30%
Single Discount Rate* 2.63% as of August 31, 2019
Election Rates Normal Retirement: 65% participation prior to age 65 and
50% after age 65. 25% of pre-65 retirees are assumed to
discontinue coverage at age 65
Expenses Third-party administrative expenses related to the
delivery of health care benefits are included in the age
adjusted claims costs.
Salary increases** 3.05% to 9.05%, including inflation
Healthcare Trend Rates*** 4.50% to 10.25%
Ad Hoc Post- Employment Benefit Changes None
** Includes Inflation at 2.30%
*** Initial medical trend rates were 7.50% for non-Medicare retirees; 10.25% for Medicare retirees and
110.25% for prescription drug trend rate. The initial trend rates decrease to an ultimate trend rate of 4.50%
over a period 13 years.
* Source: Fixed Income municipal bonds with 20 years to maturity that include only federal tax-exempt
municipal bonds as reported in Fidelity Index’s “20-Year Municipal GO AA Index” as of August 31, 2019.
In this valuation the impact of the Cadillac Tax has been calculated as a portion of the trend assumption.
Assumptions and methods used to determine the impact of the Cadillac Tax include:
2018 thresholds of $850/$2,292 were indexed annually by 2.30 percent.
Premium data submitted was not adjusted for permissible exclusions to the Cadillac Tax.
There were no special adjustments to the dollar limit other than those permissible for non-Medicare
retirees over 55.
Results indicate that the value of the excise tax would be reasonably represented by a 25 basis point addition
to the long-term trend rate assumption.
Discount Rate
A single discount rate of 2.63% was used to measure the total OPEB liability. There was a decrease of 1.06
percent in the discount rate since previous year. Because the plan is essentially a “pay-as-you-go” plan, the
single discount rate is equal to the prevailing municipal bond rate. The projection of cash flows used to
determine the discount rate assumed that contributions from active members and those of the contributing
employers and the non-employer contributing entity are made at the statutorily required rates. Based on those
assumptions, the OPEB plan’s fiduciary net position was projected to not be able to make all future benefit
payments of current plan members. Therefore, the municipal bond rate was applied to all periods of projected
benefit payments to determine the total OPEB liability.
52
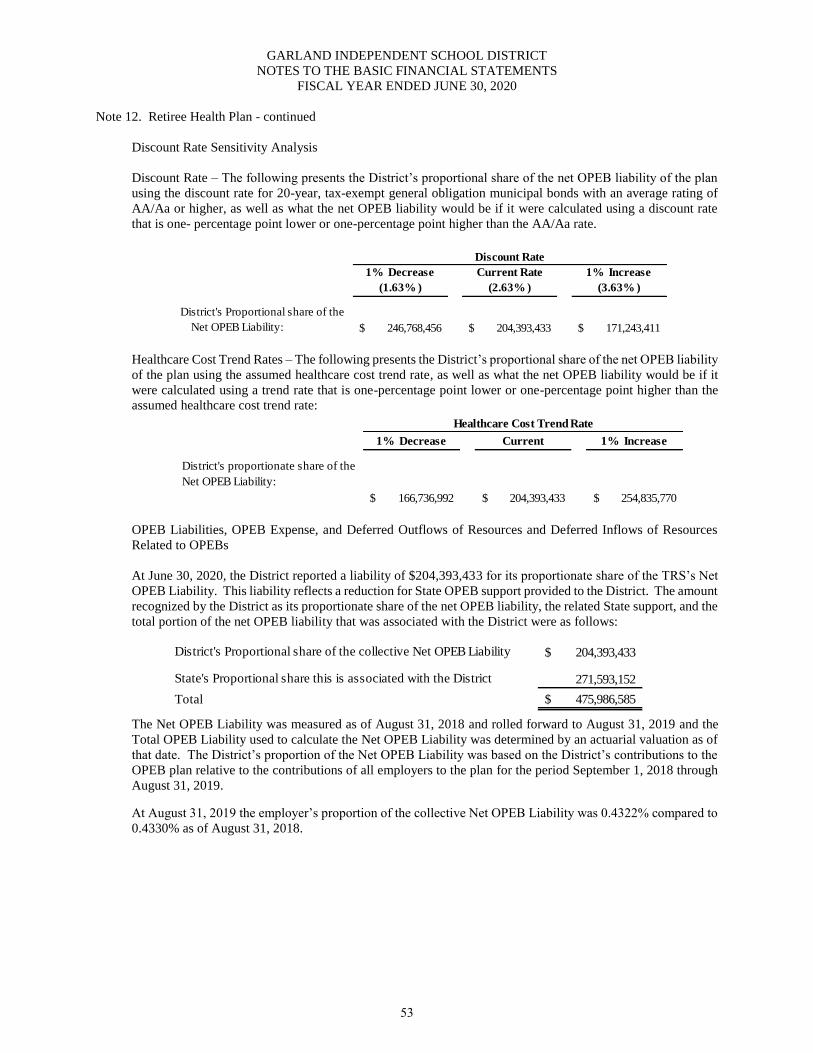
GARLAND INDEPENDENT SCHOOL DISTRICT
NOTES TO THE BASIC FINANCIAL STATEMENTS
FISCAL YEAR ENDED JUNE 30, 2020
Note 12. Retiree Health Plan - continued
Discount Rate Sensitivity Analysis
Discount Rate – The following presents the District’s proportional share of the net OPEB liability of the plan
using the discount rate for 20-year, tax-exempt general obligation municipal bonds with an average rating of
AA/Aa or higher, as well as what the net OPEB liability would be if it were calculated using a discount rate
that is one- percentage point lower or one-percentage point higher than the AA/Aa rate.
1% Decrease
(1.63% )
Current Rate
(2.63% )
1% Increase
(3.63% )
District's Proportional share of the
Net OPEB Liability: 246,768,456$ 204,393,433$ 171,243,411$
Discount Rate
Healthcare Cost Trend Rates – The following presents the District’s proportional share of the net OPEB liability
of the plan using the assumed healthcare cost trend rate, as well as what the net OPEB liability would be if it
were calculated using a trend rate that is one-percentage point lower or one-percentage point higher than the
assumed healthcare cost trend rate:
1% Decrease Current 1% Increase
District's proportionate share of the
Net OPEB Liability:
166,736,992$ 204,393,433$ 254,835,770$
Healthcare Cost Trend Rate
OPEB Liabilities, OPEB Expense, and Deferred Outflows of Resources and Deferred Inflows of Resources
Related to OPEBs
At June 30, 2020, the District reported a liability of $204,393,433 for its proportionate share of the TRS’s Net
OPEB Liability. This liability reflects a reduction for State OPEB support provided to the District. The amount
recognized by the District as its proportionate share of the net OPEB liability, the related State support, and the
total portion of the net OPEB liability that was associated with the District were as follows:
District's Proportional share of the collective Net OPEB Liability 204,393,433$
State's Proportional share this is associated with the District 271,593,152
Total 475,986,585$
The Net OPEB Liability was measured as of August 31, 2018 and rolled forward to August 31, 2019 and the
Total OPEB Liability used to calculate the Net OPEB Liability was determined by an actuarial valuation as of
that date. The District’s proportion of the Net OPEB Liability was based on the District’s contributions to the
OPEB plan relative to the contributions of all employers to the plan for the period September 1, 2018 through
August 31, 2019.
At August 31, 2019 the employer’s proportion of the collective Net OPEB Liability was 0.4322% compared to
0.4330% as of August 31, 2018.
53
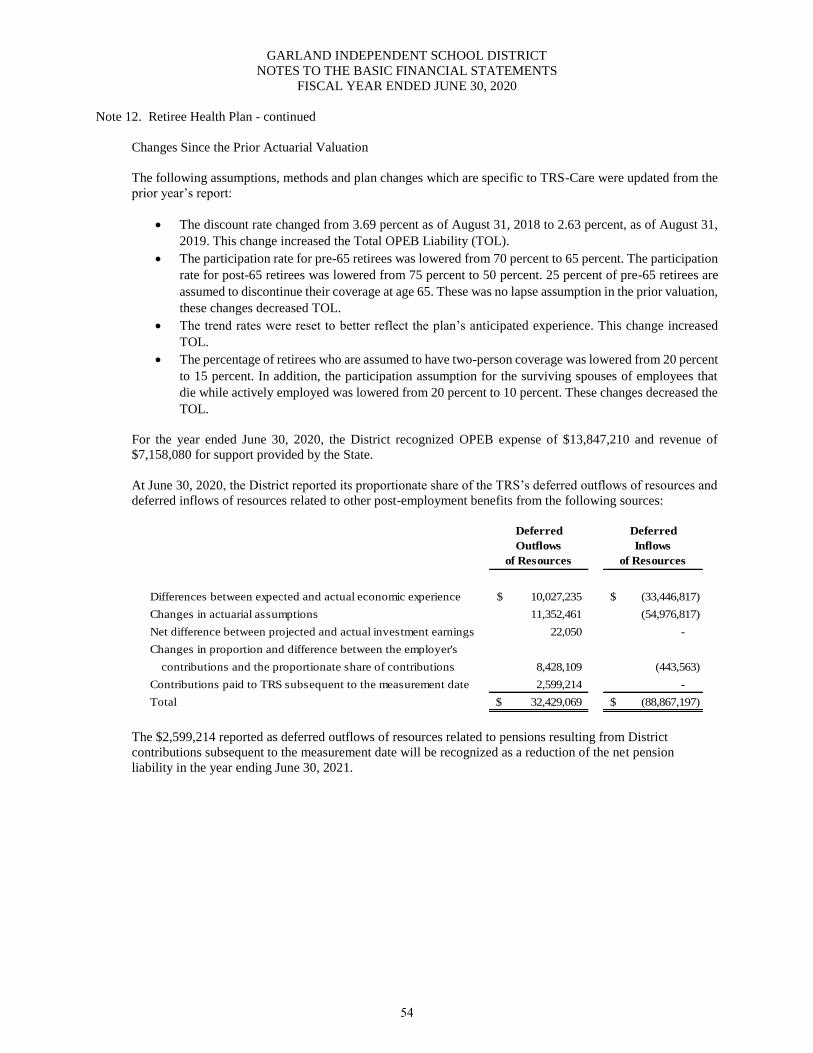
GARLAND INDEPENDENT SCHOOL DISTRICT
NOTES TO THE BASIC FINANCIAL STATEMENTS
FISCAL YEAR ENDED JUNE 30, 2020
Note 12. Retiree Health Plan - continued
Changes Since the Prior Actuarial Valuation
The following assumptions, methods and plan changes which are specific to TRS-Care were updated from the
prior year’s report:
The discount rate changed from 3.69 percent as of August 31, 2018 to 2.63 percent, as of August 31,
2019. This change increased the Total OPEB Liability (TOL).
The participation rate for pre-65 retirees was lowered from 70 percent to 65 percent. The participation
rate for post-65 retirees was lowered from 75 percent to 50 percent. 25 percent of pre-65 retirees are
assumed to discontinue their coverage at age 65. These was no lapse assumption in the prior valuation,
these changes decreased TOL.
The trend rates were reset to better reflect the plan’s anticipated experience. This change increased
TOL.
The percentage of retirees who are assumed to have two-person coverage was lowered from 20 percent
to 15 percent. In addition, the participation assumption for the surviving spouses of employees that
die while actively employed was lowered from 20 percent to 10 percent. These changes decreased the
TOL.
For the year ended June 30, 2020, the District recognized OPEB expense of $13,847,210 and revenue of
$7,158,080 for support provided by the State.
At June 30, 2020, the District reported its proportionate share of the TRS’s deferred outflows of resources and
deferred inflows of resources related to other post-employment benefits from the following sources:
Deferred
Outflows
of Resources
Deferred
Inflows
of Resources
Differences between expected and actual economic experience 10,027,235$ (33,446,817)$
Changes in actuarial assumptions 11,352,461 (54,976,817)
Net difference between projected and actual investment earnings 22,050 -
Changes in proportion and difference between the employer's
contributions and the proportionate share of contributions 8,428,109 (443,563)
Contributions paid to TRS subsequent to the measurement date 2,599,214 -
Total 32,429,069$ (88,867,197)$
The $2,599,214 reported as deferred outflows of resources related to pensions resulting from District
contributions subsequent to the measurement date will be recognized as a reduction of the net pension
liability in the year ending June 30, 2021.
54
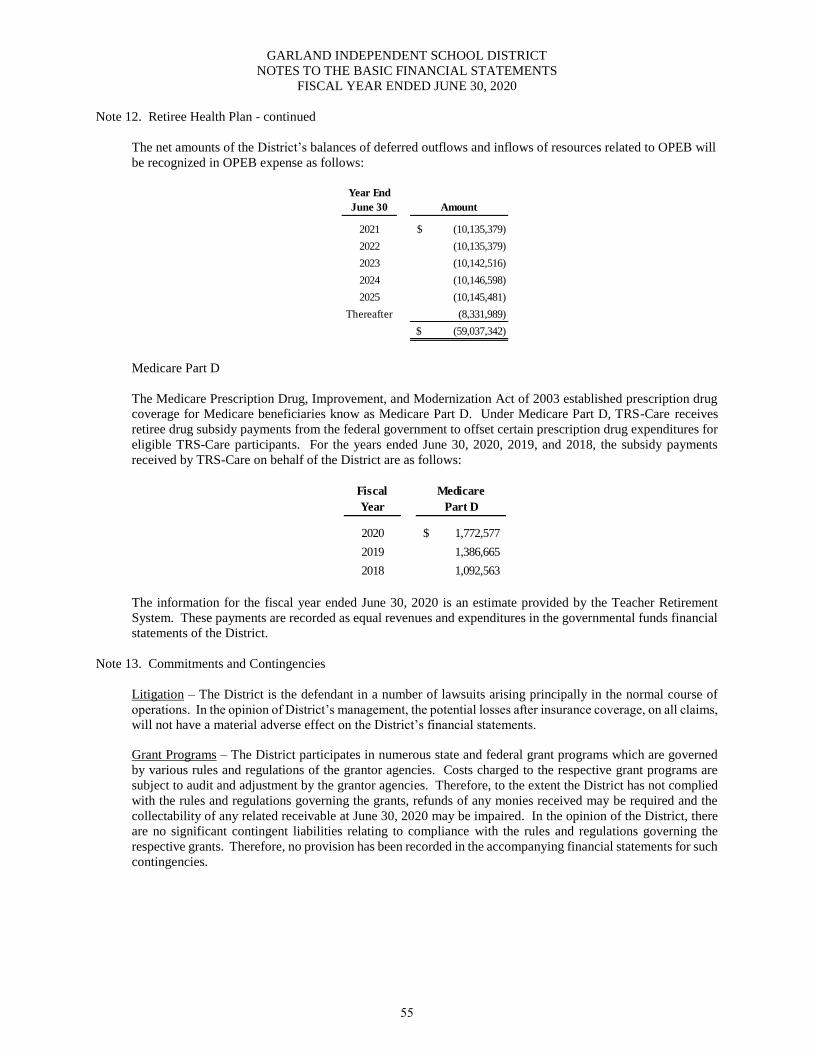
GARLAND INDEPENDENT SCHOOL DISTRICT
NOTES TO THE BASIC FINANCIAL STATEMENTS
FISCAL YEAR ENDED JUNE 30, 2020
Note 12. Retiree Health Plan - continued
The net amounts of the District’s balances of deferred outflows and inflows of resources related to OPEB will
be recognized in OPEB expense as follows:
Year End
June 30 Amount
2021 (10,135,379)$
2022 (10,135,379)
2023 (10,142,516)
2024 (10,146,598)
2025 (10,145,481)
Thereafter (8,331,989)
(59,037,342)$
Medicare Part D
The Medicare Prescription Drug, Improvement, and Modernization Act of 2003 established prescription drug
coverage for Medicare beneficiaries know as Medicare Part D. Under Medicare Part D, TRS-Care receives
retiree drug subsidy payments from the federal government to offset certain prescription drug expenditures for
eligible TRS-Care participants. For the years ended June 30, 2020, 2019, and 2018, the subsidy payments
received by TRS-Care on behalf of the District are as follows:
Fiscal
Year
Medicare
Part D
2020 1,772,577$
2019 1,386,665
2018 1,092,563
The information for the fiscal year ended June 30, 2020 is an estimate provided by the Teacher Retirement
System. These payments are recorded as equal revenues and expenditures in the governmental funds financial
statements of the District.
Note 13. Commitments and Contingencies
Litigation – The District is the defendant in a number of lawsuits arising principally in the normal course of
operations. In the opinion of District’s management, the potential losses after insurance coverage, on all claims,
will not have a material adverse effect on the District’s financial statements.
Grant Programs – The District participates in numerous state and federal grant programs which are governed
by various rules and regulations of the grantor agencies. Costs charged to the respective grant programs are
subject to audit and adjustment by the grantor agencies. Therefore, to the extent the District has not complied
with the rules and regulations governing the grants, refunds of any monies received may be required and the
collectability of any related receivable at June 30, 2020 may be impaired. In the opinion of the District, there
are no significant contingent liabilities relating to compliance with the rules and regulations governing the
respective grants. Therefore, no provision has been recorded in the accompanying financial statements for such
contingencies.
55
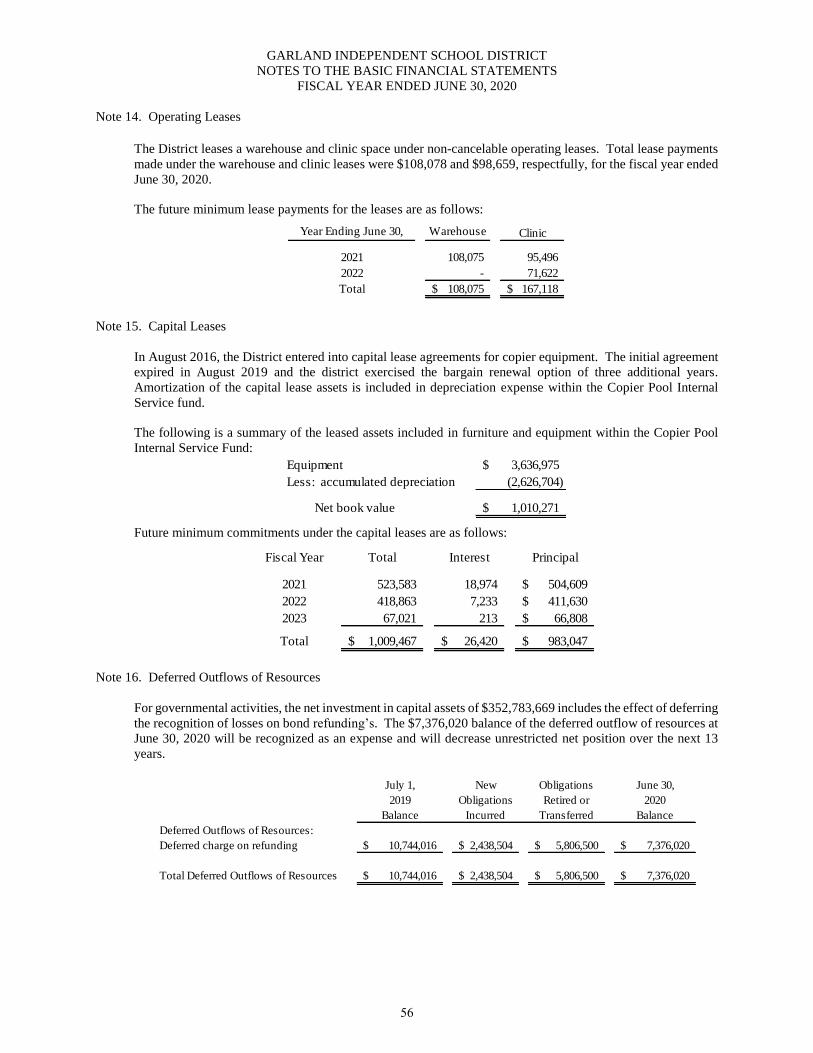
GARLAND INDEPENDENT SCHOOL DISTRICT
NOTES TO THE BASIC FINANCIAL STATEMENTS
FISCAL YEAR ENDED JUNE 30, 2020
Note 14. Operating Leases
The District leases a warehouse and clinic space under non-cancelable operating leases. Total lease payments
made under the warehouse and clinic leases were $108,078 and $98,659, respectfully, for the fiscal year ended
June 30, 2020.
The future minimum lease payments for the leases are as follows:
Year Ending June 30, Warehouse Clinic
2021 108,075 95,496
2022 - 71,622
Total 108,075$ 167,118$
Note 15. Capital Leases
In August 2016, the District entered into capital lease agreements for copier equipment. The initial agreement
expired in August 2019 and the district exercised the bargain renewal option of three additional years.
Amortization of the capital lease assets is included in depreciation expense within the Copier Pool Internal
Service fund.
The following is a summary of the leased assets included in furniture and equipment within the Copier Pool
Internal Service Fund:
Equipment 3,636,975$
Less: accumulated depreciation (2,626,704)
Net book value 1,010,271$
Future minimum commitments under the capital leases are as follows:
Fiscal Year Total Interest Principal
2021 523,583 18,974 504,609$
2022 418,863 7,233 411,630$
2023 67,021 213 66,808$
Total 1,009,467$ 26,420$ 983,047$
Note 16. Deferred Outflows of Resources
For governmental activities, the net investment in capital assets of $352,783,669 includes the effect of deferring
the recognition of losses on bond refunding’s. The $7,376,020 balance of the deferred outflow of resources at
June 30, 2020 will be recognized as an expense and will decrease unrestricted net position over the next 13
years.
July 1, New Obligations June 30,
2019 Obligations Retired or 2020
Balance Incurred Transferred Balance
Deferred Outflows of Resources:
Deferred charge on refunding 10,744,016$ 2,438,504$ 5,806,500$ 7,376,020$
Total Deferred Outflows of Resources 10,744,016$ 2,438,504$ 5,806,500$ 7,376,020$
56
GARLAND INDEPENDENT SCHOOL DISTRICT
NOTES TO THE BASIC FINANCIAL STATEMENTS
FISCAL YEAR ENDED JUNE 30, 2020
Note 17. Subsequent Events
In November 2020, the District issued $47,830,000 of Unlimited Tax Refunding Bonds, Series 2020 to refund
the remaining Unlimited Tax Refunding Bonds, Series 2012.
The District evaluated all subsequent events through December 15, 2020, the date these financial statements
were issued, and determined there to be no additional subsequent events requiring recognition or disclosure.
57
Required Supplementary Information
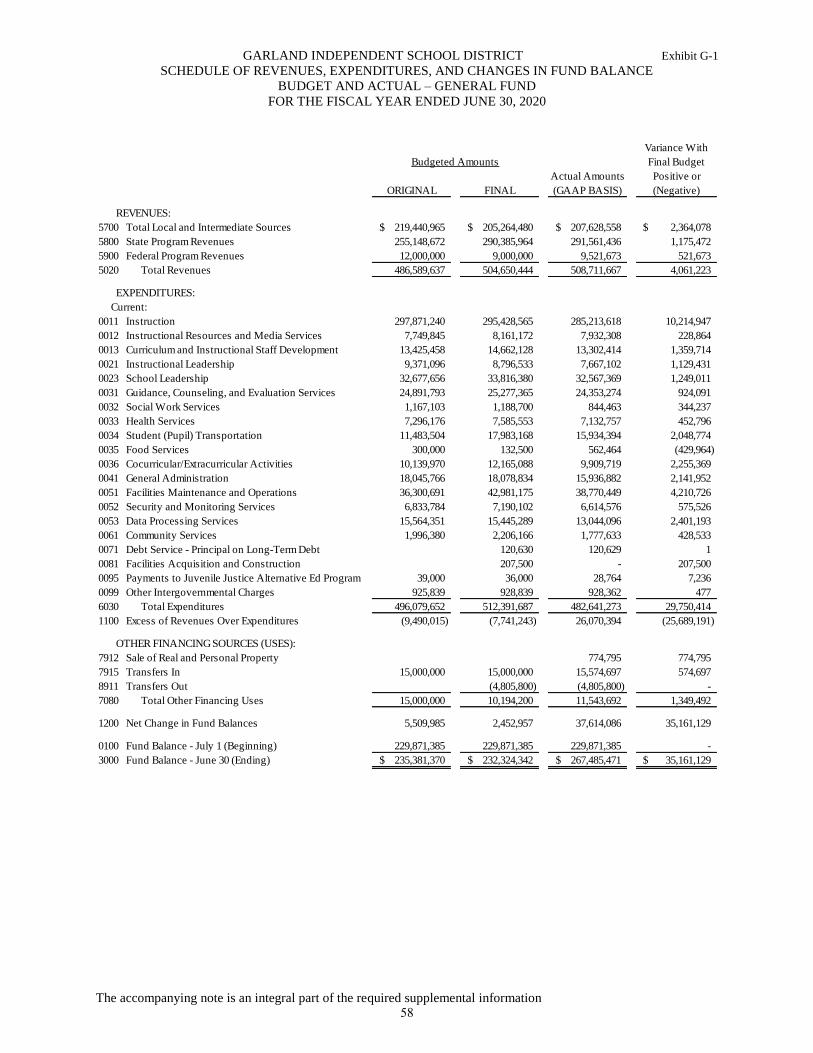
GARLAND INDEPENDENT SCHOOL DISTRICT Exhibit G-1
SCHEDULE OF REVENUES, EXPENDITURES, AND CHANGES IN FUND BALANCE
BUDGET AND ACTUAL – GENERAL FUND
FOR THE FISCAL YEAR ENDED JUNE 30, 2020
The accompanying note is an integral part of the required supplemental information
Variance With
Budgeted Amounts Final Budget
Actual Amounts Positive or
ORIGINAL FINAL (GAAP BASIS) (Negative)
REVENUES:
5700 Total Local and Intermediate Sources 219,440,965$ 205,264,480$ 207,628,558$ 2,364,078$
5800 State Program Revenues 255,148,672 290,385,964 291,561,436 1,175,472
5900 Federal Program Revenues 12,000,000 9,000,000 9,521,673 521,673
5020 Total Revenues 486,589,637 504,650,444 508,711,667 4,061,223
EXPENDITURES:
Current:
0011 Instruction 297,871,240 295,428,565 285,213,618 10,214,947
0012 Instructional Resources and Media Services 7,749,845 8,161,172 7,932,308 228,864
0013 Curriculum and Instructional Staff Development 13,425,458 14,662,128 13,302,414 1,359,714
0021 Instructional Leadership 9,371,096 8,796,533 7,667,102 1,129,431
0023 School Leadership 32,677,656 33,816,380 32,567,369 1,249,011
0031 Guidance, Counseling, and Evaluation Services 24,891,793 25,277,365 24,353,274 924,091
0032 Social Work Services 1,167,103 1,188,700 844,463 344,237
0033 Health Services 7,296,176 7,585,553 7,132,757 452,796
0034 Student (Pupil) Transportation 11,483,504 17,983,168 15,934,394 2,048,774
0035 Food Services 300,000 132,500 562,464 (429,964)
0036 Cocurricular/Extracurricular Activities 10,139,970 12,165,088 9,909,719 2,255,369
0041 General Administration 18,045,766 18,078,834 15,936,882 2,141,952
0051 Facilities Maintenance and Operations 36,300,691 42,981,175 38,770,449 4,210,726
0052 Security and Monitoring Services 6,833,784 7,190,102 6,614,576 575,526
0053 Data Processing Services 15,564,351 15,445,289 13,044,096 2,401,193
0061 Community Services 1,996,380 2,206,166 1,777,633 428,533
0071 Debt Service - Principal on Long-Term Debt 120,630 120,629 1
0081 Facilities Acquisition and Construction 207,500 - 207,500
0095 Payments to Juvenile Justice Alternative Ed Program 39,000 36,000 28,764 7,236
0099 Other Intergovernmental Charges 925,839 928,839 928,362 477
6030 Total Expenditures 496,079,652 512,391,687 482,641,273 29,750,414
1100 Excess of Revenues Over Expenditures (9,490,015) (7,741,243) 26,070,394 (25,689,191)
OTHER FINANCING SOURCES (USES):
7912 Sale of Real and Personal Property 774,795 774,795
7915 Transfers In 15,000,000 15,000,000 15,574,697 574,697
8911 Transfers Out (4,805,800) (4,805,800) -
7080 Total Other Financing Uses 15,000,000 10,194,200 11,543,692 1,349,492
1200 Net Change in Fund Balances 5,509,985 2,452,957 37,614,086 35,161,129
0100 Fund Balance - July 1 (Beginning) 229,871,385 229,871,385 229,871,385 -
3000 Fund Balance - June 30 (Ending) 235,381,370$ 232,324,342$ 267,485,471$ 35,161,129$
58
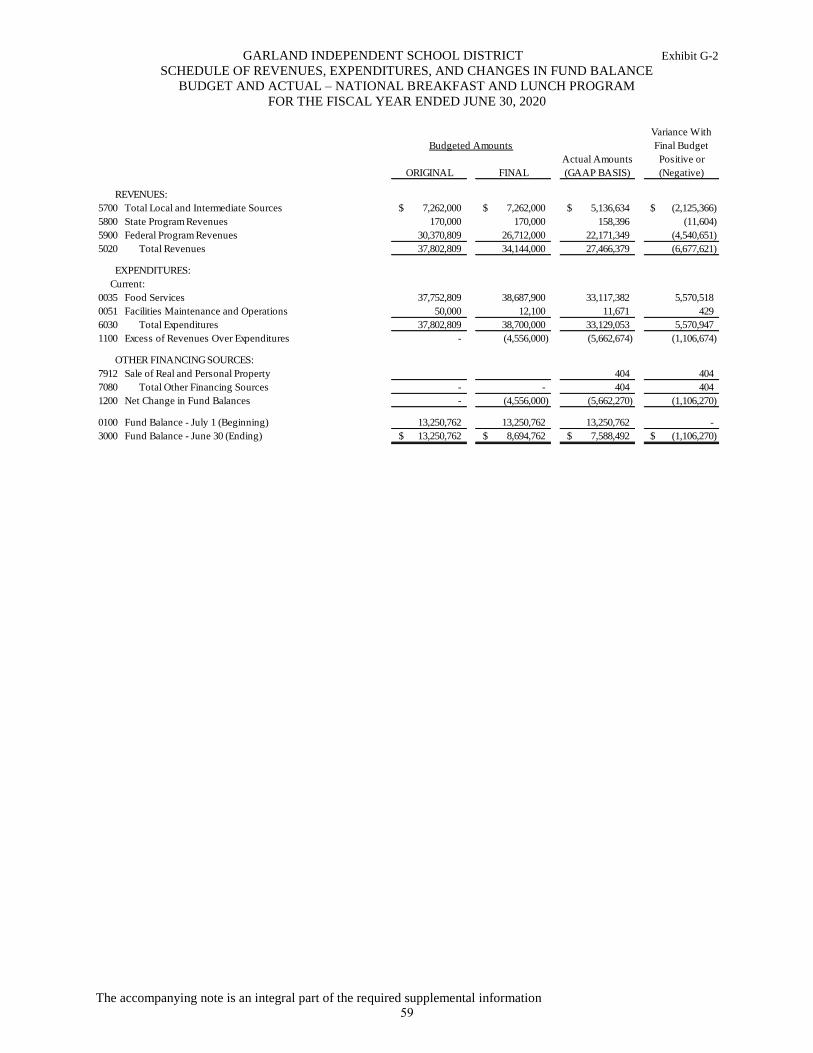
GARLAND INDEPENDENT SCHOOL DISTRICT Exhibit G-2
SCHEDULE OF REVENUES, EXPENDITURES, AND CHANGES IN FUND BALANCE
BUDGET AND ACTUAL – NATIONAL BREAKFAST AND LUNCH PROGRAM
FOR THE FISCAL YEAR ENDED JUNE 30, 2020
The accompanying note is an integral part of the required supplemental information
Variance With
Budgeted Amounts Final Budget
Actual Amounts Positive or
ORIGINAL FINAL (GAAP BASIS) (Negative)
REVENUES:
5700 Total Local and Intermediate Sources 7,262,000$ 7,262,000$ 5,136,634$ (2,125,366)$
5800 State Program Revenues 170,000 170,000 158,396 (11,604)
5900 Federal Program Revenues 30,370,809 26,712,000 22,171,349 (4,540,651)
5020 Total Revenues 37,802,809 34,144,000 27,466,379 (6,677,621)
EXPENDITURES:
Current:
0035 Food Services 37,752,809 38,687,900 33,117,382 5,570,518
0051 Facilities Maintenance and Operations 50,000 12,100 11,671 429
6030 Total Expenditures 37,802,809 38,700,000 33,129,053 5,570,947
1100 Excess of Revenues Over Expenditures - (4,556,000) (5,662,674) (1,106,674)
OTHER FINANCING SOURCES:
7912 Sale of Real and Personal Property 404 404
7080 Total Other Financing Sources - - 404 404
1200 Net Change in Fund Balances - (4,556,000) (5,662,270) (1,106,270)
0100 Fund Balance - July 1 (Beginning) 13,250,762 13,250,762 13,250,762 -
3000 Fund Balance - June 30 (Ending) 13,250,762$ 8,694,762$ 7,588,492$ (1,106,270)$
59
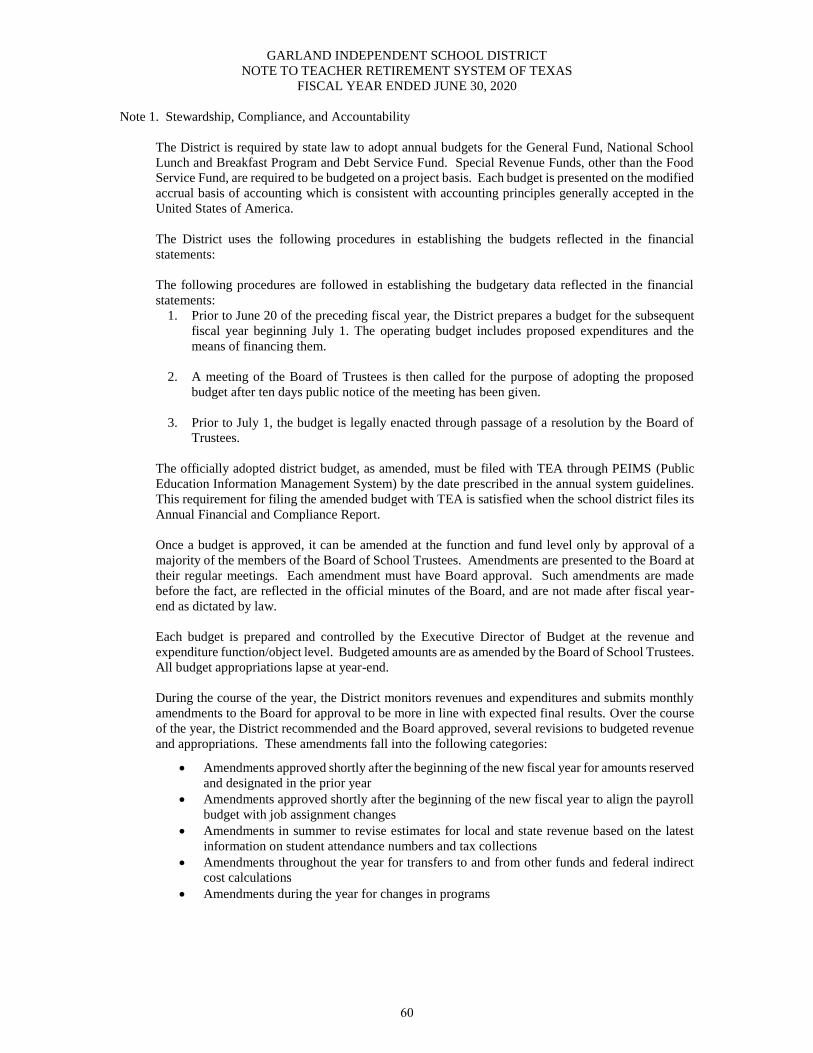
GARLAND INDEPENDENT SCHOOL DISTRICT
NOTE TO TEACHER RETIREMENT SYSTEM OF TEXAS
FISCAL YEAR ENDED JUNE 30, 2020
Note 1. Stewardship, Compliance, and Accountability
The District is required by state law to adopt annual budgets for the General Fund, National School
Lunch and Breakfast Program and Debt Service Fund. Special Revenue Funds, other than the Food
Service Fund, are required to be budgeted on a project basis. Each budget is presented on the modified
accrual basis of accounting which is consistent with accounting principles generally accepted in the
United States of America.
The District uses the following procedures in establishing the budgets reflected in the financial
statements:
The following procedures are followed in establishing the budgetary data reflected in the financial
statements:
1. Prior to June 20 of the preceding fiscal year, the District prepares a budget for the subsequent
fiscal year beginning July 1. The operating budget includes proposed expenditures and the
means of financing them.
2. A meeting of the Board of Trustees is then called for the purpose of adopting the proposed
budget after ten days public notice of the meeting has been given.
3. Prior to July 1, the budget is legally enacted through passage of a resolution by the Board of
Trustees.
The officially adopted district budget, as amended, must be filed with TEA through PEIMS (Public
Education Information Management System) by the date prescribed in the annual system guidelines.
This requirement for filing the amended budget with TEA is satisfied when the school district files its
Annual Financial and Compliance Report.
Once a budget is approved, it can be amended at the function and fund level only by approval of a
majority of the members of the Board of School Trustees. Amendments are presented to the Board at
their regular meetings. Each amendment must have Board approval. Such amendments are made
before the fact, are reflected in the official minutes of the Board, and are not made after fiscal year-
end as dictated by law.
Each budget is prepared and controlled by the Executive Director of Budget at the revenue and
expenditure function/object level. Budgeted amounts are as amended by the Board of School Trustees.
All budget appropriations lapse at year-end.
During the course of the year, the District monitors revenues and expenditures and submits monthly
amendments to the Board for approval to be more in line with expected final results. Over the course
of the year, the District recommended and the Board approved, several revisions to budgeted revenue
and appropriations. These amendments fall into the following categories:
Amendments approved shortly after the beginning of the new fiscal year for amounts reserved
and designated in the prior year
Amendments approved shortly after the beginning of the new fiscal year to align the payroll
budget with job assignment changes
Amendments in summer to revise estimates for local and state revenue based on the latest
information on student attendance numbers and tax collections
Amendments throughout the year for transfers to and from other funds and federal indirect
cost calculations
Amendments during the year for changes in programs
60
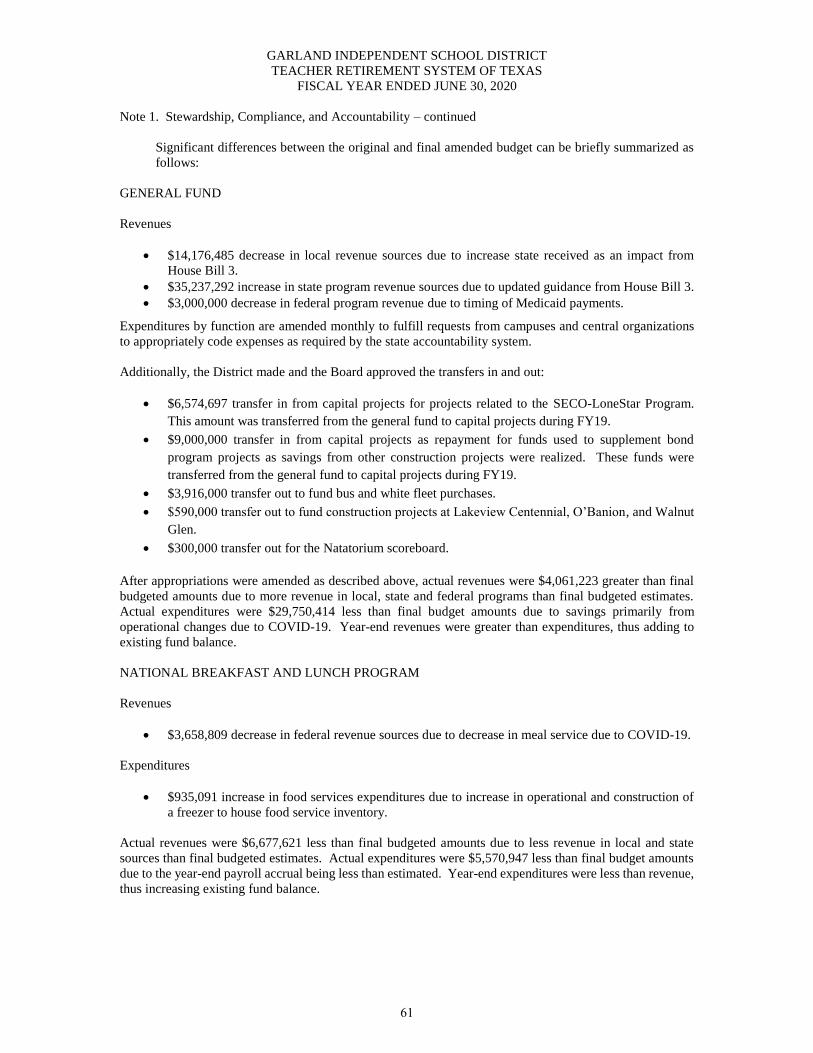
GARLAND INDEPENDENT SCHOOL DISTRICT
TEACHER RETIREMENT SYSTEM OF TEXAS
FISCAL YEAR ENDED JUNE 30, 2020
Note 1. Stewardship, Compliance, and Accountability – continued
Significant differences between the original and final amended budget can be briefly summarized as
follows:
GENERAL FUND
Revenues
$14,176,485 decrease in local revenue sources due to increase state received as an impact from
House Bill 3.
$35,237,292 increase in state program revenue sources due to updated guidance from House Bill 3.
$3,000,000 decrease in federal program revenue due to timing of Medicaid payments.
Expenditures by function are amended monthly to fulfill requests from campuses and central organizations
to appropriately code expenses as required by the state accountability system.
Additionally, the District made and the Board approved the transfers in and out:
$6,574,697 transfer in from capital projects for projects related to the SECO-LoneStar Program.
This amount was transferred from the general fund to capital projects during FY19.
$9,000,000 transfer in from capital projects as repayment for funds used to supplement bond
program projects as savings from other construction projects were realized. These funds were
transferred from the general fund to capital projects during FY19.
$3,916,000 transfer out to fund bus and white fleet purchases.
$590,000 transfer out to fund construction projects at Lakeview Centennial, O’Banion, and Walnut
Glen.
$300,000 transfer out for the Natatorium scoreboard.
After appropriations were amended as described above, actual revenues were $4,061,223 greater than final
budgeted amounts due to more revenue in local, state and federal programs than final budgeted estimates.
Actual expenditures were $29,750,414 less than final budget amounts due to savings primarily from
operational changes due to COVID-19. Year-end revenues were greater than expenditures, thus adding to
existing fund balance.
NATIONAL BREAKFAST AND LUNCH PROGRAM
Revenues
$3,658,809 decrease in federal revenue sources due to decrease in meal service due to COVID-19.
Expenditures
$935,091 increase in food services expenditures due to increase in operational and construction of
a freezer to house food service inventory.
Actual revenues were $6,677,621 less than final budgeted amounts due to less revenue in local and state
sources than final budgeted estimates. Actual expenditures were $5,570,947 less than final budget amounts
due to the year-end payroll accrual being less than estimated. Year-end expenditures were less than revenue,
thus increasing existing fund balance.
61
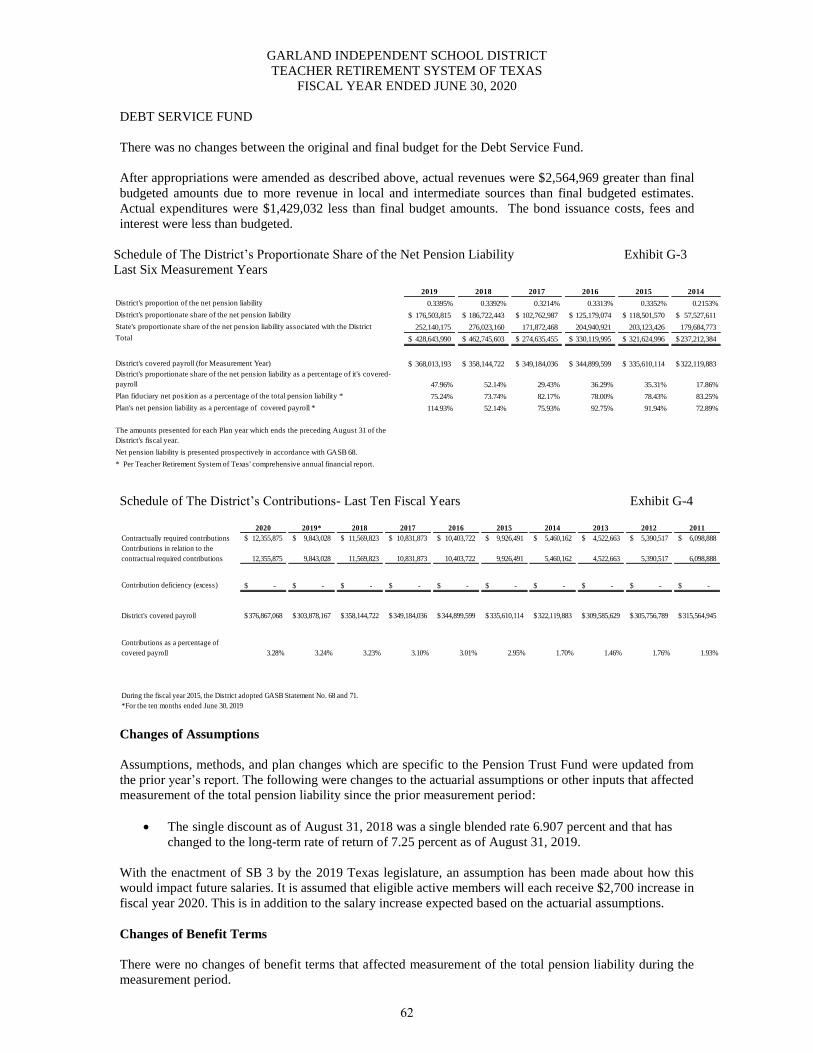
GARLAND INDEPENDENT SCHOOL DISTRICT
TEACHER RETIREMENT SYSTEM OF TEXAS
FISCAL YEAR ENDED JUNE 30, 2020
DEBT SERVICE FUND
There was no changes between the original and final budget for the Debt Service Fund.
After appropriations were amended as described above, actual revenues were $2,564,969 greater than final
budgeted amounts due to more revenue in local and intermediate sources than final budgeted estimates.
Actual expenditures were $1,429,032 less than final budget amounts. The bond issuance costs, fees and
interest were less than budgeted.
Schedule of The District’s Proportionate Share of the Net Pension Liability Exhibit G-3
Last Six Measurement Years
2019 2018 2017 2016 2015 2014
District's proportion of the net pension liability 0.3395% 0.3392% 0.3214% 0.3313% 0.3352% 0.2153%
District's proportionate share of the net pension liability 176,503,815$ 186,722,443$ 102,762,987$ 125,179,074$ 118,501,570$ 57,527,611$
State's proportionate share of the net pension liability associated with the District 252,140,175 276,023,160 171,872,468 204,940,921 203,123,426 179,684,773
Total 428,643,990$ 462,745,603$ 274,635,455$ 330,119,995$ 321,624,996$ 237,212,384$
District's covered payroll (for Measurement Year) 368,013,193$ 358,144,722$ 349,184,036$ 344,899,599$ 335,610,114$ 322,119,883$
District's proportionate share of the net pension liability as a percentage of it's covered-
payroll 47.96% 52.14% 29.43% 36.29% 35.31% 17.86%
Plan fiduciary net position as a percentage of the total pension liability * 75.24% 73.74% 82.17% 78.00% 78.43% 83.25%
Plan's net pension liability as a percentage of covered payroll * 114.93% 52.14% 75.93% 92.75% 91.94% 72.89%
The amounts presented for each Plan year which ends the preceding August 31 of the
District's fiscal year.
Net pension liability is presented prospectively in accordance with GASB 68.
* Per Teacher Retirement System of Texas' comprehensive annual financial report.
Schedule of The District’s Contributions- Last Ten Fiscal Years Exhibit G-4
2020 2019* 2018 2017 2016 2015 2014 2013 2012 2011
Contractually required contributions 12,355,875$ 9,843,028$ 11,569,823$ 10,831,873$ 10,403,722$ 9,926,491$ 5,460,162$ 4,522,663$ 5,390,517$ 6,098,888$
Contributions in relation to the
contractual required contributions 12,355,875 9,843,028 11,569,823 10,831,873 10,403,722 9,926,491 5,460,162 4,522,663 5,390,517 6,098,888
Contribution deficiency (excess) -$ -$ -$ -$ -$ -$ -$ -$ -$ -$
District's covered payroll 376,867,068$ 303,878,167$ 358,144,722$ 349,184,036$ 344,899,599$ 335,610,114$ 322,119,883$ 309,585,629$ 305,756,789$ 315,564,945$
Contributions as a percentage of
covered payroll 3.28% 3.24% 3.23% 3.10% 3.01% 2.95% 1.70% 1.46% 1.76% 1.93%
During the fiscal year 2015, the District adopted GASB Statement No. 68 and 71.
*For the ten months ended June 30, 2019
Changes of Assumptions
Assumptions, methods, and plan changes which are specific to the Pension Trust Fund were updated from
the prior year’s report. The following were changes to the actuarial assumptions or other inputs that affected
measurement of the total pension liability since the prior measurement period:
The single discount as of August 31, 2018 was a single blended rate 6.907 percent and that has
changed to the long-term rate of return of 7.25 percent as of August 31, 2019.
With the enactment of SB 3 by the 2019 Texas legislature, an assumption has been made about how this
would impact future salaries. It is assumed that eligible active members will each receive $2,700 increase in
fiscal year 2020. This is in addition to the salary increase expected based on the actuarial assumptions.
Changes of Benefit Terms
There were no changes of benefit terms that affected measurement of the total pension liability during the
measurement period.
62
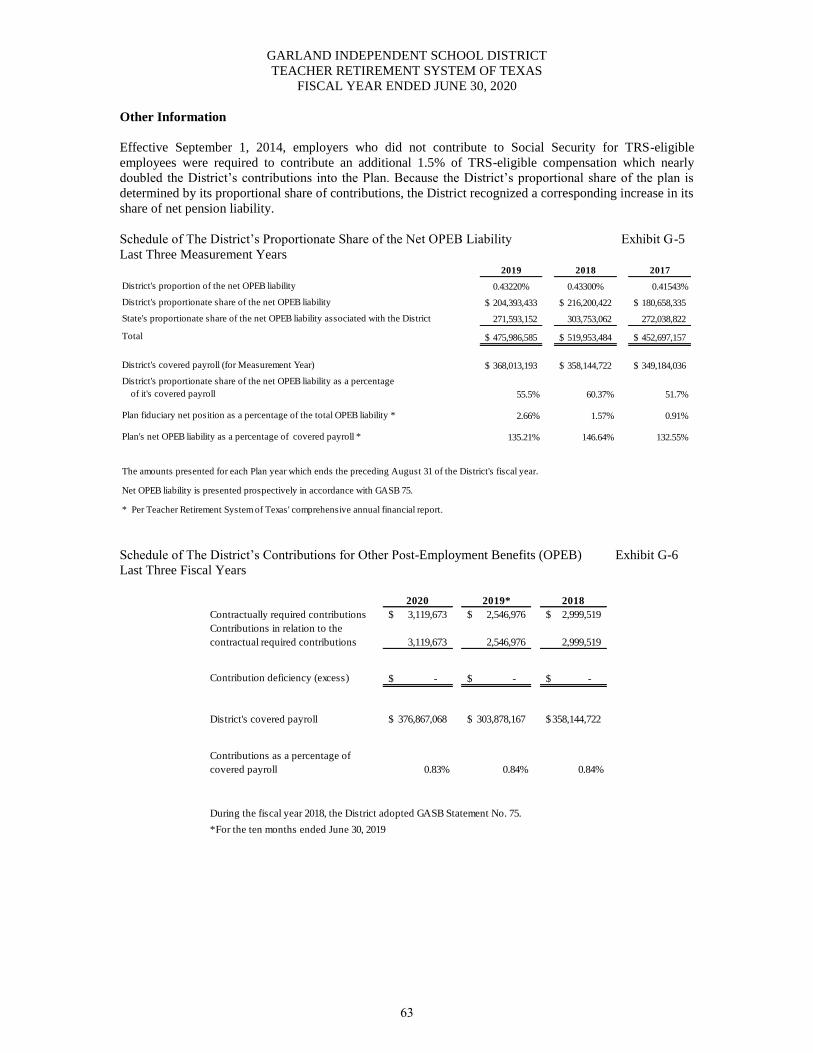
GARLAND INDEPENDENT SCHOOL DISTRICT
TEACHER RETIREMENT SYSTEM OF TEXAS
FISCAL YEAR ENDED JUNE 30, 2020
Other Information
Effective September 1, 2014, employers who did not contribute to Social Security for TRS-eligible
employees were required to contribute an additional 1.5% of TRS-eligible compensation which nearly
doubled the District’s contributions into the Plan. Because the District’s proportional share of the plan is
determined by its proportional share of contributions, the District recognized a corresponding increase in its
share of net pension liability.
Schedule of The District’s Proportionate Share of the Net OPEB Liability Exhibit G-5
Last Three Measurement Years 2019 2018 2017
District's proportion of the net OPEB liability 0.43220% 0.43300% 0.41543%
District's proportionate share of the net OPEB liability 204,393,433$ 216,200,422$ 180,658,335$
State's proportionate share of the net OPEB liability associated with the District 271,593,152 303,753,062 272,038,822
Total 475,986,585$ 519,953,484$ 452,697,157$
District's covered payroll (for Measurement Year) 368,013,193$ 358,144,722$ 349,184,036$
District's proportionate share of the net OPEB liability as a percentage
of it's covered payroll 55.5% 60.37% 51.7%
Plan fiduciary net position as a percentage of the total OPEB liability * 2.66% 1.57% 0.91%
Plan's net OPEB liability as a percentage of covered payroll * 135.21% 146.64% 132.55%
The amounts presented for each Plan year which ends the preceding August 31 of the District's fiscal year.
Net OPEB liability is presented prospectively in accordance with GASB 75.
* Per Teacher Retirement System of Texas' comprehensive annual financial report.
Schedule of The District’s Contributions for Other Post-Employment Benefits (OPEB) Exhibit G-6
Last Three Fiscal Years
2020 2019* 2018
Contractually required contributions 3,119,673$ 2,546,976$ 2,999,519$
Contributions in relation to the
contractual required contributions 3,119,673 2,546,976 2,999,519
Contribution deficiency (excess) -$ -$ -$
District's covered payroll 376,867,068$ 303,878,167$ 358,144,722$
Contributions as a percentage of
covered payroll 0.83% 0.84% 0.84%
During the fiscal year 2018, the District adopted GASB Statement No. 75.
*For the ten months ended June 30, 2019
63
GARLAND INDEPENDENT SCHOOL DISTRICT
NOTE TO TEACHER RETIREMENT SYSTEM AND POST EMPLOYMENT
BENEFITS SCHEDULES REQUIRED SUPPLEMENTARY INFORMATION
FISCAL YEAR ENDED JUNE 30, 2020
Changes of Assumptions
The following assumptions, methods and plan changes which are specific to TRS-Care were updated from
the prior year’s report:
The discount rate changed from 3.69 percent as of August 31, 2018 to 2.63 percent, as of August
31, 2019. This change increased the Total OPEB Liability (TOL).
The participation rate for pre-65 retirees was lowered from 70 percent to 65 percent. The
participation rate for post-65 retirees was lowered from 75 percent to 50 percent. 25 percent of pre-
65 retirees are assumed to discontinue their coverage at age 65. These was no lapse assumption in
the prior valuation, these changes decreased TOL.
The trend rates were reset to better reflect the plan’s anticipated experience. This change increased
TOL.
The percentage of retirees who are assumed to have two-person coverage was lowered from 20
percent to 15 percent. In addition, the participation assumption for the surviving spouses of
employees that die while actively employed was lowered from 20 percent to 10 percent. These
changes decreased the TOL.
Changes in Benefit Terms
Effective January 1, 2018, only one health plan option will exist (instead of three), and all retirees will be
required to contribute monthly premiums for coverage. The health plan changes triggered changes to several
of the assumptions, including participation rates, retirement rates, and spousal participation rates. This change
in plan benefits significantly lowered the OPEB liability and had an immediate effect on the OPEB expenses
recognized by participating entities.
The 85th Legislature, Regular Session, passed the following statutory changes in House Bill 3976 which
became effective on September 1, 2017:
Created a high-deductible health plan that provides a zero cost for generic prescriptions for certain
preventive drugs and provides a zero premium for disability retirees who retired as a disability
retiree on or before January 1, 2017 and are not eligible to enroll in Medicare.
Created a single Medicare Advantage plan and Medicare prescription drug plan for all Medicare-
eligible participants.
Allowed the System to provide other, appropriate health benefit plans to address the needs of
enrollees eligible for Medicare.
Allowed eligible retirees and their eligible dependents to enroll in TRS-Care when the retiree
reaches 65 years of age, rather than waiting for the next enrollment period
Eliminated free coverage under TRS-Care, except for certain disability retirees enrolled during Plan
Years 2018 through 2021, requiring members to contribute $200 per month toward their health
insurance premiums.
64
Combining Statements

This page intentionally left blank
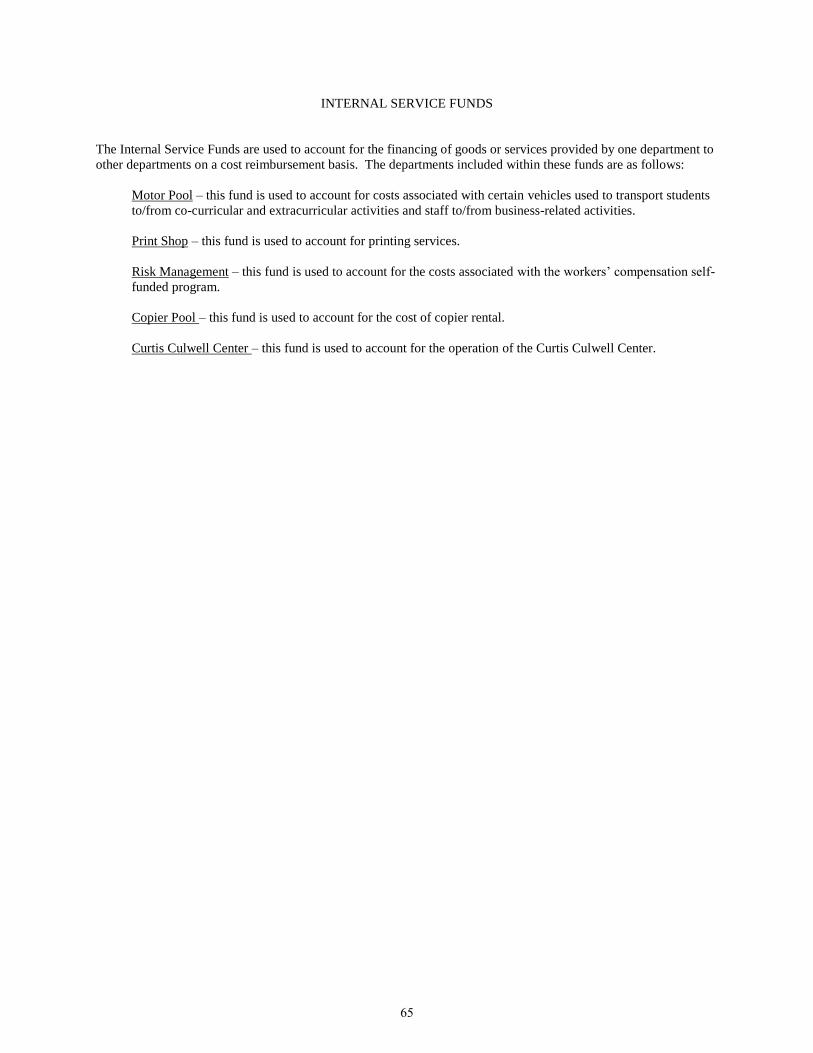
INTERNAL SERVICE FUNDS
The Internal Service Funds are used to account for the financing of goods or services provided by one department to
other departments on a cost reimbursement basis. The departments included within these funds are as follows:
Motor Pool – this fund is used to account for costs associated with certain vehicles used to transport students
to/from co-curricular and extracurricular activities and staff to/from business-related activities.
Print Shop – this fund is used to account for printing services.
Risk Management – this fund is used to account for the costs associated with the workers’ compensation self-
funded program.
Copier Pool – this fund is used to account for the cost of copier rental.
Curtis Culwell Center – this fund is used to account for the operation of the Curtis Culwell Center.
65
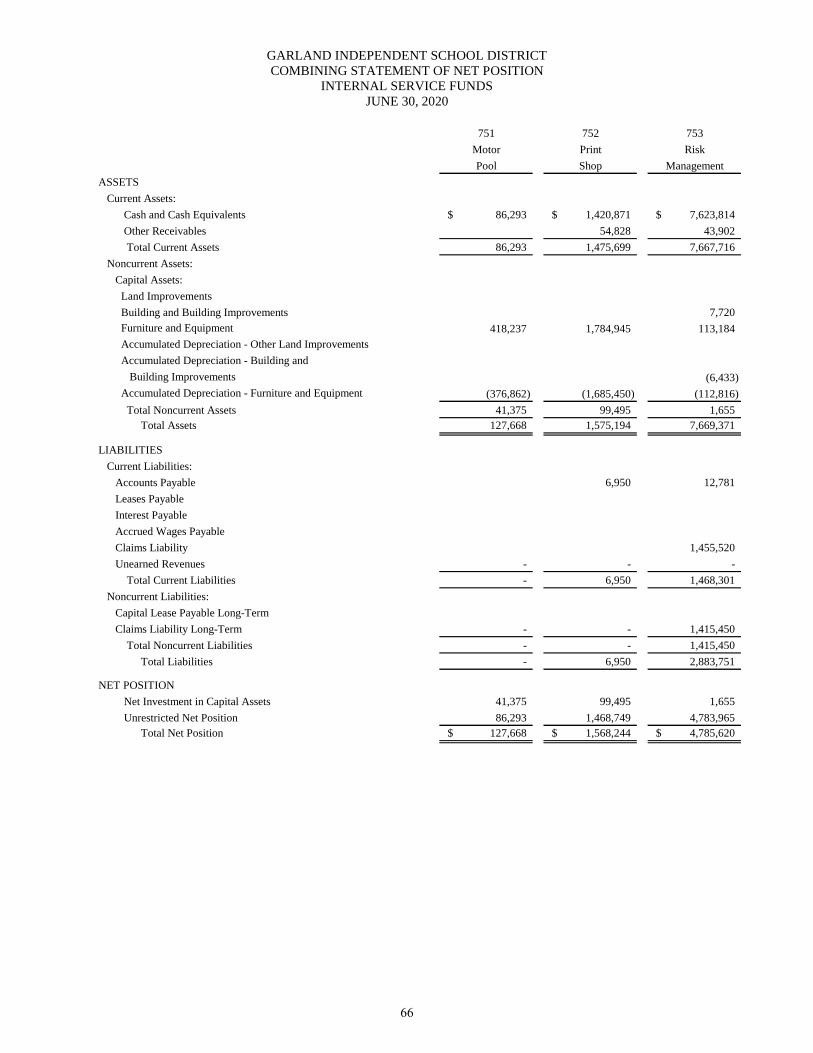
GARLAND INDEPENDENT SCHOOL DISTRICT
COMBINING STATEMENT OF NET POSITION
INTERNAL SERVICE FUNDS
JUNE 30, 2020
751 752 753
Motor Print Risk
Pool Shop Management
ASSETS
Current Assets:
Cash and Cash Equivalents 86,293$ 1,420,871$ 7,623,814$
Other Receivables 54,828 43,902
Total Current Assets 86,293 1,475,699 7,667,716
Noncurrent Assets:
Capital Assets:
Land Improvements
Building and Building Improvements 7,720
Furniture and Equipment 418,237 1,784,945 113,184
Accumulated Depreciation - Other Land Improvements
Accumulated Depreciation - Building and
Building Improvements (6,433)
Accumulated Depreciation - Furniture and Equipment (376,862) (1,685,450) (112,816)
Total Noncurrent Assets 41,375 99,495 1,655
Total Assets 127,668 1,575,194 7,669,371
LIABILITIES
Current Liabilities:
Accounts Payable 6,950 12,781
Leases Payable
Interest Payable
Accrued Wages Payable
Claims Liability 1,455,520
Unearned Revenues - - -
Total Current Liabilities - 6,950 1,468,301
Noncurrent Liabilities:
Capital Lease Payable Long-Term
Claims Liability Long-Term - - 1,415,450
Total Noncurrent Liabilities - - 1,415,450
Total Liabilities - 6,950 2,883,751
NET POSITION
Net Investment in Capital Assets 41,375 99,495 1,655
Unrestricted Net Position 86,293 1,468,749 4,783,965
Total Net Position 127,668$ 1,568,244$ 4,785,620$
66
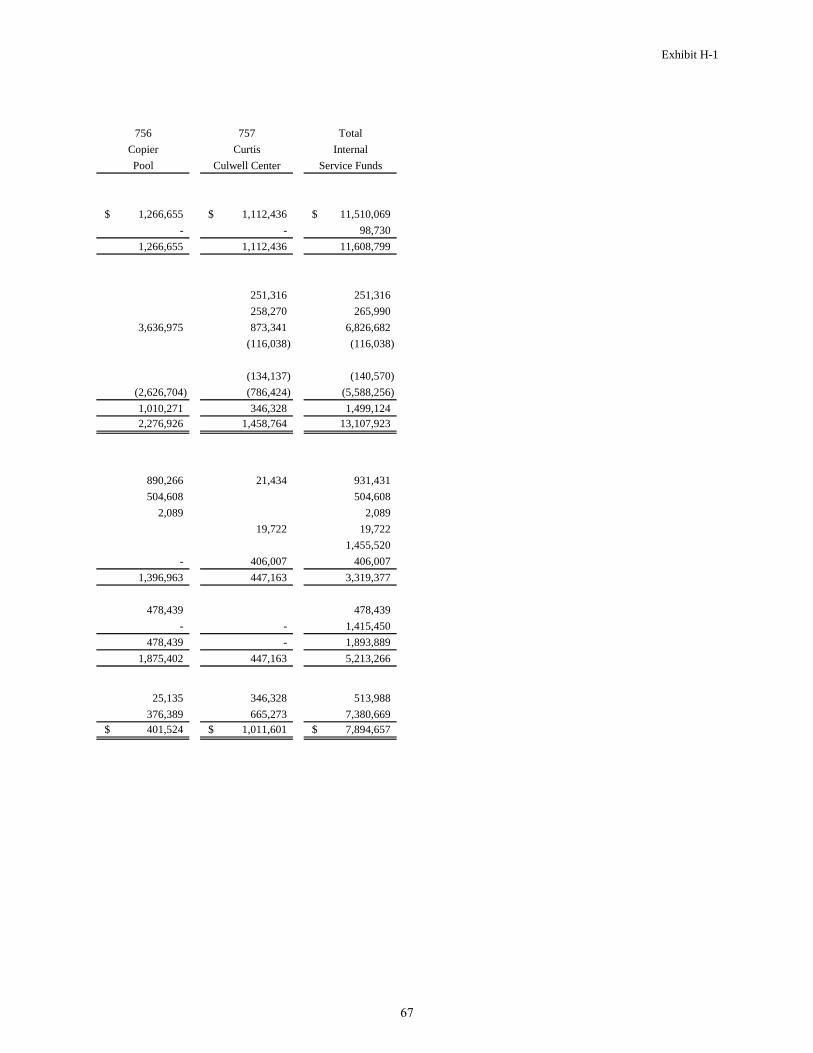
Exhibit H-1
756 757 Total
Copier Curtis Internal
Pool Culwell Center Service Funds
1,266,655$ 1,112,436$ 11,510,069$
- - 98,730
1,266,655 1,112,436 11,608,799
251,316 251,316
258,270 265,990
3,636,975 873,341 6,826,682
(116,038) (116,038)
(134,137) (140,570)
(2,626,704) (786,424) (5,588,256)
1,010,271 346,328 1,499,124
2,276,926 1,458,764 13,107,923
890,266 21,434 931,431
504,608 504,608
2,089 2,089
19,722 19,722
1,455,520
- 406,007 406,007
1,396,963 447,163 3,319,377
478,439 478,439
- - 1,415,450
478,439 - 1,893,889
1,875,402 447,163 5,213,266
25,135 346,328 513,988
376,389 665,273 7,380,669
401,524$ 1,011,601$ 7,894,657$
67
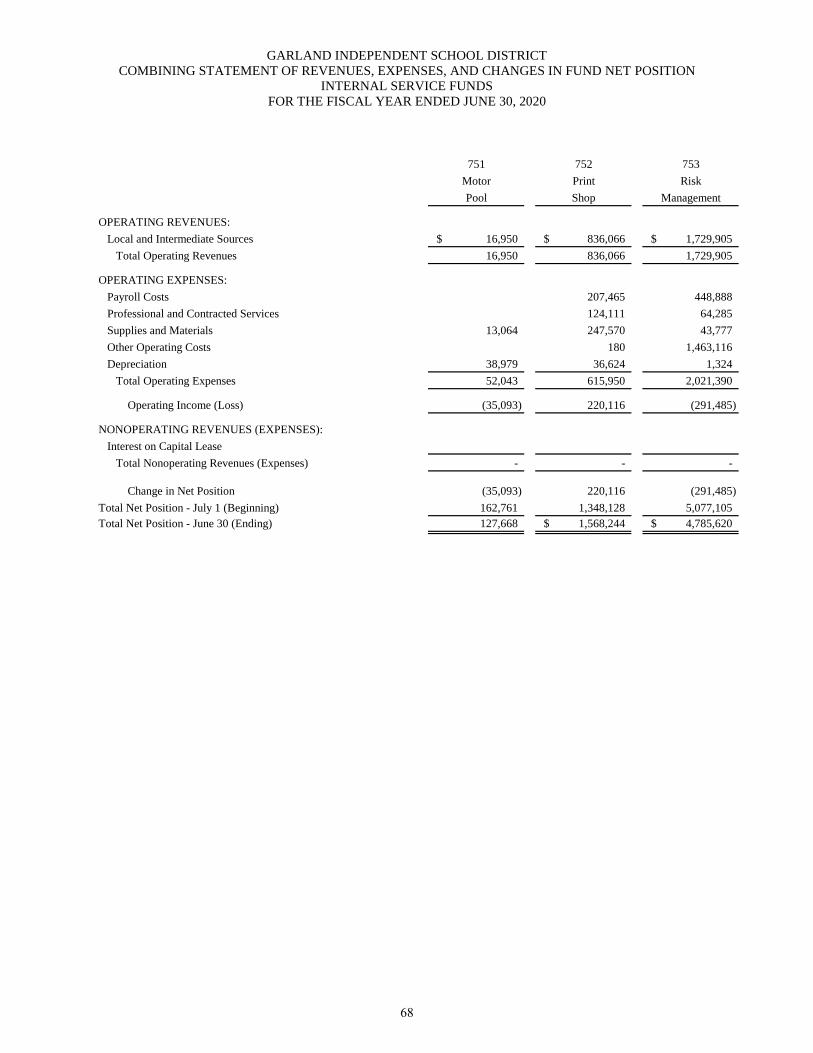
GARLAND INDEPENDENT SCHOOL DISTRICT
COMBINING STATEMENT OF REVENUES, EXPENSES, AND CHANGES IN FUND NET POSITION
INTERNAL SERVICE FUNDS
FOR THE FISCAL YEAR ENDED JUNE 30, 2020
751 752 753
Motor Print Risk
Pool Shop Management
OPERATING REVENUES:
Local and Intermediate Sources 16,950$ 836,066$ 1,729,905$
Total Operating Revenues 16,950 836,066 1,729,905
OPERATING EXPENSES:
Payroll Costs 207,465 448,888
Professional and Contracted Services 124,111 64,285
Supplies and Materials 13,064 247,570 43,777
Other Operating Costs 180 1,463,116
Depreciation 38,979 36,624 1,324
Total Operating Expenses 52,043 615,950 2,021,390
Operating Income (Loss) (35,093) 220,116 (291,485)
NONOPERATING REVENUES (EXPENSES):
Interest on Capital Lease
Total Nonoperating Revenues (Expenses) - - -
Change in Net Position (35,093) 220,116 (291,485)
Total Net Position - July 1 (Beginning) 162,761 1,348,128 5,077,105
Total Net Position - June 30 (Ending) 127,668 1,568,244$ 4,785,620$
68
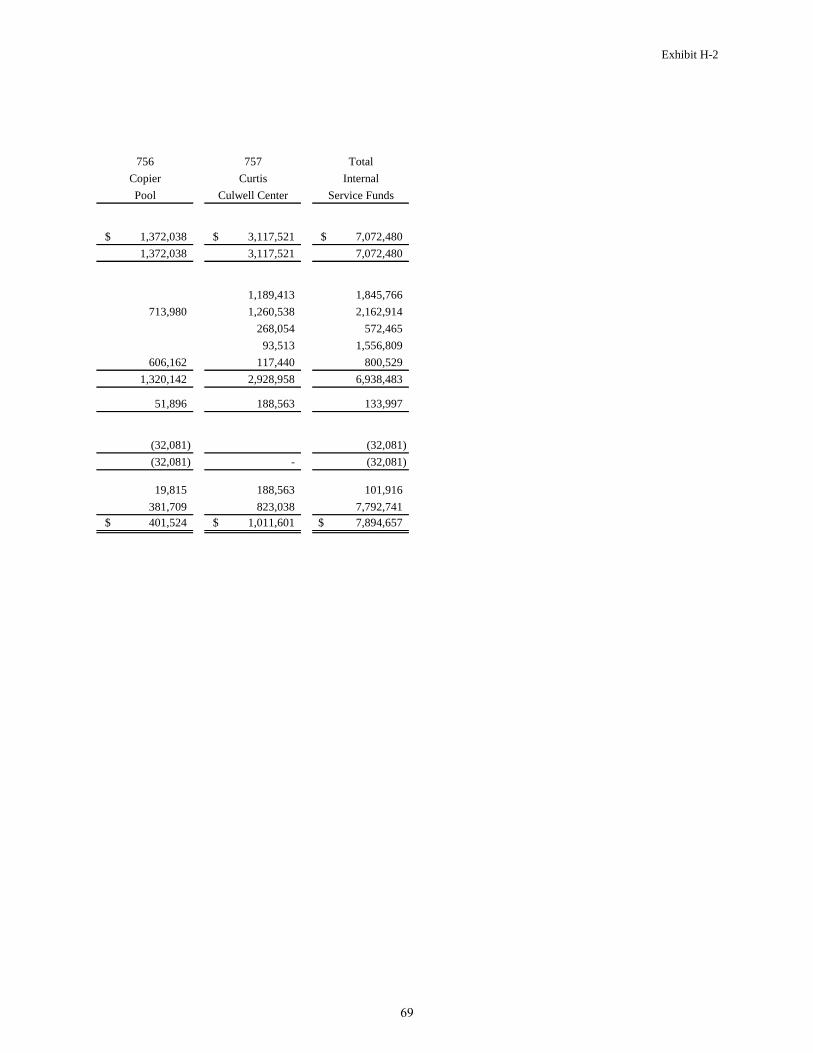
Exhibit H-2
756 757 Total
Copier Curtis Internal
Pool Culwell Center Service Funds
1,372,038$ 3,117,521$ 7,072,480$
1,372,038 3,117,521 7,072,480
1,189,413 1,845,766
713,980 1,260,538 2,162,914
268,054 572,465
93,513 1,556,809
606,162 117,440 800,529
1,320,142 2,928,958 6,938,483
51,896 188,563 133,997
(32,081) (32,081)
(32,081) - (32,081)
19,815 188,563 101,916
381,709 823,038 7,792,741
401,524$ 1,011,601$ 7,894,657$
69
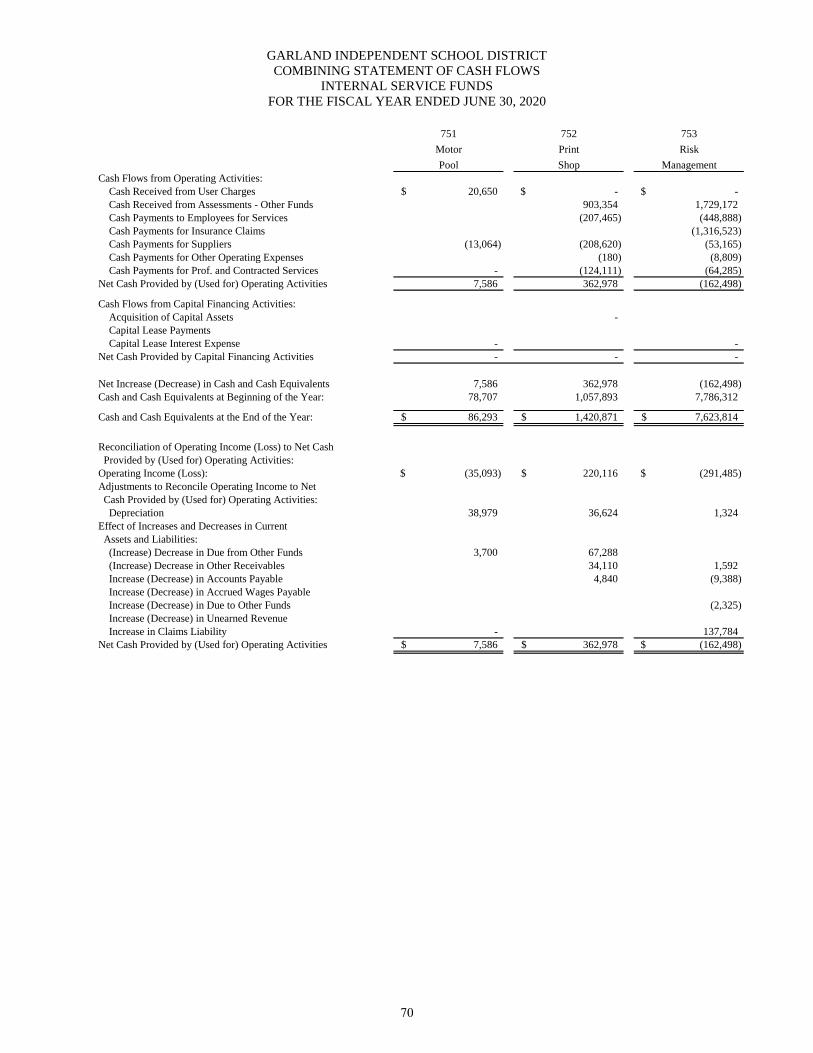
GARLAND INDEPENDENT SCHOOL DISTRICT
COMBINING STATEMENT OF CASH FLOWS
INTERNAL SERVICE FUNDS
FOR THE FISCAL YEAR ENDED JUNE 30, 2020
751 752 753
Motor Print Risk
Pool Shop Management
Cash Flows from Operating Activities:
Cash Received from User Charges 20,650$ -$ -$
Cash Received from Assessments - Other Funds 903,354 1,729,172
Cash Payments to Employees for Services (207,465) (448,888)
Cash Payments for Insurance Claims (1,316,523)
Cash Payments for Suppliers (13,064) (208,620) (53,165)
Cash Payments for Other Operating Expenses (180) (8,809)
Cash Payments for Prof. and Contracted Services - (124,111) (64,285)
Net Cash Provided by (Used for) Operating Activities 7,586 362,978 (162,498)
Cash Flows from Capital Financing Activities:
Acquisition of Capital Assets -
Capital Lease Payments
Capital Lease Interest Expense - -
Net Cash Provided by Capital Financing Activities - - -
Net Increase (Decrease) in Cash and Cash Equivalents 7,586 362,978 (162,498)
Cash and Cash Equivalents at Beginning of the Year: 78,707 1,057,893 7,786,312
Cash and Cash Equivalents at the End of the Year: 86,293$ 1,420,871$ 7,623,814$
Reconciliation of Operating Income (Loss) to Net Cash
Provided by (Used for) Operating Activities:
Operating Income (Loss): (35,093)$ 220,116$ (291,485)$
Adjustments to Reconcile Operating Income to Net
Cash Provided by (Used for) Operating Activities:
Depreciation 38,979 36,624 1,324
Effect of Increases and Decreases in Current
Assets and Liabilities:
(Increase) Decrease in Due from Other Funds 3,700 67,288
(Increase) Decrease in Other Receivables 34,110 1,592
Increase (Decrease) in Accounts Payable 4,840 (9,388)
Increase (Decrease) in Accrued Wages Payable
Increase (Decrease) in Due to Other Funds (2,325)
Increase (Decrease) in Unearned Revenue
Increase in Claims Liability - 137,784
Net Cash Provided by (Used for) Operating Activities 7,586$ 362,978$ (162,498)$
70
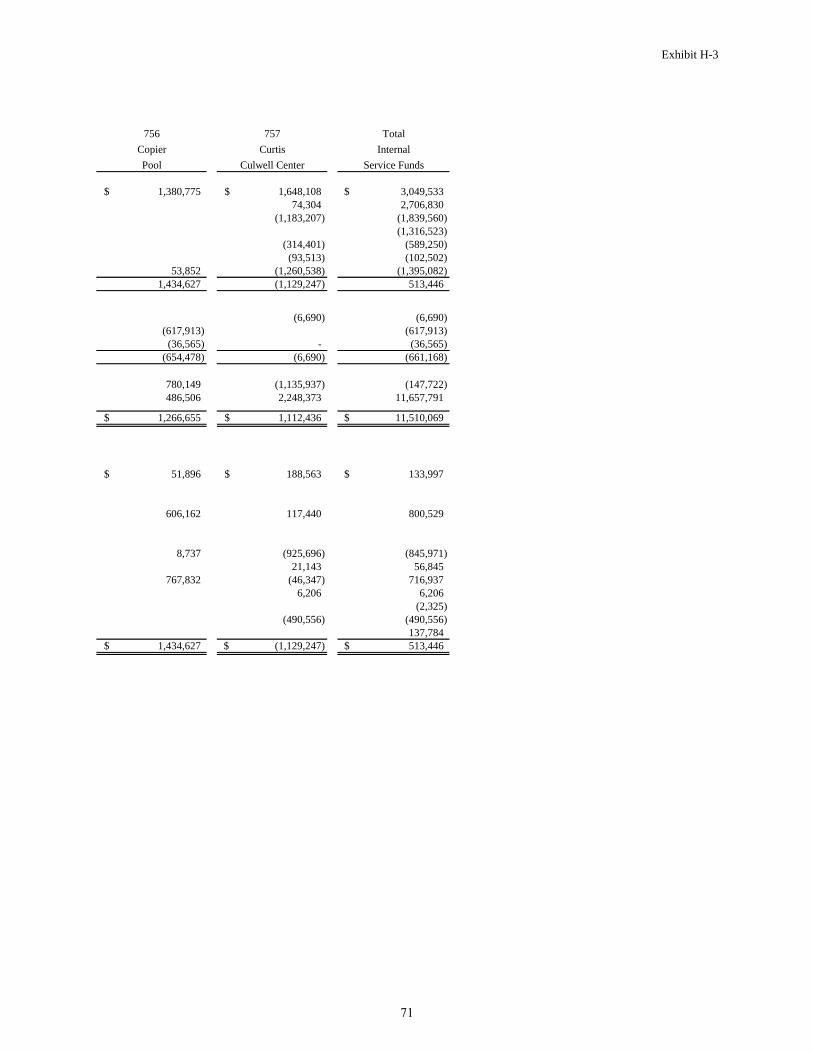
Exhibit H-3
756 757 Total
Copier Curtis Internal
Pool Culwell Center Service Funds
1,380,775$ 1,648,108$ 3,049,533$
74,304 2,706,830
(1,183,207) (1,839,560)
(1,316,523)
(314,401) (589,250)
(93,513) (102,502)
53,852 (1,260,538) (1,395,082)
1,434,627 (1,129,247) 513,446
(6,690) (6,690)
(617,913) (617,913)
(36,565) - (36,565)
(654,478) (6,690) (661,168)
780,149 (1,135,937) (147,722)
486,506 2,248,373 11,657,791
1,266,655$ 1,112,436$ 11,510,069$
51,896$ 188,563$ 133,997$
606,162 117,440 800,529
8,737 (925,696) (845,971)
21,143 56,845
767,832 (46,347) 716,937
6,206 6,206
(2,325)
(490,556) (490,556)
137,784
1,434,627$ (1,129,247)$ 513,446$
71
AGENCY FUNDS
Agency funds are established to account for assets received and held by the District in the capacity of trustee, agent,
or custodian. Expenditures are made only in accordance with the purpose for which assets are received.
Student Activity Agency Fund accounts for the receipt and disbursement of monies from student activity
organizations.
Other Activity Agency Fund accounts for the receipt and disbursement of monies from employee activity
groups and fundraisers for outside charitable groups/scholarships.
72
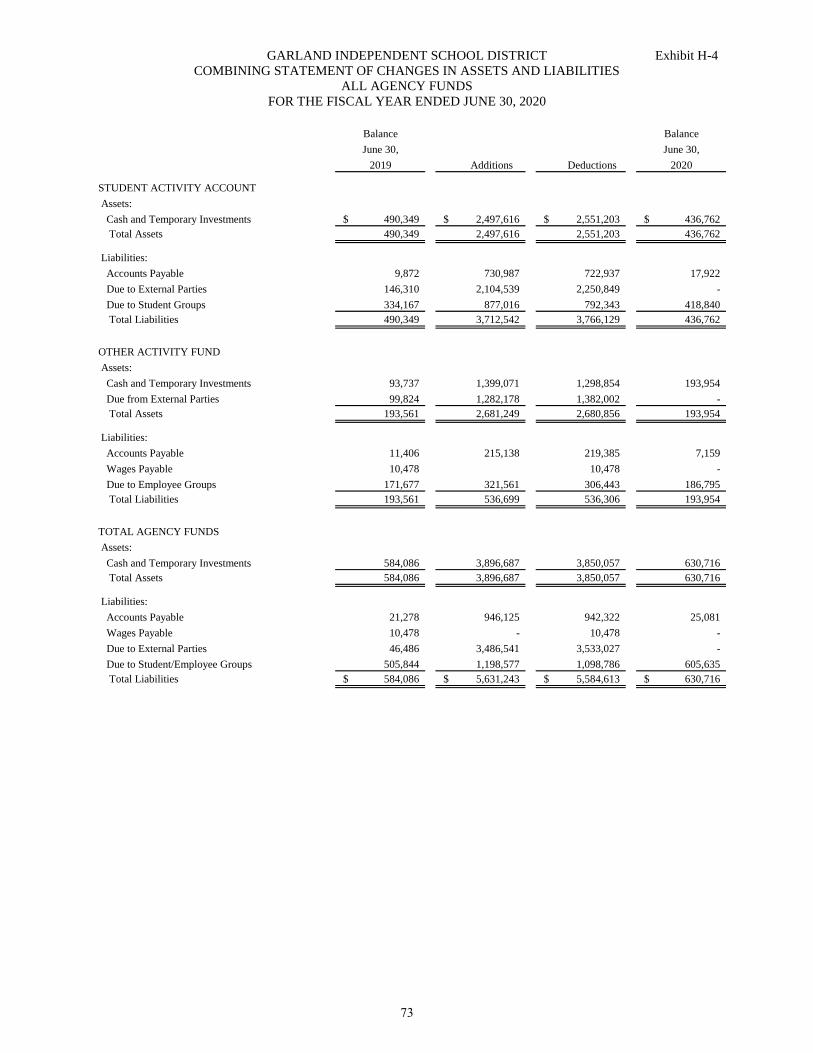
GARLAND INDEPENDENT SCHOOL DISTRICT Exhibit H-4
COMBINING STATEMENT OF CHANGES IN ASSETS AND LIABILITIES
ALL AGENCY FUNDS
FOR THE FISCAL YEAR ENDED JUNE 30, 2020
Balance Balance
June 30, June 30,
2019 Additions Deductions 2020
STUDENT ACTIVITY ACCOUNT
Assets:
Cash and Temporary Investments 490,349$ 2,497,616$ 2,551,203$ 436,762$
Total Assets 490,349 2,497,616 2,551,203 436,762
Liabilities:
Accounts Payable 9,872 730,987 722,937 17,922
Due to External Parties 146,310 2,104,539 2,250,849 -
Due to Student Groups 334,167 877,016 792,343 418,840
Total Liabilities 490,349 3,712,542 3,766,129 436,762
OTHER ACTIVITY FUND
Assets:
Cash and Temporary Investments 93,737 1,399,071 1,298,854 193,954
Due from External Parties 99,824 1,282,178 1,382,002 -
Total Assets 193,561 2,681,249 2,680,856 193,954
Liabilities:
Accounts Payable 11,406 215,138 219,385 7,159
Wages Payable 10,478 10,478 -
Due to Employee Groups 171,677 321,561 306,443 186,795
Total Liabilities 193,561 536,699 536,306 193,954
TOTAL AGENCY FUNDS
Assets:
Cash and Temporary Investments 584,086 3,896,687 3,850,057 630,716
Total Assets 584,086 3,896,687 3,850,057 630,716
Liabilities:
Accounts Payable 21,278 946,125 942,322 25,081
Wages Payable 10,478 - 10,478 -
Due to External Parties 46,486 3,486,541 3,533,027 -
Due to Student/Employee Groups 505,844 1,198,577 1,098,786 605,635
Total Liabilities 584,086$ 5,631,243$ 5,584,613$ 630,716$
73

This page intentionally left blank
Required TEA Schedules Section
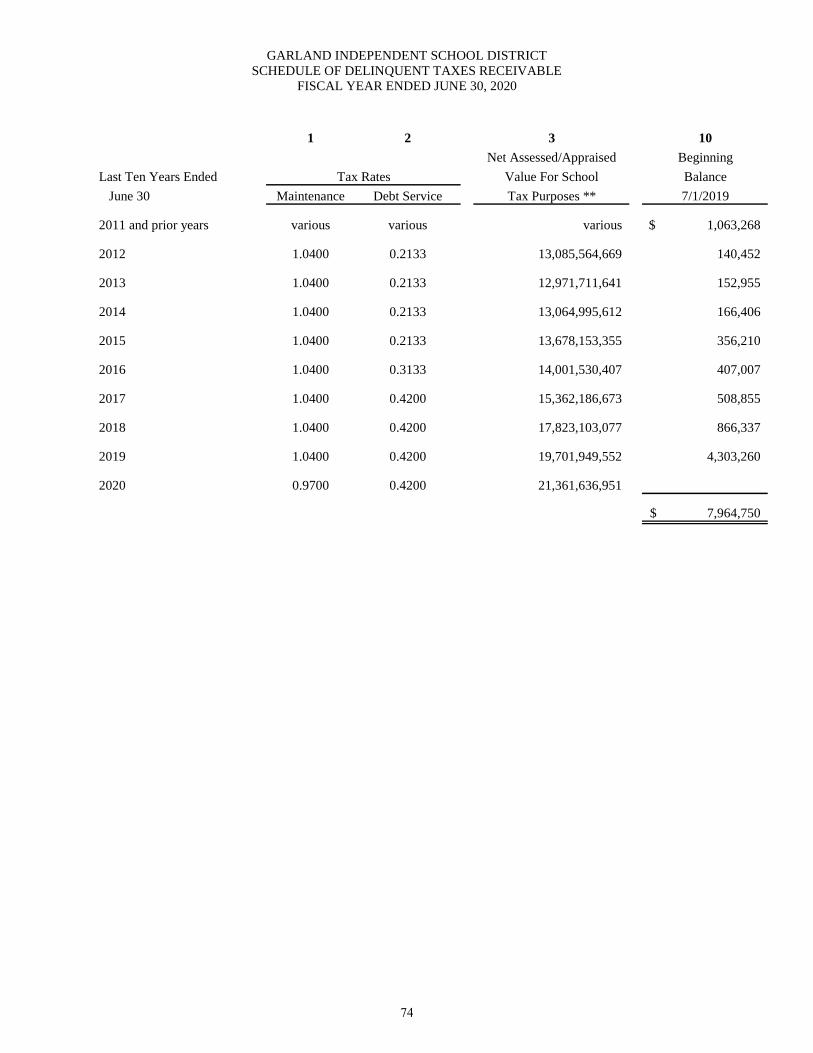
GARLAND INDEPENDENT SCHOOL DISTRICT
SCHEDULE OF DELINQUENT TAXES RECEIVABLE
FISCAL YEAR ENDED JUNE 30, 2020
1 2 3 10
Net Assessed/Appraised Beginning
Last Ten Years Ended Value For School Balance
June 30 Maintenance Debt Service Tax Purposes ** 7/1/2019
2011 and prior years various various various 1,063,268$
2012 1.0400 0.2133 13,085,564,669 140,452
2013 1.0400 0.2133 12,971,711,641 152,955
2014 1.0400 0.2133 13,064,995,612 166,406
2015 1.0400 0.2133 13,678,153,355 356,210
2016 1.0400 0.3133 14,001,530,407 407,007
2017 1.0400 0.4200 15,362,186,673 508,855
2018 1.0400 0.4200 17,823,103,077 866,337
2019 1.0400 0.4200 19,701,949,552 4,303,260
2020 0.9700 0.4200 21,361,636,951
7,964,750$
Tax Rates
74
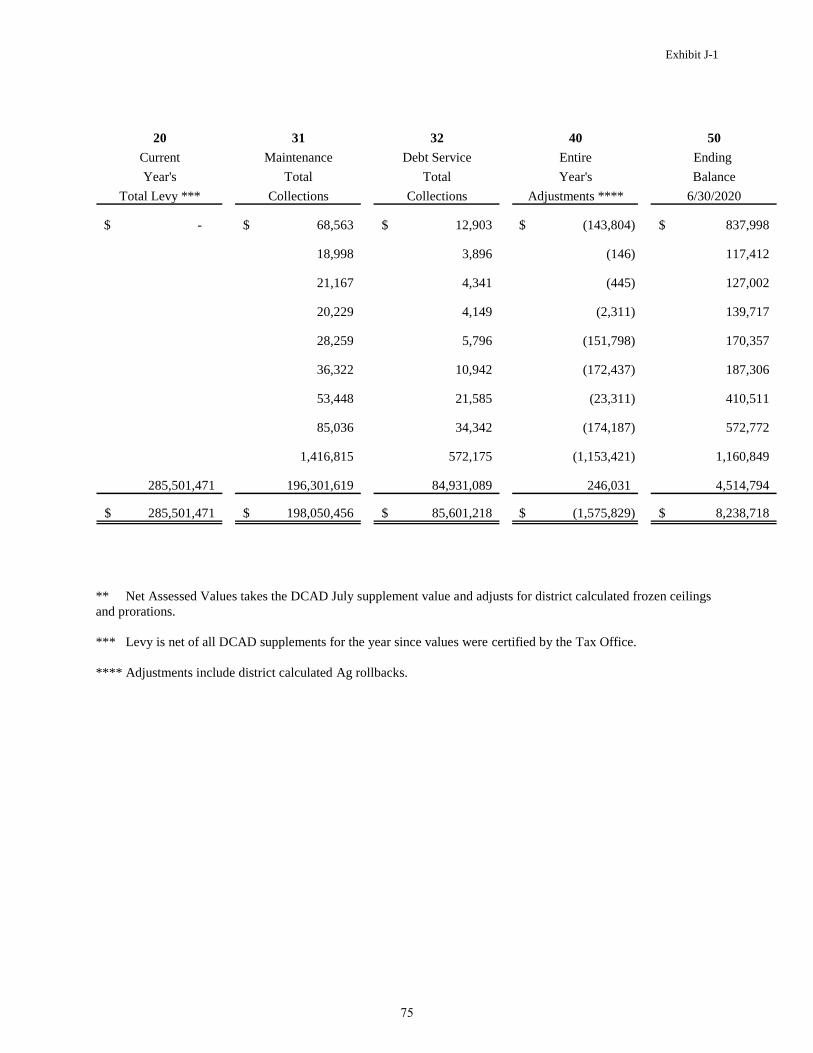
Exhibit J-1
20 31 32 40 50
Current Maintenance Debt Service Entire Ending
Year's Total Total Year's Balance
Total Levy *** Collections Collections Adjustments **** 6/30/2020
-$ 68,563$ 12,903$ (143,804)$ 837,998$
18,998 3,896 (146) 117,412
21,167 4,341 (445) 127,002
20,229 4,149 (2,311) 139,717
28,259 5,796 (151,798) 170,357
36,322 10,942 (172,437) 187,306
53,448 21,585 (23,311) 410,511
85,036 34,342 (174,187) 572,772
1,416,815 572,175 (1,153,421) 1,160,849
285,501,471 196,301,619 84,931,089 246,031 4,514,794
285,501,471$ 198,050,456$ 85,601,218$ (1,575,829)$ 8,238,718$
** Net Assessed Values takes the DCAD July supplement value and adjusts for district calculated frozen ceilings
and prorations.
*** Levy is net of all DCAD supplements for the year since values were certified by the Tax Office.
**** Adjustments include district calculated Ag rollbacks.
75
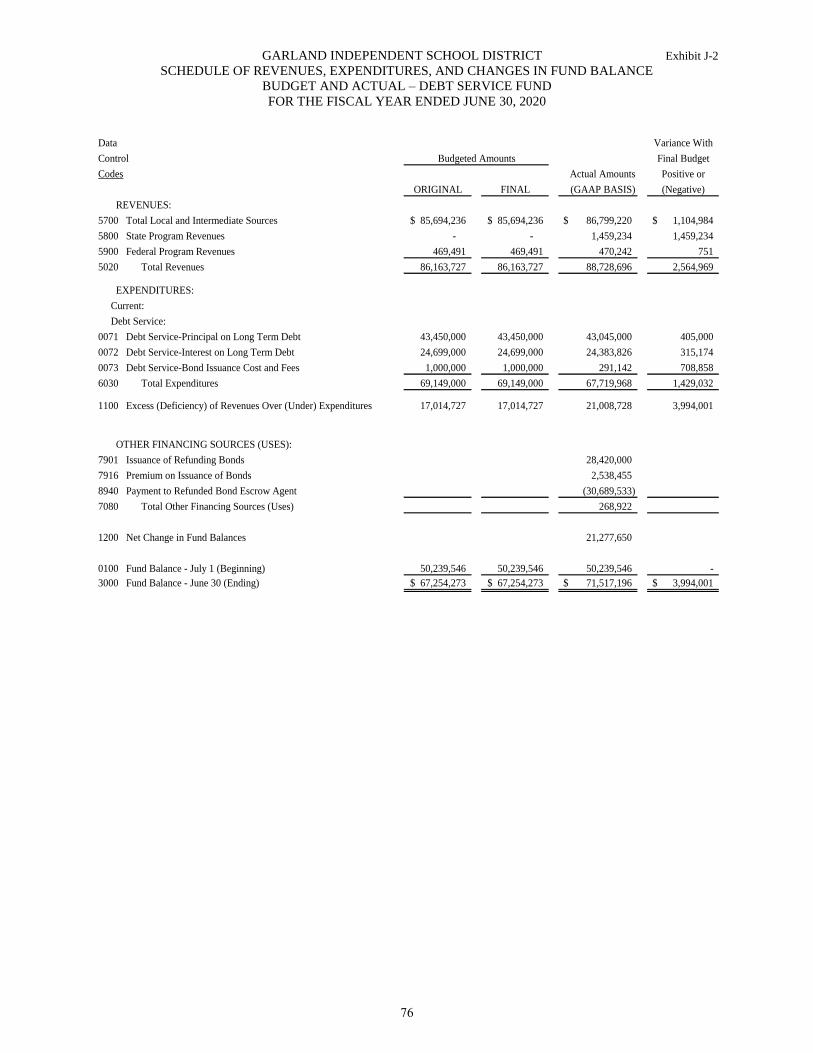
GARLAND INDEPENDENT SCHOOL DISTRICT Exhibit J-2
SCHEDULE OF REVENUES, EXPENDITURES, AND CHANGES IN FUND BALANCE
BUDGET AND ACTUAL – DEBT SERVICE FUND
FOR THE FISCAL YEAR ENDED JUNE 30, 2020
Data Variance With
Control Final Budget
Codes Actual Amounts Positive or
ORIGINAL FINAL (GAAP BASIS) (Negative)
REVENUES:
5700 Total Local and Intermediate Sources 85,694,236$ 85,694,236$ 86,799,220$ 1,104,984$
5800 State Program Revenues - - 1,459,234 1,459,234
5900 Federal Program Revenues 469,491 469,491 470,242 751
5020 Total Revenues 86,163,727 86,163,727 88,728,696 2,564,969
EXPENDITURES:
Current:
Debt Service:
0071 Debt Service-Principal on Long Term Debt 43,450,000 43,450,000 43,045,000 405,000
0072 Debt Service-Interest on Long Term Debt 24,699,000 24,699,000 24,383,826 315,174
0073 Debt Service-Bond Issuance Cost and Fees 1,000,000 1,000,000 291,142 708,858
6030 Total Expenditures 69,149,000 69,149,000 67,719,968 1,429,032
1100 Excess (Deficiency) of Revenues Over (Under) Expenditures 17,014,727 17,014,727 21,008,728 3,994,001
OTHER FINANCING SOURCES (USES):
7901 Issuance of Refunding Bonds 28,420,000
7916 Premium on Issuance of Bonds 2,538,455
8940 Payment to Refunded Bond Escrow Agent (30,689,533)
7080 Total Other Financing Sources (Uses) 268,922
1200 Net Change in Fund Balances 21,277,650
0100 Fund Balance - July 1 (Beginning) 50,239,546 50,239,546 50,239,546 -
3000 Fund Balance - June 30 (Ending) 67,254,273$ 67,254,273$ 71,517,196$ 3,994,001$
Budgeted Amounts
76
GARLAND INDEPENDENT SCHOOL DISTRICT
NET POSITION BY COMPONENT
LAST TEN FISCAL YEARS (UNAUDITED)
STATISTICAL SECTION
This part of the Garland Independent School District’s comprehensive annual financial report presents detailed
information as a context for understanding what the information in the financial statements, note disclosures, and
required supplementary information says about the government’s overall financial health.
Financial Trends 78-91
These schedules contain trend information to help the reader understand how
the government’s financial performance and wellbeing have changed over time.
Revenue Capacity 92-95
These schedules contain information to help the reader assess the government’s
most significant local revenue source, the property tax.
Debt Capacity 96-98
These schedules present information to help the reader assess the affordability
of the government’s current levels of outstanding debt and the government’s
ability to issue additional debt in the future.
Demographic and Economic Information 99-101
These schedules offer demographic and economic indicators to help the reader
understand the environment within which the government’s financial activities
take place.
Operating Information 102-112
These schedules contain service and infrastructure data to help the reader
understand how the information in the government’s financial report relates to
the services the government provides and the activities it performs.
Sources: Unless otherwise noted, the information in these schedules is derived from the comprehensive annual
financial reports for the relevant year.
77

GARLAND INDEPENDENT SCHOOL DISTRICT
NET POSITION BY COMPONENT
LAST TEN FISCAL YEARS (UNAUDITED)
2011 2012 2013 2014
Governmental net position
Net investment in capital assets 135,714,399$ 150,416,165$ 157,656,333$ 162,891,590$
Restricted
Food Service 3,572,158 5,647,011
Debt Service 5,944,130 5,852,827 5,689,844 5,841,400
Grant Funds 4,480,338 7,594,789 9,155,138
Construction 6,614,366
Unrestricted 118,941,802 140,509,657 157,811,060 163,033,042
Total governmental net position 264,172,489 306,905,998 328,752,026 347,535,536
Business-type net position
Net investment in capital assets 17,536 14,180 11,601 9,023
Unrestricted (129,759) (127,504) (126,232) (130,792)
Total Business-type net position (112,223) (113,324) (114,631) (121,769)
Total net position
Net investment in capital assets 135,731,935 150,430,345 157,667,934 162,900,613
Restricted
Food Service 3,572,158 5,647,011
Debt Service 5,944,130 5,852,827 5,689,844 5,841,400
Grant Funds 4,480,338 10,133,840 9,155,138
Construction 6,614,366
Unrestricted 118,812,043 140,382,153 155,145,777 162,902,250
Total net position 264,060,266$ 306,792,674$ 328,637,395$ 347,413,767$
Fiscal Year
Source: The Statement of Net Position for the Garland Independent School District
78
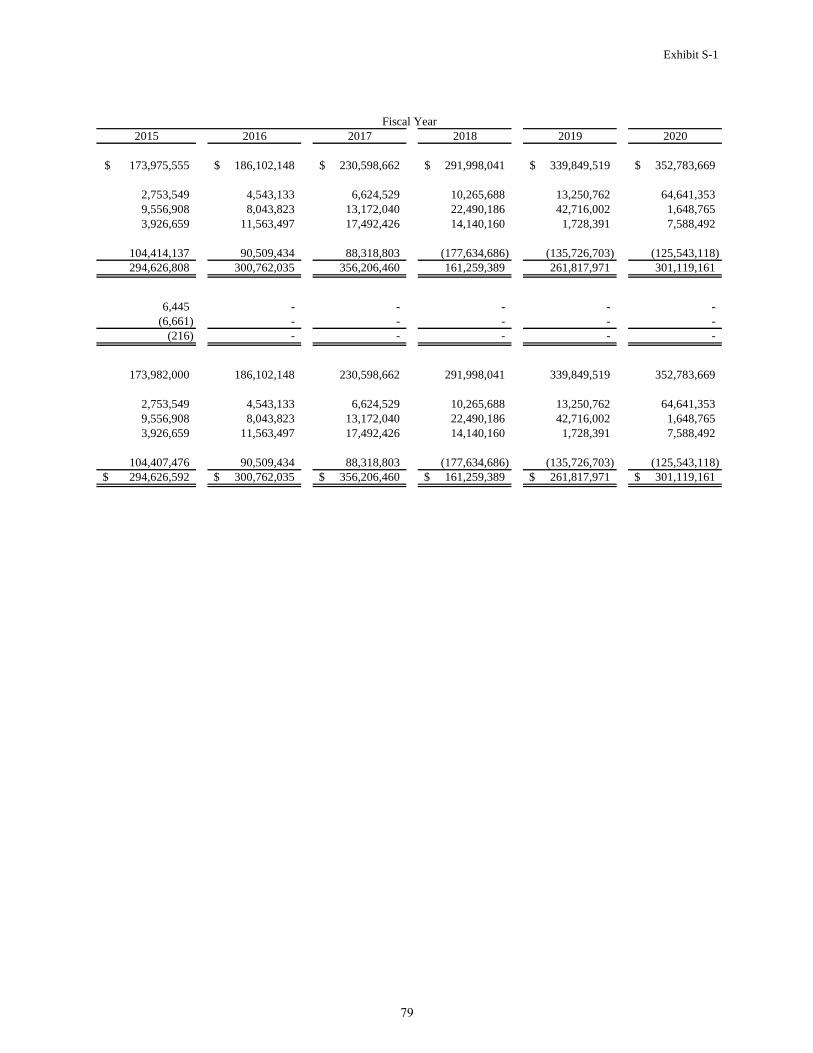
Exhibit S-1
2015 2016 2017 2018 2019 2020
173,975,555$ 186,102,148$ 230,598,662$ 291,998,041$ 339,849,519$ 352,783,669$
2,753,549 4,543,133 6,624,529 10,265,688 13,250,762 64,641,353
9,556,908 8,043,823 13,172,040 22,490,186 42,716,002 1,648,765
3,926,659 11,563,497 17,492,426 14,140,160 1,728,391 7,588,492
104,414,137 90,509,434 88,318,803 (177,634,686) (135,726,703) (125,543,118)
294,626,808 300,762,035 356,206,460 161,259,389 261,817,971 301,119,161
6,445 - - - - -
(6,661) - - - - -
(216) - - - - -
173,982,000 186,102,148 230,598,662 291,998,041 339,849,519 352,783,669
2,753,549 4,543,133 6,624,529 10,265,688 13,250,762 64,641,353
9,556,908 8,043,823 13,172,040 22,490,186 42,716,002 1,648,765
3,926,659 11,563,497 17,492,426 14,140,160 1,728,391 7,588,492
104,407,476 90,509,434 88,318,803 (177,634,686) (135,726,703) (125,543,118)
294,626,592$ 300,762,035$ 356,206,460$ 161,259,389$ 261,817,971$ 301,119,161$
Fiscal Year
79
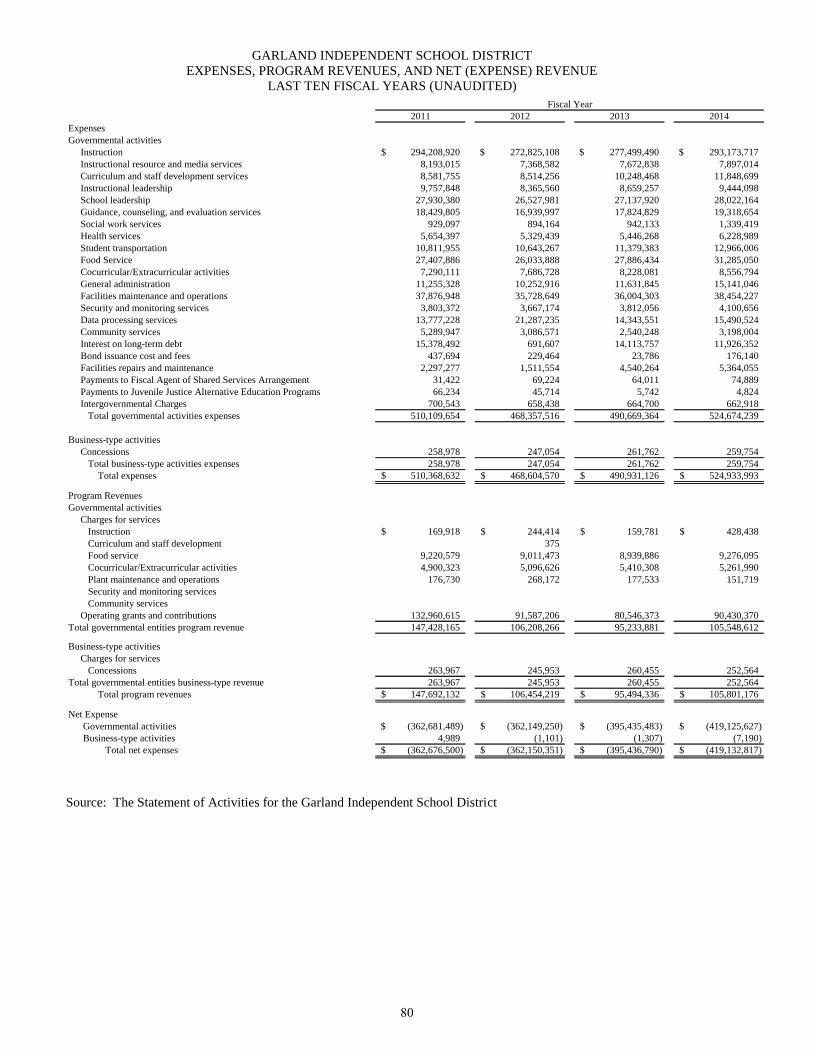
GARLAND INDEPENDENT SCHOOL DISTRICT
EXPENSES, PROGRAM REVENUES, AND NET (EXPENSE) REVENUE
LAST TEN FISCAL YEARS (UNAUDITED)
2011 2012 2013 2014
Expenses
Governmental activities
Instruction 294,208,920$ 272,825,108$ 277,499,490$ 293,173,717$
Instructional resource and media services 8,193,015 7,368,582 7,672,838 7,897,014
Curriculum and staff development services 8,581,755 8,514,256 10,248,468 11,848,699
Instructional leadership 9,757,848 8,365,560 8,659,257 9,444,098
School leadership 27,930,380 26,527,981 27,137,920 28,022,164
Guidance, counseling, and evaluation services 18,429,805 16,939,997 17,824,829 19,318,654
Social work services 929,097 894,164 942,133 1,339,419
Health services 5,654,397 5,329,439 5,446,268 6,228,989
Student transportation 10,811,955 10,643,267 11,379,383 12,966,006
Food Service 27,407,886 26,033,888 27,886,434 31,285,050
Cocurricular/Extracurricular activities 7,290,111 7,686,728 8,228,081 8,556,794
General administration 11,255,328 10,252,916 11,631,845 15,141,046
Facilities maintenance and operations 37,876,948 35,728,649 36,004,303 38,454,227
Security and monitoring services 3,803,372 3,667,174 3,812,056 4,100,656
Data processing services 13,777,228 21,287,235 14,343,551 15,490,524
Community services 5,289,947 3,086,571 2,540,248 3,198,004
Interest on long-term debt 15,378,492 691,607 14,113,757 11,926,352
Bond issuance cost and fees 437,694 229,464 23,786 176,140
Facilities repairs and maintenance 2,297,277 1,511,554 4,540,264 5,364,055
Payments to Fiscal Agent of Shared Services Arrangement 31,422 69,224 64,011 74,889
Payments to Juvenile Justice Alternative Education Programs 66,234 45,714 5,742 4,824
Intergovernmental Charges 700,543 658,438 664,700 662,918
Total governmental activities expenses 510,109,654 468,357,516 490,669,364 524,674,239
Business-type activities
Concessions 258,978 247,054 261,762 259,754
Total business-type activities expenses 258,978 247,054 261,762 259,754
Total expenses 510,368,632$ 468,604,570$ 490,931,126$ 524,933,993$
Program Revenues
Governmental activities
Charges for services
Instruction 169,918$ 244,414$ 159,781$ 428,438$
Curriculum and staff development 375
Food service 9,220,579 9,011,473 8,939,886 9,276,095
Cocurricular/Extracurricular activities 4,900,323 5,096,626 5,410,308 5,261,990
Plant maintenance and operations 176,730 268,172 177,533 151,719
Security and monitoring services
Community services
Operating grants and contributions 132,960,615 91,587,206 80,546,373 90,430,370
Total governmental entities program revenue 147,428,165 106,208,266 95,233,881 105,548,612
Business-type activities
Charges for services
Concessions 263,967 245,953 260,455 252,564
Total governmental entities business-type revenue 263,967 245,953 260,455 252,564
Total program revenues 147,692,132$ 106,454,219$ 95,494,336$ 105,801,176$
Net Expense
Governmental activities (362,681,489)$ (362,149,250)$ (395,435,483)$ (419,125,627)$
Business-type activities 4,989 (1,101) (1,307) (7,190)
Total net expenses (362,676,500)$ (362,150,351)$ (395,436,790)$ (419,132,817)$
Fiscal Year
Source: The Statement of Activities for the Garland Independent School District
80
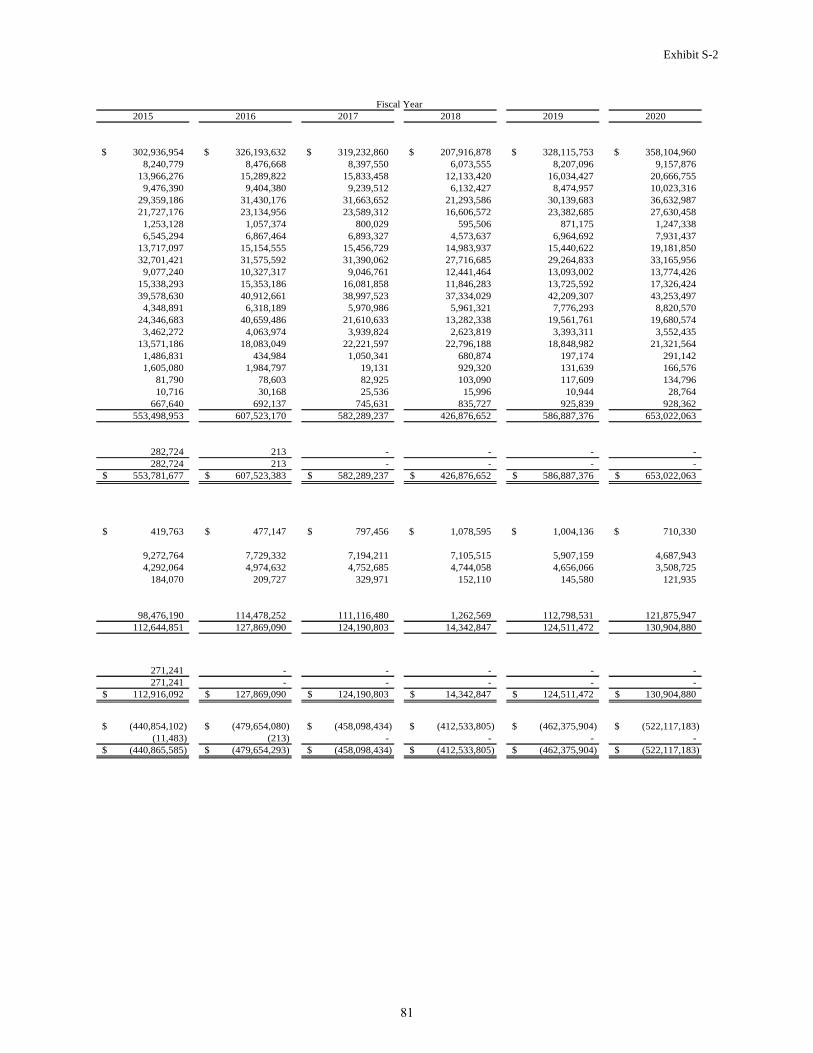
Exhibit S-2
2015 2016 2017 2018 2019 2020
302,936,954$ 326,193,632$ 319,232,860$ 207,916,878$ 328,115,753$ 358,104,960$
8,240,779 8,476,668 8,397,550 6,073,555 8,207,096 9,157,876
13,966,276 15,289,822 15,833,458 12,133,420 16,034,427 20,666,755
9,476,390 9,404,380 9,239,512 6,132,427 8,474,957 10,023,316
29,359,186 31,430,176 31,663,652 21,293,586 30,139,683 36,632,987
21,727,176 23,134,956 23,589,312 16,606,572 23,382,685 27,630,458
1,253,128 1,057,374 800,029 595,506 871,175 1,247,338
6,545,294 6,867,464 6,893,327 4,573,637 6,964,692 7,931,437
13,717,097 15,154,555 15,456,729 14,983,937 15,440,622 19,181,850
32,701,421 31,575,592 31,390,062 27,716,685 29,264,833 33,165,956
9,077,240 10,327,317 9,046,761 12,441,464 13,093,002 13,774,426
15,338,293 15,353,186 16,081,858 11,846,283 13,725,592 17,326,424
39,578,630 40,912,661 38,997,523 37,334,029 42,209,307 43,253,497
4,348,891 6,318,189 5,970,986 5,961,321 7,776,293 8,820,570
24,346,683 40,659,486 21,610,633 13,282,338 19,561,761 19,680,574
3,462,272 4,063,974 3,939,824 2,623,819 3,393,311 3,552,435
13,571,186 18,083,049 22,221,597 22,796,188 18,848,982 21,321,564
1,486,831 434,984 1,050,341 680,874 197,174 291,142
1,605,080 1,984,797 19,131 929,320 131,639 166,576
81,790 78,603 82,925 103,090 117,609 134,796
10,716 30,168 25,536 15,996 10,944 28,764
667,640 692,137 745,631 835,727 925,839 928,362
553,498,953 607,523,170 582,289,237 426,876,652 586,887,376 653,022,063
282,724 213 - - - -
282,724 213 - - - -
553,781,677$ 607,523,383$ 582,289,237$ 426,876,652$ 586,887,376$ 653,022,063$
419,763$ 477,147$ 797,456$ 1,078,595$ 1,004,136$ 710,330$
9,272,764 7,729,332 7,194,211 7,105,515 5,907,159 4,687,943
4,292,064 4,974,632 4,752,685 4,744,058 4,656,066 3,508,725
184,070 209,727 329,971 152,110 145,580 121,935
98,476,190 114,478,252 111,116,480 1,262,569 112,798,531 121,875,947
112,644,851 127,869,090 124,190,803 14,342,847 124,511,472 130,904,880
271,241 - - - - -
271,241 - - - - -
112,916,092$ 127,869,090$ 124,190,803$ 14,342,847$ 124,511,472$ 130,904,880$
(440,854,102)$ (479,654,080)$ (458,098,434)$ (412,533,805)$ (462,375,904)$ (522,117,183)$
(11,483) (213) - - - -
(440,865,585)$ (479,654,293)$ (458,098,434)$ (412,533,805)$ (462,375,904)$ (522,117,183)$
Fiscal Year
81
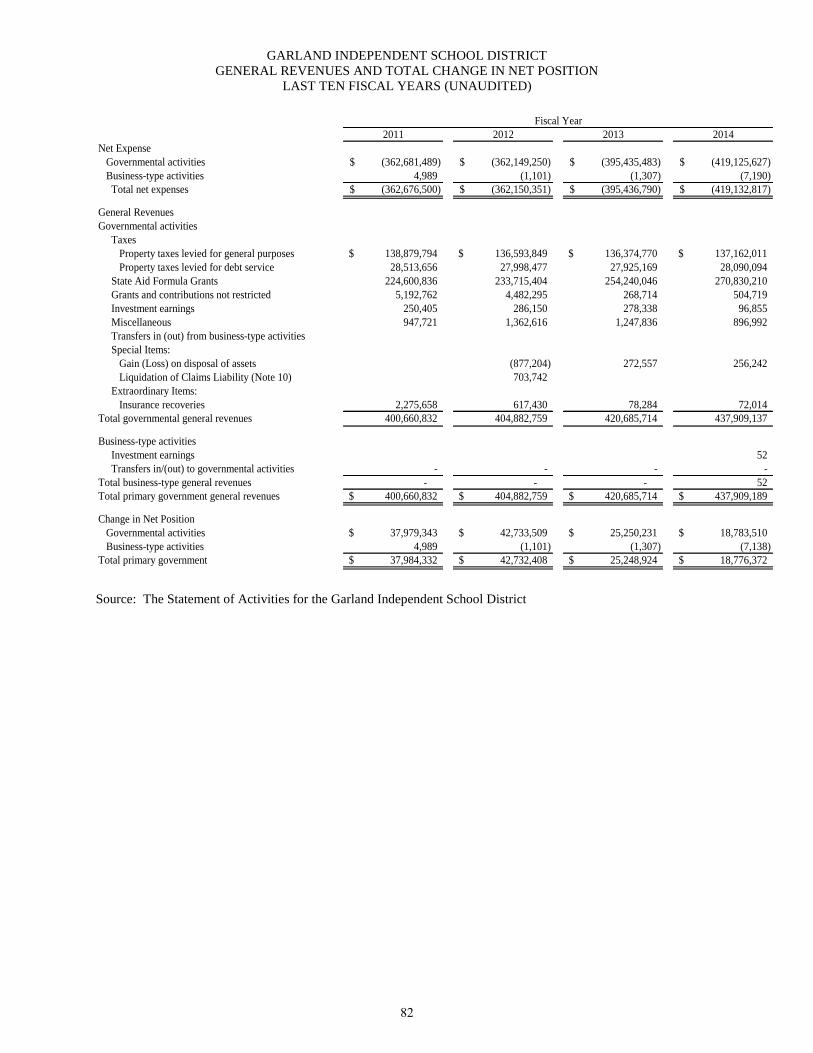
GARLAND INDEPENDENT SCHOOL DISTRICT
GENERAL REVENUES AND TOTAL CHANGE IN NET POSITION
LAST TEN FISCAL YEARS (UNAUDITED)
2011 2012 2013 2014
Net Expense
Governmental activities (362,681,489)$ (362,149,250)$ (395,435,483)$ (419,125,627)$
Business-type activities 4,989 (1,101) (1,307) (7,190)
Total net expenses (362,676,500)$ (362,150,351)$ (395,436,790)$ (419,132,817)$
General Revenues
Governmental activities
Taxes
Property taxes levied for general purposes 138,879,794$ 136,593,849$ 136,374,770$ 137,162,011$
Property taxes levied for debt service 28,513,656 27,998,477 27,925,169 28,090,094
State Aid Formula Grants 224,600,836 233,715,404 254,240,046 270,830,210
Grants and contributions not restricted 5,192,762 4,482,295 268,714 504,719
Investment earnings 250,405 286,150 278,338 96,855
Miscellaneous 947,721 1,362,616 1,247,836 896,992
Transfers in (out) from business-type activities
Special Items:
Gain (Loss) on disposal of assets (877,204) 272,557 256,242
Liquidation of Claims Liability (Note 10) 703,742
Extraordinary Items:
Insurance recoveries 2,275,658 617,430 78,284 72,014
Total governmental general revenues 400,660,832 404,882,759 420,685,714 437,909,137
Business-type activities
Investment earnings 52
Transfers in/(out) to governmental activities - - - -
Total business-type general revenues - - - 52
Total primary government general revenues 400,660,832$ 404,882,759$ 420,685,714$ 437,909,189$
Change in Net Position
Governmental activities 37,979,343$ 42,733,509$ 25,250,231$ 18,783,510$
Business-type activities 4,989 (1,101) (1,307) (7,138)
Total primary government 37,984,332$ 42,732,408$ 25,248,924$ 18,776,372$
Fiscal Year
Source: The Statement of Activities for the Garland Independent School District
82
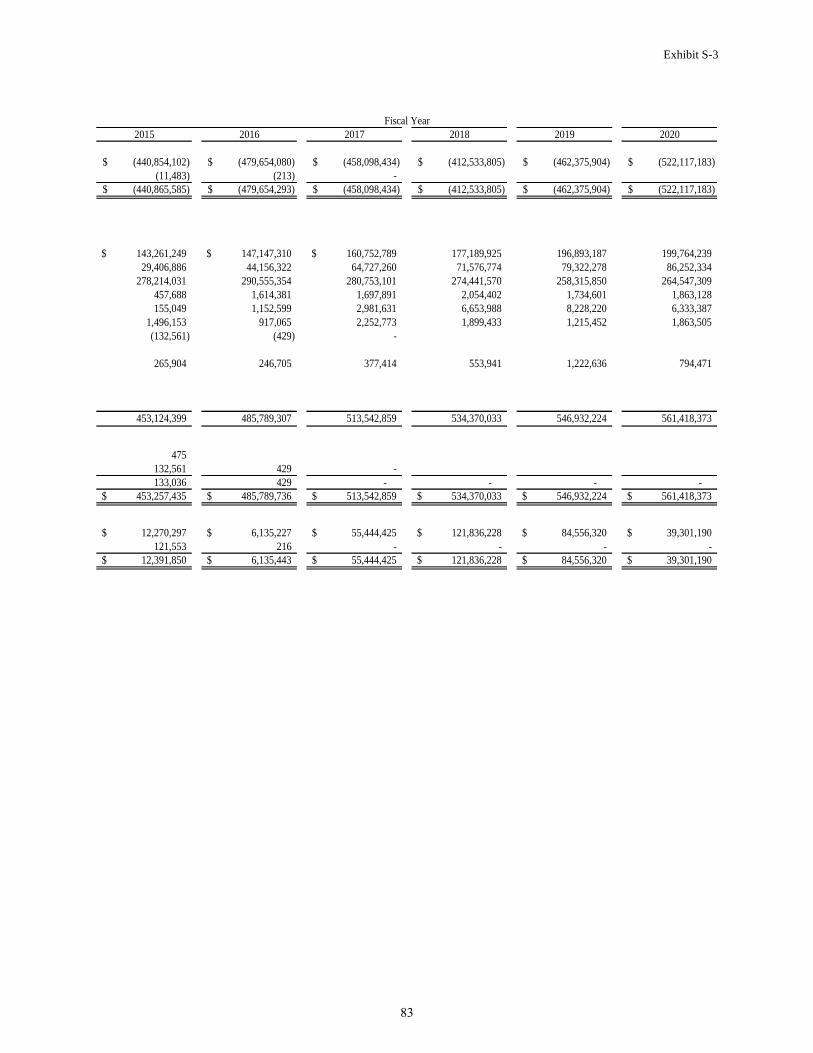
Exhibit S-3
2015 2016 2017 2018 2019 2020
(440,854,102)$ (479,654,080)$ (458,098,434)$ (412,533,805)$ (462,375,904)$ (522,117,183)$
(11,483) (213) -
(440,865,585)$ (479,654,293)$ (458,098,434)$ (412,533,805)$ (462,375,904)$ (522,117,183)$
143,261,249$ 147,147,310$ 160,752,789$ 177,189,925 196,893,187 199,764,239
29,406,886 44,156,322 64,727,260 71,576,774 79,322,278 86,252,334
278,214,031 290,555,354 280,753,101 274,441,570 258,315,850 264,547,309
457,688 1,614,381 1,697,891 2,054,402 1,734,601 1,863,128
155,049 1,152,599 2,981,631 6,653,988 8,228,220 6,333,387
1,496,153 917,065 2,252,773 1,899,433 1,215,452 1,863,505
(132,561) (429) -
265,904 246,705 377,414 553,941 1,222,636 794,471
453,124,399 485,789,307 513,542,859 534,370,033 546,932,224 561,418,373
475
132,561 429 -
133,036 429 - - - -
453,257,435$ 485,789,736$ 513,542,859$ 534,370,033$ 546,932,224$ 561,418,373$
12,270,297$ 6,135,227$ 55,444,425$ 121,836,228$ 84,556,320$ 39,301,190$
121,553 216 - - - -
12,391,850$ 6,135,443$ 55,444,425$ 121,836,228$ 84,556,320$ 39,301,190$
Fiscal Year
83
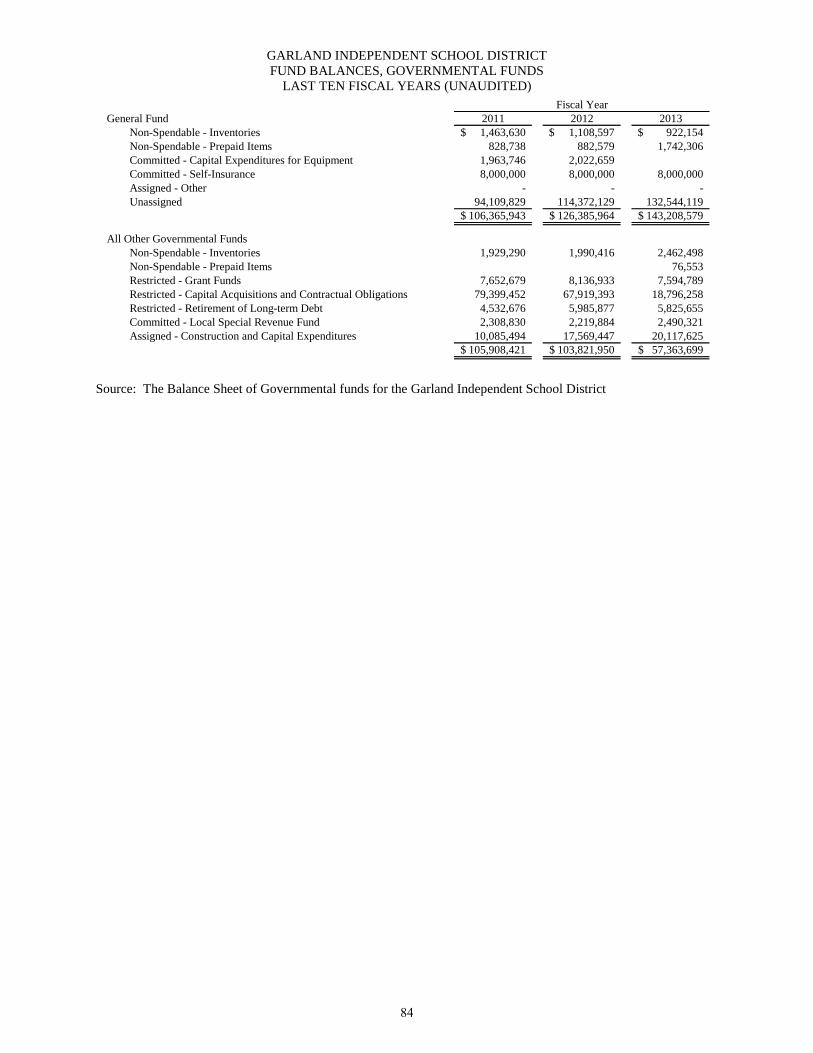
GARLAND INDEPENDENT SCHOOL DISTRICT
FUND BALANCES, GOVERNMENTAL FUNDS
LAST TEN FISCAL YEARS (UNAUDITED)
General Fund 2011 2012 2013
Non-Spendable - Inventories 1,463,630$ 1,108,597$ 922,154$
Non-Spendable - Prepaid Items 828,738 882,579 1,742,306
Committed - Capital Expenditures for Equipment 1,963,746 2,022,659
Committed - Self-Insurance 8,000,000 8,000,000 8,000,000
Assigned - Other - - -
Unassigned 94,109,829 114,372,129 132,544,119
106,365,943$ 126,385,964$ 143,208,579$
All Other Governmental Funds
Non-Spendable - Inventories 1,929,290 1,990,416 2,462,498
Non-Spendable - Prepaid Items 76,553
Restricted - Grant Funds 7,652,679 8,136,933 7,594,789
Restricted - Capital Acquisitions and Contractual Obligations 79,399,452 67,919,393 18,796,258
Restricted - Retirement of Long-term Debt 4,532,676 5,985,877 5,825,655
Committed - Local Special Revenue Fund 2,308,830 2,219,884 2,490,321
Assigned - Construction and Capital Expenditures 10,085,494 17,569,447 20,117,625
105,908,421$ 103,821,950$ 57,363,699$
Fiscal Year
Source: The Balance Sheet of Governmental funds for the Garland Independent School District
84
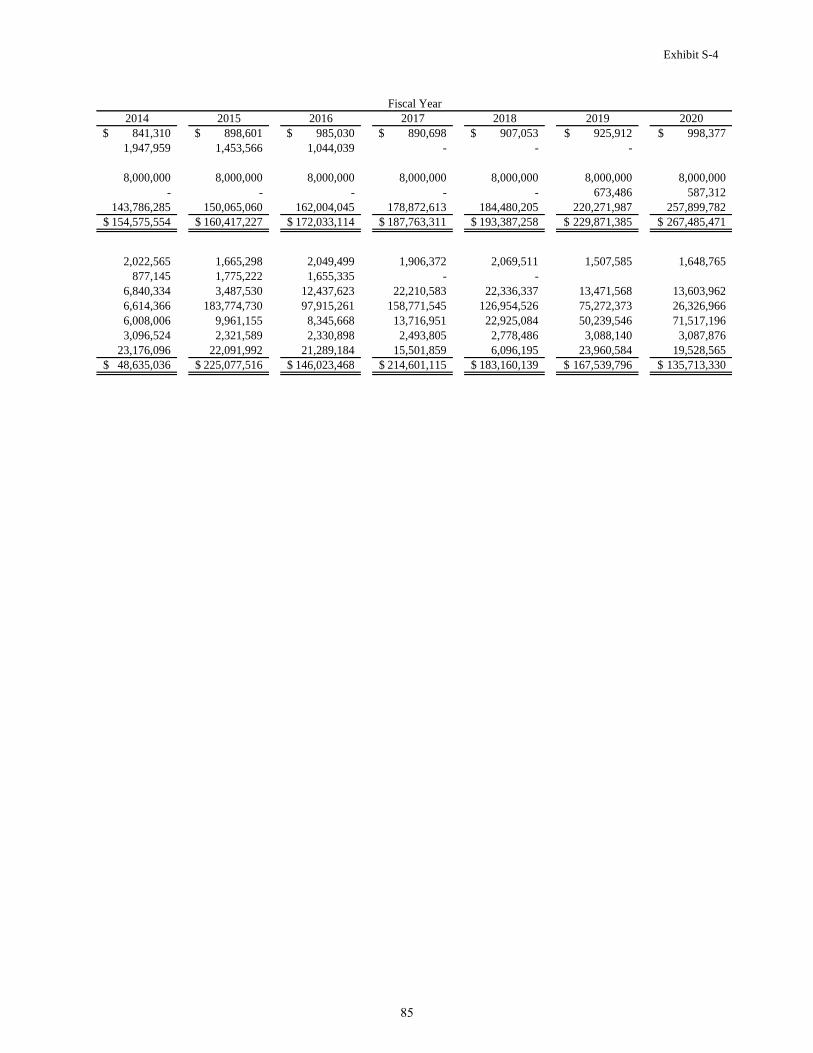
Exhibit S-4
2014 2015 2016 2017 2018 2019 2020
841,310$ 898,601$ 985,030$ 890,698$ 907,053$ 925,912$ 998,377$
1,947,959 1,453,566 1,044,039 - - -
8,000,000 8,000,000 8,000,000 8,000,000 8,000,000 8,000,000 8,000,000
- - - - - 673,486 587,312
143,786,285 150,065,060 162,004,045 178,872,613 184,480,205 220,271,987 257,899,782
154,575,554$ 160,417,227$ 172,033,114$ 187,763,311$ 193,387,258$ 229,871,385$ 267,485,471$
2,022,565 1,665,298 2,049,499 1,906,372 2,069,511 1,507,585 1,648,765
877,145 1,775,222 1,655,335 - -
6,840,334 3,487,530 12,437,623 22,210,583 22,336,337 13,471,568 13,603,962
6,614,366 183,774,730 97,915,261 158,771,545 126,954,526 75,272,373 26,326,966
6,008,006 9,961,155 8,345,668 13,716,951 22,925,084 50,239,546 71,517,196
3,096,524 2,321,589 2,330,898 2,493,805 2,778,486 3,088,140 3,087,876
23,176,096 22,091,992 21,289,184 15,501,859 6,096,195 23,960,584 19,528,565
48,635,036$ 225,077,516$ 146,023,468$ 214,601,115$ 183,160,139$ 167,539,796$ 135,713,330$
Fiscal Year
85
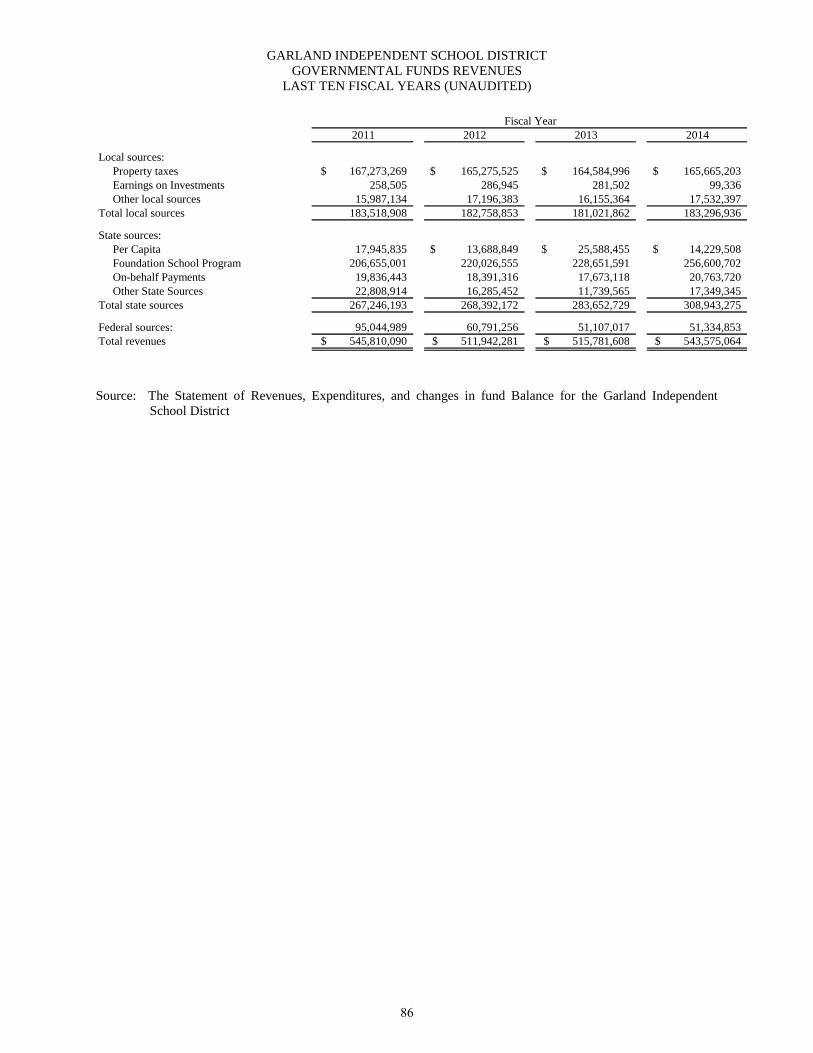
GARLAND INDEPENDENT SCHOOL DISTRICT
GOVERNMENTAL FUNDS REVENUES
LAST TEN FISCAL YEARS (UNAUDITED)
2011 2012 2013 2014
Local sources:
Property taxes 167,273,269$ 165,275,525$ 164,584,996$ 165,665,203$
Earnings on Investments 258,505 286,945 281,502 99,336
Other local sources 15,987,134 17,196,383 16,155,364 17,532,397
Total local sources 183,518,908 182,758,853 181,021,862 183,296,936
State sources:
Per Capita 17,945,835 13,688,849$ 25,588,455$ 14,229,508$
Foundation School Program 206,655,001 220,026,555 228,651,591 256,600,702
On-behalf Payments 19,836,443 18,391,316 17,673,118 20,763,720
Other State Sources 22,808,914 16,285,452 11,739,565 17,349,345
Total state sources 267,246,193 268,392,172 283,652,729 308,943,275
Federal sources: 95,044,989 60,791,256 51,107,017 51,334,853
Total revenues 545,810,090$ 511,942,281$ 515,781,608$ 543,575,064$
Fiscal Year
Source: The Statement of Revenues, Expenditures, and changes in fund Balance for the Garland Independent
School District
86
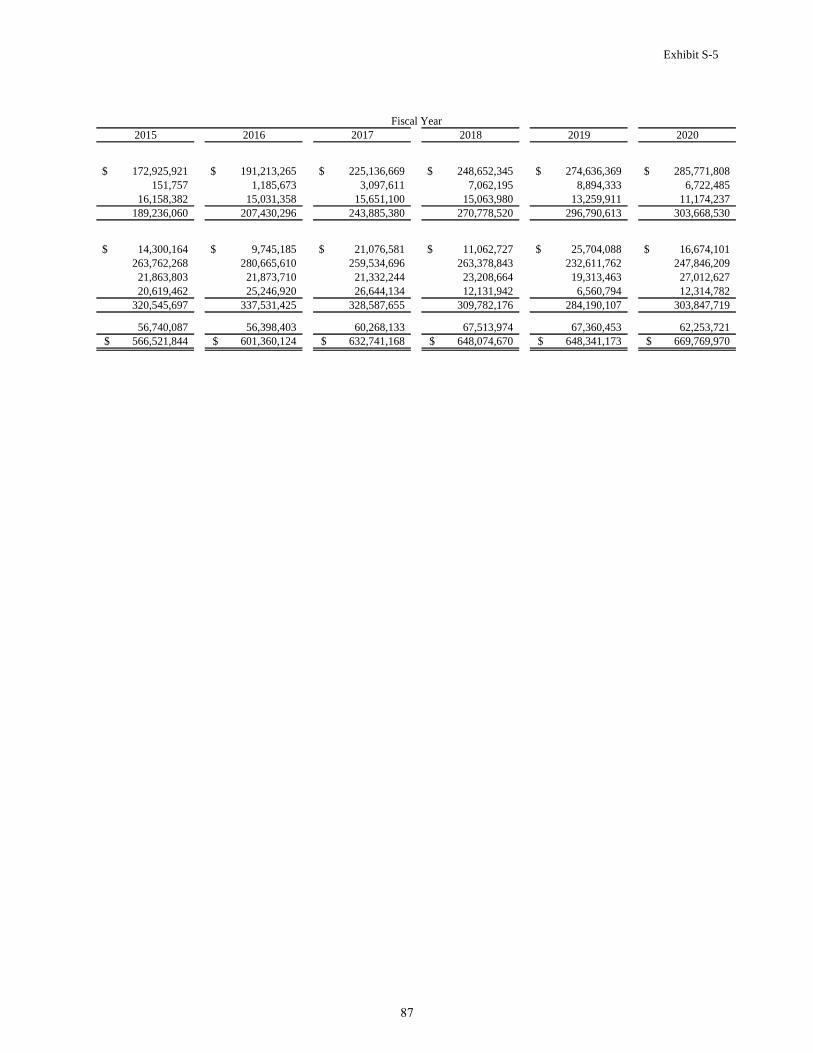
Exhibit S-5
2015 2016 2017 2018 2019 2020
172,925,921$ 191,213,265$ 225,136,669$ 248,652,345$ 274,636,369$ 285,771,808$
151,757 1,185,673 3,097,611 7,062,195 8,894,333 6,722,485
16,158,382 15,031,358 15,651,100 15,063,980 13,259,911 11,174,237
189,236,060 207,430,296 243,885,380 270,778,520 296,790,613 303,668,530
14,300,164$ 9,745,185$ 21,076,581$ 11,062,727$ 25,704,088$ 16,674,101$
263,762,268 280,665,610 259,534,696 263,378,843 232,611,762 247,846,209
21,863,803 21,873,710 21,332,244 23,208,664 19,313,463 27,012,627
20,619,462 25,246,920 26,644,134 12,131,942 6,560,794 12,314,782
320,545,697 337,531,425 328,587,655 309,782,176 284,190,107 303,847,719
56,740,087 56,398,403 60,268,133 67,513,974 67,360,453 62,253,721
566,521,844$ 601,360,124$ 632,741,168$ 648,074,670$ 648,341,173$ 669,769,970$
Fiscal Year
87
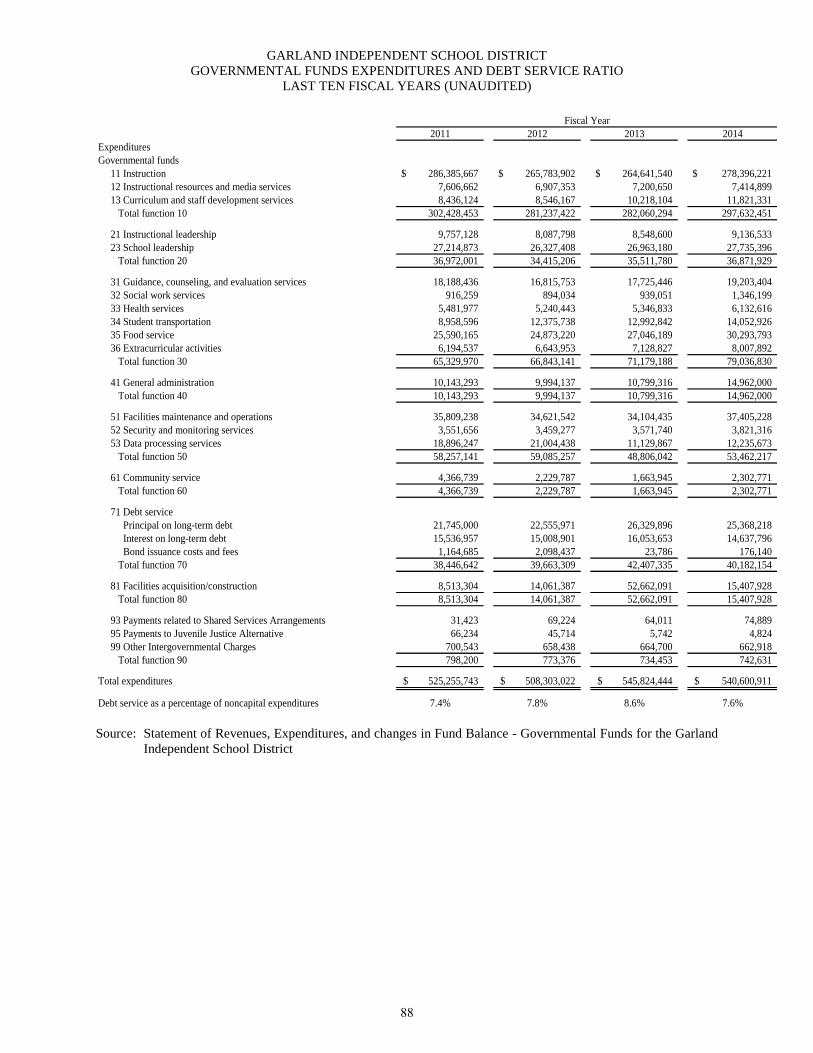
GARLAND INDEPENDENT SCHOOL DISTRICT
GOVERNMENTAL FUNDS EXPENDITURES AND DEBT SERVICE RATIO
LAST TEN FISCAL YEARS (UNAUDITED)
2011 2012 2013 2014
Expenditures
Governmental funds
11 Instruction 286,385,667$ 265,783,902$ 264,641,540$ 278,396,221$
12 Instructional resources and media services 7,606,662 6,907,353 7,200,650 7,414,899
13 Curriculum and staff development services 8,436,124 8,546,167 10,218,104 11,821,331
Total function 10 302,428,453 281,237,422 282,060,294 297,632,451
21 Instructional leadership 9,757,128 8,087,798 8,548,600 9,136,533
23 School leadership 27,214,873 26,327,408 26,963,180 27,735,396
Total function 20 36,972,001 34,415,206 35,511,780 36,871,929
31 Guidance, counseling, and evaluation services 18,188,436 16,815,753 17,725,446 19,203,404
32 Social work services 916,259 894,034 939,051 1,346,199
33 Health services 5,481,977 5,240,443 5,346,833 6,132,616
34 Student transportation 8,958,596 12,375,738 12,992,842 14,052,926
35 Food service 25,590,165 24,873,220 27,046,189 30,293,793
36 Extracurricular activities 6,194,537 6,643,953 7,128,827 8,007,892
Total function 30 65,329,970 66,843,141 71,179,188 79,036,830
41 General administration 10,143,293 9,994,137 10,799,316 14,962,000
Total function 40 10,143,293 9,994,137 10,799,316 14,962,000
51 Facilities maintenance and operations 35,809,238 34,621,542 34,104,435 37,405,228
52 Security and monitoring services 3,551,656 3,459,277 3,571,740 3,821,316
53 Data processing services 18,896,247 21,004,438 11,129,867 12,235,673
Total function 50 58,257,141 59,085,257 48,806,042 53,462,217
61 Community service 4,366,739 2,229,787 1,663,945 2,302,771
Total function 60 4,366,739 2,229,787 1,663,945 2,302,771
71 Debt service
Principal on long-term debt 21,745,000 22,555,971 26,329,896 25,368,218
Interest on long-term debt 15,536,957 15,008,901 16,053,653 14,637,796
Bond issuance costs and fees 1,164,685 2,098,437 23,786 176,140
Total function 70 38,446,642 39,663,309 42,407,335 40,182,154
81 Facilities acquisition/construction 8,513,304 14,061,387 52,662,091 15,407,928
Total function 80 8,513,304 14,061,387 52,662,091 15,407,928
93 Payments related to Shared Services Arrangements 31,423 69,224 64,011 74,889
95 Payments to Juvenile Justice Alternative 66,234 45,714 5,742 4,824
99 Other Intergovernmental Charges 700,543 658,438 664,700 662,918
Total function 90 798,200 773,376 734,453 742,631
Total expenditures 525,255,743$ 508,303,022$ 545,824,444$ 540,600,911$
Debt service as a percentage of noncapital expenditures 7.4% 7.8% 8.6% 7.6%
Fiscal Year
Source: Statement of Revenues, Expenditures, and changes in Fund Balance - Governmental Funds for the Garland
Independent School District
88
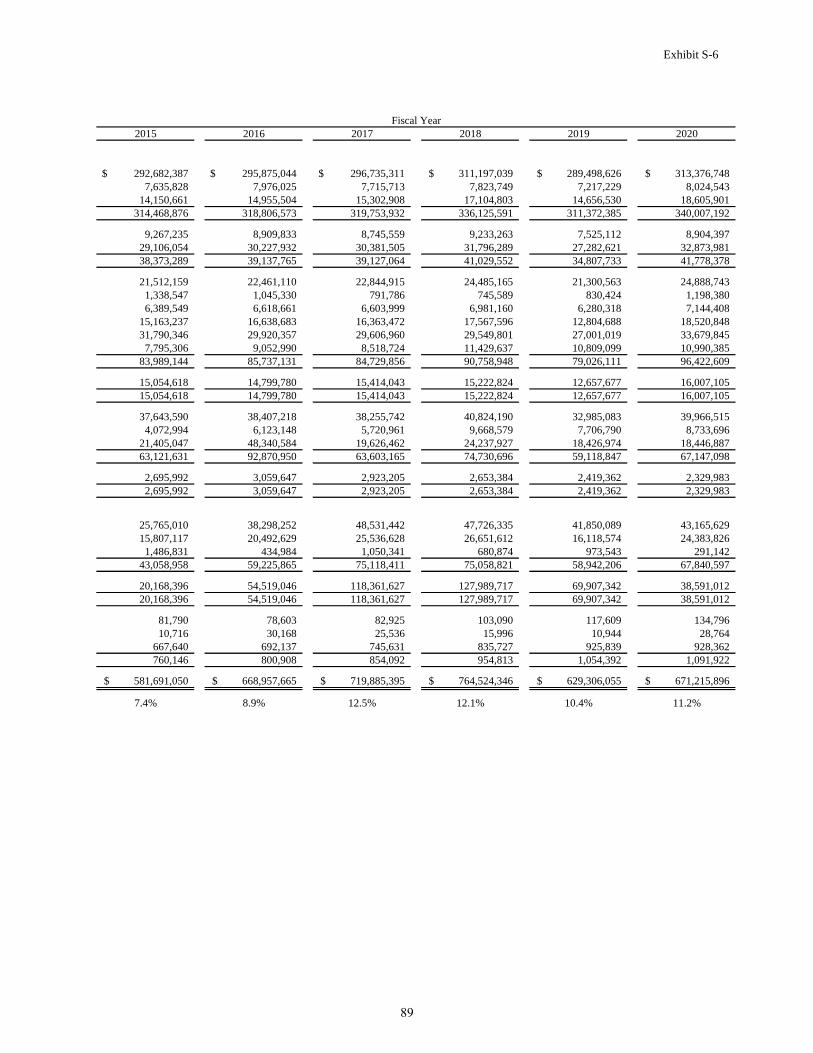
Exhibit S-6
2015 2016 2017 2018 2019 2020
292,682,387$ 295,875,044$ 296,735,311$ 311,197,039$ 289,498,626$ 313,376,748$
7,635,828 7,976,025 7,715,713 7,823,749 7,217,229 8,024,543
14,150,661 14,955,504 15,302,908 17,104,803 14,656,530 18,605,901
314,468,876 318,806,573 319,753,932 336,125,591 311,372,385 340,007,192
9,267,235 8,909,833 8,745,559 9,233,263 7,525,112 8,904,397
29,106,054 30,227,932 30,381,505 31,796,289 27,282,621 32,873,981
38,373,289 39,137,765 39,127,064 41,029,552 34,807,733 41,778,378
21,512,159 22,461,110 22,844,915 24,485,165 21,300,563 24,888,743
1,338,547 1,045,330 791,786 745,589 830,424 1,198,380
6,389,549 6,618,661 6,603,999 6,981,160 6,280,318 7,144,408
15,163,237 16,638,683 16,363,472 17,567,596 12,804,688 18,520,848
31,790,346 29,920,357 29,606,960 29,549,801 27,001,019 33,679,845
7,795,306 9,052,990 8,518,724 11,429,637 10,809,099 10,990,385
83,989,144 85,737,131 84,729,856 90,758,948 79,026,111 96,422,609
15,054,618 14,799,780 15,414,043 15,222,824 12,657,677 16,007,105
15,054,618 14,799,780 15,414,043 15,222,824 12,657,677 16,007,105
37,643,590 38,407,218 38,255,742 40,824,190 32,985,083 39,966,515
4,072,994 6,123,148 5,720,961 9,668,579 7,706,790 8,733,696
21,405,047 48,340,584 19,626,462 24,237,927 18,426,974 18,446,887
63,121,631 92,870,950 63,603,165 74,730,696 59,118,847 67,147,098
2,695,992 3,059,647 2,923,205 2,653,384 2,419,362 2,329,983
2,695,992 3,059,647 2,923,205 2,653,384 2,419,362 2,329,983
25,765,010 38,298,252 48,531,442 47,726,335 41,850,089 43,165,629
15,807,117 20,492,629 25,536,628 26,651,612 16,118,574 24,383,826
1,486,831 434,984 1,050,341 680,874 973,543 291,142
43,058,958 59,225,865 75,118,411 75,058,821 58,942,206 67,840,597
20,168,396 54,519,046 118,361,627 127,989,717 69,907,342 38,591,012
20,168,396 54,519,046 118,361,627 127,989,717 69,907,342 38,591,012
81,790 78,603 82,925 103,090 117,609 134,796
10,716 30,168 25,536 15,996 10,944 28,764
667,640 692,137 745,631 835,727 925,839 928,362
760,146 800,908 854,092 954,813 1,054,392 1,091,922
581,691,050$ 668,957,665$ 719,885,395$ 764,524,346$ 629,306,055$ 671,215,896$
7.4% 8.9% 12.5% 12.1% 10.4% 11.2%
Fiscal Year
89
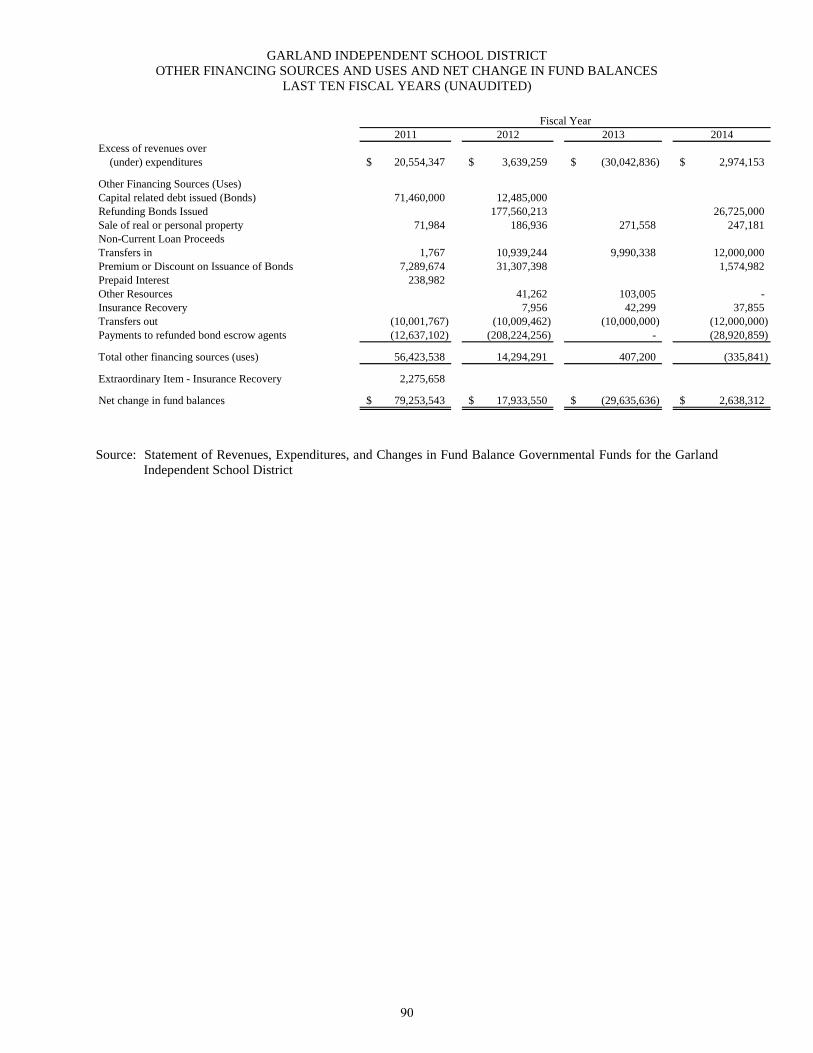
GARLAND INDEPENDENT SCHOOL DISTRICT
OTHER FINANCING SOURCES AND USES AND NET CHANGE IN FUND BALANCES
LAST TEN FISCAL YEARS (UNAUDITED)
2011 2012 2013 2014
Excess of revenues over
(under) expenditures 20,554,347$ 3,639,259$ (30,042,836)$ 2,974,153$
Other Financing Sources (Uses)
Capital related debt issued (Bonds) 71,460,000 12,485,000
Refunding Bonds Issued 177,560,213 26,725,000
Sale of real or personal property 71,984 186,936 271,558 247,181
Non-Current Loan Proceeds
Transfers in 1,767 10,939,244 9,990,338 12,000,000
Premium or Discount on Issuance of Bonds 7,289,674 31,307,398 1,574,982
Prepaid Interest 238,982
Other Resources 41,262 103,005 -
Insurance Recovery 7,956 42,299 37,855
Transfers out (10,001,767) (10,009,462) (10,000,000) (12,000,000)
Payments to refunded bond escrow agents (12,637,102) (208,224,256) - (28,920,859)
Total other financing sources (uses) 56,423,538 14,294,291 407,200 (335,841)
Extraordinary Item - Insurance Recovery 2,275,658
Net change in fund balances 79,253,543$ 17,933,550$ (29,635,636)$ 2,638,312$
Fiscal Year
Source: Statement of Revenues, Expenditures, and Changes in Fund Balance Governmental Funds for the Garland
Independent School District
90
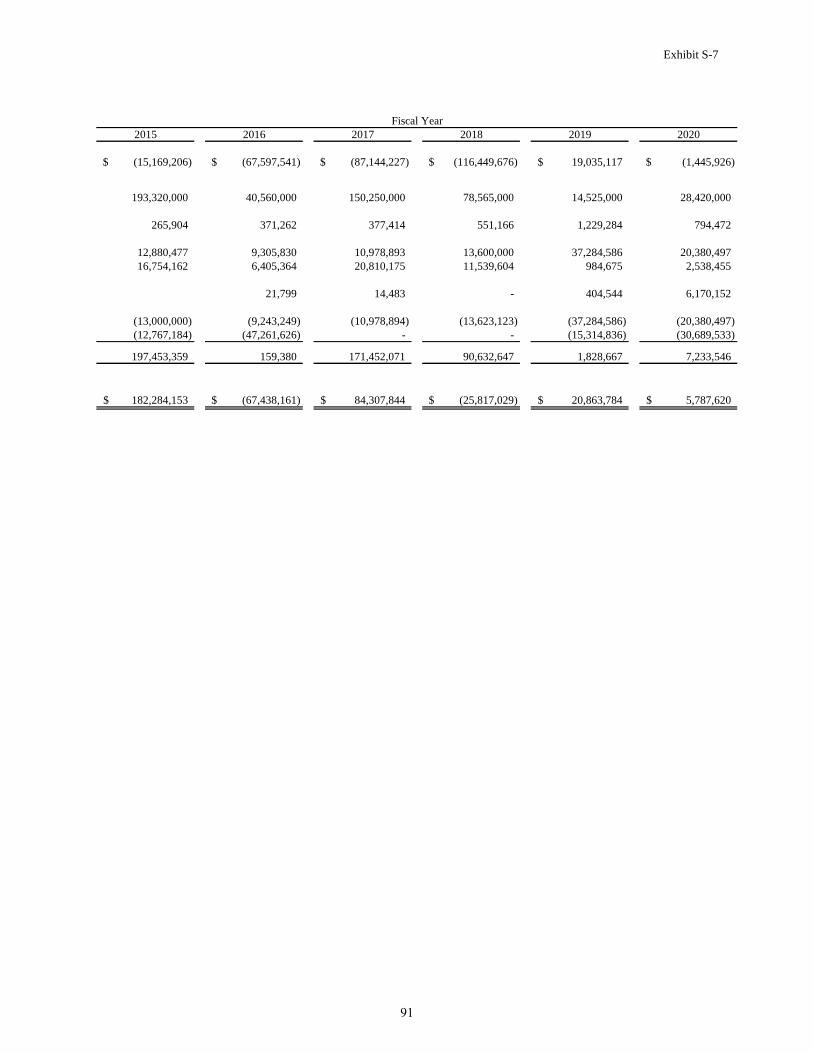
Exhibit S-7
2015 2016 2017 2018 2019 2020
(15,169,206)$ (67,597,541)$ (87,144,227)$ (116,449,676)$ 19,035,117$ (1,445,926)$
193,320,000 40,560,000 150,250,000 78,565,000 14,525,000 28,420,000
265,904 371,262 377,414 551,166 1,229,284 794,472
12,880,477 9,305,830 10,978,893 13,600,000 37,284,586 20,380,497
16,754,162 6,405,364 20,810,175 11,539,604 984,675 2,538,455
21,799 14,483 - 404,544 6,170,152
(13,000,000) (9,243,249) (10,978,894) (13,623,123) (37,284,586) (20,380,497)
(12,767,184) (47,261,626) - - (15,314,836) (30,689,533)
197,453,359 159,380 171,452,071 90,632,647 1,828,667 7,233,546
182,284,153$ (67,438,161)$ 84,307,844$ (25,817,029)$ 20,863,784$ 5,787,620$
Fiscal Year
91
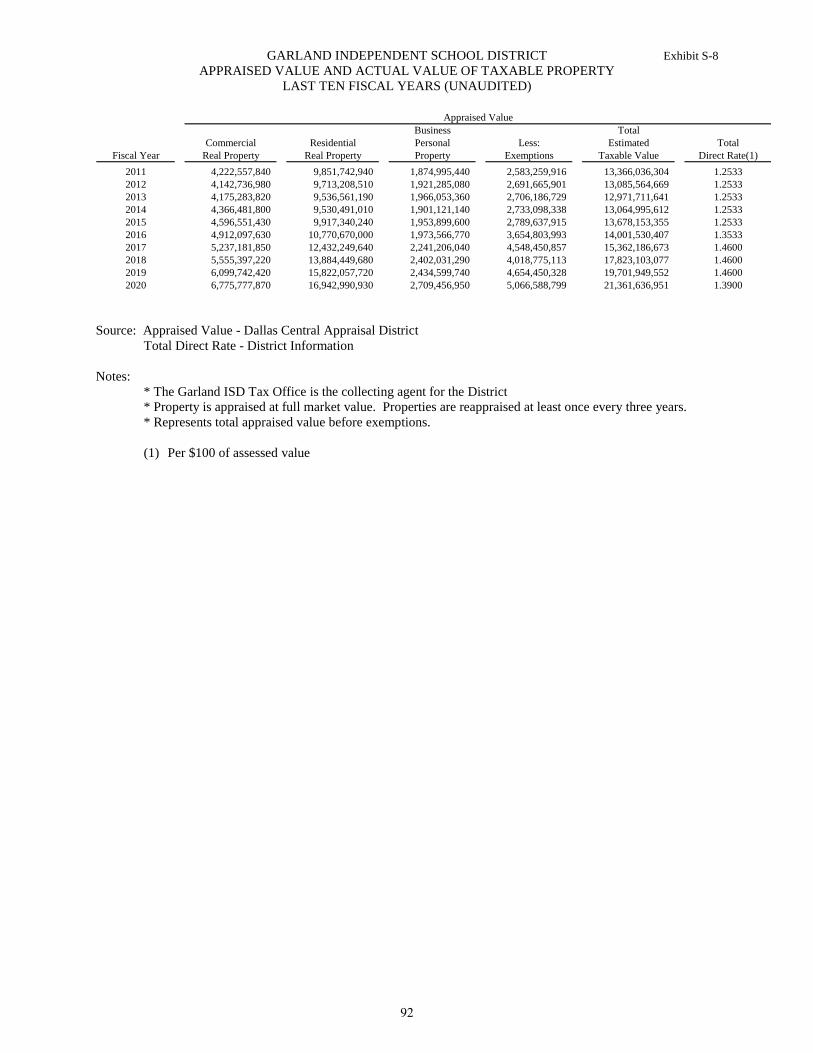
GARLAND INDEPENDENT SCHOOL DISTRICT Exhibit S-8
APPRAISED VALUE AND ACTUAL VALUE OF TAXABLE PROPERTY
LAST TEN FISCAL YEARS (UNAUDITED)
Business Total
Commercial Residential Personal Less: Estimated Total
Fiscal Year Real Property Real Property Property Exemptions Taxable Value Direct Rate(1)
2011 4,222,557,840 9,851,742,940 1,874,995,440 2,583,259,916 13,366,036,304 1.2533
2012 4,142,736,980 9,713,208,510 1,921,285,080 2,691,665,901 13,085,564,669 1.2533
2013 4,175,283,820 9,536,561,190 1,966,053,360 2,706,186,729 12,971,711,641 1.2533
2014 4,366,481,800 9,530,491,010 1,901,121,140 2,733,098,338 13,064,995,612 1.2533
2015 4,596,551,430 9,917,340,240 1,953,899,600 2,789,637,915 13,678,153,355 1.2533
2016 4,912,097,630 10,770,670,000 1,973,566,770 3,654,803,993 14,001,530,407 1.3533
2017 5,237,181,850 12,432,249,640 2,241,206,040 4,548,450,857 15,362,186,673 1.4600
2018 5,555,397,220 13,884,449,680 2,402,031,290 4,018,775,113 17,823,103,077 1.4600
2019 6,099,742,420 15,822,057,720 2,434,599,740 4,654,450,328 19,701,949,552 1.4600
2020 6,775,777,870 16,942,990,930 2,709,456,950 5,066,588,799 21,361,636,951 1.3900
Appraised Value
Source: Appraised Value - Dallas Central Appraisal District
Total Direct Rate - District Information
Notes:
* The Garland ISD Tax Office is the collecting agent for the District
* Property is appraised at full market value. Properties are reappraised at least once every three years.
* Represents total appraised value before exemptions.
(1) Per $100 of assessed value
92

GARLAND INDEPENDENT SCHOOL DISTRICT Exhibit S-9
DIRECT AND OVERLAPPING PROPERTY TAX RATES
LAST TEN FISCAL YEARS (UNAUDITED)
Maintenance City City City City City
and Debt of Dallas of of of of
Fiscal Year Operations Service Total Garland County Rowlett Sachse Dallas Mesquite2010 1.0400 0.2133 1.2533 0.7046 0.6022 0.7472 0.7058 0.7479 0.6400
2011 1.0400 0.2133 1.2533 0.7046 0.6233 0.7472 0.7058 0.7970 0.6400
2012 1.0400 0.2133 1.2533 0.7046 0.6237 0.7472 0.7708 0.7970 0.6400
2013 1.0400 0.2133 1.2533 0.7046 0.6434 0.7472 0.7708 0.7970 0.6400
2014 1.0400 0.2133 1.2533 0.7046 0.6538 0.7472 0.7708 0.7970 0.6400
2015 1.0400 0.2133 1.2533 0.7046 0.6639 0.7872 0.7708 0.7970 0.6400
2016 1.0400 0.3133 1.3533 0.7046 0.6628 0.7872 0.7573 0.7970 0.6400
2017 1.0400 0.4200 1.4600 0.7046 0.6547 0.7872 0.7573 0.7825 0.6870
2018 1.0400 0.4200 1.4600 0.7046 0.6567 0.7772 0.7473 0.7804 0.6870
2019 1.0400 0.4200 1.4600 0.7046 0.6565 0.7572 0.7200 0.7767 0.7340
2020 0.9700 0.4200 1.3900 0.7696 0.6466 0.7572 0.7200 0.7766 0.7340
Garland Independent School District Overlapping Rates
Source: Appropriate government entities' tax departments.
Note: Tax rates are per $1,000 of assessed value.
93
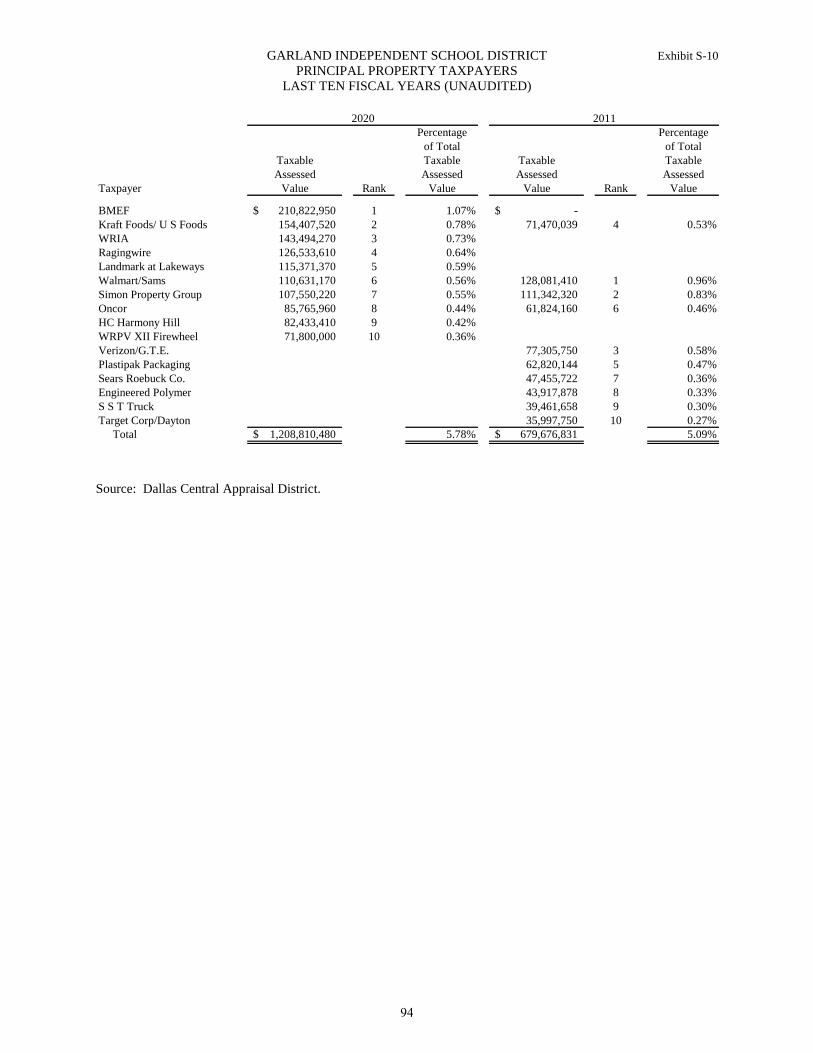
GARLAND INDEPENDENT SCHOOL DISTRICT Exhibit S-10
PRINCIPAL PROPERTY TAXPAYERS
LAST TEN FISCAL YEARS (UNAUDITED)
Percentage Percentage
of Total of Total
Taxable Taxable Taxable Taxable
Assessed Assessed Assessed Assessed
Taxpayer Value Rank Value Value Rank Value
BMEF 210,822,950$ 1 1.07% -$
Kraft Foods/ U S Foods 154,407,520 2 0.78% 71,470,039 4 0.53%
WRIA 143,494,270 3 0.73%
Ragingwire 126,533,610 4 0.64%
Landmark at Lakeways 115,371,370 5 0.59%
Walmart/Sams 110,631,170 6 0.56% 128,081,410 1 0.96%
Simon Property Group 107,550,220 7 0.55% 111,342,320 2 0.83%
Oncor 85,765,960 8 0.44% 61,824,160 6 0.46%
HC Harmony Hill 82,433,410 9 0.42%
WRPV XII Firewheel 71,800,000 10 0.36%
Verizon/G.T.E. 77,305,750 3 0.58%
Plastipak Packaging 62,820,144 5 0.47%
Sears Roebuck Co. 47,455,722 7 0.36%
Engineered Polymer 43,917,878 8 0.33%
S S T Truck 39,461,658 9 0.30%
Target Corp/Dayton 35,997,750 10 0.27%
Total 1,208,810,480$ 5.78% 679,676,831$ 5.09%
2020 2011
Source: Dallas Central Appraisal District.
94
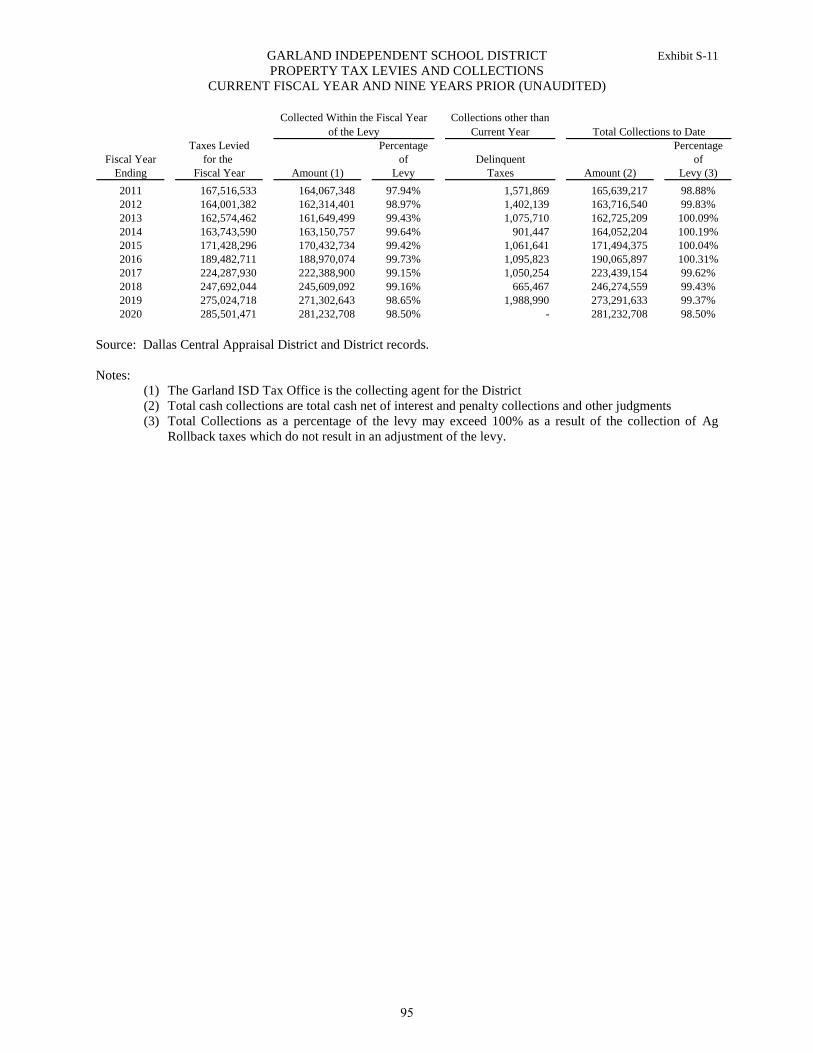
GARLAND INDEPENDENT SCHOOL DISTRICT Exhibit S-11
PROPERTY TAX LEVIES AND COLLECTIONS
CURRENT FISCAL YEAR AND NINE YEARS PRIOR (UNAUDITED)
Taxes Levied Percentage Percentage
Fiscal Year for the of Delinquent of
Ending Fiscal Year Amount (1) Levy Taxes Amount (2) Levy (3)2004 172,624,543 169,742,514 98.33% 3,134,760 172,877,274 100.15%
2011 167,516,533 164,067,348 97.94% 1,571,869 165,639,217 98.88%
2012 164,001,382 162,314,401 98.97% 1,402,139 163,716,540 99.83%
2013 162,574,462 161,649,499 99.43% 1,075,710 162,725,209 100.09%
2014 163,743,590 163,150,757 99.64% 901,447 164,052,204 100.19%
2015 171,428,296 170,432,734 99.42% 1,061,641 171,494,375 100.04%
2016 189,482,711 188,970,074 99.73% 1,095,823 190,065,897 100.31%
2017 224,287,930 222,388,900 99.15% 1,050,254 223,439,154 99.62%
2018 247,692,044 245,609,092 99.16% 665,467 246,274,559 99.43%
2019 275,024,718 271,302,643 98.65% 1,988,990 273,291,633 99.37%
2020 285,501,471 281,232,708 98.50% - 281,232,708 98.50%
Collected Within the Fiscal Year
of the Levy
Collections other than
Current Year Total Collections to Date
Source: Dallas Central Appraisal District and District records.
Notes:
(1) The Garland ISD Tax Office is the collecting agent for the District
(2) Total cash collections are total cash net of interest and penalty collections and other judgments
(3) Total Collections as a percentage of the levy may exceed 100% as a result of the collection of Ag
Rollback taxes which do not result in an adjustment of the levy.
95
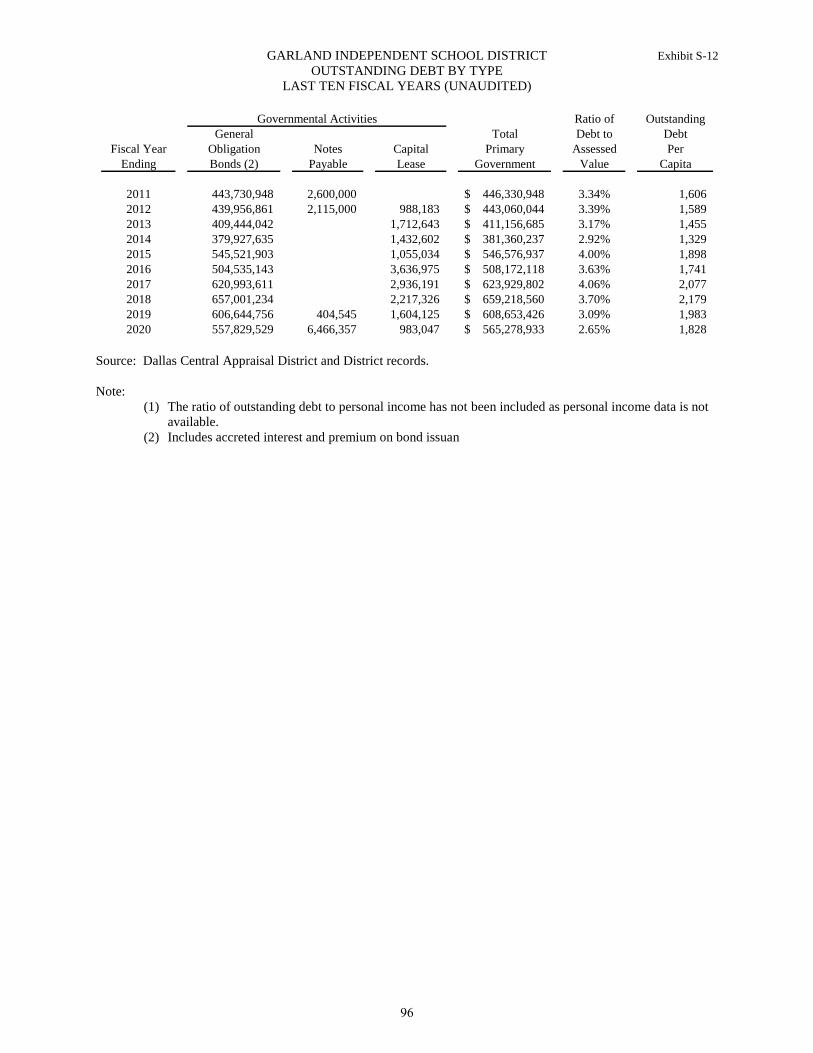
GARLAND INDEPENDENT SCHOOL DISTRICT Exhibit S-12
OUTSTANDING DEBT BY TYPE
LAST TEN FISCAL YEARS (UNAUDITED)
Ratio of Outstanding
General Total Debt to Debt
Fiscal Year Obligation Notes Capital Primary Assessed Per
Ending Bonds (2) Payable Lease Government Value Capita
2011 443,730,948 2,600,000 446,330,948$ 3.34% 1,606
2012 439,956,861 2,115,000 988,183 443,060,044$ 3.39% 1,589
2013 409,444,042 1,712,643 411,156,685$ 3.17% 1,455
2014 379,927,635 1,432,602 381,360,237$ 2.92% 1,329
2015 545,521,903 1,055,034 546,576,937$ 4.00% 1,898
2016 504,535,143 3,636,975 508,172,118$ 3.63% 1,741
2017 620,993,611 2,936,191 623,929,802$ 4.06% 2,077
2018 657,001,234 2,217,326 659,218,560$ 3.70% 2,179
2019 606,644,756 404,545 1,604,125 608,653,426$ 3.09% 1,983
2020 557,829,529 6,466,357 983,047 565,278,933$ 2.65% 1,828
Governmental Activities
Source: Dallas Central Appraisal District and District records.
Note:
(1) The ratio of outstanding debt to personal income has not been included as personal income data is not
available.
(2) Includes accreted interest and premium on bond issuan
96
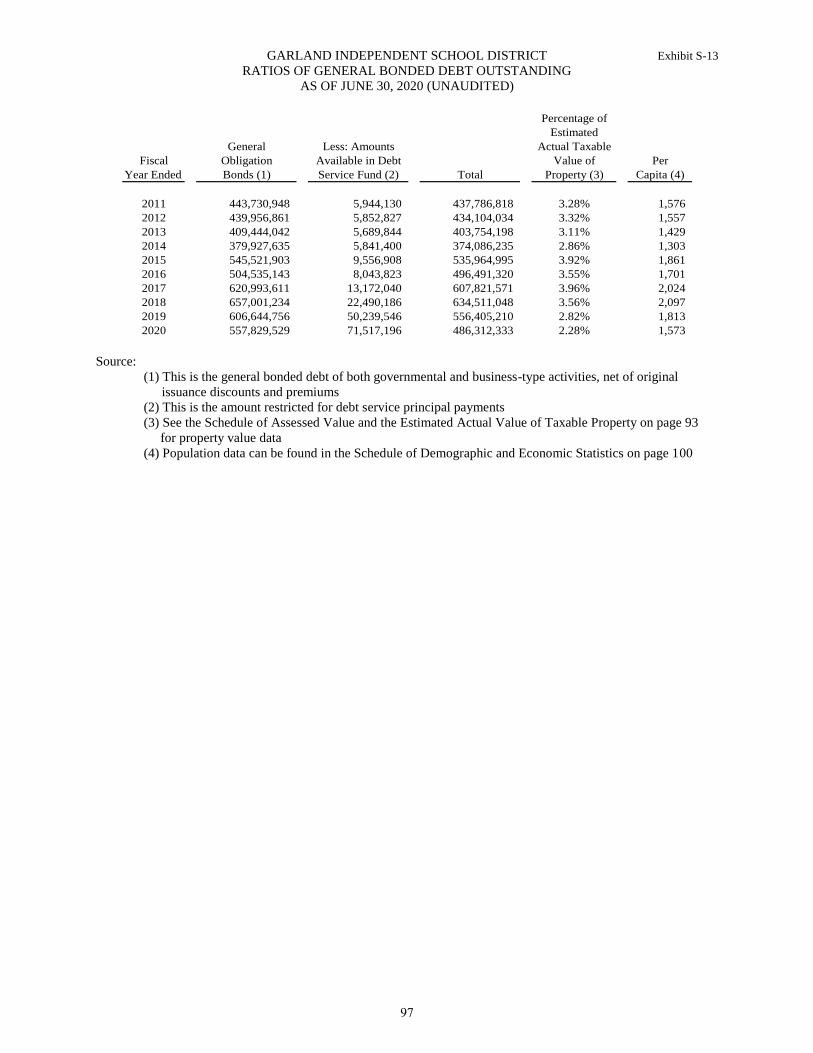
GARLAND INDEPENDENT SCHOOL DISTRICT Exhibit S-13
RATIOS OF GENERAL BONDED DEBT OUTSTANDING
AS OF JUNE 30, 2020 (UNAUDITED)
Percentage of
Estimated
General Less: Amounts Actual Taxable
Fiscal Obligation Available in Debt Value of Per
Year Ended Bonds (1) Service Fund (2) Total Property (3) Capita (4)
2009 421,052,464$ 2,867,279$ 418,185,185$ 2.97% 1,525$
2011 443,730,948 5,944,130 437,786,818 3.28% 1,576
2012 439,956,861 5,852,827 434,104,034 3.32% 1,557
2013 409,444,042 5,689,844 403,754,198 3.11% 1,429
2014 379,927,635 5,841,400 374,086,235 2.86% 1,303
2015 545,521,903 9,556,908 535,964,995 3.92% 1,861
2016 504,535,143 8,043,823 496,491,320 3.55% 1,701
2017 620,993,611 13,172,040 607,821,571 3.96% 2,024
2018 657,001,234 22,490,186 634,511,048 3.56% 2,097
2019 606,644,756 50,239,546 556,405,210 2.82% 1,813
2020 557,829,529 71,517,196 486,312,333 2.28% 1,573
Source:
(1) This is the general bonded debt of both governmental and business-type activities, net of original
issuance discounts and premiums
(2) This is the amount restricted for debt service principal payments
(3) See the Schedule of Assessed Value and the Estimated Actual Value of Taxable Property on page 93
for property value data
(4) Population data can be found in the Schedule of Demographic and Economic Statistics on page 100
97
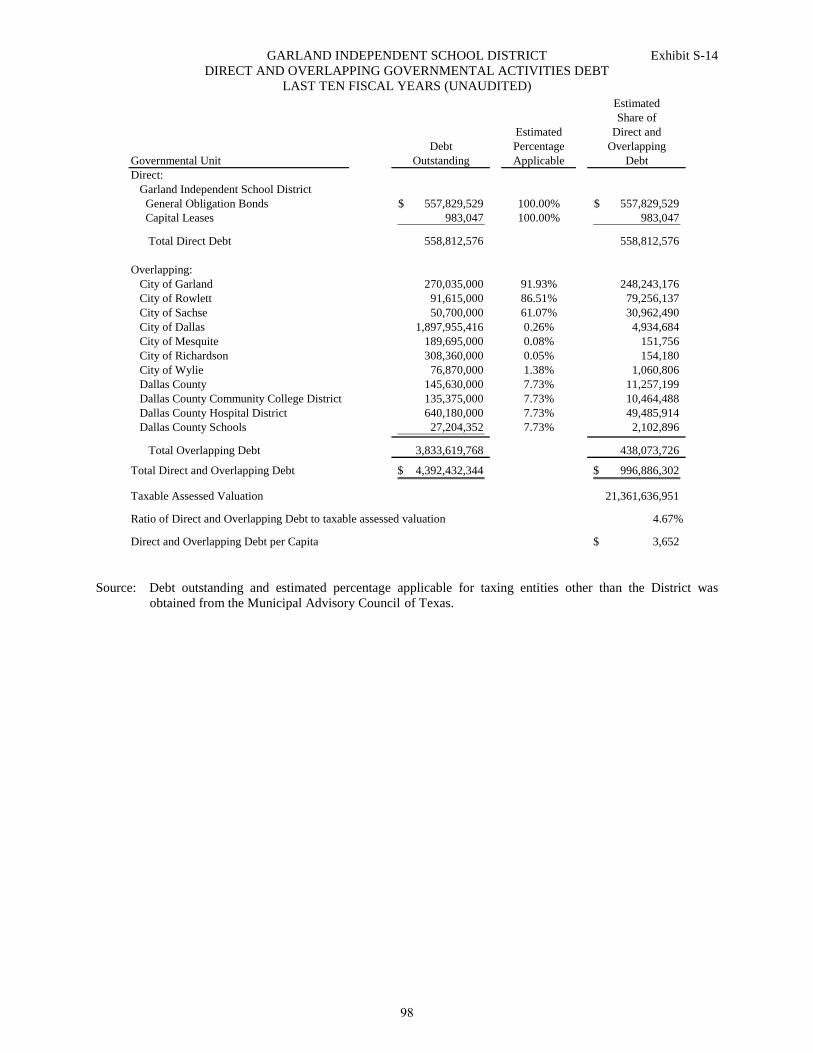
GARLAND INDEPENDENT SCHOOL DISTRICT Exhibit S-14
DIRECT AND OVERLAPPING GOVERNMENTAL ACTIVITIES DEBT
LAST TEN FISCAL YEARS (UNAUDITED)
Estimated
Share of
Estimated Direct and
Debt Percentage Overlapping
Governmental Unit Outstanding Applicable Debt
Direct:
Garland Independent School District
General Obligation Bonds 557,829,529$ 100.00% 557,829,529$
Capital Leases 983,047 100.00% 983,047
Total Direct Debt 558,812,576 558,812,576
Overlapping:
City of Garland 270,035,000 91.93% 248,243,176
City of Rowlett 91,615,000 86.51% 79,256,137
City of Sachse 50,700,000 61.07% 30,962,490
City of Dallas 1,897,955,416 0.26% 4,934,684
City of Mesquite 189,695,000 0.08% 151,756
City of Richardson 308,360,000 0.05% 154,180
City of Wylie 76,870,000 1.38% 1,060,806
Dallas County 145,630,000 7.73% 11,257,199
Dallas County Community College District 135,375,000 7.73% 10,464,488
Dallas County Hospital District 640,180,000 7.73% 49,485,914
Dallas County Schools 27,204,352 7.73% 2,102,896
Total Overlapping Debt 3,833,619,768 438,073,726
Total Direct and Overlapping Debt 4,392,432,344$ 996,886,302$
Taxable Assessed Valuation 21,361,636,951
Ratio of Direct and Overlapping Debt to taxable assessed valuation 4.67%
Direct and Overlapping Debt per Capita 3,652$
Source: Debt outstanding and estimated percentage applicable for taxing entities other than the District was
obtained from the Municipal Advisory Council of Texas.
98
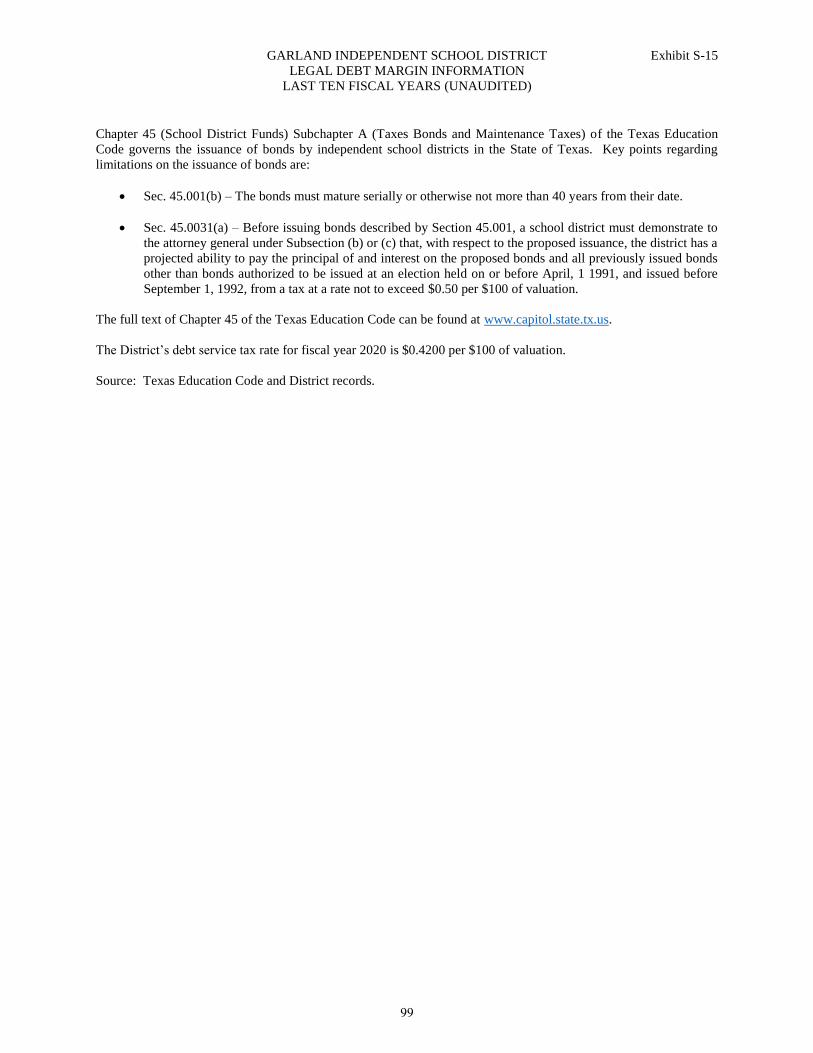
GARLAND INDEPENDENT SCHOOL DISTRICT Exhibit S-15
LEGAL DEBT MARGIN INFORMATION
LAST TEN FISCAL YEARS (UNAUDITED)
Chapter 45 (School District Funds) Subchapter A (Taxes Bonds and Maintenance Taxes) of the Texas Education
Code governs the issuance of bonds by independent school districts in the State of Texas. Key points regarding
limitations on the issuance of bonds are:
Sec. 45.001(b) – The bonds must mature serially or otherwise not more than 40 years from their date.
Sec. 45.0031(a) – Before issuing bonds described by Section 45.001, a school district must demonstrate to
the attorney general under Subsection (b) or (c) that, with respect to the proposed issuance, the district has a
projected ability to pay the principal of and interest on the proposed bonds and all previously issued bonds
other than bonds authorized to be issued at an election held on or before April, 1 1991, and issued before
September 1, 1992, from a tax at a rate not to exceed $0.50 per $100 of valuation.
The full text of Chapter 45 of the Texas Education Code can be found at www.capitol.state.tx.us.
The District’s debt service tax rate for fiscal year 2020 is $0.4200 per $100 of valuation.
Source: Texas Education Code and District records.
99
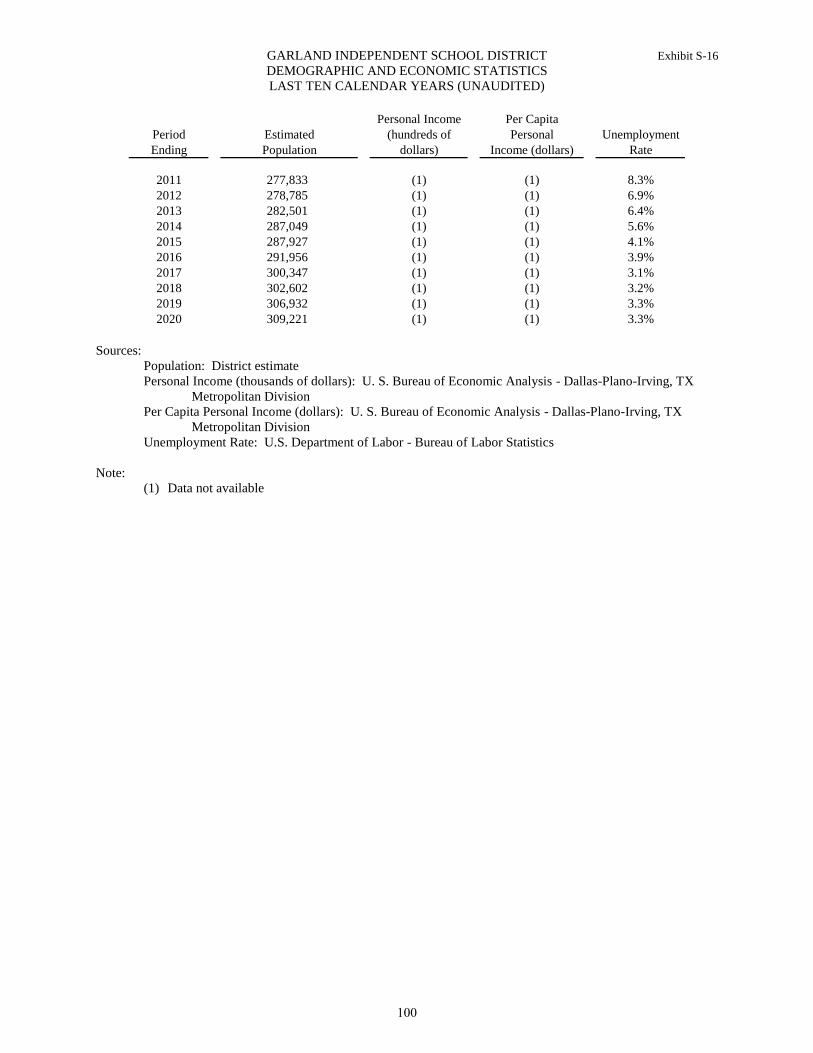
GARLAND INDEPENDENT SCHOOL DISTRICT Exhibit S-16
DEMOGRAPHIC AND ECONOMIC STATISTICS
LAST TEN CALENDAR YEARS (UNAUDITED)
Personal Income Per Capita
Period Estimated (hundreds of Personal Unemployment
Ending Population dollars) Income (dollars) Rate
2011 277,833 (1) (1) 8.3%
2012 278,785 (1) (1) 6.9%
2013 282,501 (1) (1) 6.4%
2014 287,049 (1) (1) 5.6%
2015 287,927 (1) (1) 4.1%
2016 291,956 (1) (1) 3.9%
2017 300,347 (1) (1) 3.1%
2018 302,602 (1) (1) 3.2%
2019 306,932 (1) (1) 3.3%
2020 309,221 (1) (1) 3.3%
Sources:
Population: District estimate
Personal Income (thousands of dollars): U. S. Bureau of Economic Analysis - Dallas-Plano-Irving, TX
Metropolitan Division
Per Capita Personal Income (dollars): U. S. Bureau of Economic Analysis - Dallas-Plano-Irving, TX
Metropolitan Division
Unemployment Rate: U.S. Department of Labor - Bureau of Labor Statistics
Note:
(1) Data not available
100
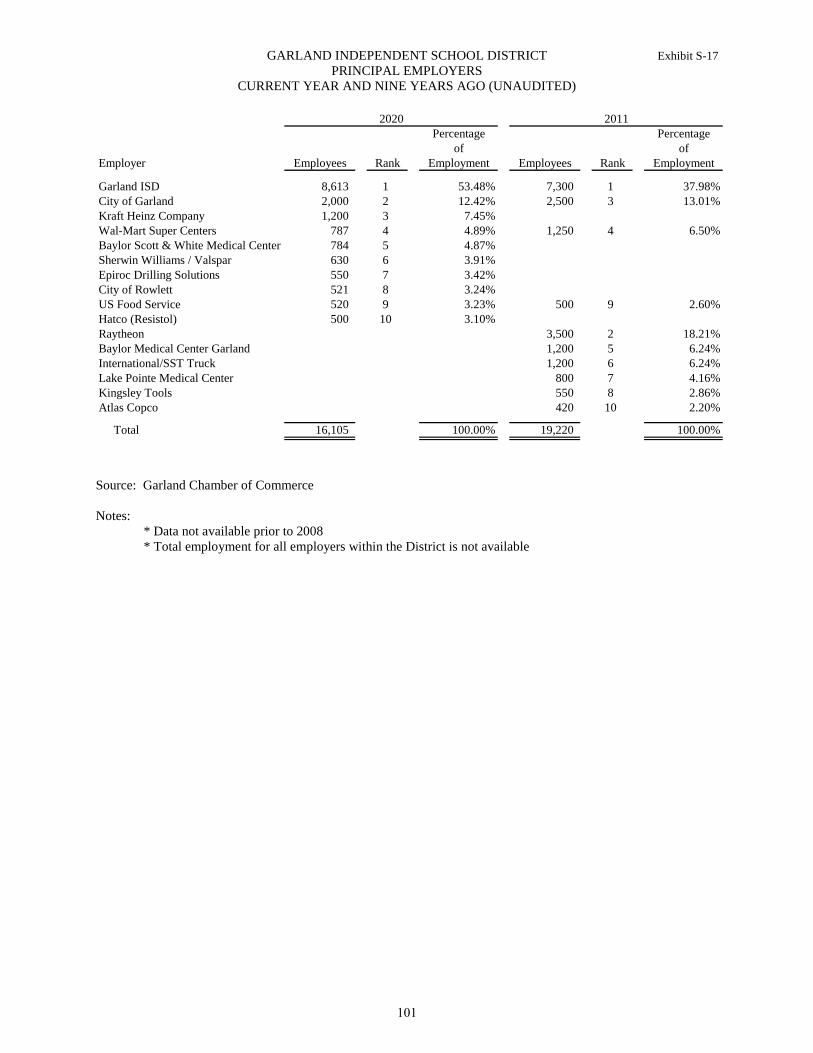
GARLAND INDEPENDENT SCHOOL DISTRICT Exhibit S-17
PRINCIPAL EMPLOYERS
CURRENT YEAR AND NINE YEARS AGO (UNAUDITED)
Percentage Percentage
of of
Employer Employees Rank Employment Employees Rank Employment
Garland ISD 8,613 1 53.48% 7,300 1 37.98%
City of Garland 2,000 2 12.42% 2,500 3 13.01%
Kraft Heinz Company 1,200 3 7.45%
Wal-Mart Super Centers 787 4 4.89% 1,250 4 6.50%
Baylor Scott & White Medical Center - Lake Pointe784 5 4.87%
Sherwin Williams / Valspar 630 6 3.91%
Epiroc Drilling Solutions 550 7 3.42%
City of Rowlett 521 8 3.24%
US Food Service 520 9 3.23% 500 9 2.60%
Hatco (Resistol) 500 10 3.10%
Raytheon 3,500 2 18.21%
Baylor Medical Center Garland 1,200 5 6.24%
International/SST Truck 1,200 6 6.24%
Lake Pointe Medical Center 800 7 4.16%
Kingsley Tools 550 8 2.86%
Atlas Copco 420 10 2.20%
Total 16,105 100.00% 19,220 100.00%
2020 2011
Source: Garland Chamber of Commerce
Notes:
* Data not available prior to 2008
* Total employment for all employers within the District is not available
101
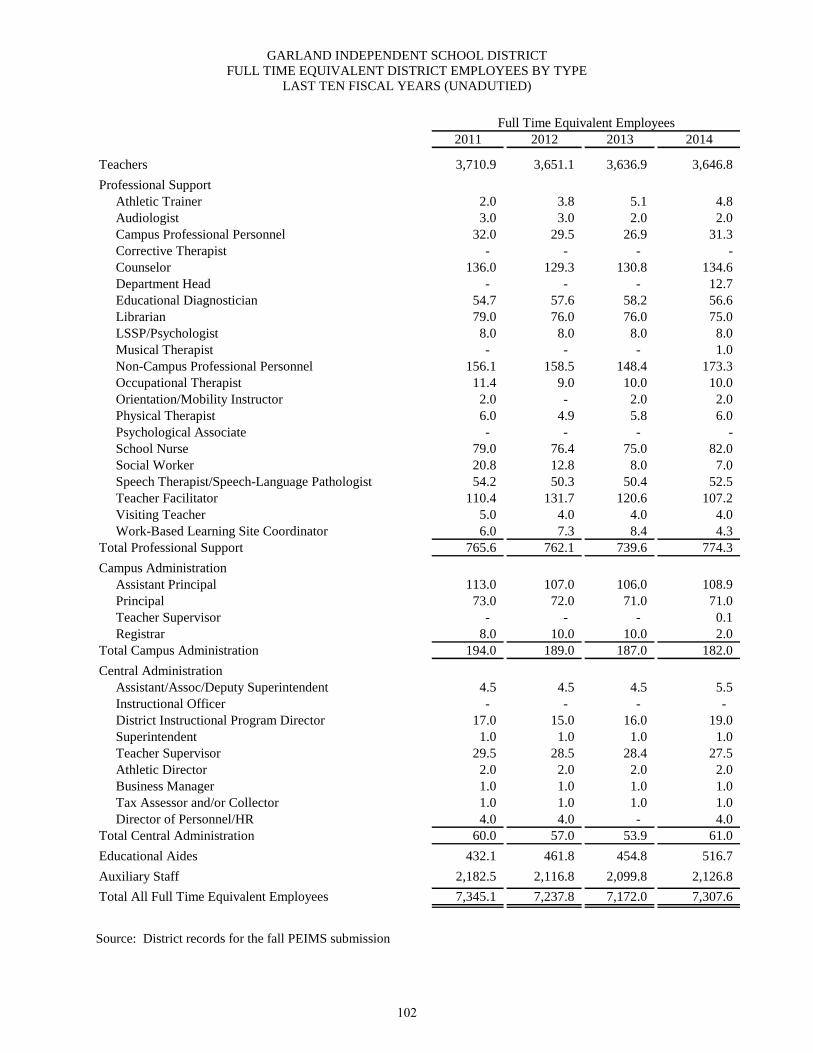
GARLAND INDEPENDENT SCHOOL DISTRICT
FULL TIME EQUIVALENT DISTRICT EMPLOYEES BY TYPE
LAST TEN FISCAL YEARS (UNADUTIED)
2011 2012 2013 2014
Teachers 3,710.9 3,651.1 3,636.9 3,646.8
Professional Support
Athletic Trainer 2.0 3.8 5.1 4.8
Audiologist 3.0 3.0 2.0 2.0
Campus Professional Personnel 32.0 29.5 26.9 31.3
Corrective Therapist - - - -
Counselor 136.0 129.3 130.8 134.6
Department Head - - - 12.7
Educational Diagnostician 54.7 57.6 58.2 56.6
Librarian 79.0 76.0 76.0 75.0
LSSP/Psychologist 8.0 8.0 8.0 8.0
Musical Therapist - - - 1.0
Non-Campus Professional Personnel 156.1 158.5 148.4 173.3
Occupational Therapist 11.4 9.0 10.0 10.0
Orientation/Mobility Instructor 2.0 - 2.0 2.0
Physical Therapist 6.0 4.9 5.8 6.0
Psychological Associate - - - -
School Nurse 79.0 76.4 75.0 82.0
Social Worker 20.8 12.8 8.0 7.0
Speech Therapist/Speech-Language Pathologist 54.2 50.3 50.4 52.5
Teacher Facilitator 110.4 131.7 120.6 107.2
Visiting Teacher 5.0 4.0 4.0 4.0
Work-Based Learning Site Coordinator 6.0 7.3 8.4 4.3
Total Professional Support 765.6 762.1 739.6 774.3
Campus Administration
Assistant Principal 113.0 107.0 106.0 108.9
Principal 73.0 72.0 71.0 71.0
Teacher Supervisor - - - 0.1
Registrar 8.0 10.0 10.0 2.0
Total Campus Administration 194.0 189.0 187.0 182.0
Central Administration
Assistant/Assoc/Deputy Superintendent 4.5 4.5 4.5 5.5
Instructional Officer - - - -
District Instructional Program Director 17.0 15.0 16.0 19.0
Superintendent 1.0 1.0 1.0 1.0
Teacher Supervisor 29.5 28.5 28.4 27.5
Athletic Director 2.0 2.0 2.0 2.0
Business Manager 1.0 1.0 1.0 1.0
Tax Assessor and/or Collector 1.0 1.0 1.0 1.0
Director of Personnel/HR 4.0 4.0 - 4.0
Total Central Administration 60.0 57.0 53.9 61.0
Educational Aides 432.1 461.8 454.8 516.7
Auxiliary Staff 2,182.5 2,116.8 2,099.8 2,126.8
Total All Full Time Equivalent Employees 7,345.1 7,237.8 7,172.0 7,307.6
Full Time Equivalent Employees
Source: District records for the fall PEIMS submission
102
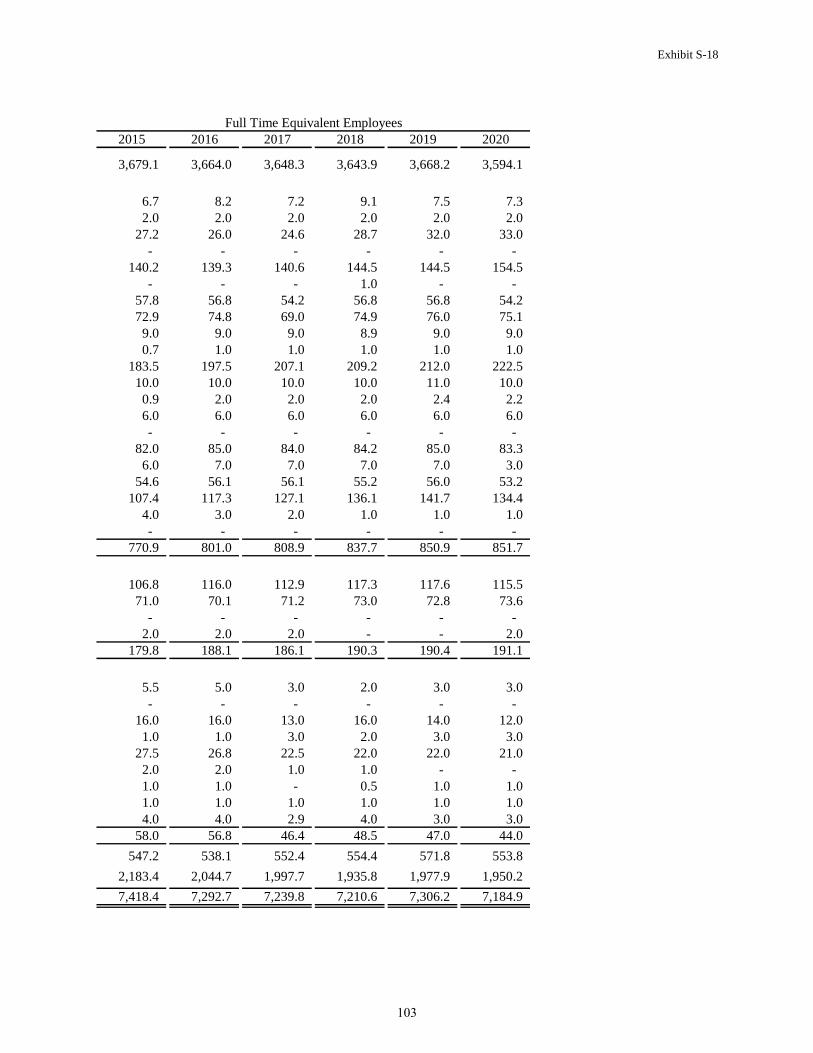
Exhibit S-18
2015 2016 2017 2018 2019 2020
3,679.1 3,664.0 3,648.3 3,643.9 3,668.2 3,594.1
6.7 8.2 7.2 9.1 7.5 7.3
2.0 2.0 2.0 2.0 2.0 2.0
27.2 26.0 24.6 28.7 32.0 33.0
- - - - - -
140.2 139.3 140.6 144.5 144.5 154.5
- - - 1.0 - -
57.8 56.8 54.2 56.8 56.8 54.2
72.9 74.8 69.0 74.9 76.0 75.1
9.0 9.0 9.0 8.9 9.0 9.0
0.7 1.0 1.0 1.0 1.0 1.0
183.5 197.5 207.1 209.2 212.0 222.5
10.0 10.0 10.0 10.0 11.0 10.0
0.9 2.0 2.0 2.0 2.4 2.2
6.0 6.0 6.0 6.0 6.0 6.0
- - - - - -
82.0 85.0 84.0 84.2 85.0 83.3
6.0 7.0 7.0 7.0 7.0 3.0
54.6 56.1 56.1 55.2 56.0 53.2
107.4 117.3 127.1 136.1 141.7 134.4
4.0 3.0 2.0 1.0 1.0 1.0
- - - - - -
770.9 801.0 808.9 837.7 850.9 851.7
106.8 116.0 112.9 117.3 117.6 115.5
71.0 70.1 71.2 73.0 72.8 73.6
- - - - - -
2.0 2.0 2.0 - - 2.0
179.8 188.1 186.1 190.3 190.4 191.1
5.5 5.0 3.0 2.0 3.0 3.0
- - - - - -
16.0 16.0 13.0 16.0 14.0 12.0
1.0 1.0 3.0 2.0 3.0 3.0
27.5 26.8 22.5 22.0 22.0 21.0
2.0 2.0 1.0 1.0 - -
1.0 1.0 - 0.5 1.0 1.0
1.0 1.0 1.0 1.0 1.0 1.0
4.0 4.0 2.9 4.0 3.0 3.0
58.0 56.8 46.4 48.5 47.0 44.0
547.2 538.1 552.4 554.4 571.8 553.8
2,183.4 2,044.7 1,997.7 1,935.8 1,977.9 1,950.2
7,418.4 7,292.7 7,239.8 7,210.6 7,306.2 7,184.9
Full Time Equivalent Employees
103
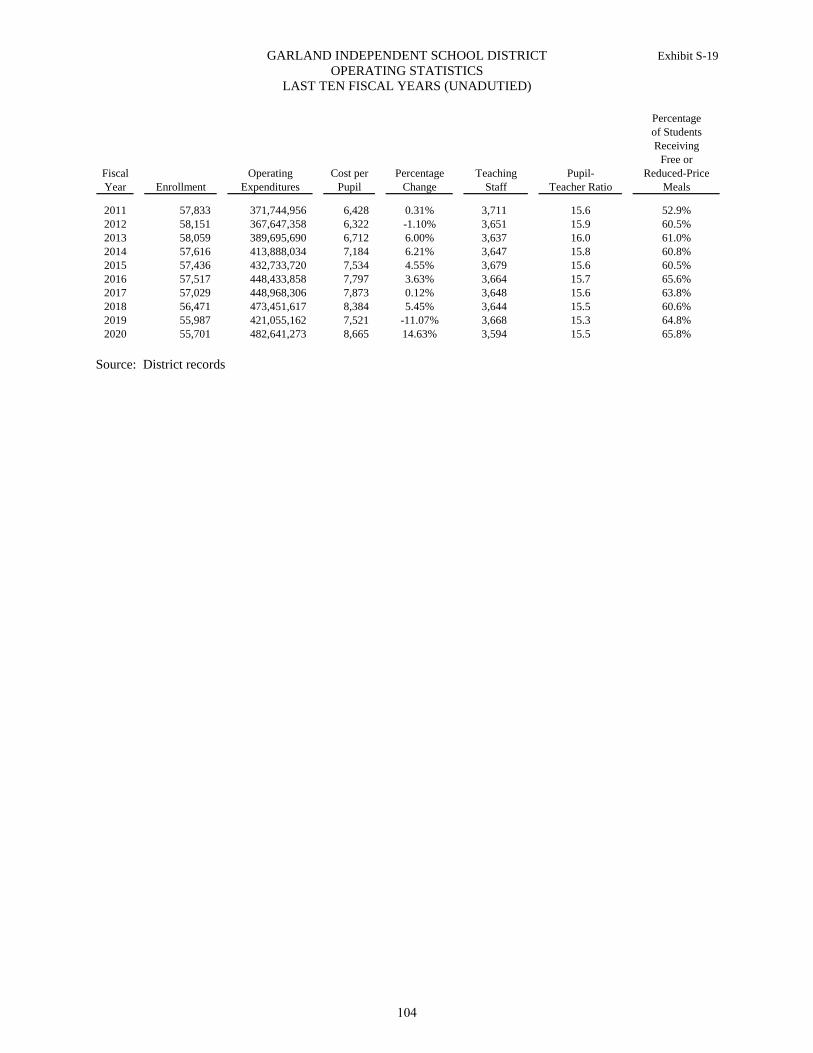
GARLAND INDEPENDENT SCHOOL DISTRICT Exhibit S-19
OPERATING STATISTICS
LAST TEN FISCAL YEARS (UNADUTIED)
Percentage
of Students
Receiving
Free or
Fiscal Operating Cost per Percentage Teaching Pupil- Reduced-Price
Year Enrollment Expenditures Pupil Change Staff Teacher Ratio Meals
2011 57,833 371,744,956 6,428 0.31% 3,711 15.6 52.9%
2012 58,151 367,647,358 6,322 -1.10% 3,651 15.9 60.5%
2013 58,059 389,695,690 6,712 6.00% 3,637 16.0 61.0%
2014 57,616 413,888,034 7,184 6.21% 3,647 15.8 60.8%
2015 57,436 432,733,720 7,534 4.55% 3,679 15.6 60.5%
2016 57,517 448,433,858 7,797 3.63% 3,664 15.7 65.6%
2017 57,029 448,968,306 7,873 0.12% 3,648 15.6 63.8%
2018 56,471 473,451,617 8,384 5.45% 3,644 15.5 60.6%
2019 55,987 421,055,162 7,521 -11.07% 3,668 15.3 64.8%
2020 55,701 482,641,273 8,665 14.63% 3,594 15.5 65.8%
Source: District records
104
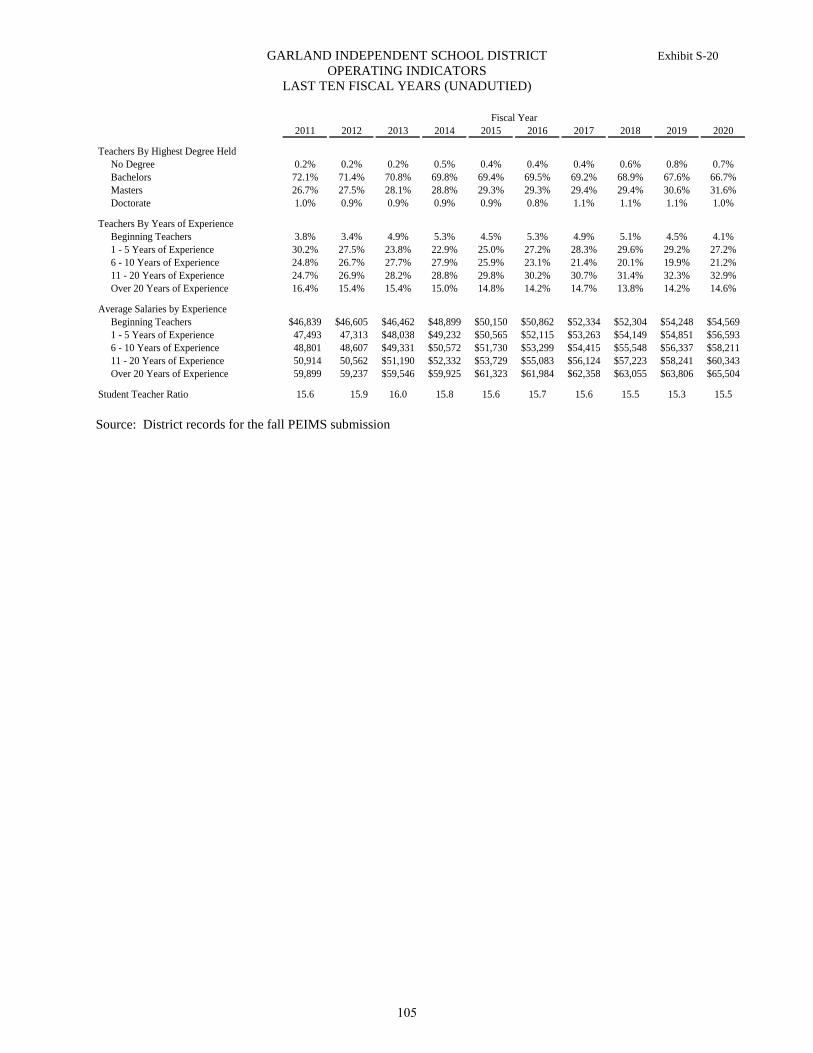
GARLAND INDEPENDENT SCHOOL DISTRICT Exhibit S-20
OPERATING INDICATORS
LAST TEN FISCAL YEARS (UNADUTIED)
2011 2012 2013 2014 2015 2016 2017 2018 2019 2020
Teachers By Highest Degree Held
No Degree 0.2% 0.2% 0.2% 0.5% 0.4% 0.4% 0.4% 0.6% 0.8% 0.7%
Bachelors 72.1% 71.4% 70.8% 69.8% 69.4% 69.5% 69.2% 68.9% 67.6% 66.7%
Masters 26.7% 27.5% 28.1% 28.8% 29.3% 29.3% 29.4% 29.4% 30.6% 31.6%
Doctorate 1.0% 0.9% 0.9% 0.9% 0.9% 0.8% 1.1% 1.1% 1.1% 1.0%
Teachers By Years of Experience
Beginning Teachers 3.8% 3.4% 4.9% 5.3% 4.5% 5.3% 4.9% 5.1% 4.5% 4.1%
1 - 5 Years of Experience 30.2% 27.5% 23.8% 22.9% 25.0% 27.2% 28.3% 29.6% 29.2% 27.2%
6 - 10 Years of Experience 24.8% 26.7% 27.7% 27.9% 25.9% 23.1% 21.4% 20.1% 19.9% 21.2%
11 - 20 Years of Experience 24.7% 26.9% 28.2% 28.8% 29.8% 30.2% 30.7% 31.4% 32.3% 32.9%
Over 20 Years of Experience 16.4% 15.4% 15.4% 15.0% 14.8% 14.2% 14.7% 13.8% 14.2% 14.6%
Average Salaries by Experience
Beginning Teachers 46,839$ 46,605$ $46,462 $48,899 $50,150 $50,862 $52,334 $52,304 $54,248 $54,569
1 - 5 Years of Experience 47,493 47,313 $48,038 $49,232 $50,565 $52,115 $53,263 $54,149 $54,851 $56,593
6 - 10 Years of Experience 48,801 48,607 $49,331 $50,572 $51,730 $53,299 $54,415 $55,548 $56,337 $58,211
11 - 20 Years of Experience 50,914 50,562 $51,190 $52,332 $53,729 $55,083 $56,124 $57,223 $58,241 $60,343
Over 20 Years of Experience 59,899 59,237 $59,546 $59,925 $61,323 $61,984 $62,358 $63,055 $63,806 $65,504
Student Teacher Ratio 15.6 15.9 16.0 15.8 15.6 15.7 15.6 15.5 15.3 15.5
Fiscal Year
Source: District records for the fall PEIMS submission
105
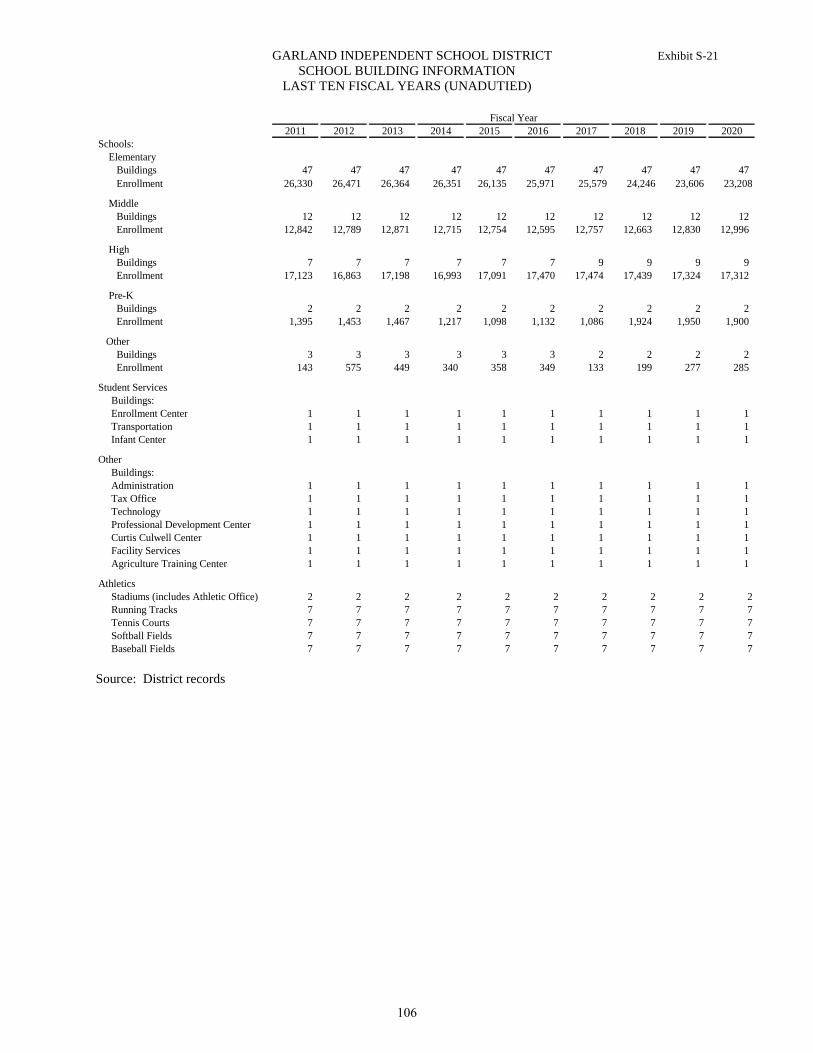
GARLAND INDEPENDENT SCHOOL DISTRICT Exhibit S-21
SCHOOL BUILDING INFORMATION
LAST TEN FISCAL YEARS (UNADUTIED)
2011 2012 2013 2014 2015 2016 2017 2018 2019 2020
Schools:
Elementary
Buildings 47 47 47 47 47 47 47 47 47 47
Enrollment 26,330 26,471 26,364 26,351 26,135 25,971 25,579 24,246 23,606 23,208
Middle
Buildings 12 12 12 12 12 12 12 12 12 12
Enrollment 12,842 12,789 12,871 12,715 12,754 12,595 12,757 12,663 12,830 12,996
High
Buildings 7 7 7 7 7 7 9 9 9 9
Enrollment 17,123 16,863 17,198 16,993 17,091 17,470 17,474 17,439 17,324 17,312
Pre-K
Buildings 2 2 2 2 2 2 2 2 2 2
Enrollment 1,395 1,453 1,467 1,217 1,098 1,132 1,086 1,924 1,950 1,900
Other
Buildings 3 3 3 3 3 3 2 2 2 2
Enrollment 143 575 449 340 358 349 133 199 277 285
Student Services
Buildings:
Enrollment Center 1 1 1 1 1 1 1 1 1 1
Transportation 1 1 1 1 1 1 1 1 1 1
Infant Center 1 1 1 1 1 1 1 1 1 1
Other
Buildings:
Administration 1 1 1 1 1 1 1 1 1 1
Tax Office 1 1 1 1 1 1 1 1 1 1
Technology 1 1 1 1 1 1 1 1 1 1
Professional Development Center 1 1 1 1 1 1 1 1 1 1
Curtis Culwell Center 1 1 1 1 1 1 1 1 1 1
Facility Services 1 1 1 1 1 1 1 1 1 1
Agriculture Training Center 1 1 1 1 1 1 1 1 1 1
Athletics
Stadiums (includes Athletic Office) 2 2 2 2 2 2 2 2 2 2
Running Tracks 7 7 7 7 7 7 7 7 7 7
Tennis Courts 7 7 7 7 7 7 7 7 7 7
Softball Fields 7 7 7 7 7 7 7 7 7 7
Baseball Fields 7 7 7 7 7 7 7 7 7 7
Fiscal Year
Source: District records
106
Federal Awards Section
This page intentionally left blank
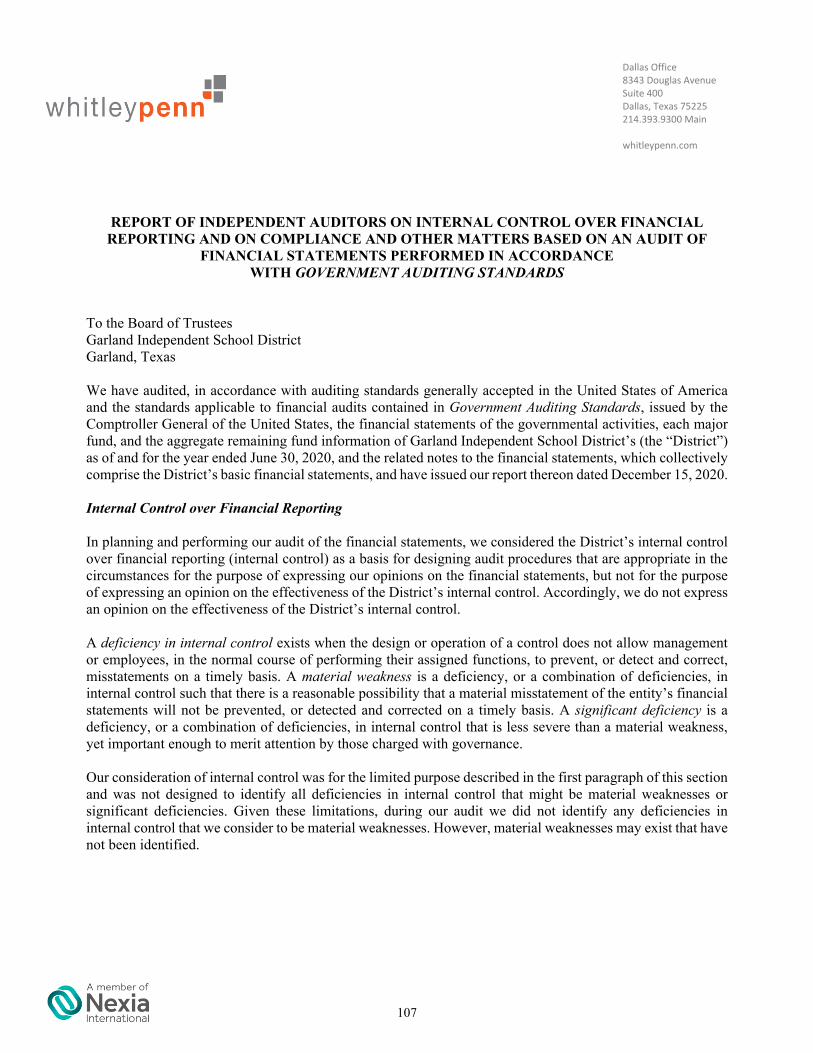
Dallas Office 8343 Douglas Avenue Suite 400 Dallas, Texas 75225 214.393.9300 Main
whitleypenn.com
REPORT OF INDEPENDENT AUDITORS ON INTERNAL CONTROL OVER FINANCIAL REPORTING AND ON COMPLIANCE AND OTHER MATTERS BASED ON AN AUDIT OF
FINANCIAL STATEMENTS PERFORMED IN ACCORDANCE WITH GOVERNMENT AUDITING STANDARDS
To the Board of TrusteesGarland Independent School District Garland, Texas
We have audited, in accordance with auditing standards generally accepted in the United States of America and the standards applicable to financial audits contained in Government Auditing Standards, issued by theComptroller General of the United States, the financial statements of the governmental activities, each major fund, and the aggregate remaining fund information of Garland Independent School District’s (the “District”) as of and for the year ended June 30, 2020, and the related notes to the financial statements, which collectively comprise the District’s basic financial statements, and have issued our report thereon dated December 15, 2020.
Internal Control over Financial Reporting
In planning and performing our audit of the financial statements, we considered the District’s internal control over financial reporting (internal control) as a basis for designing audit procedures that are appropriate in the circumstances for the purpose of expressing our opinions on the financial statements, but not for the purposeof expressing an opinion on the effectiveness of the District’s internal control. Accordingly, we do not express an opinion on the effectiveness of the District’s internal control.
A deficiency in internal control exists when the design or operation of a control does not allow management or employees, in the normal course of performing their assigned functions, to prevent, or detect and correct, misstatements on a timely basis. A material weakness is a deficiency, or a combination of deficiencies, in internal control such that there is a reasonable possibility that a material misstatement of the entity’s financial statements will not be prevented, or detected and corrected on a timely basis. A significant deficiency is a deficiency, or a combination of deficiencies, in internal control that is less severe than a material weakness, yet important enough to merit attention by those charged with governance.
Our consideration of internal control was for the limited purpose described in the first paragraph of this section and was not designed to identify all deficiencies in internal control that might be material weaknesses or significant deficiencies. Given these limitations, during our audit we did not identify any deficiencies in internal control that we consider to be material weaknesses. However, material weaknesses may exist that have not been identified.
107
To the Board of Trustees Garland Independent School District
Compliance and Other Matters
As part of obtaining reasonable assurance about whether the District’s financial statements are free from material misstatement, we performed tests of its compliance with certain provisions of laws, regulations, contracts, and grant agreements, noncompliance with which could have a direct and material effect on the financial statements. However, providing an opinion on compliance with those provisions was not an objective of our audit, and accordingly, we do not express such an opinion. The results of our tests disclosed no instances of noncompliance that is required to be reported under Government Auditing Standards.
Purpose of this Report
The purpose of this report is solely to describe the scope of our testing of internal control and compliance and the results of that testing, and not to provide an opinion on the effectiveness of the entity’s internal control or on compliance. This report is an integral part of an audit performed in accordance with Government Auditing Standards in considering the District’s internal control and compliance. Accordingly, this communication is not suitable for any other purpose.
Dallas, Texas December 15, 2020
108
Dallas Office 8343 Douglas Avenue Suite 400 Dallas, Texas 75225 214.393.9300 Main
whitleypenn.com
REPORT OF INDEPENDENT AUDITORS ON COMPLIANCE FOR EACH MAJOR FEDERAL PROGRAM AND ON INTERNAL CONTROL OVER COMPLIANCE
REQUIRED BY THE UNIFORM GUIDANCE
To the Board of TrusteesGarland Independent School District Garland, Texas
Report on Compliance for Each Major Federal Program
We have audited Garland Independent School District’s (the “District”) compliance with the types ofcompliance requirements described in the OMB Compliance Supplement that could have a direct and material effect on each of the District’s major federal programs for the year ended June 30, 2020. The District’s majorfederal programs are identified in the summary of auditor’s results section of the accompanying schedule of findings and questioned costs.
Management’s Responsibility
Management is responsible for compliance with federal statutes, regulations, and the terms and conditions of its federal awards applicable to its federal programs.
Auditor’s Responsibility
Our responsibility is to express an opinion on compliance for each of the District’s major federal programs based on our audit of the types of compliance requirements referred to above. We conducted our audit of compliance in accordance with auditing standards generally accepted in the United States of America; the standards applicable to financial audits contained in Government Auditing Standards, issued by the Comptroller General of the United States; and audit requirements of Title 2 U.S. Code of Federal Regulations Part 200, Uniform Administrative Requirements, Cost Principles, and Audit Requirements for Federal Awards (“Uniform Guidance”). Those standards and the Uniform Guidance require that we plan and perform the audit to obtain reasonable assurance about whether noncompliance with the types of compliance requirements referred to above that could have a direct and material effect on a major federal program occurred. An audit includes examining, on a test basis, evidence about the District’s compliance with those requirements and performing such other procedures as we considered necessary in the circumstances.
We believe that our audit provides a reasonable basis for our opinion on compliance for each major federal program. However, our audit does not provide a legal determination of the District’s compliance.
109
To the Board of Trustees Garland Independent School District
Opinion on Each Major Federal Program
In our opinion, the District complied, in all material respects, with the types of compliance requirements referred to above that could have a direct and material effect on each of its major federal programs for the year ended June 30, 2020.
Report on Internal Control Over Compliance
Management of the District is responsible for establishing and maintaining effective internal control over compliance with the types of compliance requirements referred to above. In planning and performing our audit of compliance, we considered the District’s internal control over compliance with the types of requirements that could have a direct and material effect on each major federal program to determine the auditing procedures that are appropriate in the circumstances for the purpose of expressing an opinion on compliance for each major federal program and to test and report on internal control over compliance in accordance with the Uniform Guidance, but not for the purpose of expressing an opinion on the effectiveness of internal control over compliance. Accordingly, we do not express an opinion on the effectiveness of the District’s internal control over compliance.
A deficiency in internal control over compliance exists when the design or operation of a control over compliance does not allow management or employees, in the normal course of performing their assigned functions, to prevent, or detect and correct, noncompliance with a type of compliance requirement of a federal program on a timely basis. A material weakness in internal control over compliance is a deficiency, or combination of deficiencies, in internal control over compliance, such that there is a reasonable possibility that material noncompliance with a type of compliance requirement of a federal program will not be prevented, or detected and corrected, on a timely basis. A significant deficiency in internal control over compliance is a deficiency, or a combination of deficiencies, in internal control over compliance with a type of compliance requirement of a federal program that is less severe than a material weakness in internal control over compliance, yet important enough to merit attention by those charged with governance.
Our consideration of internal control over compliance was for the limited purpose described in the first paragraph of this section and was not designed to identify all deficiencies in internal control over compliance that might be material weaknesses or significant deficiencies. We did not identify any deficiencies in internal control over compliance that we consider to be material weaknesses. However, material weaknesses may exist that have not been identified.
The purpose of this report on internal control over compliance is solely to describe the scope of our testing of internal control over compliance and the results of that testing based on the requirements of the Uniform Guidance. Accordingly, this report is not suitable for any other purpose.
Dallas, Texas December 15, 2020
110
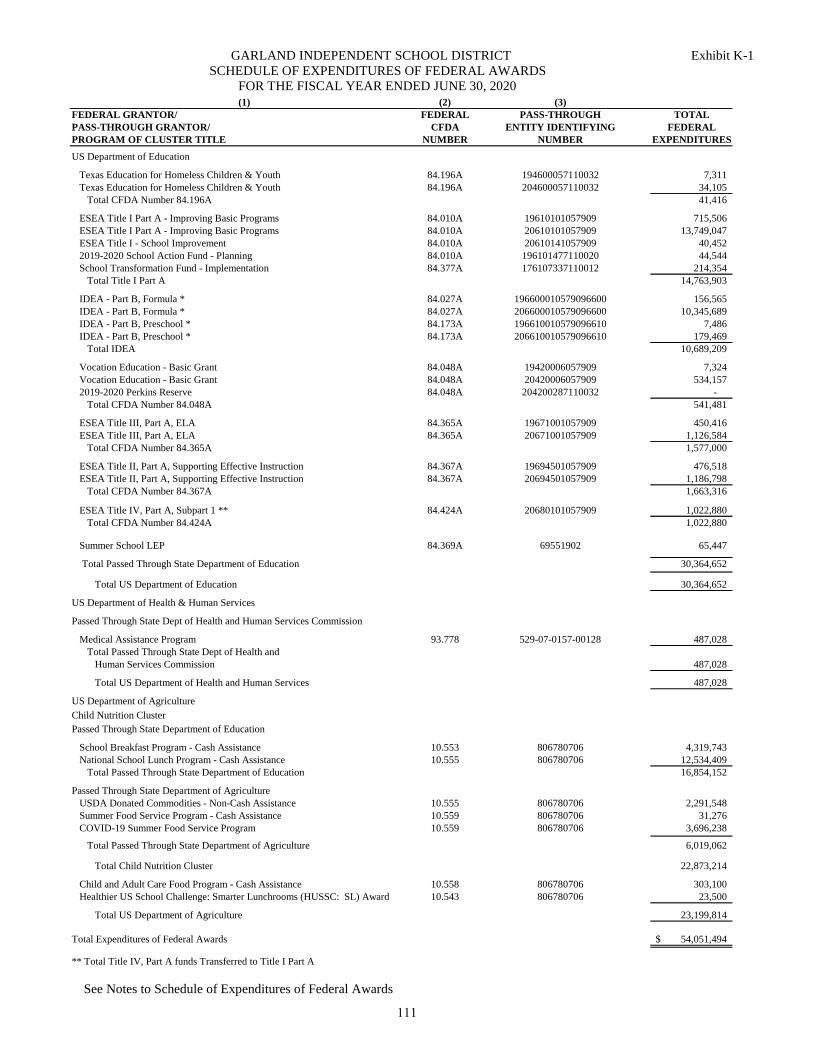
GARLAND INDEPENDENT SCHOOL DISTRICT Exhibit K-1
SCHEDULE OF EXPENDITURES OF FEDERAL AWARDS
FOR THE FISCAL YEAR ENDED JUNE 30, 2020
See Notes to Schedule of Expenditures of Federal Awards
(1) (2) (3)
FEDERAL GRANTOR/ FEDERAL PASS-THROUGH TOTAL
PASS-THROUGH GRANTOR/ CFDA ENTITY IDENTIFYING FEDERAL
PROGRAM OF CLUSTER TITLE GRANT END DATENUMBER NUMBER EXPENDITURES
US Department of Education
Texas Education for Homeless Children & Youth 84.196A 194600057110032 7,311
Texas Education for Homeless Children & Youth 84.196A 204600057110032 34,105
Total CFDA Number 84.196A 41,416
ESEA Title I Part A - Improving Basic Programs 84.010A 19610101057909 715,506
ESEA Title I Part A - Improving Basic Programs 84.010A 20610101057909 13,749,047
ESEA Title I - School Improvement 84.010A 20610141057909 40,452
2019-2020 School Action Fund - Planning 84.010A 196101477110020 44,544
School Transformation Fund - Implementation 84.377A 176107337110012 214,354
Total Title I Part A 14,763,903
IDEA - Part B, Formula * 84.027A 196600010579096600 156,565
IDEA - Part B, Formula * 84.027A 206600010579096600 10,345,689
IDEA - Part B, Preschool * 84.173A 196610010579096610 7,486
IDEA - Part B, Preschool * 84.173A 206610010579096610 179,469
Total IDEA 10,689,209
Vocation Education - Basic Grant 84.048A 19420006057909 7,324
Vocation Education - Basic Grant 84.048A 20420006057909 534,157
2019-2020 Perkins Reserve 84.048A 204200287110032 -
Total CFDA Number 84.048A 541,481
ESEA Title III, Part A, ELA 84.365A 19671001057909 450,416
ESEA Title III, Part A, ELA 84.365A 20671001057909 1,126,584
Total CFDA Number 84.365A 1,577,000
ESEA Title II, Part A, Supporting Effective Instruction 84.367A 19694501057909 476,518
ESEA Title II, Part A, Supporting Effective Instruction 84.367A 20694501057909 1,186,798
Total CFDA Number 84.367A 1,663,316 ESEA Title IV, Part A, Subpart 1 84.424A 18680101057909 -
ESEA Title IV, Part A, Subpart 1 ** 84.424A 20680101057909 1,022,880
Total CFDA Number 84.424A 1,022,880
Summer School LEP 84.369A 69551902 65,447
Total Passed Through State Department of Education 30,364,652
Total US Department of Education 30,364,652
US Department of Health & Human Services
Passed Through State Dept of Health and Human Services Commission
Medical Assistance Program 93.778 529-07-0157-00128 487,028
Total Passed Through State Dept of Health and
Human Services Commission 487,028
Total US Department of Health and Human Services 487,028
US Department of Agriculture
Child Nutrition Cluster
Passed Through State Department of Education
School Breakfast Program - Cash Assistance 10.553 806780706 4,319,743
National School Lunch Program - Cash Assistance 10.555 806780706 12,534,409
Total Passed Through State Department of Education 16,854,152
Passed Through State Department of Agriculture
USDA Donated Commodities - Non-Cash Assistance 10.555 806780706 2,291,548
Summer Food Service Program - Cash Assistance 10.559 806780706 31,276
COVID-19 Summer Food Service Program 10.559 806780706 3,696,238 USDA Donated Commodities - Non-Cash Assistance 10.559 00279 -
Total Passed Through State Department of Agriculture 6,019,062
Total Child Nutrition Cluster 22,873,214
Child and Adult Care Food Program - Cash Assistance 10.558 806780706 303,100
Healthier US School Challenge: Smarter Lunchrooms (HUSSC: SL) Award 10.543 806780706 23,500
Total US Department of Agriculture 23,199,814
Total Expenditures of Federal Awards 54,051,494$
** Total Title IV, Part A funds Transferred to Title I Part A
111
GARLAND INDEPENDENT SCHOOL DISTRICT
NOTES TO SCHEDULE OF EXPENDITURES OF FEDERAL AWARDS
FISCAL YEAR ENDED JUNE 30, 2020
Note 1. Fund Types
The District utilizes the fund types specified in the Texas Education Agency Resource Guide.
Special Revenue Fund – used to account for resources restricted to, or designated for, specific
purposes by a grantor. Federal and state awards generally are accounted for in a Special Revenue
Fund. Generally, unused balances are returned to the grantor at the close of specified grant periods.
Note 2. Accounting and Financial Reporting
The accounting and financial reporting treatment applied to a fund is determined by its measurement focus.
The Governmental Funds are accounted for using a current financial resources measurement focus. All
federal grant funds were accounted for in the Special Revenue Fund, which are Governmental Funds. With
this measurement focus, only current assets and current liabilities generally are included on the balance sheet.
Operating statements of these funds present increases (i.e., revenues and other financing sources) and
decreases (i.e., expenditures and other financing uses) in net current assets.
The Schedule of Expenditures of Federal Awards was prepared on the modified accrual basis of accounting.
The modified accrual basis of accounting is used for the Governmental Funds. This basis of accounting
recognizes revenues in the accounting period in which they become susceptible to accrual, i.e., both
measurable and available, and expenditures in the accounting period in which the fund liability is incurred, if
measurable, except for unmatured interest on long-term debt, which is recognized when due, and certain
compensated absences and claims and judgments, which are recognized when the obligations are expected to
be liquidated with expendable available financial resources.
Federal grant funds are considered to be earned to the extent of expenditures made under the provisions of the
grant, and, accordingly, when such funds are received, they are recorded as deferred revenues until earned.
The District has not elected to use the 10 percent de-minimis indirect cost rate.
Note 3. Period of Availability
The period of availability for federal grant funds for the purpose of liquidation of outstanding obligations
made on or before the ending date of the federal project period extends 30 days beyond the federal project
period ending date, in accordance with provisions in Section H: Period of Availability of Federal Funds, Part
3, OMB Compliance Supplement.
Note 4. Contingent Liabilities
The District participates in numerous state and federal grant programs, which are governed by various rules
and regulations of the grantor agencies. Costs charged to the respective grant programs are subject to audit
and adjustments by the grantor agencies; therefore, to the extent that the District has not complied with rules
and regulations governing the grants, refund of any money received may be required and the collectability of
any related receivable at June 30, 2019, may be impaired. In the opinion of the District, there are no
significant contingent liabilities relating to compliance with the rules and regulations governing the respective
grants; therefore, no provision has been recorded in the accompanying financial statements for such
contingencies.
Note 5. Title I, Part A Transferability
As described in the U.S. Department of Education Cross-Cutting Section (CFDA 84.000), sections III.A.3
Activities Allowed or Unallowed - Transferability (SEAs and LEAs) and IV.3 Other Information -
Transferability of the 2019 OMB Compliance Supplement, expenditures of funds should be included in the
audit universe and total expenditures of the receiving program. For fiscal year 2019, the District transferred
Title IV, Part A (CFDA 84.424) expenditures to its Title I, Part A (CFDA 84.010A) program as submitted to
the Texas Education Agency in its consolidated application and as denoted on the Schedule of Expenditures
of Federal Awards. As such, Title IV, Part A (CFDA 84.424) expenditures were included as part of Title I,
Part A (CFDA 84.010).
112
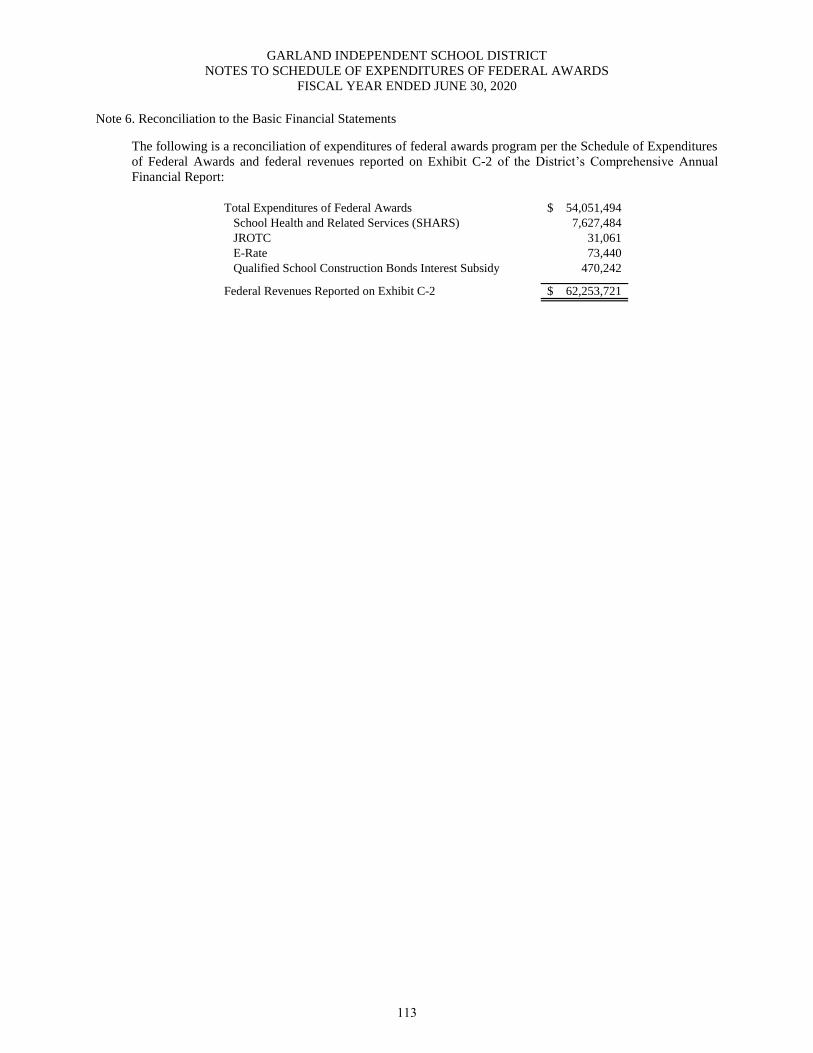
GARLAND INDEPENDENT SCHOOL DISTRICT
NOTES TO SCHEDULE OF EXPENDITURES OF FEDERAL AWARDS
FISCAL YEAR ENDED JUNE 30, 2020
Note 6. Reconciliation to the Basic Financial Statements
The following is a reconciliation of expenditures of federal awards program per the Schedule of Expenditures
of Federal Awards and federal revenues reported on Exhibit C-2 of the District’s Comprehensive Annual
Financial Report:
Total Expenditures of Federal Awards 54,051,494$
School Health and Related Services (SHARS) 7,627,484
JROTC 31,061
E-Rate 73,440
Qualified School Construction Bonds Interest Subsidy 470,242
Federal Revenues Reported on Exhibit C-2 62,253,721$
113
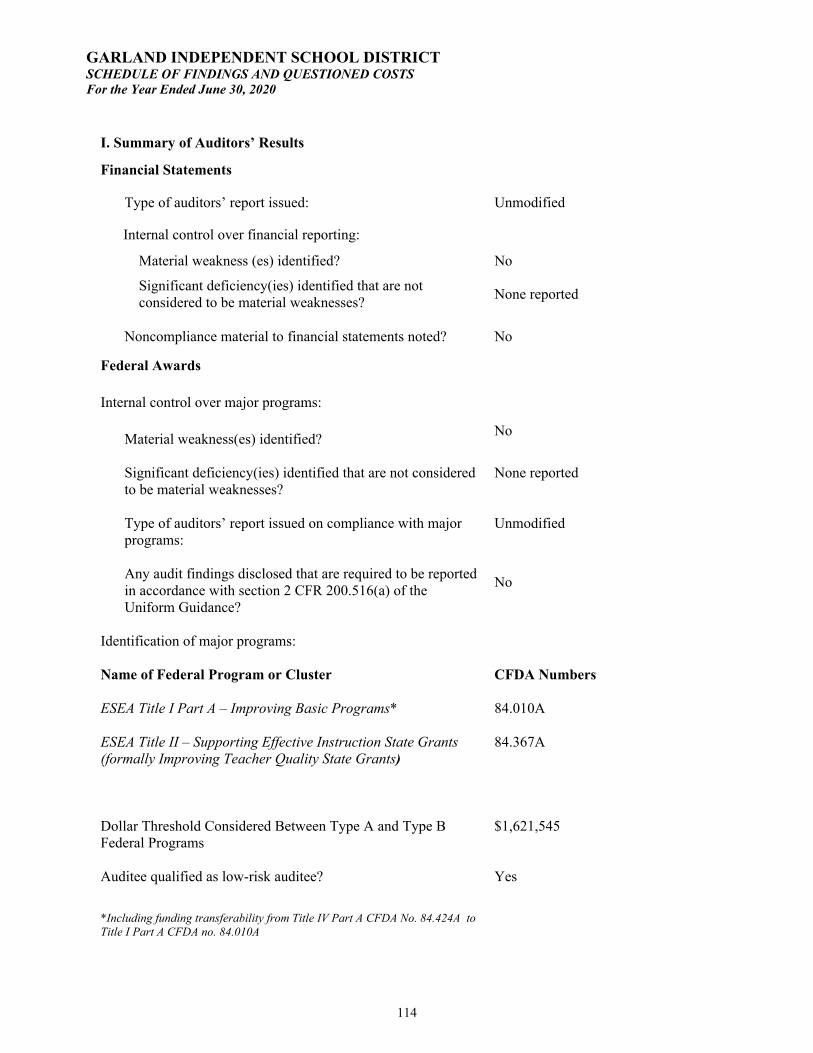
GARLAND INDEPENDENT SCHOOL DISTRICT SCHEDULE OF FINDINGS AND QUESTIONED COSTS For the Year Ended June 30, 2020
I. Summary of Auditors’ Results
Financial Statements
Type of auditors’ report issued: Unmodified
Internal control over financial reporting:
Material weakness (es) identified? No
Significant deficiency(ies) identified that are not considered to be material weaknesses?
None reported
Noncompliance material to financial statements noted? No
Federal Awards
Internal control over major programs:
Material weakness(es) identified? No
Significant deficiency(ies) identified that are not considered to be material weaknesses?
None reported
Type of auditors’ report issued on compliance with major programs:
Unmodified
Any audit findings disclosed that are required to be reported in accordance with section 2 CFR 200.516(a) of the Uniform Guidance?
No
Identification of major programs:
Name of Federal Program or Cluster CFDA Numbers
ESEA Title I Part A – Improving Basic Programs*
ESEA Title II – Supporting Effective Instruction State Grants (formally Improving Teacher Quality State Grants)
84.010A
84.367A
Dollar Threshold Considered Between Type A and Type B Federal Programs
$1,621,545
Auditee qualified as low-risk auditee? Yes
*Including funding transferability from Title IV Part A CFDA No. 84.424A toTitle I Part A CFDA no. 84.010A
114
GARLAND INDEPENDENT SCHOOL DISTRICT SCHEDULE OF FINDINGS AND QUESTIONED COSTS (continued) For the Year Ended June 30, 2020
II. Financial Statement Findings
None reported
III. Federal Awards Findings and Questioned Costs
None reported.
115
GARLAND INDEPENDENT SCHOOL DISTRICT SUMMARY SCHEDULE OF PRIOR AUDIT FINDINGS For the Year Ended June 30, 2020
Federal regulations, Title 2 U.S. Code of Federal Regulations Section 200.511 states, “The auditee is responsible for follow-up and corrective action on all audit findings. As part of this responsibility, the auditee must prepare a summary schedule of prior audit findings.” The summary schedule of prior audit findings must report the status of the following:
All audit findings included in the prior audit’s schedule of findings and questioned costs and All audit findings reported in the prior audit’s summary schedule of prior audit findings except audit
findings listed as corrected.
I. Prior Audit Findings
No prior year findings reported.
116
GARLAND INDEPENDENT SCHOOL DISTRICT CORRECTIVE ACTION PLAN For the Year Ended June 30, 2020
Federal regulations, Title 2 U.S. Code of Federal Regulations §200.511 states, “At the completion of the audit, the auditee must prepare, in a document separate from the auditor's findings described in §200.516 Audit findings, a corrective action plan to address each audit finding included in the current year auditor's reports.”
I. Corrective Action Plan
Not applicable
117