for the three months ending 30 june 2017 for … the three months ending 30 june 2017 . ... •...
TRANSCRIPT
Page | 1
QUARTERLY REPORT For the three months ending 30 June 2017 Galaxy Resources Limited (ASX: GXY, “Galaxy” or “Company”) is pleased to report to shareholders its activities for the quarter ended 30 June 2017. Highlights Mt Cattlin Operations
• Total of 32,998 dmt of lithium concentrate produced in the quarter, a 41% increase over Q1 2017 • For June, plant recoveries achieved 61% and output exceeded target production rate with 14,038 dry metric tonnes
("dmt") of concentrate produced • Cash flow generation of A$13.2 million for the quarter before capex and repayment of balance of customer
prepayments • Average production cash costs (excluding royalties and marketing fees) of US$393 per dmt for the quarter,
including US$334 per dmt for the month of June • Sales of 30,135 dmt at an average realised price before royalties and marketing fees of US$724 (A$964) per dmt • Sales of production on 2016 contract terms completed • Balance of all customer offtake prepayments repaid • First tantalum sale complete
Sal de Vida Project • Progress on field work and production well drilling • Relocation and refurbishment of the test plant • Initial planning activities for construction camp
James Bay Project • Drilling program progressing, now 65% complete • Initial assays from drilling campaign showing excellent results • Work on feasibility study advancing
Corporate • Cash on hand at 30 June 2017 of $40.4 million • Annual General Meeting of Shareholders approve a 1 for 5 share consolidation • Appointment of new Director to the Board • Appointment of new Chief Financial Officer • US$2.1 million received for settlement of legal dispute with Tianqi
__________________________________________________________________ Teleconference A teleconference on the Quarterly Results will be held on Monday 17 July 2017, commencing at 9.30am (AWST). Conference ID: 5432 6900 Within Australia (Toll Free): 1800 123 296 International: Canada 1855 5616 766 Japan 0120 477 087 China 4001 203 085 Singapore 800 616 2288 Hong Kong 800 908 865 United States 1855 293 1544 UK 1855 293 1544
For
per
sona
l use
onl
y

Page | 2
PROJECTS
MT CATTLIN – OPERATIONS Operations at Mt Cattlin remains Lost Time Incident free since refurbishment and restart of production. During the quarter, the Mt Cattlin operations transitioned into commercial production with ramp up and commissioning of the plant completed at the end of April. Production & Sales Statistics
Units March qtr 2017
June qtr 2017
YTD 2017
June qtr vs
March qtr
Waste mined bcm 143,300 460,850 604,150 222%
Ore mined bcm 87,922 110,788 198,710 26%
Ore mined wmt 233,193 303,394 536,587 30%
Grade % 0.96 1.12 1.05 +0.16
Ore treated wmt 253,156 334,036 587,192 32%
Ore Feed Grade % 1.02 1.15 1.09 +0.13
Spodumene produced dmt 23,467 32,998 56,465 41%
Spodumene sold dmt 23,455 30,135 53,590 28%
Spodumene grade sold % 5.38 5.77 5.60 +0.39
Moisture % 1.80 2.12 1.98 +0.32
Mica content % 1.88 1.96 1.93 +0.08
Mining operations achieved full production levels during the quarter, with total material movement of 571,638 bank cubic metres (“bcm”) of waste and ore, including 303,394 wet metric tonnes (“wmt”) of ore at an average grade of 1.12% Li2O. Mining volumes increased by 147% from the March quarter mainly due to a 222% increase in waste mining volumes. Mining activities were concentrated on the northern and western sides of the pit, and run of mine ore stocks were as planned at the end of the quarter. Ore treated increased by 32% to 334,036 wmt and the average ore feed grade improved to 1.15% for the quarter. Spodumene production increased by 41% to 32,998 dmt. The efficiency of the Mt Cattlin plant has continued to improve with concentrate production for the last 2 months of the quarter averaging 436 dmt per day, equivalent to production of approximately 160,000 tonnes per annum (“tpa”). The
For
per
sona
l use
onl
y
Page | 3
annualised rate of concentrate production in June was approximately 170,000 tpa. During June, daily concentrate production exceeded 500 tpa on sixteen days. The performance of the redesigned Mt Cattlin plant has now reached steady state operations with an average recovery of 61% achieved in June, well above the budgeted target of 50-55%. This was due to higher head grade and improved specific gravity (“SG”) control, as well as improved stability in the dense media separation (“DMS”) circuit. There were two shipments of lithium concentrate during the quarter totaling 30,135 dmt, with both shipments at product grade and specifications well above contract requirements and with moisture and mica content levels well below contract requirements. With the shipment in April, Mt Cattlin completed:
• its 2016 contract off take supply obligations priced at US$600 per tonne; and
• repayment in full of all prepayments advanced by customers. All subsequent shipments are based on 2017 pricing terms of US$830 per tonne for 5.5% grade lithium concentrate, rising to US$905 per tonne for 6.0% grade product. Mt Cattlin management is currently evaluating two options for longer term crushing operations - comparing the benefits of refurbishing the plant’s existing fixed crushing circuit versus setting up a semi-permanent crushing facility operated by a contractor. A final decision is expected to be made in the September quarter. In addition, a technical and financial evaluation has commenced for the construction of an ultra fines DMS circuit, a secondary float re-crush circuit and a final product optical sorter that will target further increasing recoveries to between 70-75%. Work continues to progress on establishing medium and long term water supply sources, with suitable options available for both timelines. The average production cash costs (excluding royalties and marketing fees) for the quarter were US$393 (A$524) per dmt of spodumene produced. Compared to the March quarter, these costs were impacted by higher waste mining volumes during the June quarter. The production cash cost (excluding royalties and marketing fees) for the month of June was US$334 (A$442) per dmt of spodumene produced. It is anticipated that unit production cash costs will continue to reduce as the operation achieves further efficiencies and full production rates are maintained. Product sales of 30,135 dmt were reported at an average realized sales price (before royalties and marketing fees) of US$724 (A$964) per dmt of spodumene. Notwithstanding the ramp up and final commissioning of the operations during April, Mt Cattlin generated a positive cash flow of A$13.2 million for the quarter before capex and repayment of the balance of customer prepayments.
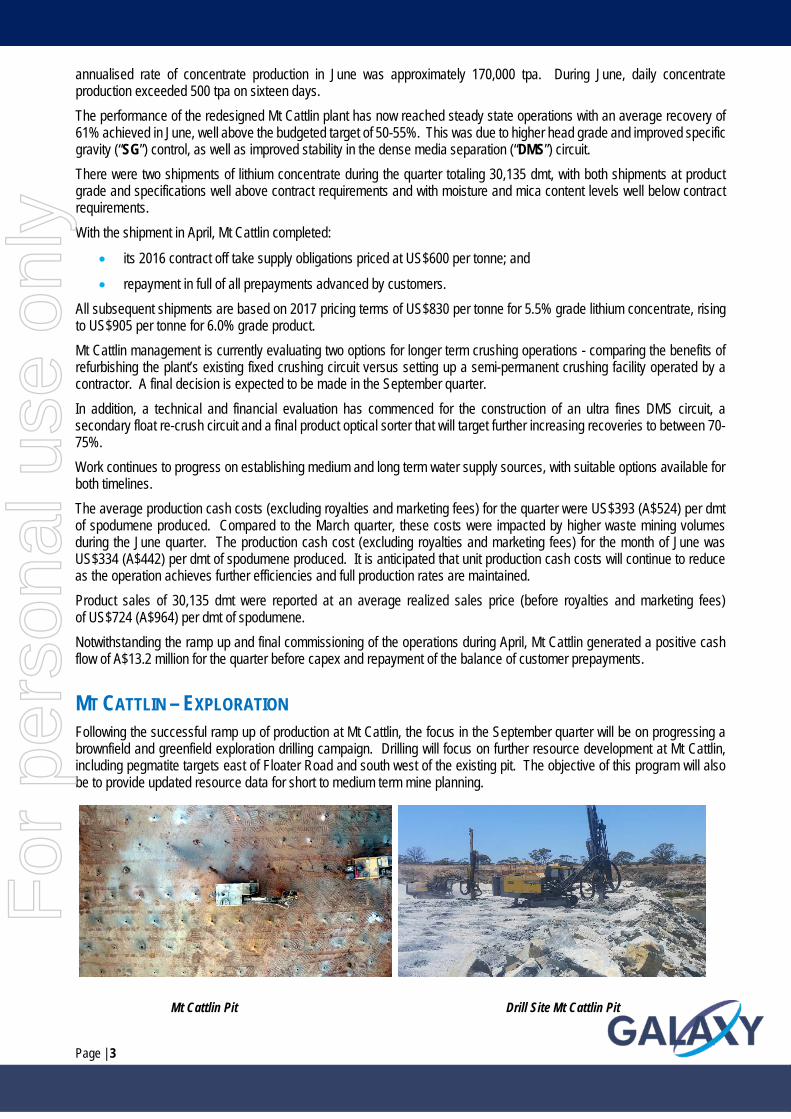
MT CATTLIN – EXPLORATION Following the successful ramp up of production at Mt Cattlin, the focus in the September quarter will be on progressing a brownfield and greenfield exploration drilling campaign. Drilling will focus on further resource development at Mt Cattlin, including pegmatite targets east of Floater Road and south west of the existing pit. The objective of this program will also be to provide updated resource data for short to medium term mine planning.
Mt Cattlin Pit Drill Site Mt Cattlin Pit
For
per
sona
l use
onl
y
Page | 4
SAL DE VIDA
The Company is pleased to report that the June quarter has seen the Sal de Vida (“SDV”) team advance with a number of key milestones achieved.
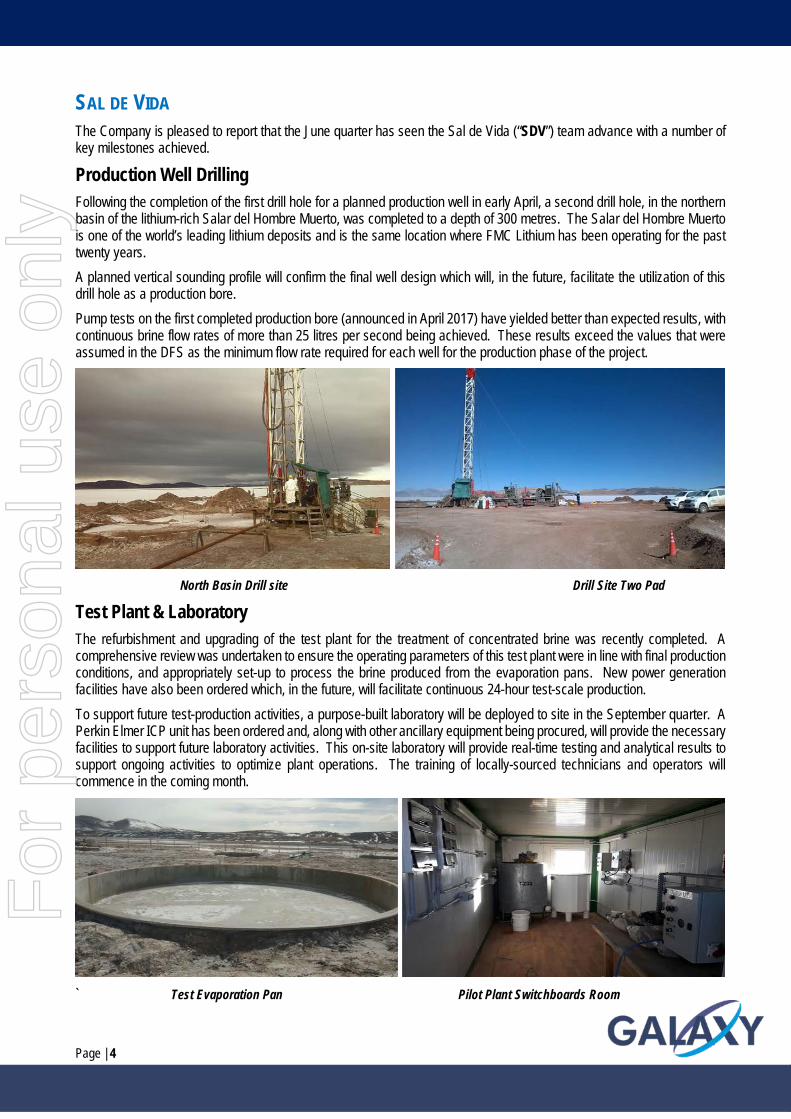
Production Well Drilling Following the completion of the first drill hole for a planned production well in early April, a second drill hole, in the northern basin of the lithium-rich Salar del Hombre Muerto, was completed to a depth of 300 metres. The Salar del Hombre Muerto is one of the world’s leading lithium deposits and is the same location where FMC Lithium has been operating for the past twenty years. A planned vertical sounding profile will confirm the final well design which will, in the future, facilitate the utilization of this drill hole as a production bore. Pump tests on the first completed production bore (announced in April 2017) have yielded better than expected results, with continuous brine flow rates of more than 25 litres per second being achieved. These results exceed the values that were assumed in the DFS as the minimum flow rate required for each well for the production phase of the project.
North Basin Drill site Drill Site Two Pad
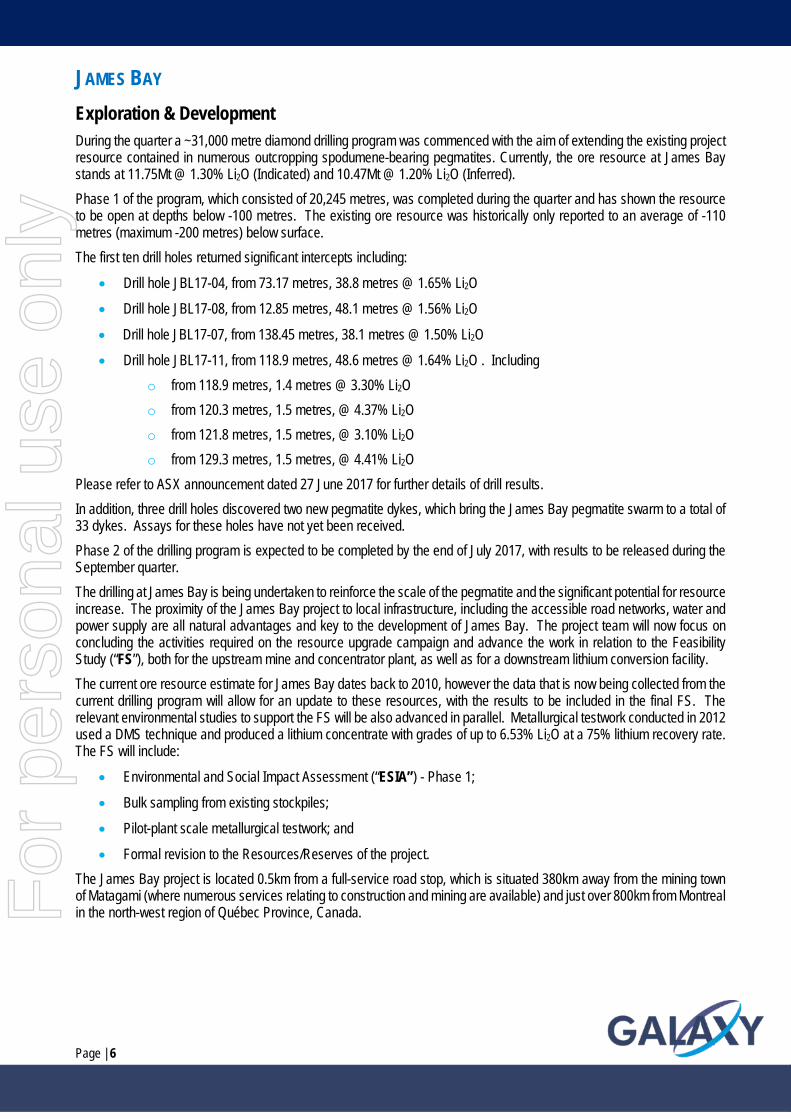
Test Plant & Laboratory The refurbishment and upgrading of the test plant for the treatment of concentrated brine was recently completed. A comprehensive review was undertaken to ensure the operating parameters of this test plant were in line with final production conditions, and appropriately set-up to process the brine produced from the evaporation pans. New power generation facilities have also been ordered which, in the future, will facilitate continuous 24-hour test-scale production. To support future test-production activities, a purpose-built laboratory will be deployed to site in the September quarter. A Perkin Elmer ICP unit has been ordered and, along with other ancillary equipment being procured, will provide the necessary facilities to support future laboratory activities. This on-site laboratory will provide real-time testing and analytical results to support ongoing activities to optimize plant operations. The training of locally-sourced technicians and operators will commence in the coming month.
` Test Evaporation Pan Pilot Plant Switchboards Room
For
per
sona
l use
onl
y

Page | 5
“TANGO-01” Construction Camp Design and planning activities relating to the establishment of a temporary construction camp have been completed. The camp will incorporate numerous renewable energy systems to power and heat the facilities at its remote location in the Puna. Final approvals from relevant regulatory departments are expected shortly so that the refurbishment and establishment of the camp can be undertaken in the third quarter of 2017. Following completion, “TANGO-01” will become a base of operations for the future planned test plant activities and pond construction works.
“Tango-01” East View “Tango-01” Aerial NE View
Pre-Production Evaporation Ponds Requests for quotation were issued in May to local engineering service providers to provide support for design works associated with the small-scale pre-production evaporation ponds, as well as the larger, commercial production scale equivalent. Quotations have now been received and are currently being evaluated. In parallel, the Company has also commenced discussions with major earthwork equipment vendors and contractors to determine the most cost-effective method to undertake the ponds construction.
Corporate Social Responsibility In line with a long-standing commitment to the local communities, Galaxy has engaged with numerous local service providers, and the Catamarca and Salta provincial governments, to discuss and identify training opportunities for specific job vacancies that Galaxy plans to fill during the remainder of the year. Galaxy has taken proactive steps to develop a comprehensive training program for those positions to be filled once construction and operational activities commence. Training opportunities will be available for roles at the Sal de Vida Project, including laboratory technicians and various heavy equipment operators.
Strategic Partners The Company has recently progressed its discussions with potential joint venture partners on the project to a more definitive stage, and currently has ongoing dialogue with a number of potential strategic partners and customers, for investment, project financing and offtake.
For
per
sona
l use
onl
y
Page | 6
JAMES BAY Exploration & Development During the quarter a ~31,000 metre diamond drilling program was commenced with the aim of extending the existing project resource contained in numerous outcropping spodumene-bearing pegmatites. Currently, the ore resource at James Bay stands at 11.75Mt @ 1.30% Li2O (Indicated) and 10.47Mt @ 1.20% Li2O (Inferred). Phase 1 of the program, which consisted of 20,245 metres, was completed during the quarter and has shown the resource to be open at depths below -100 metres. The existing ore resource was historically only reported to an average of -110 metres (maximum -200 metres) below surface. The first ten drill holes returned significant intercepts including:
• Drill hole JBL17-04, from 73.17 metres, 38.8 metres @ 1.65% Li2O
• Drill hole JBL17-08, from 12.85 metres, 48.1 metres @ 1.56% Li2O
• Drill hole JBL17-07, from 138.45 metres, 38.1 metres @ 1.50% Li2O
• Drill hole JBL17-11, from 118.9 metres, 48.6 metres @ 1.64% Li2O . Including o from 118.9 metres, 1.4 metres @ 3.30% Li2O o from 120.3 metres, 1.5 metres, @ 4.37% Li2O o from 121.8 metres, 1.5 metres, @ 3.10% Li2O o from 129.3 metres, 1.5 metres, @ 4.41% Li2O
Please refer to ASX announcement dated 27 June 2017 for further details of drill results. In addition, three drill holes discovered two new pegmatite dykes, which bring the James Bay pegmatite swarm to a total of 33 dykes. Assays for these holes have not yet been received. Phase 2 of the drilling program is expected to be completed by the end of July 2017, with results to be released during the September quarter. The drilling at James Bay is being undertaken to reinforce the scale of the pegmatite and the significant potential for resource increase. The proximity of the James Bay project to local infrastructure, including the accessible road networks, water and power supply are all natural advantages and key to the development of James Bay. The project team will now focus on concluding the activities required on the resource upgrade campaign and advance the work in relation to the Feasibility Study (“FS”), both for the upstream mine and concentrator plant, as well as for a downstream lithium conversion facility. The current ore resource estimate for James Bay dates back to 2010, however the data that is now being collected from the current drilling program will allow for an update to these resources, with the results to be included in the final FS. The relevant environmental studies to support the FS will be also advanced in parallel. Metallurgical testwork conducted in 2012 used a DMS technique and produced a lithium concentrate with grades of up to 6.53% Li2O at a 75% lithium recovery rate. The FS will include:
• Environmental and Social Impact Assessment (“ESIA”) - Phase 1;
• Bulk sampling from existing stockpiles;
• Pilot-plant scale metallurgical testwork; and
• Formal revision to the Resources/Reserves of the project. The James Bay project is located 0.5km from a full-service road stop, which is situated 380km away from the mining town of Matagami (where numerous services relating to construction and mining are available) and just over 800km from Montreal in the north-west region of Québec Province, Canada.
For
per
sona
l use
onl
y
Page | 7
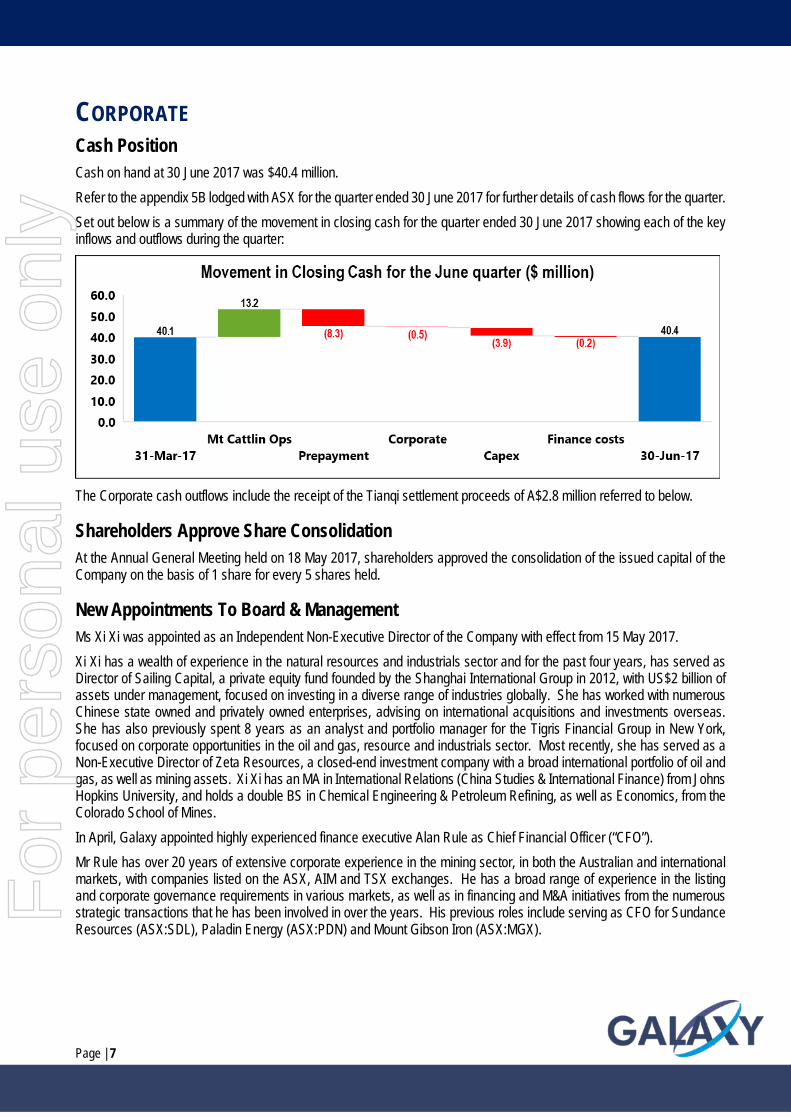
CORPORATE Cash Position Cash on hand at 30 June 2017 was $40.4 million. Refer to the appendix 5B lodged with ASX for the quarter ended 30 June 2017 for further details of cash flows for the quarter. Set out below is a summary of the movement in closing cash for the quarter ended 30 June 2017 showing each of the key inflows and outflows during the quarter:
The Corporate cash outflows include the receipt of the Tianqi settlement proceeds of A$2.8 million referred to below.
Shareholders Approve Share Consolidation At the Annual General Meeting held on 18 May 2017, shareholders approved the consolidation of the issued capital of the Company on the basis of 1 share for every 5 shares held.
New Appointments To Board & Management Ms Xi Xi was appointed as an Independent Non-Executive Director of the Company with effect from 15 May 2017. Xi Xi has a wealth of experience in the natural resources and industrials sector and for the past four years, has served as Director of Sailing Capital, a private equity fund founded by the Shanghai International Group in 2012, with US$2 billion of assets under management, focused on investing in a diverse range of industries globally. She has worked with numerous Chinese state owned and privately owned enterprises, advising on international acquisitions and investments overseas. She has also previously spent 8 years as an analyst and portfolio manager for the Tigris Financial Group in New York, focused on corporate opportunities in the oil and gas, resource and industrials sector. Most recently, she has served as a Non-Executive Director of Zeta Resources, a closed-end investment company with a broad international portfolio of oil and gas, as well as mining assets. Xi Xi has an MA in International Relations (China Studies & International Finance) from Johns Hopkins University, and holds a double BS in Chemical Engineering & Petroleum Refining, as well as Economics, from the Colorado School of Mines. In April, Galaxy appointed highly experienced finance executive Alan Rule as Chief Financial Officer (“CFO”). Mr Rule has over 20 years of extensive corporate experience in the mining sector, in both the Australian and international markets, with companies listed on the ASX, AIM and TSX exchanges. He has a broad range of experience in the listing and corporate governance requirements in various markets, as well as in financing and M&A initiatives from the numerous strategic transactions that he has been involved in over the years. His previous roles include serving as CFO for Sundance Resources (ASX:SDL), Paladin Energy (ASX:PDN) and Mount Gibson Iron (ASX:MGX).
For
per
sona
l use
onl
y
Page | 8
Settlement Of Legal Dispute With Tianqi During the quarter, Galaxy Lithium Australia Limited (a wholly owned subsidiary of the Company) received US$2.1 million in full and final settlement of the legal proceedings arising from a dispute concerning the Amended and Restated Share Purchase Agreement originally made on 29 April 2014, amended and restated with effect from 16 January 2015 with Galaxy Lithium Australia Limited, Galaxy Resources Limited, Tianqi HK Co., Limited (“Tianqi”) and Sichuan Tianqi Lithium Industries, for the sale of Galaxy Lithium Australia Limited’s shares in Galaxy Lithium International Limited, the entity which held the Jiangsu Lithium Carbonate plant, to Tianqi. Refer to note 11(a) of the consolidated financial statements for the year ended 31 December 2016 for further details of the dispute that is now settled.
INDUSTRY & MARKET UPDATE The demand outlook for lithium continues to remain very robust, with the lithium battery sector showing solid results for continued growth near term, as well as strong potential for extending that growth through to 2020 and beyond, with the announcements of major multifold capacity expansion from downstream manufacturers, including leading global companies such as Umicore and CATL. Much of these planned expansions have been due to the ongoing increase in adoption rates and sales of electric vehicles around the world.
The New Energy Vehicle (“NEV”) sector in China has continued to show strong growth. After a slow start in Q1 2017, CAAM reported a strong Q2 data with a total of 154,000 vehicles produced in the quarter, representing a 167% growth quarter-on-quarter and a 20% growth year-on-year. Of these NEVs, a total of 128,000 or 83% were pure electric vehicles, with the remainder being hybrid electric vehicles, continuing the trend of pure electric vehicles dominating the market in China. In the first half of the 2017, China produced an aggregate 212,000 NEVs, which represented a 20% increase when compared to 2016H1.
In addition, the US market also reported strong growth during the period, with a reported 47,364 plug-in vehicles sales according to InsideEVs, representing a 13% growth quarter-on-quarter and a 28% year-on-year growth. In total, the US market reported a total of 89,285 vehicles sold in the first half of 2017, an increase of 38% when compared to the first half of 2016.
Aside from the strong results in the electric vehicle sector, new growth initiatives have also been reported in the high potential mass energy storage sector, with the announcement by Tesla to build the world‘s largest lithium battery storage system in South Australia. The PowerPack battery system is to be located next to the Hornsdale Wind Farm and will have 100MW of capacity, providing 129MWh of energy generation to the region, supporting the local renewable energy generation with load balancing and allowing for back-up power where required. The scale of the PowerPack battery farm significantly surpasses the next largest energy storage system, which is only 30MW in size, built thus far and is the equivalent to over 2,000 Tesla Model 3‘s in aggregate battery size.
For
per
sona
l use
onl
y
Page | 9
Competent Person Statement SAL DE VIDA Any information in this report that relates to relates to the estimation and reporting of the Sal de Vida Project Mineral Resources and Ore Reserves is extracted from the report entitled “Sal De Vida: Revised Definitive Feasibility Study Confirms Low Cost, Long Life and Economically Robust Operation” created on 22 August 2016 which is available to view on www.galaxylithium.com and www.asx.com.au. The Company confirms that it is not aware of any new information or data that materially affects the information included in the original market announcement and that all material assumptions and technical parametres underpinning the Mineral Resources and Ore Reserves estimates in the relevant market announcement continue to apply and have not materially changed. The Company confirms that the form and context in which the Competent Person’s findings are presented have not been materially modified from the original market announcement.
JAMES BAY The information in this report that relates to relates to the estimation and reporting of the James Bay exploration results is extracted from the announcement entitled “James Bay Update: Drilling Campaign Delivers Thick, High Grade Results ” created on 27 June 2017 which is available to view on www.galaxylithium.com and www.asx.com.au. The Company confirms that it is not aware of any new information or data that materially affects the information included in the original market announcement and that all material assumptions and technical parameters underpinning the exploration results in the relevant market announcement continue to apply and have not materially changed. The Company confirms that the form and context in which the Competent Person’s findings are presented have not been materially modified from the original market announcement. The information in this report that relates to Mineral Resources at the James Bay Project is based on work completed by Mr James McCann, who is a Member of the Ordre des Geologues du Quebec, a Recognised Overseas Professional Organisation. Mr McCann is a full time employee of Galaxy, and has sufficient experience which is relevant to the style of mineralisation and type of deposit under consideration and to the activity which he is undertaking to qualify as a Competent Person as defined in the 2004 edition of the ‘Australian Code for Reporting of Exploration Results, Mineral Resources and Ore Reserves’. Mr McCann consents to the inclusion in the report of the matters based on his information in the form and context it appears. This information was prepared and first disclosed under the JORC Code 2004 and it has not been updated since to comply with JORC code 2012 on the basis that the information has not materially changed since it was last reported.
Caution Regarding Forward Looking Information This document contains forward looking statements concerning Galaxy. Forward-looking statements are not statements of historical fact and actual events and results may differ materially from those described in the forward looking statements as a result of a variety of risks, uncertainties and other factors. Forward-looking statements are inherently subject to business, economic, competitive, political and social uncertainties and contingencies. Many factors could cause the Company’s actual results to differ materially from those expressed or implied in any forward-looking information provided by the Company, or on behalf of the Company. Such factors include, among other things, risks relating to additional funding requirements, metal prices, exploration, development and operating risks, competition, production risks, regulatory restrictions, including environmental regulation and liability and potential title disputes. Forward looking statements in this document are based on Galaxy’s beliefs, opinions and estimates of Galaxy as of the dates the forward looking statements are made and no obligation is assumed to update forward looking statements if these beliefs, opinions and estimates should change or to reflect other future developments.
Not For Release in the United States
This announcement has been prepared for publication in Australia and may not be released in the United States. This announcement does not constitute an offer of securities for sale in any jurisdiction, including the United States and any securities described in this announcement may not be offered or sold in the United States absent registration or an exemption from registration under the United States Securities Act of 1933, as amended. Any public offering of securities to be made in the United States will be made by means of a prospectus that may be obtained from the issuer and that will contain detailed information about the company and management, as well as financial statements.
For
per
sona
l use
onl
y

Page | 10
TENEMENT SCHEDULE Australia
Tenement PROJECT MANAGER HOLDER GXY SHARES JV SHARE
E51/1602 CHESTERFIELD *GALA GMCL 100
E51/1603 CHESTERFIELD *GALA GMCL 100
E51/1604 CHESTERFIELD *GALA GMCL 100
E70/2493 BOXWOOD HILL *GALA GALA 100
E74/0299 BAKERS HILL *GALA GALA 100
E74/0415 BAKERS HILL *GALA GALA 100
L74/0047 WEST KUNDIP *GALA GALA 100
M45/0538 MURCURY HILL *GALA GMCL 100
M51/0270 MEEKATHARRA *GALA GMCL 100
M51/0451 MEEKATHARRA *GALA GMCL 100
M74/0133 WEST KUNDIP *GALA GALA 100
M74/0238 WEST KUNDIP *GALA GALA 100
E74/0400 FLOATER *GLIT GLIT 100
E74/0401 SIRDAR *GLIT GLIT 80 TRAKA 20
L74/0046 MT CATTLIN *GLIT GLIT 100
L74/0048 MT CATTLIN *GLIT GLIT 100
M74/0244 MT CATTLIN *GLIT GLIT 100
P74/0370 MT CATTLIN *GLIT GLIT 80 TRAKA 20
P74/0371 MT CATTLIN *GLIT GLIT 100
P74/0372 MT CATTLIN *GLIT GLIT 100
P74/0373 MT CATTLIN *GLIT GLIT 80 TRAKA 20
M51/0353 MEEKATHARRA *GMCL GMCL 100
For
per
sona
l use
onl
y

Page | 11
James Bay
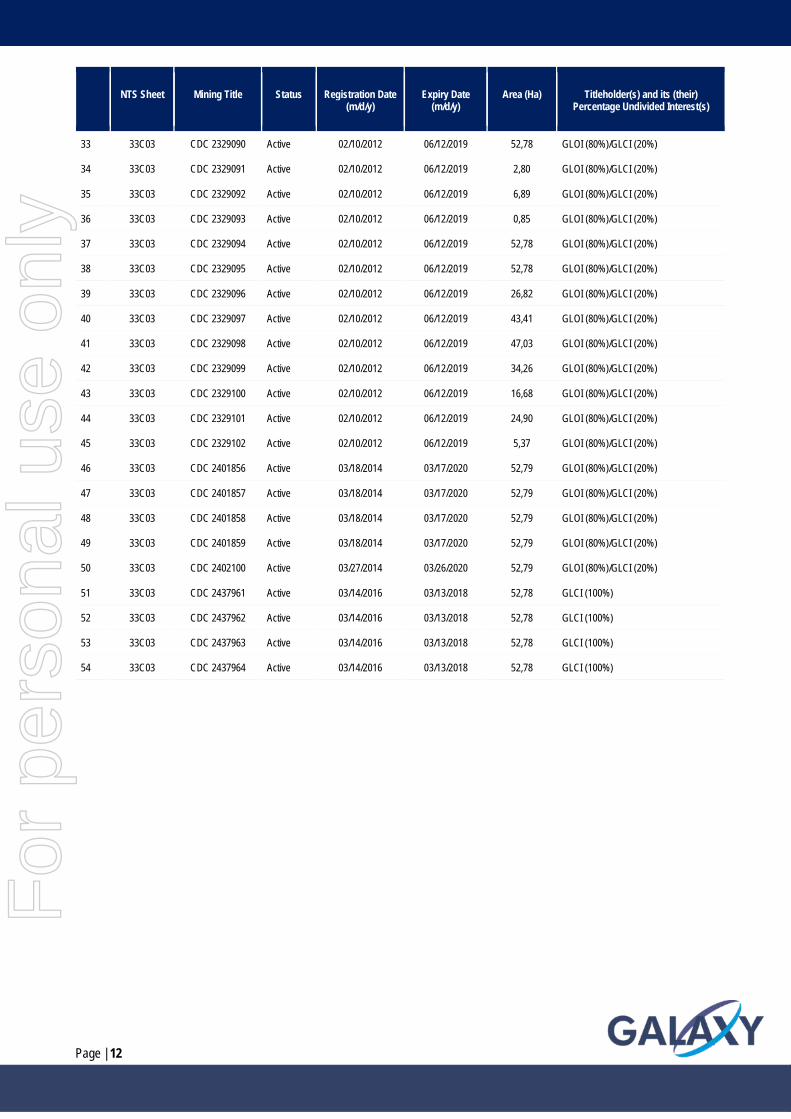
Galaxy Lithium (Canada) Inc. (“GLCI”) and Galaxy Lithium (Ontario) Inc. (“GLOI”) are the registered titleholders of the following tenements constituting the James Bay Project:
NTS Sheet Mining Title Status Registration Date
(m/d/y) Expiry Date
(m/d/y) Area (Ha) Titleholder(s) and its (their)
Percentage Undivided Interest(s)
1 33C03 CDC 2126850 Active 10/04/2007 06/12/2019 52,78 GLOI (80%)/GLCI (20%) 2 33C03 CDC 2126851 Active 10/04/2007 06/12/2019 52,78 GLOI (80%)/GLCI (20%) 3 33C03 CDC 2126852 Active 10/04/2007 06/12/2019 52,78 GLOI (80%)/GLCI (20%) 4 33C03 CDC 2126857 Active 10/04/2007 06/12/2019 52,77 GLOI (80%)/GLCI (20%) 5 33C03 CDC 2126858 Active 10/04/2007 06/12/2019 52,77 GLOI (80%)/GLCI (20%) 6 33C03 CDC 2126859 Active 10/04/2007 06/12/2019 52,77 GLOI (80%)/GLCI (20%) 7 33C03 CDC 2126860 Active 10/04/2007 06/12/2019 52,77 GLOI (80%)/GLCI (20%) 8 33C03 CDC 2126861 Active 10/04/2007 06/12/2019 52,77 GLOI (80%)/GLCI (20%) 9 33C03 CDC 2126862 Active 10/04/2007 06/12/2019 52,77 GLOI (80%)/GLCI (20%) 10 33C03 CDC 2126863 Active 10/04/2007 06/12/2019 52,77 GLOI (80%)/GLCI (20%) 11 33C03 CDC 2126864 Active 10/04/2007 06/12/2019 52,77 GLOI (80%)/GLCI (20%) 12 33C03 CDC 2126868 Active 10/04/2007 06/12/2019 52,76 GLOI (80%)/GLCI (20%) 13 33C03 CDC 2126869 Active 10/04/2007 06/12/2019 52,76 GLOI (80%)/GLCI (20%) 14 33C03 CDC 2126870 Active 10/04/2007 06/12/2019 52,76 GLOI (80%)/GLCI (20%) 15 33C03 CDC 2126871 Active 10/04/2007 06/12/2019 52,76 GLOI (80%)/GLCI (20%) 16 33C03 CDC 2126872 Active 10/04/2007 06/12/2019 52,76 GLOI (80%)/GLCI (20%) 17 33C03 CDC 2126873 Active 10/04/2007 06/12/2019 52,76 GLOI (80%)/GLCI (20%) 18 33C03 CDC 2126986 Active 10/04/2007 06/12/2019 49,98 GLOI (80%)/GLCI (20%) 19 33C03 CDC 2126988 Active 10/04/2007 06/12/2019 45,88 GLOI (80%)/GLCI (20%) 20 33C03 CDC 2126989 Active 10/04/2007 06/12/2019 47,39 GLOI (80%)/GLCI (20%) 21 33C03 CDC 2126990 Active 10/04/2007 06/12/2019 51,91 GLOI (80%)/GLCI (20%) 22 33C03 CDC 2183503 Active 06/16/2009 06/12/2019 22,41 GLOI (80%)/GLCI (20%) 23 33C03 CDC 2183504 Active 06/16/2009 06/12/2019 3,55 GLOI (80%)/GLCI (20%) 24 33C03 CDC 2183505 Active 06/16/2009 06/12/2019 18,51 GLOI (80%)/GLCI (20%) 25 33C03 CDC 2183506 Active 06/16/2009 06/12/2019 36,08 GLOI (80%)/GLCI (20%) 26 33C03 CDC 2183507 Active 06/16/2009 06/12/2019 0,33 GLOI (80%)/GLCI (20%) 27 33C03 CDC 2183508 Active 06/16/2009 06/12/2019 27,53 GLOI (80%)/GLCI (20%) 28 33C03 CDC 2192842 Active 10/27/2009 06/12/2019 1,83 GLOI (80%)/GLCI (20%) 29 33C03 CDC 2238478 Active 06/21/2010 06/20/2020 GLOI (80%)/GLCI (20%) 30 33C03 CDC 2238480 Active 06/21/2010 06/20/2020 7,54 GLOI (80%)/GLCI (20%) 31 33C03 CDC 2298178 Active 06/21/2011 06/12/2019 52,79 GLOI (80%)/GLCI (20%) 32 33C03 CDC 2298179 Active 06/21/2011 06/12/2019 52,79 GLOI (80%)/GLCI (20%)
For
per
sona
l use
onl
y
Page | 12
NTS Sheet Mining Title Status Registration Date
(m/d/y) Expiry Date
(m/d/y) Area (Ha) Titleholder(s) and its (their)
Percentage Undivided Interest(s)
33 33C03 CDC 2329090 Active 02/10/2012 06/12/2019 52,78 GLOI (80%)/GLCI (20%) 34 33C03 CDC 2329091 Active 02/10/2012 06/12/2019 2,80 GLOI (80%)/GLCI (20%) 35 33C03 CDC 2329092 Active 02/10/2012 06/12/2019 6,89 GLOI (80%)/GLCI (20%) 36 33C03 CDC 2329093 Active 02/10/2012 06/12/2019 0,85 GLOI (80%)/GLCI (20%) 37 33C03 CDC 2329094 Active 02/10/2012 06/12/2019 52,78 GLOI (80%)/GLCI (20%) 38 33C03 CDC 2329095 Active 02/10/2012 06/12/2019 52,78 GLOI (80%)/GLCI (20%) 39 33C03 CDC 2329096 Active 02/10/2012 06/12/2019 26,82 GLOI (80%)/GLCI (20%) 40 33C03 CDC 2329097 Active 02/10/2012 06/12/2019 43,41 GLOI (80%)/GLCI (20%) 41 33C03 CDC 2329098 Active 02/10/2012 06/12/2019 47,03 GLOI (80%)/GLCI (20%) 42 33C03 CDC 2329099 Active 02/10/2012 06/12/2019 34,26 GLOI (80%)/GLCI (20%) 43 33C03 CDC 2329100 Active 02/10/2012 06/12/2019 16,68 GLOI (80%)/GLCI (20%) 44 33C03 CDC 2329101 Active 02/10/2012 06/12/2019 24,90 GLOI (80%)/GLCI (20%) 45 33C03 CDC 2329102 Active 02/10/2012 06/12/2019 5,37 GLOI (80%)/GLCI (20%) 46 33C03 CDC 2401856 Active 03/18/2014 03/17/2020 52,79 GLOI (80%)/GLCI (20%) 47 33C03 CDC 2401857 Active 03/18/2014 03/17/2020 52,79 GLOI (80%)/GLCI (20%) 48 33C03 CDC 2401858 Active 03/18/2014 03/17/2020 52,79 GLOI (80%)/GLCI (20%) 49 33C03 CDC 2401859 Active 03/18/2014 03/17/2020 52,79 GLOI (80%)/GLCI (20%) 50 33C03 CDC 2402100 Active 03/27/2014 03/26/2020 52,79 GLOI (80%)/GLCI (20%) 51 33C03 CDC 2437961 Active 03/14/2016 03/13/2018 52,78 GLCI (100%) 52 33C03 CDC 2437962 Active 03/14/2016 03/13/2018 52,78 GLCI (100%) 53 33C03 CDC 2437963 Active 03/14/2016 03/13/2018 52,78 GLCI (100%) 54 33C03 CDC 2437964 Active 03/14/2016 03/13/2018 52,78 GLCI (100%)
For
per
sona
l use
onl
y

Page | 13
Sal de Vida
Catamarca
N° FILE TENEMENT N° FILE TENEMENT
1 78-G-1986 LA REDONDA 4 22 1279-G-2006 AGUSTIN 2 210-R-1994 LOS PATOS 23 1280-D-2006 LUNA BLANCA 3 261-G-1997 CENTENARIO 24 1281-G-2006 FIDEL 4 77-R-1999 BARREAL 1 25 1430-M-2006 MEME 5 27-M-2000 MAKTUB XXIII 26 227-G-2007 PACHAMAMA 6 54-R-2000 AURELIO 27 289-G-2007 LA PRIMERA 7 55-R-2000 LA REDONDA I 28 290-G-2007 LA SEGUNDA 8 56-R-2000 DON CARLOS 29 291-A-2007 LA TERCERA 9 160-G-2002 BARREAL 2 30 354-G-2007 CHINA
10 161-G-2002 REDONDA 5 31 657-G-2009 RODOLFO 11 162-G-2002 DON PEPE 32 709-G-2009 LUNA BLANCA II 12 168-G-2002 AGOSTINA 33 754-G-2009 SONQO 13 185-G-2002 CHACHITA 34 812-G-2009 LUNA BLANCA IV 14 398-G-2003 DELIA 35 813-G-2009 LUNA BLANCA V 15 787-M-2005 JUAN LUIS 36 814-G-2009 LUNA BLANCA VI 16 788-M-2005 MARIA LUCIA 37 815-G-2009 ROCIO I 17 913-M-2005 MARIA CLARA 38 117-G-2010 LUNA BLANCA III 18 914-M-2005 MARIA CLARA 1 39 268-G-2010 BEATRIZ VI 19 1178-G-2006 EL TORDO 40 269-G-2010 NELLY VI 20 1179-G-2006 QUIERO VALE CUATRO 41 65-2016 MONTSERRAT I 21 1197-A-2006 TRUCO 42 254-G-2011 MONTSERRAT
Salta
N° FILE TENEMENT N° FILE TENEMENT
43 1215 ESTELA 57 18001-2004 ROCIO
44 1495 ALEX 58 18128-2005 PABLO II
45 5596 FERNANDO 59 19562-2009 SALVADOR
46 13848 DIANA 60 19579-2009 SALVADOR II
47 16741-1999 GASTON I 61 19669-2009 PAPADOPULOS XXXIV
48 16810-2000 GASTON II 62 19670-2009 PAPADOPULOS XXXV
49 17335 VALERIO 63 19931-2009 TABAHM
50 17392-2001 GASTON III 64 19987-2009 TABAHM 02
51 17529-2002 MARIA CECILIA 65 20024-2009 TABAHM 05
52 17583-2002 LITA 66 20877 RATONES OESTE
53 17584-2002 FLORENCIA 67 21190 CATAL NORTE
54 17599-2002 NELLY 68 21655 RATONES SUR
55 17898-2004 PABLO 69 21864 RATONES OESTE 2
56 17924-2004 CAMILA
For
per
sona
l use
onl
y

Appendix 5B Mining exploration entity and oil and gas exploration entity quarterly report
+ See chapter 19 for defined terms 1 September 2016 Page 1
+Rule 5.5
Appendix 5B
Mining exploration entity and oil and gas exploration entity quarterly report
Introduced 01/07/96 Origin Appendix 8 Amended 01/07/97, 01/07/98, 30/09/01, 01/06/10, 17/12/10, 01/05/13, 01/09/16
Name of entity
Galaxy Resources Limited
ABN Quarter ended (“current quarter”)
11 071 976 442 30 June 2017
Consolidated statement of cash flows Current quarter
$A’000
Year to date
(6 months)
$A’000
1. Cash flows from operating activities
19,594 27,075 1.1 Receipts from customers*
1.2 Payments for
(2,535) (3,122) (a) exploration & evaluation
(b) development - -
(c) production (11,990) (18,058)
(d) staff costs (2,853) (4,822)
(e) administration and corporate costs (2,393) (3,389)
1.3 Dividends received (see note 3) - -
1.4 Interest received 111 116
1.5 Interest and other costs of finance paid (183) (1,065)
1.6 Income taxes paid - -
1.7 Research and development refunds - -
1.8 Other (provide details if material) - -
1.9 Net cash from / (used in) operating activities
(249) (3,265)
Note*: Receipts from customers above are amounts net of the repayment of customer offtake prepayments received in 2016 amounting to $8.3 million for the quarter and $18.0 million for the half-year
2. Cash flows from investing activities
(1,451) (2,581)
2.1 Payments to acquire:
(a) property, plant and equipment
(b) tenements (see item 10) - -
(c) investments - -
(d) other non-current assets - -
For
per
sona
l use
onl
y
Appendix 5B Mining exploration entity and oil and gas exploration entity quarterly report
+ See chapter 19 for defined terms 1 September 2016 Page 2
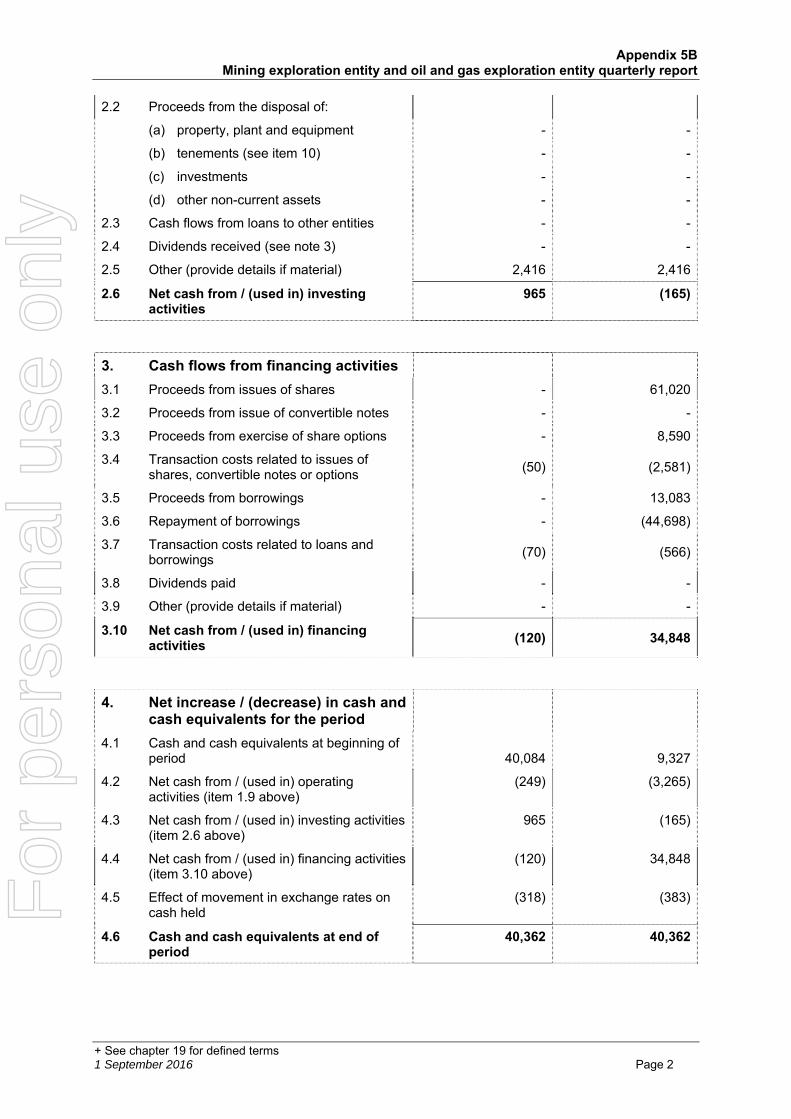
2.2 Proceeds from the disposal of:
- - (a) property, plant and equipment
(b) tenements (see item 10) - -
(c) investments - -
(d) other non-current assets - -
2.3 Cash flows from loans to other entities - -
2.4 Dividends received (see note 3) - -
2.5 Other (provide details if material) 2,416 2,416
2.6 Net cash from / (used in) investing activities
965 (165)
3. Cash flows from financing activities
- 61,020 3.1 Proceeds from issues of shares
3.2 Proceeds from issue of convertible notes - -
3.3 Proceeds from exercise of share options - 8,590
3.4 Transaction costs related to issues of shares, convertible notes or options
(50) (2,581)
3.5 Proceeds from borrowings - 13,083
3.6 Repayment of borrowings - (44,698)
3.7 Transaction costs related to loans and borrowings
(70) (566)
3.8 Dividends paid - -
3.9 Other (provide details if material) - -
3.10 Net cash from / (used in) financing activities
(120) 34,848
4. Net increase / (decrease) in cash and cash equivalents for the period
40,084 9,327 4.1 Cash and cash equivalents at beginning of
period
4.2 Net cash from / (used in) operating activities (item 1.9 above)
(249) (3,265)
4.3 Net cash from / (used in) investing activities (item 2.6 above)
965 (165)
4.4 Net cash from / (used in) financing activities (item 3.10 above)
(120) 34,848
4.5 Effect of movement in exchange rates on cash held
(318) (383)
4.6 Cash and cash equivalents at end of period
40,362 40,362
For
per
sona
l use
onl
y
Appendix 5B Mining exploration entity and oil and gas exploration entity quarterly report
+ See chapter 19 for defined terms 1 September 2016 Page 3
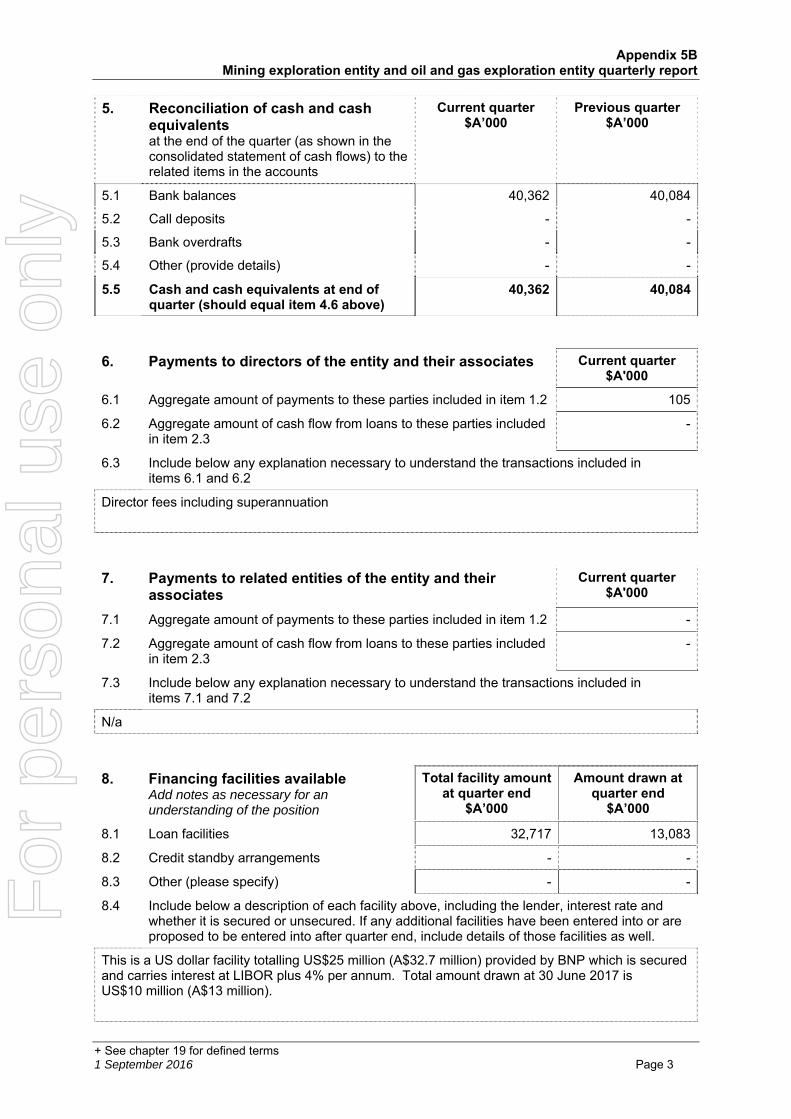
5. Reconciliation of cash and cash equivalents at the end of the quarter (as shown in the consolidated statement of cash flows) to the related items in the accounts
Current quarter $A’000
Previous quarter $A’000
5.1 Bank balances 40,362 40,084
5.2 Call deposits - -
5.3 Bank overdrafts - -
5.4 Other (provide details) - -
5.5 Cash and cash equivalents at end of quarter (should equal item 4.6 above)
40,362 40,084
6. Payments to directors of the entity and their associates Current quarter $A'000
6.1 Aggregate amount of payments to these parties included in item 1.2 105
6.2 Aggregate amount of cash flow from loans to these parties included in item 2.3
-
6.3 Include below any explanation necessary to understand the transactions included in items 6.1 and 6.2
Director fees including superannuation
7. Payments to related entities of the entity and their associates
Current quarter $A'000
7.1 Aggregate amount of payments to these parties included in item 1.2 -
7.2 Aggregate amount of cash flow from loans to these parties included in item 2.3
-
7.3 Include below any explanation necessary to understand the transactions included in items 7.1 and 7.2
N/a
8. Financing facilities available Add notes as necessary for an understanding of the position
Total facility amount at quarter end
$A’000
Amount drawn at quarter end
$A’000
8.1 Loan facilities 32,717 13,083
8.2 Credit standby arrangements - -
8.3 Other (please specify) - -
8.4 Include below a description of each facility above, including the lender, interest rate and whether it is secured or unsecured. If any additional facilities have been entered into or are proposed to be entered into after quarter end, include details of those facilities as well.
This is a US dollar facility totalling US$25 million (A$32.7 million) provided by BNP which is secured and carries interest at LIBOR plus 4% per annum. Total amount drawn at 30 June 2017 is US$10 million (A$13 million).
For
per
sona
l use
onl
y
Appendix 5B Mining exploration entity and oil and gas exploration entity quarterly report
+ See chapter 19 for defined terms 1 September 2016 Page 4
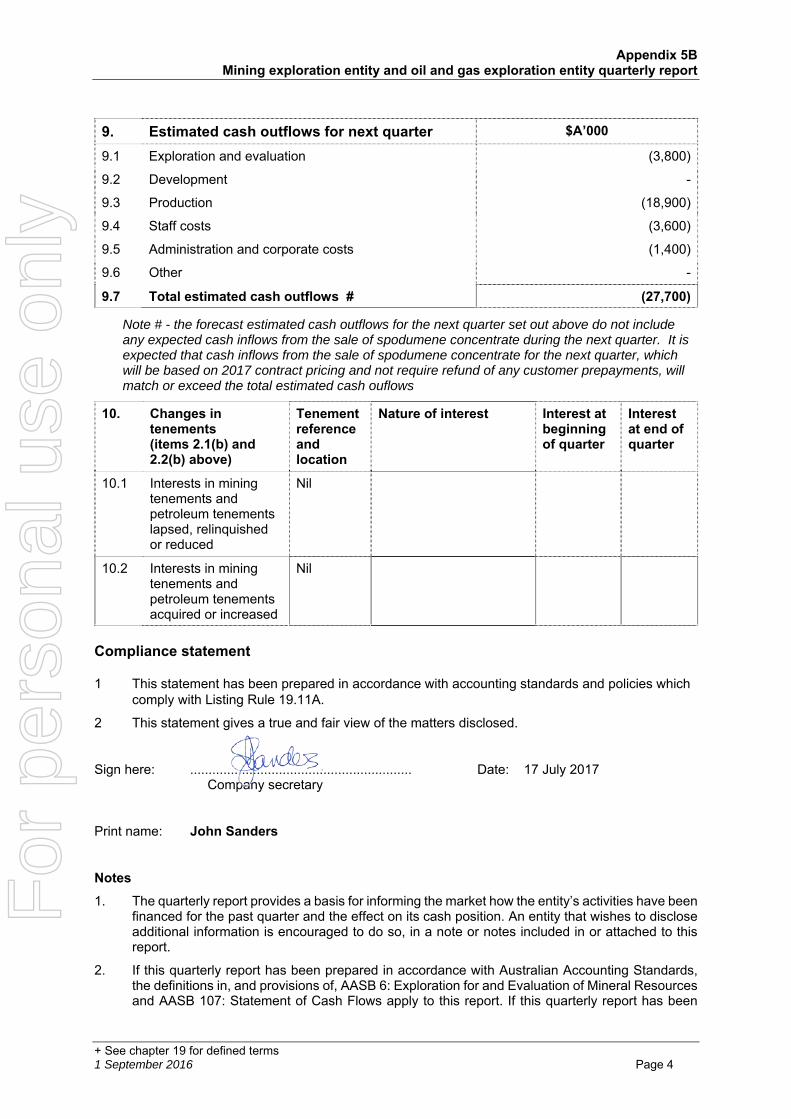
9. Estimated cash outflows for next quarter $A’000
9.1 Exploration and evaluation (3,800)
9.2 Development -
9.3 Production (18,900)
9.4 Staff costs (3,600)
9.5 Administration and corporate costs (1,400)
9.6 Other -
9.7 Total estimated cash outflows # (27,700)
Note # - the forecast estimated cash outflows for the next quarter set out above do not include any expected cash inflows from the sale of spodumene concentrate during the next quarter. It is expected that cash inflows from the sale of spodumene concentrate for the next quarter, which will be based on 2017 contract pricing and not require refund of any customer prepayments, will match or exceed the total estimated cash ouflows
10. Changes in tenements (items 2.1(b) and 2.2(b) above)
Tenement reference and location
Nature of interest Interest at beginning of quarter
Interest at end of quarter
10.1 Interests in mining tenements and petroleum tenements lapsed, relinquished or reduced
Nil
10.2 Interests in mining tenements and petroleum tenements acquired or increased
Nil
Compliance statement
1 This statement has been prepared in accordance with accounting standards and policies which comply with Listing Rule 19.11A.
2 This statement gives a true and fair view of the matters disclosed.
Sign here: ............................................................ Date: 17 July 2017 Company secretary
Print name: John Sanders
Notes
1. The quarterly report provides a basis for informing the market how the entity’s activities have been financed for the past quarter and the effect on its cash position. An entity that wishes to disclose additional information is encouraged to do so, in a note or notes included in or attached to this report.
2. If this quarterly report has been prepared in accordance with Australian Accounting Standards, the definitions in, and provisions of, AASB 6: Exploration for and Evaluation of Mineral Resources and AASB 107: Statement of Cash Flows apply to this report. If this quarterly report has been
For
per
sona
l use
onl
y
Appendix 5B Mining exploration entity and oil and gas exploration entity quarterly report
+ See chapter 19 for defined terms 1 September 2016 Page 5
prepared in accordance with other accounting standards agreed by ASX pursuant to Listing Rule 19.11A, the corresponding equivalent standards apply to this report.
3. Dividends received may be classified either as cash flows from operating activities or cash flows from investing activities, depending on the accounting policy of the entity.
For
per
sona
l use
onl
y