for snowline jusd duncan road solar project hydrology report for snowline jusd duncan road solar...
TRANSCRIPT

PreliminaryHydrology Report
forSnowline JUSD Duncan Road Solar Project
Prepared: November 12, 2013File: DEW-13-001

INDEX
ItemPage
Number
Executive Summary 3
Purpose & Summary 5
Project Location Map 8
Drainage Area Map 9
Rainfall Values from NOAA Atlas 14 - Regional Model 10
Derived Rainfall Values - Regional Model 11
Rainfall Values from NOAA Atlas 14 - Project Model 12
Derived Rainfall Values - Project Model 13
Intensity-Duration Curves Calculation Sheet (Figure D-4) - Calibration HECHMS Model 14
Figure E-12 for 100 Year Event - Calibration HECHMS Model 15
100 Year Rainfall Curve - Regional Model 16
100 Year Rainfall Curve - Project Model 17
Watershed Loss Determination - Calibration HECHMS Model 20
Effective 24 Hour Rainfall Curve - Calibration HECHMS Model 21
Lag Time - Calibration HECHMS Model 22
100 Year Unit Hydrograph - Calibration HECHMS Model 23
SCS Soil Group Map 25
Zoning Overlay for Cn's 26
San Bernardino Flood Mapping of Project 27
Appendix A HEC-HMS Results 28
HEC-HMS Calibration Model Summary A-1
Appendix B FLO-2D Summary 29
Regional Model 100yr-24hr B-1
Project Model 100yr-24hr B-10
Appendix C FLO-2D Drawings 30
Appendix D FLO-2D Files 31
Meyer Civil Engineeering, Inc. 110 S. Montclair Street #104, Bakersfield, CA 93309P:\DeWalt Corp\DEW-13-001\CALCS\SBCHM-DuncanRd.xls
Page 2 of 31 Index
EXECUTIVE SUMMARY
(Continued next page.)
Meyer Civil Engineering, Inc. has prepared this executive summary solely to provide a general overview of the Hydrology Report for the JUSD Duncan Road Solar Project. The report itself should be relied upon for information about the findings, conclusions, recommendations and other concerns.
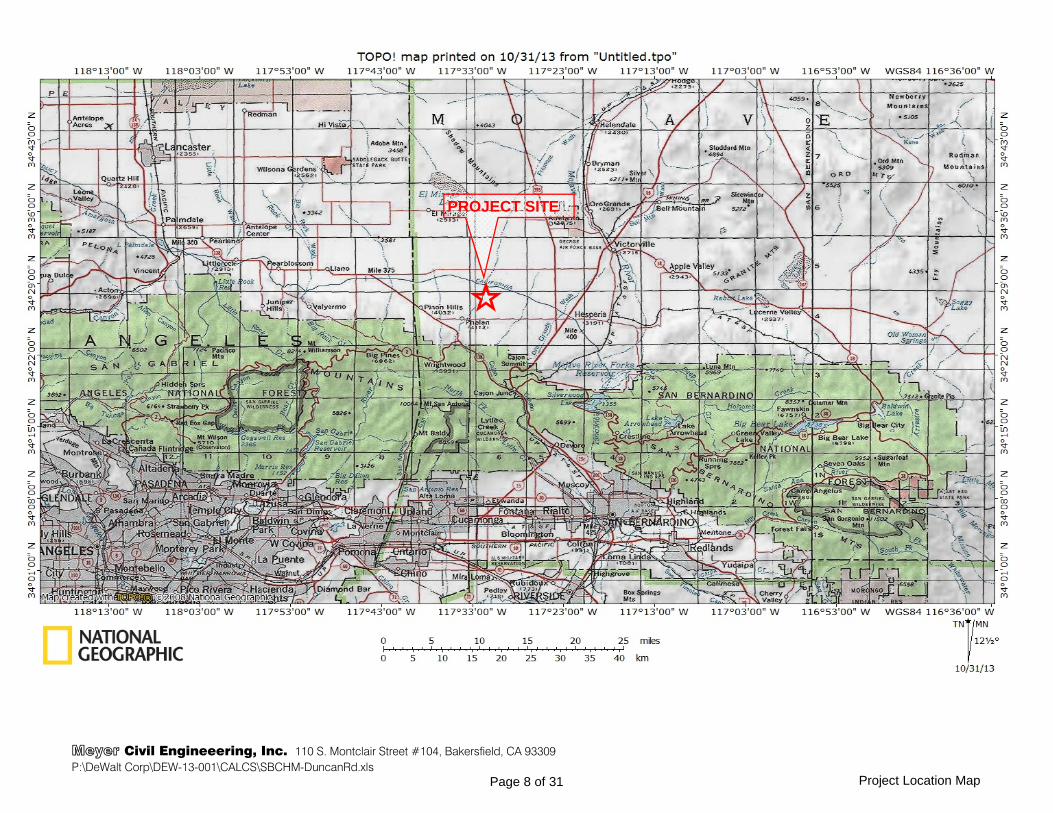
The Project - The JUSD Duncan Road Solar Project is located in San Bernardino County in the southern portion of the Mojave Dessert. The project receives drainage from the San Gabriel Mountains south and east of Pinon Hills, California. The project is located Northeast of the community of Phelan. Constructed project area is approximately 25.9 acres.
The solar generation facility includes the solar arrays (solar PV panels, or modules), inverters, intermediate voltage transformers, access roads, and electrical wiring that collects and consolidates power from across the project. A solar array is composed of multiple PV panels. Each panel will be approximately 3.5 feet in width and 6.5 feet in height. The panels will be supported by driven steel pipes, spaced approximately 15 feet apart. The length of each row of panels is approximately 128 feet. Spacing between each row would be approximately 15 feet. The project also includes access roads, a minimum of 20 feet wide. Rainwater that falls onto PV panels will drain freely to the ground. Panels will slope and rainwater will run off the lower edge. Based on the small volume of water falling from each panel, the height of the fall, and the soil conditions, it is not expected that erosion beyond a minimal level will occur. It is expected that water will fall from the PV panels and pond at a drip point before infiltrating or gradually migrating into the existing drainage patterns.
The PV panel supports are assumed to be small-diameter steel or aluminum members and are not anticipated to be a significant hindrance to flow and were therefore not modeled. Access roads are proposed to be flush or slightly elevated above existing grade. Small changes in elevation (less than 4 inches) are too minor to model and, as such, all proposed roadways were omitted.
Development of Hydrology - Hydrology for this report was developed utilizing San Bernardino County standards as required in the San Bernardino County Hydrology Manual (SBCHM). The SBCHM provides a detailed procedure for a one dimensional hydrograph analysis for large watersheds located in San Bernardino County. Due to the complexity of the project watersheds, a two dimensional analysis was preferred and performed. The two dimensional model utilized is a program recognized by FEMA for detailed development of theoretical flows, velocities and depths on an ungaged watershed. This program, know as FLO-2D, provides advantages as compared to a one dimensional analysis as it internally develops watershed lag time and splits and collects flows based on actual digital terrain features. The model also provides detailed depths, velocities and flows on a digital basis over the entire watershed. The FLO-2D model was calibrated to the San Bernardino County method by adjusting the Manning's n-values and NRCS Curve Number (CN) factors to match runoff flows as dictated in the SBCHM. A smaller more definitive calibration area of about 2380 acres was utilized to do this. Actual one dimensional values were computed in accordance with the SBCHM and calculated using the Army Corps of Engineers' HEC-HMS hydrograph engine. Resultant values are provided on page 6 of this report. Values for the 100 year event compare relatively closely and thus the FLO-2D model was considered to be calibrated correctly. The FLO-2D values were utilized for analysis. NRCS AMC III Curve Numbers used in the model did not need adjusting as the model to closely matched infiltration calculated from the SBCHM, resultant values are provided on page 6 of this report.
The results of the Unit Hydrograph calculation were compared against regression formulas prepared by FEMA. The FEMA equation is based on data from only the Antelope Valley, which includes Mojave area. The smaller data set generally provides peak flows substantially less than determined with the USGS equation. The FEMA equation is considered the lower bound for probable peak flow.
Drainage and Streambed Crossings - No culverts are proposed for the project.
Freeboard Requirements - San Bernardino County Standards require that all structures be located at least 2 foot above the water surface elevation determined as part of the hydraulic model.
Meyer Civil Engineering, Inc. 110 S. Montclair Street #104, Bakersfield, CA 93309P:\DeWalt Corp\DEW-13-001\CALCS\SBCHM-DuncanRd.xls
Page 3 of 31 Executive Summary
EXECUTIVE SUMMARY, Continued
Scour and Erosion Requirements San Bernardino County Standards require that design of all facilities (such as PV array piles/posts and inverter pads) include protection from scour and erosion. Scour and erosion depths can be calculated from the runoff velocities included as part of the hydraulic model and site soils condition analysis. The "With" Project plotting in Appendix C also shows velocity of flows. These velocity vectors have been enhanced with a color shading to indicate values over 2.0 fps to assist the designer in identifying potentional erosion locations.
On-Site Detention Requirements - Construction of proposed facilities will typically increase storm water runoff generated from the existing parcel without the implementation of best management practices. The County requires that any increase in runoff be mitigated, typically with a detention basin. As was previously mentioned in Section 1.2, the PV panels are placed above the existing ground, allowing infiltration to occur beneath each panel, so infiltration is not significantly reduced.
Conclusions - The following summarizes key conclusions based on the hydrologic and hydraulic analysesperformed for the site and documented in this report.
a. The proposed project does not increase water surface elevation of flows through the site by more than 1-foot. Indeed, most calculations showed no measureable increase.
b. The County will require that any new runoff generated as a result of this project be mitigated on-site in a detention basin. However, calculations showed no signifcant increase of flow as compared to the "Without Project" analysis.
c. The County will require that all facilities be elevated at least 2 foot above the 100-year, 24-hour peak flood elevation. Appendix C provides water surface depths, to which freeboard of 2-foot must be added.
d. The County will require that scour and erosion potential be included in the design of PV array piles or posts, and protective features at the inverter pads and substation. Runoff velocity for this analysis is provided in Appendix C.
Based on preliminary design information, the total proposed impermeable surface can be estimated at 0.5% of the project area and thus is 0.13 acres. Runoff volume can be calculated per the 10 year 5 day rainfall. It is assumed that no impermeable surfaces exist prior to construction.
Runoff Volume = 0.12 (D10) (ai) (Area)Area = 25.9 acresD10 = 3.04 inches (10-year, 24-hour rainfall)ai = 0.5% of project siteRunoff Volume = 0.05 acre-feet
Based on the above volume and the hydrologic and hydraulics calculations performed herein, increased runoff values can be considered negligible. Please refer to Sheet C-4 in Appendix C. The Comparable Outfall Flows graph, which graphs the outflow from the model on the downstream edges of the project, illustrates the neglible effect of the project. Therefore it is our recommendation that no detention facilities need be constructed.
The recommendations within this report are based on estimated values for the 100 return years. Estimates are based on procedural recommendations from the SBCHM and based on this engineer's experience. Compliance with these recommendations is essential for the successful construction and operation of the project.
Respectfully Submitted,
______________________________________Richard Meyer RCE 28104, Expires 3-31-2012
Meyer Civil Engineering, Inc. 110 S. Montclair Street #104, Bakersfield, CA 93309P:\DeWalt Corp\DEW-13-001\CALCS\SBCHM-DuncanRd.xls
Page 4 of 31 Executive Summary
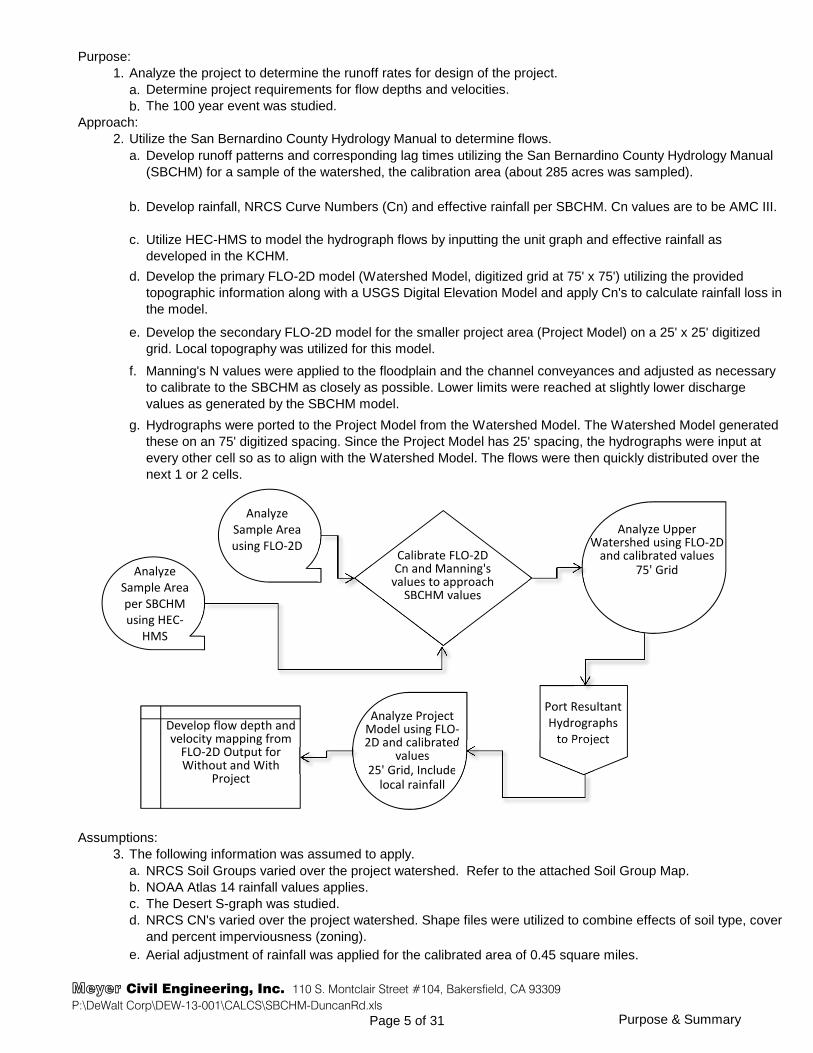
Purpose:1. Analyze the project to determine the runoff rates for design of the project.
a.b.
Approach:2. Utilize the San Bernardino County Hydrology Manual to determine flows.
a.
b.
c.
d.
e.
f.
g.
Assumptions:3. The following information was assumed to apply.
a. NRCS Soil Groups varied over the project watershed. Refer to the attached Soil Group Map.b. NOAA Atlas 14 rainfall values applies.c.d.
e. Aerial adjustment of rainfall was applied for the calibrated area of 0.45 square miles.
Determine project requirements for flow depths and velocities.The 100 year event was studied.
Develop runoff patterns and corresponding lag times utilizing the San Bernardino County Hydrology Manual (SBCHM) for a sample of the watershed, the calibration area (about 285 acres was sampled).
Develop rainfall, NRCS Curve Numbers (Cn) and effective rainfall per SBCHM. Cn values are to be AMC III.
Utilize HEC-HMS to model the hydrograph flows by inputting the unit graph and effective rainfall as developed in the KCHM.
The Desert S-graph was studied.
Develop the primary FLO-2D model (Watershed Model, digitized grid at 75' x 75') utilizing the provided topographic information along with a USGS Digital Elevation Model and apply Cn's to calculate rainfall loss in the model.
Develop the secondary FLO-2D model for the smaller project area (Project Model) on a 25' x 25' digitized grid. Local topography was utilized for this model.
Manning's N values were applied to the floodplain and the channel conveyances and adjusted as necessary to calibrate to the SBCHM as closely as possible. Lower limits were reached at slightly lower discharge values as generated by the SBCHM model.
Hydrographs were ported to the Project Model from the Watershed Model. The Watershed Model generated these on an 75' digitized spacing. Since the Project Model has 25' spacing, the hydrographs were input at every other cell so as to align with the Watershed Model. The flows were then quickly distributed over the next 1 or 2 cells.
NRCS CN's varied over the project watershed. Shape files were utilized to combine effects of soil type, cover and percent imperviousness (zoning).
Analyze Sample Area per SBCHM using HEC‐
HMS
Analyze Sample Area using FLO‐2D
Calibrate FLO‐2DCn and Manning's values to approach SBCHM values
Analyze Upper Watershed using FLO‐2D and calibrated values
75' Grid
Port ResultantHydrographs to Project
Analyze Project Model using FLO‐2D and calibrated
values25' Grid, Includelocal rainfall
Develop flow depth and velocity mapping from FLO‐2D Output for Without and With
Project
Meyer Civil Engineering, Inc. 110 S. Montclair Street #104, Bakersfield, CA 93309P:\DeWalt Corp\DEW-13-001\CALCS\SBCHM-DuncanRd.xls
Page 5 of 31 Purpose & Summary

Summary:4. The analysis showed the following:
a.b.
c. Comparative infiltration values for SBCHM and FLO-2D:
100 Year Event: -8%
d.
Flow, CFSTime of Peak,
Hrs Flow, CFSTime of Peak,
Hrs
-1%
23%
e.
(Continued next page.)
Modeling approach pursued in this study is based on deep hydrology experience of this engineer. Difficult analysis, such as occurs on this project, is best addressed using two-dimensional combination hydrology and hydraulic modeling. The chosen program "FLO-2D" provides this venue. The larger Watershed Model was designed to deliberately oversample the contributing area to assure that difficult to define flow paths are included that might otherwise be missed on a one-dimensional modeling basis. FLO-2D has the intrinsic ability to model expected flows accurately as this analysis does not depend on an engineer's estimate of such things as times of concentration or watershed definition. Since the Manning's n values were reduced to the minimums as recommend by the program developer, it is the opinion of this engineer that resultant estimation of the peak flows are accurate even though these values are slightly lower than provided by the FEMA equation or the SBCHM method. Another advantage to this approach is proper distribution of flows over the project area. Computed hydrographs from the Watershed Model were directly ported and placed accurately as input for the Project Model. The Project Model then distributed these flows based on a more detailed topography basis and thus provides for accurate depths and velocities in the correct geographic location. Introduction of a single point hydrograph from a one-dimension model would not have accurately distributed these flows. Final estimates of depth and velocity of flows are very reasonable in regard to conveyed discharge. These values have been graphically plotted for use in design. In addition ESRI shape files have been made available to the designer for their use.
100 Year Event:401
321 16:25
Five (5) minute time increment was utilized.An average SCS Curve Number of 88.47 for the entire watershed area of the primary FLO-2D model was used. The San Bernardino County prescribed values, an average of 86.23, were used to calculate the SBCHM rainfall infiltration and was compared to the main FLO-2D model rainfall infiltration for the entire watershed. The average varied between the two models due to the larger model having less receptive soils on the average. The 100 year event infiltration values from FLO2d matched fairly closely with the SBCHM, see table below. HEC-HMS was used to calculate the SBCHM peak runoff of the calibration area and compared to the FLO-2D peak runoff of the same calibration area. These runoff comparison values were used to adjust the Manning's n values for the entire watershed to calibrate the FLO-2D model to the SBCHM. Final Manning's n values vary from 0.055 to 0.080. Adjustment to the Manning's n values was provided so peak FLO-2D values would be reduced to better match that of the SBCHM method.
1.40 1.28
FEMA Regression
Q100=662(Area)0.62
17:55
SBCHM FLO-2D % DevianceInfiltration, inches Infiltration, inches
Comparative Values for HEC-HMS (KCHM) and FLO2D:
Storm
% Deviance
HEC-HMS (SBCHM)
Desert S-graph
Flow, CFS
Storm
395
FLO2D
Meyer Civil Engineering, Inc. 110 S. Montclair Street #104, Bakersfield, CA 93309P:\DeWalt Corp\DEW-13-001\CALCS\SBCHM-DuncanRd.xls
Page 6 of 31 Purpose & Summary

f.
Scenario
Point Rainfall, Inches
Rainfall Volume, AF
Inflow H-graph Volume, AF
Infiltration & Interception,
Inches
Infiltration & Interception,
AF
Floodplain Storage, AF
Floodplain Outflow Volume,
AF
Sum of Peak Outlet Flows,
CFS
Without Project: 4.79 14.77 386.80 1.50 4.61 2.49 394.47 928.00
With Project: 4.79 14.77 386.80 1.49 4.59 2.42 394.56 911.00
g.
h. The "With" Project plotting in Appendix C also shows velocity of flows. These velocity vectors have been enhanced with a color shading to indicate values over 2.0 fps to assist the designer in identifying potentional erosion locations.
The Project Model Run FLO-2d Results are as follows:
Results have been graphically plotted for easier interpretation. These maps are included in Appendix C of this report. Included on the maps are outfall hydrographs that illustrate that the project has no significant effect on increase of peak flows.
Meyer Civil Engineering, Inc. 110 S. Montclair Street #104, Bakersfield, CA 93309P:\DeWalt Corp\DEW-13-001\CALCS\SBCHM-DuncanRd.xls
Page 7 of 31 Purpose & Summary
PROJECT SITE
Meyer Civil Engineeering, Inc. 110 S. Montclair Street #104, Bakersfield, CA 93309P:\DeWalt Corp\DEW-13-001\CALCS\SBCHM-DuncanRd.xls
Page 8 of 31 Project Location Map

CALIBRATION POINT TO VERIFY FLO-2D TO KCHM
FLO-2D DRAINAGE AREA4,959 ACRES
7.75 SM
SBCHM DRAINAGE CALIBRATION AREA
285 AC
RAINFALL CENTROID34.4361, -117.5814
Meyer Civil Engineeering, Inc. 110 S. Montclair Street #104, Bakersfield, CA 93309P:\DeWalt Corp\DEW-13-001\CALCS\SBCHM-DuncanRd.xls
Page 9 of 31 Drainage Area Map
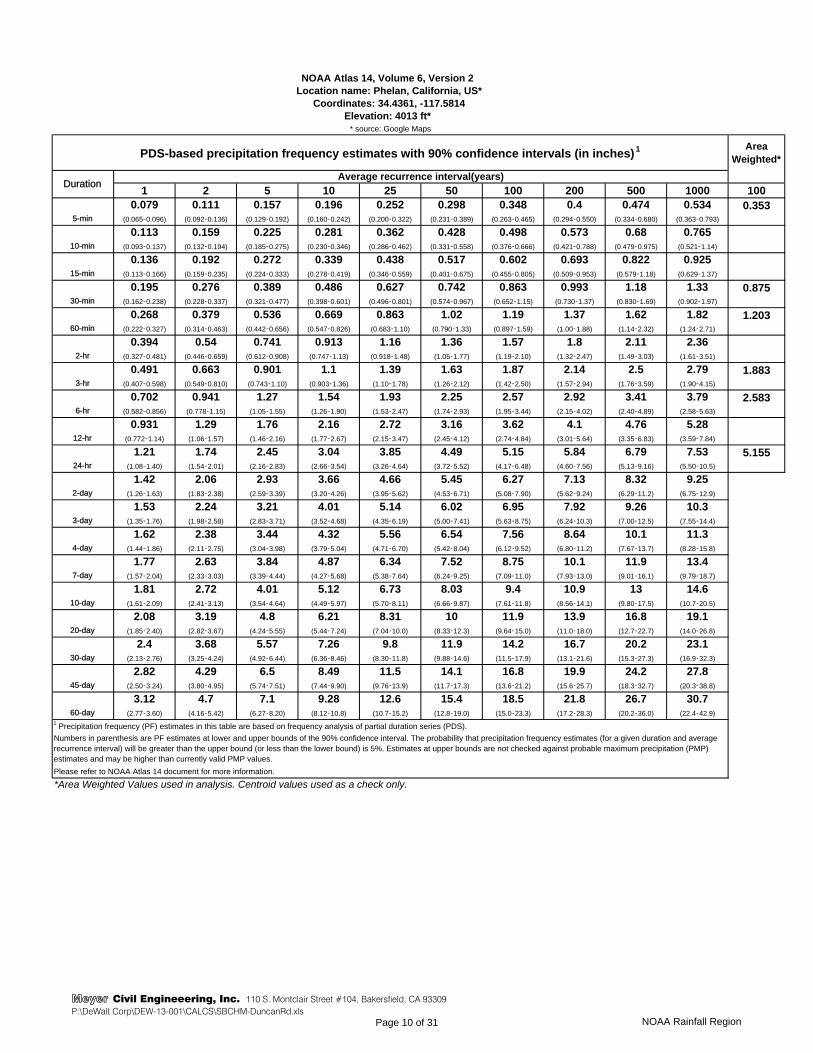
NOAA Atlas 14, Volume 6, Version 2 Location name: Phelan, California, US*
Coordinates: 34.4361, -117.5814 Elevation: 4013 ft*
* source: Google Maps
Area Weighted*
1 2 5 10 25 50 100 200 500 1000 1000.079 0.111 0.157 0.196 0.252 0.298 0.348 0.4 0.474 0.534 0.353
(0.065‑0.096) (0.092‑0.136) (0.129‑0.192) (0.160‑0.242) (0.200‑0.322) (0.231‑0.389) (0.263‑0.465) (0.294‑0.550) (0.334‑0.680) (0.363‑0.793)
0.113 0.159 0.225 0.281 0.362 0.428 0.498 0.573 0.68 0.765(0.093‑0.137) (0.132‑0.194) (0.185‑0.275) (0.230‑0.346) (0.286‑0.462) (0.331‑0.558) (0.376‑0.666) (0.421‑0.788) (0.479‑0.975) (0.521‑1.14)
0.136 0.192 0.272 0.339 0.438 0.517 0.602 0.693 0.822 0.925(0.113‑0.166) (0.159‑0.235) (0.224‑0.333) (0.278‑0.419) (0.346‑0.559) (0.401‑0.675) (0.455‑0.805) (0.509‑0.953) (0.579‑1.18) (0.629‑1.37)
0.195 0.276 0.389 0.486 0.627 0.742 0.863 0.993 1.18 1.33 0.875(0.162‑0.238) (0.228‑0.337) (0.321‑0.477) (0.398‑0.601) (0.496‑0.801) (0.574‑0.967) (0.652‑1.15) (0.730‑1.37) (0.830‑1.69) (0.902‑1.97)
0.268 0.379 0.536 0.669 0.863 1.02 1.19 1.37 1.62 1.82 1.203(0.222‑0.327) (0.314‑0.463) (0.442‑0.656) (0.547‑0.826) (0.683‑1.10) (0.790‑1.33) (0.897‑1.59) (1.00‑1.88) (1.14‑2.32) (1.24‑2.71)
0.394 0.54 0.741 0.913 1.16 1.36 1.57 1.8 2.11 2.36(0.327‑0.481) (0.446‑0.659) (0.612‑0.908) (0.747‑1.13) (0.918‑1.48) (1.05‑1.77) (1.19‑2.10) (1.32‑2.47) (1.49‑3.03) (1.61‑3.51)
0.491 0.663 0.901 1.1 1.39 1.63 1.87 2.14 2.5 2.79 1.883(0.407‑0.598) (0.549‑0.810) (0.743‑1.10) (0.903‑1.36) (1.10‑1.78) (1.26‑2.12) (1.42‑2.50) (1.57‑2.94) (1.76‑3.59) (1.90‑4.15)
0.702 0.941 1.27 1.54 1.93 2.25 2.57 2.92 3.41 3.79 2.583(0.582‑0.856) (0.778‑1.15) (1.05‑1.55) (1.26‑1.90) (1.53‑2.47) (1.74‑2.93) (1.95‑3.44) (2.15‑4.02) (2.40‑4.89) (2.58‑5.63)
0.931 1.29 1.76 2.16 2.72 3.16 3.62 4.1 4.76 5.28(0.772‑1.14) (1.06‑1.57) (1.46‑2.16) (1.77‑2.67) (2.15‑3.47) (2.45‑4.12) (2.74‑4.84) (3.01‑5.64) (3.35‑6.83) (3.59‑7.84)
1.21 1.74 2.45 3.04 3.85 4.49 5.15 5.84 6.79 7.53 5.155(1.08‑1.40) (1.54‑2.01) (2.16‑2.83) (2.66‑3.54) (3.26‑4.64) (3.72‑5.52) (4.17‑6.48) (4.60‑7.56) (5.13‑9.16) (5.50‑10.5)
1.42 2.06 2.93 3.66 4.66 5.45 6.27 7.13 8.32 9.25(1.26‑1.63) (1.83‑2.38) (2.59‑3.39) (3.20‑4.26) (3.95‑5.62) (4.53‑6.71) (5.08‑7.90) (5.62‑9.24) (6.29‑11.2) (6.75‑12.9)
1.53 2.24 3.21 4.01 5.14 6.02 6.95 7.92 9.26 10.3(1.35‑1.76) (1.98‑2.58) (2.83‑3.71) (3.52‑4.68) (4.35‑6.19) (5.00‑7.41) (5.63‑8.75) (6.24‑10.3) (7.00‑12.5) (7.55‑14.4)
1.62 2.38 3.44 4.32 5.56 6.54 7.56 8.64 10.1 11.3(1.44‑1.86) (2.11‑2.75) (3.04‑3.98) (3.79‑5.04) (4.71‑6.70) (5.42‑8.04) (6.12‑9.52) (6.80‑11.2) (7.67‑13.7) (8.28‑15.8)
1.77 2.63 3.84 4.87 6.34 7.52 8.75 10.1 11.9 13.4(1.57‑2.04) (2.33‑3.03) (3.39‑4.44) (4.27‑5.68) (5.38‑7.64) (6.24‑9.25) (7.09‑11.0) (7.93‑13.0) (9.01‑16.1) (9.79‑18.7)
1.81 2.72 4.01 5.12 6.73 8.03 9.4 10.9 13 14.6(1.61‑2.09) (2.41‑3.13) (3.54‑4.64) (4.49‑5.97) (5.70‑8.11) (6.66‑9.87) (7.61‑11.8) (8.56‑14.1) (9.80‑17.5) (10.7‑20.5)
2.08 3.19 4.8 6.21 8.31 10 11.9 13.9 16.8 19.1(1.85‑2.40) (2.82‑3.67) (4.24‑5.55) (5.44‑7.24) (7.04‑10.0) (8.33‑12.3) (9.64‑15.0) (11.0‑18.0) (12.7‑22.7) (14.0‑26.8)
2.4 3.68 5.57 7.26 9.8 11.9 14.2 16.7 20.2 23.1(2.13‑2.76) (3.25‑4.24) (4.92‑6.44) (6.36‑8.46) (8.30‑11.8) (9.88‑14.6) (11.5‑17.9) (13.1‑21.6) (15.3‑27.3) (16.9‑32.3)
2.82 4.29 6.5 8.49 11.5 14.1 16.8 19.9 24.2 27.8(2.50‑3.24) (3.80‑4.95) (5.74‑7.51) (7.44‑9.90) (9.76‑13.9) (11.7‑17.3) (13.6‑21.2) (15.6‑25.7) (18.3‑32.7) (20.3‑38.8)
3.12 4.7 7.1 9.28 12.6 15.4 18.5 21.8 26.7 30.7(2.77‑3.60) (4.16‑5.42) (6.27‑8.20) (8.12‑10.8) (10.7‑15.2) (12.8‑19.0) (15.0‑23.3) (17.2‑28.3) (20.2‑36.0) (22.4‑42.9)
*Area Weighted Values used in analysis. Centroid values used as a check only.
30-day
45-day
60-day
2-day
3-day
4-day
7-day
10-day
20-day
60-min
2-hr
3-hr
6-hr
12-hr
24-hr
Please refer to NOAA Atlas 14 document for more information.
1 Precipitation frequency (PF) estimates in this table are based on frequency analysis of partial duration series (PDS).
Numbers in parenthesis are PF estimates at lower and upper bounds of the 90% confidence interval. The probability that precipitation frequency estimates (for a given duration and average recurrence interval) will be greater than the upper bound (or less than the lower bound) is 5%. Estimates at upper bounds are not checked against probable maximum precipitation (PMP) estimates and may be higher than currently valid PMP values.
PDS-based precipitation frequency estimates with 90% confidence intervals (in inches)1
DurationAverage recurrence interval(years)
5-min
10-min
15-min
30-min
Meyer Civil Engineeering, Inc. 110 S. Montclair Street #104, Bakersfield, CA 93309P:\DeWalt Corp\DEW-13-001\CALCS\SBCHM-DuncanRd.xls
Page 10 of 31 NOAA Rainfall Region

Area: 0.45 sqr miDuration Factor
5 0.9872730 0.9872760 0.98727
180 0.99809360 0.99905
1440 0.99943
Duration 5 year Values: 10 year Values: 25 year Values: 50 year Values: 100 year Values:
per hour NOAA 14 Adusted per hour NOAA 14 Adusted per hour NOAA 14 Adusted per hour NOAA 14 Adusted per hour NOAA 14 Adusted
5min 0.08hr 1.884" 0.157" 0.155" 2.352" 0.196" 0.194" 3.024" 0.252" 0.249" 3.576" 0.298" 0.294" 4.231" 0.353" 0.348"30min 0.50hr 0.778" 0.389" 0.384" 0.972" 0.486" 0.480" 1.254" 0.627" 0.619" 1.484" 0.742" 0.733" 1.751" 0.875" 0.864"60min 1hr 0.536" 0.536" 0.529" 0.669" 0.669" 0.660" 0.863" 0.863" 0.852" 1.020" 1.020" 1.007" 1.203" 1.203" 1.188"
180min 3hr 0.300" 0.901" 0.899" 0.367" 1.100" 1.098" 0.463" 1.390" 1.387" 0.543" 1.630" 1.627" 0.628" 1.883" 1.879"360min 6hr 0.212" 1.270" 1.269" 0.257" 1.540" 1.539" 0.322" 1.930" 1.928" 0.375" 2.250" 2.248" 0.431" 2.583" 2.581"
1440min 24hr 0.102" 2.450" 2.449" 0.127" 3.040" 3.038" 0.160" 3.850" 3.848" 0.187" 4.490" 4.487" 0.215" 5.155" 5.152"
Develop Rainfall Curve
Aerial Adjustment
0.75
0.80
0.85
0.90
0.95
1.00
1.05
1 10 100 1000 10000
Aerial FactorFactor
Meyer Civil Engineeering, Inc. 110 S. Montclair Street #104, Bakersfield, CA 93309P:\DeWalt Corp\DEW-13-001\CALCS\SBCHM-DuncanRd.xls
Page 11 of 31 DERIVED RAINFALL Region
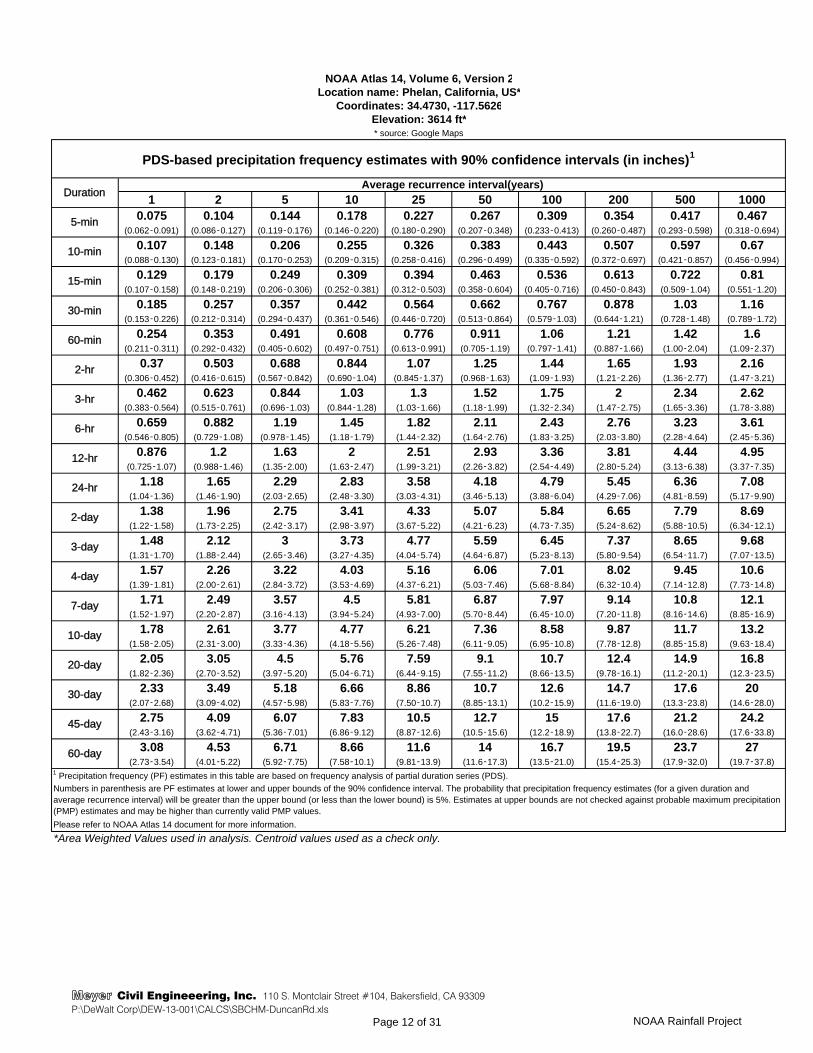
NOAA Atlas 14, Volume 6, Version 2Location name: Phelan, California, US*
Coordinates: 34.4730, -117.5626Elevation: 3614 ft** source: Google Maps
1 2 5 10 25 50 100 200 500 10000.075 0.104 0.144 0.178 0.227 0.267 0.309 0.354 0.417 0.467
(0.062‑0.091) (0.086‑0.127) (0.119‑0.176) (0.146‑0.220) (0.180‑0.290) (0.207‑0.348) (0.233‑0.413) (0.260‑0.487) (0.293‑0.598) (0.318‑0.694)
0.107 0.148 0.206 0.255 0.326 0.383 0.443 0.507 0.597 0.67(0.088‑0.130) (0.123‑0.181) (0.170‑0.253) (0.209‑0.315) (0.258‑0.416) (0.296‑0.499) (0.335‑0.592) (0.372‑0.697) (0.421‑0.857) (0.456‑0.994)
0.129 0.179 0.249 0.309 0.394 0.463 0.536 0.613 0.722 0.81(0.107‑0.158) (0.148‑0.219) (0.206‑0.306) (0.252‑0.381) (0.312‑0.503) (0.358‑0.604) (0.405‑0.716) (0.450‑0.843) (0.509‑1.04) (0.551‑1.20)
0.185 0.257 0.357 0.442 0.564 0.662 0.767 0.878 1.03 1.16(0.153‑0.226) (0.212‑0.314) (0.294‑0.437) (0.361‑0.546) (0.446‑0.720) (0.513‑0.864) (0.579‑1.03) (0.644‑1.21) (0.728‑1.48) (0.789‑1.72)
0.254 0.353 0.491 0.608 0.776 0.911 1.06 1.21 1.42 1.6(0.211‑0.311) (0.292‑0.432) (0.405‑0.602) (0.497‑0.751) (0.613‑0.991) (0.705‑1.19) (0.797‑1.41) (0.887‑1.66) (1.00‑2.04) (1.09‑2.37)
0.37 0.503 0.688 0.844 1.07 1.25 1.44 1.65 1.93 2.16(0.306‑0.452) (0.416‑0.615) (0.567‑0.842) (0.690‑1.04) (0.845‑1.37) (0.968‑1.63) (1.09‑1.93) (1.21‑2.26) (1.36‑2.77) (1.47‑3.21)
0.462 0.623 0.844 1.03 1.3 1.52 1.75 2 2.34 2.62(0.383‑0.564) (0.515‑0.761) (0.696‑1.03) (0.844‑1.28) (1.03‑1.66) (1.18‑1.99) (1.32‑2.34) (1.47‑2.75) (1.65‑3.36) (1.78‑3.88)
0.659 0.882 1.19 1.45 1.82 2.11 2.43 2.76 3.23 3.61(0.546‑0.805) (0.729‑1.08) (0.978‑1.45) (1.18‑1.79) (1.44‑2.32) (1.64‑2.76) (1.83‑3.25) (2.03‑3.80) (2.28‑4.64) (2.45‑5.36)
0.876 1.2 1.63 2 2.51 2.93 3.36 3.81 4.44 4.95(0.725‑1.07) (0.988‑1.46) (1.35‑2.00) (1.63‑2.47) (1.99‑3.21) (2.26‑3.82) (2.54‑4.49) (2.80‑5.24) (3.13‑6.38) (3.37‑7.35)
1.18 1.65 2.29 2.83 3.58 4.18 4.79 5.45 6.36 7.08(1.04‑1.36) (1.46‑1.90) (2.03‑2.65) (2.48‑3.30) (3.03‑4.31) (3.46‑5.13) (3.88‑6.04) (4.29‑7.06) (4.81‑8.59) (5.17‑9.90)
1.38 1.96 2.75 3.41 4.33 5.07 5.84 6.65 7.79 8.69(1.22‑1.58) (1.73‑2.25) (2.42‑3.17) (2.98‑3.97) (3.67‑5.22) (4.21‑6.23) (4.73‑7.35) (5.24‑8.62) (5.88‑10.5) (6.34‑12.1)
1.48 2.12 3 3.73 4.77 5.59 6.45 7.37 8.65 9.68(1.31‑1.70) (1.88‑2.44) (2.65‑3.46) (3.27‑4.35) (4.04‑5.74) (4.64‑6.87) (5.23‑8.13) (5.80‑9.54) (6.54‑11.7) (7.07‑13.5)
1.57 2.26 3.22 4.03 5.16 6.06 7.01 8.02 9.45 10.6(1.39‑1.81) (2.00‑2.61) (2.84‑3.72) (3.53‑4.69) (4.37‑6.21) (5.03‑7.46) (5.68‑8.84) (6.32‑10.4) (7.14‑12.8) (7.73‑14.8)
1.71 2.49 3.57 4.5 5.81 6.87 7.97 9.14 10.8 12.1(1.52‑1.97) (2.20‑2.87) (3.16‑4.13) (3.94‑5.24) (4.93‑7.00) (5.70‑8.44) (6.45‑10.0) (7.20‑11.8) (8.16‑14.6) (8.85‑16.9)
1.78 2.61 3.77 4.77 6.21 7.36 8.58 9.87 11.7 13.2(1.58‑2.05) (2.31‑3.00) (3.33‑4.36) (4.18‑5.56) (5.26‑7.48) (6.11‑9.05) (6.95‑10.8) (7.78‑12.8) (8.85‑15.8) (9.63‑18.4)
2.05 3.05 4.5 5.76 7.59 9.1 10.7 12.4 14.9 16.8(1.82‑2.36) (2.70‑3.52) (3.97‑5.20) (5.04‑6.71) (6.44‑9.15) (7.55‑11.2) (8.66‑13.5) (9.78‑16.1) (11.2‑20.1) (12.3‑23.5)
2.33 3.49 5.18 6.66 8.86 10.7 12.6 14.7 17.6 20(2.07‑2.68) (3.09‑4.02) (4.57‑5.98) (5.83‑7.76) (7.50‑10.7) (8.85‑13.1) (10.2‑15.9) (11.6‑19.0) (13.3‑23.8) (14.6‑28.0)
2.75 4.09 6.07 7.83 10.5 12.7 15 17.6 21.2 24.2(2.43‑3.16) (3.62‑4.71) (5.36‑7.01) (6.86‑9.12) (8.87‑12.6) (10.5‑15.6) (12.2‑18.9) (13.8‑22.7) (16.0‑28.6) (17.6‑33.8)
3.08 4.53 6.71 8.66 11.6 14 16.7 19.5 23.7 27(2.73‑3.54) (4.01‑5.22) (5.92‑7.75) (7.58‑10.1) (9.81‑13.9) (11.6‑17.3) (13.5‑21.0) (15.4‑25.3) (17.9‑32.0) (19.7‑37.8)
*Area Weighted Values used in analysis. Centroid values used as a check only.
PDS-based precipitation frequency estimates with 90% confidence intervals (in inches)1
DurationAverage recurrence interval(years)
5-min
10-min
15-min
30-min
60-min
2-hr
3-hr
6-hr
12-hr
24-hr
2-day
3-day
4-day
7-day
10-day
Please refer to NOAA Atlas 14 document for more information.
20-day
30-day
45-day
60-day
1 Precipitation frequency (PF) estimates in this table are based on frequency analysis of partial duration series (PDS).
Numbers in parenthesis are PF estimates at lower and upper bounds of the 90% confidence interval. The probability that precipitation frequency estimates (for a given duration and average recurrence interval) will be greater than the upper bound (or less than the lower bound) is 5%. Estimates at upper bounds are not checked against probable maximum precipitation (PMP) estimates and may be higher than currently valid PMP values.
Meyer Civil Engineeering, Inc. 110 S. Montclair Street #104, Bakersfield, CA 93309P:\DeWalt Corp\DEW-13-001\CALCS\SBCHM-DuncanRd.xls
Page 12 of 31 NOAA Rainfall Project

Area: 0.04 sqr miDuration Factor
5 0.9988430 0.9988460 0.99884
180 0.99983360 0.99991
1440 0.99995
Duration 5 year Values: 10 year Values: 25 year Values: 50 year Values: 100 year Values:
per hour NOAA 14 Adusted per hour NOAA 14 Adusted per hour NOAA 14 Adusted per hour NOAA 14 Adusted per hour NOAA 14 Adusted
5min 0.08hr 1.728" 0.144" 0.144" 2.136" 0.178" 0.178" 2.724" 0.227" 0.227" 3.204" 0.267" 0.267" 3.708" 0.309" 0.309"30min 0.50hr 0.714" 0.357" 0.357" 0.884" 0.442" 0.441" 1.128" 0.564" 0.563" 1.324" 0.662" 0.661" 1.534" 0.767" 0.766"60min 1hr 0.491" 0.491" 0.490" 0.608" 0.608" 0.607" 0.776" 0.776" 0.775" 0.911" 0.911" 0.910" 1.060" 1.060" 1.059"
180min 3hr 0.281" 0.844" 0.844" 0.343" 1.030" 1.030" 0.433" 1.300" 1.300" 0.507" 1.520" 1.520" 0.583" 1.750" 1.750"360min 6hr 0.198" 1.190" 1.190" 0.242" 1.450" 1.450" 0.303" 1.820" 1.820" 0.352" 2.110" 2.110" 0.405" 2.430" 2.430"
1440min 24hr 0.095" 2.290" 2.290" 0.118" 2.830" 2.830" 0.149" 3.580" 3.580" 0.174" 4.180" 4.180" 0.200" 4.790" 4.790"
Develop Rainfall Curve
Aerial Adjustment
0.75
0.80
0.85
0.90
0.95
1.00
1.05
1 10 100 1000 10000
Aerial FactorFactor
Meyer Civil Engineeering, Inc. 110 S. Montclair Street #104, Bakersfield, CA 93309P:\DeWalt Corp\DEW-13-001\CALCS\SBCHM-DuncanRd.xls
Page 13 of 31 DERIVED RAINFALL Project
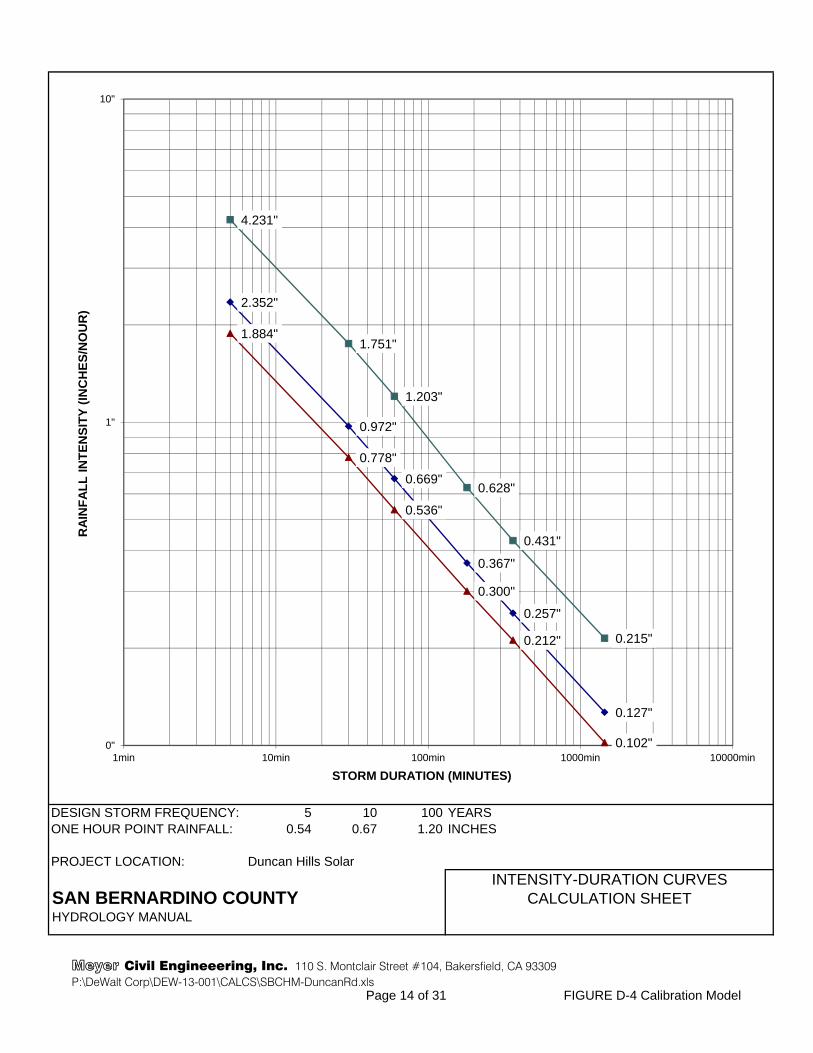
DESIGN STORM FREQUENCY: 5 10 100 YEARSONE HOUR POINT RAINFALL: 0.54 0.67 1.20 INCHES
PROJECT LOCATION: Duncan Hills Solar
INTENSITY-DURATION CURVES CALCULATION SHEETSAN BERNARDINO COUNTY
HYDROLOGY MANUAL
1.884"
0.778"
0.536"
0.300"
0.212"
0.102"
4.231"
1.751"
1.203"
0.628"
0.431"
0.215"
2.352"
0.972"
0.669"
0.367"
0.257"
0.127"
0"
1"
10"
1min 10min 100min 1000min 10000min
RA
INF
AL
L I
NT
EN
SIT
Y (
INC
HE
S/N
OU
R)
STORM DURATION (MINUTES)
Meyer Civil Engineeering, Inc. 110 S. Montclair Street #104, Bakersfield, CA 93309P:\DeWalt Corp\DEW-13-001\CALCS\SBCHM-DuncanRd.xls
Page 14 of 31 FIGURE D-4 Calibration Model
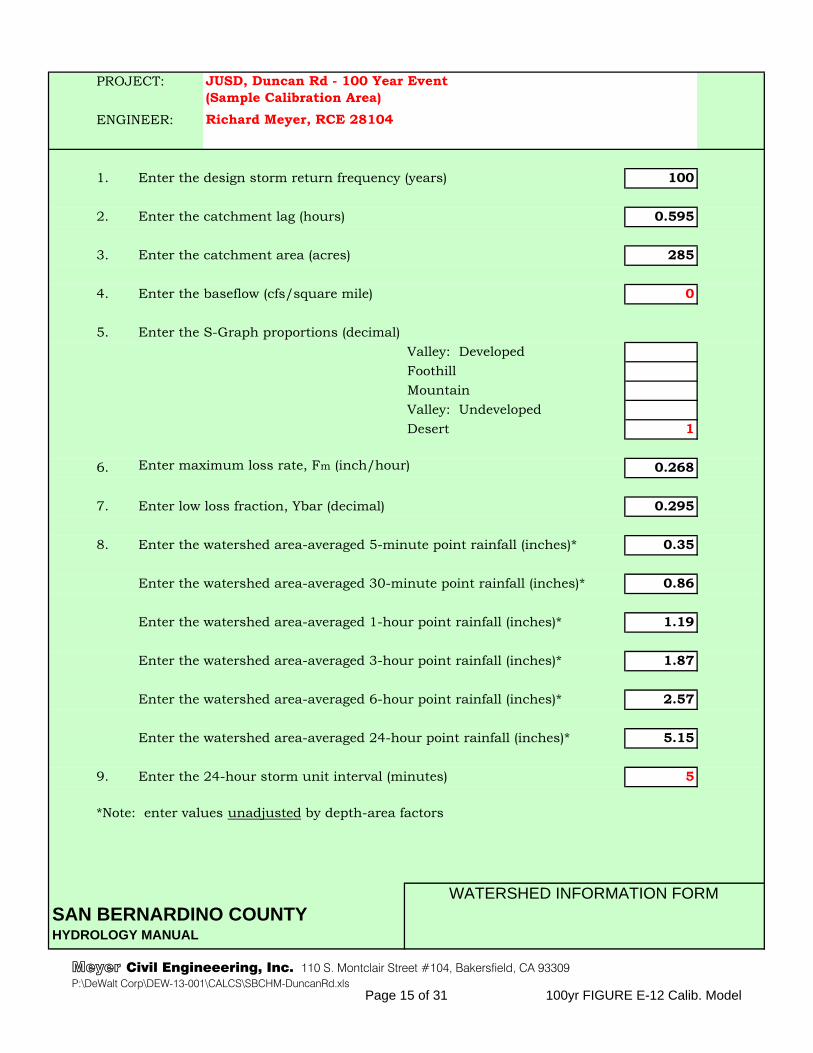
PROJECT:
ENGINEER:
1. Enter the design storm return frequency (years) 100
2. Enter the catchment lag (hours) 0.595
3. Enter the catchment area (acres) 285
4. Enter the baseflow (cfs/square mile) 0
5. Enter the S-Graph proportions (decimal)Valley: DevelopedFoothillMountainValley: UndevelopedDesert 1
6. Enter maximum loss rate, Fm (inch/hour) 0.268
7. Enter low loss fraction, Ybar (decimal) 0.295
8. Enter the watershed area-averaged 5-minute point rainfall (inches)* 0.35
Enter the watershed area-averaged 30-minute point rainfall (inches)* 0.86
Enter the watershed area-averaged 1-hour point rainfall (inches)* 1.19
Enter the watershed area-averaged 3-hour point rainfall (inches)* 1.87
Enter the watershed area-averaged 6-hour point rainfall (inches)* 2.57
Enter the watershed area-averaged 24-hour point rainfall (inches)* 5.15
9. Enter the 24-hour storm unit interval (minutes) 5
*Note: enter values unadjusted by depth-area factors
JUSD, Duncan Rd - 100 Year Event(Sample Calibration Area)
Richard Meyer, RCE 28104
WATERSHED INFORMATION FORMSAN BERNARDINO COUNTY HYDROLOGY MANUAL
Meyer Civil Engineeering, Inc. 110 S. Montclair Street #104, Bakersfield, CA 93309P:\DeWalt Corp\DEW-13-001\CALCS\SBCHM-DuncanRd.xls
Page 15 of 31 100yr FIGURE E-12 Calib. Model

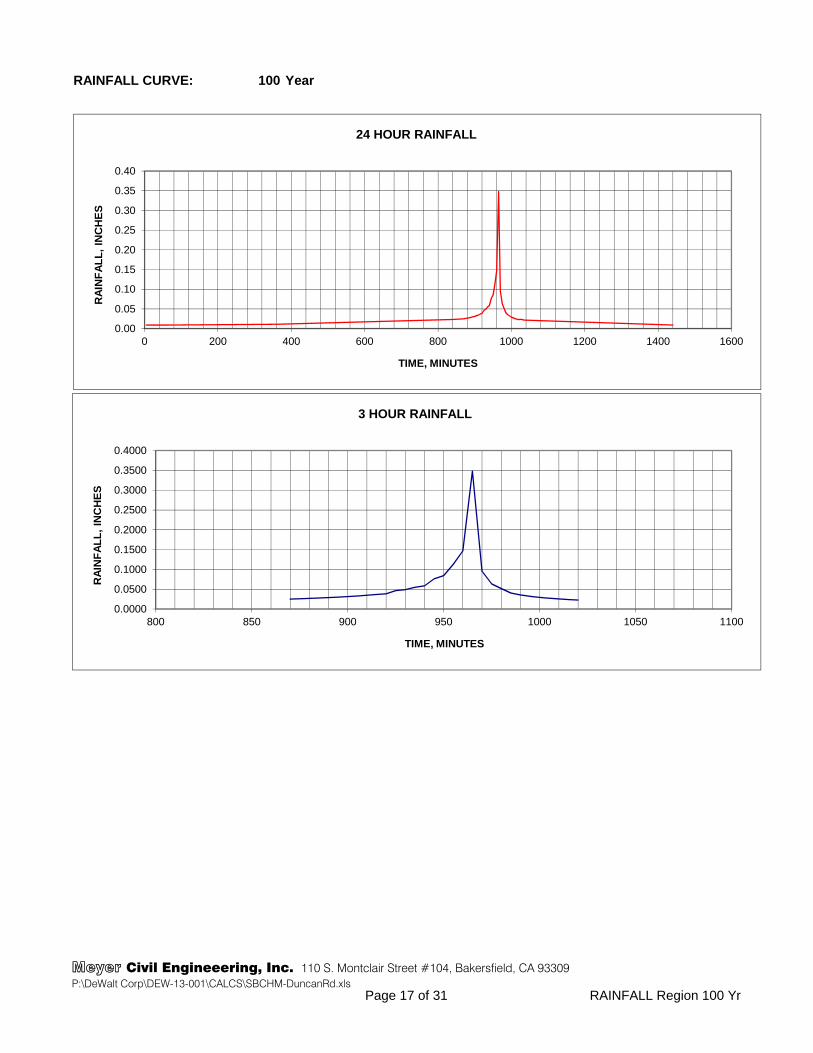
RAINFALL CURVE: 100 Year
Delta T: 5 min.RAINFALL
UNIT NUMBER
STORM TIME, MIN.
MASS POINT RAINFALL POINT TIME
UNIT RAINFALL POINT TIME
24 HR UNIT RAINFALL
3 HR UNIT RAINFALL
1. 5 0.35 965 0.348 5 0.0089266. 30 0.86 945 0.076 30 0.00903712. 60 1.19 925 0.047 60 0.00918636. 180 1.88 845 0.022 180 0.00986572. 360 2.58 725 0.016 360 0.011241168. 840 3.94 405 0.012 840 0.023369 * 0174. 870 4.01 385 0.011 870 0.024965 0.0250175. 875 4.02 1255 0.011 875 0.026046 0.0260176. 880 4.03 380 0.011 880 0.026637 0.0266177. 885 4.04 375 0.011 885 0.027935 0.0279178. 890 4.05 1260 0.011 890 0.028652 0.0287179. 895 4.06 370 0.011 895 0.030250 0.0302180. 900 4.08 365 0.011 900 0.031144 0.0311181. 905 4.09 1265 0.011 905 0.033172 0.0332182. 910 4.10 360 0.011 910 0.034330 0.0343183. 915 4.11 355 0.011 915 0.037015 0.0370184. 920 4.12 1270 0.011 920 0.038590 0.0386185. 925 4.13 350 0.011 925 0.046533 0.0465186. 930 4.14 345 0.011 930 0.048882 0.0489187. 935 4.15 1275 0.011 935 0.054810 0.0548188. 940 4.16 340 0.011 940 0.058657 0.0587189. 945 4.18 335 0.011 945 0.076381 0.0764190. 950 4.19 1280 0.011 950 0.084358 0.0844191. 955 4.20 330 0.011 955 0.113071 0.1131192. 960 4.21 325 0.011 960 0.146765 0.1468193. 965 4.22 1285 0.011 965 0.348132 0.3481194. 970 4.23 320 0.011 970 0.095568 0.0956195. 975 4.24 315 0.011 975 0.063390 0.0634196. 980 4.25 1290 0.011 980 0.051605 0.0516197. 985 4.26 310 0.011 985 0.040361 0.0404198. 990 4.27 305 0.011 990 0.035604 0.0356199. 995 4.28 1295 0.011 995 0.032115 0.0321200. 1000 4.30 300 0.011 1000 0.029422 0.0294201. 1005 4.31 295 0.011 1005 0.027265 0.0273202. 1010 4.32 1300 0.011 1010 0.025490 0.0255203. 1015 4.33 290 0.011 1015 0.023997 0.0240204. 1020 4.34 285 0.011 1020 0.022721 * 0.0227205. 1025 4.35 1305 0.011 1025 0.023714 0206. 1030 4.36 280 0.011 1030 0.022720 1.879207. 1035 4.37 275 0.011 1035 0.021836288. 1440 5.15 5 0.009 1440 0.008957
5.15 5.15
REORDERED delta T=5min
Meyer Civil Engineeering, Inc. 110 S. Montclair Street #104, Bakersfield, CA 93309P:\DeWalt Corp\DEW-13-001\CALCS\SBCHM-DuncanRd.xls
Page 16 of 31 RAINFALL Region 100 Yr
RAINFALL CURVE: 100 Year
0.00
0.05
0.10
0.15
0.20
0.25
0.30
0.35
0.40
0 200 400 600 800 1000 1200 1400 1600
RA
INF
AL
L,
INC
HE
S
TIME, MINUTES
24 HOUR RAINFALL
0.0000
0.0500
0.1000
0.1500
0.2000
0.2500
0.3000
0.3500
0.4000
800 850 900 950 1000 1050 1100
RA
INF
AL
L,
INC
HE
S
TIME, MINUTES
3 HOUR RAINFALL
Meyer Civil Engineeering, Inc. 110 S. Montclair Street #104, Bakersfield, CA 93309P:\DeWalt Corp\DEW-13-001\CALCS\SBCHM-DuncanRd.xls
Page 17 of 31 RAINFALL Region 100 Yr

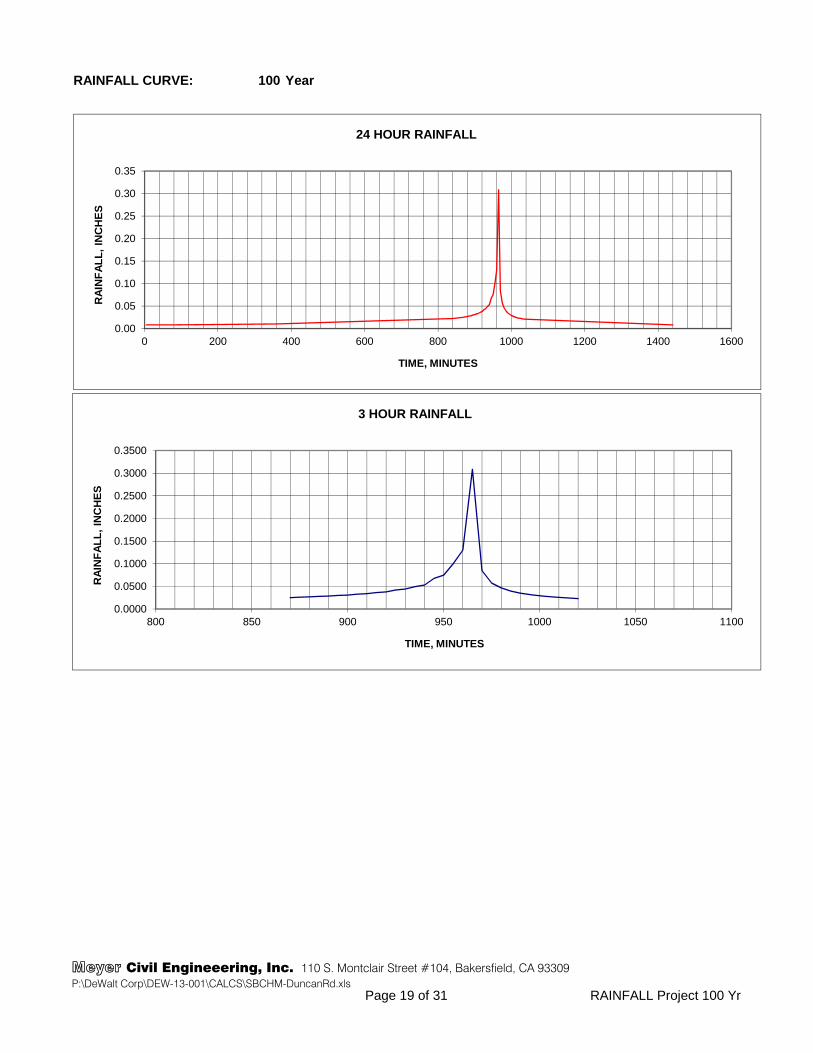
RAINFALL CURVE: 100 Year
Delta T: 5 min.RAINFALL
UNIT NUMBER
STORM TIME, MIN.
MASS POINT RAINFALL POINT TIME
UNIT RAINFALL POINT TIME
24 HR UNIT RAINFALL
3 HR UNIT RAINFALL
1. 5 0.31 965 0.309 5 0.0081496. 30 0.77 945 0.068 30 0.00825212. 60 1.06 925 0.042 60 0.00839136. 180 1.75 845 0.022 180 0.00902372. 360 2.43 725 0.016 360 0.010306168. 840 3.68 405 0.011 840 0.022536 * 0174. 870 3.74 385 0.011 870 0.025228 0.0252175. 875 3.75 1255 0.011 875 0.026245 0.0262176. 880 3.76 380 0.010 880 0.026799 0.0268177. 885 3.77 375 0.010 885 0.028014 0.0280178. 890 3.78 1260 0.010 890 0.028683 0.0287179. 895 3.79 370 0.010 895 0.030170 0.0302180. 900 3.81 365 0.010 900 0.031000 0.0310181. 905 3.82 1265 0.010 905 0.032876 0.0329182. 910 3.83 360 0.010 910 0.033944 0.0339183. 915 3.84 355 0.010 915 0.036411 0.0364184. 920 3.85 1270 0.010 920 0.037852 0.0379185. 925 3.86 350 0.010 925 0.042139 0.0421186. 930 3.87 345 0.010 930 0.044236 0.0442187. 935 3.88 1275 0.010 935 0.049520 0.0495188. 940 3.89 340 0.010 940 0.052945 0.0529189. 945 3.90 335 0.010 945 0.067694 0.0677190. 950 3.91 1280 0.010 950 0.074765 0.0748191. 955 3.92 330 0.010 955 0.100218 0.1002192. 960 3.93 325 0.010 960 0.130090 0.1301193. 965 3.94 1285 0.010 965 0.308643 0.3086194. 970 3.95 320 0.010 970 0.084703 0.0847195. 975 3.96 315 0.010 975 0.057155 0.0572196. 980 3.97 1290 0.010 980 0.046664 0.0467197. 985 3.98 310 0.010 985 0.039468 0.0395198. 990 3.99 305 0.010 990 0.035116 0.0351199. 995 4.00 1295 0.010 995 0.031899 0.0319200. 1000 4.01 300 0.010 1000 0.029400 0.0294201. 1005 4.02 295 0.010 1005 0.027387 0.0274202. 1010 4.03 1300 0.010 1010 0.025722 0.0257203. 1015 4.04 290 0.010 1015 0.024317 0.0243204. 1020 4.05 285 0.010 1020 0.023109 * 0.0231205. 1025 4.06 1305 0.010 1025 0.022858 0206. 1030 4.07 280 0.010 1030 0.021928 1.750207. 1035 4.07 275 0.010 1035 0.021099288. 1440 4.79 5 0.008 1440 0.008178
4.79 4.79
REORDERED delta T=5min
Meyer Civil Engineeering, Inc. 110 S. Montclair Street #104, Bakersfield, CA 93309P:\DeWalt Corp\DEW-13-001\CALCS\SBCHM-DuncanRd.xls
Page 18 of 31 RAINFALL Project 100 Yr
RAINFALL CURVE: 100 Year
0.00
0.05
0.10
0.15
0.20
0.25
0.30
0.35
0 200 400 600 800 1000 1200 1400 1600
RA
INF
AL
L,
INC
HE
S
TIME, MINUTES
24 HOUR RAINFALL
0.0000
0.0500
0.1000
0.1500
0.2000
0.2500
0.3000
0.3500
800 850 900 950 1000 1050 1100
RA
INF
AL
L,
INC
HE
S
TIME, MINUTES
3 HOUR RAINFALL
Meyer Civil Engineeering, Inc. 110 S. Montclair Street #104, Bakersfield, CA 93309P:\DeWalt Corp\DEW-13-001\CALCS\SBCHM-DuncanRd.xls
Page 19 of 31 RAINFALL Project 100 Yr
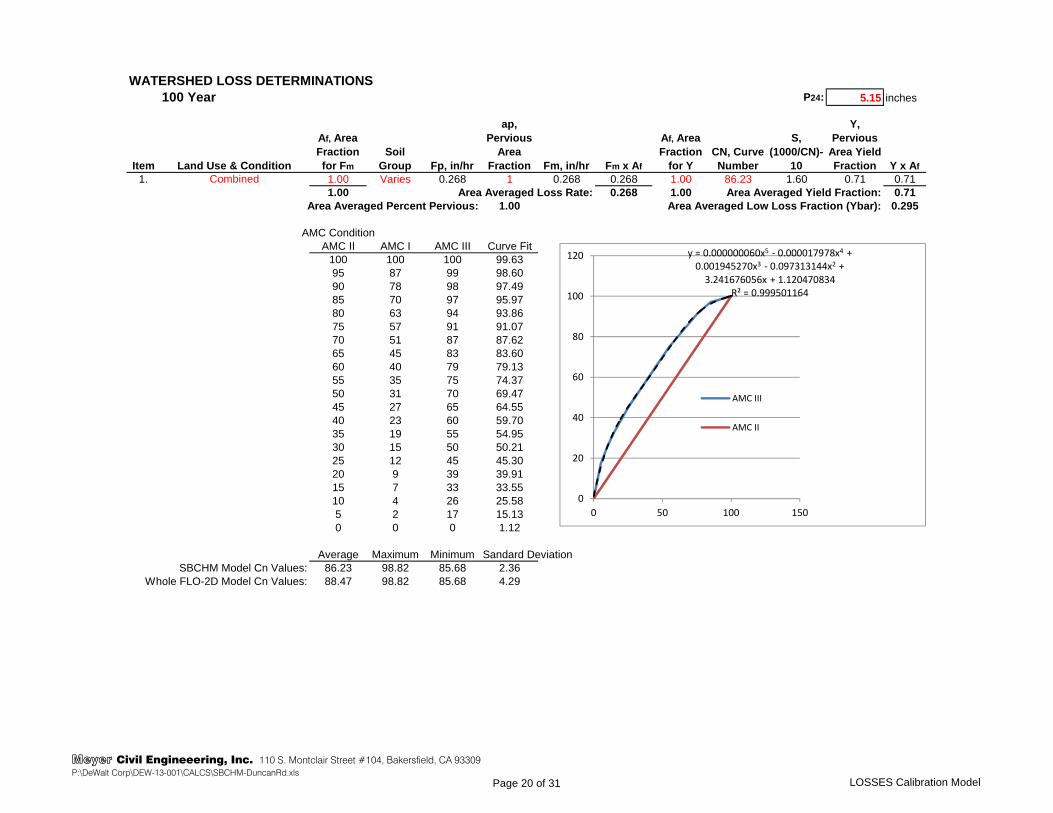
WATERSHED LOSS DETERMINATIONS100 Year P24: 5.15 inches
Item Land Use & Condition
Af, Area Fraction for Fm
Soil Group Fp, in/hr
ap, Pervious
Area Fraction Fm, in/hr Fm x Af
Af, Area Fraction
for YCN, Curve Number
S, (1000/CN)-
10
Y, Pervious
Area Yield Fraction Y x Af
1. Combined 1.00 Varies 0.268 1 0.268 0.268 1.00 86.23 1.60 0.71 0.711.00 Area Averaged Loss Rate: 0.268 1.00 Area Averaged Yield Fraction: 0.71
Area Averaged Percent Pervious: 1.00 Area Averaged Low Loss Fraction (Ybar): 0.295
AMC ConditionAMC II AMC I AMC III Curve Fit
100 100 100 99.6395 87 99 98.6090 78 98 97.4985 70 97 95.9780 63 94 93.8675 57 91 91.0770 51 87 87.6265 45 83 83.6060 40 79 79.1355 35 75 74.3750 31 70 69.4745 27 65 64.5540 23 60 59.7035 19 55 54.9530 15 50 50.2125 12 45 45.3020 9 39 39.9115 7 33 33.5510 4 26 25.585 2 17 15.130 0 0 1.12
Average Maximum Minimum Sandard DeviationSBCHM Model Cn Values: 86.23 98.82 85.68 2.36
Whole FLO-2D Model Cn Values: 88.47 98.82 85.68 4.29
y = 0.000000060x5 ‐ 0.000017978x4 + 0.001945270x3 ‐ 0.097313144x2 + 3.241676056x + 1.120470834
R² = 0.999501164
0
20
40
60
80
100
120
0 50 100 150
AMC III
AMC II
Meyer Civil Engineeering, Inc. 110 S. Montclair Street #104, Bakersfield, CA 93309P:\DeWalt Corp\DEW-13-001\CALCS\SBCHM-DuncanRd.xls
Page 20 of 31 LOSSES Calibration Model

LAG EQUATION: Lag (hours)=24n[(L*Lca)/s^0.5]^mn: 0.04 n Tc(T)=Tc(100)*KTL: 3.18 miles 100yr Lag (hours): 0.595 hours Return Period KT Value
Lca: 1.12 miles 10yr Lag (hours): 0.679 hours 2 1.32elev1: 4139.0 msl 5 1.20elev2: 3638.0 msl 10 1.14
H: 501.0 ft 25 1.07s: 157.4 ft/mile 50 1.03
m: 0.38 m 100 1.00
LAG
CALIBRATION AREA 285 ACRES
Meyer Civil Engineeering, Inc. 110 S. Montclair Street #104, Bakersfield, CA 93309P:\DeWalt Corp\DEW-13-001\CALCS\SBCHM-DuncanRd.xls
Page 21 of 31 LAG Calibration Model

100 Year Eventdelta T: 5 min.
Fm: 0.268 in/hr
Y(bar): 0.295
Max Loss: 0.0223 inchesTime, min. Unit Rainfall Unit Losses
Effective Rainfall
5 0.0089 0.0026 0.0062930 0.0090 0.0027 0.0063760 0.0092 0.0027 0.00648
180 0.0099 0.0029 0.00695360 0.0112 0.0033 0.00793840 0.0234 0.0069 0.01648870 0.0250 0.0074 0.01760875 0.0260 0.0077 0.01836880 0.0266 0.0079 0.01878885 0.0279 0.0082 0.01969890 0.0287 0.0085 0.02020895 0.0302 0.0089 0.02133900 0.0311 0.0092 0.02196905 0.0332 0.0098 0.02339910 0.0343 0.0101 0.02420915 0.0370 0.0109 0.02610920 0.0386 0.0114 0.02721925 0.0465 0.0137 0.03281930 0.0489 0.0144 0.03446935 0.0548 0.0162 0.03864940 0.0587 0.0173 0.04135945 0.0764 0.0223 0.05406950 0.0844 0.0223 0.06204955 0.1131 0.0223 0.09075960 0.1468 0.0223 0.12444965 0.3481 0.0223 0.32581970 0.0956 0.0223 0.07325975 0.0634 0.0187 0.04469980 0.0516 0.0152 0.03638985 0.0404 0.0119 0.02846990 0.0356 0.0105 0.02510995 0.0321 0.0095 0.02264
1000 0.0294 0.0087 0.020741005 0.0273 0.0080 0.019221010 0.0255 0.0075 0.017971015 0.0240 0.0071 0.016921020 0.0227 0.0067 0.016021025 0.0237 0.0070 0.016721030 0.0227 0.0067 0.016021035 0.0218 0.0064 0.015391440 0.0090 0.0026 0.00631
5.1516 1.3986 3.7529
24 HOUR EFFECTIVE RAINFALL
0.00
0.05
0.10
0.15
0.20
0.25
0.30
0.35
0.40
0 500 1000
Rai
nfa
ll, i
nch
es
Time, minutes
EFFECTIVE RAINFALL
Unit Rainfall
Effective Rainfall
yer Civil Engineeering, Inc. 110 S. Montclair Street #104, Bakersfield, CA 93309eWalt Corp\DEW-13-001\CALCS\SBCHM-DuncanRd.xls
Page 22 of 31 Effective 24hr RF Calib. Model
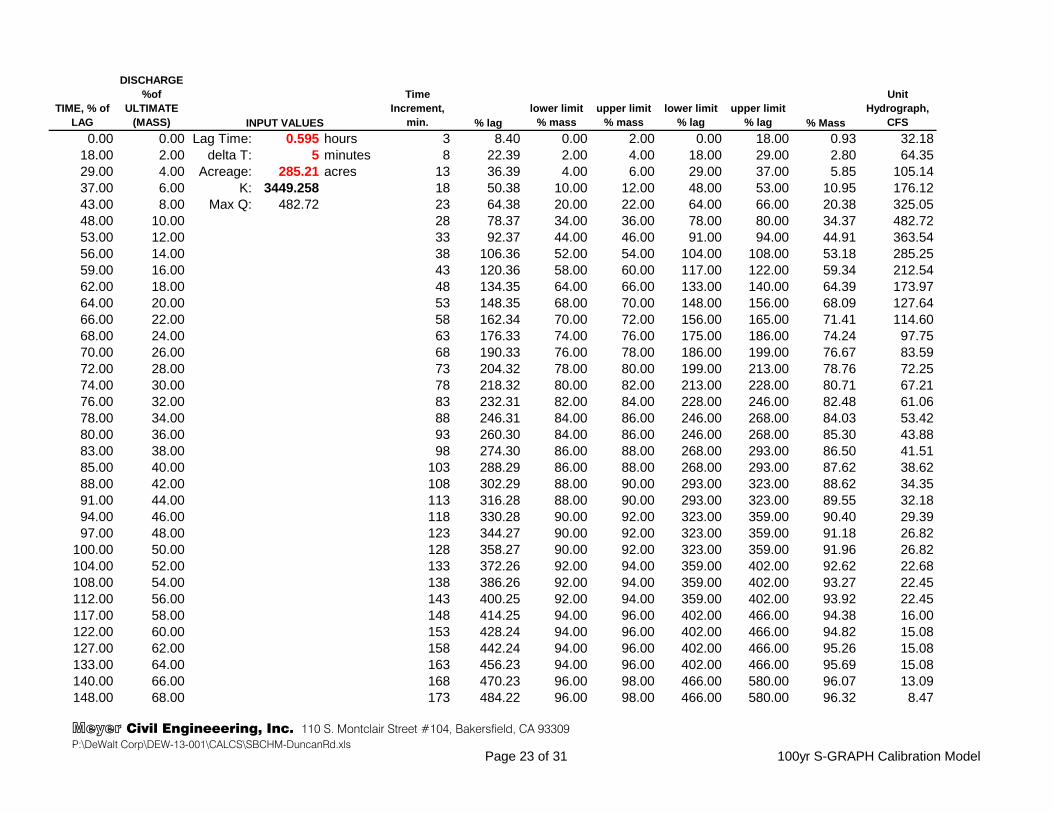
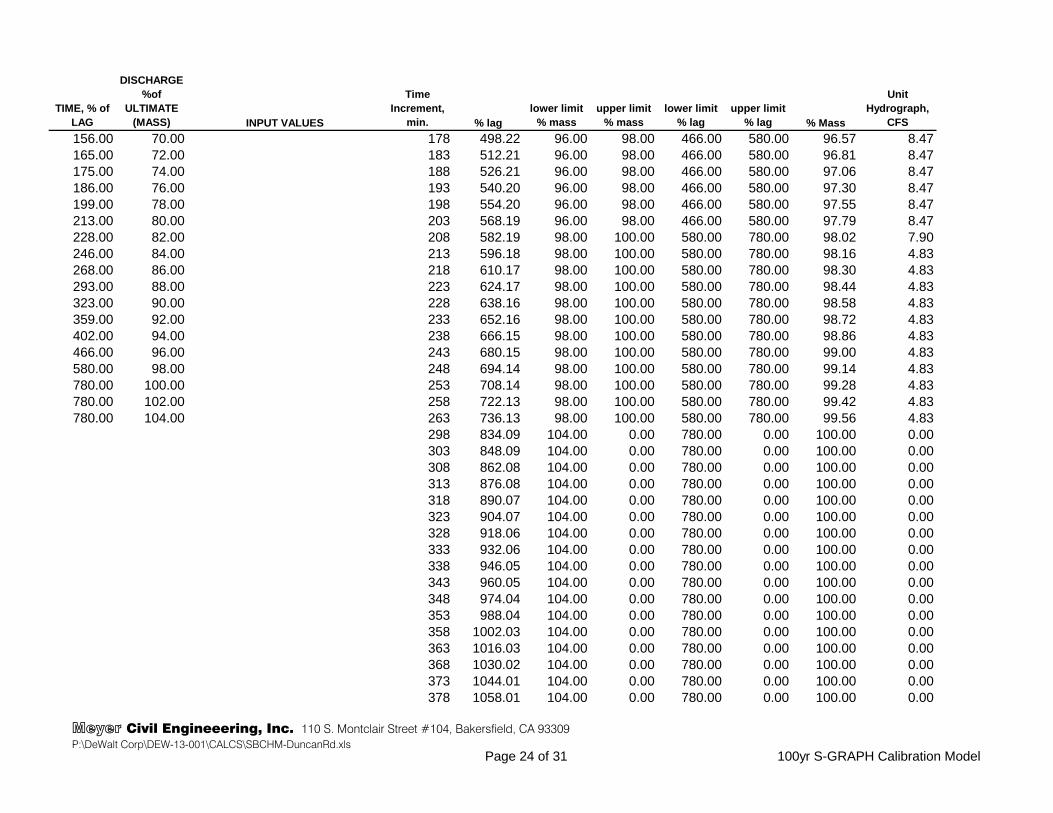
TIME, % of LAG
DISCHARGE %of
ULTIMATE (MASS)
Time Increment,
min. % laglower limit
% massupper limit
% masslower limit
% lagupper limit
% lag % Mass
Unit Hydrograph,
CFS
0.00 0.00 Lag Time: 0.595 hours 3 8.40 0.00 2.00 0.00 18.00 0.93 32.1818.00 2.00 delta T: 5 minutes 8 22.39 2.00 4.00 18.00 29.00 2.80 64.3529.00 4.00 Acreage: 285.21 acres 13 36.39 4.00 6.00 29.00 37.00 5.85 105.1437.00 6.00 K: 3449.258 18 50.38 10.00 12.00 48.00 53.00 10.95 176.1243.00 8.00 Max Q: 482.72 23 64.38 20.00 22.00 64.00 66.00 20.38 325.0548.00 10.00 28 78.37 34.00 36.00 78.00 80.00 34.37 482.7253.00 12.00 33 92.37 44.00 46.00 91.00 94.00 44.91 363.5456.00 14.00 38 106.36 52.00 54.00 104.00 108.00 53.18 285.2559.00 16.00 43 120.36 58.00 60.00 117.00 122.00 59.34 212.5462.00 18.00 48 134.35 64.00 66.00 133.00 140.00 64.39 173.9764.00 20.00 53 148.35 68.00 70.00 148.00 156.00 68.09 127.6466.00 22.00 58 162.34 70.00 72.00 156.00 165.00 71.41 114.6068.00 24.00 63 176.33 74.00 76.00 175.00 186.00 74.24 97.7570.00 26.00 68 190.33 76.00 78.00 186.00 199.00 76.67 83.5972.00 28.00 73 204.32 78.00 80.00 199.00 213.00 78.76 72.2574.00 30.00 78 218.32 80.00 82.00 213.00 228.00 80.71 67.2176.00 32.00 83 232.31 82.00 84.00 228.00 246.00 82.48 61.0678.00 34.00 88 246.31 84.00 86.00 246.00 268.00 84.03 53.4280.00 36.00 93 260.30 84.00 86.00 246.00 268.00 85.30 43.8883.00 38.00 98 274.30 86.00 88.00 268.00 293.00 86.50 41.5185.00 40.00 103 288.29 86.00 88.00 268.00 293.00 87.62 38.6288.00 42.00 108 302.29 88.00 90.00 293.00 323.00 88.62 34.3591.00 44.00 113 316.28 88.00 90.00 293.00 323.00 89.55 32.1894.00 46.00 118 330.28 90.00 92.00 323.00 359.00 90.40 29.3997.00 48.00 123 344.27 90.00 92.00 323.00 359.00 91.18 26.82
100.00 50.00 128 358.27 90.00 92.00 323.00 359.00 91.96 26.82104.00 52.00 133 372.26 92.00 94.00 359.00 402.00 92.62 22.68108.00 54.00 138 386.26 92.00 94.00 359.00 402.00 93.27 22.45112.00 56.00 143 400.25 92.00 94.00 359.00 402.00 93.92 22.45117.00 58.00 148 414.25 94.00 96.00 402.00 466.00 94.38 16.00122.00 60.00 153 428.24 94.00 96.00 402.00 466.00 94.82 15.08127.00 62.00 158 442.24 94.00 96.00 402.00 466.00 95.26 15.08133.00 64.00 163 456.23 94.00 96.00 402.00 466.00 95.69 15.08140.00 66.00 168 470.23 96.00 98.00 466.00 580.00 96.07 13.09148.00 68.00 173 484.22 96.00 98.00 466.00 580.00 96.32 8.47
INPUT VALUES
Meyer Civil Engineeering, Inc. 110 S. Montclair Street #104, Bakersfield, CA 93309P:\DeWalt Corp\DEW-13-001\CALCS\SBCHM-DuncanRd.xls
Page 23 of 31 100yr S-GRAPH Calibration Model
TIME, % of LAG
DISCHARGE %of
ULTIMATE (MASS)
Time Increment,
min. % laglower limit
% massupper limit
% masslower limit
% lagupper limit
% lag % Mass
Unit Hydrograph,
CFSINPUT VALUES
156.00 70.00 178 498.22 96.00 98.00 466.00 580.00 96.57 8.47165.00 72.00 183 512.21 96.00 98.00 466.00 580.00 96.81 8.47175.00 74.00 188 526.21 96.00 98.00 466.00 580.00 97.06 8.47186.00 76.00 193 540.20 96.00 98.00 466.00 580.00 97.30 8.47199.00 78.00 198 554.20 96.00 98.00 466.00 580.00 97.55 8.47213.00 80.00 203 568.19 96.00 98.00 466.00 580.00 97.79 8.47228.00 82.00 208 582.19 98.00 100.00 580.00 780.00 98.02 7.90246.00 84.00 213 596.18 98.00 100.00 580.00 780.00 98.16 4.83268.00 86.00 218 610.17 98.00 100.00 580.00 780.00 98.30 4.83293.00 88.00 223 624.17 98.00 100.00 580.00 780.00 98.44 4.83323.00 90.00 228 638.16 98.00 100.00 580.00 780.00 98.58 4.83359.00 92.00 233 652.16 98.00 100.00 580.00 780.00 98.72 4.83402.00 94.00 238 666.15 98.00 100.00 580.00 780.00 98.86 4.83466.00 96.00 243 680.15 98.00 100.00 580.00 780.00 99.00 4.83580.00 98.00 248 694.14 98.00 100.00 580.00 780.00 99.14 4.83780.00 100.00 253 708.14 98.00 100.00 580.00 780.00 99.28 4.83780.00 102.00 258 722.13 98.00 100.00 580.00 780.00 99.42 4.83780.00 104.00 263 736.13 98.00 100.00 580.00 780.00 99.56 4.83
298 834.09 104.00 0.00 780.00 0.00 100.00 0.00303 848.09 104.00 0.00 780.00 0.00 100.00 0.00308 862.08 104.00 0.00 780.00 0.00 100.00 0.00313 876.08 104.00 0.00 780.00 0.00 100.00 0.00318 890.07 104.00 0.00 780.00 0.00 100.00 0.00323 904.07 104.00 0.00 780.00 0.00 100.00 0.00328 918.06 104.00 0.00 780.00 0.00 100.00 0.00333 932.06 104.00 0.00 780.00 0.00 100.00 0.00338 946.05 104.00 0.00 780.00 0.00 100.00 0.00343 960.05 104.00 0.00 780.00 0.00 100.00 0.00348 974.04 104.00 0.00 780.00 0.00 100.00 0.00353 988.04 104.00 0.00 780.00 0.00 100.00 0.00358 1002.03 104.00 0.00 780.00 0.00 100.00 0.00363 1016.03 104.00 0.00 780.00 0.00 100.00 0.00368 1030.02 104.00 0.00 780.00 0.00 100.00 0.00373 1044.01 104.00 0.00 780.00 0.00 100.00 0.00378 1058.01 104.00 0.00 780.00 0.00 100.00 0.00
Meyer Civil Engineeering, Inc. 110 S. Montclair Street #104, Bakersfield, CA 93309P:\DeWalt Corp\DEW-13-001\CALCS\SBCHM-DuncanRd.xls
Page 24 of 31 100yr S-GRAPH Calibration Model

TIME, % of LAG
DISCHARGE %of
ULTIMATE (MASS)
Time Increment,
min. % laglower limit
% massupper limit
% masslower limit
% lagupper limit
% lag % Mass
Unit Hydrograph,
CFSINPUT VALUES
383 1072.00 104.00 0.00 780.00 0.00 100.00 0.00388 1086.00 104.00 0.00 780.00 0.00 100.00 0.00393 1099.99 104.00 0.00 780.00 0.00 100.00 0.00398 1113.99 104.00 0.00 780.00 0.00 100.00 0.00403 1127.98 104.00 0.00 780.00 0.00 100.00 0.00408 1141.98 104.00 0.00 780.00 0.00 100.00 0.00413 1155.97 104.00 0.00 780.00 0.00 100.00 0.00418 1169.97 104.00 0.00 780.00 0.00 100.00 0.00423 1183.96 104.00 0.00 780.00 0.00 100.00 0.00428 1197.96 104.00 0.00 780.00 0.00 100.00 0.00433 1211.95 104.00 0.00 780.00 0.00 100.00 0.00653 1827.73 104.00 0.00 780.00 0.00 100.00 0.00
0
20
40
60
80
100
120
0 200 400 600 800 1000
Dis
char
ge
in %
of
Ult
imat
e D
isch
arg
e (K
)
Time in % of Lag
S-GRAPH for Desert
0
100
200
300
400
500
600
0 100 200 300 400 500
Dis
char
ge,
CF
S
Time, minutes
Unit Hydrograph
Meyer Civil Engineeering, Inc. 110 S. Montclair Street #104, Bakersfield, CA 93309P:\DeWalt Corp\DEW-13-001\CALCS\SBCHM-DuncanRd.xls
Page 25 of 31 100yr S-GRAPH Calibration Model

Soil Type Complex Applied for CnA B Ponderosa PineB B Desert BrushC C Desert BrushD D Desert Brush
Base Value Cn
Meyer Civil Engineeering, Inc. 110 S. Montclair Street #104, Bakersfield, CA 93309P:\DeWalt Corp\DEW-13-001\CALCS\SBCHM-DuncanRd.xls
Page 26 of 31 Soil Map
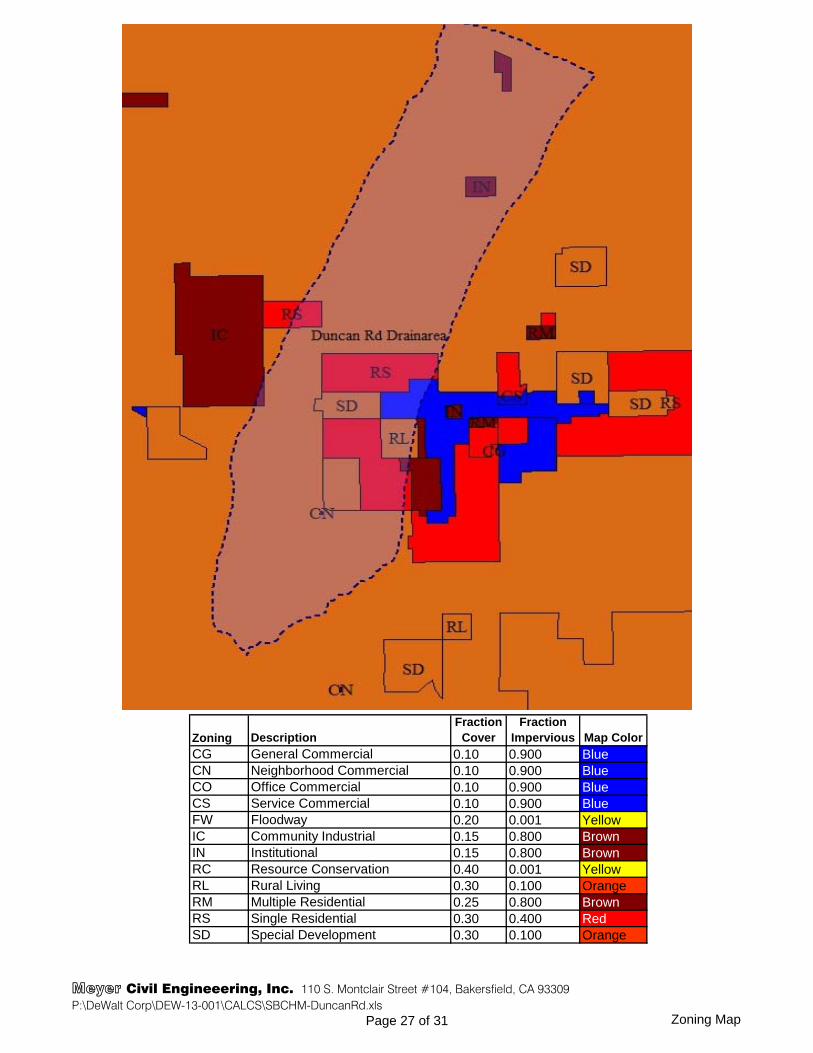
Zoning DescriptionFraction
CoverFraction
Impervious Map Color
CG General Commercial 0.10 0.900 BlueCN Neighborhood Commercial 0.10 0.900 BlueCO Office Commercial 0.10 0.900 BlueCS Service Commercial 0.10 0.900 BlueFW Floodway 0.20 0.001 YellowIC Community Industrial 0.15 0.800 BrownIN Institutional 0.15 0.800 BrownRC Resource Conservation 0.40 0.001 YellowRL Rural Living 0.30 0.100 OrangeRM Multiple Residential 0.25 0.800 BrownRS Single Residential 0.30 0.400 RedSD Special Development 0.30 0.100 Orange
Meyer Civil Engineeering, Inc. 110 S. Montclair Street #104, Bakersfield, CA 93309P:\DeWalt Corp\DEW-13-001\CALCS\SBCHM-DuncanRd.xls
Page 27 of 31 Zoning Map

APPENDIX AHEC-HMS Results
Meyer Civil Engineeering, Inc. 110 S. Montclair Street #104, Bakersfield, CA 93309P:\DeWalt Corp\DEW-13-001\CALCS\SBCHM-DuncanRd.xls
Page 28 of 31 APP-A HEC-HMS Results

APPENDIX BFLO-2D SUMMARY
Meyer Civil Engineeering, Inc. 110 S. Montclair Street #104, Bakersfield, CA 93309P:\DeWalt Corp\DEW-13-001\CALCS\SBCHM-DuncanRd.xls
Page 29 of 31 APP-B FLO-2D Summary
APPENDIX CFLO-2D DRAWINGS
Meyer Civil Engineeering, Inc. 110 S. Montclair Street #104, Bakersfield, CA 93309P:\DeWalt Corp\DEW-13-001\CALCS\SBCHM-DuncanRd.xls
Page 30 of 31 APP-C FLO-2D Drawings
APPENDIX DFLO-2D FILES
Meyer Civil Engineeering, Inc. 110 S. Montclair Street #104, Bakersfield, CA 93309P:\DeWalt Corp\DEW-13-001\CALCS\SBCHM-DuncanRd.xls
Page 31 of 31 APP-D FLO-2D Files